the Creative Commons Attribution 4.0 License.
the Creative Commons Attribution 4.0 License.
OH measurements in the coastal atmosphere of South China: possible missing OH sinks in aged air masses
Zhouxing Zou
Qianjie Chen
Qi Yuan
Yanan Wang
Enyu Xiong
The hydroxyl radical (OH) is the main atmospheric oxidant responsible for the removal of many reduced trace gases and the formation of secondary air pollutants. However, due to technical difficulties in measuring OH, the existing measurements of atmospheric OH concentrations are limited, and its sources and sinks are not well understood under low-nitrogen-oxide (NOx) conditions. In this study, we observed the OH concentrations using chemical ionization mass spectrometry at a coastal site in Hong Kong from October to November 2020. The average noontime OH concentration over the study period was measured at cm−3. We found that a box model with comprehensive observational constraints reproduced the observed daytime OH concentrations when air parcels originated from the continental regions. However, this model overpredicted the observed daytime OH concentrations for coastal air parcels by 142 % on average. Unaccounted-for OH sinks in the model are proposed to be the cause of this overprediction. A missing OH reactivity, which is defined as the pseudo-first-order rate coefficient for OH loss by unmeasured trace gases, was estimated as 5.0±2.6 s−1 (lower limit) in the coastal air, and the missing reactivity increased with decreasing concentrations of NOx and volatile organic compounds (VOCs). Further studies are needed to find out the exact cause of the model overestimation and to identify the suspected unmeasured chemical species that contribute to the OH budget, in order to better quantify the formation of secondary air pollutants.
- Article
(2741 KB) - Full-text XML
-
Supplement
(1420 KB) - BibTeX
- EndNote
The hydroxyl radical (OH) dominates atmospheric oxidative capacity and participates in nearly all sunlit tropospheric chemistry. The primary sources of the ambient OH radical include the photolysis of ozone (O3) and nitrous acid (HONO) and the ozonolysis of alkenes. The OH sinks are mainly the reactions of OH with trace gases, including carbon monoxide (CO), sulfur dioxide (SO2), nitric oxide (NO), nitrogen dioxide (NO2), methane (CH4), and other volatile organic compounds (VOCs; Fuchs et al., 2018). In reactions with CO and VOCs, peroxy radicals (HO2 and RO2) are produced and then recycled back into OH in the presence of NO as a secondary OH source. This interconversion is closely related to photochemical smog production (Stone et al., 2012). The reaction of OH with SO2 and NO2 produces H2SO4 and HNO3, contributing to new particle formation and the acidity of rain, fog, and aerosols. OH also plays an important role in the climate system through reactions with the greenhouse gas CH4 and dimethyl sulfide (DMS) – a sulfate aerosol precursor (Berresheim et al., 2002).
Measuring ambient OH is challenging due to its high reactivity, short lifetime (<1 s), and low environmental concentration (Stone et al., 2012). Through decades of efforts, tropospheric OH radicals have been successfully detected following the development of laser-induced fluorescence (LIF) and fluorescence assay with gas expansion (Heard and Pilling, 2003), chemical ionization mass spectrometry (CIMS; Eisele and Tanner, 1991), and open-path differential optical absorption spectrometry (DOAS; Hausmann et al., 1997). The theory, advantages, and disadvantages of various measuring techniques have been discussed previously (Heard and Pilling, 2003; Mao et al., 2012). Using these techniques, multiple campaigns have been conducted to measure the atmospheric OH concentrations in different regions around the globe. Figure S1 and Table S1 in the Supplement summarize the previous field observations of OH radicals in various environments.
The OH observations are often compared with model simulations to evaluate whether a model has included the major OH sources and sinks (Heard and Pilling, 2003). A summary of the results of the most recent studies is shown in Table S1 with the simulation to observation ratios (). As concluded in previous reviews (Stone et al., 2012; Rohrer et al., 2014; Lu et al., 2019), observed OH concentrations can generally be reproduced by box models under high-nitric-oxide (NO) conditions (NO > 1 ppb), such as at urban sites or within polluted air masses (Shirley et al., 2006; Griffith et al., 2016; Slater et al., 2020). However, discrepancies between model predictions and observations have often been found under low-NO conditions (NO < 1 ppb). The model typically overpredicts OH concentrations in a low-VOC environment and underpredicts them in an environment with high concentrations of biogenic VOCs (BVOCs), as discussed below.
The model overestimation of OH has been found in remote marine boundary layers and coastal, urban, and Arctic regions (Table S1), which is attributed to the overestimation of OH sources, missing OH sinks, or the uncertainties inherent in model simulation and observation. For example, model overestimation of OH has been found when dominant sources, such as HONO (in the Antarctic, Kukui et al., 2014) and HO2 (in the coastal area, Kanaya et al., 2007), are overestimated. In these cases, the overestimation of OH was resolved when these sources were better constrained in the model. Unmeasured VOCs have been proposed as the missing OH sinks, resulting in the overestimation of OH, e.g., in aged air in Idaho Hill (McKeen et al., 1997), in the marine boundary layer (MBL) of Mace Head (Carslaw et al., 1999; Berresheim et al., 2002), in the MBL in Tasmania (Creasey et al., 2003), in Antarctica (Mauldin et al., 2010), and in the urban area of California (Griffith et al., 2016). Other studies have shown evidence of missing OH sinks in various types of environments (Lou et al., 2010; Yang et al., 2016), e.g., in clean forest (Hansen et al., 2014) and marine (Thames et al., 2020) areas, which likely results from unmeasured organic compounds emitted from biogenic (Kaiser et al., 2016) or oceanic (Thames et al., 2020) sources and their oxidation products. A few studies have shown that the overestimations fall within measurement uncertainties of DOAS, CIMS (McKeen et al., 1997), and LIF (Carslaw et al., 1999), while others have suggested a possible sampling loss of OH in CIMS (Mauldin et al., 2010) or a possible calibration bias due to low relative humidity (CIMS; Mauldin et al., 2001).
Underestimations of OH by models have mostly been found in forest areas with high BVOC emissions and low-NO conditions. A few recent studies also found the OH estimation in urban atmospheres when the NO level was below 1 ppb (Whalley et al., 2018; Tan et al., 2017, 2019). These underestimations have usually been attributed to missing OH sources (Tan et al., 2001; Lelieveld et al., 2008; Hofzumahaus et al., 2009; Whalley et al., 2011). The Leuven isoprene mechanism (LIM) was then developed to explain the high OH concentrations observed during field campaigns in forested regions, based on laboratory and chamber experiments of isoprene oxidation (Wennberg et al., 2018; Novelli et al., 2020). With the adoption of this mechanism, the simulated OH concentration increased by 20 %–30 % in the forest region (Lew et al., 2020). Another breakthrough was the development of a new chemical scavenging technique in LIF instruments that were able to determine the interference to the instrument's background. Some studies have shown that the interference in LIF instruments can partly explain the previously observed high OH concentrations (Mao et al., 2012; Hens et al., 2014; Novelli et al., 2014; Feiner et al., 2016; Woodward-Massey et al., 2020). With the adoption of interference scavenging and the LIM improved mechanism, measurements using LIF in an Alabama forest (Feiner et al., 2016) and CIMS in Amazon forests (Jeong et al., 2022) agreed with the OH concentration predicted by the model. However, the models in other studies continued to underestimate OH with the improved mechanism (Tan et al., 2019; Lew et al., 2020).
The industrialization of the Pearl River Delta (PRD) region of south China over the past 3 decades has been accompanied by high anthropogenic emissions of air pollutants (Lu et al., 2013), causing elevated concentrations of surface ozone (T. Wang et al., 2019) and particulate matter (Yao et al., 2014). Measurements of OH in the PRD region that were taken using LIF at a forested site (Backgarden) indicated missing OH sources at this BVOC-rich site (Hofzumahaus et al., 2009; Lu et al., 2012). More recently, OH concentrations were measured at a suburban site in Shenzhen during the autumn of 2018 (F. Wang et al., 2019; G. Wang et al., 2021) using a newly developed LIF instrument. The OH concentrations, which had an average value of 5.3×106 cm−3 around noon, were briefly presented with no comparison to modeled OH.
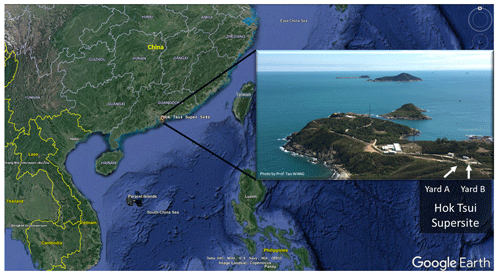
Figure 1The location of the Hok Tsui air monitoring supersite in Hong Kong, South China. The map is from © Google Earth.
In the present study, we measured OH concentrations using quadrupole CIMS from October to November 2020 at a background site in Hong Kong. The study aimed to determine the OH concentrations in coastal south China and to investigate whether they could be simulated by a state-of-the-art chemical model under different airflow conditions. We first give a brief description of the site and OH measurement procedure, including the working theory of CIMS, calibration, uncertainties, and modeling setup. We then present the overall measurement results for different air masses and compare them with those found in previous studies. After this, we simulate OH concentrations using a box model constrained by comprehensive observations and discuss possible reasons for the model–observation discrepancy. Our measurements add to the limited database of ambient OH radical concentrations, while our analysis sheds light on possible missing OH sinks under low-NOx conditions.
2.1 The Hok Tsui supersite
The field campaign was conducted at the Cape D'Aguilar (also known as Hok Tsui, HT) air quality supersite, which is operated by the Hong Kong Environmental Protection Department, between 6 October and 24 November 2020. The HT supersite (22∘12′32′′ N, 114∘15′12′′ E) is a coastal site located at the southeastern tip of Hong Kong Island. The site is surrounded by ocean, vegetation, and a country road (Fig. 1) and is around 15 km away from the nearest urban center. There is no strong anthropogenic emission source in the surrounding area apart from the ocean-going vessels traveling in nearby waters (Peng et al., 2022). Nonetheless, the site does occasionally receive polluted air masses from mainland China, including air masses from the highly urbanized PRD region (Li et al., 2018; Peng et al., 2022).
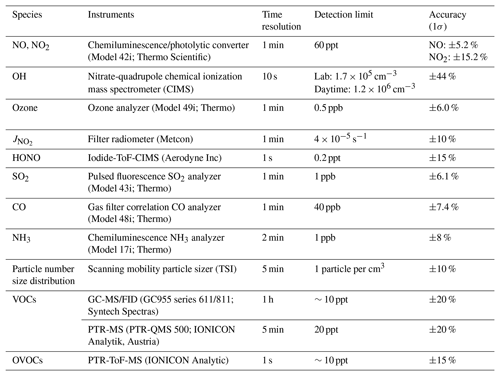
We measured OH radicals, O3, NOx, CO, HONO, VOCs, oxygenated VOCs (OVOCs), relative humidity, temperature, NO2 photolysis frequency (), and aerosol size distribution. Table 1 summarizes the measurement technique, resolution, and detection limits. The OH-CIMS was housed in an air-conditioned shelter in yard B together with the time-of-flight (ToF)-CIMS and ozone and NOx analyzers (Fig. 1). was measured on top of the shelter. The other species and the aerosol size distribution were measured inside the main station building in yard A, which was located around 10 m away from yard B (Fig. 1). The backward trajectory was calculated at 1 h intervals on sampling days at an elevation of 60 m a.g.l. (above ground level) using the MeteoInfoMap software package (http://meteothink.org/, last access: 1 May 2023; Wang, 2014, 2019).
2.2 OH radical measurements
OH radical concentrations were indirectly measured using a custom-built quadrupole CIMS instrument (THS Inc, Atlanta). The THS-CIMS was originally developed by Eisele and Tanner (1991) and improved upon in subsequent works (Eisele and Tanner, 1993; Tanner and Eisele, 1995; Tanner et al., 1997). The ambient OH concentrations were measured by first converting the OH (by addition of SO2) to sulfuric acid (H2SO4) which was further converted to HSO ion followed by its detection with a quadrupole mass detector.
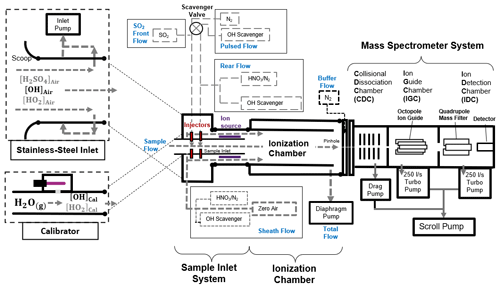
Figure 2Schematics of the CIMS system, which consists of a stainless-steel inlet, a sample inlet, an ionization chamber, a mass spectrometer system, and a calibration unit. The CIMS measures the ambient OH concentration when connecting to the stainless-steel inlet, whereas, during calibration, the calibration unit is connected to the CIMS instead. Details of the setup, calibration and optimization of the CIMS can be found in the Supplement.
A schematic diagram of our OH-CIMS instrument is shown in Fig. 2. Ambient air was drawn into the stainless-steel inlet with a turbulence-reducing scoop by the inlet pump. The central part of the air in the stainless-steel inlet was then drawn into the sample inlet, where OH was converted into H2SO4 by adding SO2 to the sample flow (Reactions R1 to R3).
The conversion was ended by the addition of scavenger gases (C3F6) in the rear flow. The reaction time for OH conversion is 47 ms, which is short enough to mitigate the HO2 and RO2 recycling interference (Reactions R4 and R5).
The converted H2SO4 in the sample flow was then reacted with the excess NO cluster in the sheath flow and converted into an HSO ion cluster in the ionization chamber (Reaction R6).
The NO reagent ion cluster () with m and n mostly of 0–2 and 0–3 (Berresheim et al., 2000) was generated by passing an HNO3 containing sheath flow through a 210Po ion source (Reactions R7 to R9):
where e− is emitted from the 210Po ion source. The NO and HSO ion clusters further dissociated (Reactions R10 and R11) in the collisional dissociation chamber (CDC), refocused in the ion guide chamber (IGC), and were then detected by the detector in the ion detection chamber (IDC).
The HSO and NO were detected by the peak intensities at (S97) and (S62), respectively. The HSO ion concentration was determined based on relative signal strength (the ratio) rather than absolute signal (S97) (Berresheim et al., 2000).
Apart from ambient OH, some interference gases, such as ambient H2SO4, Criegee intermediates, and artificial OH produced by the ion source, can also be converted into HSO and contribute to the signal S97. To mitigate such interference, the scavenger gas (C3F6) and N2 were added to the sample flow through electrically operated valves (see the pulsed flow in Fig. 2) that automatically switched injection positions every 3 min. When a scavenger gas is added to the front injectors, ambient OH radicals are eliminated by the scavenger instead of reacting with SO2 due to the higher concentration (∼100 times) and the faster reaction of C3F6 than of SO2 in the sample flow (Dubey et al., 1996). This allows the background signal (BS97) contributed by the interference gases and instrument noise signal to be determined. When the pulsed flow scavenger gas is switched to the rear injector, the ambient OH radicals and interference gases react with SO2 to give the total signal (TS97). Then, the ambient OH signal can be obtained by subtracting the signal contributed by interference (BS97) from the total signal (TS97). The measured OH concentration ([OH]) can be calculated using the following Eq. (1):
where C is the calibration factor obtained from calibration that was performed using the calibrator shown in Fig. 2. The calibration is based on the production of OH radicals through the photolysis of water vapor by 184.9 nm light in the airflow through the calibrator (SR1). The OH concentration produced by the calibrator is calculated by photon flux (It) and H2O concentration in the airflow (SE1). Calibration was carried out at least every 2 d during the campaign, as well as before and after any changes in settings. The difference in calibration factors was included in the calibration accuracy.
The detection limit was calculated by the background signal as shown by the equation in the supplementary information (SE3). The detection limit is approximately 1.7×105 cm−3 (signal-to-noise ratio of 3) in the laboratory. Due to variations in the concentrations of H2SO4 and other interference gases in the ambient air, the background signal during ambient measurement has a larger variation compared to the lab condition, resulting in a higher detection limit in the ambient condition. During the field study, the daytime and nighttime average detection limits in this campaign were 12×105 and 8.5×105 cm−3, respectively.
The overall calibration accuracy was estimated at 38 %, by calculation that took into account the uncertainty of all of the parameters measured during the calibration process. The averaged overall uncertainty for this campaign is 44 % for OH measurement with consideration of the calibration accuracy and the variations in at 62 (S62, 18 %) and 97 (TS97–BS97, 13 %) during observation (SE4 and SE5). The technical details and specifications are in Table S2, and the detailed descriptions of CIMS optimization, calibration process, and calculation of detection limit are in the supplementary information.
2.3 Box modeling
The Framework for 0-D Atmospheric Modelling (F0AM) using the Master Chemical Mechanism (MCM) v3.3.1 (Wolfe et al., 2016) was used to simulate OH concentrations. MCM v3.3.1 (http://mcm.leeds.ac.uk/MCM, last access: 1 May 2023) is a near-explicit chemical mechanism that includes over 17 000 elementary reactions of 6700 primary, secondary, and radical species (Jenkin et al., 2015). The isoprene degradation mechanisms, and in particular the mechanisms OH regenerated by HOx recycling under low-NOx conditions, were improved in MCM v3.3.1. The MCM mechanism has been used in previous studies to investigate OH chemistry in different environments, including forests (Stone et al., 2011), urban areas (Slater et al., 2020), suburban areas (Tan et al., 2018), and coastal regions (Sommariva et al., 2004). In our study, observational data (shown in Table 1) were used to constrain the model. These data included VOCs, OVOCs, SO2, NOx, CO, O3, HONO, photolysis frequency of NO2 (), and meteorological parameters (temperature, relative humidity, and pressure). The photolysis frequencies for other species were calculated by the “HYBRID” method in F0AM which is based on the Tropospheric Ultraviolet and Visible (TUV v5.2) Radiation Model from the National Center for Atmospheric Research. The ozone column we used for TUV calculation was 240 DU (the Dobson unit) which is the average number from October to November 2020 for the Hok Tsui area according to the Worldview website (EOSDIS Worldview; https://www.nasa.gov/, last access: 1 May 2023). The simulated photolysis frequencies were then scaled by the correction factor obtained from the comparison between observed and modeled . The first-order physical loss process, with a 24 h lifetime for all species, was included in the model to represent physical processes (Wolfe et al., 2016; Chen et al., 2022). The physical loss process has a negligible influence on OH simulation because the OH concentrations are controlled by fast in situ chemistry.
The heterogeneous uptake of HO2 by aerosols was included in the model by assuming a pseudo-first-order loss of HO2 (E2–E4; Jacob, 2000):
where is the first-order loss rate coefficient of HO2 by aerosol uptake, is the effective HO2 uptake coefficient (0.1 for the base model run; Guo et al., 2019), is the mean molecular velocity of HO2, Sa is the aerosol surface area concentration measured by a scanning mobility particle sizing (SMPS), and (=17 g mol−1) is the molecular mass of HO2. We assumed in the model that the products of heterogeneous HO2 loss would not participate in further reactions (Guo et al., 2019).
The observation data were averaged every 10 mins for the model input. Any missing values were calculated assuming linear interpolation. The measured concentrations of NO and NO2 were used to constrain the model. Due to the clean condition of the coastal air, some of the reactive alkenes and long-chain alkanes were below detection limits. For the simulation of those compounds, we used concentrations that were half of the detection limits. The measured VOCs were further divided into those of anthropogenic origin (AVOCs) and biogenic origin (BVOCs). The AVOCs included alkanes (C2–C8), alkenes (C2–C6), benzene, and TEXs (toluene, ethylbenzene, and xylenes), which covered the dominant species originating from petroleum gas and industrial solvent evaporation (Tang et al., 2008), while the BVOCs included isoprene, terpene, pinene, and limonene. The majority (>95 %) of the measured OVOCs in this study were C1–C3 aldehydes, ketones, and acids. For each run, a 3 d spinup was performed with constant photolysis and deposition to create a stable model environment and to avoid the uncertainty of unconstrained species (Carslaw et al., 1999).
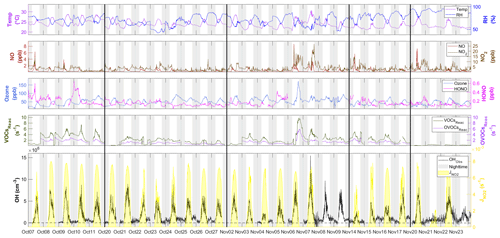
Figure 3Time series of OH between 7 October and 23 November with measured weather conditions (temperature and RH), OH primary sources (ozone and HONO), NOx (NO and NO2), the reactivity of measured VOCs and OVOCs (VOCsReac and OVOCsReac), and photolysis frequency (). All measurement data shown are 10 min averages. The gaps in the data were due to the calibration or instrument maintenance. The black lines separate the non-continuous days during measurement and the black horizontal dotted line denotes [OH] = 0. The gray shaded area denotes nighttime. The time zone was the local time (+8 UTC) for the x axis.
3.1 Overview of observations
Figure 3 shows the time series of observed OH concentrations, along with the concentrations of other trace gases and the meteorological parameters, during the study period. The weather conditions featured relatively high temperatures, high relative humidity (RH), and strong solar radiation, similar to previous autumn observations at the same site (Li et al., 2018; Peng et al., 2022). The air temperature ranged from 20 to 30 ∘C, and RH ranged from 40 % to 96 %. The photolysis frequency of NO2 () peaked at s−1 around noon on sunny days and decreased to s−1 on cloudy days. The observed OH concentrations were mostly above the detection limit during the daytime but fell closer to the detection limit at night. The OH concentrations showed a distinct diurnal pattern and a positive correlation with (R2=0.68) and calculated JO1D (R2=0.46) (Fig. S2), similar to the findings in previous studies (Berresheim et al., 2003; Rohrer and Berresheim, 2006; Ma et al., 2019). The daily maximum OH concentration varied from 2.1×106 cm−3 on 21 November, accompanying the lowest level of solar radiation, to 15.4×106 cm−3 on 7 November during a pollution episode. The pollution episode began on the evening of 6 November and featured a maximum concentration of 174.0 ppb O3, 8.7 ppb NO, 22.7 ppb NO2, 9.8 s−1 total reactivity of measured VOCs, and 5.8 s−1 total reactivity of measured OVOCs. The OH concentration peaked the next day (7 November). This suggests abundant OH sources and fast radical propagation under high-NOx and high-VOC conditions.
Figure 4 shows the average diurnal profiles of OH and other representative species. On average, the maximum OH concentration was ) cm−3. As shown in Table S1, the OH concentrations at our site were comparable to those reported in previous field studies conducted at tropical coastal sites. For example, the reported OH maximum concentration was 4.5×106 cm−3 in the low-altitude remote tropical troposphere (Brune et al., 2020). In a study conducted in autumn at a suburban site in Shenzhen, approximately 50 km away from our site, an OH diurnal maximum concentration of 5.3×106 cm−3 was observed (Y. Wang et al., 2021). The average nighttime OH concentrations in this study were cm−3, which was comparable to the previous nighttime results (below 10×105 cm−3) measured at the PRD region (in Heshan; Tan et al., 2019; and in the Peking University Shenzhen Graduate School (PKUSZ) site; Yang et al., 2022). The OH concentration was slightly higher in the evening ( cm−3) than in the morning ( cm−3), which might be due to the higher ozone concentration in the evening leading to a higher OH production from alkene ozonolysis.
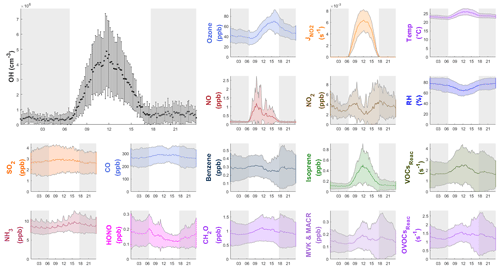
Figure 4Diurnal profiles of the average (±1σ) concentrations of OH, other chemical species, the measured VOCs reactivity and OVOCs reactivity (VOCsReac and OVOCsReac), and meteorological parameters (T, RH, ) during the field campaign. The gray shaded area denotes nighttime. The error bars and shaded error bars are the standard deviations of the averaged data.
Figure 4 also shows the average diurnal patterns of the other trace gases measured. As a primary source of OH, HONO peaked in the morning at 0.21±0.09 ppb around 07:00 LT (local time), and O3 peaked in the afternoon at 70±20 ppb at around 16:00 LT. The average NO and NO2 concentrations reached a maximum of 1.2±1.6 ppb at around 10:00 LT and 4.9±3.2 ppb at around 18:00 LT, respectively. Isoprene showed a diurnal pattern similar to that of and OH, peaking at 0.5±0.4 ppb at noon. Non-negligible levels of NO (∼0.1 ppb) and isoprene (∼0.1 ppb) were observed at night, which could be caused by nearby ship emissions and plant emissions, respectively. The average concentrations of all of the measured species during the campaign are shown in Table S3.
Figure 5 shows the hourly backward trajectories over the whole campaign. Consistent with previous studies conducted at HT in the same season (Li et al., 2018; Peng et al., 2022), the air masses were dominated by continental air masses containing high concentrations of pollutants (Fig. 5a) and less polluted coastal air masses (Fig. 5c). In this study, we did not encounter oceanic air masses from the south. The average noontime OH concentration was cm−3 in the continental air (Fig. 5b) and cm−3 in the coastal air (Fig. 5d).
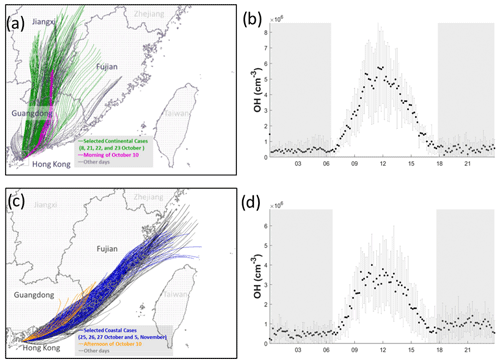
Figure 5Back trajectories of 24 h of the continental (a) and coastal (c) cases over the whole measurement period. The selected days for coastal, continental, and mixed cases are labeled in different colors. Panels (b) and (d) show the average concentration of OH with standard deviation in continental and coastal air masses, respectively. The error bars and shaded error bars are the standard deviations of the averaged data.
3.2 Model–observation comparison
To investigate the performance of the MCM box model in simulating OH chemistry at our site, we selected 4 d featuring the continental air mass (8, 21, 22, and 23 October) and 4 d featuring the coastal air mass (25–27 October, 5 November) (Fig. 6). We also selected 10 October as a specific case due to the shifting continental and coastal air masses within the same day during the daytime. These days were selected for model analysis because they comprised relatively complete chemical data that could be used to constrain the model. The below discussions focus on the comparison of the daytime results, since the simulated nighttime OH concentration was mostly within the measurement uncertainties and the nighttime observations for 8, 23, 27 October and 5 November were incomplete as shown in Fig. 6.
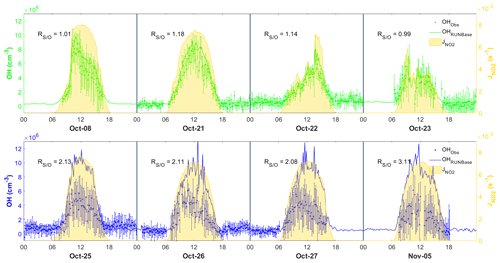
Figure 6Comparison between observed (dots) and simulated (lines) OH in the four continental cases (top panel) and the four coastal cases (lower panel), also showing measurement uncertainty (error bars) and measurement (yellow shades). The time zone is the local time (+8 UTC) for the x axis.
3.2.1 Selected continental air mass cases
Figure 6 shows the comparison between the simulated and observed OH concentrations for the selected cases in the continental and coastal air masses (4 d each). The simulated OH concentrations of the four continental cases (8 and 21–23 October) were mostly within the OH measurement uncertainty (2σ), with a daytime average of 1.14 (Fig. 7) and a range from 0.99 to 1.18 (Fig. 6). High NOx (∼5 ppb) and VOC (∼17 ppb) concentrations were measured on these days (Fig. 7, Table S3). Therefore, in the continental polluted air mass, the existing MCM mechanism reproduced the observed OH concentrations well. On these days, the reaction between HO2 and NO was the dominant OH formation pathway (78 %), followed by O3 photolysis (8 %), HONO photolysis (6 %), the reaction between ozone and HO2 (2 %), and alkene ozonolysis (<2 %; Table 2 and Fig. S3). These results are similar to the findings of previous studies in the PRD conducted during autumn under polluted conditions (Tan et al., 2019). The removal of OH occurs mainly through its reaction with non-methane hydrocarbons (NMHCs; ∼63 %), CO (20 %), NO2 (9 %), and CH4 (4 %; Table 2).
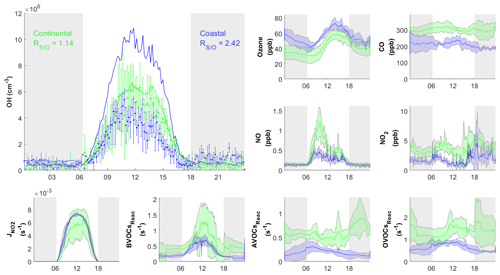
Figure 7Diurnal profiles of average concentrations of measured (dots) with standard deviation and simulated (RUNBase; line) OH concentration, important trace gases, and the measured BVOCs, AVOCs, and OVOCs reactivity (BVOCsReac, AVOCsReac, and OVOCsReac) for selected cases in continental (green) and coastal (blue) air masses. The gray shaded area denotes night time. The error bars and shaded error bars are the standard deviations of the averaged data.
Table 2OH budgets for the selected continental and coastal cases, and the morning and afternoon of 10 October.
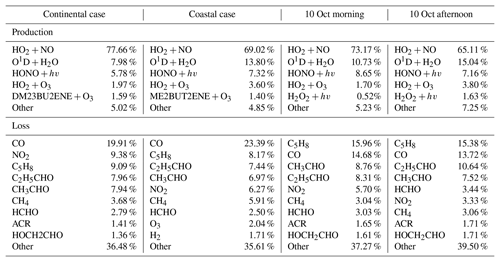
Notes: The H2 concentration was constrained as 550 ppb in the model simulation. The H2O2 was simulated by the model with average concentration of 0.95 ppb. ACR – acrolein, HCHO – formaldehyde, C5H8 – isoprene, HOCH2CHO – glycolaldehyde, C2H5CHO – propanol, CH3CHO – acetaldehyde, ME2BUT2ENE – 2-Methyl-2-butene, DM23BU2ENE – 2,3-Dimethyl-2-butene. “Other” represents the group of the species that contributes less than 2 % to the total OH reactivities. Most of them were the intermediate species produced by the reaction of OH with VOCs.
The simulated daytime average and peak HO2 concentration were and 4.5×108 cm−3, respectively, for continental air masses (RUNBase; Fig. S4). The peak HO2 value in our study is lower than the result at a clean midlatitude forest area (10×108 cm−3; Lew et al., 2020), and the average daytime value is higher than that measured at polluted urban sites in Beijing (0.3 to 0.4×108 cm−3, Ma et al., 2019). The ratio of simulated HO2 to observed OH () was 147 averaged during the daytime (06:00-18:00 LT) in continental cases.
The simulated OH reactivity was 8.1±1.0 s−1 on average for continental air masses (Fig. S5a), which is comparable to the OH reactivity measured at suburban sites which ranged from 5 to 30 s−1 but is lower than that measured at the urban sites which ranged from 10 to 100 s−1 (Yang et al., 2016).
3.2.2 Selected coastal air mass cases
In contrast to the continental air mass cases, the diurnal OH patterns in the coastal air mass category (25–27 October and 5 November) were not well reproduced by the model (Fig. 6). The simulated results overestimated the observed OH concentration, with the daytime average of 2.42 (Fig. 7) for these 4 d (range 2.08 to 3.11; Fig. 6). The coastal air masses showed statistically significant (i.e., p value < 0.05) lower NOx (−63 %), AVOC (−47 %), BVOC (−50 %), OVOC (−23 %), and CO (−31 %) concentrations compared with the continental cases (Fig. 7, Table S3). (The p value is the probability of the difference between two data sets occurring by chance.) The HO2 and NO reaction was still the dominant source (69 %) of OH in the coastal air masses, like in the continental air mass cases, but in a lower proportion than on continental days due to the lower NO concentration (Table 2 and Fig. S3). The other major OH sources were O3 photolysis (13.8 %), HONO photolysis (7 %), and the reaction between ozone and HO2 (4 %).
The simulated daytime average HO2 concentration was cm−3 for the coastal cases (RUNBase; Fig. S4), which was cm−3 higher than the value in the continental polluted air mass. The simulated HO2 level is comparable to the measured value at a rural site in Heshan (3×108 cm−3; Tan et al., 2019). The was 218 in coastal cases, higher than the ratio in continental cases. This could be explained by the lower NO concentration in the coastal cases that slows the recycling reaction of HO2 back to OH (Reactions R4 and R5) (Sommariva et al., 2004; Shirley et al., 2006; Chen et al., 2010).
The simulated OH reactivity was 4.7±0.58 s−1 on average for the coastal cases (Fig. S5b), which was lower than that of the continental polluted air mass (8.1±1.0 s−1). As discussed below in Sect. 3.3, low OH reactivity could have been the cause of the model's overestimation of OH concentrations in the coastal cases. The model's overestimation of OH in coastal air masses indicates gaps in our knowledge about the OH budget in relatively clean conditions with low NOx and VOCs.
3.2.3 The 10 October case day
During the day on 10 October, our site received continental air masses between sunrise and noon and coastal air masses between noon and sunset. This served as another case that could be used to check the model's performance on continental versus coastal air masses within the same day. On 10 October, the changed from 1.20 in the morning to 2.59 in the afternoon, driven by the air mass drift during continuous measurement without interruption (Fig. 8). As with the continental and coastal results shown above, the afternoon of 10 October showed significantly (p<0.05) lower concentrations of NO (−50 %), NO2 (−68 %), and the reactivity of AVOCs (−42 %), BVOCs (−27 %), and OVOCs (−12 %) compared with the morning (Table S3). With lower NO, the fraction of OH produced from HO2 and NO reaction was also lower in the afternoon (65 %) than in the morning (73 %; Table 2 and Fig. S3). Similarly, the simulated total OH reactivity was lower in the afternoon (7.6±2.3 s−1 on average) than in the morning (10.3±1.6 s−1 on average; Fig. S5c). The simulated HO2 was cm−3 in the morning when continental air mass dominated and was cm−3 in the afternoon when coastal air mass dominated (RUNBase; Fig. S4). The was 142 in the morning and up to 476 in the afternoon. Again, a higher HO2 concentration and ratio were shown with low NO concentration.
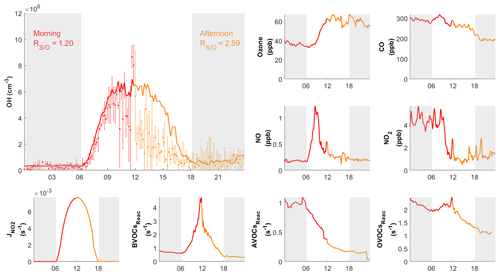
Figure 8Diurnal profiles of measured (dots) with measurement uncertainty (error bars) and simulated (RUNBase; line) OH on 10 October 2020, with other chemical species and the measured BVOCs, AVOCs, OVOCs reactivity (BVOCsReac, AVOCsReac and OVOCsReac). The air mass drifted from continental (red) in the morning to coastal (orange) in the afternoon. The gray shaded area denotes night time. The time zone was the local time (+8 UTC) for the x axis.
3.3 Discussion on the model–observation discrepancy
As discussed in the introduction, the model's overestimation of OH could have been caused by multiple factors, including uncertainties in OH measurements and modeling, overestimation of OH sources, and underestimation of OH sinks. Below, we discuss their possible roles in the study.
3.3.1 Uncertainties in OH measurement and simulation
The OH measurement uncertainties have been calculated as described in Sect. 2.2 and are shown as the error bars in Figs. 5 and 6. The model's overestimation of OH in coastal air masses exceeded the measurement uncertainties (Figs. 6 and 7), and thus, the measurement uncertainty is unlikely to be the main reason for the discrepancy.
Model uncertainties in our study include the uncertainties in photolysis frequencies correction, uncertainties in the constrained VOCs concentrations when they were below detection limits, and uncertainties from not considering halogen chemistry. On the first possibility, we acknowledge that the correction factor for photolysis frequencies due to cloud presence may be different for different species (Walker et al., 2022); thus, using a single correction factor (based on ) may introduce uncertainty in the model simulations. We think such uncertainty should not be significant because the weather was mostly sunny in the coastal cases. Regarding the uncertainty from the VOCs input, we conducted a sensitivity test to show that the treatment of VOCs that were below the detection limits should have a negligible effect on OH simulation (RUNVOC0 and RUNVOCDL in Fig. S4). We did not include halogen chemistry in our study, as we wanted to compare our results with previous modeling work, most of which did not consider halogen chemistry. Our other studies at the same site that did consider the halogen chemistry show a 4 % increase in OH concentration from Cl chemistry (Peng et al., 2022) and 2.8 % from Br chemistry (Xia et al., 2022), which would even increase the model measurement in the coastal air mass discrepancy.
3.3.2 Overestimation of OH sources
Our calculated OH budgets show that the main sources of OH in the coastal air masses were the HO2 + NO reaction (69 %), O3 photolysis (14 %), HONO photolysis (7 %), and the reaction between ozone and HO2 (4 %). In the simulation, NO, HONO, and O3 were constrained by observations. Could HO2 be overestimated, which would cause overprediction of OH? The main HO2 sources are the VOCs oxidation by OH and the photolysis of OVOCs. In our study, VOCs and OVOCs were more likely under-measured than over-measured, which would underpredict HO2 rather than overpredict it. In addition, not including the halogen chemistry would under-simulate HO2 at this site (Peng et al., 2022; Xia et al., 2022).
We next examine the possibility of the underestimation of HO2 sinks as the cause of the overprediction of OH. The major sinks of HO2 include the reaction of NO to recycle OH, self-reaction to form H2O2, and heterogeneous loss by aerosol uptake. The first and second pathways have been considered in the MCM. The heterogeneous uptake of HO2 onto aerosol was also included in our simulations with an uptake coefficient of 0.1. We conducted a sensitivity run by increasing the aerosol uptake of HO2 (RUNγMAX; Fig. S4). Even when we set the uptake coefficient to unity (which is unlikely large), the simulated HO2 concentration would decrease by 34 % and the simulated OH would decrease to 1.73 from 2.42 in the base case. This indicates that the heterogeneous uptake of HO2 is not the cause of the overestimation of OH in the coastal case. In summary, the discrepancy in modeled and observed OH in coastal cases is unlikely to be due to the overestimated HO2.
3.3.3 Possible missing OH reactivity
Based on the above discussions, we propose that the model's overestimation of OH could have been caused by unmeasured species that were not included in the model as OH sinks. We attempt to estimate the magnitude of possible OH sinks and investigate which factors could be important to these sinks. We added an artificial loss reaction into the model with the reactivity of kmiss (s−1) and assumed that the reaction product would not participate in further reactions. Assuming a pseudo-steady state of OH during the daytime (P=k[OH]), kmiss was calculated as follows:
where Pconstrain is the model's calculated OH production rates, with OH constrained by observations; [OHobs] is the observed OH concentration; and [OHsim] is the OH concentration simulated in RUNBase. After introducing the OH sink with kmiss into the model, the model better reproduced the observed OH concentrations on the coastal case days, with daytime close to unity (RUNKmiss; Fig. S6). The average daytime kmiss for the coastal cases was 5.0±2.6 s−1, which is larger than the total calculated reactivity in coastal cases (4.7±0.6 s−1). The calculated kmiss should be a lower limit of the possible missing sinks, as the products from the reactions of OH with unknown species are most likely to further react with the missing source to produce RO2 and HO2 and recycle back to OH. We conducted a sensitivity test in which we assume the missing sink is resulting from under-measured CH3CHO. Results show that CH3CHO concentrations would increase by 20 times (RUN) to make up the missing OH sinks, and the missing reactivity with the cycling of the CH3CHO oxidation products would increase to 7.2 s−1 (Fig. S4).
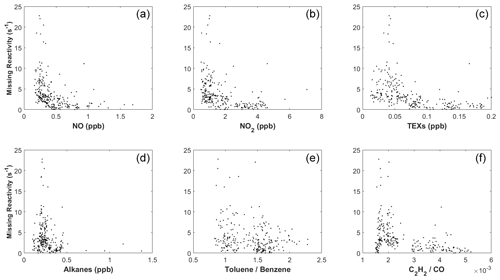
We next explored the dependence of kmiss on different trace gases. Figure 9a shows the correlation between kmiss and NO concentration for the 9 case days (including 10 October) between 09:00 and 15:00 LT. At NO > 0.5 ppb, kmiss is close to zero. At NO < 0.5 ppb, kmiss tended to increase with decreasing NO. Similarly, kmiss approached zero at high concentrations of NO2 (>2.5 ppb), TEXs (>0.25 ppb), and AVOCs (>5 ppb; Fig. 9) and increased with decreasing concentrations of NO2, TEXs, and AVOCs. High kmiss also typically occurred at low ratios of toluene to benzene and low ratios of C2H2 to CO (Fig. 9), which are indicators of an aged air mass (Xiao et al., 2007; Kuyper et al., 2020).
Therefore, while we cannot completely rule out other possibilities, we argue that the aged coastal air masses could have contained unmeasured species such as oxygenated organic molecules (OOMs; Nie et al., 2022) and ocean-emitted gases (Thames et al., 2020) that contributed to the missing OH reactivity, causing the model to overestimate OH concentrations on the coastal case days.
In this study, we measured OH concentrations using CIMS at a coastal site in Hong Kong in the autumn of 2020 to gain insights into the atmospheric oxidative capacity and to evaluate the performance of a box model in the coastal atmosphere. The daily maximum OH concentration ranged from 2.1 to 15.4×106 cm−3 over the whole campaign, with an average of cm−3. The air masses were categorized into two groups based on their backward air trajectories: (1) continental air masses, which contained high concentrations of NOx and VOCs; and (2) coastal air masses, which contained low concentrations of NOx and VOCs. The observed OH concentration in the continental air parcels was on average 52 % higher than in the coastal air parcels. The F0AM box model with comprehensive observational constraints generally reproduced the observed OH in the continental cases during the daytime, with a simulated/observed OH ratio () of 1.14 on average. However, the model significantly overestimated OH concentrations in the coastal cases, with an of 2.42 on average during the daytime. While we cannot completely rule out other possibilities, we incline to attribute this overestimation to a missing OH reactivity in the aged coastal air parcels that were not accounted for in the model. The lower limit of the missing OH reactivity was estimated at 5.0±2.6 s−1 on average between 09:00 and 15:00 LT and was especially larger under low-NOx, low-AVOC, and aged-air conditions. We hypothesize that unknown products from AVOCs oxidation or unknown OH-reacting gases emitted from oceans could contribute to the missing OH reactivity in aged coastal air masses. The overestimation of OH in the model could cause an overestimation of the formation of secondary aerosols, such as sulfate and nitrate, while the impacts would be even more complicated if it is due to missing chemical species which participated in ozone formation. Further studies are necessary to pin down the exact cause(s) of the OH overestimation by concurrently measuring HO2 and OH reactivities, VOCs oxidation products, and ocean-emitted trace gases.
All of the data used to produce this paper can be obtained by contacting Tao Wang (two.wang@polyu.edu.hk).
The supplement related to this article is available online at: https://doi.org/10.5194/acp-23-7057-2023-supplement.
TW initially conceived the project. TW and ZW planned and organized the overall field campaign at Hok Tsui. ZZ conducted the OH measurements using CIMS, with contributions from TW and ZW. YC performed the aerosol size distribution measurements. YQ performed the OVOC measurements using PTR-MS. MX and YC performed the HONO measurements using ToF-CIMS. YW assisted with HONO calibration. ZZ performed the box model analysis and sensitivity test with contributions from EX and QC. ZZ, TW, and QC analyzed the data and interpreted the results, with contributions from MX. ZZ, TW, and QC wrote the paper. All of the authors reviewed and commented on the paper.
At least one of the (co-)authors is a member of the editorial board of Atmospheric Chemistry and Physics. The peer-review process was guided by an independent editor, and the authors have no other competing interests to declare.
Publisher's note: Copernicus Publications remains neutral with regard to jurisdictional claims in published maps and institutional affiliations.
We thank David Tanner, Wei Pu, and Weihao Wang for developing the OH-CIMS. We are also grateful to the Environmental Protection Department of Hong Kong, for loaning the CIMS instrument and providing access to its station and data on trace gases, and to the Hong Kong Observatory, for supplying meteorology data.
This research was financially supported by the Hong Kong Research Grants Council (grant nos. T24-504/17-N and 15223221).
This paper was edited by Holger Tost and reviewed by two anonymous referees.
Berresheim, H., Elste, T., Plass-Dülmer, C., Eiseleb, F. L., and Tannerb, D. J.: Chemical ionization mass spectrometer for long-term measurements of atmospheric OH and H2SO4, Int. J. Mass Spectrom., 202, 91–109, https://doi.org/10.1016/S1387-3806(00)00233-5, 2000.
Berresheim, H., Elste, T., Tremmel, H. G., Allen, A. G., Hansson, H.-C., Rosman, K., Dal Maso, M., Mäkelä, J. M., Kulmala, M., and O'Dowd, C. D.: Gas-aerosol relationships of H2SO4, MSA, and OH: Observations in the coastal marine boundary layer at Mace Head, Ireland, J. Geophys. Res.-Atmos., 107, PAR 5-1–PAR 5-12, https://doi.org/10.1029/2000JD000229, 2002.
Berresheim, H., Plass-Dülmer, C., Elste, T., Mihalopoulos, N., and Rohrer, F.: OH in the coastal boundary layer of Crete during MINOS: Measurements and relationship with ozone photolysis, Atmos. Chem. Phys., 3, 639–649, https://doi.org/10.5194/acp-3-639-2003, 2003.
Brune, W. H., Miller, D. O., Thames, A. B., Allen, H. M., Apel, E. C., Blake, D. R., Bui, T. P., Commane, R., Crounse, J. D., Daube, B. C., Diskin, G. S., DiGangi, J. P., Elkins, J. W., Hall, S. R., Hanisco, T. F., Hannun, R. A., Hintsa, E. J., Hornbrook, R. S., Kim, M. J., McKain, K., Moore, F. L., Neuman, J. A., Nicely, J. M., Peischl, J., Ryerson, T. B., St. Clair, J. M., Sweeney, C., Teng, A. P., Thompson, C., Ullmann, K., Veres, P. R., Wennberg, P. O., and Wolfe, G. M.: Exploring Oxidation in the Remote Free Troposphere: Insights From Atmospheric Tomography (ATom), J. Geophys. Res.-Atmos., 125, 1–17, https://doi.org/10.1029/2019JD031685, 2020.
Carslaw, N., Creasey, D. J., Heard, D. E., Lewis, A. C., McQuaid, J. B., Pilling, M. J., Monks, P. S., Bandy, B. J., and Penkett, S. A.: Modeling OH, HO2, and RO2 radicals in the marine boundary layer: 1. Model construction and comparison with field measurements, J. Geophys. Res., 104, 30241–30255, https://doi.org/10.1029/1999JD900783, 1999.
Chen, Q., Xia, M., Peng, X., Yu, C., Sun, P., Li, Y., Liu, Y., Xu, Z., Xu, Z., Wu, R., Nie, W., Ding, A., Zhao, Y., and Wang, T.: Large Daytime Molecular Chlorine Missing Source at a Suburban Site in East China, J. Geophys. Res.-Atmos., 127, 1–19, https://doi.org/10.1029/2021JD035796, 2022.
Chen, S., Ren, X., Mao, J., Chen, Z., Brune, W. H., Lefer, B., Rappenglück, B., Flynn, J., Olson, J., and Crawford, J. H.: A comparison of chemical mechanisms based on TRAMP-2006 field data, Atmos. Environ., 44, 4116–4125, https://doi.org/10.1016/j.atmosenv.2009.05.027, 2010.
Creasey, D. J., Evans, G. E., and Heard, D. E.: Measurements of OH and HO2 concentrations in the Southern Ocean marine boundary layer, J. Geophys. Res., 108, 4475, https://doi.org/10.1029/2002JD003206, 2003.
Dubey, M. K., Hanisco, T. F., Wennberg, P. O., and Anderson, J. G.: Monitoring potential photochemical interference in laser-induced fluorescence Measurements of atmospheric OH, Geophys. Res. Lett., 23, 3215–3218, https://doi.org/10.1029/96GL03008, 1996.
Eisele, F. L. and Tanner, D. J.: Ion-assisted tropospheric OH measurements, J. Geophys. Res., 96, 9295, https://doi.org/10.1029/91JD00198, 1991.
Eisele, F. L. and Tanner, D. J.: Measurement of the gas phase concentration of H2SO4 and methane sulfonic acid and estimates of H2SO4 production and loss in the atmosphere, J. Geophys. Res.-Atmos., 98, 9001–9010, https://doi.org/10.1029/93JD00031, 1993.
Feiner, P. A., Brune, W. H., Miller, D. O., Zhang, L., Cohen, R. C., Romer, P. S., Goldstein, A. H., Keutsch, F. N., Skog, K. M., Wennberg, P. O., Nguyen, T. B., Teng, A. P., DeGouw, J., Koss, A., Wild, R. J., Brown, S. S., Guenther, A., Edgerton, E., Baumann, K., and Fry, J. L.: Testing Atmospheric Oxidation in an Alabama Forest, J. Atmos. Sci., 73, 4699–4710, https://doi.org/10.1175/JAS-D-16-0044.1, 2016.
Fuchs, H., Albrecht, S., Acir, I., Bohn, B., Breitenlechner, M., Dorn, H.-P., Gkatzelis, G. I., Hofzumahaus, A., Holland, F., Kaminski, M., Keutsch, F. N., Novelli, A., Reimer, D., Rohrer, F., Tillmann, R., Vereecken, L., Wegener, R., Zaytsev, A., Kiendler-Scharr, A., and Wahner, A.: Investigation of the oxidation of methyl vinyl ketone (MVK) by OH radicals in the atmospheric simulation chamber SAPHIR, Atmos. Chem. Phys., 18, 8001–8016, https://doi.org/10.5194/acp-18-8001-2018, 2018.
Griffith, S. M., Hansen, R. F., Dusanter, S., Michoud, V., Gilman, J. B., Kuster, W. C., Veres, P. R., Graus, M., Gouw, J. A., Roberts, J., Young, C., Washenfelder, R., Brown, S. S., Thalman, R., Waxman, E., Volkamer, R., Tsai, C., Stutz, J., Flynn, J. H., Grossberg, N., Lefer, B., Alvarez, S. L., Rappenglueck, B., Mielke, L. H., Osthoff, H. D., and Stevens, P. S.: Measurements of hydroxyl and hydroperoxy radicals during CalNex-LA: Model comparisons and radical budgets, J. Geophys. Res.-Atmos., 121, 4211–4232, https://doi.org/10.1002/2015JD024358, 2016.
Guo, J., Wang, Z., Wang, T., and Zhang, X.: Theoretical evaluation of different factors affecting the HO2 uptake coefficient driven by aqueous-phase first-order loss reaction, Sci. Total Environ., 683, 146–153, https://doi.org/10.1016/j.scitotenv.2019.05.237, 2019.
Hansen, R. F., Griffith, S. M., Dusanter, S., Rickly, P. S., Stevens, P. S., Bertman, S. B., Carroll, M. A., Erickson, M. H., Flynn, J. H., Grossberg, N., Jobson, B. T., Lefer, B. L., and Wallace, H. W.: Measurements of total hydroxyl radical reactivity during CABINEX 2009 – Part 1: field measurements, Atmos. Chem. Phys., 14, 2923–2937, https://doi.org/10.5194/acp-14-2923-2014, 2014.
Hausmann, M., Brandenburger, U., Brauers, T., and Dorn, H.-P.: Detection of tropospheric OH radicals by long-path differential-optical-absorption spectroscopy: Experimental setup, accuracy, and precision, J. Geophys. Res., 102, 16011–16022, https://doi.org/10.1029/97JD00931, 1997.
Heard, D. E. and Pilling, M. J.: Measurement of OH and HO2 in the Troposphere, Chem. Rev., 103, 5163–5198, https://doi.org/10.1021/cr020522s, 2003.
Hens, K., Novelli, A., Martinez, M., Auld, J., Axinte, R., Bohn, B., Fischer, H., Keronen, P., Kubistin, D., Nölscher, A. C., Oswald, R., Paasonen, P., Petäjä, T., Regelin, E., Sander, R., Sinha, V., Sipilä, M., Taraborrelli, D., Tatum Ernest, C., Williams, J., Lelieveld, J., and Harder, H.: Observation and modelling of HOx radicals in a boreal forest, Atmos. Chem. Phys., 14, 8723–8747, https://doi.org/10.5194/acp-14-8723-2014, 2014.
Hofzumahaus, A., Rohrer, F., Lu, K., Bohn, B., Brauers, T., Chang, C.-C., Fuchs, H., Holland, F., Kita, K., Kondo, Y., Li, X., Lou, S., Shao, M., Zeng, L., Wahner, A., and Zhang, Y.: Amplified Trace Gas Removal in the Troposphere, Science, 324, 1702–1704, https://doi.org/10.1126/science.1164566, 2009.
Jacob, D.: Heterogeneous chemistry and tropospheric ozone, Atmos. Environ., 34, 2131–2159, https://doi.org/10.1016/S1352-2310(99)00462-8, 2000.
Jenkin, M. E., Young, J. C., and Rickard, A. R.: The MCM v3.3.1 degradation scheme for isoprene, Atmos. Chem. Phys., 15, 11433–11459, https://doi.org/10.5194/acp-15-11433-2015, 2015.
Jeong, D., Seco, R., Emmons, L., Schwantes, R., Liu, Y., McKinney, K. A., Martin, S. T., Keutsch, F. N., Gu, D., Guenther, A. B., Vega, O., Tota, J., Souza, R. A. F., Springston, S. R., Watson, T. B., and Kim, S.: Reconciling Observed and Predicted Tropical Rainforest OH Concentrations, J. Geophys. Res.-Atmos., 127, 1–18, https://doi.org/10.1029/2020JD032901, 2022.
Kaiser, J., Skog, K. M., Baumann, K., Bertman, S. B., Brown, S. B., Brune, W. H., Crounse, J. D., de Gouw, J. A., Edgerton, E. S., Feiner, P. A., Goldstein, A. H., Koss, A., Misztal, P. K., Nguyen, T. B., Olson, K. F., St. Clair, J. M., Teng, A. P., Toma, S., Wennberg, P. O., Wild, R. J., Zhang, L., and Keutsch, F. N.: Speciation of OH reactivity above the canopy of an isoprene-dominated forest, Atmos. Chem. Phys., 16, 9349–9359, https://doi.org/10.5194/acp-16-9349-2016, 2016.
Kanaya, Y., Cao, R., Akimoto, H., Fukuda, M., Komazaki, Y., Yokouchi, Y., Koike, M., Tanimoto, H., Takegawa, N., and Kondo, Y.: Urban photochemistry in central Tokyo: 1. Observed and modeled OH and HO2 radical concentrations during the winter and summer of 2004, J. Geophys. Res., 112, D21312, https://doi.org/10.1029/2007JD008670, 2007.
Kukui, A., Legrand, M., Preunkert, S., Frey, M. M., Loisil, R., Gil Roca, J., Jourdain, B., King, M. D., France, J. L., and Ancellet, G.: Measurements of OH and RO2 radicals at Dome C, East Antarctica, Atmos. Chem. Phys., 14, 12373–12392, https://doi.org/10.5194/acp-14-12373-2014, 2014.
Kuyper, B., Wingrove, H., Lesch, T., Labuschagne, C., Say, D., Martin, D., Young, D., Khan, M. A. H., O'Doherty, S., Davies-Coleman, M. T., and Shallcross, D. E.: Atmospheric Toluene and Benzene Mole Fractions at Cape Town and Cape Point and an Estimation of the Hydroxyl Radical Concentrations in the Air above the Cape Peninsula, South Africa, ACS Earth Space Chem., 4, 24–34, https://doi.org/10.1021/acsearthspacechem.9b00207, 2020.
Lelieveld, J., Butler, T. M., Crowley, J. N., Dillon, T. J., Fischer, H., Ganzeveld, L., Harder, H., Lawrence, M. G., Martinez, M., Taraborrelli, D., and Williams, J.: Atmospheric oxidation capacity sustained by a tropical forest, Nature, 452, 737–740, https://doi.org/10.1038/nature06870, 2008.
Lew, M. M., Rickly, P. S., Bottorff, B. P., Reidy, E., Sklaveniti, S., Léonardis, T., Locoge, N., Dusanter, S., Kundu, S., Wood, E., and Stevens, P. S.: OH and HO2 radical chemistry in a midlatitude forest: measurements and model comparisons, Atmos. Chem. Phys., 20, 9209–9230, https://doi.org/10.5194/acp-20-9209-2020, 2020.
Li, Z., Xue, L., Yang, X., Zha, Q., Tham, Y. J., Yan, C., Louie, P. K. K., Luk, C. W. Y., Wang, T., and Wang, W.: Oxidizing capacity of the rural atmosphere in Hong Kong, Southern China, Sci. Total Environ., 612, 1114–1122, https://doi.org/10.1016/j.scitotenv.2017.08.310, 2018.
Lou, S., Holland, F., Rohrer, F., Lu, K., Bohn, B., Brauers, T., Chang, C. C., Fuchs, H., Häseler, R., Kita, K., Kondo, Y., Li, X., Shao, M., Zeng, L., Wahner, A., Zhang, Y., Wang, W., and Hofzumahaus, A.: Atmospheric OH reactivities in the Pearl River Delta – China in summer 2006: measurement and model results, Atmos. Chem. Phys., 10, 11243–11260, https://doi.org/10.5194/acp-10-11243-2010, 2010.
Lu, K., Guo, S., Tan, Z., Wang, H., Shang, D., Liu, Y., Li, X., Wu, Z., Hu, M., and Zhang, Y.: Exploring atmospheric free-radical chemistry in China: the self-cleansing capacity and the formation of secondary air pollution, Natl. Sci. Rev., 6, 579–594, https://doi.org/10.1093/nsr/nwy073, 2019.
Lu, K. D., Rohrer, F., Holland, F., Fuchs, H., Bohn, B., Brauers, T., Chang, C. C., Häseler, R., Hu, M., Kita, K., Kondo, Y., Li, X., Lou, S. R., Nehr, S., Shao, M., Zeng, L. M., Wahner, A., Zhang, Y. H., and Hofzumahaus, A.: Observation and modelling of OH and HO2 concentrations in the Pearl River Delta 2006: a missing OH source in a VOC rich atmosphere, Atmos. Chem. Phys., 12, 1541–1569, https://doi.org/10.5194/acp-12-1541-2012, 2012.
Lu, K. D., Hofzumahaus, A., Holland, F., Bohn, B., Brauers, T., Fuchs, H., Hu, M., Häseler, R., Kita, K., Kondo, Y., Li, X., Lou, S. R., Oebel, A., Shao, M., Zeng, L. M., Wahner, A., Zhu, T., Zhang, Y. H., and Rohrer, F.: Missing OH source in a suburban environment near Beijing: observed and modelled OH and HO2 concentrations in summer 2006, Atmos. Chem. Phys., 13, 1057–1080, https://doi.org/10.5194/acp-13-1057-2013, 2013.
Ma, X., Tan, Z., Lu, K., Yang, X., Liu, Y., Li, S., Li, X., Chen, S., Novelli, A., Cho, C., Zeng, L., Wahner, A., and Zhang, Y.: Winter photochemistry in Beijing: Observation and model simulation of OH and HO2 radicals at an urban site, Sci. Total Environ., 685, 85–95, https://doi.org/10.1016/j.scitotenv.2019.05.329, 2019.
Mao, J., Ren, X., Zhang, L., Van Duin, D. M., Cohen, R. C., Park, J.-H., Goldstein, A. H., Paulot, F., Beaver, M. R., Crounse, J. D., Wennberg, P. O., DiGangi, J. P., Henry, S. B., Keutsch, F. N., Park, C., Schade, G. W., Wolfe, G. M., Thornton, J. A., and Brune, W. H.: Insights into hydroxyl measurements and atmospheric oxidation in a California forest, Atmos. Chem. Phys., 12, 8009–8020, https://doi.org/10.5194/acp-12-8009-2012, 2012.
Mauldin III, R., Kosciuch, E., Eisele, F., Huey, G., Tanner, D., Sjostedt, S., Blake, D., Chen, G., Crawford, J., and Davis, D.: South Pole Antarctica observations and modeling results: New insights on HOx radical and sulfur chemistry, Atmos. Environ., 44, 572–581, https://doi.org/10.1016/j.atmosenv.2009.07.058, 2010.
Mauldin III, R. L., Eisele, F. L., Cantrell, C. A., Kosciuch, E., Ridley, B. A., Lefer, B., Tanner, D. J., Nowak, J. B., Chen, G., Wang, L., and Davis, D.: Measurements of OH aboard the NASA P-3 during PEM-Tropics B, J. Geophys. Res., 106, 32657–32666, https://doi.org/10.1029/2000JD900832, 2001.
McKeen, S. A., Mount, G., Eisele, F., Williams, E., Harder, J., Goldan, P., Kuster, W., Liu, S. C., Baumann, K., Tanner, D., Fried, A., Sewell, S., Cantrell, C., and Shetter, R.: Photochemical modeling of hydroxyl and its relationship to other species during the Tropospheric OH Photochemistry Experiment, J. Geophys. Res., 102, 6467–6493, https://doi.org/10.1029/96JD03322, 1997.
Nie, W., Yan, C., Huang, D. D., Wang, Z., Liu, Y., Qiao, X., Guo, Y., Tian, L., Zheng, P., Xu, Z., Li, Y., Xu, Z., Qi, X., Sun, P., Wang, J., Zheng, F., Li, X., Yin, R., Dallenbach, K. R., Bianchi, F., Petäjä, T., Zhang, Y., Wang, M., Schervish, M., Wang, S., Qiao, L., Wang, Q., Zhou, M., Wang, H., Yu, C., Yao, D., Guo, H., Ye, P., Lee, S., Li, Y. J., Liu, Y., Chi, X., Kerminen, V.-M., Ehn, M., Donahue, N. M., Wang, T., Huang, C., Kulmala, M., Worsnop, D., Jiang, J., and Ding, A.: Secondary organic aerosol formed by condensing anthropogenic vapours over China's megacities, Nat. Geosci., 15, 255–261, https://doi.org/10.1038/s41561-022-00922-5, 2022.
Novelli, A., Hens, K., Tatum Ernest, C., Kubistin, D., Regelin, E., Elste, T., Plass-Dülmer, C., Martinez, M., Lelieveld, J., and Harder, H.: Characterisation of an inlet pre-injector laser-induced fluorescence instrument for the measurement of atmospheric hydroxyl radicals, Atmos. Meas. Tech., 7, 3413–3430, https://doi.org/10.5194/amt-7-3413-2014, 2014.
Novelli, A., Vereecken, L., Bohn, B., Dorn, H.-P., Gkatzelis, G. I., Hofzumahaus, A., Holland, F., Reimer, D., Rohrer, F., Rosanka, S., Taraborrelli, D., Tillmann, R., Wegener, R., Yu, Z., Kiendler-Scharr, A., Wahner, A., and Fuchs, H.: Importance of isomerization reactions for OH radical regeneration from the photo-oxidation of isoprene investigated in the atmospheric simulation chamber SAPHIR, Atmos. Chem. Phys., 20, 3333–3355, https://doi.org/10.5194/acp-20-3333-2020, 2020.
Peng, X., Wang, T., Wang, W., Ravishankara, A. R., George, C., Xia, M., Cai, M., Li, Q., Salvador, C. M., Lau, C., Lyu, X., Poon, C. N., Mellouki, A., Mu, Y., Hallquist, M., Saiz-Lopez, A., Guo, H., Herrmann, H., Yu, C., Dai, J., Wang, Y., Wang, X., Yu, A., Leung, K., Lee, S., and Chen, J.: Photodissociation of particulate nitrate as a source of daytime tropospheric Cl2, Nat. Commun., 13, 939, https://doi.org/10.1038/s41467-022-28383-9, 2022.
Rohrer, F. and Berresheim, H.: Strong correlation between levels of tropospheric hydroxyl radicals and solar ultraviolet radiation, Nature, 442, 184–187, https://doi.org/10.1038/nature04924, 2006.
Rohrer, F., Lu, K., Hofzumahaus, A., Bohn, B., Brauers, T., Chang, C.-C., Fuchs, H., Häseler, R., Holland, F., Hu, M., Kita, K., Kondo, Y., Li, X., Lou, S., Oebel, A., Shao, M., Zeng, L., Zhu, T., Zhang, Y., and Wahner, A.: Maximum efficiency in the hydroxyl-radical-based self-cleansing of the troposphere, Nat. Geosci., 7, 559–563, https://doi.org/10.1038/ngeo2199, 2014.
Shirley, T. R., Brune, W. H., Ren, X., Mao, J., Lesher, R., Cardenas, B., Volkamer, R., Molina, L. T., Molina, M. J., Lamb, B., Velasco, E., Jobson, T., and Alexander, M.: Atmospheric oxidation in the Mexico City Metropolitan Area (MCMA) during April 2003, Atmos. Chem. Phys., 6, 2753–2765, https://doi.org/10.5194/acp-6-2753-2006, 2006.
Slater, E. J., Whalley, L. K., Woodward-Massey, R., Ye, C., Lee, J. D., Squires, F., Hopkins, J. R., Dunmore, R. E., Shaw, M., Hamilton, J. F., Lewis, A. C., Crilley, L. R., Kramer, L., Bloss, W., Vu, T., Sun, Y., Xu, W., Yue, S., Ren, L., Acton, W. J. F., Hewitt, C. N., Wang, X., Fu, P., and Heard, D. E.: Elevated levels of OH observed in haze events during wintertime in central Beijing, Atmos. Chem. Phys., 20, 14847–14871, https://doi.org/10.5194/acp-20-14847-2020, 2020.
Sommariva, R., Haggerstone, A.-L., Carpenter, L. J., Carslaw, N., Creasey, D. J., Heard, D. E., Lee, J. D., Lewis, A. C., Pilling, M. J., and Zádor, J.: OH and HO2 chemistry in clean marine air during SOAPEX-2, Atmos. Chem. Phys., 4, 839–856, https://doi.org/10.5194/acp-4-839-2004, 2004.
Stone, D., Evans, M. J., Edwards, P. M., Commane, R., Ingham, T., Rickard, A. R., Brookes, D. M., Hopkins, J., Leigh, R. J., Lewis, A. C., Monks, P. S., Oram, D., Reeves, C. E., Stewart, D., and Heard, D. E.: Isoprene oxidation mechanisms: measurements and modelling of OH and HO2 over a South-East Asian tropical rainforest during the OP3 field campaign, Atmos. Chem. Phys., 11, 6749–6771, https://doi.org/10.5194/acp-11-6749-2011, 2011.
Stone, D., Whalley, L. K., and Heard, D. E.: Tropospheric OH and HO2 radicals: field measurements and model comparisons, Chem. Soc. Rev., 41, 6348, https://doi.org/10.1039/c2cs35140d, 2012.
Tan, D., Faloona, I., Simpas, J. B., Brune, W., Shepson, P. B., Couch, T. L., Sumner, A. L., Carroll, M. A., Thornberry, T., Apel, E., Riemer, D., and Stockwell, W.: HOx budgets in a deciduous forest: Results from the PROPHET summer 1998 campaign, J. Geophys. Res., 106, 24407–24427, https://doi.org/10.1029/2001JD900016, 2001.
Tan, Z., Fuchs, H., Lu, K., Hofzumahaus, A., Bohn, B., Broch, S., Dong, H., Gomm, S., Häseler, R., He, L., Holland, F., Li, X., Liu, Y., Lu, S., Rohrer, F., Shao, M., Wang, B., Wang, M., Wu, Y., Zeng, L., Zhang, Y., Wahner, A., and Zhang, Y.: Radical chemistry at a rural site (Wangdu) in the North China Plain: observation and model calculations of OH, HO2 and RO2 radicals, Atmos. Chem. Phys., 17, 663–690, https://doi.org/10.5194/acp-17-663-2017, 2017.
Tan, Z., Rohrer, F., Lu, K., Ma, X., Bohn, B., Broch, S., Dong, H., Fuchs, H., Gkatzelis, G. I., Hofzumahaus, A., Holland, F., Li, X., Liu, Y., Liu, Y., Novelli, A., Shao, M., Wang, H., Wu, Y., Zeng, L., Hu, M., Kiendler-Scharr, A., Wahner, A., and Zhang, Y.: Wintertime photochemistry in Beijing: observations of ROx radical concentrations in the North China Plain during the BEST-ONE campaign, Atmos. Chem. Phys., 18, 12391–12411, https://doi.org/10.5194/acp-18-12391-2018, 2018.
Tan, Z., Lu, K., Hofzumahaus, A., Fuchs, H., Bohn, B., Holland, F., Liu, Y., Rohrer, F., Shao, M., Sun, K., Wu, Y., Zeng, L., Zhang, Y., Zou, Q., Kiendler-Scharr, A., Wahner, A., and Zhang, Y.: Experimental budgets of OH, HO2, and RO2 radicals and implications for ozone formation in the Pearl River Delta in China 2014, Atmos. Chem. Phys., 19, 7129–7150, https://doi.org/10.5194/acp-19-7129-2019, 2019.
Tang, J. H., Chan, L. Y., Chan, C. Y., Li, Y. S., Chang, C. C., Wang, X. M., Zou, S. C., Barletta, B., Blake, D. R., and Wu, D.: Implications of changing urban and rural emissions on non-methane hydrocarbons in the Pearl River Delta region of China, Atmos. Environ., 42, 3780–3794, https://doi.org/10.1016/j.atmosenv.2007.12.069, 2008.
Tanner, D. J. and Eisele, F. L.: Present OH measurement limits and associated uncertainties, J. Geophys. Res., 100, 2883, https://doi.org/10.1029/94JD02609, 1995.
Tanner, D. J., Jefferson, A., and Eisele, F. L.: Selected ion chemical ionization mass spectrometric measurement of OH, J. Geophys. Res., 102, 6415–6425, https://doi.org/10.1029/96JD03919, 1997.
Thames, A. B., Brune, W. H., Miller, D. O., Allen, H. M., Apel, E. C., Blake, D. R., Bui, T. P., Commane, R., Crounse, J. D., Daube, B. C., Diskin, G. S., DiGangi, J. P., Elkins, J. W., Hall, S. R., Hanisco, T. F., Hannun, R. A., Hintsa, E., Hornbrook, R. S., Kim, M. J., McKain, K., Moore, F. L., Nicely, J. M., Peischl, J., Ryerson, T. B., St. Clair, J. M., Sweeney, C., Teng, A., Thompson, C. R., Ullmann, K., Wennberg, P. O., and Wolfe, G. M.: Missing OH reactivity in the global marine boundary layer, Atmos. Chem Phys., 20, 4013–4029, https://doi.org/10.5194/acp-20-4013-2020, 2020.
Walker, H. L., Heal, M. R., Braban, C. F., Whalley, L. K., and Twigg, M. M.: Evaluation of local measurement-driven adjustments of modelled cloud-free atmospheric photolysis rate coefficients, Environ. Sci. Atmos., 2, 1411–1427, https://doi.org/10.1039/D2EA00072E, 2022.
Wang, F., Hu, R., Chen, H., Xie, P., Wang, Y., Li, Z., Jin, H., Liu, J., and Liu, W.: Development of a field system for measurement of tropospheric OH radical using laser-induced fluorescence technique, Opt. Express, 27, A419, https://doi.org/10.1364/OE.27.00A419, 2019.
Wang, G., Iradukunda, Y., Shi, G., Sanga, P., Niu, X., and Wu, Z.: Hydroxyl, hydroperoxyl free radicals determination methods in atmosphere and troposphere, J. Environ. Sci., 99, 324–335, https://doi.org/10.1016/j.jes.2020.06.038, 2021.
Wang, T., Dai, J., Lam, K. S., Nan Poon, C., and Brasseur, G. P.: Twenty-Five Years of Lower Tropospheric Ozone Observations in Tropical East Asia: The Influence of Emissions and Weather Patterns, Geophys. Res. Lett., 46, 11463–11470, https://doi.org/10.1029/2019GL084459, 2019.
Wang, Y., Hu, R., Xie, P., Chen, H., Wang, F., Liu, X., Liu, J., and Liu, W.: Measurement of tropospheric HO2 radical using fluorescence assay by gas expansion with low interferences, J. Environ. Sci., 99, 40–50, https://doi.org/10.1016/j.jes.2020.06.010, 2021.
Wang, Y. Q.: MeteoInfo: GIS software for meteorological data visualization and analysis: Meteorological GIS software, Meteorol. Appl., 21, 360–368, https://doi.org/10.1002/met.1345, 2014.
Wang, Y. Q.: An Open Source Software Suite for Multi-Dimensional Meteorological Data Computation and Visualisation, J. Open Res. Softw., 7, 21, https://doi.org/10.5334/jors.267, 2019.
Wennberg, P. O., Bates, K. H., Crounse, J. D., Dodson, L. G., McVay, R. C., Mertens, L. A., Nguyen, T. B., Praske, E., Schwantes, R. H., Smarte, M. D., St Clair, J. M., Teng, A. P., Zhang, X., and Seinfeld, J. H.: Gas-Phase Reactions of Isoprene and Its Major Oxidation Products, Chem. Rev., 118, 3337–3390, https://doi.org/10.1021/acs.chemrev.7b00439, 2018.
Whalley, L. K., Edwards, P. M., Furneaux, K. L., Goddard, A., Ingham, T., Evans, M. J., Stone, D., Hopkins, J. R., Jones, C. E., Karunaharan, A., Lee, J. D., Lewis, A. C., Monks, P. S., Moller, S. J., and Heard, D. E.: Quantifying the magnitude of a missing hydroxyl radical source in a tropical rainforest, Atmos. Chem. Phys., 11, 7223–7233, https://doi.org/10.5194/acp-11-7223-2011, 2011.
Whalley, L. K., Stone, D., Dunmore, R., Hamilton, J., Hopkins, J. R., Lee, J. D., Lewis, A. C., Williams, P., Kleffmann, J., Laufs, S., Woodward-Massey, R., and Heard, D. E.: Understanding in situ ozone production in the summertime through radical observations and modelling studies during the Clean air for London project (ClearfLo), Atmos. Chem. Phys., 18, 2547–2571, https://doi.org/10.5194/acp-18-2547-2018, 2018.
Wolfe, G. M., Marvin, M. R., Roberts, S. J., Travis, K. R., and Liao, J.: The Framework for 0-D Atmospheric Modeling (F0AM) v3.1, Geosci. Model Dev., 9, 3309–3319, https://doi.org/10.5194/gmd-9-3309-2016, 2016.
Woodward-Massey, R., Slater, E. J., Alen, J., Ingham, T., Cryer, D. R., Stimpson, L. M., Ye, C., Seakins, P. W., Whalley, L. K., and Heard, D. E.: Implementation of a chemical background method for atmospheric OH measurements by laser-induced fluorescence: characterisation and observations from the UK and China, Atmos. Meas. Tech., 13, 3119–3146, https://doi.org/10.5194/amt-13-3119-2020, 2020.
Xia, M., Wang, T., Wang, Z., Chen, Y., Peng, X., Huo, Y., Wang, W., Yuan, Q., Jiang, Y., Guo, H., Lau, C., Leung, K., Yu, A., and Lee, S.: Pollution-Derived Br2 Boosts Oxidation Power of the Coastal Atmosphere, Environ. Sci. Technol., 56, 12055–12065, https://doi.org/10.1021/acs.est.2c02434, 2022.
Xiao, Y., Jacob, D. J., and Turquety, S.: Atmospheric acetylene and its relationship with CO as an indicator of air mass age, J. Geophys. Res., 112, D12305, https://doi.org/10.1029/2006JD008268, 2007.
Yang, X., Lu, K., Ma, X., Gao, Y., Tan, Z., Wang, H., Chen, X., Li, X., Huang, X., He, L., Tang, M., Zhu, B., Chen, S., Dong, H., Zeng, L., and Zhang, Y.: Radical chemistry in the Pearl River Delta: observations and modeling of OH and HO2 radicals in Shenzhen in 2018, Atmos. Chem. Phys., 22, 12525–12542, https://doi.org/10.5194/acp-22-12525-2022, 2022.
Yang, Y., Shao, M., Wang, X., Nölscher, A. C., Kessel, S., Guenther, A., and Williams, J.: Towards a quantitative understanding of total OH reactivity: A review, Atmos. Environ., 134, 147–161, https://doi.org/10.1016/j.atmosenv.2016.03.010, 2016.
Yao, T., Fung, J. C. H., Ma, H., Lau, A. K. H., Chan, P. W., Yu, J. Z., and Xue, J.: Enhancement in secondary particulate matter production due to mountain trapping, Atmos. Res., 147–148, 227–236, https://doi.org/10.1016/j.atmosres.2014.05.007, 2014.


