the Creative Commons Attribution 4.0 License.
the Creative Commons Attribution 4.0 License.
 | 23 Jun 2023
A 1-year aerosol chemical speciation monitor (ACSM) source analysis of organic aerosol particle contributions from anthropogenic sources after long-range transport at the TROPOS research station Melpitz
Samira Atabakhsh
Laurent Poulain
Gang Chen
Francesco Canonaco
André S. H. Prévôt
Mira Pöhlker
Alfred Wiedensohler
Atmospheric aerosol particles are a complex combination of primary emitted sources (biogenic and anthropogenic) and secondary aerosol resulting from aging processes such as condensation, coagulation, and cloud processing. To better understand their sources, investigations have been focused on urban areas in the past, whereas rural-background stations are normally less impacted by surrounding anthropogenic sources. Therefore, they are predisposed for studying the impact of long-range transport of anthropogenic aerosols. Here, the chemical composition and organic aerosol (OA) sources of submicron aerosol particles measured by an aerosol chemical speciation monitor (ACSM) and a multi-angle absorption photometer (MAAP) were investigated at Melpitz from September 2016 to August 2017. The location of the station at the frontier between western and eastern Europe makes it the ideal place to investigate the impact of long-range transport over Europe. Indeed, the station is under the influence of less polluted air masses from westerly directions and more polluted continental air masses from eastern Europe. The OA dominated the submicron particle mass concentration and showed strong seasonal variability ranging from 39 % (in winter) to 58 % (in summer). It was followed by sulfate (15 % and 20 %) and nitrate (24 % and 11 %). The OA source identification was performed using the rolling positive matrix factorization (PMF) approach to account for the potential temporal changes in the source profile. It was possible to split OA into five factors with a distinct temporal variability and mass spectral signature. Three were associated with anthropogenic primary OA (POA) sources: hydrocarbon-like OA (HOA; 5.2 % of OA mass in winter and 6.8 % in summer), biomass burning OA (BBOA; 10.6 % and 6.1 %) and coal combustion OA (CCOA; 23 % and 8.7 %). Another two are secondary and processed oxygenated OA (OOA) sources: less oxidized OOA (LO-OOA; 28.4 % and 36.7 %) and more oxidized OOA (MO-OOA; 32.8 % and 41.8 %). Since equivalent black carbon (eBC) was clearly associated with the identified POA factors (sum of HOA, BBOA, and CCOA; R2= 0. 87), eBC's contribution to each of the POA factors was achieved using a multilinear regression model. Consequently, CCOA represented the main anthropogenic sources of carbonaceous aerosol (sum of OA and eBC) not only during winter (56 % of POA in winter) but also in summer (13 % of POA in summer), followed by BBOA (29 % and 69 % of POA in winter and summer, respectively) and HOA (15 % and 18 % of POA in winter and summer, respectively). A seasonal air mass cluster analysis was used to understand the geographical origins of the different aerosol types and showed that during both winter and summer time, PM1 (PM with an aerodynamic diameter smaller than 1 µm) air masses with eastern influence were always associated with the highest mass concentration and the highest coal combustion fraction. Since during wintertime CCOA is a combination of domestic heating and power plant emissions, the summer contribution of CCOA emphasizes the critical importance of coal power plant emissions to rural-background aerosols and its impact on air quality, through long-range transportation.
- Article
(3939 KB) - Full-text XML
-
Supplement
(1358 KB) - BibTeX
- EndNote


Human health effects of air pollution from particulate matter (PM) are well known, and efforts are being made across the world (WHO; Expert Consultation, 2019) to minimize both long-term exposures to harmful levels and air pollution peaks. The submicronic particles known as PM1 (particles with an aerodynamic diameter less than 1 µm) not only have a negative impact on human health (Pope and Dockery, 2006; Daellenbach et al., 2020) but also a significant effect on visibility (Shi et al., 2014) and climate (Shrivastava et al., 2017). Its ability to penetrate the respiratory system makes it more dangerous, and therefore it is more relevant to mitigate adverse health impacts. Since the most numerous component of the atmospheric PM is the organic aerosol (OA) (Jimenez et al., 2009; Chen et al., 2022), contributions to OA and explanations of its chemical and physical characteristics remain challenging, whereas the large variety of OA can be attributed to primary emissions by various sources in different seasons, as well as different reactions to atmospheric dynamics and complicated chemical mechanisms depending on meteorological parameters and geographical locations.
In order to evaluate and recognize the sources of OA emission, aerosol mass spectrometer (AMS; Jayne et al., 2000) and aerosol chemical speciation monitor (ACSM) (Ng et al., 2011; Fröhlich et al., 2013) instruments are widely deployed worldwide (Chen et al., 2022; Bressi et al., 2021; Fröhlich et al., 2015). The AMS is commonly limited to short time periods due to the high maintenance of the AMS measurements and its high operating costs. As a result, only a few studies run the AMS continuously (e.g., see Kumar et al., 2022; O'Dowd et al., 2014). However, there was still a strong need for such a long-term analysis. The ACSM is designated for long-term monitoring purposes due to its robustness and is much less labor-intense compared to the AMS. Therefore, the deployment of the ACSM allows us to look at the long-term (more than 1 year) temporal changes and seasonal variability of OA sources.
Regarding the identification of OA sources, source apportionment analysis using the positive matrix factorization algorithm (PMF; Paatero and Tappert, 1994) has been intensively used over the past 2 decades on both AMS and ACSM measurements (e.g., see Crippa et al., 2014; Poulain et al., 2020). However, this algorithm faced two main limitations when used during a long time period: firstly, the factor profiles are static over the analyzing period (Paatero, 1997); and secondly, there is rotational ambiguity which provides non-unique solutions. To solve these issues, a multilinear engine (ME-2; Paatero, 1999) has been implemented in the PMF analysis, which allows the use of a priori knowledge to constrain the model to environmentally reasonable solutions (e.g., Canonaco et al., 2013; Crippa et al., 2014). To consider the temporal variation of the factor profiles, a rolling approach was suggested (Parworth et al., 2015; Canonaco et al., 2021). The rolling strategy involves advancing a smaller PMF window (i.e., 14 d) and moving it over the whole dataset to catch the temporal changes of the source profiles with a 1 d step.
Although several studies in Europe have already conducted source apportionment analyses of 1 year or more, most of them were associated with urban or suburban environments (e.g., for urban studies; Stavroulas et al., 2019; Vlachou et al., 2019; Huang et al., 2019; Qi et al., 2020; and for suburban studies: Katsanos et al., 2019; Zhang et al., 2019), and only a few of them were studied in rural-background sites (Schlag et al., 2016; Crippa et al., 2014; Vlachou et al., 2018; Paglione et al., 2020; Dudoitis et al., 2016; Heikkinen et al., 2021; Chen et al., 2021, 2022), although the rural-background sites represent the major advantage to be able to study the impact of long-range transport of anthropogenic emissions and their changes over a long time period. The Leibniz Institute for Tropospheric Research (TROPOS) central European observatory in Melpitz has been continuously measuring aerosol chemical compositions for 30 years. The station is in a unique place in Europe, sitting at the border between marine-influenced western Europe and continental eastern Europe. A direct consequence is that the aerosol chemical compositions and mass concentrations strongly depend on the air mass origins, showing less polluted air masses coming from the west and more polluted air masses from the east (Birmili et al., 2010; Spindler et al., 2010). However, only a few studies were done on the source identification of the aerosol reaching the station by covering short time periods mostly during winter (van Pinxteren et al., 2016, 2020).
The current study comprehensively investigates the PM1 aerosol particle chemical compositions and the various OA sources for Melpitz as a rural-background station, based on ACSM and multi-angle absorption photometer (MAAP) measurements from September 2016 to August 2017, using the most advanced rolling PMF with ME-2 implemented in the SoFi Pro package (Datalystica Ltd., Villigen, Switzerland) (Parworth et al., 2015; Canonaco et al., 2013, 2021). Although previous papers already considered this dataset, they were focused on quality assurance (Poulain et al., 2020) to depict the European aerosol chemical composition (Bressi et al., 2021; Chen et al., 2022) or the relationship between the cloud condensation nuclei (CCN) properties (Wang et al., 2022; Schmale et al., 2017); none of these papers were focused on carbonaceous source identification (OA and equivalent black carbon (eBC)) nor did they discuss the strong dependency of the aerosol chemical composition to the air mass origin. Therefore, a multilinear regression model was used to estimate the contribution of eBC to the various primary organic PMF factors such as hydrocarbon-like organic aerosol, biomass burning organic aerosol, and coal combustion organic aerosol. Meanwhile, to better understand the emission area of PM1 chemical composition and PMF factors, the influence of air mass origin was investigated based on self-developed back-trajectory cluster methods (BCLM).
2.1 Sampling site
The atmospheric aerosol measurements were carried out at the TROPOS research station at Melpitz (51.54∘ N, 12.93∘ E; 86 m a.s.l.), located approximately 50 km northeast of Leipzig, Germany. The station itself is mainly encircled by agronomical pastures and forests within a rural area, which is why the station is recognized as a rural-background station (Spindler et al., 2013). Since 1992, the station has been monitoring the influence of atmospheric long-range transport on the background air quality of Central European (e.g., Spindler et al., 2012, 2013). The Melpitz station is part of EMEP (European Monitoring and Evaluation Programme, level 3 station; Aas et al., 2012), ACTRIS (Aerosol, Clouds and Trace gases Research Infrastructure), GAW (Global Atmosphere Watch of the World Meteorological Organization), and GUAN (German Ultrafine Aerosol Network; Birmili et al., 2009, 2015, 2016). For a general description of the chemical and physical aerosol characterization analysis techniques, check, e.g., Spindler et al. (2004, 2010, 2012, 2013) and Poulain et al. (2011, 2014, 2020).
2.2 ACSM
The chemical compositions and mass loadings of non-refractory PM1 (NR-PM1: organic, sulfate, nitrate, ammonium, and chloride) with a 30 min time resolution were measured by an Aerodyne quadrupole ACSM. The ACSM sampling technique and operational information were previously detailed by Ng et al. (2011).
Briefly, after PM1 transmits across a 100 µm critical orifice, the aerosols are centralized into a narrow beam in an aerodynamic lens (Liu et al., 2007). Non-refractory particulate material that evaporates at the oven temperature (generally, 600 ∘C) is recorded and chemically determined using electron impact quadrupole mass spectrometry at 70 eV (Ng et al., 2011). The ions are then detected using a quadrupole residual gas analyzer (RGA; Pfeiffer Vacuum Prisma Plus). The ACSM takes 30 s samples of both ambient and particle-free air. The difference in these measurements identifies the aerosol mass spectrum. To change the signal spectra into organic or inorganic species concentrations, the fragmentation table (Allan et al., 2004), the ion transmission correction, and the response factor (RF) are applied. To improve the particle loss as a result of bouncing off the vaporizer, the ACSM data were processed according to manufacturer guidelines using a composition-dependent collection efficiency (CDCE) correction relying on the algorithms suggested by Middlebrook et al. (2012). Calibrations of ionization efficiency (IE) and relative ion efficiency (RIE) were performed using a 350 nm monodispersed ammonium nitrate and ammonium sulfate (Ng et al., 2011). The final mean value for IE was 4.93(±1.45) × 10−11, and the mean values for RIEs for ammonium and sulfate, respectively, were 6.48 ± 1.26 and 0.68 ± 0.13. The quality assurance of the ACSM measurements was performed by comparing them with collocated measurements including by a mobility particle size spectrometer (MPSS) and high-volume filter samples (PM1 and PM2.5) for the total particle mass concentration, water-soluble ions (nitrate, sulfate, and ammonium), as well as OC/EC. Details on the QA/QC and instrumental uncertainties can be found in Poulain et al. (2020).
The ACSM ammonium mass concentration mainly corresponds to ammonium nitrate and ammonium sulfate salts. Previously by Poulain et al. (2020), the neutralization state of the particles was estimated for datasets assuming complete neutralization by nitrate, sulfate, and chloride. Therefore, the particles are neutralized when considering nitrate, ammonium, and sulfate in this study. Furthermore, the significant role of organo-nitrate and organo-sulfate on signals of nitrate and sulfate is not negligible (Kiendler-Scharr et al. (2016). Since the Q-ACSM is working at a unit mass resolution (UMR), it is not possible to distinguish nitrate and sulfate from organic. Therefore, estimating the organo-nitrate would only introduce uncertainties to measurements; thus, we did not consider conducting this analysis in this study.
2.3 Additional measurements
In parallel to the ACSM, a MAAP was used to measure the mass concentrations of eBC (model 5012 Thermo Scientific; Petzold and Schönlinner, 2004). The eBC mass concentration from the PM10 data was multiplied by a constant factor of 0.9 following Poulain et al. (2011) to estimate the eBC mass concentration in the PM1 fraction. Consequently, all the eBC mass concentrations reported and discussed here correspond to the eBC in the PM1 fraction and are referred to as eBC-PM1. Furthermore, a dual mobility particle size spectrometer (TROPOS-type T-MPSS; Birmili et al., 1999) was used to measure the particle number size distribution (PNSD) from 3 to 800 nm (mobility diameter, d mob) at ambient and 300 ∘C temperatures (Wehner et al., 2002). The MAAP was situated in the same laboratory container as the ACSM, these instruments sampled the same PM10 inlet after a dryer, and the sampled air distribution among the instruments was equally assured by an isokinetic splitter (Poulain et al., 2020).
In addition to the online measurements, high-volume samplers (DIGITEL DHA-80; Digitel Elektronik AG, Hegnau, Switzerland) were utilized to capture daily PM2.5 samples on a quartz filter (for 24 h from midnight to midnight). For more details on the sample preparation and evaluation methods, see Spindler et al. (2013). Levoglucosan as a tracer for wood burning combustion was measured following Iinuma et al. (2009) using high-performance anion exchange chromatography coupled with an electrochemical detector (HPAEC-PAD).
Trace gas measurements were also carried out. Ozone was determined by a UV photometric gas analyzer mode 49C (Thermo Scientific, UK), SO2 by an APSA-360A (Horiba, Kyoto, Japan) and NO and NO2 using a customized Trace Level NOx Analysis Model 42i-TL (Thermo Scientific) equipped with a blue light converter. Standard meteorological parameters (temperature, relative humidity, solar radiation, precipitation, wind direction, and wind speed) were regularly measured.
2.4 Rolling PMF (ME-2) source apportionment of OA
This work conducted the most advanced source apportionment analysis following a standardized protocol developed by Chen et al. (2022). The PMF method was used to allocate the source of the OA (Paatero and Tappert, 1994) through the Source Finder professional (SoFi Pro, version 8.0.3.1; Canonaco et al., 2021) software package (Datalystica Ltd., Villigen, Switzerland), within the Igor Pro software environment (Igor Pro, version 8.04; Wavemetrics, Inc., Lake Oswego, OR, USA). Two matrices of factor profiles F and factor contributions G defined the dataset X, and the matrix E named the residual matrix is the fraction which cannot be described by the model. Time series and the chemical fingerprint of sources have been represented by Fkj and Gik, respectively. The dimension of Fkj and Gik are based on the order p, which is the number of factors selected to represent the data defined by the user:
In this study, since the measurement covers a period of 12 months (four full seasons), four separate PMF inputs were prepared. Unconstrained PMF was applied with four to six factor runs for all the seasons; throughout the pre-result and while referring to previous studies (Crippa et al., 2014; van Pinxteren et al., 2016), primary factors were separated as hydrocarbon-like OA (HOA), biomass burning OA (BBOA), and coal combustion OA (CCOA). However, unconstrained PMF did not result to separate the primary factor profiles. Introducing constraints based on prior knowledge is an efficient strategy for avoiding the mixing of primary factors (Canonaco et al., 2013; Crippa et al., 2014). For this reason, the multilinear engine (ME-2) algorithm (Paatero, 1999) enables the incorporation of time series and factor profile constraints in the form of the a-value approach. In dealing with a profile constraint, the a value specifies the variety of a factor that can deviate from the anchor profile during the PMF iteration:
The constraints applied through ME-2 for HOA and BBOA sources used the anchor profile of Crippa et al. (2014) and Ng et al. (2010), respectively. The anchor profile used for CCOA was generated from our own winter data during this work (SI, 1.1). For each of the four seasons, primary profiles were subject to a sensitivity analysis with a values ranging from 0–0.4 for HOA and BBOA and 0–0.5 for CCOA, and steps of 0.1 were used to choose the best a-value combination for these three factors.
In the PMF approach, there is the intrinsic property of static factor profiles during the period of PMF analysis. Even though for short-term measurements (like one or two season/s) this might be a sensible estimation, long-term observations as are typical for current ACSM study (1 year and more) are expected to be subject to evolving factor profiles based on seasonality. To consider the temporal changes, the rolling PMF window method was developed (Canonaco et al., 2021; Parworth et al., 2015). This technique is applied to a small window, which is slowly extended throughout the whole dataset. Based on the dataset, the user determines the width of the PMF window, the shift parameter, and the number of PMF repeats per window; for the current work, we set 14 d windows, a 1 d shift, and 100 repeats per window.
In addition, this rolling PMF analysis was coupled with the bootstrap re-sampling approach (Efron, 1979), which can randomly select a part of the original matrix and repeat a part of the rows to generate a new same-sized matrix to test the stability of solutions and to estimate the statistical error. Overall, we have combined rolling PMF with ME-2 and bootstrap to conduct the source apportionment investigation, and more information on this new approach is described in Canonaco et al. (2021). This approach for a yearlong dataset generates an enormous number of PMF runs (N= 35 800), and not all of the solutions are environmentally reasonable. Since it is practically impossible to manually inspect all PMF runs, the criteria-base selection was introduced in SoFi Pro to automatically and objectively select environmentally reasonable PMF solutions (Canonaco et al., 2021). Finally, the resulting factors were interpreted as HOA, BBOA, CCOA, and two oxygenated OA (OOA) factors named less oxidized OOA (LO-OOA) and more oxidized OOA (MO-OOA). The steps and setups utilized in the evaluation of this dataset are detailed in the Supplement (Sect. 1).
2.5 eBC-PM1 source apportionment
The eBC-PM1 correlated with each of the three identified primary organic factors (HOA, BBOA, and CCOA) during the source apportionment analysis (Table 1, which will be discussed later on in the Results section). The total amount of these primary factors (known as POA) was highly correlated with eBC-PM1 (R2= 0.87; Fig. 8a). As a result, the different sources of eBC-PM1 were evaluated for each factor utilizing a multilinear regression model, as suggested by Laborde et al. (2013), Zhu et al. (2018), and Poulain et al. (2021), for instance. The following assumes that the eBC-PM1 mass is associated with the separate contribution from each OA factor (i.e., eBC-PM1HOA, eBC-PM1BBOA, and eBC-PM1CCOA) at any time:
The eBC-PM1 emission from each source is expected to be proportionate to the separate source mass concentration generated in each season (mHOA, mBBOA, and mCCOA, respectively). As a result, the multilinear regression model can be described as follows:
where a, b, and c are the linear regression coefficients for mHOA, mBBOA, and mCCOA, respectively, that will be applied to evaluate the contribution of eBC-PM1 per each POA factor for each season (Table S4).
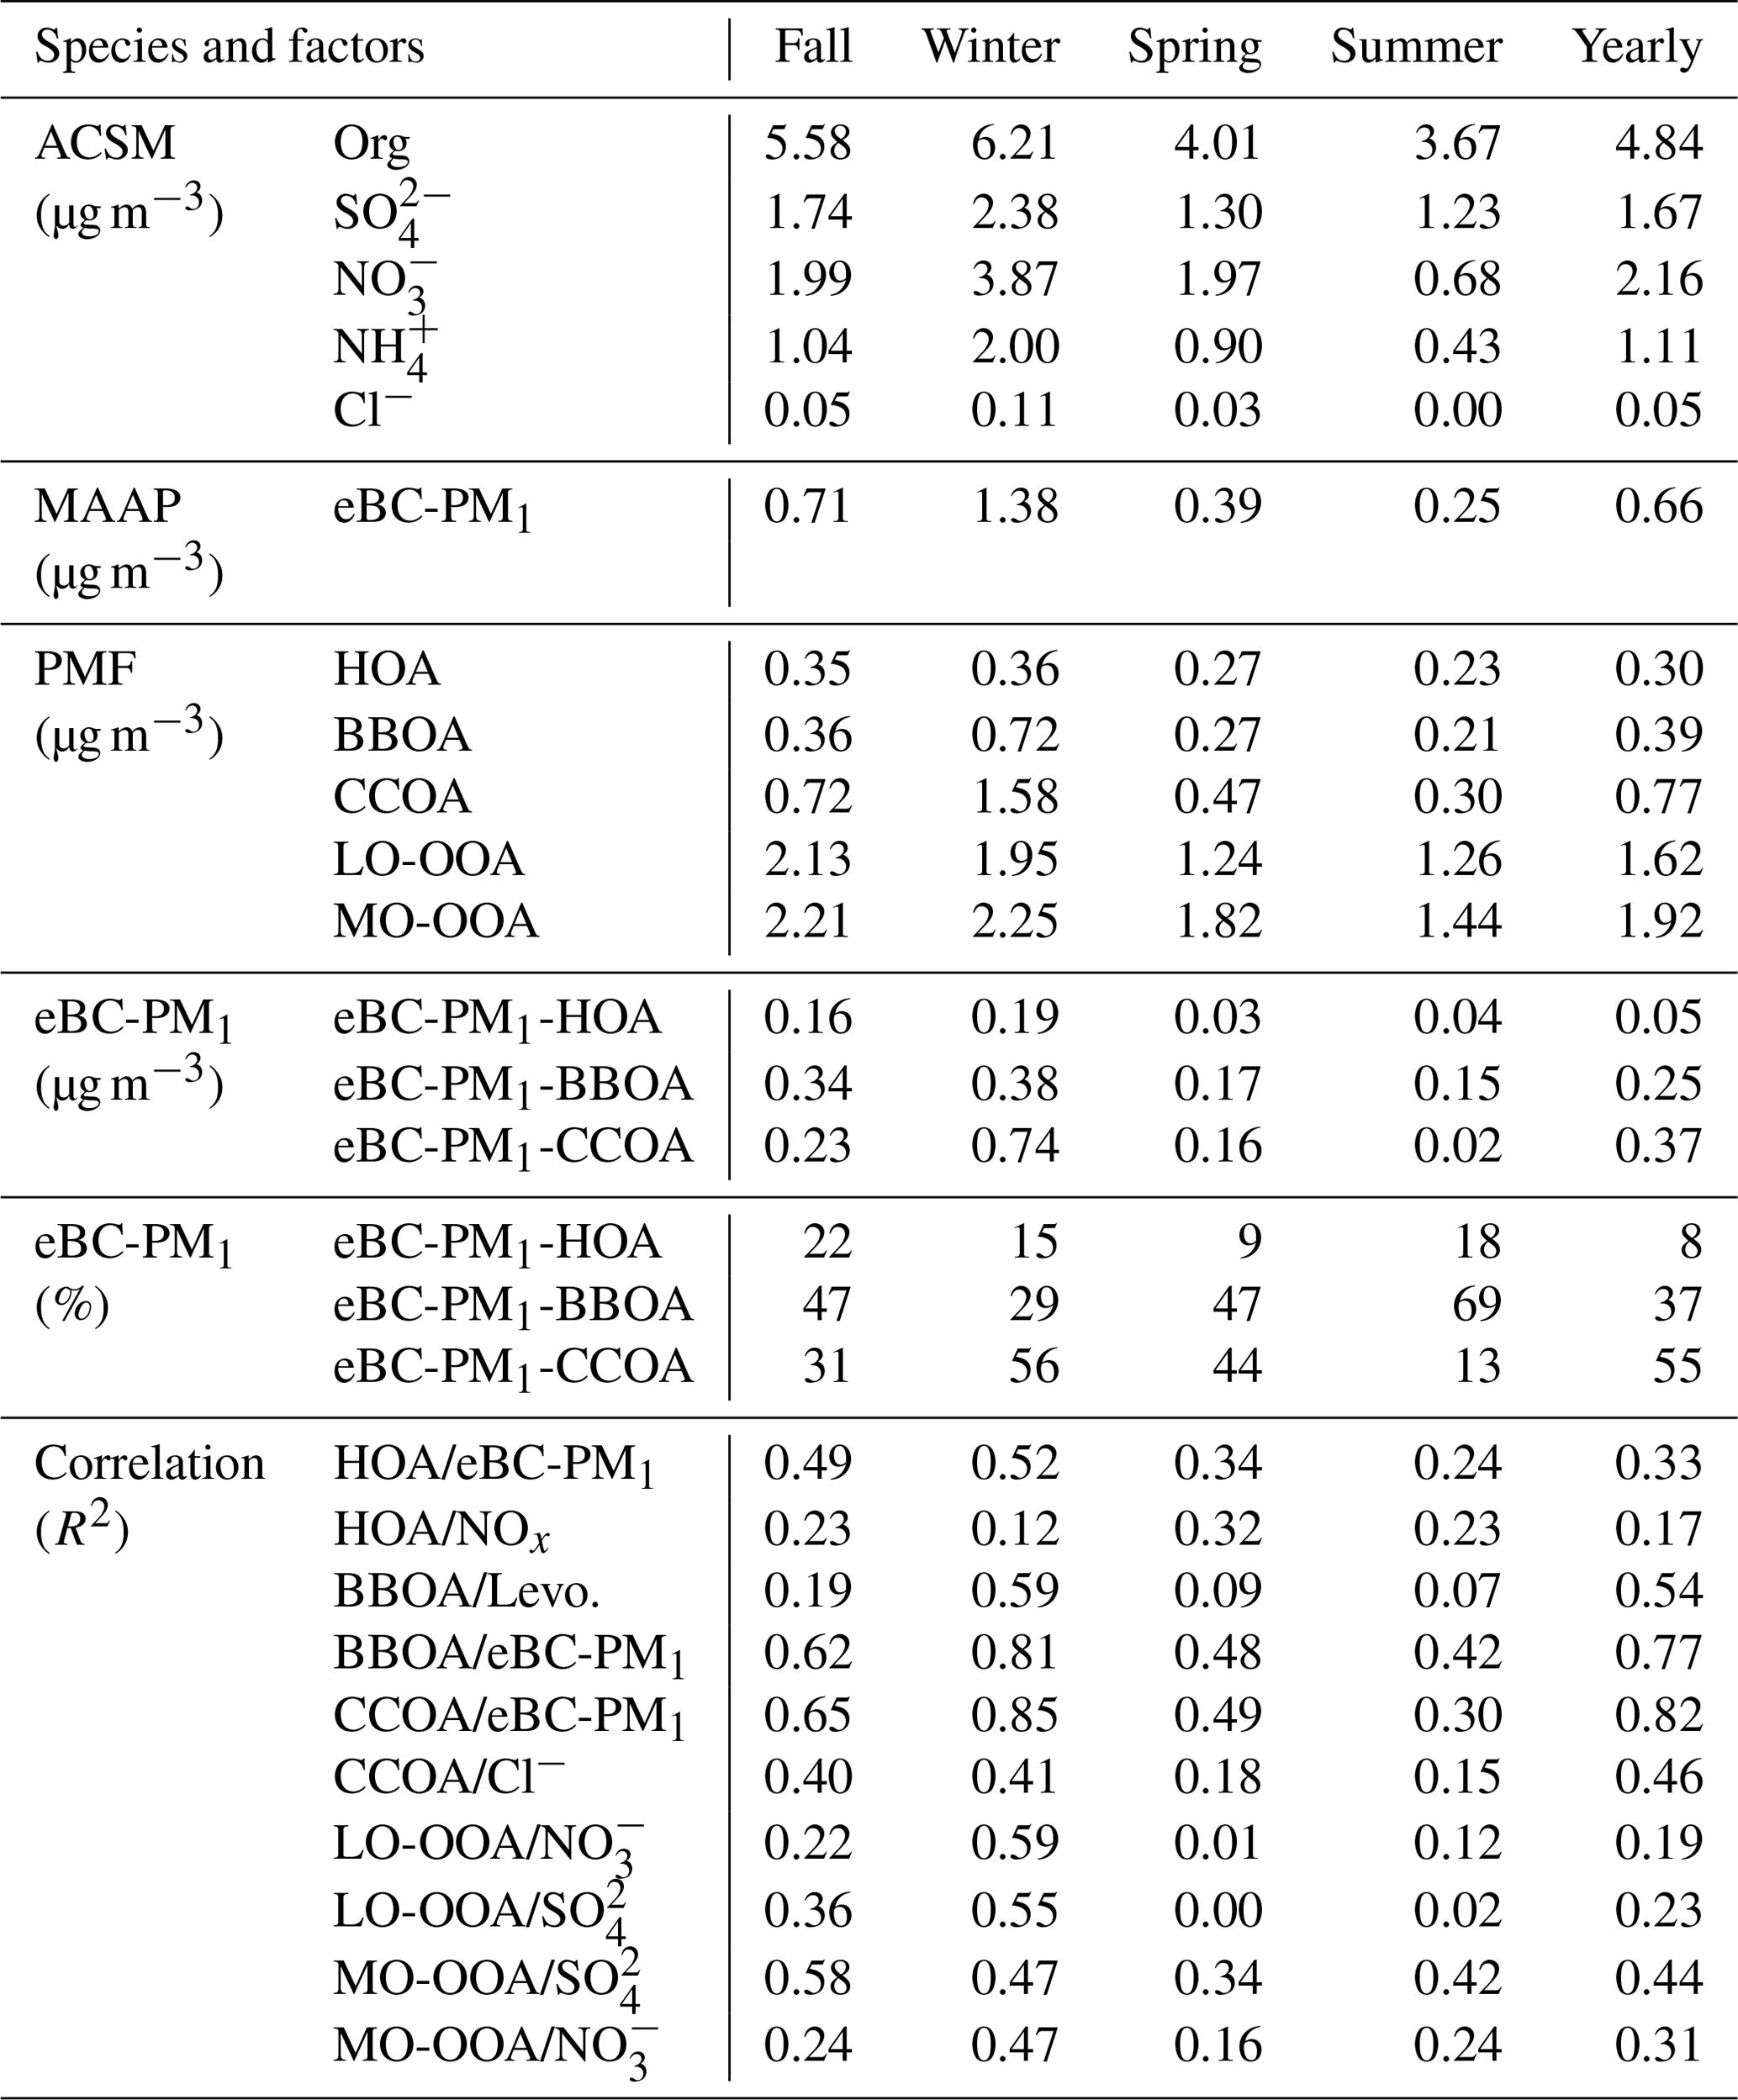
Table 1Seasonal and yearly mass concentration of each ACSM species, each PMF factor, contribution of the different POA-PMF- eBC-PM1, and correlation of each factor with related species.
2.6 Air mass trajectory analysis
Non-parametric wind regression (NWR) was used to approximate the OA source concentrations at a given wind direction and speed (Henry et al., 2009) in order to investigate not only the local but also the prevalent wind sector associated with transported emission sources (Marin et al., 2019). The NOAA HYbrid Single-Particle Lagrangian Integrated Trajectory (HYSPLIT-4) model was used to analyze 96 h backward trajectories at 500 m above the model ground of the sampling place (Draxler and Hess, 1997). The trajectory results were used for two independent but complementary analyses to better depict the emission areas of the aerosol by identifying the potential areas of aerosol sources and by clustering the trajectories.
A cluster analysis of the different trajectories was performed. The synoptic-scale air mass condition, together with geographical locations and paths, is a crucial driver of local pollutant concentrations (e.g., Sun et al., 2020; Ma et al., 2014). Local particle mass concentrations and meteorological conditions can play a significant role and can be associated with specific air mass trajectories. In addition, the trajectories of the air mass can influence aerosol compositions. For example, the stability of the atmosphere is also meaningful, since it influences both the vertical dilution of pollutants and the overall particle mass concentrations. Therefore, the effects of inter-annual variations in air mass conditions and the stability of atmosphere on observed patterns were inspected using a self-developed back-trajectory cluster method (BCLM), concerning air mass backward trajectories, pseudo-potential temperature profiles, PM10 mass concentration profiles over Melpitz, and seasons (Birmili et al., 2010; Ma et al., 2014).
In this method, the different clusters can be divided according to the different seasons (CS, cold season; TS, transition season; and WS, warm season) and meteorological synoptic patterns (ST, stagnant; A1, anticyclonic with air mass coming from eastern Europe; A2, anticyclonic with air mass coming from the west; C1, cyclonic with air mass coming from relatively south; and C2, cyclonic with air mass coming from the west and southwest). However, the clustering approach did not consider spring and fall separately, and therefore the transition clusters correspond to both spring and fall. Finally, a total of 15 clusters were identified, corresponding to different meteorological conditions over the course of the year. Descriptive analysis, cluster processing, and data processes and products are all described in detail by Sun et al. (2020) and Ma et al. (2014).
3.1 PM1 chemical composition
In this work, we investigate 1-year-long measurements of PM1 for Melpitz, Germany. All the data are presented in UTC, during the winter and summer; the time zone is 1 and 2 h behind local time, respectively. Yearly time series, seasonal variation, and diurnal cycles of aerosol particle chemical compositions including mass concentrations and mass fractions, as measured by the ACSM and MAAP, are shown in Figs. 1, 2, and 3, respectively. Over the entire period, the chemical composition of PM1 was basically made up of organic aerosol (46 % of the total mass; Fig. 1c), sulfate (16 %), nitrate (21 %), ammonium (11 %), eBC-PM1 (6 %), and chloride (close to 0 %). However, a mean mass concentration of 10.49 µg m−3 (Fig. 1) was obtained with an obvious seasonal trend which detected the highest total mass concentration (15.95 µg m−3) during the wintertime and lowest mass concentration during the summer time (6.24 µg m−3) (Fig. 2a). Compared to previous AMS measurements of Poulain et al. (2011) at the same station, a similar seasonal trend was observed in the period 2008–2009, while the absolute masses differed (Table S1 in the Supplement), which is at least partially related to the inter-annual changes of the meteorological conditions. Compared to previous ACSM long-term measurements by Poulain et al. (2020) at the same station, a similar mean mass concentration of PM1 was observed in the period from June 2012 to November 2017 (Poulain et al., 2020: 10.23 µg m−3 and this study: 10.49 µg m−3, respectively) and presented the same seasonal trends for all the chemical species with a highest mass concentration in the winter and lowest mass concentration in the summer time (13.15 and 7.64 µg m−3, respectively; Table S2). Consequently, the results obtained from the current study can be considered as a representative ACSM study for the Melpitz station. Figure S3 presents the coming high polluted air masses for total PM1 to the measurement site in the current study; polluted eastern Europe flow with high mass concentration and southwest with lower mass concentration was more clearly found in wintertime rather than in other seasons, which will be comprehensively discussed in Sect. 3.4.
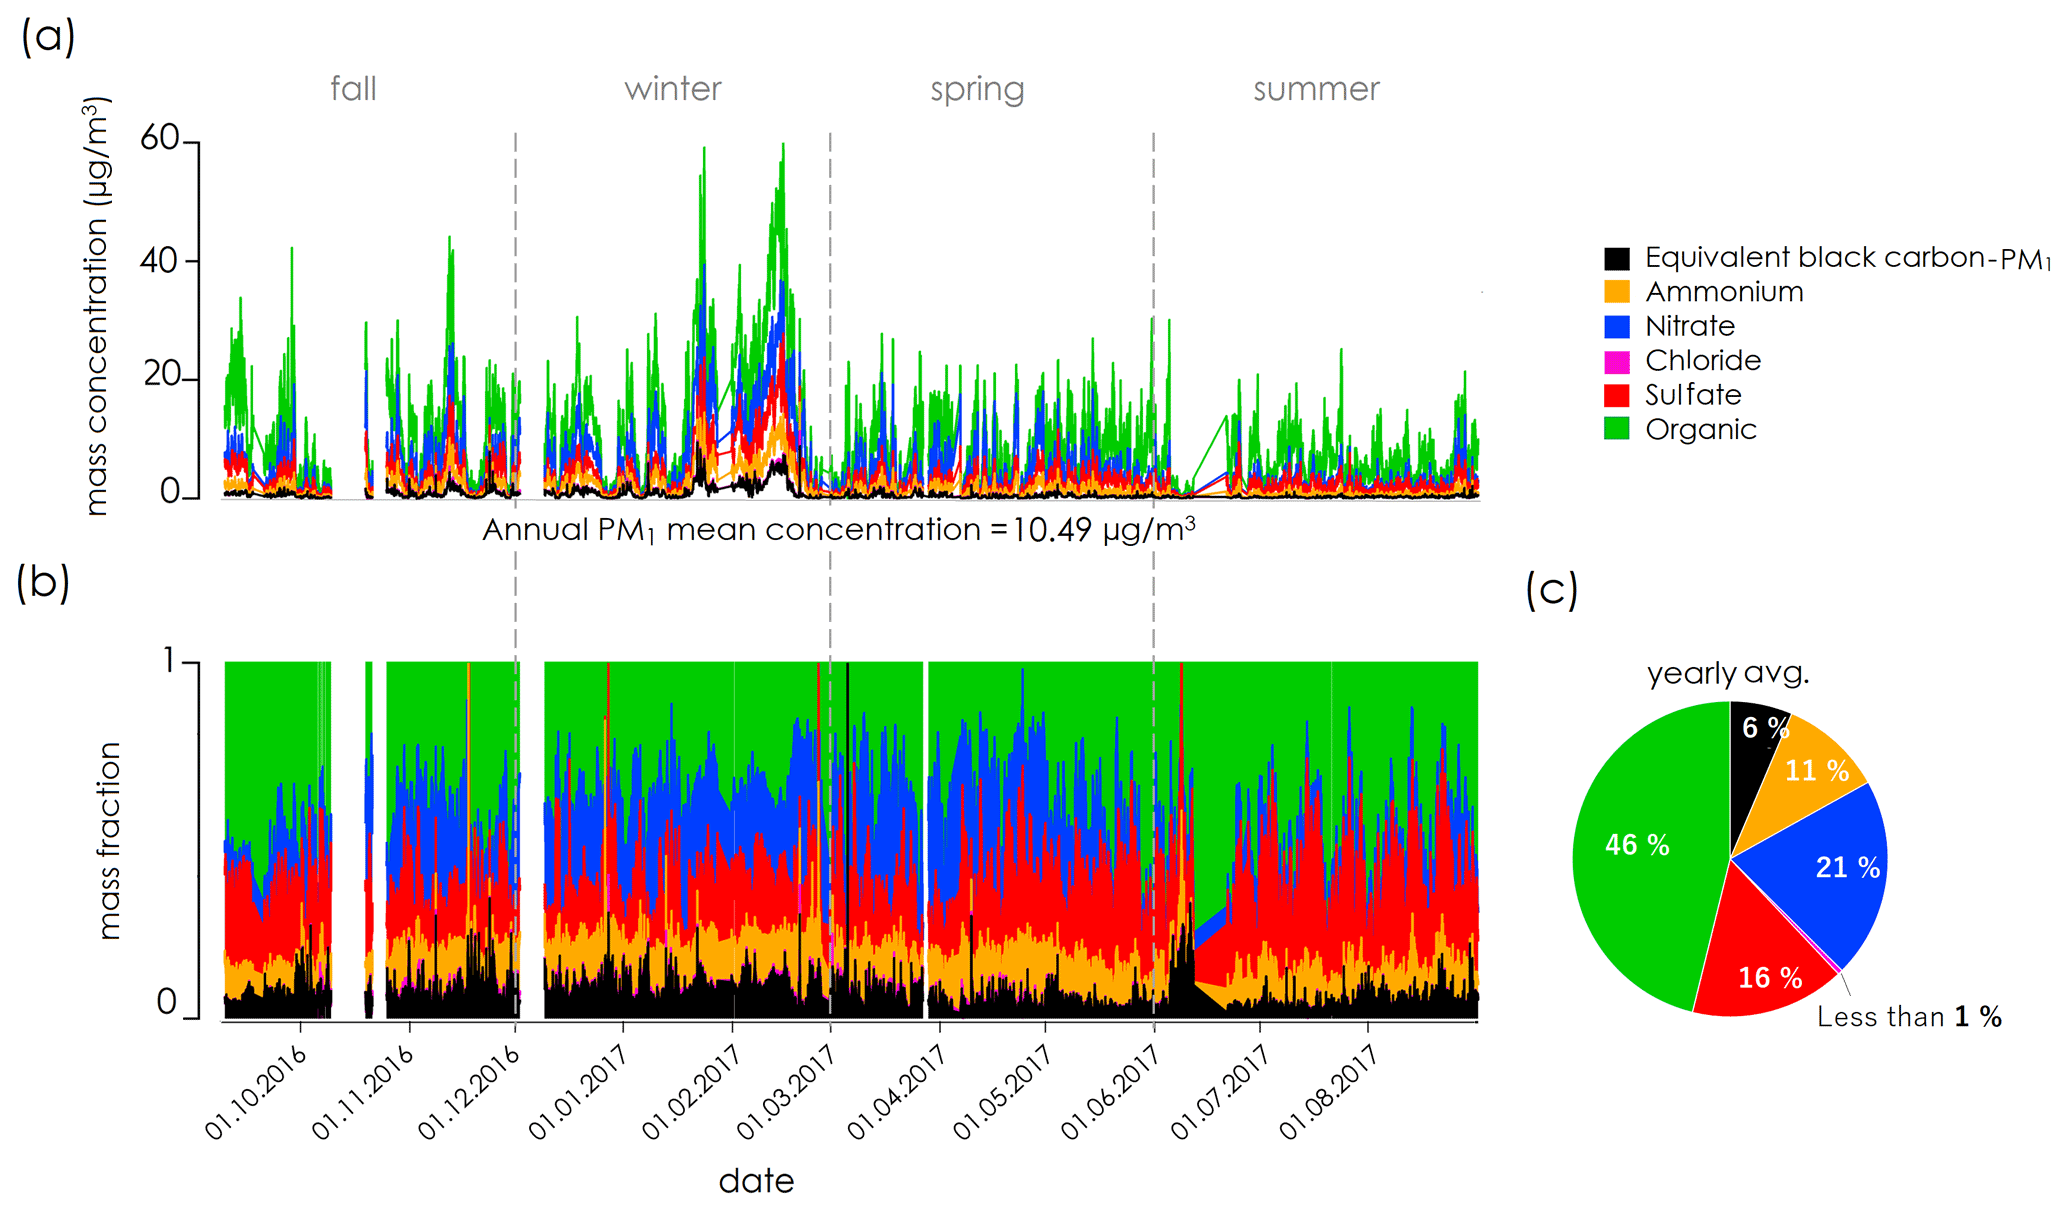
Figure 1Time series of (a) the particulate PM1 chemical composition, (b) the corresponding mass fraction, and (c) the average contribution of each chemical component (time is in UTC).
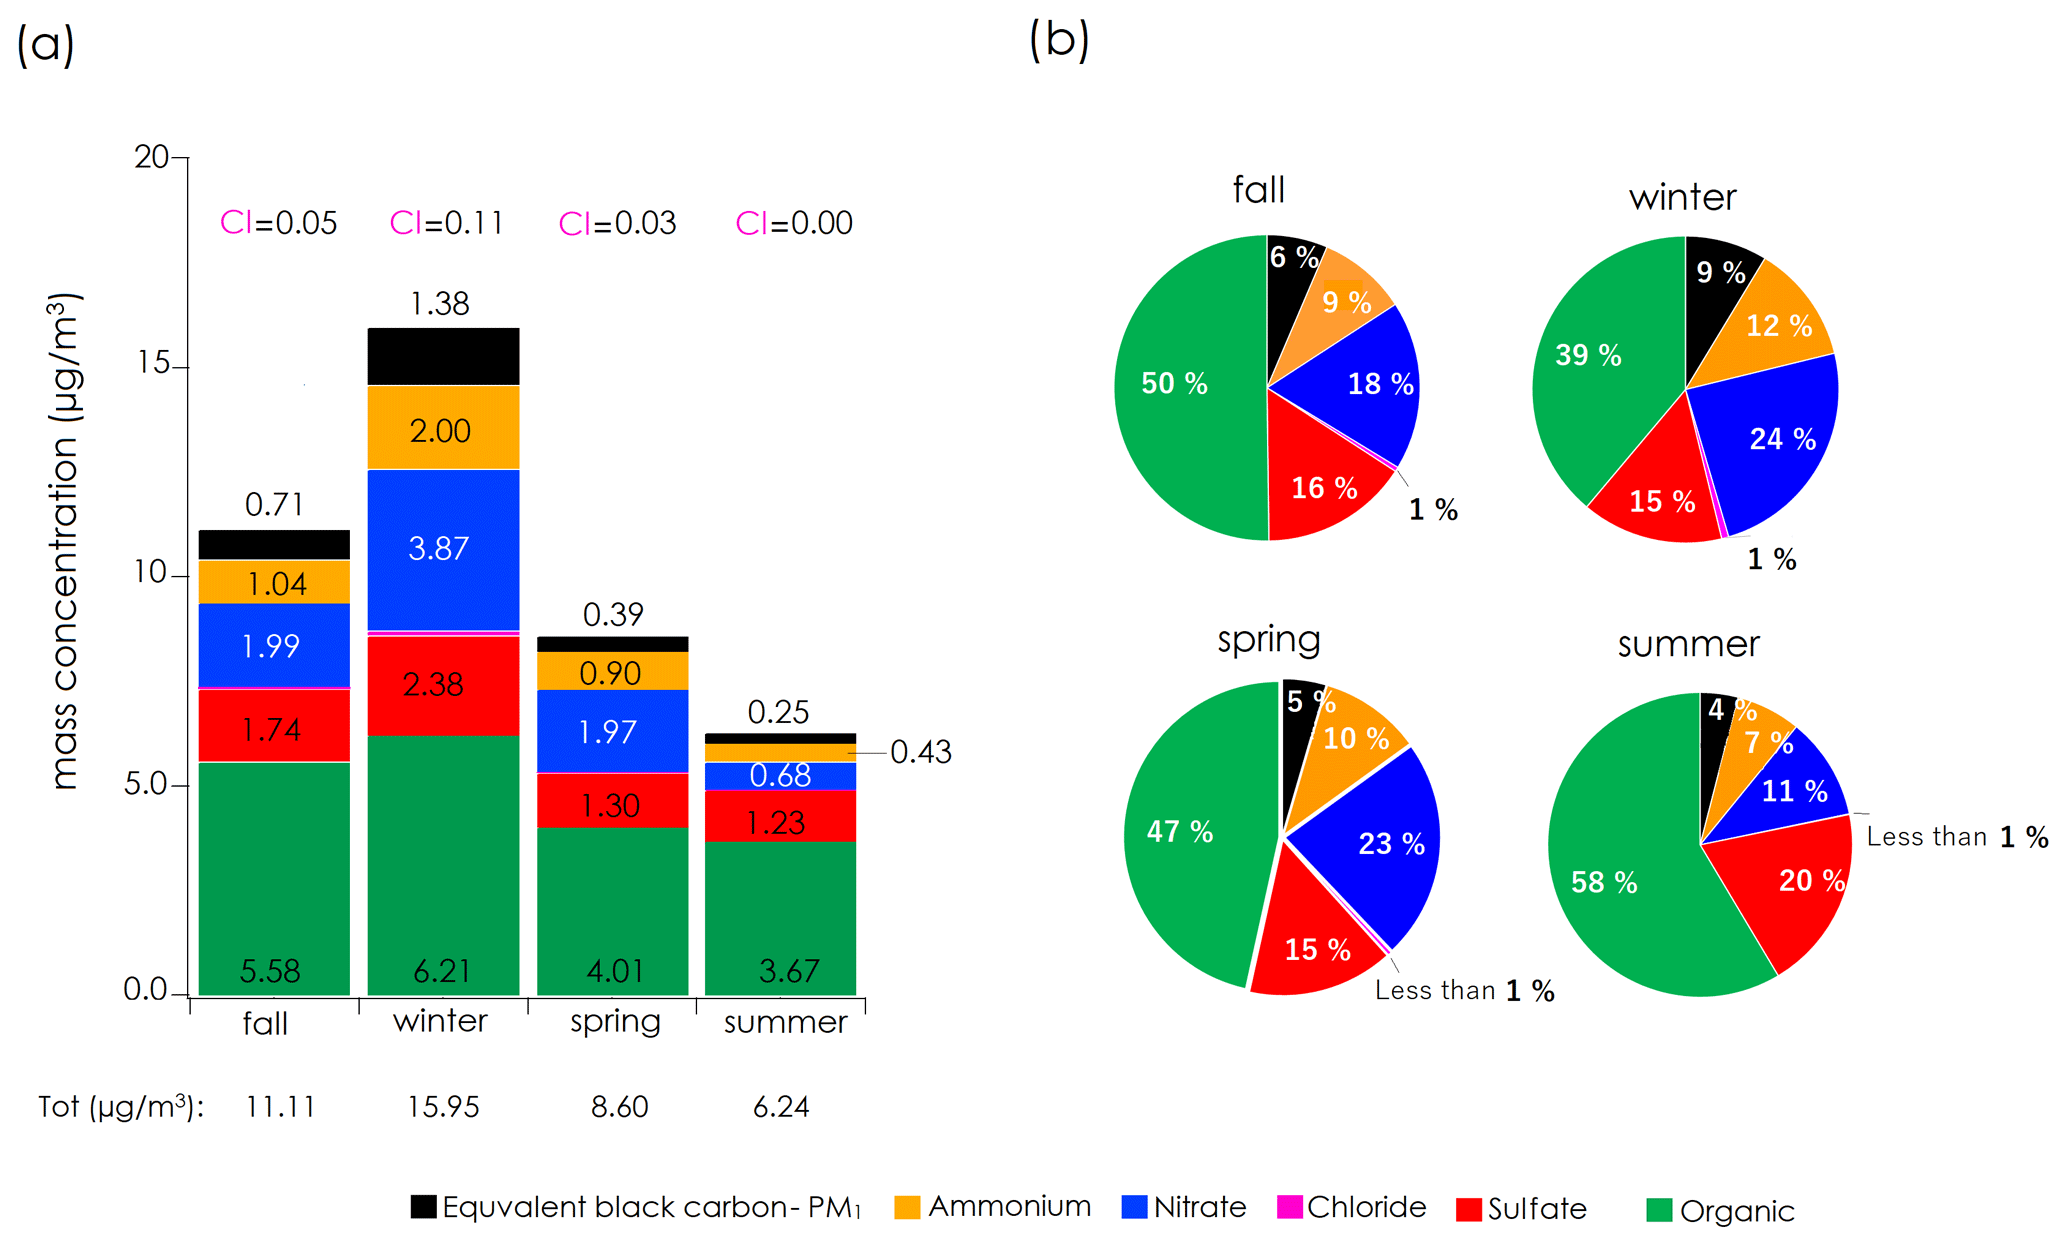
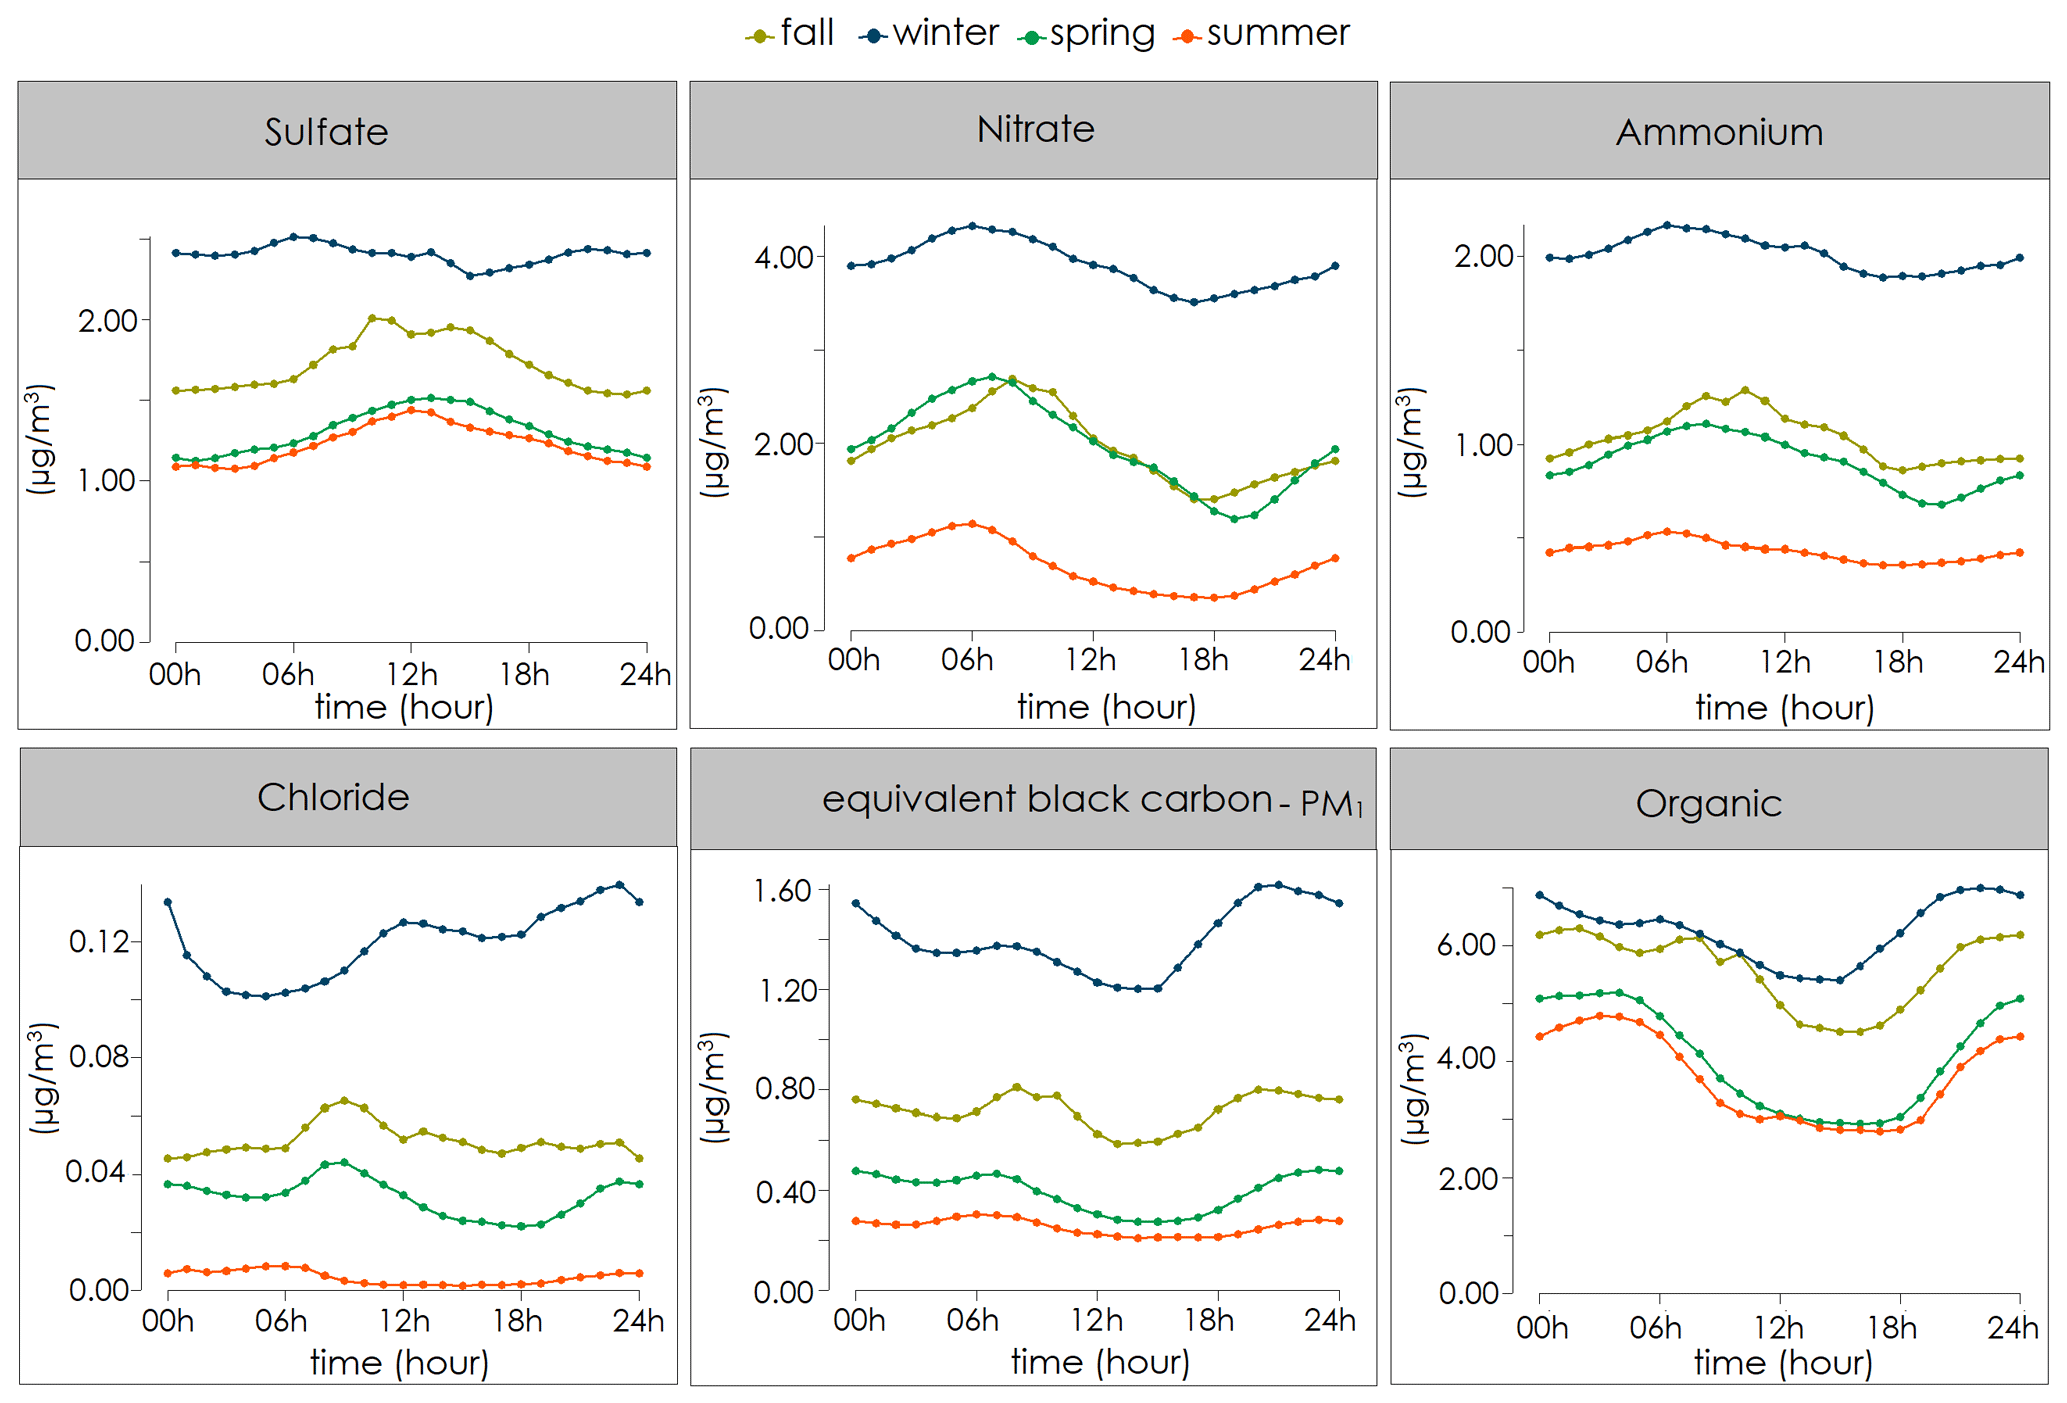
Figure 3Seasonal diurnal cycle of PM1 for ACSM organic and inorganic species (time is in UTC).
In comparison with other ACSM and AMS rural-background stations in Europe, which can be divided into three parts, northern Europe (NE), southern Europe (SE), and mid-latitude Europe (ME) (Bressi et al., 2021), the annual PM1 mean mass concentration measured at Melpitz is similar to the value obtained at other ME stations, such as Magadino at 10.1, Kosetice at 8.5 (Chen et al., 2022), and 9.1 µg m−3 on average of PM1 mean mass concentration of six stations (Ispra, Melpitz, Magadino, Cabauw, Sirta, and Hohenpeissenberg; Bressi et al., 2021).
3.1.1 Inorganic
The seasonality of the inorganic species can be associated with their variations in emissions and the changes in their chemical atmospheric processes. Throughout the year, the mass concentration and their respective contribution to the total PM1 mass of nitrate, ammonium, and chloride increased from a minimum value in summer (11 %, 7 %, and 0 %, respectively; Fig. 2b) and reached a maximum value in winter (24 %, 12 %, and 1 %, respectively; Fig. 2b). Moreover, the comparison between Bressi et al. (2021) and the current study (Fig. S4 from Bressi et al., 2021; Fig. 3 from the current study) for the Melpitz station with different time coverage shows that the daily variation of ACSM sulfate, nitrate, and ammonium are similar in both winter and summer seasons. In comparison with other ACSM and AMS rural-background stations in Europe (Fig. S4 from Bressi et al., 2021), the mean daily cycle of the PM1 chemical components (sulfate, nitrate, and ammonium) does not show a similar pattern to the other stations (Bressi et al., 2021) due to the different geographical location and meteorological conditions.
Sulfate showed a slightly different behavior. Although the contribution of sulfate to the total PM1 decreased slightly from summer (20 %) to winter (15 %), its mass concentration remained higher in winter compared to summer (2.38 and 1.23 µg m−3, respectively; Table 1). The increment is not as drastic as other inorganic species, since sulfate is least volatile; therefore, more fraction of sulfate stayed in the particle phase even in summer. Moreover, the sulfate contribution to the total PM1 was higher during the summer than the wintertime, since with enhanced irradiations in summer, sulfate formation from photochemistry could be enhanced as well. This higher contribution of sulfate in summer over winter is consistent with the mean PM1 mass concentration measured by the AMS for the three periods during fall (16 September to 3 November 2008), winter (24 February to 25 March 2009), and summer (23 May to 9 June 2009) campaigns reported by Poulain et al. (2011). In comparison with previous ACSM long-term measurements by Poulain et al. (2020) at the Melpitz station, a similar mean mass concentration of sulfate was observed in the period from June 2012 to November 2017 (Poulain et al., 2020: 1.54 µg m−3 and this study: 1.67 µg m−3, respectively; Table S2). This comparison indicates the current study as a case study of the ACSM for the Melpitz station within 5-year ACSM data, with the best data coverage of time in a year. The diurnal cycles of sulfate (Fig. 3) showed a different daily pattern in warm and cold seasons. In summer, sulfate mass concentration increased during the day and reached its maximum level at 12:00 UTC (Fig. 3) due to sulfur dioxide photochemical oxidation processes in the atmosphere, which also presented the highest mass concentration during the day, along with maximum temperature and sun radiation in summer time (Fig. S4). Furthermore, the NWR plots (Fig. S3) show that during the wintertime, sulfate mostly comes from the north and east sectors with wind speeds above 5 m s−1, which can be associated with dominant transported sulfate sources. Although the eastern wind sector remains visible for the sulfate in the summer time, the high concentrations of sulfate can be observed during periods with low wind speed and without a specific wind sector; this corresponds to local sulfate formation. Section 3.4 will go into detail about the long-range transported emissions later on. Although these locally formed emissions of sulfate (Figs. S3 and 9) can explain this peak during the day in summer, this photochemical process is not the only source of sulfate. It especially cannot explain the highest mass concentrations during the wintertime with almost no diurnal variation (Fig. 3). For winter, the emission of domestic heating processes, which could be enhanced in the atmospheric boundary layer (Stieger et al., 2018), along with the long-range transported emissions, which came from northeast toward the measurement site (Figs. S3 and 9), and also high ammonium nitrate due to partitioning according to temperature explain the high mass concentration but the low relative contribution of sulfate.
Nitrate is mostly found in the form of ammonium nitrate (NH4NO3), which is reliant on the gas-phase precursor concentrations, temperature, humidity, and aerosol chemical composition (Poulain et al., 2011; Stieger et al., 2018). Both nitrate and ammonium showed a minimum mass fraction and mass concentration in summer (11 % and 0.68 µg m−3 and 7 % and 0.43 µg m−3, respectively; Fig. 2), both showed an increasing trend toward the cold months, and both reached their maximum mass fraction and mass concentration in wintertime (nitrate 24 % and 3.87 µg m−3 and ammonium 12 % and 2 µg m−3, respectively; Fig. 2). The diurnal cycles of nitrate and ammonium (Fig. 3) showed a relatively similar daily pattern in all seasons, which means the highest values were reached in the morning, due to the beginning of vertical mixing and a reduction in the afternoon followed by an increase during the night, reflecting their nighttime production during every season. The volatile behavior of ammonium nitrate strongly affects its temporal variation during warm days leading to the formation of the gaseous nitric acid and ammonia compounds at higher temperatures and low humidity (Figs. S4 and S8). Nitrate profiles from NWR plots (Fig. S3) present two different wind directions for the whole period, which might be associated with transported nitrate from Leipzig and Torgau (50 km in the southwest and 7 km in the northeast of Melpitz, respectively) with higher wind speed. Since the reaction pathway of OH and NO2 can result in nitrate formation (Yang et al., 2022), this mechanism can be linked to traffic emissions in residential areas. These long-range transported sources together with locally formed emissions could describe higher mass concentrations for nitrate and ammonium due to, e.g., meteorological conditions and abundant precursors in wintertime. However, in winter, ammonium nitrate remains mainly in the particle phase (Seinfeld and Pandis, 2006), since it can totally be changed from gas to particle phase at lower temperature (Spindler et al., 2010). High values of nitrate and ammonium in spring time are linked to agronomical fertilization (Stieger et al., 2018). These seasonal contributions result for both nitrate and ammonium and are consistent with the previous AMS study (Poulain et al., 2011), with a minimum fraction to the total AMS-PM1 during summer (nitrate 5 % and ammonium 8 %; Table S1) and a maximum fraction during wintertime (nitrate 34 % and ammonium 17 %; Table S1). However, it is known that a fraction of the nitrate signal can be attributed to nitrogen containing organic species (Kiendler-Scharr et al., 2016), which can affect the overall nitrate mass concentration (Poulain et al., 2020).
Although chloride had the lowest annual mass concentration (0.05 µg m−3) compared to all other PM1 chemical components (Table 1), it showed the highest mass concentration and mass fraction in winter (0.11 µg m−3 and 1 %, respectively; Fig. 2; Table 1) compared to other seasons; as seen in the previous AMS study by Poulain et al. (2011) (2 %; Table S1). It could be related to the surrounding and transported emissions, where mass concentrations were high for air masses from northeasterly and southwesterly directions (Fig. S3). In a multiyear analysis of the hourly PM10 chloride mass concentration measurements using a MARGA, Stieger et al. (2018) attributed the chloride sources of Melpitz during winter to the resuspension of road salt used for the de-icing of streets, mainly coming from the cities of Torgau and Leipzig. These sites are also located in the wind directions along with being a coal and wood combustion emission region, which could explain the highest mass concentration of chloride during the winter. Furthermore, the existence of chloride might be due to low mass concentration marine influences consisting of sea-salt aerosols during all the seasons in the southwesterly direction (Fig. S3), which were previously studied by Stieger et al. (2018). However, it is known that the AMS technology cannot properly detect sea salt (Huang et al., 2018; Ovadnevaite et al., 2014) because the majority of chloride is in the refractory part, which cannot be flash vaporized at 600 ∘C. Consequently, the chloride detected by the ACSM is mostly related to combustion processes (wood and coal combustion as well as trash burning; Li et al., 2012).
3.1.2 eBC-PM1 and organics
The eBC-PM1 showed its maximum mass concentration and mass fraction to PM mass during wintertime at 1.38 µg m−3 and 9 %, respectively (Fig. 2), and only 0.25 µg m−3 and 4 %, respectively, during summer time (Fig. 2). This is consistent with the expected highest anthropogenic emissions from fossil fuel consumption (house heating and energy productions) in winter compared to summer (Spindler et al., 2010). Furthermore, considering measured eBC-PM1 in regard to wind speed and wind direction from NWR plots (Fig. S3), eBC-PM1 presented transported and local emissions. The highest mass concentrations for fall, winter, and spring seasons could be linked to northeasterly and southwesterly winds with higher wind speed (above 10 m s−1), while in summer time, it is mostly linked to the surrounding emissions regardless of wind direction with lower wind speed (Fig. S3). Significant changes in the diurnal profiles of eBC-PM1 for the different seasons can be found with the highest mass concentrations throughout the cold months compared to warm months owing to house heating (Fig. 3). It also showed morning and evening peaks during all seasons (Fig. 3). This is consistent with those observed for the nitrogen oxides (Fig. S4), which might be attributed to liquid fuel emissions and possibly the impact of the traffic rush hours on the main street, B 87, located approximately 1 or 1.5 km north of the station (Yuan et al., 2021). In the following chapter, diurnal patterns showed lower mass concentrations at noon and increased in the late afternoon to become nearly constant from 20:00 UTC until midnight (Fig. 3). This ambient particulate pollution resulting from very surrounding sources in the village was reported by van Pinxteren et al. (2020). Diurnal increments of eBC-PM1 were smaller in fall and spring compared to winter; the increment in summer is also correspondingly low due to the absence of house heating emissions, and the diurnal variation in the increment is determined by surrounding motor vehicle emissions in combination with the mixing layer height (van Pinxteren et al., 2020). Further discussions on the seasonal trend of the eBC-PM1 can be found in Sect. 3.3.
Organic aerosol (OA) was the predominant species throughout the whole year, with a mean mass concentration of 4.84 µg m−3 and a mass fraction of 46 % (Fig. 1c; Table 1). The OA mass fraction decreased from the maximum value in summer and attained a minimum mass fraction in winter (58 % and 39 %, respectively; Fig. 2b). Similar to the comparison of previous inorganic AMS measurements performed at Melpitz (Poulain et al., 2011), AMS-OA contribution to total PM1 showed maximum contribution during summer (59 %, Table S1), and minimum contribution during winter (23 %) as well. However, the mass concentration of OA increased from its lowest value in summer and reached its highest value in wintertime (3.67 and 6.21 µg m−3, respectively; Fig. 2, Table 1). Similar to eBC-PM1, by analyzing NWR plots, OA measured according to wind direction and wind speed showed the highest average mass concentrations for northeasterly and southwesterly winds in winter (Fig. S3). In fall, polluted air masses came from the northeasterly direction, and in spring and summer OA, surrounding emissions closer to Melpitz were identified (Fig. S3). The diurnal cycle of the organic aerosol had an identical pattern across all seasons (Fig. 3), showing the highest mass concentration in nighttime, a small peak in the early hours of the morning related to rush hours, and the lowest mass concentrations around the early afternoon. The peak observed around 12:00 UTC in summer time (Fig. 3) can be due to the local photochemical production that leads to the formation of secondary organic aerosol mass during the day, similar to the diurnal behavior of sulfate (previously discussed in Sect. 3.1.1). However, the reduction in total OA mass concentration throughout the day (Fig. 3), which was mostly observed during the warm seasons (spring and summer), could be clearly related to the dilution effect of increasing mixed layer height. During warm days, evaporation of semi-volatile organics from the particle phase cannot be completely excluded (Schaap et al., 2004; Keck and Wittmaack, 2005). In comparison between Bressi et al. (2021) and the current study for the Melpitz station, the daily variation of organic aerosol is similar in both winter and summer seasons, while there are differences between Melpitz with other rural-background stations due to the different geographical location and meteorological conditions (Bressi et al., 2021).
Overall, eBC-PM1 and OA can be composed of various sources with strong seasonal dependencies and they can be influenced by different responses to atmospheric dynamics depending on meteorological parameters, geographical locations, and chemical processes. Therefore, a comprehensive analysis of the OA and eBC-PM1 sources was performed using source apportionment techniques.
3.2 Source apportionment of OA
The chosen solution for the organic aerosol source apportionment contained five different factors based on their time series and mass spectra (Fig. 4). The source apportionment solution is based on a partly constrained rolling approach with three primary organic aerosol (POA) factors, namely HOA (on average 0.30 µg m−3 and 6 % of the total OA; Table 1 and Fig. 4), BBOA (on average 0.39 µg m−3 and 7.9 % of the total OA), and CCOA (on average 0.77 µg m−3 and 15.4 % of the total OA). In addition to these POA factors, two oxygenated organic aerosols (OOAs) were identified as LO-OOA (on average 1.62 µg m−3 and 32.4 % of the total OA) and MO-OOA (on average 1.92 µg m−3 and 38.4 % of the OA). The seasonal average mass concentrations and relative mass fractions of each OA factor to the total OA mass and their seasonal diurnal variation are presented in Figs. 5 and 6, respectively. They will be discussed separately in the following sections.
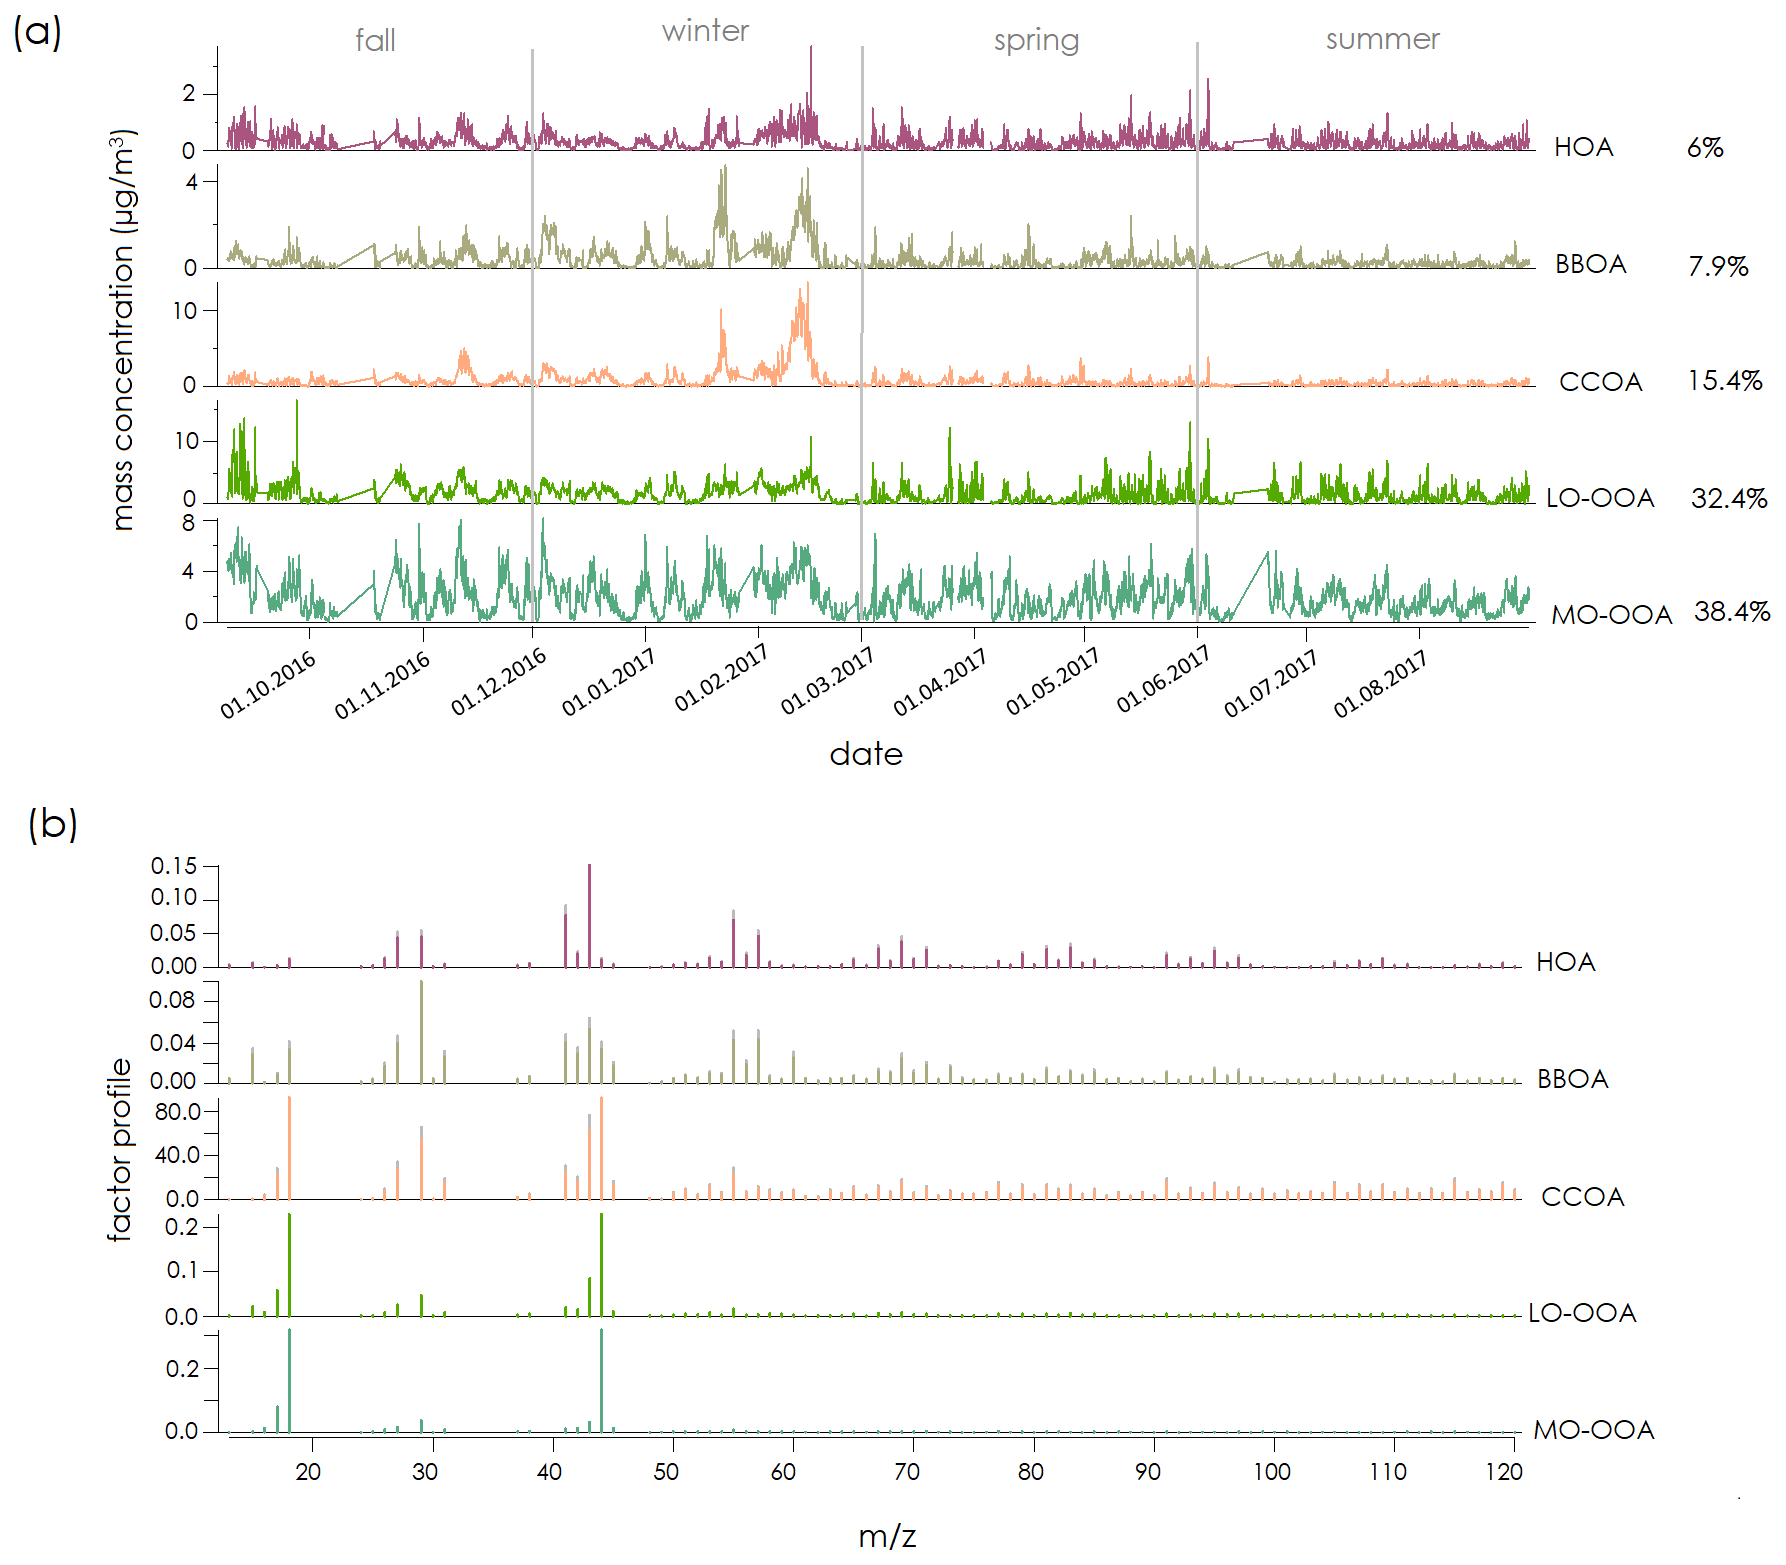
Figure 4Overview of averaged PMF (ME-2) results: (a) time series and (b) mass spectral profile of organic PMF factors (time is in UTC).
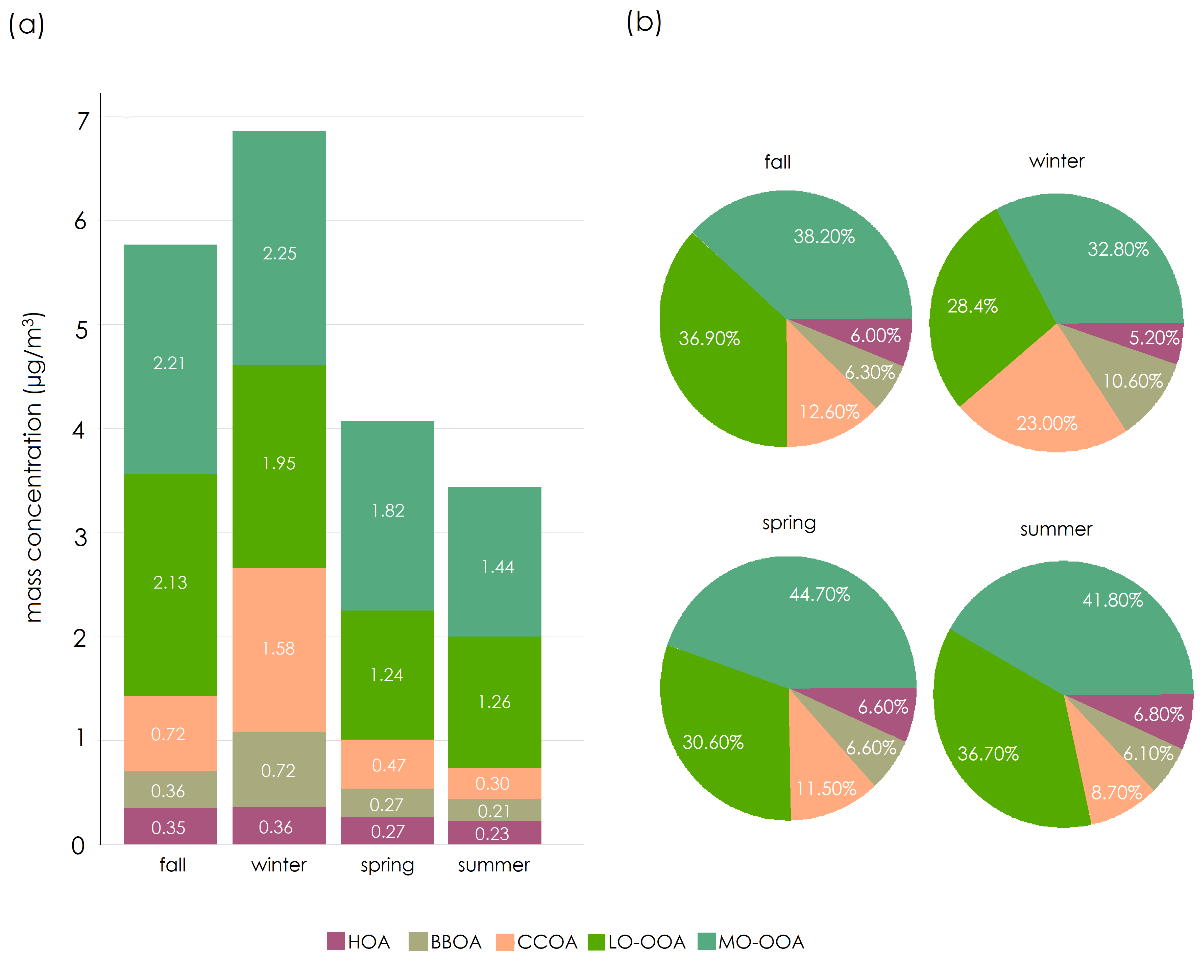
Figure 5Seasonal variation of (a) mass concentration and (b) mass fraction of PMF source factors.
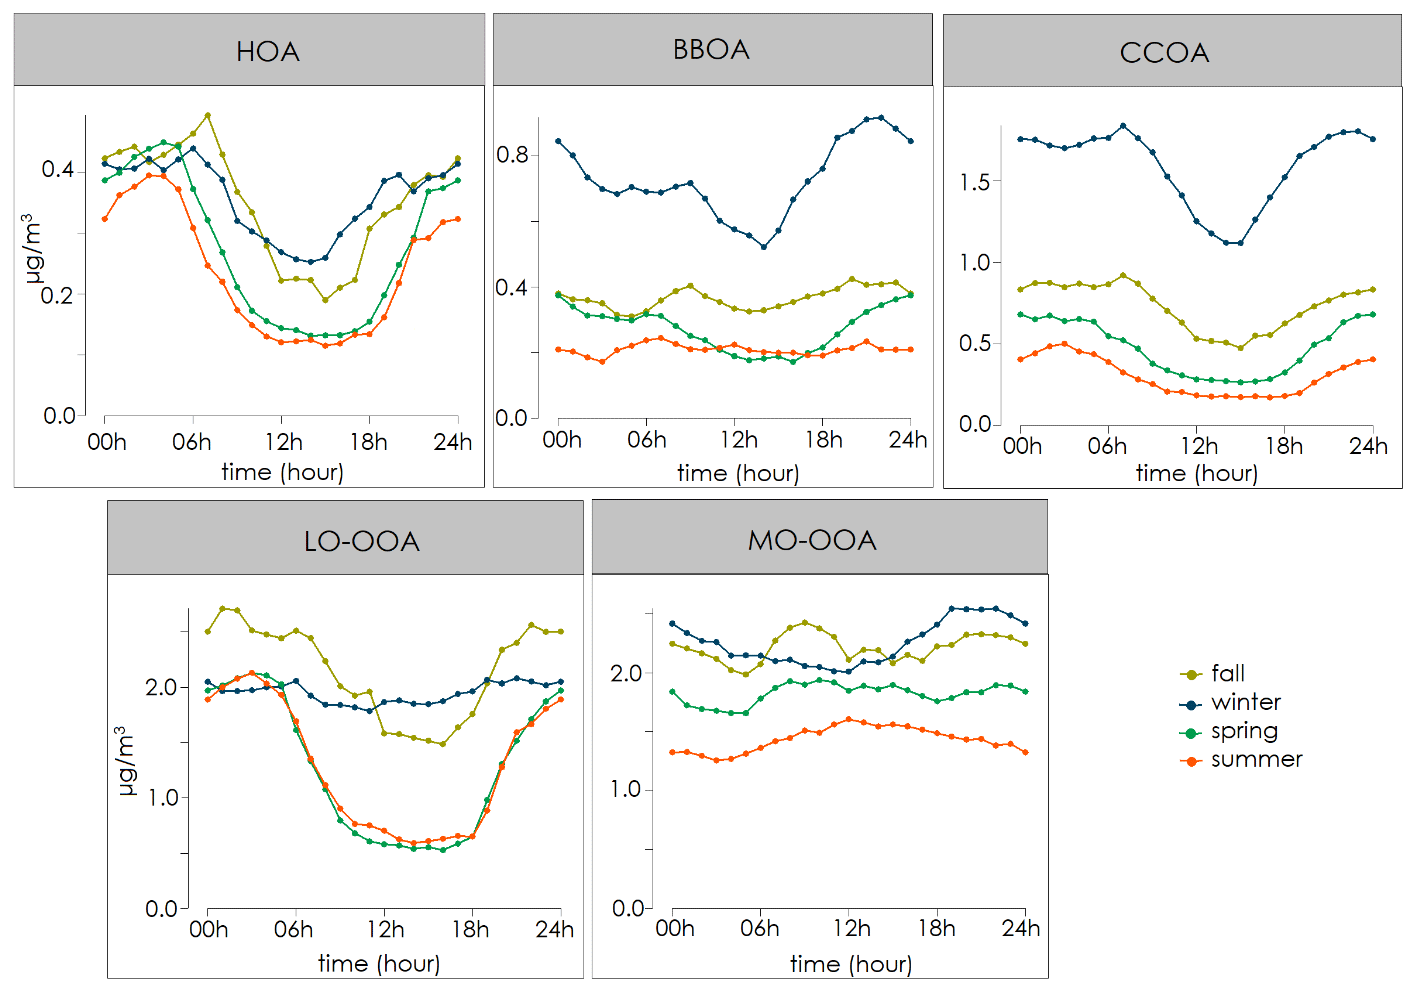
Figure 6Seasonal diurnal cycle (hourly averages) of the organic components HOA, BBOA, CCOA, LO-OOA, and MO-OOA in UTC time.
3.2.1 POA factors
The HOA mass spectrum (Fig. 4b) is recognized by mass fragments at unsaturated and saturated hydrocarbon chain pairs 41 (C3H5), 43 (C3H7), 55 (C4H7) and 57 (C4H9) (Zhang et al., 2005; Canagaratna et al., 2004), which are representative of liquid fuel combustion emissions and are associated with either traffic emissions or domestic heating fuel (Wang et al., 2020). This result designates HOA as a minimal source of OA at the monitoring site, which is consistent with previous studies in the PM1 range made in the same place. A total average was 7 % of the organic mass concentration in a study by Crippa et al. (2014), and total average was 3 % of PM size range between 0.05–1.2 µm mass concentration in a study by van Pinxteren et al. (2016) (Table S3). However, in comparison with other ACSM and AMS stations in Europe (22 stations; Chen et al., 2022), Kosetice with 9.7 % as a rural-background site and Bucharest with 13.7 % as an urban-background site showed the minimum annual HOA mean contribution of total OA, which is similar to the contribution at Melpitz.
Mass concentration of HOA followed a slightly increasing seasonal pattern towards the cold months, from 0.23 in summer to 0.36 µg m−3 in the winter (Fig. 5a; Table 1). HOA presented a low correlation with nitrogen oxides over the entire period (R2= 0.17; Table 1), but it correlated well with eBC-PM1 in winter (R2= 0.52; Table 1) and showed a weaker correlation in summer (R2= 0.24; Table 1). Possibly, HOA is also associated with household heating (35 % by oil and 11 % by liquid petroleum gas; van Pinxteren et al., 2020) rather than traffic emissions, especially during the cold months. Analyzing the NWR plots demonstrates that the highest HOA mass concentration was observed at low wind speed during the warm period (Fig. 7), indicating local emission sources, while during the cold period, a clear increase of the mass concentration can be associated with the highest wind speed (> 10 m s−1) mostly coming from the north to east sector. During periods with wind speeds below 10 m s−1, the two dominant wind sectors (NE and SW) can be observed. The NE wind sector might be associated with emission plumes coming from the surrounding traffic emissions (the federal street B 87) and the city of Torgau (with approx. 20 000 inhabitants, distance from 7 km). Another potential emission source can be linked to the use of liquid fuel for domestic house heating in the cold season as well as for hot water production all year-round (van Pinxteren et al., 2020). Although the SW sector shows a lower HOA mass concentration in comparison to the NE one, it corresponds to the direction of the city of Leipzig (above 600 000 inhabitants, approx. 50 km). Therefore, it might be associated with the influence of the pollution plume of the city of Leipzig.
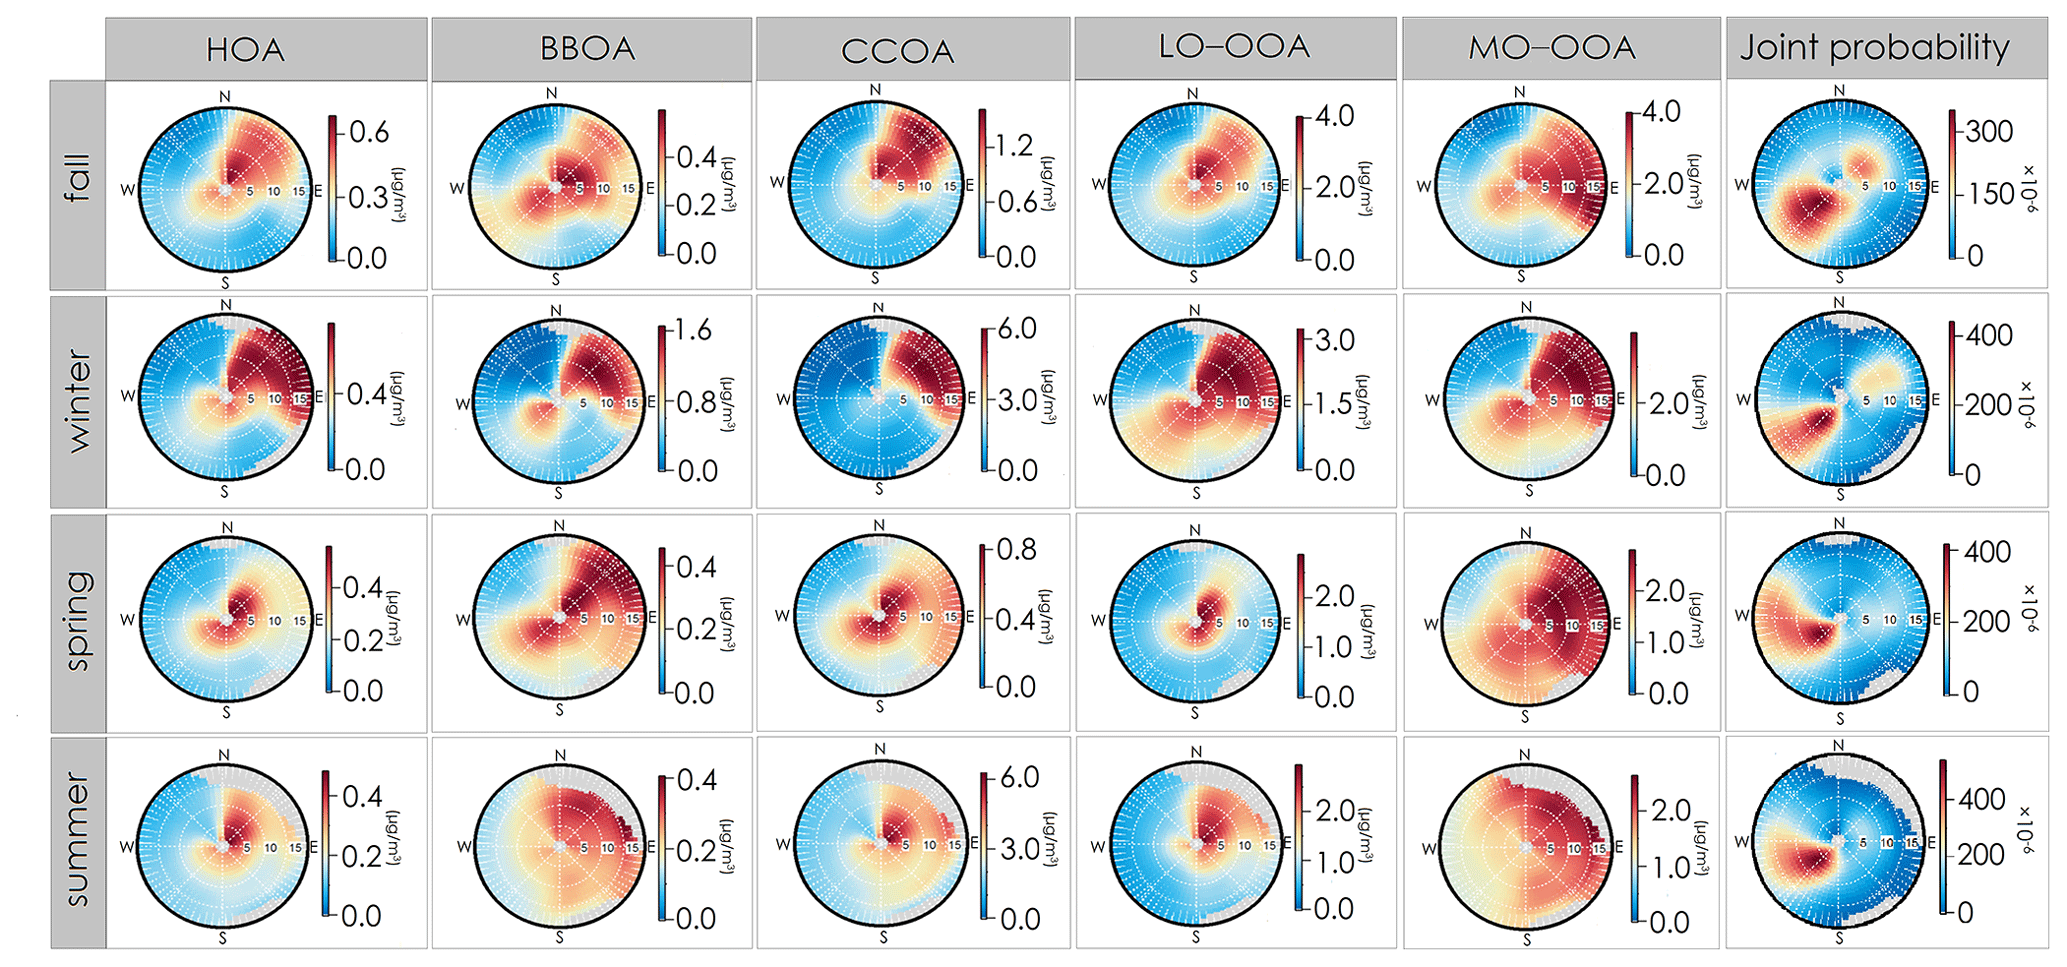
Figure 7Seasonal NWR plots for the different PMF factors (µg m−3).
The diurnal patterns of HOA reproduced two peaks in the morning and evening for all seasons (Fig. 6), which is related to traffic rush hours and linked to surrounding emissions from the main street (B 87, approx. 1.5 km north of the station), the Melpitz village itself, and emissions coming from Leipzig and Torgau residential areas. The small time shift for the start of the evening increase corresponds to the time shift of the sunrise between winter and summer. The diurnal cycles reached a systematic minimum during the daytime, probably not only owing to emission decrease but also emphasizing the effect of dynamic atmospheric processes (e.g., mixing layer height (MLH) and planetary boundary layer (PBL)) (Figs. 6 and S4). Oppositely to what can be seen during the daytime, nighttime mass concentrations appeared to be unaffected by the seasons, showing similar mass concentrations all year round; i.e., their mass concentration rose continuously in the early evening and remained at a very similar mass concentration over the night, which supports the hypothesis of yearlong continuous rather than surrounding emissions. Nevertheless, the differences between HOA mass concentration during the nighttime from summer to winter season (Fig. 6) are small and can be covered by the uncertainties of the PMF result (±32.5 %, Fig. S2). However, it can be explained by different emission sources, condensation of POA (Chen et al., 2022), evaporation, oxidation processes (Saha et al., 2018), and potential nighttime aging process by high ozone concentration (Kodros et al., 2020).
The mass spectra of BBOA are identified by ions at 29, 43, 60, and 73 (Fig. 4b), known as fragments tracers of anhydro-sugars like levoglucosan (Alfarra et al., 2007), which have been recognized as indicators of wood combustion processes (Simoneit et al., 1999; Simoneit and Elias, 2001). This is confirmed by the correlation between BBOA and levoglucosan over the whole period (R2= 0.54; Table 1). On average, BBOA mass concentration and contribution were 0.39 µg m−3 and 7.9 %, respectively (Table 1 and Fig. 4a). However, its contribution is highest during wintertime (10.6 %; Fig. 5), which is similar to previous studies in different PM ranges for the Melpitz station during the cold months: (a) in PM1 range, 14 % of OA mass concentration in fall (Crippa et al., 2014); (b) in 0.05–1.2 µm range, highest contribution with 10 % of PM mass concentration in winter (van Pinxteren et al., 2016); and (c) in PM10 range, highest contribution with 16 % of PM mass concentration in winter (van Pinxteren et al., 2020).
By analyzing the NWR model, the high mass concentration of BBOA in cold months, regardless of wind speed, can be observed with two wind sectors coming from northeast and southwest directions. These BBOA emissions are mainly attributed to residential heating in Melpitz village and also indicate the effect of transported biomass burning emissions to the sampling site with higher wind speed (> 10 m s−1, Fig. 7). While in summer time, it is still observable as surrounding emissions during periods of low wind speed (Figs. 7 and S4) with a mass concentration of 0.21 µg m−3 and a contribution of 6.1 % to total OA (Fig. 5). The presence of BBOA in the summer can be linked to water heating systems using wood briquettes and logs (estimated at 32 % of total central heating in this area; van Pinxteren et al., 2020). Moreover, it can also be related to recreational open fires or barbecue activities (van Pinxteren et al., 2020). This result is similar to other ACSM and AMS rural-background stations in Europe (22 stations; Chen et al., 2022); both Magadino and Kosetice showed the highest contribution of BBOA during wintertime (27.4 % and 15.5 %, respectively).
The diurnal cycles, peaking from early evening to early morning in winter (Fig. 6), match the expectations for a factor related to domestic heating activities, along with a better eBC-PM1 correlation during winter than during summer time (R2= 0.81 and R2= 0.42, respectively; Table 1). Finally, in opposition to HOA, the nighttime BBOA mass concentration showed a strong seasonal variation, having its highest mass concentration during winter nights and lowest during summer time, showing the influence of the impact of house heating emissions on the BBOA emissions. However, the daytime behavior reflects the influence of enhanced vertical mixing during daytime (higher temperature; Fig. S4) and combined with high wind speeds can readily cause dilution and thus low pollutant concentrations near the ground (Chen et al., 2021; Via et al., 2020; Paglione et al., 2020).
The mass spectrum of CCOA is characterized by fragments at 77, 91, and 115 (Fig. 4b) as previously reported by Dall'Osto et al. (2013), Xu et al. (2020), Tobler et al. (2021), and Chen et al. (2022). These specific fragments can be associated with unsaturated hydrocarbons, particularly ion peaks related to polycyclic aromatic hydrocarbon (PAH). The CCOA time series showed the strongest correlation with eBC-PM1 (R2= 0.82; Table 1). In addition, several studies reported that coal combustion emissions are often accompanied by high chloride mass concentrations (e.g., Iapalucci et al., 1969; Yudovich and Ketris, 2006; Tobler et al., 2021). Here, the correlation between CCOA and chloride was higher during winter than during summer time (R2= 0.41 and 0.15, respectively; Table 1), as the gas-particle-phase equilibrium dramatically changes with rising temperatures (Tobler et al., 2021). Although chloride is almost observable in the particle phase as ammonium chloride (NH4Cl) at lower temperatures, chloride is typically observable in the gas phase as hydrogen chloride (HCl) at higher temperatures (Tobler et al., 2021).
CCOA represented on average 15.4 % of the total OA (0.77 µg m−3) (Table 1; Fig. 4a) and is the most important POA over the entire period. No CCOA factor was identified in the previous AMS measurements made at Melpitz (Crippa et al., 2014). It is most likely this factor was not properly resolved or it was not possible to properly separate it from the other factors, since no reference mass spectra for CCOA were reported in the literature at that time. CCOA showed the highest mass concentration and mass fraction during the winter (1.58 µg m−3 and 23 %, respectively; Fig. 5; Table 1). By analyzing the NWR plots, this high mass concentration during wintertime can be related to the surrounding emissions and long-range transported air masses coming from two different directions, northeasterly and southwesterly (Fig. 7). Not surprisingly, the lowest mass concentration and contribution were observed during the summer time (0.30 µg m−3 and 8.7 %, respectively; Fig. 5a; Table 1,) which most probably correspond to only long-range transport as later discussed in Sect. 3.4 (Fig. 9). Moreover, this result is consistent with previous measurements made in the same place. For the size range 0.05–1.2 µm, van Pinxteren et al. (2016) reported a contribution of 29 % and 21 % of the PM in winter and summer, respectively, and a contribution of 7 % and 0 % for winter and summer, respectively, for the PM10 range was found (van Pinxteren et al., 2020). From all ACSM and AMS stations (22 stations; Chen et al., 2022), only Melpitz as a rural-background site and Krakow as an urban-background site showed the coal combustion emissions with the maximum contribution during winter for both sites (Krakow 18.2 % and Melpitz 23 %) compared to summer (Krakow 4.5 % and Melpitz 8.7 %). The drastic seasonal changes in Krakow are attributed to the common use of coal burning for residential heating reasons during the wintertime (Tobler et al., 2021), while in Melpitz, as discussed above, coal combustion is affected by both surrounding and transported emissions from other sites. Mass concentrations of CCOA during nighttime were much higher than during daytime throughout all seasons (Fig. 6), further verifying the increased coal combustion emissions from coal heat generation at night in wintertime and the potential decrease in emissions during the day due to a strong influence of atmospheric dynamics.
3.2.2 OOA factors
The two OOAs (Fig. 4) referred to as LO-OOA and MO-OOA are known to be characterized by the different ratios of their 43 and 44 fragments (Fig. 4b), which represent the oxidation level (Canagaratna et al., 2015). While 43 could be derived from C2H3O+ (a semi-volatile signature) and/or C3H7+ (the primary emissions hydrocarbon-like signature), 44 is mainly derived from the fragment of (a signature of, particularly, oxygenated acids) (Canonaco et al., 2015; Ng et al., 2010). As presented in Fig. 4b, MO-OOA mass spectra showed a notable peak at 44. This spectrum has been extensively recognized as low volatility OOA (LV-OOA) and described to be made-up of aged secondary OA (SOA) and highly oxidized OA (Ulbrich et al., 2009; Zhang et al., 2011; Ng et al., 2011), while the mass spectra of LO-OOA in this study presented a higher 43 (Fig. 4b) compared to MO-OOA, which is similar to the mass spectral pattern of the previously reported freshly formed semi-volatile OOA (SV-OOA) (Jimenez et al., 2009; Ng et al., 2010). To differentiate the variations of the OOAs factor, the f44 vs. f43 space was used, which is a typical diagnostic tool based on atmospheric aging (Ng et al., 2010).
The seasonal for OOAs measured points and the for modeled factor profiles (LO-OOA and MO-OOA) are presented in Fig. S5. The data points in Fig. S5 are distributed differently according to the season (Chen et al., 2021; Canonaco et al., 2015; Crippa et al., 2014; Chazeau et al., 2022). Furthermore, the modeled factor profile points represent a high variability in space, especially for LO-OOA. This assumes how an annual or seasonal PMF solution, unless a larger number of factors are used, would perform poorly in capturing all of the variations of SOA. In order to capture time-dependent changes, in particular for LO-OOA, it is therefore advantageous to perform rolling PMF analysis. The triangle plot defined by Ng et al. (2010) is also shown in Fig. S5. As assumed, the LO-OOA points were concentrated in the lower part of the space, whereas more aged MO-OOA points relocated to the upper part of the space during the aging process. The fall, spring, and summer data points were all located on the right side of the triangle (Fig. S5); however, the winter data points were located near the top and inside the triangle. The data points on the right side of the triangle correspond to the time exposed to higher temperatures more than those that are within the triangle. This could be attributed to an increase in biogenic SOA emissions if the temperature increased, as biogenic OOA appears to be dispersed all along the right side of the triangle. Furthermore, as the temperature is reduced, the increased biomass emissions cause the OOA points to lie vertically inside the triangle, as seen in the winter data.
The two OOAs were the two most significant contributors to the total OA fraction (Fig. 4) over the entire period. The seasonal mean mass concentrations of MO-OOA varied from higher mass concentrations during winter (2.25 µg m−3) and lower during summer time (1.44 µg m−3; Table 1). However, the highest MO-OOA mass concentrations found during the cold periods are similar to the seasonal patterns in POA. This high mass concentration in cold seasons can be seen from the NWR plot (Fig. 7) presenting local emissions with low wind speed (> 5 m s−1) and transported emissions from east, northeast, and southwest directions with high wind speed (< 5 m s−1). Furthermore, high mass concentrations of MO-OOA are generally found at high relative humidity (RH > 80 %) and low temperature (< 0 ∘C), i.e., conditions during wintertime (Fig. S6). This low air temperature condition can be linked to a possible scenario for an increase in the MO-OOA precursor emissions from biomass burning and coal combustion as a result of residential heating activities during wintertime. Therefore, significant enhancement appears to be an effect of RH during winter, proposing that the aqueous-phase heterogeneous mechanisms could also play a crucial role in the regional MO-OOA formation through winter as suggested by Gilardoni et al. (2016). In contrast, no RH-temperature-dependent trends for the MO-OOA were found in the other seasons (Fig. S6), indicating more complex formation processes during other seasons. Meanwhile, MO-OOA diurnal cycles presented a seasonal variation as well, with a remarkable enhancement in the evening and nighttime during winter (Fig. 6), indicating a potential regional formation mechanism containing nighttime chemistry (Tiitta et al., 2016), and descending pattern from nighttime to daytime due to planetary boundary layer effect, while in fall, spring, and summer, MO-OOA displayed a considerable increase during the day (Fig. 6), indicating that higher temperatures result in considerable regional photochemical production of SOA particles (Fig. S4) and enhanced solar radiation (Petit et al., 2015). Furthermore, regarding the correlation of mass concentration of MO-OOA with sulfate, the latter is regarded as a local secondary production indicator (Petit et al., 2015, and Table 1). Consequently, alongside almost stable mass spectra throughout the year, MO-OOA seems to be derived from a variety of seasonal-dependent formation mechanisms and sources (such as aged background, biomass burning, coal combustion, and biogenic sources).
The seasonal mean mass concentrations of LO-OOA varied from higher mass concentrations during fall (2.13 µg m−3) and lower mass concentrations during spring time (1.24 µg m−3, Table 1). Temperature had a significant effect on LO-OOA and showed a distinguishable seasonal variation pattern. The temperature RH dependence of the LO-OOA was not quite similar depending on the season (Fig. S6). The highest wintertime LO-OOA mass concentrations were found mostly at low temperatures and high RH environments, indicating that gas–particle partitioning might have a key role in LO-OOA formation throughout this season. The freshly formed SOA deriving from primary biomass burning and coal combustion emissions, as found in previous studies (Crippa et al., 2013; Zhang et al., 2015; Sun et al., 2018; Stavroulas et al., 2019), can also affect the LO-OOA during the cold months. Furthermore, since nitrate could be originated locally or arrived from a long distance to Melpitz (Sect. 3.1.1), with a good correlation between LO-OOA and nitrate (R2= 0.59) during winter, the long-range transported LO-OOA from different directions reaching the measuring site could be explained (Fig. 7). Different LO-OOA daily cycles were also found in different seasons (Fig. 6). The daily changes in LO-OOA displayed higher mass concentrations in nighttime compared to daytime in fall, spring, and summer (Fig. 6), highlighting the significant roles of nighttime chemistry and gas–particle partitioning in the LO-OOA formation, while the decrease during the day is partly linked to the atmospheric dilution effect (Fig. S4), evaporation and photochemical aging into MO-OOA (Fig. 6). For winter night increments, lower temperature in favor of condensation and more abundant precursors are present considering increased BBOA emission; therefore enhanced night chemistry activities leads to higher LO-OOA. Moreover, shallow boundary layer in winter and nighttime inversion caused pollutants to accumulate.
3.3 Source apportionment of eBC-PM1
By applying a multilinear regression model during the source apportionment analysis, eBC-PM1 correlated with every one of the three identified primary organic factors (HOA, BBOA, and CCOA; Table 1). CCOA appeared to be the largest source of eBC-PM1, contributing half of it (eBC-PM1-CCOA at 55 %; Table 1), followed by eBC-PM1 associated with BBOA at 37 % (eBC-PM1-BBOA), while the lowest contribution was found for eBC-PM1-HOA (8 %). However, the contribution of sources to the total eBC-PM1 strongly depends on the season. Looking at each individual source, the hydrocarbon-like emissions contributed most to the eBC-PM1 fraction in the fall (eBC-PM1-HOA with 22 %, Table 1; Fig. 8b), while biomass burning emissions dominated the eBC-PM1 in summer, and coal combustion emission dominated in winter (eBC-PM1-BBOA and eBC-PM1-CCOA with 69 % and 56 %; Table 1). In the diurnal cycle, contribution to the total eBC-PM1 of eBC-PM1-HOA showed two peaks in the morning and evening for fall, spring, and summer (Fig. S7), reflecting the impact of the traffic rush hours as mentioned in Sect. 3.2.1 and the minimum contributions during the daytime due to the effect of lowest emissions and PBL effect (Fig. S4). However, wintertime did not show a strong variation in the diurnal cycle (Fig. S7). This indicates the potential influence of continuous emissions at the measurement site. Biomass burning combustion with its maximum contribution during the day in summer (Fig. S7) can be related to a variety of different eBC-PM1-POA mass concentrations (Fig. S7b); while the BBOA mass concentration was almost constant, the other POA mass concentration decreased during the day. Coal combustion showed an increasing contribution during nighttime in all the seasons (Fig. S7), especially during the wintertime, which further confirms the enhanced coal combustion emission in winter nights (Fig. S7b).
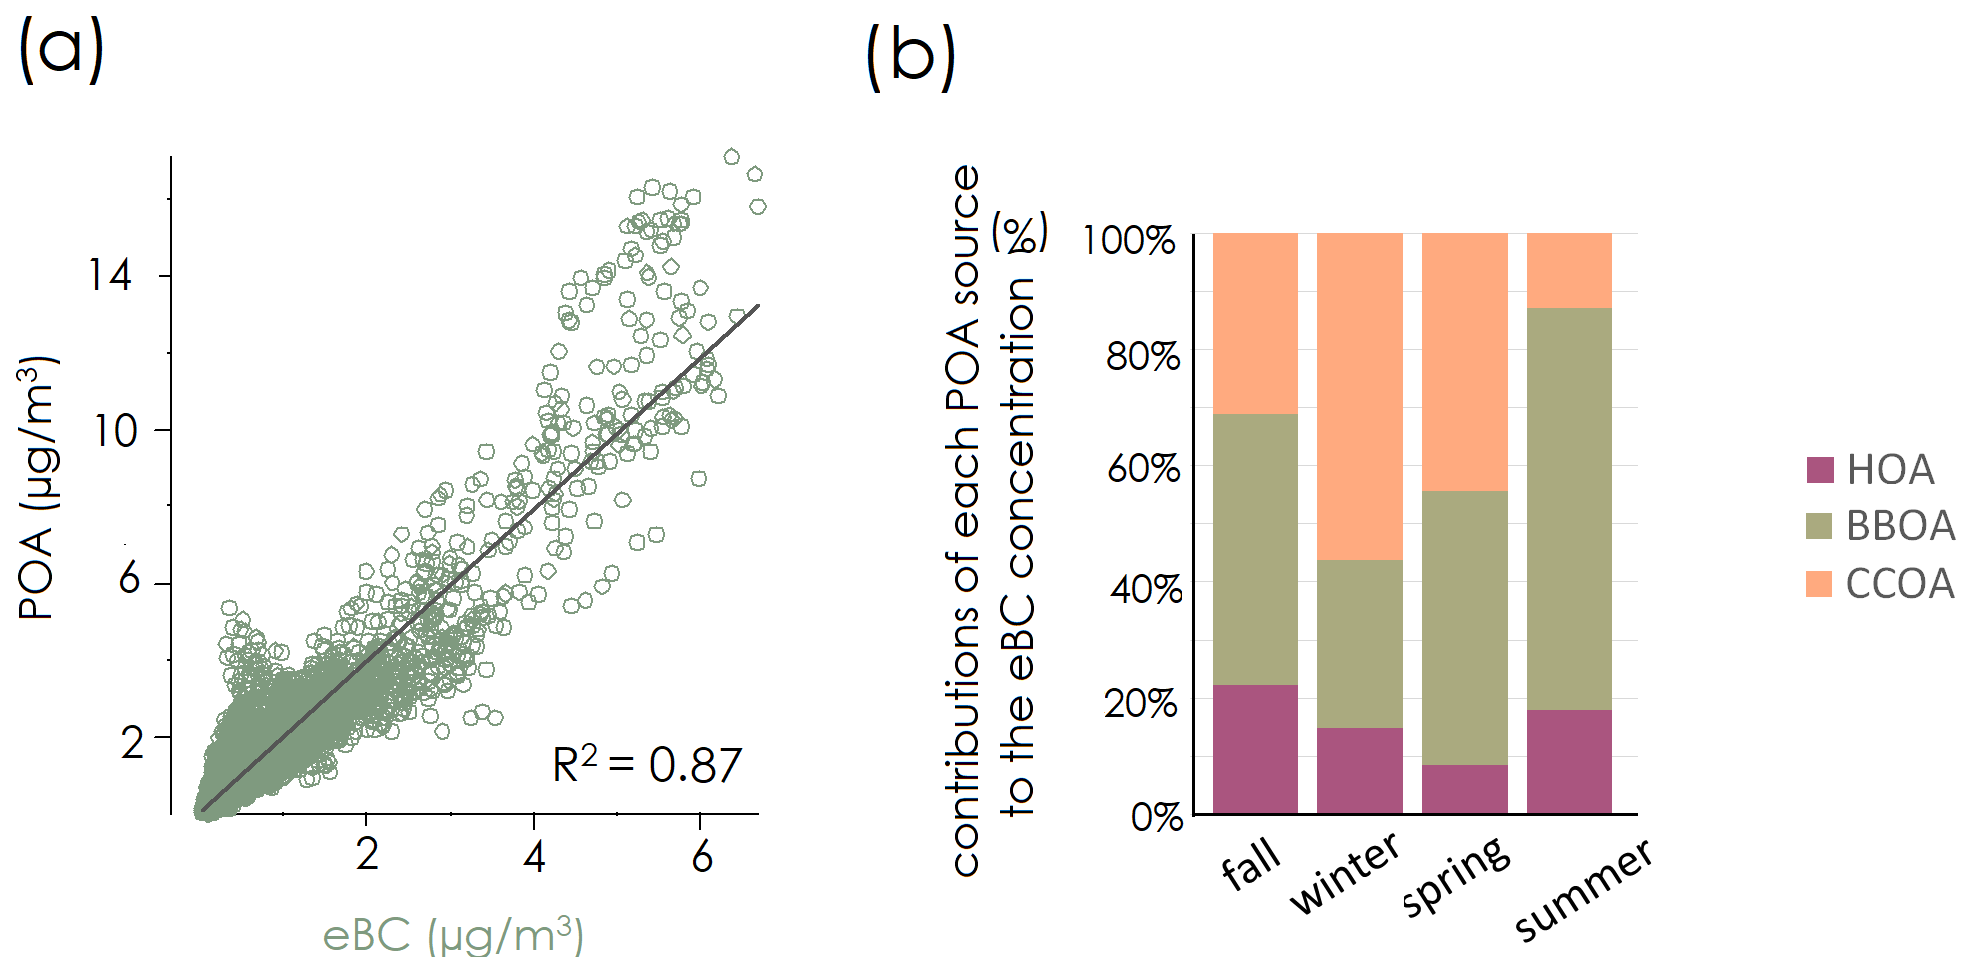
Figure 8Contribution of the three POA factors to the mass concentration of eBC-PM1. (a) Scatter plot of POA vs. eBC-PM1 and (b) contributions of sources to the eBC-PM1 mass concentration.
3.4 Seasonal air mass clustering
As mentioned before, the geographical origin of the PM1 chemical species and also PMF components are not only emitted from the surrounding area but also transported to it. Therefore, to better identify the origin of their sources, trajectory analysis and their clustering analysis were applied using the self-developed back-trajectory cluster method (BCLM) (Sun et al., 2020; Ma et al., 2014; Hussein et al., 2006). Regarding this cluster approach, six air masses were identified at the Melpitz station for the winter season, four air masses for the transition seasons, and five air masses for the summer season (Fig. 9a). The number of clusters with their corresponding mean mass concentration of PM1 chemical species and PMF factors of organics are summarized in Table 2 and with more details in Tables S5 and S6.
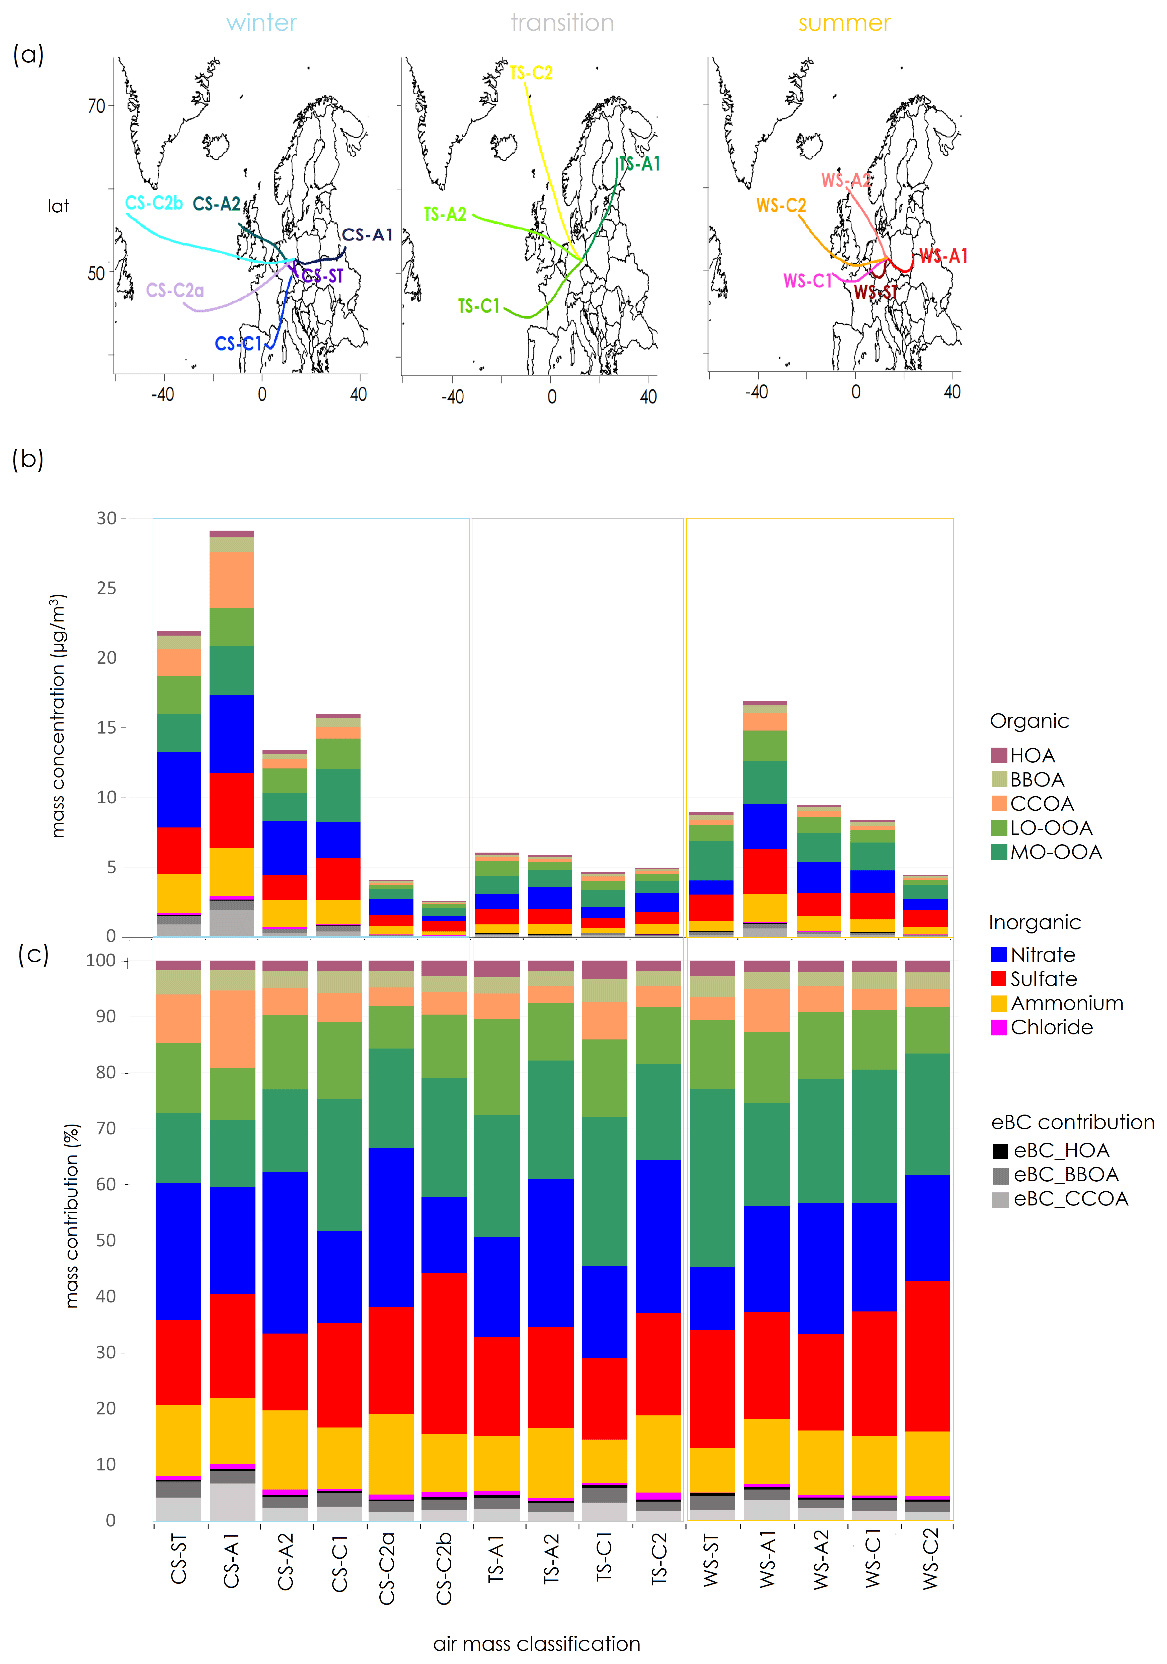
Figure 9(a) Air mass classification based on 1-year backward trajectories cluster analysis at 12:00 UTC, (b) the influence of air mass to the PM1 data and PMF factors, and (c) the contribution of those that averaged from 10:00 to 14:00 UTC.
Table 2Main statistical details of the 15 air mass types for total PM1 (CS, cold season; WS, warm season; ST, stagnant; A, anticyclonic; C, cyclonic).
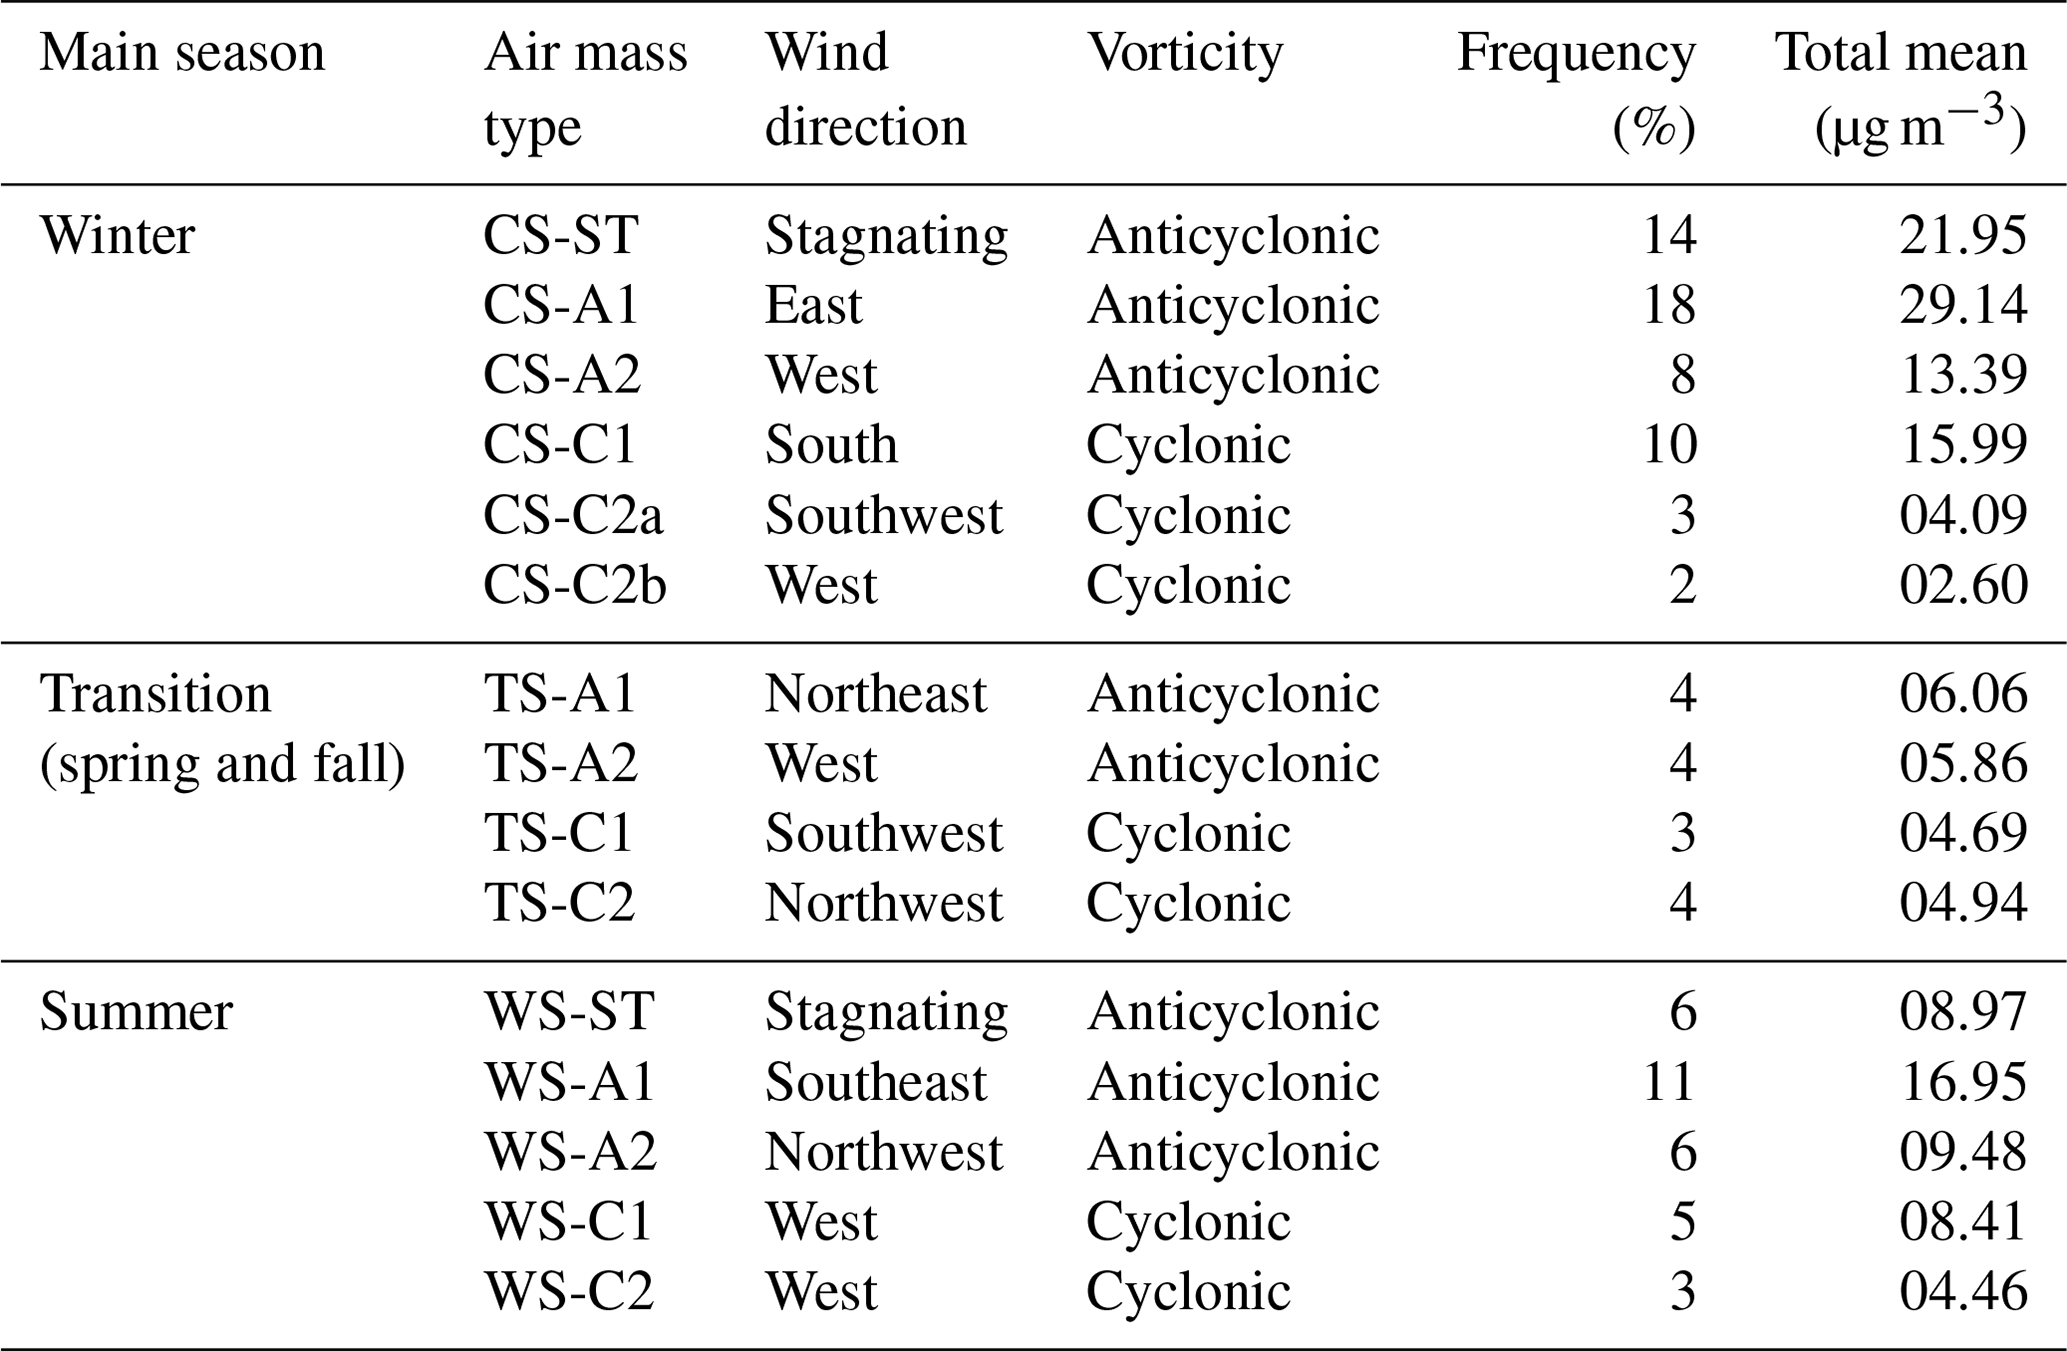
3.4.1 Winter
Figure 9b and c illustrate the mass concentration and contribution of PM1 chemical species and PMF factors of organic for each air mass type at Melpitz based on the type of air masses. For the winter season, the cluster CS-ST corresponds to more surrounding emission origin with a PM mean value of 21.95 µg m−3, which occurred during 14 % of the total measurement period. These surrounding emissions refer to the emissions from the Melpitz station directly, Melpitz village, and short-distance transported particles like particles from Leipzig and Torgau. This cluster presented the highest mass concentration of LO-OOA to the PM mass (2.73 µg m−3). In fact, SOA is considered to be formed by biomass burning as well as coal combustion, particularly during the winter when biogenic emissions and UV radiation are low (Lanz et al., 2010; Kodros et al., 2020). In this condition and in the presence of NO2 and O3, the biomass burning emissions could age rapidly and produce SOA. In conclusion, this cluster could confirm the role of freshly formed SOA which originated from the primary biomass burning and coal combustion emission (mass concentrations of 0.97 and 1.89 µg m−3, respectively). Furthermore, nitrate showed a high mass concentration and contribution in this air mass (5.38 µg m−3 and 25 %, respectively) due to, e.g., meteorological conditions and abundant precursors.
The cluster CS-A1 with the highest mass concentration of PM (29.14 µg m−3) represented eastern European continental air masses (passing Poland and the Czech Republic) during anticyclonic flow which occurred during 18 % of the total measurement period, meaning that Melpitz was under their influence during winter. This air mass, with the highest POA mass concentration (5.56 µg m−3), especially coal combustion emissions (CCOA and eBC-PM1-CCOA with an average mass concentration of 4.01 and 1.93 µg m−3, respectively), highlight the importance of long-range transported emissions. This cluster also contained the highest mass concentration of sulfate (5.39 µg m−3) and could support the importance of coal combustion on sulfate formation, which is known to be strongly emitted by coal power plants (Wierońska-Wiśniewska et al., 2022).
The air mass CS-A2 identified as marine-influenced air mass with a mean value of 13.39 µg m−3 of PM came from the United Kingdom with the anticyclonic flow, which occurred during 8 % of the total measurement period. This cluster presented a low mass concentration of POA, and for two OOAs, it presented almost the same mass concentration and contribution (Tables S5 and S6). Since Melpitz is placed away from the coast, the sampling location is affected by aged maritime air masses (Poulain et al., 2011). Inorganics are dominated by nitrate in this cluster with the high mass concentration (3.86 µg m−3), which represents the highest mass fraction (50 % of the total inorganic species).
The CS-C1 air mass with a mean value of 15.99 µg m−3 characteristic of southern European air mass came from an industrial and polluted area starting from Spain and partly crossing Italy with the cyclonic flow, which occurred during 10 % of the total measurement period. POA mass concentration and contribution were low in this cluster, while SOA, especially MO-OOA, showed the highest mass concentration of PM over the entire period (3.77 µg m−3) and the highest contribution during the winter season (24 %). This can be linked to the high sulfate in this air mass (2.99 µg m−3), which showed that the regional influence by contribution from aged BBOA and CCOA might be manifested in MO-OOA (as discussed in Sect. 3.2.2).
Finally, CS-C2a and CS-C2b were both associated with cyclonic and marine influence conditions which only occurred for a short time (3 % and 2 % of the total measurements, respectively), showing the lowest PM mean value (4.09 and 2.60 µg m−3, respectively). Both of them showed almost the same mass concentration and contribution of POA (Fig. 9b and c and Tables S5 and S6). However, similar to CS-A2, cluster CS-C2a contained a marine component at the beginning point of the air masses, and in the following time it was dominated by continental areas (France and southern Germany), where, due to the longer time transferring over continent and aging process, it showed more nitrate mass concentration and contribution than CS-C2b (1.16 and 0.35 µg m−3 and 28 % and 14 %, respectively). Whereas CS-C2b started near Iceland with the same history of the air mass over the continent, and in comparison, with CS-C2a, it presented a higher contribution of sulfate (29 % and 19 %, respectively), which could be associated with aged marine air mass due to the higher contribution of MO-OOA (21 % and 18 %, respectively).
3.4.2 Transition seasons
For transition seasons (fall and spring), whereas the four clusters showed quite similar PM mass concentrations (Fig. 9) which might be linked to the overall weather situation during these two times of the year, their chemical composition strongly depended on their origins. TS-A1 and TS-A2 corresponded to two different types of anticyclonic air masses with respective mean PM mass concentrations of 6.06 and 5.86 µg m−3. Cluster TS-A1, which occurred during 4 % of the total measurement period, started from Finland and crossed the Estonian, Latvian, Lithuanian, and Polish coasts before arriving at Melpitz. Although it might contain a certain marine component, this cluster mostly followed coastal areas, which means that in this cluster OA mass concentration dominated PM (2.95 µg m−3). Furthermore, this cluster showed continental and polluted aspects with the highest LO-OOA mass concentration and contribution during transition seasons (1.03 µg m−3 and 17 %, respectively), which is linked to originating from freshly formed SOA from primary biomass burning and coal combustion emissions around coastal areas. On the other hand, cluster TS-A2 (4 % of the measurement period) is characterized as a marine cluster and started from the south of Iceland and Greenland. This cluster showed inorganics as the dominant components in PM with a high mass concentration and a mass fraction (3.35 µg m−3 and 58 %, respectively). Since Melpitz is influenced by aged marine air masses, this cluster showed a maximum nitrate mass concentration during the transition seasons (1.54 µg m−3 and a contribution of 26 %, respectively).
Finally, two other clusters TS-C1 and TS-C2 were two different types of cyclonic air masses in fall and spring time, with mean PM mass concentrations of 4.69 and 4.94 µg m−3, respectively. These trajectories with different types of marine-influenced air masses occurred for a very short period of time (3 % and 4 % of the total measurements period, respectively). The first one, TS-C1, started from the Atlantic Ocean near Spain and is associated with a more continental influence, which is why organic mass concentration and contribution were higher than inorganics. However, the MO-OOA contribution of this cluster was the highest during this time period (26 %) due to the aging processes of primary organic aerosols especially CCOA, which had a maximum mass concentration (0.31 µg m−3 and mass fraction of 7 %, respectively), while the second one, TS-C2, was almost a pure marine cluster, coming from the Norwegian Sea. In opposition to TS-C1, PM was dominated by inorganics in TS-C2, with a high mass concentration of nitrate (1.35 µg m−3) representing the aging effect due to the long time transfer over the continents.
3.4.3 Summer
During the summer season, the different clusters showed strong changes in both chemical compositions and total mass concentrations. Cluster WS-ST was identified as the local air mass with a mean value of 8.97 µg m−3, which occurred for a short period, 6 % of the measurement. However, this cluster contained a low POA mass concentration but a maximum contribution of MO-OOA (32 %), assuming important regional photochemical roles of SOA particles with higher temperatures (Fig. S4) and enhanced solar radiation (Petit et al., 2015).
Air masses WS-A1 and WS-A2 were two different types of anticyclonic air masses with different directions and different mean PM mass concentrations. Cluster WS-A1, known as the highest mass concentration during summer time (16.95 µg m−3 and contribution of 11 % of the measurement period) was the continental air mass which was coming from eastern Europe during the anticyclonic flow (starting from Belarus and crossing Poland and the Czech Republic). This air mass included maximum inorganics and organics, especially CCOA mass concentration (1.28 µg m−3) during summer time, which can explain the existing higher CCOA during summer, and showed the role of long-range transported emissions in the summer season. However, WS-A2 air mass, with a mean value of 9.48 µg m−3, was a marine-influenced air mass and was coming from the North Sea, which only occurred for a short period (6 % of the total measurement period).
Moreover, two cyclonic air masses, WS-C1 and WS-C2, were also identified as two different marine clusters. These trajectories did not occur very often, only 5 % and 3 % of the total measurement period, respectively. The starting point of WS-C1 with a mean value of 8.41 µg m−3 was the Celtic Sea, but in the following time, it predominantly passed over continental areas (France and southern Germany), which means it could be aged, and the result can be shown in the high mass concentration of nitrate and sulfate in this cluster (1.63 and 1.86 µg m−3, respectively). Finally, the starting point of WS-C2 with a mean value of 4.46 µg m−3 was near Iceland, with the lowest PM mass concentration during summer. However, it showed the highest sulfate contribution (27 %) at this time, which could be associated with aged marine air mass like other marine air masses.
3.4.4 Cluster seasonality
A parallel comparison can be made between the winter and summer clusters. Clusters CS-A1 and WS-A1 both show the highest POA contribution dominated by coal combustion, which emphasizes that the origin of this source could be associated with the transport of the coal power plant emissions from eastern Europe (e.g., eastern part of Germany, Poland, Czech Republic, and further countries located in the east). These clusters were not only affected by the winter air quality but also the summer air quality.
Clusters CS-ST and WS-ST, which were known as local air masses, showed the seasonal effect on the chemical component. First, the volatility of ammonium nitrate at higher summer temperatures could explain their lower value in summer. Then, atmospheric photochemical oxidation processes can affect the locally formed sulfate in summer, which might explain the highest sulfate contribution to the overall inorganic components during summer. Not surprisingly, due to the residential heating effect, POA mass concentration was very high during winter; however, freshly formed SOA originating from biomass and coal emissions can explain the higher LO-OOA mass concentration in winter.
During the whole period, some marine air masses with cyclonic and anticyclonic flow showed the important roles of aged marine air masses over the measurement site: (a) clusters CS-A2 and WS-A2 with an anticyclonic pattern starting from the North Sea and Norwegian Sea; and (b) CS-C2a, WS-C1, and TS-C1 starting from the Celtic Sea near Spain, and also CS-C2b and WS-C2 starting from Iceland, all with cyclonic patterns, contain nitrate and sulfate during the transferring over continental areas in different seasons.
The chemical compositions of non-refractory fine aerosol (NR-PM1) at the German rural-background observatory at Melpitz were investigated in this study over a 1-year period between September 2016 and August 2017. Overall, the averaged total PM1 mass concentration is 10.49 µg m−3 and follows a clear seasonal pattern, with the highest mass concentration during winter (15.95 µg m−3) and the lowest mass concentration during summer time (6.24 µg m−3). The organic aerosol was the most significant component, accounting for 46 % of total PM1 and showing significant seasonal dependency (39 % in winter to 58 % in summer). It was followed by sulfate (15 % and 20 %) and nitrate (24 % and 11 %). For OA source apportionment, PMF in a rolling fashion has been applied using the SoFi Pro, which provided the decomposition of time-dependent factor profiles that were able to better capture the variability of OA sources across seasons in comparison with the conventional seasonal PMF. The final solution enabled the identification of five factors throughout the 1-year measurements of OA; HOA, BBOA, CCOA, LO-OOA, and MO-OOA. Using the correlation between HOA, BBOA, and CCOA with eBC-PM1, a multilinear regression approach was applied to perform the source apportionment of eBC-PM1.
Generally, in Melpitz, HOA as a minor source of OA (6 % of the contribution of total organic mass) and eBC-PM1 (8 % of the total eBC-PM1) was associated with (a) low traffic emissions, (b) household heating in winter, and (c) the central heating for hot water production for all seasons, which uses multiple fuel types in the Melpitz area. BBOA representing 7.9 % of the contribution of total organic mass and 37 % of the total eBC-PM1 showed a seasonal effect, emphasizing the impact of house heating during winter. Similar to HOA, the presence of BBOA during summer was due to central heating, which uses multiple fuel types in the Melpitz area. The most dominant anthropogenic source was associated with CCOA with a 15.4 % contribution of total organic mass and 55 % of the total eBC-PM1 with the highest mass concentration and contribution of PM during winter rather than summer. Although a certain fraction of CCOA could be linked to surrounding domestic heating (van Pinxteren et al., 2020), it is rather associated with power plant emissions and long-range transport all year round, which is supported by cluster and back-trajectory analysis. LO-OOA and MO-OOA, referred to as oxidized oxygenated organic aerosol (32.4 % and 38.4 % of the contribution of total organic mass, respectively), were identified as a secondary organic aerosol with the highest mass concentration during the cold months and the lowest mass concentration during the warm months. LO-OOA mass concentration decreased during the day due to dilution, and the evaporation process resulted in aging into MO-OOA.
A combination of the NWR model and cluster analysis was used to better understand the origin of the aerosol reaching the station. Overall, Melpitz is influenced by 15 types of air masses, such as long-range continental, marine, and surrounding emissions. During winter and summer time, easterly continental air masses, CS-A1 and WS-A1 with an anticyclonic pattern come from eastern Europe and showed a significant particle mass concentration, especially high POA (and CCOA) mass concentration at the measurement site. Marine clusters, mostly coming from the south, west, and north side with aged marine air masses including nitrate and sulfate, also have important roles in the PM mass concentration at the Melpitz site over the entire period (winter: CS-A2, CS-C2b, and CS-C2a; transition: TS-C, TS-A2, and TS-C2; and summer: WS-Ca, WS-C2, and WS-A2). However, the surrounding emissions are recognized as another important source of emissions which include high organic and inorganic components during winter and summer (CS-ST and WS-ST, respectively).
Our results emphasize the importance of the long-range transported emissions of coal-combustion-related aerosol particles regardless of the season, which supports that the main CCOA source is related to coal power plants emissions. However, coal power plant emissions not only affect the surrounding air quality but can also be transported over long distances. It is important to note that the overall coal combustion mass concentration presented here can certainly be underestimated, since the identified CCOA factor is associated with freshly emitted organic aerosol, and no factor associated with potential aged coal combustion was identified. Because coal still is an important energy source in the European energy mix (68.4 % of all energy in the EU was produced from coal, crude oil, and natural gas; Energy Statistics – an overview – Statistics Explained, 2022) as well as on a global scale and also that it still will be in use for the coming decades (until 2040, Europe's coal exit, 2022), further research should be done on the identification of coal emissions across Europe in order to better understand its atmospheric aging processes.
The SoFi code is the property of Datalystica and has been used under license. The ACSM data were analyzed using IGOR Pro 8.04 (Igor Pro, 2023, https://www.wavemetrics.com/). Source apportionment analysis was performed using SoFi 8.0.3.1 (https://datalystica.com/, SoFi pro, 2023, Canonaco et al., 2021). Backward trajectories were calculated using HYSPLIT-4 (https://www.ready.noaa.gov/HYSPLIT.php, NOAA Research, 2023, Draxler and Hess, 1997).
The data used for this work are available via the public repository Zenodo (https://doi.org/10.5281/zenodo.6522811, Chen, 2022) or can be obtained from the authors on request.
The supplement related to this article is available online at: https://doi.org/10.5194/acp-23-6963-2023-supplement.
LP performed the measurements. SA analyzed the ACSM and eBC data and performed the rolling source apportionment, eBC source apportionment, and cluster analysis. FC and GC provided technical support for SoFi Pro and the evaluation of the PMF results. All of the co-authors participated in the discussion. SA wrote the manuscript. LP, GC, FC, ASHP, MP, AW, and HH reviewed the manuscript.
The contact author has declared that none of the authors has any competing interests.
Publisher's note: Copernicus Publications remains neutral with regard to jurisdictional claims in published maps and institutional affiliations.
This work is supported by the COST action CA16109 Chemical On-Line cOmpoSition and Source Apportionment of fine aerosoLs (COLOSSAL), the SNF COST project SAMSAM IZCOZO_177063, the infrastructure project ACTRIS (EU FP7; grant no. 262254), the RI-URBANS project (grant no. 101036245), ERA-PLANET, the transnational projects SMURBS and iCUPE (grant agreement no. 689443), and ACTRIS-2 (grant no. 654109).
This research has been supported by the European Cooperation in Science and Technology (grant no. CA16109), the Schweizerischer Nationalfonds zur Förderung der Wissenschaftlichen Forschung (grant no. SAMSAM (IZCOZ0-177063)), and the H2020 Research Infrastructures (grant nos. RI-URBANS (101036245), ACTRIS (262254), ERA-PLANET (689443), and ACTRIS-2 (654109)).
This paper was edited by Annele Virtanen and reviewed by Liqing Hao and one anonymous referee.
Aas, W., Tsyro, S., Bieber, E., Bergström, R., Ceburnis, D., Ellermann, T., Fagerli, H., Frölich, M., Gehrig, R., Makkonen, U., Nemitz, E., Otjes, R., Perez, N., Perrino, C., Prévôt, A. S. H., Putaud, J.-P., Simpson, D., Spindler, G., Vana, M., and Yttri, K. E.: Lessons learnt from the first EMEP intensive measurement periods, Atmos. Chem. Phys., 12, 8073–8094, https://doi.org/10.5194/acp-12-8073-2012, 2012.
Alfarra, M. R., Prevot, A. S. H., Szidat, S., Sandradewi, J., Weimer, S., Lanz, V. A., Schreiber, D., Mohr, M., and Baltensperger, U.: Identification of the mass spectral signature of organic aerosols from wood burning emissions, Environ. Sci. Technol., 41, 5770–5777, https://doi.org/10.1021/es062289b, 2007.
Allan, J. D., Delia, A. E., Coe, H., Bower, K. N., Alfarra, M. R., Jimenez, J. L., Middlebrook, A. M., Drewnick, F., Onasch, T. B., Canagaratna, M. R., Jayne, J. T., and Worsnop, D. R.: A generalised method for the extraction of chemically resolved mass spectra from Aerodyne aerosol mass spectrometer data, J. Aerosol Sci., 35, 909–922, https://doi.org/10.1016/j.jaerosci.2004.02.007, 2004.
Birmili, W., Stratmann, F., and Wiedensohler, A.: Technical note design of a DMA-based size spectrometer for a large particle size range and stable operation, J. Aerosol Sci., 30, 549–553, https://doi.org/10.1016/S0021-8502(98)00047-0, 1999.
Birmili, W., Wiedensohler, A., Mueller, K., Birmili, W., Weinhold, K., Nordmann, S., Wiedensohler, A., Spindler, G., Müller, K., Herrmann, H., Gnauk, T., Pitz, M., Cyrys, J., Flentje, H., Nickel, C., J Kuhlbusch, T. A., Löschau, G., Haase, D., Meinhardt, F., F., Schwerin, A., Ries, L., and Wirtz, K.: Atmospheric aerosol measurements in the German Ultrafine Aerosol Network (GUAN) Korngrößendifferenzierte Feinstaubbelastung in Straßennähe in Ballungsgebieten Sachsens (2003–2005) View project Chemistry, Air Quality and Climate View project Atmospheric aerosol measurements in the German Ultrafine Aerosol Network (GUAN) Part 1: Soot and particle number size distributions, https://www.researchgate.net/publication/232089057 (last access: 21 March 2023), 2009.
Birmili, W., Heinke, K., Pitz, M., Matschullat, J., Wiedensohler, A., Cyrys, J., Wichmann, H.-E., and Peters, A.: Particle number size distributions in urban air before and after volatilisation, Atmos. Chem. Phys., 10, 4643–4660, https://doi.org/10.5194/acp-10-4643-2010, 2010.
Birmili, W., Sun, J., Wiedensohler, A., Birmili, W., Sun, J., Weinhold, K., Merkel, M., Rasch, F., Spindler, G., Wiedensohler, A., Bastian, S., Löschau, G., Schladitz, A., Quass, U., Kuhlbusch, T. A. J., Kaminski, H., Cyrys, J., Pitz, M., Gu, J., Peters, A., Flentje, H., Meinhardt, F., Schwerin, A., Bath, O., Ries, L., Gerwig, H., Wirtz, K., and Weber, S.: Enhanced Land Use Regression models for urban fine dust and ultrafine particle concentrations View project Radon parallel measurements, View project Atmospheric aerosol measurements in the German Ultrafine Aerosol Network (GUAN), https://www.researchgate.net/publication/330910927 (last access: 20 December 2022), 2015.
Birmili, W., Weinhold, K., Rasch, F., Sonntag, A., Sun, J., Merkel, M., Wiedensohler, A., Bastian, S., Schladitz, A., Löschau, G., Cyrys, J., Pitz, M., Gu, J., Kusch, T., Flentje, H., Quass, U., Kaminski, H., Kuhlbusch, T. A. J., Meinhardt, F., Schwerin, A., Bath, O., Ries, L., Gerwig, H., Wirtz, K., and Fiebig, M.: Long-term observations of tropospheric particle number size distributions and equivalent black carbon mass concentrations in the German Ultrafine Aerosol Network (GUAN), Earth Syst. Sci. Data, 8, 355–382, https://doi.org/10.5194/essd-8-355-2016, 2016.
Bootstrap Methods: Another Look at the Jackknife on JSTOR, https://www.jstor.org/stable/2958830?origin=JSTOR-pdf (last access: 17 October 2019), 1979.
Bressi, M., Cavalli, F., Putaud, J. P., Fröhlich, R., Petit, J. E., Aas, W., Äijälä, M., Alastuey, A., Allan, J. D., Aurela, M., Berico, M., Bougiatioti, A., Bukowiecki, N., Canonaco, F., Crenn, V., Dusanter, S., Ehn, M., Elsasser, M., Flentje, H., M., Flentje, H., Graf, P., Green, D. C., Heikkinen, L., Hermann, H., Holzinger, R., Hueglin, C., Keernik, H., Kiendler-Scharr, A., Kubelova, L., Lunder, C., Maasikmets, M., Makes, O., Malaguti, A., Mihalopoulos, N., Nicolas, J. B., O'Dowd, C., Ovadnevaite, J., Petralia, E., Poulain, L., Priestman, M., Riffault, V., Ripoll, A., Schlag, P., Schwarz, J., Sciarec,, J., Slowik, J., Sosedova, Y., Stavroulas, I., Teinemaa, E., Via, M., Vodickar, P., Williams, P. I., Wiedensohler, A., Young, D. E., Zhang, S., Favez, O., Minguillon, M. C., and Prevot, A. S. H.: A European aerosol phenomenology – 7: High-time resolution chemical characteristics of submicron particulate matter across Europe, Atmos. Environ., 10, 100108, https://doi.org/10.1016/j.aeaoa.2021.100108, 2021.
Canagaratna, M. R., Jayne, J. T., Ghertner, D. A., Herndon, S., Shi, Q., Jimenez, J. L., Silva, P. J., Williams, P., Lanni, T., Drewnick, F., Demerjian, K. L., Kolb, C. E., and Worsnop, D. R.: Chase studies of particulate emissions from in-use New York City vehicles, Aerosol Sci. Tech., 38, 555–573, https://doi.org/10.1080/02786820490465504, 2004.
Canagaratna, M. R., Jimenez, J. L., Kroll, J. H., Chen, Q., Kessler, S. H., Massoli, P., Hildebrandt Ruiz, L., Fortner, E., Williams, L. R., Wilson, K. R., Surratt, J. D., Donahue, N. M., Jayne, J. T., and Worsnop, D. R.: Elemental ratio measurements of organic compounds using aerosol mass spectrometry: characterization, improved calibration, and implications, Atmos. Chem. Phys., 15, 253–272, https://doi.org/10.5194/acp-15-253-2015, 2015.
Canonaco, F., Crippa, M., Slowik, J. G., Baltensperger, U., and Prévôt, A. S. H.: SoFi, an IGOR-based interface for the efficient use of the generalized multilinear engine (ME-2) for the source apportionment: ME-2 application to aerosol mass spectrometer data, Atmos. Meas. Tech., 6, 3649–3661, https://doi.org/10.5194/amt-6-3649-2013, 2013.
Canonaco, F., Slowik, J. G., Baltensperger, U., and Prévôt, A. S. H.: Seasonal differences in oxygenated organic aerosol composition: implications for emissions sources and factor analysis, Atmos. Chem. Phys., 15, 6993–7002, https://doi.org/10.5194/acp-15-6993-2015, 2015.
Canonaco, F., Tobler, A., Chen, G., Sosedova, Y., Slowik, J. G., Bozzetti, C., Daellenbach, K. R., El Haddad, I., Crippa, M., Huang, R.-J., Furger, M., Baltensperger, U., and Prévôt, A. S. H.: A new method for long-term source apportionment with time-dependent factor profiles and uncertainty assessment using SoFi Pro: application to 1 year of organic aerosol data, Atmos. Meas. Tech., 14, 923–943, https://doi.org/10.5194/amt-14-923-2021, 2021.
Chazeau, B., el Haddad, I., Canonaco, F., Temime-Roussel, B., D'Anna, B., Gille, G., Mesbah, B., Prévôt, A. S. H., Wortham, H., and Marchand, N.: Organic aerosol source apportionment by using rolling positive matrix factorization: Application to a Mediterranean coastal city, Atmos. Environ., 14, 100176, https://doi.org/10.1016/j.aeaoa.2022.100176, 2022.
Chen, G.: European Aerosol Phenomenology – 8: Harmonised Source Apportionment of Organic Aerosol using 22 Year-long ACSM/AMS Datasets, in: Environment International (Version 2nd, Vol. 166, p. 107325), Zenodo [data set], https://doi.org/10.5281/zenodo.6672710, 2022.
Chen, G., Sosedova, Y., Canonaco, F., Fröhlich, R., Tobler, A., Vlachou, A., Daellenbach, K. R., Bozzetti, C., Hueglin, C., Graf, P., Baltensperger, U., Slowik, J. G., El Haddad, I., and Prévôt, A. S. H.: Time-dependent source apportionment of submicron organic aerosol for a rural site in an alpine valley using a rolling positive matrix factorisation (PMF) window, Atmos. Chem. Phys., 21, 15081–15101, https://doi.org/10.5194/acp-21-15081-2021, 2021.
Chen, G., Canonaco, F., Tobler, A., Aas, W., Alastuey, A., Allan, J., Atabakhsh, S., Aurela, M., Baltensperger, U., Bougiatioti, A., de Brito, J. F., Ceburnis, D., Chazeau, B., Chebaicheb, H., Daellenbach, K. R., Ehn, M., el Haddad, I., Eleftheriadis, K., Favez, O., Flentje, H., Font, A., Fossum, K., Freney, E., Gini, M., Green, D. C., Heikkinen, L., Herrmann, H., Kalogridis, A., Keernik, H., Lhotka, R., Lin, C., Lunder, C., Maasikmets, M., Manousakas, M. I., Marchand, N., Marin, C., Marmureanu, L., Mihalopoulos, N., Mocnika, G., Nęckia, J., O'Dowd, C., Ovadnevaite, J., Petera, T., Petita, J. E., Pikridasa, M., Matthew Platt, S., Pokorna, P., Poulain, L., Priestman, M., Riffault, V., Rinaldia, M., Rozanskia, K., Schwarz, J., Sciarea, J., Simon, L., Skiba, A., Slowik, J. G., Sosedova, Y., Stavroulas, I., Styszkoa, K., Teinemaa, E., Timonen, H., Tremper, A., Vasilescu, J., Via, M., Vodicka, P., Wiedensohler, A., Zografou, O., Cruz Minguillon, M., and Prévôt, A. S. H.: European aerosol phenomenology – 8: Harmonised source apportionment of organic aerosol using 22 Year-long ACSM/AMS datasets, Environ. Int., 166, 107325, https://doi.org/10.1016/j.envint.2022.107325, 2022.
Crippa, M., DeCarlo, P. F., Slowik, J. G., Mohr, C., Heringa, M. F., Chirico, R., Poulain, L., Freutel, F., Sciare, J., Cozic, J., Di Marco, C. F., Elsasser, M., Nicolas, J. B., Marchand, N., Abidi, E., Wiedensohler, A., Drewnick, F., Schneider, J., Borrmann, S., Nemitz, E., Zimmermann, R., Jaffrezo, J.-L., Prévôt, A. S. H., and Baltensperger, U.: Wintertime aerosol chemical composition and source apportionment of the organic fraction in the metropolitan area of Paris, Atmos. Chem. Phys., 13, 961–981, https://doi.org/10.5194/acp-13-961-2013, 2013.
Crippa, M., Canonaco, F., Lanz, V. A., Äijälä, M., Allan, J. D., Carbone, S., Capes, G., Ceburnis, D., Dall'Osto, M., Day, D. A., DeCarlo, P. F., Ehn, M., Eriksson, A., Freney, E., Hildebrandt Ruiz, L., Hillamo, R., Jimenez, J. L., Junninen, H., Kiendler-Scharr, A., Kortelainen, A.-M., Kulmala, M., Laaksonen, A., Mensah, A. A., Mohr, C., Nemitz, E., O'Dowd, C., Ovadnevaite, J., Pandis, S. N., Petäjä, T., Poulain, L., Saarikoski, S., Sellegri, K., Swietlicki, E., Tiitta, P., Worsnop, D. R., Baltensperger, U., and Prévôt, A. S. H.: Organic aerosol components derived from 25 AMS data sets across Europe using a consistent ME-2 based source apportionment approach, Atmos. Chem. Phys., 14, 6159–6176, https://doi.org/10.5194/acp-14-6159-2014, 2014.
Daellenbach, K. R., Uzu, G., Jiang, J., Cassagnes, L. E., Leni, Z., Vlachou, A., Stefenelli, G., Canonaco, F., Weber, S., Segers, A., Kuenen, J. J. P., Schaap, M., Favez, O., Albinet, A., Aksoyoglu, S., Dommen, J., Baltensperger, U., Geiser, M., el Haddad, I., Jaffrezo, J. L., and Prévôt, A. S. H.: Sources of particulate-matter air pollution and its oxidative potential in Europe, Nature, 587, 414–419, https://doi.org/10.1038/s41586-020-2902-8, 2020.
Dall'Osto, M., Ovadnevaite, J., Ceburnis, D., Martin, D., Healy, R. M., O'Connor, I. P., Kourtchev, I., Sodeau, J. R., Wenger, J. C., and O'Dowd, C.: Characterization of urban aerosol in Cork city (Ireland) using aerosol mass spectrometry, Atmos. Chem. Phys., 13, 4997–5015, https://doi.org/10.5194/acp-13-4997-2013, 2013.
Draxler, R. R. and Hess, G. D.: Description of the HYSPLIT-4 Modeling System, NOAA Technical Memorandum ERL ARL-224, NOAA Air Resources Laboratory, Silver Spring, 1–24, https://www.arl.noaa.gov/documents/reports/arl-224.pdf (last access: 17 April 2021), 1997.
Dudoitis, V., Byčenkiene, S., Plauškaite, K., Bozzetti, C., Fröhlich, R., Mordas, G., and Ulevičius, V.: Spatial distribution of carbonaceous aerosol in the southeastern Baltic Sea region (event of grass fires), Acta Geophys., 64, 711–731, https://doi.org/10.1515/acgeo-2016-0018, 2016.
Efron, B.: Bootstrap Methods: Another Look at the Jackknife on JSTOR, https://www.jstor.org/stable/2958830?origin=JSTOR-pdf (last access: 17 October 2019), 1979.
Energy statistics: an overview – Statistics Explained, https://ec.europa.eu/eurostat/statistics-explained/index.php?title=Energy_statistics_-_an_overview (last access: 20 December 2022), 2022.
Europe's coal exit: Europe Beyond Coal: Europe Beyond Coal, https://beyond-coal.eu/europes-coal-exit/ (last access: 8 July 2022), 2022.
Fröhlich, R., Cubison, M. J., Slowik, J. G., Bukowiecki, N., Prévôt, A. S. H., Baltensperger, U., Schneider, J., Kimmel, J. R., Gonin, M., Rohner, U., Worsnop, D. R., and Jayne, J. T.: The ToF-ACSM: a portable aerosol chemical speciation monitor with TOFMS detection, Atmos. Meas. Tech., 6, 3225–3241, https://doi.org/10.5194/amt-6-3225-2013, 2013.
Fröhlich, R., Crenn, V., Setyan, A., Belis, C. A., Canonaco, F., Favez, O., Riffault, V., Slowik, J. G., Aas, W., Aijälä, M., Alastuey, A., Artiñano, B., Bonnaire, N., Bozzetti, C., Bressi, M., Carbone, C., Coz, E., Croteau, P. L., Cubison, M. J., Esser-Gietl, J. K., Green, D. C., Gros, V., Heikkinen, L., Herrmann, H., Jayne, J. T., Lunder, C. R., Minguillón, M. C., Mocnik, G., O'Dowd, C. D., Ovadnevaite, J., Petralia, E., Poulain, L., Priestman, M., Ripoll, A., Sarda-Estève, R., Wiedensohler, A., Baltensperger, U., Sciare, J., and Prévôt, A. S. H.: ACTRIS ACSM intercomparison – Part 2: Intercomparison of ME-2 organic source apportionment results from 15 individual, co-located aerosol mass spectrometers, Atmos. Meas. Tech., 8, 2555–2576, https://doi.org/10.5194/amt-8-2555-2015, 2015.
Gilardoni, S., Massoli, P., Paglione, M., Giulianelli, L., Carbone, C., Rinaldi, M., Decesari, S., Sandrini, S., Costabile, F., Gobbi, G. P., Pietrogrande, M. C., Visentin, M., Scotto, F., Fuzzi, S., and Facchini, M. C.: Direct observation of aqueous secondary organic aerosol from biomass-burning emissions, P. Natl. Acad. Sci. USA, 113, 10013–10018, https://doi.org/10.1073/pnas.1602212113, 2016.
Heikkinen, L., Äijälä, M., Daellenbach, K. R., Chen, G., Garmash, O., Aliaga, D., Graeffe, F., Räty, M., Luoma, K., Aalto, P., Kulmala, M., Petäjä, T., Worsnop, D., and Ehn, M.: Eight years of sub-micrometre organic aerosol composition data from the boreal forest characterized using a machine-learning approach, Atmos. Chem. Phys., 21, 10081–10109, https://doi.org/10.5194/acp-21-10081-2021, 2021.
Henry, R., Norris, G. A., Vedantham, R., and Turner, J. R.: Source region identification using kernel smoothing, Environ. Sci. Technol., 43, 4090–4097, https://doi.org/10.1021/es8011723, 2009.
Huang, S., Wu, Z., Poulain, L., van Pinxteren, M., Merkel, M., Assmann, D., Herrmann, H., and Wiedensohler, A.: Source apportionment of the organic aerosol over the Atlantic Ocean from 53∘ N to 53∘ S: significant contributions from marine emissions and long-range transport, Atmos. Chem. Phys., 18, 18043–18062, https://doi.org/10.5194/acp-18-18043-2018, 2018.
Huang, W., Saathoff, H., Shen, X., Ramisetty, R., Leisner, T., and Mohr, C.: Seasonal characteristics of organic aerosol chemical composition and volatility in Stuttgart, Germany, Atmos. Chem. Phys., 19, 11687–11700, https://doi.org/10.5194/acp-19-11687-2019, 2019.
Hussein, T., Karppinen, A., Kukkonen, J., Härkönen, J., Aalto, P. P., Hämeri, K., Kerminen, V. M., and Kulmala, M.: Meteorological dependence of size-fractionated number concentrations of urban aerosol particles, Atmos. Environ., 40, 1427–1440, https://doi.org/10.1016/j.atmosenv.2005.10.061, 2006.
Iapalucci, T. L., Demski, R. J., and Bienstock, D.: Chlorine in Coal Combustion. United States Department of the Interior, Bureau of Mines Report of Investigation 7260s, https://www.osti.gov/biblio/7158348 (last access: 21 March 2023), 1969.
Igor Pro: Wavemetrics Inc, OR, USA, https://www.wavemetrics.com/, last access: 16 June 2023.
Iinuma, Y., Engling, G., Puxbaum, H., and Herrmann, H.: A highly resolved anion-exchange chromatographic method for determination of saccharidic tracers for biomass combustion and primary bio-particles in atmospheric aerosol, Atmos. Environ., 43, 1367–1371, https://doi.org/10.1016/j.atmosenv.2008.11.020, 2009.
Jayne, J. T., Leard, D. C., Zhang, X., Davidovits, P., Smith, K. A., Kolb, C. E., and Worsnop, D. R.: Development of an Aerosol Mass Spectrometer for Size and Composition Analysis of Submicron Particles, Aerosol Sci. Technol., 33, 48–70, https://doi.org/10.1080/027868200410840, 2000.
Jimenez, J. L., Canagaratna, M. R., Donahue, N. M., Prévôt, A. S. H., Zhang, Q., Kroll, J. H., DeCarlo, P. F., Allan, J. D., Coe, H., Ng, N. L., Aiken, A. C., Docherty, K. S., Ulbrich, I. M., Grieshop, A. P., Robinson, A. L., Duplissy, J., Smith, J. D., Wilson, K. R., Lanz, V. A., Hueglin, C., Sun, Y. L., Tian, J., Laaksonen, A., Raatikainen, T., Rautiainen, J., Vaattovaara, P., Ehn, M., Kulmala, M., Tomlinson, J. M., Collins, D. R., Cubison, M. J., Dunlea, E. J., Huffman, J. A., Onasch, T. B., Alfarra, M. R., Williams, P. I., Bower, K., Kondo, Y., Schneider, J., Drewnick, F., Borrmann, S., Weimer, S., Demerjian, K., Salcedo, D., Cottrell, L., Griffin, R., Takami, A., Miyoshi, T., Hatakeyama, S., Shimono, A., Sun, J. Y, Zhang, Y. M., Dzepina, K., Kimmel, J. R., Sueper, D., Jayne, J. T., Herndon, S. C., Trimborn, A. M., Williams, L. R., Wood, E. C., Middlebrook, A. M., Kolb, C. E., Baltensperger, U., and Worsnop, D. R.: Evolution of organic aerosols in the atmosphere, Science, 326, 1525–1529, https://doi.org/10.1126/science.1180353, 2009.
Katsanos, D., Bougiatioti, A., Liakakou, E., Kaskaoutis, D. G., Stavroulas, I., Paraskevopoulou, D., Lianou, M., Psiloglou, B. E., Gerasopoulos, E., Pilinis, C., and Mihalopoulos, N.: Optical properties of near-surface urban aerosols and their chemical tracing in a mediterranean city (Athens), Aerosol Air Qual. Res., 19, 49–70, https://doi.org/10.4209/aaqr.2017.11.0544, 2019.
Keck, L. and Wittmaack, K.: Effect of filter type and temperature on volatilisation losses from ammonium salts in aerosol matter, Atmos. Environ., 39, 4093–4100, https://doi.org/10.1016/j.atmosenv.2005.03.029, 2005.
Kiendler-Scharr, A., Mensah, A. A., Friese, E., Topping, D., Nemitz, E., Prevot, A. S. H., Äijälä, M., Allan, J., Canonaco, F., Canagaratna, M., Carbone, S., Crippa, M., Dall Osto, M., Day, D. A., de Carlo, P., di Marco, C. F., Elbern, H., Eriksson, A., Freney, E., Hao, L., Herrmann, H., Hildebrandt, L., Hillamo, R., Jimenez, J. L., Laaksonen, A., McFiggans, G., Mohr, C., O'Dowd, C., Otjes, R., Ovadnevaite, J., Pandis, S. N., Poulain, L., Schlag, P., Sellegri, K., Swietlicki, E., Tiitta, P., Vermeulen, A., Wahner, A., Worsnop, D., and Wu, H. C.: Ubiquity of organic nitrates from night time chemistry in the European submicron aerosol, Geophys. Res. Lett., 43, 7735–7744, https://doi.org/10.1002/2016GL069239, 2016.
Kodros, J., Papanastasiou, D., Paglionea, M., Masiol, M., Squizzato, S., Florou, K., Skyllakou, K., Kaltsonoudis, C., Nenesa, A., and Pandisa, S.: Rapid dark aging of biomass burning as an overlookedsource of oxidized organic aerosol, P. Natl. Acad. Sci. USA, 113, 10013–10018, https://doi.org/10.1073/pnas.1602212113, 2020.
Kumar, V., Giannoukos, S., Haslett, S. L., Tong, Y., Singh, A., Bertrand, A., Lee, C. P., Wang, D. S., Bhattu, D., Stefenelli, G., Dave, J. S., Puthussery, J. V., Qi, L., Vats, P., Rai, P., Casotto, R., Satish, R., Mishra, S., Pospisilova, V., Mohr, C., Bell, D. M., Ganguly, D., Verma, V., Rastogi, N., Baltensperger, U., Tripathi, S. N., Prévôt, A. S. H., and Slowik, J. G.: Highly time-resolved chemical speciation and source apportionment of organic aerosol components in Delhi, India, using extractive electrospray ionization mass spectrometry, Atmos. Chem. Phys., 22, 7739–7761, https://doi.org/10.5194/acp-22-7739-2022, 2022.
Laborde, M., Crippa, M., Tritscher, T., Jurányi, Z., Decarlo, P. F., Temime-Roussel, B., Marchand, N., Eckhardt, S., Stohl, A., Baltensperger, U., Prévôt, A. S. H., Weingartner, E., and Gysel, M.: Black carbon physical properties and mixing state in the European megacity Paris, Atmos. Chem. Phys., 13, 5831–5856, https://doi.org/10.5194/acp-13-5831-2013, 2013.
Lanz, V. A., Prévôt, A. S. H., Alfarra, M. R., Weimer, S., Mohr, C., DeCarlo, P. F., Gianini, M. F. D., Hueglin, C., Schneider, J., Favez, O., D'Anna, B., George, C., and Baltensperger, U.: Characterization of aerosol chemical composition with aerosol mass spectrometry in Central Europe: an overview, Atmos. Chem. Phys., 10, 10453–10471, https://doi.org/10.5194/acp-10-10453-2010, 2010.
Li, G., Lei, W., Bei, N., and Molina, L. T.: Contribution of garbage burning to chloride and PM2.5 in Mexico City, Atmos. Chem. Phys., 12, 8751–8761, https://doi.org/10.5194/acp-12-8751-2012, 2012.
Liu, P. S. K., Deng, R., Smith, K. A., Williams, L. R., Jayne, J. T., Canagaratna, M. R., Moore, K., Onasch, T. B., Worsnop, D. R., and Deshler, T.: Transmission efficiency of an aerodynamic focusing lens system: Comparison of model calculations and laboratory measurements for the aerodyne aerosol mass spectrometer, Aerosol Sci. Technol., 41, 721–733, https://doi.org/10.1080/02786820701422278, 2007.
Ma, N., Birmili, W., Müller, T., Tuch, T., Cheng, Y. F., Xu, W. Y., Zhao, C. S., and Wiedensohler, A.: Tropospheric aerosol scattering and absorption over central Europe: a closure study for the dry particle state, Atmos. Chem. Phys., 14, 6241–6259, https://doi.org/10.5194/acp-14-6241-2014, 2014.
Marin, C., Marmureanu, L., Rado, C., Dodosci, A., Stan, C., Toanca, F., Preda, L., and Antonescu, B.: Wintertime Variations of Gaseous Atmospheric Constutuents in Bucharest Peri-Urban Area, Atmosphere, 10, 478, https://doi.org/10.3390/atmos10080478, 2019.
Middlebrook, A. M., Bahreini, R., Jimenez, J. L., and Canagaratna, M. R.: Evaluation of composition-dependent collection efficiencies for the Aerodyne aerosol mass spectrometer using field data, Aerosol Sci. Technol., 46, 258–271, https://doi.org/10.1080/02786826.2011.620041, 2012.
NOAA Research: HYSPLIT-4, USA, https://www.ready.noaa.gov/HYSPLIT.php, last access: 16 June 2023.
Ng, N. L., Canagaratna, M. R., Zhang, Q., Jimenez, J. L., Tian, J., Ulbrich, I. M., Kroll, J. H., Docherty, K. S., Chhabra, P. S., Bahreini, R., Murphy, S. M., Seinfeld, J. H., Hildebrandt, L., Donahue, N. M., DeCarlo, P. F., Lanz, V. A., Prévôt, A. S. H., Dinar, E., Rudich, Y., and Worsnop, D. R.: Organic aerosol components observed in Northern Hemispheric datasets from Aerosol Mass Spectrometry, Atmos. Chem. Phys., 10, 4625–4641, https://doi.org/10.5194/acp-10-4625-2010, 2010.
Ng, N. L., Herndon, S. C., Trimborn, A., Canagaratna, M. R., Croteau, P. L., Onasch, T. B., Sueper, D., Worsnop, D. R., Zhang, Q., Sun, Y. L., and Jayne, J. T.: An Aerosol Chemical Speciation Monitor (ACSM) for routine monitoring of the composition and mass concentrations of ambient aerosol, Aerosol Sci. Technol., 45, 780–794, https://doi.org/10.1080/02786826.2011.560211, 2011.
O'Dowd, C., Ceburnis, D., Ovadnevaite, J., Vaishya, A., Rinaldi, M., and Facchini, M. C.: Do anthropogenic, continental or coastal aerosol sources impact on a marine aerosol signature at Mace Head?, Atmos. Chem. Phys., 14, 10687–10704, https://doi.org/10.5194/acp-14-10687-2014, 2014.
Ovadnevaite, J., Ceburnis, D., Leinert, S., Dall'Osto, M., Canagaratna, M., O'Doherty, S., Berresheim, H., and O'Dowd, C.: Submicron NE Atlantic marine aerosol chemical composition and abundance: Seasonal trends and air mass categorization, J. Geophys. Res., 119, 11850–11863, https://doi.org/10.1002/2013JD021330, 2014.
Paatero, P.: Least squares formulation of robust non-negative factor analysis, Chemomet. Intell. Lab., 37, 23–35, https://doi.org/10.1016/S0169-7439(96)00044-5, 1997.
Paatero, P.: The Multilinear Engine- A Table-Driven, Least Squares Program for Solving Multilinear Problems, Including the n-Way Parallel Factor Analysis Model, J. Comput. Graph. Stat., 8, 854–888, https://doi.org/10.1080/10618600.1999.10474853, 1999.
Paatero, P. and Tappert, U.: Positive matrix factorization: A non-negative factor model with optimal utilization of error estimates of data values, Environmetrics, 5, 111–126, 1994.
Paglione, M., Gilardoni, S., Rinaldi, M., Decesari, S., Zanca, N., Sandrini, S., Giulianelli, L., Bacco, D., Ferrari, S., Poluzzi, V., Scotto, F., Trentini, A., Poulain, L., Herrmann, H., Wiedensohler, A., Canonaco, F., Prévôt, A. S. H., Massoli, P., Carbone, C., Facchini, M. C., and Fuzzi, S.: The impact of biomass burning and aqueous-phase processing on air quality: a multi-year source apportionment study in the Po Valley, Italy, Atmos. Chem. Phys., 20, 1233–1254, https://doi.org/10.5194/acp-20-1233-2020, 2020.
Parworth, C., Fast, J., Mei, F., Shippert, T., Sivaraman, C., Tilp, A., Watson, T., and Zhang, Q.: Long-term measurements of submicrometer aerosol chemistry at the Southern Great Plains (SGP) using an Aerosol Chemical Speciation Monitor (ACSM), Atmos. Environ., 106, 43–55, https://doi.org/10.1016/j.atmosenv.2015.01.060, 2015.
Petit, J.-E., Favez, O., Sciare, J., Crenn, V., Sarda-Estève, R., Bonnaire, N., Mocnik, G., Dupont, J.-C., Haeffelin, M., and Leoz-Garziandia, E.: Two years of near real-time chemical composition of submicron aerosols in the region of Paris using an Aerosol Chemical Speciation Monitor (ACSM) and a multi-wavelength Aethalometer, Atmos. Chem. Phys., 15, 2985–3005, https://doi.org/10.5194/acp-15-2985-2015, 2015.
Petzold, A. and Schönlinner, M.: Multi-angle absorption photometry – A new method for the measurement of aerosol light absorption and atmospheric black carbon, J. Aerosol Sci., 35, 421–441, https://doi.org/10.1016/j.jaerosci.2003.09.005, 2004.
Pope, C. A. and Dockery, D. W.: Health Effects of Fine Particulate Air Pollution: Lines that Connect, J. Air Waste Manage., 56, 709–742, https://doi.org/10.1080/10473289.2006.10464485, 2006.
Poulain, L., Spindler, G., Birmili, W., Plass-Dülmer, C., Wiedensohler, A., and Herrmann, H.: Seasonal and diurnal variations of particulate nitrate and organic matter at the IfT research station Melpitz, Atmos. Chem. Phys., 11, 12579–12599, https://doi.org/10.5194/acp-11-12579-2011, 2011.
Poulain, L., Birmili, W., Canonaco, F., Crippa, M., Wu, Z. J., Nordmann, S., Spindler, G., Prévôt, A. S. H., Wiedensohler, A., and Herrmann, H.: Chemical mass balance of 300 ∘C non-volatile particles at the tropospheric research site Melpitz, Germany, Atmos. Chem. Phys., 14, 10145–10162, https://doi.org/10.5194/acp-14-10145-2014, 2014.
Poulain, L., Spindler, G., Grüner, A., Tuch, T., Stieger, B., van Pinxteren, D., Petit, J.-E., Favez, O., Herrmann, H., and Wiedensohler, A.: Multi-year ACSM measurements at the central European research station Melpitz (Germany) – Part 1: Instrument robustness, quality assurance, and impact of upper size cutoff diameter, Atmos. Meas. Tech., 13, 4973–4994, https://doi.org/10.5194/amt-13-4973-2020, 2020.
Poulain, L., Fahlbusch, B., Spindler, G., Müller, K., van Pinxteren, D., Wu, Z., Iinuma, Y., Birmili, W., Wiedensohler, A., and Herrmann, H.: Source apportionment and impact of long-range transport on carbonaceous aerosol particles in central Germany during HCCT-2010, Atmos. Chem. Phys., 21, 3667–3684, https://doi.org/10.5194/acp-21-3667-2021, 2021.
Qi, L., Vogel, A. L., Esmaeilirad, S., Cao, L., Zheng, J., Jaffrezo, J.-L., Fermo, P., Kasper-Giebl, A., Daellenbach, K. R., Chen, M., Ge, X., Baltensperger, U., Prévôt, A. S. H., and Slowik, J. G.: A 1-year characterization of organic aerosol composition and sources using an extractive electrospray ionization time-of-flight mass spectrometer (EESI-TOF), Atmos. Chem. Phys., 20, 7875–7893, https://doi.org/10.5194/acp-20-7875-2020, 2020.
Saha, P. K., Khlystov, A., and Grieshop, A. P.: Downwind evolution of the volatility and mixing state of near-road aerosols near a US interstate highway, Atmos. Chem. Phys., 18, 2139–2154, https://doi.org/10.5194/acp-18-2139-2018, 2018.
Schaap, M., Spindler, G., Schulz, M., Acker, K., Maenhaut, W., Berner, A., Wieprecht, W., Streit, N., Muller, K., Bruggemann, E., Chi, X., Putaud, J. P., Hitzenberger, R., Puxbaum, H., Baltensperger, U., and ten Brink, H.: Artefacts in the sampling of nitrate studied in the “INTERCOMP” campaigns of EUROTRAC-AEROSOL, Atmos. Environ., 38, 6487–6496, https://doi.org/10.1016/j.atmosenv.2004.08.026, 2004.
Schlag, P., Kiendler-Scharr, A., Blom, M. J., Canonaco, F., Henzing, J. S., Moerman, M., Prévôt, A. S. H., and Holzinger, R.: Aerosol source apportionment from 1-year measurements at the CESAR tower in Cabauw, the Netherlands, Atmos. Chem. Phys., 16, 8831–8847, https://doi.org/10.5194/acp-16-8831-2016, 2016.
Schmale, J., Henning, S., Henzing, B., Keskinen, H., Sellegri, K., Ovadnevaite, J., Bougiatioti, A., Kalivitis, N., Stavroulas, I., Jefferson, A., Park, M., Schlag, P., Kristensson, A., Iwamoto, Y., Pringle, K., Reddington, C., Aalto, P., Äijälä, M., Baltensperger, U., Bialek, J., Birmili, W., Bukowiecki, N., Ehn, M., Fjæraa, A., Fiebig, M., Frank, G., Fröhlich, R., Frumau, A., Furuya, M., Hammer, E., Heikkinen, L., Herrmann, E., Holzinger, R., Hyono, H., Kanakidou, M., Kiendler-Scharr, A., Kinouchi, K., Kos, G., Kulmala, M., Mihalopoulos, N., Motos, G., Nenes, A., O'Dowd, C., Paramonov, M., Petäjä, T., Picard, D., Poulain, L., Prévôt, A., Slowik, J., Sonntag, A., Swietlicki, E., Svenningsson, B., Tsurumaru, H., Wiedensohler, A., Wittbom, C., Ogren, J., Matsuki, A., Yum, S., Myhre, G., Carslaw, K., Stratmann F., and Gysel, M.: Collocated observations of cloud condensation nuclei, particle size distributions, and chemical composition, Sci. Data, 4, 170003, https://doi.org/10.1038/sdata.2017.3, 2017.
Seinfeld, J. H. and Pandis, S. N.: Atmospheric Chemistry and Physics: From Air Pollution to Climate Change, 3rd edn., John Wiley & Sons, Inc., Hoboken, New Jersey, ISBN 9781118947401, 2006.
Shi, Y., Chen, J., Hu, D., Wang, L., Yang, X., and Wang, X.: Airborne submicron particulate (PM1) pollution in Shanghai, China: Chemical variability, formation/dissociation of associated semi-volatile components and the impacts on visibility, Sci. Total Environ., 473–474, 199–206, https://doi.org/10.1016/j.scitotenv.2013.12.024, 2014.
Shrivastava, M., Cappa, C. D., Fan, J., Goldstein, A. H., Guenther, A. B., Jimenez, J. L., Kuang, C., Laskin, A., Martin, S. T., Ng, N. L., Petaja, T., Pierce, J. R., Rasch, P. J., Roldin, P., Seinfeld, J. H., Shilling, J., Smith, J. N., Thornton, J. A., Volkamer, R., Wang, J., Worsnop, D. R., Zaveri, R. A., Zelenyuk, A., and Zhang, Q.: Recent advances in understanding secondary organic aerosol: Implications for global climate forcing, Rev. Geophys., 55, 509–559, https://doi.org/10.1002/2016RG000540, 2017.
Simoneit, B. R. T. and Elias, V. O.: Detecting Organic Tracers from Biomass Burning in the Atmosphere, Mar. Pollut. Bull., 42, 805–810, https://doi.org/10.1016/s0025-326x(01)00094-7, 2001.
Simoneit, B. R. T., Schauer, J. J., Nolte, C. G., Oros, D. R., Elias, V. O., Fraser, M. P., Rogge, W. F., and Cass, G. R.: Levoglucosan, a tracer for cellulose in biomass burning and atmospheric particles, Atmos. Environ., 33, 173–182, https://doi.org/10.1016/S1352-2310(98)00145-9, 1999.
SoFi pro: Datalystica, Park InnovAARE, Switzerland, https://datalystica.com/, last access: 16 June 2023.
Spindler, G., Müller, K., Brüggemann, E., Gnauk, T., and Herrmann, H.: Long-term size-segregated characterization of PM10, PM2.5, and PM1 at the IfT research station Melpitz downwind of Leipzig (Germany) using high and low-volume filter samplers, Atmos. Environ., 38, 5333–5347, https://doi.org/10.1016/j.atmosenv.2003.12.047, 2004.
Spindler, G., Brüggemann, E., Gnauk, T., Grüner, A., Müller, K., and Herrmann, H.: A four-year size-segregated characterization study of particles PM10, PM2.5 and PM1 depending on air mass origin at Melpitz, Atmos. Environ., 44, 164–173, https://doi.org/10.1016/j.atmosenv.2009.10.015, 2010.
Spindler, G., Gnauk, T., Grüner, A., Iinuma, Y., Müller, K., Scheinhardt, S., and Herrmann, H.: Size-segregated characterization of PM10 at the EMEP site Melpitz (Germany) using a five-stage impactor: A six-year study, J. Atmos. Chem., 69, 127–157, https://doi.org/10.1007/s10874-012-9233-6, 2012.
Spindler, G., Grüner, A., Müller, K., Schlimper, S., and Herrmann, H.: Long-term size-segregated particle (PM10, PM2.5, PM1) characterization study at Melpitz – Influence of air mass inflow, weather conditions and season, J. Atmos. Chem., 70, 165–195, https://doi.org/10.1007/s10874-013-9263-8, 2013.
Stavroulas, I., Bougiatioti, A., Grivas, G., Paraskevopoulou, D., Tsagkaraki, M., Zarmpas, P., Liakakou, E., Gerasopoulos, E., and Mihalopoulos, N.: Sources and processes that control the submicron organic aerosol composition in an urban Mediterranean environment (Athens): a high temporal-resolution chemical composition measurement study, Atmos. Chem. Phys., 19, 901–919, https://doi.org/10.5194/acp-19-901-2019, 2019.
Stieger, B., Spindler, G., Fahlbusch, B., Müller, K., Grüner, A., Poulain, L., Thöni, L., Seitler, E., Wallasch, M., and Herrmann, H.: Measurements of PM10 ions and trace gases with the online system MARGA at the research station Melpitz in Germany – A five-year study, J. Atmos. Chem., 75, 33–70, https://doi.org/10.1007/s10874-017-9361-0, 2018.
Sun, J., Birmili, W., Hermann, M., Tuch, T., Weinhold, K., Merkel, M., Rasch, F., Müller, T., Schladitz, A., Bastian, S., Löschau, G., Cyrys, J., Gu, J., Flentje, H., Briel, B., Asbach, C., Kaminski, H., Ries, L., Sohmer, R., Gerwig, H., Wirtz, K., Meinhardt, F., Schwerin, A., Bath, O., Ma, N., and Wiedensohler, A.: Decreasing trends of particle number and black carbon mass concentrations at 16 observational sites in Germany from 2009 to 2018, Atmos. Chem. Phys., 20, 7049–7068, https://doi.org/10.5194/acp-20-7049-2020, 2020.
Sun, Y., Xu, W., Zhang, Q., Jiang, Q., Canonaco, F., Prévôt, A. S. H., Fu, P., Li, J., Jayne, J., Worsnop, D. R., and Wang, Z.: Source apportionment of organic aerosol from 2-year highly time-resolved measurements by an aerosol chemical speciation monitor in Beijing, China, Atmos. Chem. Phys., 18, 8469–8489, https://doi.org/10.5194/acp-18-8469-2018, 2018.
Tiitta, P., Leskinen, A., Hao, L., Yli-Pirilä, P., Kortelainen, M., Grigonyte, J., Tissari, J., Lamberg, H., Hartikainen, A., Kuuspalo, K., Kortelainen, A.-M., Virtanen, A., Lehtinen, K. E. J., Komppula, M., Pieber, S., Prévôt, A. S. H., Onasch, T. B., Worsnop, D. R., Czech, H., Zimmermann, R., Jokiniemi, J., and Sippula, O.: Transformation of logwood combustion emissions in a smog chamber: formation of secondary organic aerosol and changes in the primary organic aerosol upon daytime and nighttime aging, Atmos. Chem. Phys., 16, 13251–13269, https://doi.org/10.5194/acp-16-13251-2016, 2016.
Tobler, A. K., Skiba, A., Canonaco, F., Močnik, G., Rai, P., Chen, G., Bartyzel, J., Zimnoch, M., Styszko, K., Nęcki, J., Furger, M., Różański, K., Baltensperger, U., Slowik, J. G., and Prévôt, A. S. H.: Characterization of non-refractory (NR) PM1 and source apportionment of organic aerosol in Kraków, Poland, Atmos. Chem. Phys., 21, 14893–14906, https://doi.org/10.5194/acp-21-14893-2021, 2021.
Ulbrich, I. M., Canagaratna, M. R., Zhang, Q., Worsnop, D. R., and Jimenez, J. L.: Interpretation of organic components from Positive Matrix Factorization of aerosol mass spectrometric data, Atmos. Chem. Phys., 9, 2891–2918, https://doi.org/10.5194/acp-9-2891-2009, 2009.
van Pinxteren, D., Fomba, K. W., Spindler, G., Müller, K., Poulain, L., Iinuma, Y., Löschau, G., Hausmann, A., and Herrmann, H.; Regional air quality in Leipzig, Germany: Detailed source apportionment of size-resolved aerosol particles and comparison with the year 2000, Faraday Discuss., 189, 291–315, https://doi.org/10.1039/c5fd00228a, 2016.
van Pinxteren, D., Mothes, F., Spindler, G., Fomba, K. W., Cuesta, A., Tuch, T., Müller, T., Wiedensohler, A., and Herrmann, H.: Zusatzbelastung aus Holzheizung, Sächsisches Landesamt für Umwelt, Landwirtschaft und Geologie (LfULG), Dresden, https://publikationen.sachsen.de/bdb/artikel/36106 (last access: 12 December 2021), 2020.
Via, M., Minguillón, M. C., Reche, C., Querol, X., and Alastuey, A.: Increase in secondary organic aerosol in an urban environment, Atmos. Chem. Phys., 21, 8323–8339, https://doi.org/10.5194/acp-21-8323-2021, 2021.
Vlachou, A., Daellenbach, K. R., Bozzetti, C., Chazeau, B., Salazar, G. A., Szidat, S., Jaffrezo, J.-L., Hueglin, C., Baltensperger, U., Haddad, I. E., and Prévôt, A. S. H.: Advanced source apportionment of carbonaceous aerosols by coupling offline AMS and radiocarbon size-segregated measurements over a nearly 2-year period, Atmos. Chem. Phys., 18, 6187–6206, https://doi.org/10.5194/acp-18-6187-2018, 2018.
Vlachou, A., Tobler, A., Lamkaddam, H., Canonaco, F., Daellenbach, K. R., Jaffrezo, J.-L., Minguillón, M. C., Maasikmets, M., Teinemaa, E., Baltensperger, U., El Haddad, I., and Prévôt, A. S. H.: Development of a versatile source apportionment analysis based on positive matrix factorization: a case study of the seasonal variation of organic aerosol sources in Estonia, Atmos. Chem. Phys., 19, 7279–7295, https://doi.org/10.5194/acp-19-7279-2019, 2019.
Wang, T., Fu, T., Chen, K., Cheng, R., Chen, S., Liu, J., Mei, M., Li, J., and Xue, Y.: Co-combustion behavior of dyeing sludge and rice husk by using TG-MS: Thermal conversion, gas evolution, and kinetic analyses, Bioresource Technol., 311, 123527, https://doi.org/10.1016/j.biortech.2020.123527, 2020.
Wang, Y., Henning, S., Poulain, L., Lu, C., Stratmann, F., Wang, Y., Niu, S., Pöhlker, M. L., Herrmann, H., and Wiedensohler, A.: Aerosol activation characteristics and prediction at the central European ACTRIS research station of Melpitz, Germany, Atmos. Chem. Phys., 22, 15943–15962, https://doi.org/10.5194/acp-22-15943-2022, 2022.
Wehner, B., Philippin, S., and Wiedensohler, A.: Design and calibration of a thermodenuder with an improved heating unit to measure the size-dependent volatile fraction of aerosol particles, J. Aerosol Sci., 33, 1087–1093, https://doi.org/10.1016/S0021-8502(02)00056-3, 2002.
WHO, Expert Consultation: https://www.who.int/news-room/events/detail/2019/02/12/default-calendar/expert-consultation-risk-communication-and-intervention-to-reduce-exposure-and-to-minimize-the-health-effects-of-air-pollution (last access: 17 December 2022), 2019.
Wierońska-Wiśniewska, F., Makowska, D., and Strugała, A.: Arsenic in polish coals: Content, mode of occurrence, and distribution during coal combustion process, Fuel, 312, 122992, https://doi.org/10.1016/j.fuel.2021.122992, 2022.
Xu, W., He, Y., Qiu, Y., Chen, C., Xie, C., Lei, L., Li, Z., Sun, J., Li, J., Fu, P., Wang, Z., Worsnop, D. R., and Sun, Y.: Mass spectral characterization of primary emissions and implications in source apportionment of organic aerosol, Atmos. Meas. Tech., 13, 3205–3219, https://doi.org/10.5194/amt-13-3205-2020, 2020.
Yang, S., Yuan, B., Peng, Y., Huang, S., Chen, W., Hu, W., Pei, C., Zhou, J., Parrish, D. D., Wang, W., He, X., Cheng, C., Li, X.-B., Yang, X., Song, Y., Wang, H., Qi, J., Wang, B., Wang, C., Wang, C., Wang, Z., Li, T., Zheng, E., Wang, S., Wu, C., Cai, M., Ye, C., Song, W., Cheng, P., Chen, D., Wang, X., Zhang, Z., Wang, X., Zheng, J., and Shao, M.: The formation and mitigation of nitrate pollution: comparison between urban and suburban environments, Atmos. Chem. Phys., 22, 4539–4556, https://doi.org/10.5194/acp-22-4539-2022, 2022.
Yuan, J., Modini, R. L., Zanatta, M., Herber, A. B., Müller, T., Wehner, B., Poulain, L., Tuch, T., Baltensperger, U., and Gysel-Beer, M.: Variability in the mass absorption cross section of black carbon (BC) aerosols is driven by BC internal mixing state at a central European background site (Melpitz, Germany) in winter, Atmos. Chem. Phys., 21, 635–655, https://doi.org/10.5194/acp-21-635-2021, 2021.
Yudovich, Y. E. and Ketris, M. P.: Chlorine in coal: A review, Int. J. Coal Geol., 67, 127–144, https://doi.org/10.1016/j.coal.2005.09.004, 2006.
Zhang, Q., Rami Alfarra, M., Worsnop, D. R., Allan, J. D., Coe, H., Canagaratna, M. R., and Jimenez, J. L.: Deconvolution and quantification of hydrocarbon-like and oxygenated organic aerosols based on aerosol mass spectrometry, Environ. Sci. Technol., 39, 4938–4952, https://doi.org/10.1021/es048568l, 2005.
Zhang, Q., Jimenez, J. L., Canagaratna, M. R., Ulbrich, I. M., Ng, N. L., Worsnop, D. R., and Sun, Y.: Understanding atmospheric organic aerosols via factor analysis of aerosol mass spectrometry: A review, Anal. Bioanal. Chem., 401, 3045–3067, https://doi.org/10.1007/s00216-011-5355-y, 2011.
Zhang, Y., Favez, O., Petit, J.-E., Canonaco, F., Truong, F., Bonnaire, N., Crenn, V., Amodeo, T., Prévôt, A. S. H., Sciare, J., Gros, V., and Albinet, A.: Six-year source apportionment of submicron organic aerosols from near-continuous highly time-resolved measurements at SIRTA (Paris area, France), Atmos. Chem. Phys., 19, 14755–14776, https://doi.org/10.5194/acp-19-14755-2019, 2019.
Zhang, Y. J., Tang, L. L., Wang, Z., Yu, H. X., Sun, Y. L., Liu, D., Qin, W., Canonaco, F., Prévôt, A. S. H., Zhang, H. L., and Zhou, H. C.: Insights into characteristics, sources, and evolution of submicron aerosols during harvest seasons in the Yangtze River delta region, China, Atmos. Chem. Phys., 15, 1331–1349, https://doi.org/10.5194/acp-15-1331-2015, 2015.
Zhu, Q., Huang, X.-F., Cao, L.-M., Wei, L.-T., Zhang, B., He, L.-Y., Elser, M., Canonaco, F., Slowik, J. G., Bozzetti, C., El-Haddad, I., and Prévôt, A. S. H.: Improved source apportionment of organic aerosols in complex urban air pollution using the multilinear engine (ME-2), Atmos. Meas. Tech., 11, 1049–1060, https://doi.org/10.5194/amt-11-1049-2018, 2018.