the Creative Commons Attribution 4.0 License.
the Creative Commons Attribution 4.0 License.
 | 20 Jun 2023
Revealing the chemical characteristics of Arctic low-level cloud residuals – in situ observations from a mountain site
Yvette Gramlich
Karolina Siegel
Sophie L. Haslett
Gabriel Freitas
Radovan Krejci
Paul Zieger
The role aerosol chemical composition plays in Arctic low-level cloud formation is still poorly understood. In this study we address this issue by combining in situ observations of the chemical characteristics of cloud residuals (dried liquid cloud droplets or ice crystals) and aerosol particles from the Zeppelin Observatory in Ny-Ålesund, Svalbard (approx. 480 m a.s.l.). These measurements were part of the 1-year-long Ny-Ålesund Aerosol and Cloud Experiment 2019–2020 (NASCENT). To obtain the chemical composition of cloud residuals at molecular level, we deployed a Filter Inlet for Gases and AEROsols coupled to a Chemical Ionization Mass Spectrometer (FIGAERO-CIMS) with iodide as the reagent ion behind a ground-based counterflow virtual impactor (GCVI). The station was enshrouded in clouds roughly 15 % of the time during NASCENT, out of which we analyzed 14 cloud events between December 2019 and December 2020. During the entire year, the composition of the cloud residuals shows contributions from oxygenated organic compounds, including organonitrates, and traces of the biomass burning tracer levoglucosan. In summer, methanesulfonic acid (MSA), an oxidation product of dimethyl sulfide (DMS), shows large contributions to the sampled mass, indicating marine natural sources of cloud condensation nuclei (CCN) and ice nucleating particle (INP) mass during the sunlit part of the year. In addition, we also find contributions of the inorganic acids nitric acid and sulfuric acid, with outstanding high absolute signals of sulfuric acid in one cloud residual sample in spring and one in late summer (21 May and 12 September 2020), probably caused by high anthropogenic sulfur emissions near the Barents Sea and Kara Sea. During one particular cloud event, on 18 May 2020, the air mass origin did not change before, during, or after the cloud. We therefore chose it as a case study to investigate cloud impact on aerosol physicochemical properties. We show that the overall chemical composition of the organic aerosol particles was similar before, during, and after the cloud, indicating that the particles had already undergone one or several cycles of cloud processing before being measured as residuals at the Zeppelin Observatory and/or that, on the timescales of the observed cloud event, cloud processing of the organic fraction can be neglected. Meanwhile, there were on average fewer particles but relatively more in the accumulation mode after the cloud. Comparing the signals of sulfur-containing compounds of cloud residuals with aerosols during cloud-free conditions, we find that sulfuric acid had a higher relative contribution to the cloud residuals than to aerosols during cloud-free conditions, but we did not observe an increase in particulate MSA due to the cloud. Overall, the chemical composition, especially of the organic fraction of the Arctic cloud residuals, reflected the overall composition of the general aerosol population well. Our results thus suggest that most aerosols can serve as seeds for low-level clouds in the Arctic.
- Article
(4307 KB) - Full-text XML
- Companion paper
-
Supplement
(2750 KB) - BibTeX
- EndNote


Aerosol particles interact with solar radiation either directly by light scattering and/or absorption or indirectly by acting as cloud seeds (Haywood and Boucher, 2000). On an annual scale, Arctic clouds have an overall warming effect on the surface (Shupe and Intrieri, 2004). The formation of a cloud particle requires the availability of sufficient water vapor and updraft to create supersaturated conditions and aerosol particles that provide a surface for the water vapor to condense onto. This subfraction of aerosol particles is termed cloud condensation nuclei (CCN) or ice nucleating particles (INPs). The physical and chemical properties of aerosols play an important role for describing aerosol–cloud interactions (Köhler, 1936; Seinfeld and Pandis, 2006). Better knowledge on their composition, especially of the subfraction activating as cloud droplets, helps to better constrain their effect in the warming Arctic, in addition to an improved understanding of their sources.
While in most of the regions on Earth water vapor is the limiting factor, in the Arctic the availability of aerosol particles able to act as CCN or INPs can be limited (Mauritsen et al., 2011). Due to this limit in aerosol number concentrations, aerosol particles in the Aitken mode (diameter <80 nm), even as small as 20 nm in diameter, are able to serve as CCN in the Arctic (Korhonen et al., 2008; Leaitch et al., 2016; Bulatovic et al., 2021; Pöhlker et al., 2021; Karlsson et al., 2021, 2022; Siegel et al., 2022).
Overall, the Arctic aerosol particle number, size, and composition follow a distinct annual cycle, where long-range atmospheric transport dominates the accumulation mode particles in winter and spring, and frequent new particle formation in the summer dominates the Aitken mode abundance. Fall is the cleanest season with the lowest particle number and mass concentrations, with only few accumulation mode particles (Tunved et al., 2013). Relatively speaking, the aerosol composition is mainly dominated by sea salt and long-range transport from lower latitudes in the winter, while organics of biogenic origin and sulfate are becoming increasingly important in late spring and summer (Moschos et al., 2022a). One specific phenomenon in the annual aerosol cycle is called “Arctic haze”, occurring in late winter and spring, when enhanced mass concentrations of aerosol particles mainly composed of long-range-transported sulfate, particulate organic matter, and heavy metals (but also black carbon, nitrate, ammonium and dust; Quinn et al., 2007) are observed. Among the natural sources, the ocean plays an important role. Aerosol particles emitted by sea spray can comprise sea salt and organic material from the sea surface microlayer (Cavalli et al., 2004; Kirpes et al., 2019). Sea salt is the largest contributor to particulate matter by mass across the Arctic. Its relative contribution to total particulate matter has been shown to be higher in the dark period compared to the bright season (Moschos et al., 2022a). In addition to open ocean, the origin of sea salt has been attributed to blowing snow, especially during the dark season at high wind speeds over sea ice, e.g. in the central Arctic (Huang and Jaeglé, 2017). Model simulations from a decade ago predicted the sea salt emissions to increase with less sea ice cover (Struthers et al., 2011). An increasing trend in sea spray emissions was found recently at the Arctic monitoring station Ny-Ålesund on Svalbard (Heslin-Rees et al., 2020); however, this trend was linked to changes in the circulation pattern rather than decreasing sea ice cover.
The organic fraction of Arctic aerosol is dominated by anthropogenic sources in winter, and natural emissions increase in importance in summer. The primary source region for wintertime anthropogenic aerosol is Eurasia (Moschos et al., 2022b). In summer, the growth of aerosol particles has been associated with the presence of methanesulfonic acid (MSA), produced from the oxidation of dimethylsulfide (DMS) released by marine phytoplankton, marine trimethylamine (N(CH3)3), and other organic compounds (Willis et al., 2016; Beck et al., 2021). The highest particulate MSA concentrations in Ny-Ålesund were found to occur in May or June, when phytoplankton biomass is active in the surrounding Greenland Sea and Barents Sea (Jang et al., 2021).
The presence of various particulate organic and sulfate-containing compounds was recently reported for the summertime Arctic Ocean using offline filter analysis (Siegel et al., 2021). These observations were among the first molecular-level measurements of semi-volatile aerosols from the high Arctic. Organic molecules with up to 18 carbon atoms were identified. The largest signal was observed for compounds with 5 to 10 carbon atoms and 3 to 4 oxygen atoms. Semi-volatile organics were found to be involved in aerosol particle growth during summer in the marine Arctic environment (Burkart et al., 2017).
Although new information about the chemical composition of Arctic aerosol is emerging, very little is known yet about the composition of Arctic cloud residuals (dried liquid cloud droplets or ice crystals), from which information on the chemical composition of CCN and INPs, aqueous-phase processing, or condensation of gaseous compounds (co-condensation; Topping and McFiggans, 2012; Topping et al., 2013) can be derived. Direct observations are scarce (Sect. S1 and Fig. S1 in the Supplement) and if available limited to intensive campaigns over just a couple of weeks; hence, there is no information on how the properties of cloud seeds change throughout the year (McFarquhar et al., 2011; Wendisch et al., 2019). Aircraft observations in spring 2008 near Utqiaġvik (formerly Barrow, Alaska, Indirect and Semi-Direct Aerosol Campaign (ISDAC)) showed that, compared to ambient aerosols, cloud residuals contained relatively less organics and more sea salt and black carbon (Hiranuma et al., 2013). However, no details on the organic molecular composition were reported. In addition, the cloud residuals were generally larger than the ambient aerosol particles (Zelenyuk et al., 2010; Hiranuma et al., 2013). In a case study during ISDAC, looking at the change in chemical composition of single particles at different altitudes in a cloud, enriched sulfate was observed in the cloud residuals compared to the aerosol population below the cloud (Zelenyuk et al., 2010). Wendisch et al. (2019) measured cloud residuals by aircraft over Svalbard during the transition from spring to summer (end of May until beginning of June in 2017). They observed trimethylamine and sulfate in the cloud residuals and, to a lesser extent, metals, organic carbon, and levoglucosan, a tracer for biomass burning. Higher levels of trimethylamine were found in cloud residuals sampled over sea ice compared to over open ocean and drift ice. One very recent study investigated the composition of cloud residuals in Ny-Ålesund based on 4 years of observations (Adachi et al., 2022). They focused on the fraction of sea salt, mineral dust, sulfate, K-bearing particles, and carbonaceous-material-containing particles; they found that the cloud residuals have the same composition as ambient aerosol particles at positive temperatures, while at negative temperatures the residuals contained more mineral dust and sea salt compared to the ambient aerosol, likely reflecting the good INP ability of mineral dust and sea spray.
To the best of our knowledge, this study presents the first molecular-level observations of the chemical composition of Arctic cloud residuals. We identify organic and inorganic compounds in cloud residuals in the Arctic region using in situ measurements from a chemical ionization high-resolution time-of-flight mass spectrometer (CIMS) coupled to a Filter Inlet for Gases and AEROsols (FIGAERO), referred to as the FIGAERO-CIMS, set up behind a ground-based counterflow virtual impactor (GCVI) for a full year at the Zeppelin Observatory, Ny-Ålesund, Svalbard (Platt et al., 2022). We investigate the changes in chemical composition of cloud residuals during different parts of the year and of the aerosol population before, during, and after one particular cloud event.
This section gives an overview of the instrumentation deployed during the 1-year-long Ny-Ålesund Aerosol and Cloud Experiment 2019–2020 (NASCENT) for this study and the data processing procedures used to determine the chemical characteristics of cloud residuals. Further information on the campaign and additional instrumentation used during NASCENT can be found in Pasquier et al. (2022).
2.1 NASCENT campaign
The data presented here were acquired during NASCENT. In brief, the aim of the campaign was to determine the physical and chemical properties of trace gases, aerosol, and cloud particles in high detail with state-of-the-art instrumentation over the course of a full year. During the campaign, measurements were conducted at different locations and altitudes near Ny-Ålesund, including the Zeppelin Observatory. In this study we only focus on the measurements conducted at the Zeppelin Observatory.
2.2 Zeppelin Observatory
The Zeppelin Observatory near Ny-Ålesund, Svalbard (78∘54′ N, 11∘53′ E), is one of a few permanent measurement stations in the Arctic. The observatory itself is located about 2 km south of the small research settlement in Ny-Ålesund, on Mt. Zeppelin at an altitude of 474 m a.s.l., and is equipped with instrumentation to continuously measure atmospheric trace gases, particles, and other atmospheric properties. The measurement station was established in 1989 and is now part of several monitoring programs as a global background station, e.g. the Global Atmosphere Watch Programme (GAW) (Platt et al., 2022). The remote location of the observatory is characterized by the 26 km long Kongsfjorden located towards the north and east and mountainous landscape with glaciers in the south and west. During the NASCENT year, low-level mixed-phase clouds were present in all seasons, covering between 20 % to around 40 % of the monthly cloud cases (Pasquier et al., 2022). The Zeppelin Observatory itself is frequently covered in clouds (between October 2019 and December 2020 about 15 % of the time), providing an ideal location to study the physicochemical properties of Arctic clouds and aerosol–cloud interactions.
2.3 Instrumental setup during NASCENT including GCVI
The instruments used in this study at the Zeppelin Observatory were connected through a three-way switching valve (Fig. 1) to a whole-air inlet during cloud-free conditions and to a GCVI (Brechtel Manufacturing Inc., USA, model 1205) inlet during cloudy conditions. The inlet height was approx. 480 m.a.s.l. With the whole-air inlet, both interstitial (non-activated) aerosol particles and cloud droplets µm were collected, whereas the GCVI inlet only sampled cloud droplets and ice crystals >6 to 7 µm (aerodynamic diameter). With our setup, we cannot state how large the fractions of droplets and ice crystals were. The only available instrumentation to differentiate between a mixed-phase, liquid or ice cloud is the cloud radar. In brief, the working principle of the GCVI is as follows: within a wind tunnel, the cloud particles are accelerated onto the GCVI tip, where an opposing air flow (counterflow) is generated such that only those particles with high enough inertia make it into the sampling flow, thereby removing the interstitial aerosol and particles <6–7 µm (Ogren et al., 1985; Noone et al., 1988). This lower cutoff size of the GCVI was achieved by keeping the counterflow always 1 L higher than the sampling flow, 16 and 15 L min−1, respectively. Regular zero checks were done during operation where the counterflow was set close to 0 L min−1 during cloud-free conditions to ensure that the flow control operates well. The quality of the counterflow was also routinely tested by switching off the wind tunnel and only sampling counterflow through the sample line. A more detailed description and evaluation of the inlet system, the GCVI, and additional instrumentation used to characterize microphysical aerosol and cloud residual properties are available in a previous study (Karlsson et al., 2021).
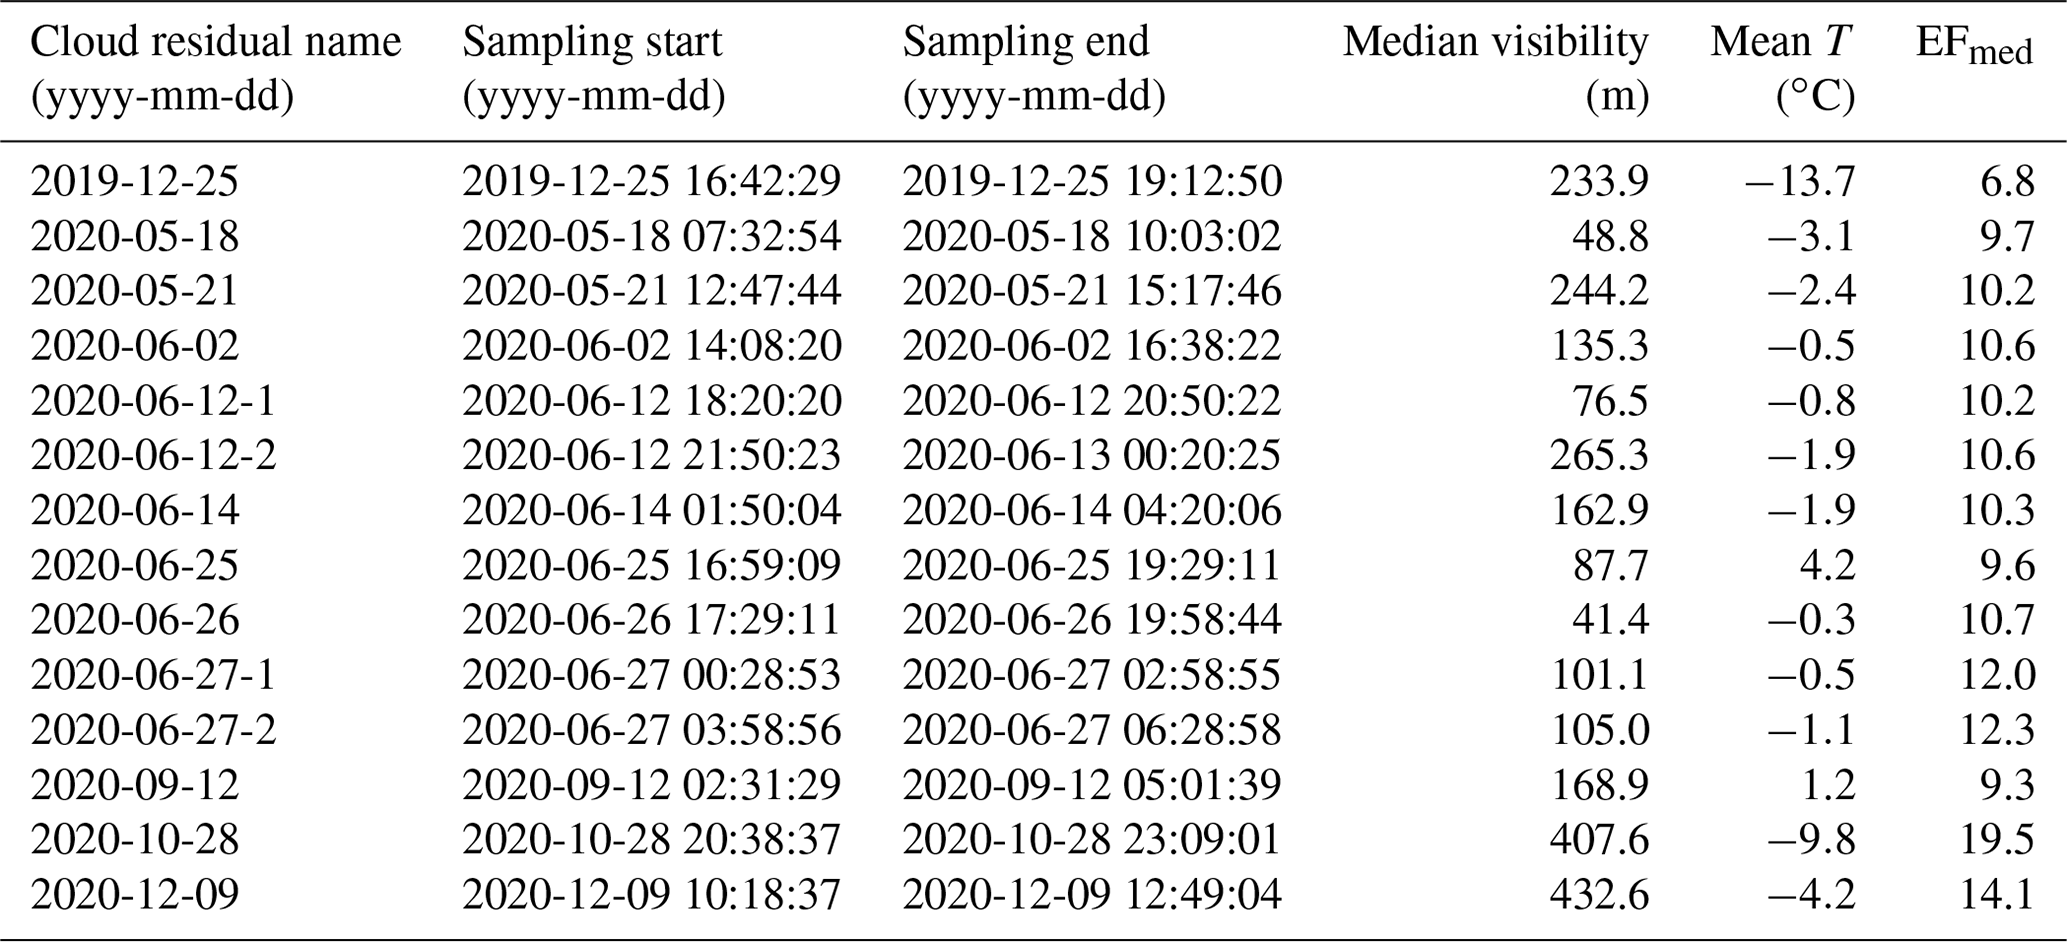
The number of cloud particles sampled with the GCVI is higher compared to the actual ambient cloud particle concentration. This enrichment of particles can be corrected for by calculating an enrichment factor (EF), which is determined by the settings of the GCVI (sampling flow and airspeed in the wind tunnel) and its geometry (Shingler et al., 2012). We used the median EF (EFmed) of the respective sample to correct the DMPS1 (differential mobility particle sizer) data during times when we sampled cloud residuals. For the entire dataset discussed here, the EFmed was in the range of 6.8 and 19.5 (mean 11.1, median 10.5, Table 1).
In addition, a sampling efficiency (eff) needs to be determined for particle number concentrations sampled behind the GCVI. The eff depends on the cloud particle number size distribution and has been experimentally calculated for our site to be 0.46 (Karlsson et al., 2021).
During the NASCENT campaign, the GCVI was partly operated in manual mode and partly in automatic mode. Manual mode means that the GCVI was manually turned on in the presence of a cloud. As an indication of cloudy conditions, the visibility sensor (Belfort, model 6400) that comes with the GCVI was used. Similar to Karlsson et al. (2021), we used a visibility threshold of 1000 m, where visibility below this threshold meant presence of a cloud according to the World Meteorological Organization's definition of fog (World Meteorological Organization, 2018). In automatic mode, the GCVI was automatically turned on whenever the visibility at the observatory was equal or less than 1000 m.
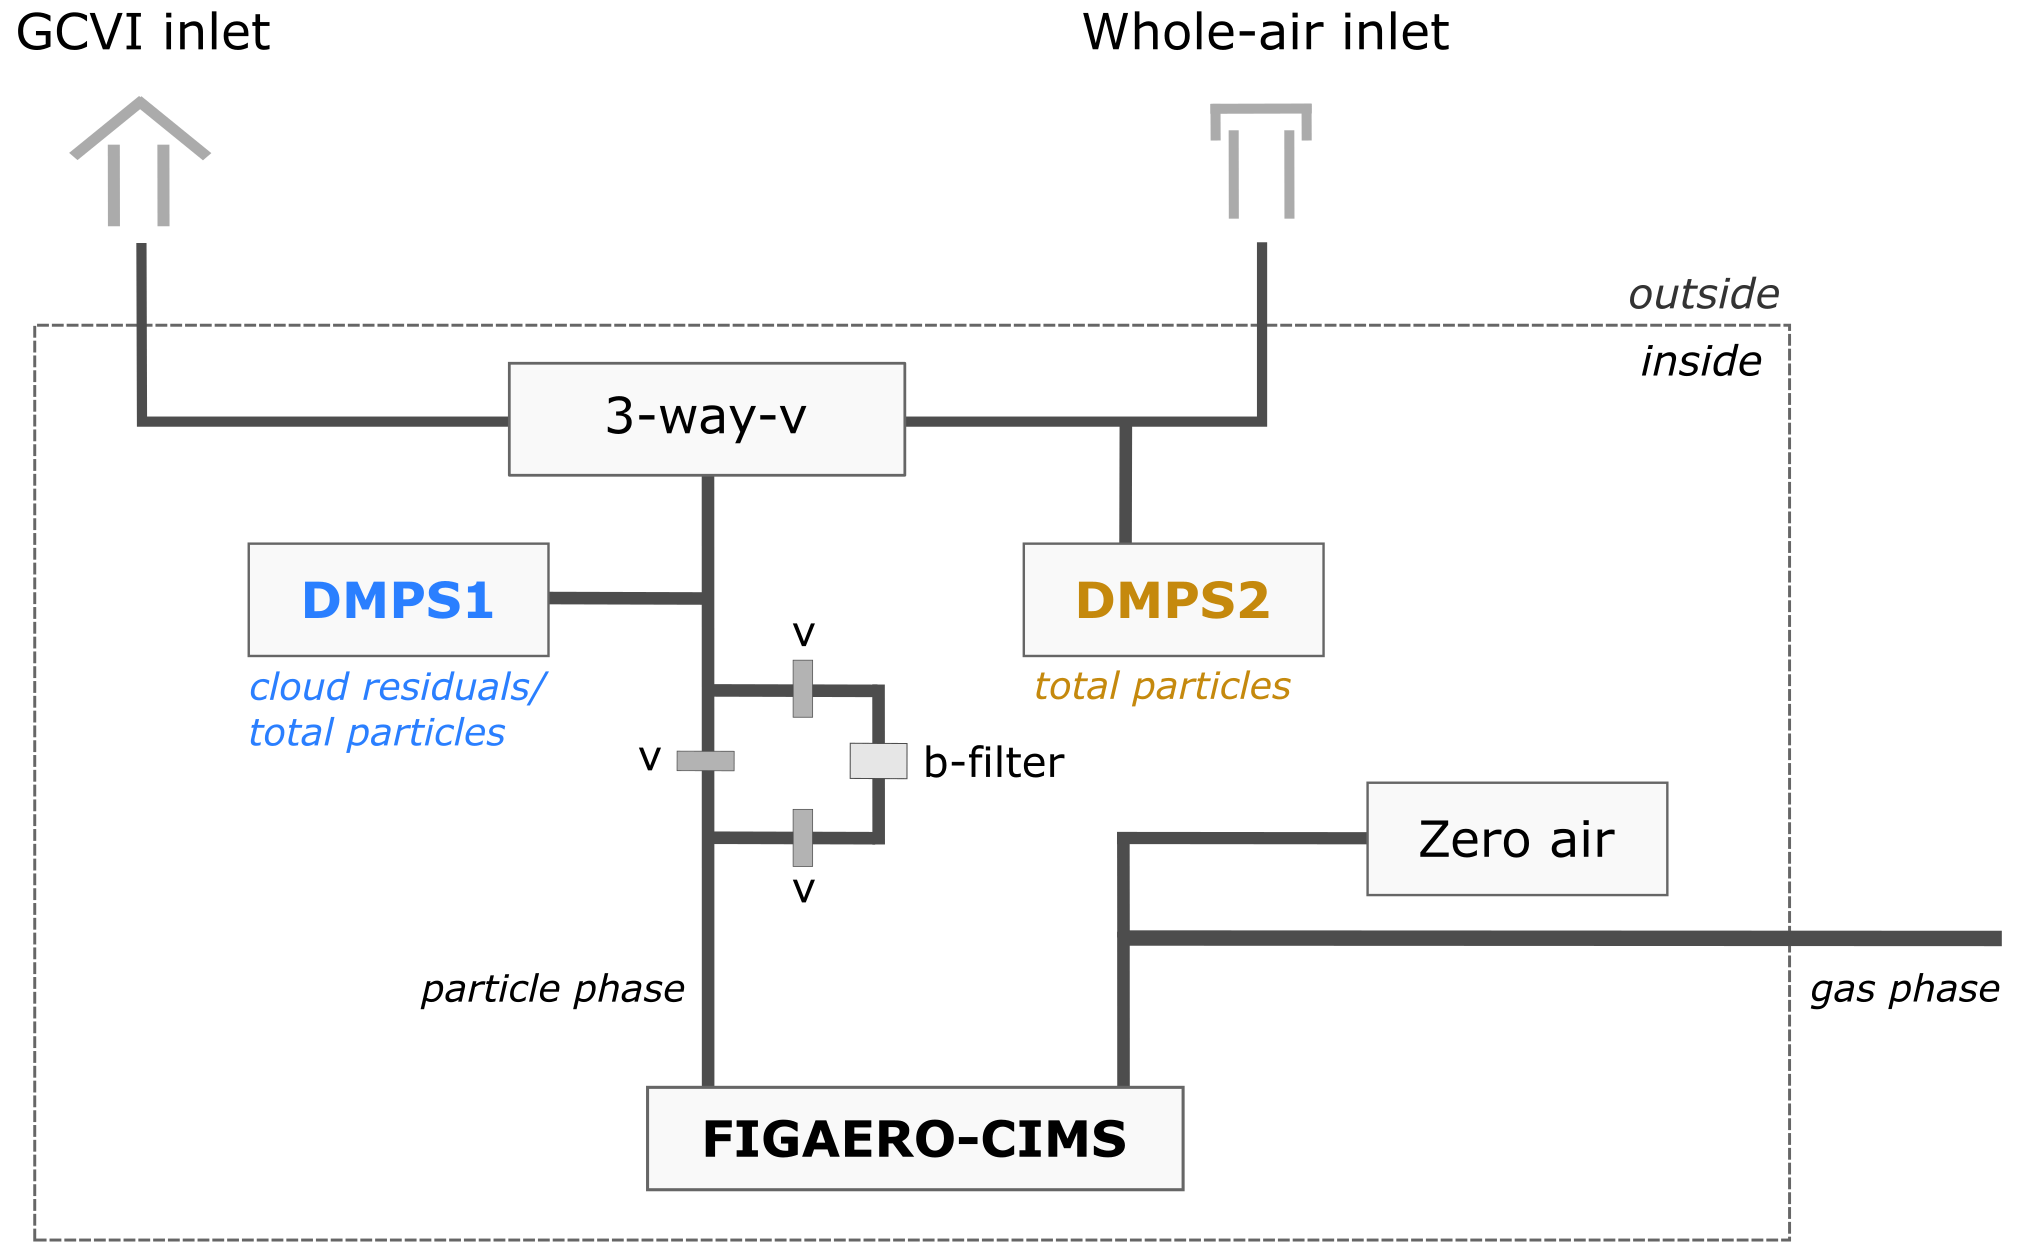
Figure 1Setup of the FIGAERO-CIMS and the DMPS at the Zeppelin Observatory. A three-way valve (3-way-v) defines the type of particles sampled. With the whole-air inlet, all particles (referred to as total particles, i.e. both aerosol particles and cloud particles) are sampled, whereas the GCVI inlet only samples cloud particles. Upstream of the FIGAERO-CIMS particle-phase inlet, a second filter (b-filter) was in place to perform regular particle-phase blanks. DMPS2 consists of two separate DMPS systems measuring partly overlapping size ranges. These two size ranges have been harmonized to one dataset in this study. Modified version of Fig. 1 from Karlsson et al. (2021), where DMPS2 consists of DMPS 2a and DMPS 2b.
2.4 FIGAERO-CIMS
The chemical composition of cloud residuals at molecular level was obtained from a FIGAERO-CIMS (Aerodyne Research Inc., USA) (Lopez-Hilfiker et al., 2014; Thornton et al., 2020) using iodide (I−) as reagent ion. The FIGAERO-CIMS was installed in October 2019, and data are available almost continuously from November 2019 until December 2020, with a larger gap in July and August 2020.
The FIGAERO-CIMS was installed inside one of the rooms at the Zeppelin Observatory and connected to two separate inlet lines (Fig. 1). The particle-phase inlet was connected via -inch stainless-steel tubing to the three-way valve of the main inlet, switching between the whole-air inlet and the GCVI inlet. The gas-phase inlet was connected via -inch polytetrafluoroethylene (PTFE) tubing to ambient air directly through a hole in the wall.
The FIGAERO automatically cycled between its two modes: gas-phase analysis with simultaneous particle deposition and thermal desorption and analysis of the deposited particulate matter. These two modes are hereafter referred to as the sampling and heating periods, respectively. The sampling period with simultaneous particle deposition was 2.5 h. The particles were sampled with a flow of 4 L min−1. During the gas-phase measurements, zero air was introduced every 40 min for 15 min to obtain the gas-phase background signal.
After the sampling period, the particle-laden filter was automatically moved to the desorption position. A 2 L min−1 flow of heated ultrapure nitrogen (from a nitrogen generator, Peak Scientific NG5000) was passed through the filter to thermally desorb the particles. This heating period was divided into three phases of 20 min each: ramping, soaking, and cooling. During ramping, the temperature of the nitrogen flow passing through the filter was gradually increased from room temperature to approx. 200 ∘C. During the soaking phase, the heated nitrogen flow was held at this temperature to ensure complete evaporation of the deposited material. During the cooling phase, the nitrogen flow was cooled back down to room temperature. The signals obtained during the heating procedure (start of the ramping until end of the soaking) are hereafter referred to as thermograms. Particle-phase background samples, also called blanks, were collected using a filter upstream of the sampling filter (Fig. 1). Automatically switching valves allowed sample air to either bypass or pass through the zeroing filter (blank). Every third sampling period was a blank.
The FIGAERO-CIMS data were acquired at 1 s time resolution until February 2020 and at 2 s until the end of the campaign, pre-averaged to 30 s for analysis. To account for the instrument's sensitivity on the water vapor pressure in the ion–molecule reaction region, the data were normalized to the signal sum of iodide (I−; mass-to-charge ratio (): 126.905) and the iodide–water cluster (H2OI−; : 144.916) (Lee et al., 2014). Since dry nitrogen (N2) is used to vaporize the particulate compounds during the heating period, accounting for the iodide–water cluster signal is not relevant for the particle-phase data. Using iodide as reagent ion allows for mainly the detection of polar and oxygenated compounds (e.g. carboxylic acids), of which we can obtain the molecular composition up to an of around 600 Th (thomson) (Lee et al., 2014).
Since the cloud residual samples and blanks of this study were distributed over the entire year with long periods of cloud-free conditions and/or instrumental breaks in between, we treated the signals as if they were offline filter samples following the procedures detailed by Cai et al. (2023). In order to take varying instrument backgrounds into account, for each compound, the signal of the blank thermogram was scaled by the signal ratio of blank and corresponding sample thermogram at the end of the soaking period (last 3–6 data points/last ∼1.5 to 3 min, Method 2b in Cai et al. (2023), Sect. S2, Fig. S2). After this step, the thermograms of the sample and the scaled blank were integrated from the beginning of the ramping period until the end of the soaking period. To obtain the total signal, the integrated thermogram signal from the scaled blank was subtracted from the integrated thermogram signal of the sample. The integration of the thermograms resulted in the total number of detected ions, which is also the unit of the data reported here.
To obtain the ambient aerosol composition (sampled via the whole-air inlet) of the two samples before and after the cloud for the case study of 18 May 2020, we used the neighboring ambient blank and subtracted the integrated thermogram blank from the integrated thermogram sample. We did not use the scaling approach here, as the instrument background of neighboring heating periods usually does not differ substantially.
Table 1Cloud residual samples and the respective sampling start and end dates and times (in UTC) of the FIGAERO-CIMS collection period, as well as corresponding median visibility, mean temperature (T), and median enrichment factor (EFmed) during the sampling time.
2.5 DMPS
The particle number size distribution at the Zeppelin Observatory is continuously measured with a differential mobility particle sizer (DMPS) since 2000 (Ström et al., 2003; Tunved et al., 2013). In total there are three DMPS systems installed at the observatory: one, similar to the FIGAERO-CIMS, behind a three-way valve switching between the whole-air and GCVI inlets (DMPS1, installed in November 2015) and two behind the whole-air inlet. The two DMPS systems behind the whole-air inlet measure partly overlapping size ranges, which is why the data of these two were harmonized and are used hereafter as one size range (DMPS2, Fig. 1). DMPS1 measured cloud residuals during cloudy conditions (when the GCVI was on) and ambient aerosol during cloud-free conditions (when the GCVI was off) in the size range of 10 to 945 nm. DMPS2 measured all ambient particles in the size range of 5 to 708 nm. More technical specifications of both DMPS systems can be found in Karlsson et al. (2021).
All the cloud residual number size distributions in this study were corrected by a factor k (Eq. 1), which is the inverse of the product of the sampling efficiency and the enrichment factor of the GCVI (see Sect. 2.3). No other particle loss calculations were applied. The data for the number size distributions of some samples were filtered for potential droplet splashing according to the procedure described in the Supplement (Sect. S3).
For the conversion from number to mass concentrations, we used a density of 1.3 g cm−3, representing secondary organic aerosol (e.g. Alfarra et al., 2006; Malloy et al., 2009). The mass-based measurements (e.g. FIGAERO-CIMS) were not corrected by k, as we only show relative changes when comparing in-cloud with out-of-cloud conditions and no ambient concentrations when comparing the cloud residual samples. All given sizes in this study refer to the diameter (D).
2.6 Back trajectories, meteorological data, and cloud target classification
Air mass back trajectories were obtained using HYSPLIT (Stein et al., 2015), starting at 474 m a.s.l. at the Zeppelin Observatory (3-hourly archive data from the Global Data Assimilation System (GDAS), operated by the National Centers for Environmental Prediction (NCEP), 1∘ horizontal grid resolution). The back trajectories were calculated for 10 d, out of which the most recent 5 d was used here. Data within and above the boundary layer were used. The hourly temperature (T) and relative humidity (RH) data were downloaded from EBAS (https://ebas-data.nilu.no, last access: 12 August 2021). The cloud target classification for Ny-Ålesund (Nomokonova et al., 2019) was taken from Cloudnet (https://cloudnet.fmi.fi/, last access: 24 November 2022).
2.7 Definition of cloud residuals and selection of samples
In analogy to the previous study by Karlsson et al. (2021), we here define cloud residuals operationally as the particles remaining after drying the cloud droplets and ice crystals collected with the GCVI. This is to clarify that with our instrumental setup we do not measure CCN or INPs directly. Even though cloud residuals are often termed as CCN or INPs in the literature, this is not entirely correct, as coalescence or chemical reactions may occur inside the cloud particles and thereby modify the original cloud nuclei (Twohy and Anderson, 2008).
As mentioned above (Sect. 2.3), the GCVI was not operated automatically throughout the entire duration of the campaign. As a consequence, there are times when the visibility at the observatory was above 1000 m, but the GCVI was still on.
Following from the above, we selected the FIGAERO-CIMS cloud residual samples according to the following criteria:
-
The inlet was set to GCVI during the entire 2.5 h sampling time of the FIGAERO-CIMS, and GCVI flows were fully operational for at least 95 % of the sampling time.
-
The median visibility during the 2.5 h sampling time was below 1000 m.
Following these criteria, we are left with in total 14 cloud residual samples and 10 cloud residual blanks from the NASCENT campaign. An overview of the cloud residual samples and the respective ambient conditions during the sampling times are listed in Table 1.
3.1 Seasonal distribution of cloud residuals characterized by FIGAERO-CIMS
Figure 2 shows the monthly number of cloud residual samples and related blanks measured with the FIGAERO-CIMS during NASCENT, as well as the corresponding monthly total number of hours with visibility below 1000 m, ambient temperature, and RH. The monthly average temperature during the year-long campaign was lowest in March (−19 ∘C) and highest in July (7 ∘C) (Fig. 2a). Based on the temperature, most of our cloud residual samples are probably originating from mixed-phase clouds. Compared to the meteorological average (1994–2018), the winter months of NASCENT were around 6 K colder, and the summer slightly warmer (around 2 K) (Pasquier et al., 2022). Monthly average RH was lowest in December 2019 and January 2020 (67 %) and highest in June and July (91 %, Fig. 2b).
Overall, the cloud occurrence at the measurement station was higher from February to September than during the winter months, as observed previously (Chernokulsky et al., 2017; Dekhtyareva et al., 2018; Gierens et al., 2020). March and June were the 2 months with the most hours of cloudy conditions at the observatory (Fig. 2c). Unfortunately, during that period, the GCVI was run mostly in manual mode and therefore not always following the visibility threshold criterion. The sampling time with the GCVI inlet was highest in June, resulting in total eight cloud residual samples and six blanks. In May we collected two samples and two blanks, and in September we collected only one cloud residual sample and one blank. During October 2020 and December 2019 and 2020, we could only measure one cloud residual sample in each month. Although the haze season (March–May) showed cloudy conditions (19 % of time), we did not measure cloud residual samples in this period due to problems with the instrumentation (in only 15 % of the cloudy conditions the GCVI was on).
In the following, we will focus first on the number size distribution of ambient and cloud particles during NASCENT before we discuss their chemical composition in more detail.
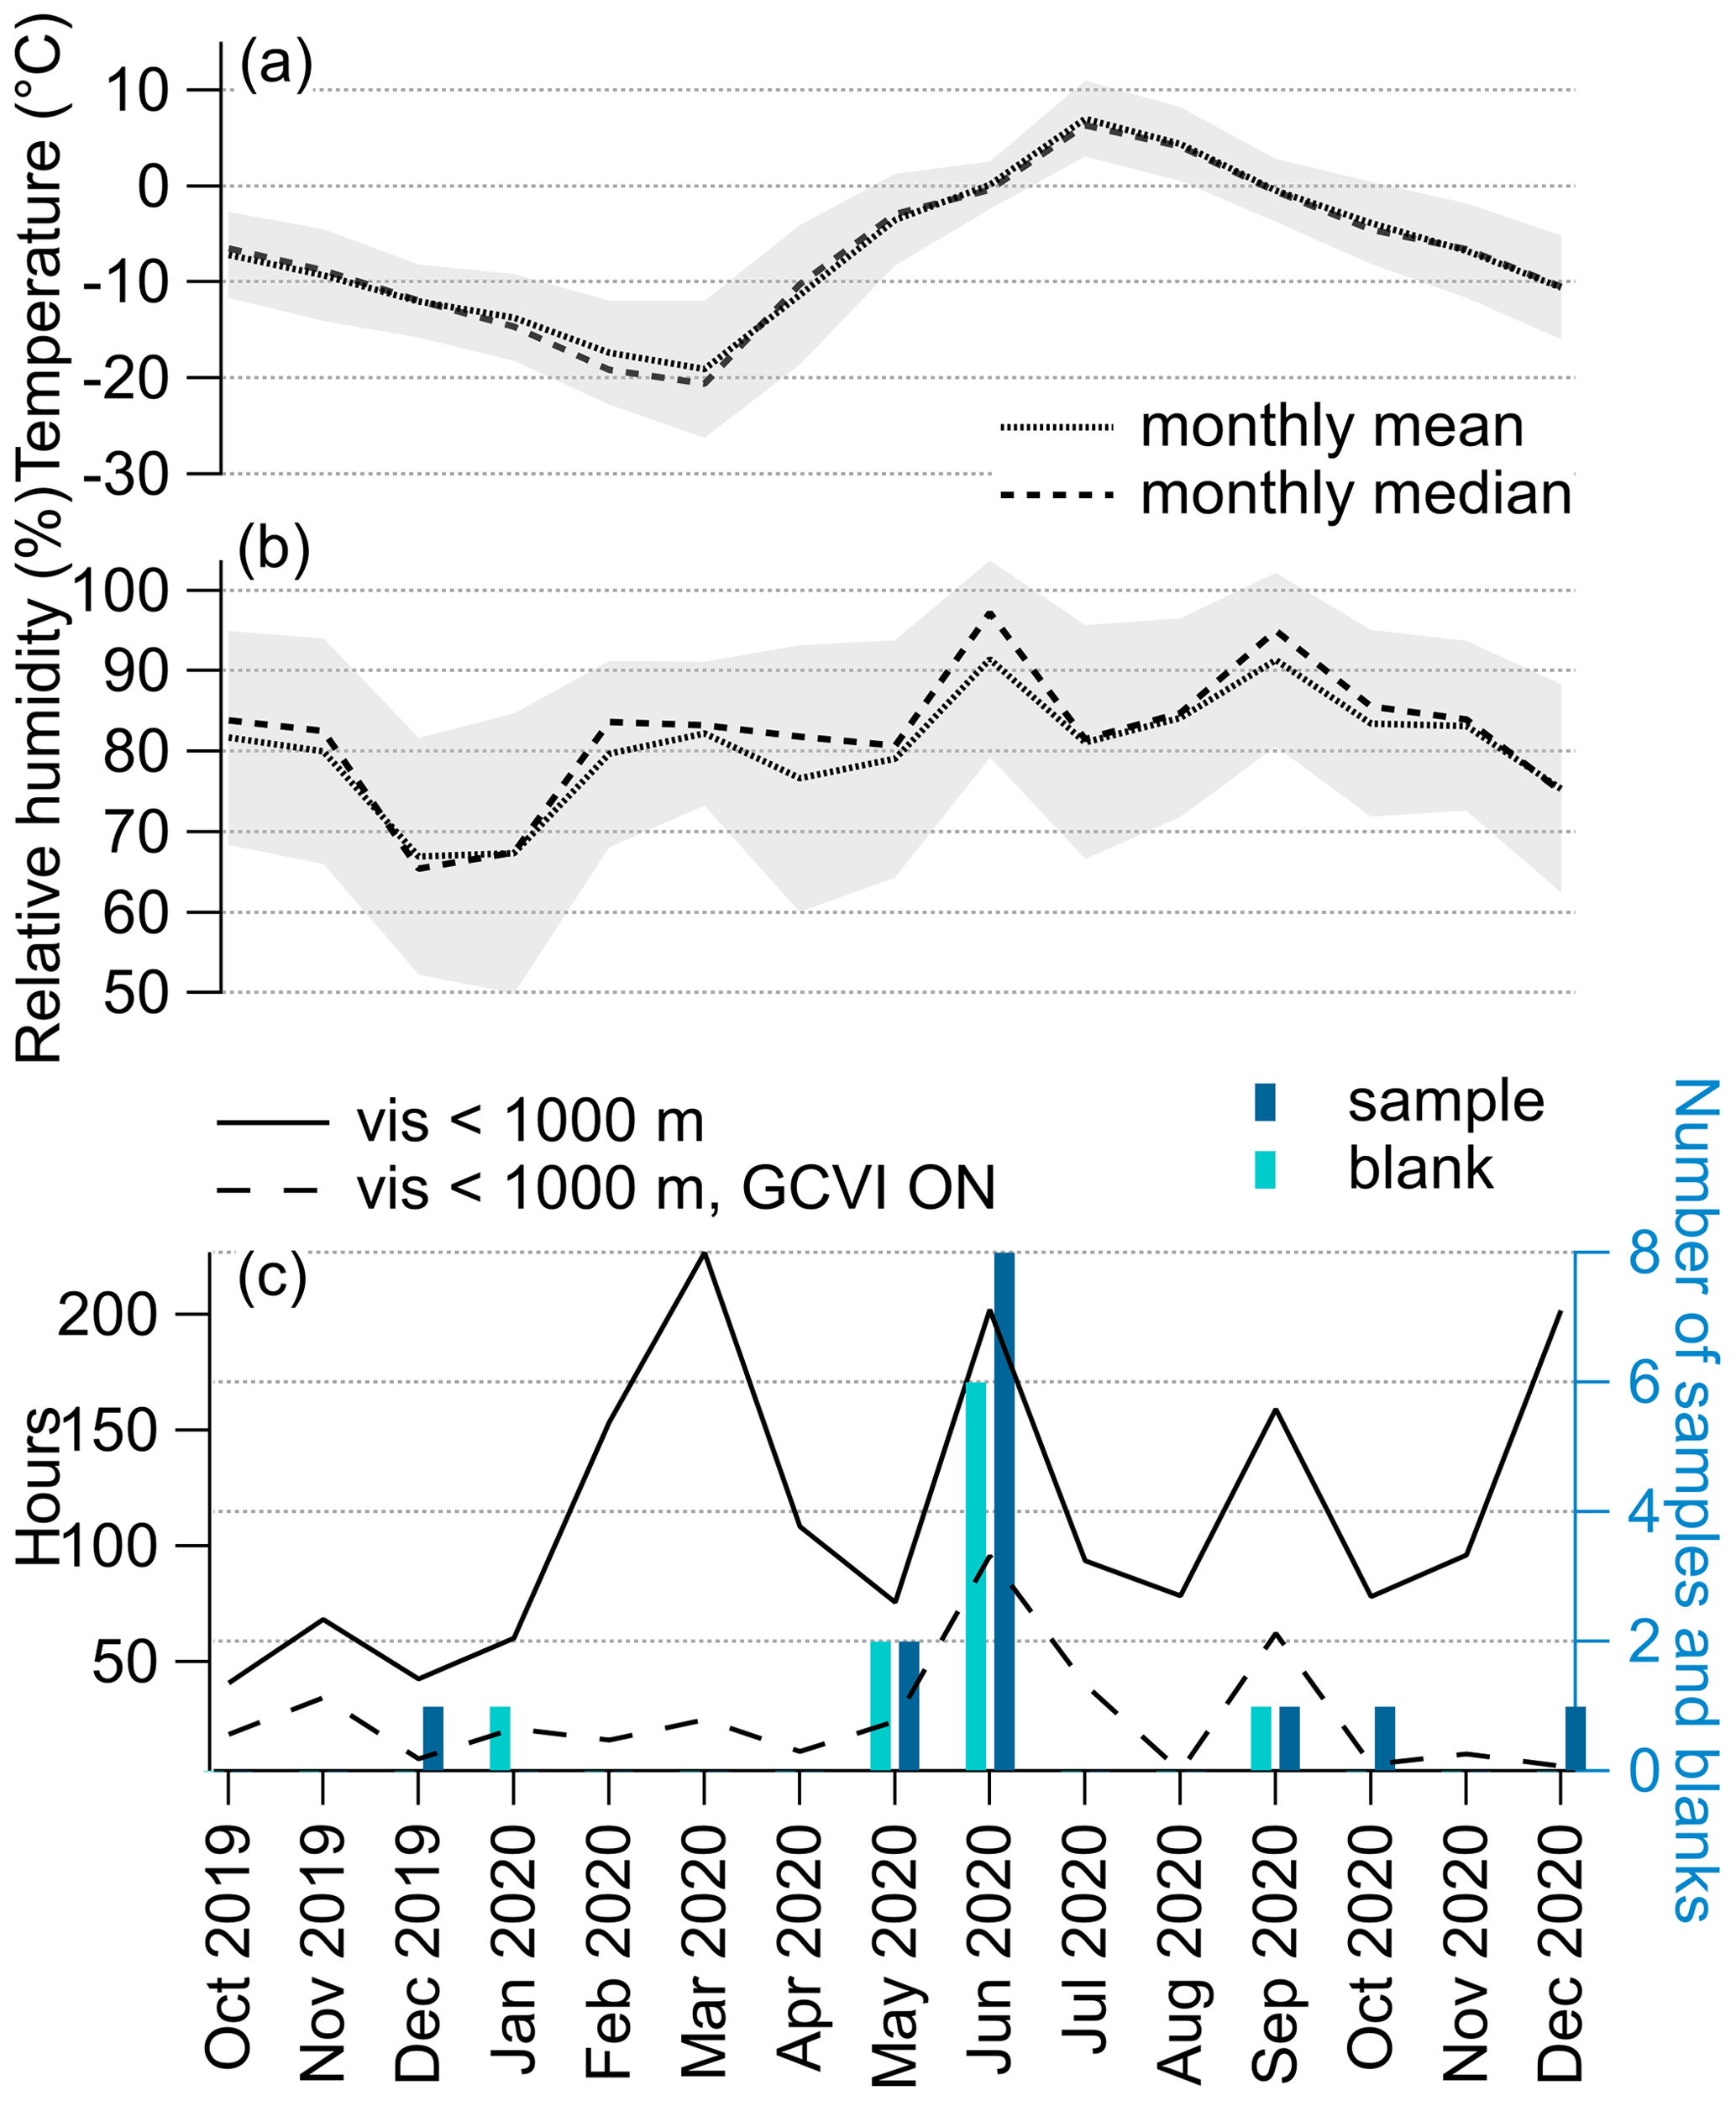
Figure 2Atmospheric conditions during the entire year of NASCENT measurement and number of cloud residual samples. (a) Monthly mean and median temperature; (b) monthly mean and median relative humidity. The shaded grey area represents the standard deviation. (c) Monthly total hours of visibility below 1000 m for at least 5 min (solid line) and corresponding total hours of sampling with the GCVI inlet (GCVI ON, dashed line), as well as the number of FIGAERO-CIMS cloud residual samples (sample) and blanks (blank) collected in the individual months.
3.2 Number size distributions of cloud residuals during NASCENT
Karlsson et al. (2021) analyzed 2 years of cloud residuals and corresponding total particle (cloud residuals and non-activated particles) sizes and number concentrations at the Zeppelin Observatory. They found that cloud residuals and aerosol particles have a similar annual cycle with respect to number, with highest concentrations in spring and summer and a minimum in fall and winter. In the winter months (December–February), they observed a dominating fraction of Aitken mode particles (D<80 nm) in the cloud residuals, while during Arctic haze until summer (April–June) the cloud residuals were most frequently found in the accumulation mode. Cloud residual sizes down to 20–30 nm were observed throughout all seasons. For liquid clouds, smaller cloud residual sizes occurred at lower total particle numbers.
To illustrate how both the number and the size of the cloud residuals and the total particles behave for our cloud cases, we show the number size distributions of cloud residuals and total particles for a cloud case of winter, spring, summer, and late fall (Fig. 3). In agreement with Karlsson et al. (2021), we observe more aerosol particles and cloud residuals in the spring and summer and fewer in winter and fall. Also, the ambient aerosol size distributions largely follow the findings from a previous long-term study on ambient aerosol number size distributions at this site (Tunved et al., 2013) with a dominating accumulation mode in winter and fall and a shift to more Aitken-mode-dominated distributions in summer. The number size distributions for the cloud residuals agree with Karlsson et al. (2021) to some extent: they agree insofar that they both show accumulation mode cloud residuals dominating in spring (144 nm on 18 May 2020) and Aitken mode cloud residuals dominating in winter (18 nm on 25 December 2020). In summer and late fall, our cloud residuals show a peak in the Aitken mode (56 nm on 12-1 June 2020 and plateau from around 66 to 144 nm in late fall), while Karlsson et al. (2021) show that cloud residuals in these seasons are more dominated by accumulation mode particles. However, the cloud residuals in our study also exhibit a peak in the accumulation mode in summer, with lower number concentrations compared to the Aitken mode.
As we only focus on a few cloudy events throughout an entire year, deviations from the seasonal pattern of particle number and size are expected. This can be illustrated in the case of the cloud event on 27 June 2020 (samples 27-1 and 27-2 June, Sect. S3, Fig. S3), where the ambient average particle number concentrations (46 cm−3) are much lower compared to typical conditions during this time of the year (Ström et al., 2003; Tunved et al., 2013; Karlsson et al., 2021). The visibility was below 1000 m for several hours before we sampled the two cloud residual samples, and the low aerosol number concentrations are most likely a result of cloud scavenging.
For most of the cloud samples, the average number of cloud residuals per size bin is smaller than the total number of particles measured at the same time in the same size bin (Sect. S3, Fig. S3). This is largely expected, since the number of cloud residuals is just a fraction of the number of total particles. However, for three cloud residual samples (27-1, 25 June, and 12 September 2020), we observe on average more Aitken mode particles (14–16 nm) in the cloud residuals than the average total particles. It is possible that this behavior is a sampling artifact from the GCVI. Karlsson et al. (2021) have discussed potential artifacts in the cloud residuals due to shattering of ice crystals when hitting the tip of the GCVI, mainly during the winter months when the fraction of ice crystals exceeds the number of liquid droplets. Our sample from 25 December 2019 (T: −13.7 ∘C) can be grouped into this category. In the 27-1, 25 June, and 12 September 2020 samples, the temperature was between −0.5 and 4.2∘C, and the sampled clouds were composed of mostly liquid droplets but contained some ice as well (Sect. S3, Fig. S4). In analogy to ice crystal shattering, it can be possible that the enhanced number of cloud residuals with a peak below 20 nm arises from splashing drizzle droplets within the funnel of the GCVI wind tunnel. Other possible reasons could be that in the dry counterflow air, hygroscopic particles shrink to sizes much smaller than they have at ambient high humidity conditions, the capture of smaller particles by larger particles due to the wake effect (Pekour and Cziczo, 2011), or entrainment of drier air (Targino et al., 2007). Based on the target classification on all three days, it is likely that there was drizzle present (Sect. S3, Fig. S4).
These potential artifacts are of negligible relevance for the discussion of the chemical composition of the cloud residuals following below, as their contribution to the bulk mass and hence bulk chemical composition measured by the FIGAERO-CIMS is small (Sect. S3, Fig. S5). Moreover, in the case of droplet splashing, only the size of the cloud residuals is affected and not the chemical composition, as the material of the splashing droplets would remain in the cloud residuals when the cloud droplets evaporate.
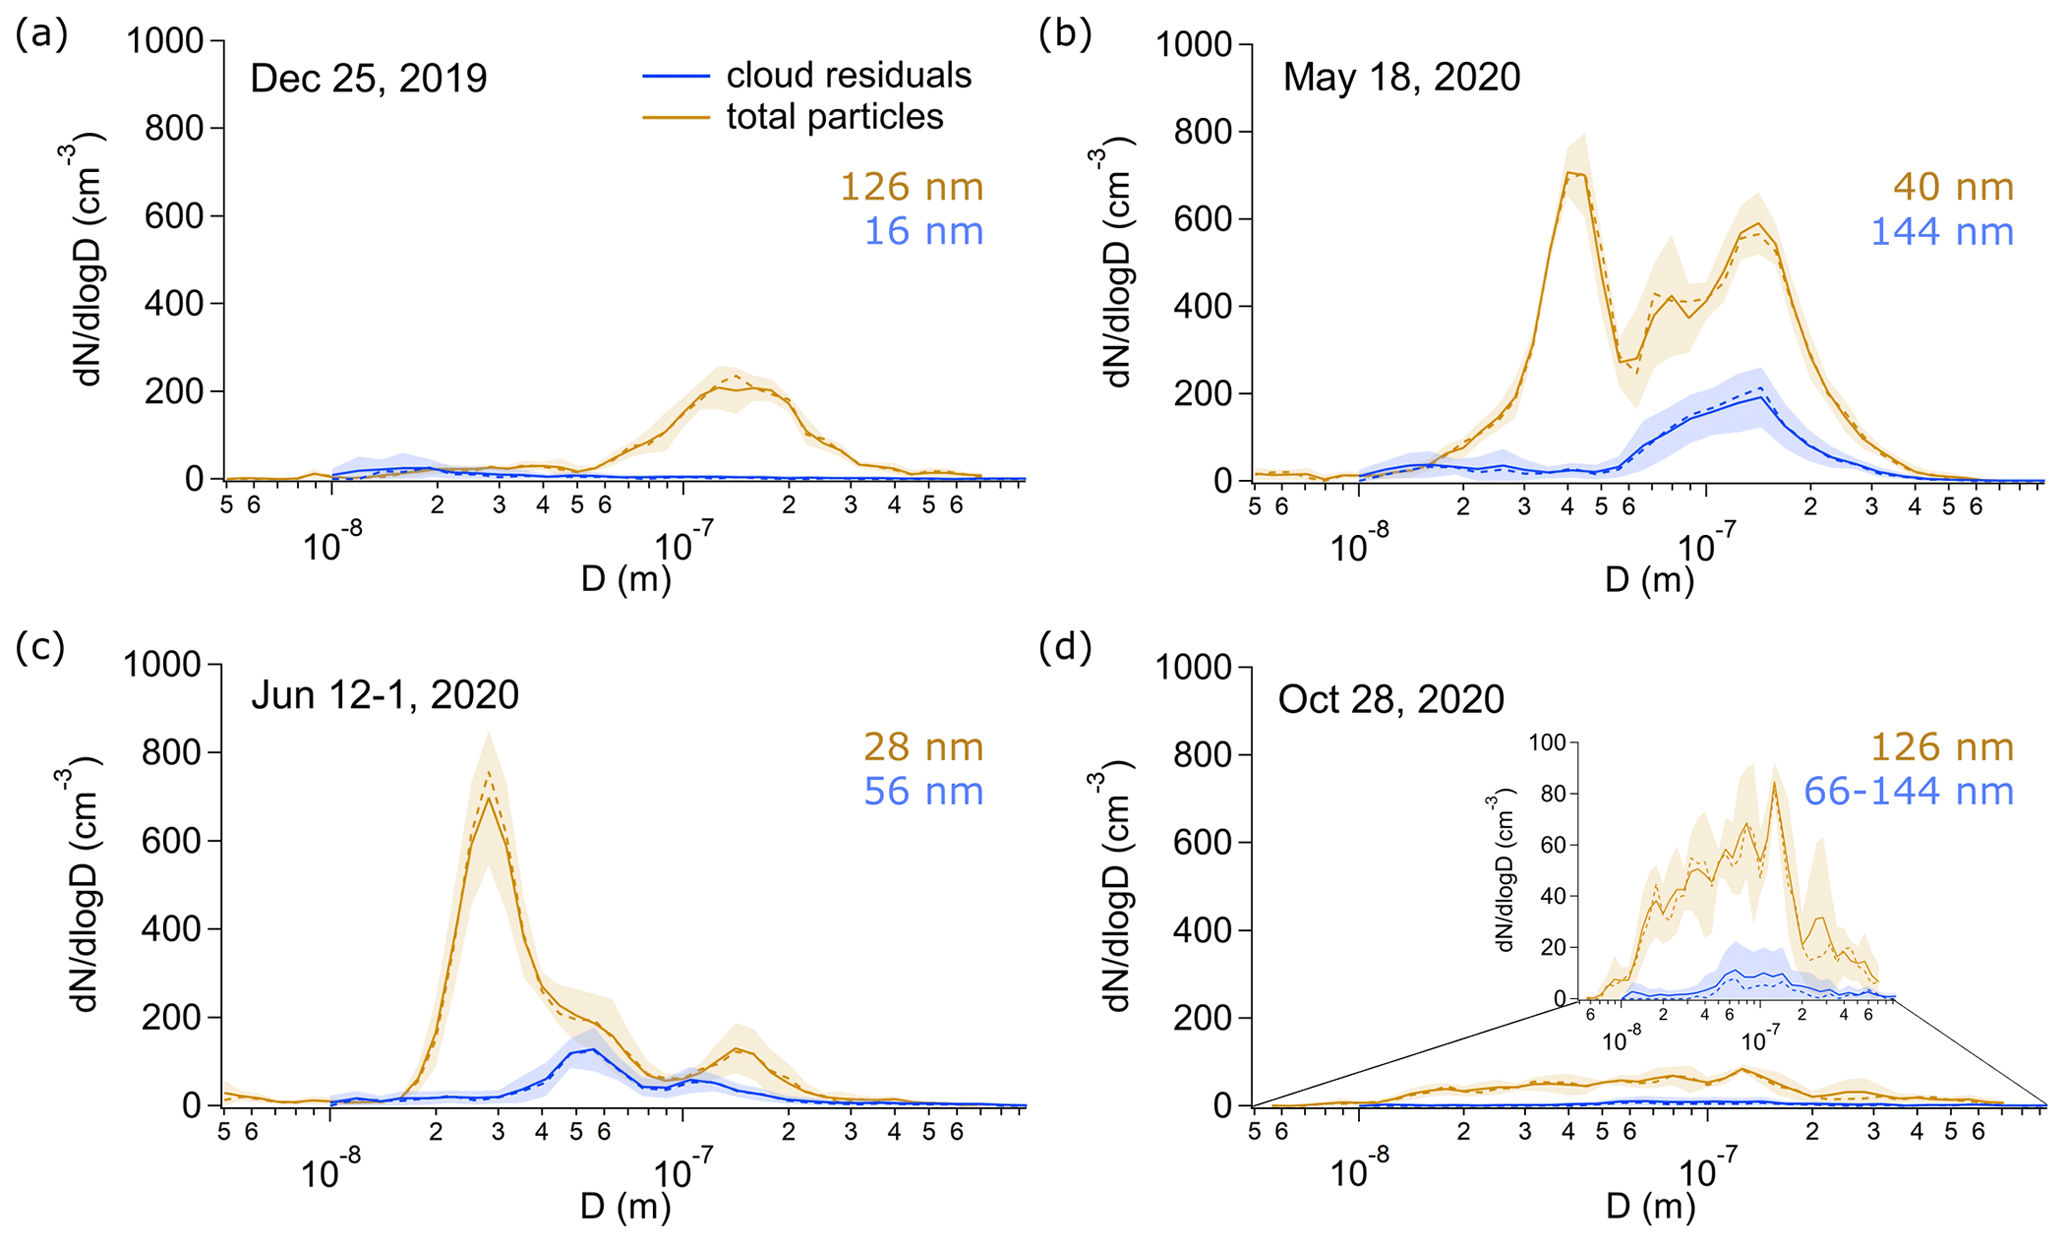
Figure 3Average number size distributions of cloud residuals and total particles during the corresponding 2.5 h FIGAERO-CIMS sampling time of (a) 25 December 2019 (winter), (a) 18 May 2020 (spring), (c) 12-1 June 2020 (summer), and (d) 28 October 2020 (late fall). The insert in (d) shows the number size distributions of cloud residuals and total particles with the y axis adjusted such that the shapes of the distributions are visible. The solid and dashed lines represent the mean and median, respectively. The shaded areas are the standard deviations. The orange and blue numbers show the peak in the particle number size distribution of the total particles and the cloud residuals, respectively.
3.3 Chemical characteristics of cloud residuals
In the following, we discuss the chemical composition of the cloud residuals of the 14 cloud events measured during the year-long NASCENT campaign with the FIGAERO-CIMS behind the GCVI as a function of season, as well as in relationship to the composition of the total particle population. With the FIGAERO-CIMS using iodide as reagent ion, we were able to identify the molecular composition of in total 1558 different compounds. These include inorganic compounds, and organic compounds following the formula IhCiHjOkY (Y = {N, S, Cl, Br, Si}), where h is the number of iodide atoms; i the number of carbon atoms; j the number of hydrogen atoms; k the number of oxygen atoms; and l the number of either nitrogen, sulfur, chlorine, bromine or silicon atoms. In total 1094 of the detected compounds were clustered with iodide (h=1–3).
The observed compounds can be grouped as follows based on their composition: ICHO (h=1, i>0, j>0, k>0), CHO (h=0, i>0, j>0, k>0), ICHON (h=1, i>0, j>0, k>0, Y = N, l=1), ICHOS (h=1, i>0, j>0, k>0, Y = S, l=1), I2CHO (h=2, i>0, j>0, k>0), I3CHO (h=3, i>0, j>0, k>0), and “others”. A subgroup of ICHO and CHO are likely fatty acids (FA), with h<2, , , representing a natural origin as they can be released into the atmosphere via sea spray emissions (Mashayekhy Rad et al., 2018). Levoglucosan (IC6H10O, a tracer for biomass burning, is part of the ICHO group. We exclude formic acid (ICH2O from the following analyses due to interference from the gas phase (Sect. S4, Fig. S7). From the ICHON group, we exclude IC6H15O7N−. It is unclear where this compound is originating from, but since it shows a very high signal in the cloud residual blanks, we attribute it to a background signal. For the ICHOS group, our focus hereafter lies on MSA (detected as ICH4O3S−, with a clear signal above background, Sect. S2, Fig. S2). In the “others” group, we include the inorganic compounds sulfuric acid (SA, detected as IH2SO) and nitric acid (NA, detected as IHNO), as well as organic compounds clustered with more than one iodide ion, I2CHO and I3CHO, the identification of the molecular formula of which was not straightforward.
To illustrate the difference in the molecular composition of the cloud residuals observed during the different seasons of NASCENT, we present a mass spectrum from winter (25 December 2019), spring (18 May 2020), summer (12-1 June 2020), and late fall (28 October 2020) each (Fig. 4). Negative signals occur due to the subtraction of the blank. For all seasons except winter, we find a clear contribution of organic compounds across the entire mass spectrum and higher signals of a few individual compounds such as MSA, SA, and NA. For most of the cloud residuals in spring, summer, and fall, the ICHO compounds show a similar pattern to that in mass spectra from offline filter samples from the summertime high Arctic measured by FIGAERO-CIMS (Siegel et al., 2021), with several molecules in the mass range of about 220 until 360 Th. In contrast to spring, summer, and fall, the winter cloud residuals show signal above background for only very few compounds, mainly IC3H6O (likely lactic acid) and the fatty acids IC16H32O (likely palmitic acid) and IC18H36O (likely stearic acid). The two latter have been previously observed in the sea surface microlayer from the Arctic Ocean (Mashayekhy Rad et al., 2018). However, these observations were from the summertime high Arctic, and the conditions for winter might not be comparable. In addition, lactic, palmitic, and stearic acid might also be attributed to handling of the GCVI during maintenance. We show the impact of these three compounds on the chemical composition of the cloud residuals in Sect. 3.4. In the dark months, the contribution of organic aerosol to the total particulate matter is expected to be lower than during the sunlit part of the year (Moschos et al., 2022b). The absence of more oxygenated organics in the wintertime cloud residual samples seems to reflect this. The average signal-weighted O:C ratio of the ICHO group is slightly larger than the ratio of the ICHON group (0.55–0.81 and 0.59–0.73, respectively), which is in agreement with offline FIGAERO-CIMS measurements conducted in the central Arctic (Siegel et al., 2021).
The cloud residuals observed in spring, summer, and early fall (18 May until 12 September 2020) show a clear MSA signal, whereas the cloud residuals observed in late fall and winter (25 December 2019; 28 October and 9 December 2020) do not (Sect. S5, Fig. S8). The large signal of MSA suggests a marine contribution to CCN in the summertime. In a recent study from the Southern Ocean, it was suggested that MSA is formed in the aqueous phase and thereby contributes to the growth of aerosol particles (Baccarini et al., 2021). In Sect. 3.5 we investigate this further.
3.4 Seasonal patterns of cloud residual chemical components
In general, the ambient organic aerosol mass is much lower in the dark period of the year than during the bright season. Based on literature, the particle composition in Ny-Ålesund during the dark period is dominated by anthropogenic emissions reaching the station due to atmospheric long-range transport, whereas in the sunlit period of the year natural emissions can account for almost half of the organic submicron aerosol burden (Moschos et al., 2022a, b). The transition period from late winter to spring is known as the Arctic haze, characterized by enhanced aerosol mass concentrations (e.g. Tunved et al., 2013). In the following, we will investigate how this general pattern is reflected in the cloud residuals. We note that we have less cloud residual data during the winter months, due to less cloudy conditions and lower concentrations close to the detection limit, and in the haze month because of the mentioned problems with the instrumentation (Sect. 3.1); hence, our observations are skewed towards the summer months.
In Fig. 5 we present the cloud residual signal of various compounds and groups of compounds measured by FIGAERO-CIMS behind the GCVI as absolute signal (Fig. 5a) and as relative signal (Fig. 5b). We include compounds related to natural (MSA, SA, levoglucosan, FA) and anthropogenic (ICHON, SA, NA) emissions and show that they are present in the cloud residuals throughout the year. We also indicate the absolute and relative signals for the winter samples when excluding the compounds that might be related to handling of the GCVI (lactic, palmitic, and stearic acid). For more details about the signals of lactic, palmitic, and stearic acid and the fact that excluding these compounds does not change the overall pattern of the chemical composition during the rest of the year, see Sect. S6 and Figs. S9 and S10.
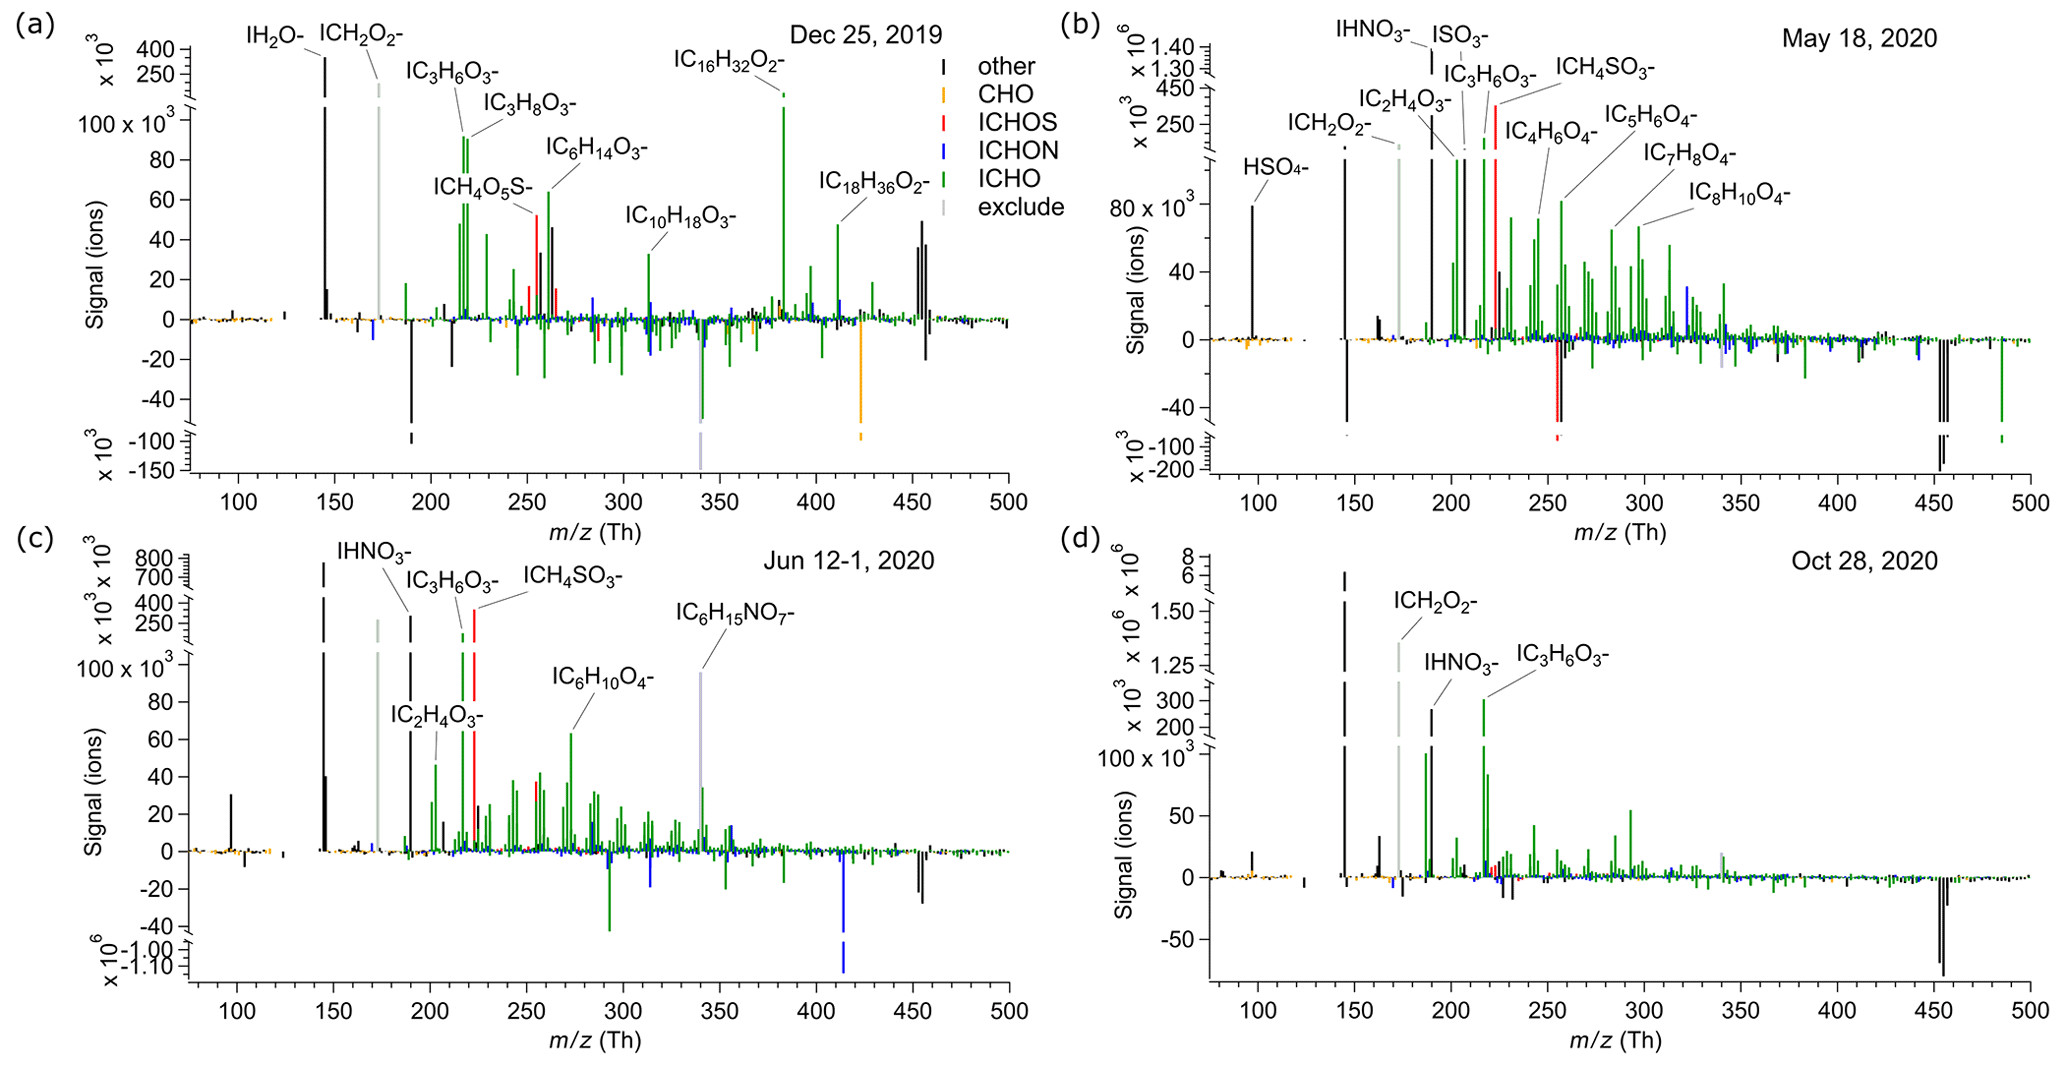
Figure 4Mass spectra of cloud residuals. (a) 25 December 2019, (b) 18 May 2020, (c) 12-1 June 2020, and (d) 28 October 2020. The detected compounds are presented as I clusters, as detected by the FIGAERO-CIMS.
The largest fraction of compounds in all cloud residuals is made up by the organic CHO + ICHO groups. The relative contribution of these compounds to the total measured signal is highest in the two cloud residuals on 12 June, whereas the absolute signal is highest in the cloud residual sample of 25 June. Except for the sample of 12 September 2020, the observed absolute signal contribution follows the expected ambient organic aerosol seasonality (Moschos et al., 2022b). It is interesting to note that from 25 June until 12 September, the signal of CHO + ICHO and MSA both decrease in absolute numbers, but MSA has a more pronounced decrease in relative terms. This could be linked to the different source regions. While the MSA precursor DMS peaks in late spring until early summer (May–June), other organic compounds are present all year round and have both natural and anthropogenic continental sources (Behrenfeldt et al., 2008; Jang et al., 2021). The elevated levels of CHO + ICHO, NA, and levoglucosan in late summer (12 September) indicate an anthropogenic influence, supported by the back trajectories originating from the large anthropogenic source region of sulfur dioxide (SO2) in the Kola Peninsula (Sect. S7, Fig. S11).
The absolute signal of organonitrates (ICHON) follows the pattern of the CHO + ICHO group, and their relative contribution to the total signal observed with the FIGAERO-CIMS is similar for the individual cloud residual samples. ICHON compounds might be related to oxidation of CH(O) and NOx emissions from year-round ship traffic in the surrounding seas and the Arctic Ocean or from the nearby power plant (Eckhardt et al., 2013).
The seasonal contribution of compounds with molecular formulae corresponding to fatty acids with 4 to 28 carbon atoms follows the contribution of the CHO + ICHO. FA-like compounds were also found in ambient aerosol samples from the high Arctic with offline FIGAERO-CIMS (Siegel et al., 2021). Their presence indicates organic-enriched sea spray as a natural source of CCN (Mashayekhy Rad et al., 2018). The group of fatty acids also includes the previously mentioned palmitic and stearic acid that might be related to hygiene products. Excluding these two compounds would decrease both the absolute and the relative signal of fatty acids in 25 December 2020, but the pattern of the rest of the year remains similar (Sect. S6, Fig. S10).
The seasonal pattern of the absolute signal of NA in the cloud residual samples is similar to that of the CHO + ICHO group for the majority of the samples. However, while CHO + ICHO has the highest absolute signal on 25 June, NA shows the largest absolute and relative signal on 18 May. Given that NA is related to anthropogenic emissions, and back trajectories (Sect. S7, Fig. S11) indicate the northern coast of Russia as the source region, it is possible that there was a prominent continental contribution to the aerosol population on 18 May.
Levoglucosan (IC6H10O is a known tracer for biomass burning (Simoneit et al., 1999). Of all the compounds and compound groups we present in Fig. 5, levoglucosan has the lowest contribution to the observed signal in each of the cloud residual samples (below 1 % in all samples in Fig. 5b). We observe elevated absolute signals of levoglucosan in the cloud residuals from mid-June until 12 September and lower absolute signals in May and October. These results show that long-range transport of biomass burning aerosol (Stohl et al., 2007; Zangrando et al., 2013; Moroni et al., 2020) is contributing to the CCN fraction during large parts of the year.
The measured total contribution of MSA to the cloud residual mass is overall low in the beginning of the year, increases towards June, and decreases again from September onwards. We observe the highest contributions to the cloud residual mass at the end of June 2020. Elevated MSA absolute signal can also be found in the cloud residuals in May, in the beginning of June, and in mid-September 2020. The increase of MSA in the cloud residuals towards June follows the overall pattern of ambient particulate MSA levels measured with the FIGAERO-CIMS in 2020 (Siegel et al., 2023). Also in previous years, the ambient concentration of particulate MSA in Ny-Ålesund was found to follow a seasonal pattern with the highest concentrations in May or June (Jang et al., 2021; Park et al., 2021; Moschos et al., 2022b). Since MSA is an oxidation product of DMS, the presence of MSA in the cloud residuals during the sunlit time of the year indicates a marine contribution to the aerosol particle population able to act as CCN. This indicates that DMS oxidation products are relevant to grow aerosol particles to CCN-active sizes, which is what previous ambient aerosol observations at the same measurement location already suggested (Park et al., 2021).
Another oxidation product of DMS is SA, which was observed in the cloud residuals as well. Since SA is formed via oxidation (in both gas and aqueous phase) of SO2, which has both anthropogenic (e.g. emissions from coal burning) and natural origins (e.g. oxidation product of DMS), source regions of the air mass need to be considered to estimate its origin. The absolute signal of SA in general shows a similar pattern as the absolute signal of MSA, except for the cloud residuals on 21 May and 12 September, when both the absolute and relative SA signals are highest of all cloud residual samples. For 21 May, HYSPLIT trajectories show that the air mass originated from the southwest and spent some time over the Greenland Sea, and the Barents Sea and Kara Sea further east of Svalbard (Sect. S7, Fig. S11). On 12 September, the trajectories show air arriving from the Barents Sea and the northern coast of Norway. The Greenland Sea southwest of Svalbard provides a source for DMS emissions, and air masses from this area have been previously observed to contain high levels of SA (Lee et al., 2020). A large anthropogenic source region of SO2 emissions, the Kola Peninsula, is located near the coastal region of the Barents Sea. SO2 emissions from this region have been identified to form SA, which drives new particle formation far away from the source region (Sipilä et al., 2021). Given that these high SA concentrations do not correlate with the observed MSA, the high SA signal in the cloud residuals on 21 May and 12 September can probably be attributed to be mainly of anthropogenic origin. It is interesting to note that on 25 June 2020, the HYSPLIT trajectories indicate air coming from near the continental border between Norway and Russia, similar to 12 September, but with less exposure over the Barents Sea. However, the cloud residual sample on 25 June contains much less SA and high MSA. The reason for this could be linked to the seasonality of MSA, with a large source in June (Jang et al., 2021). The different signals of the two DMS oxidation products suggests that the aerosol particles acting as CCN in the Arctic can have a strong seasonality, and natural sulfur sources might contribute to their mass to a large extent during the phytoplankton bloom season.
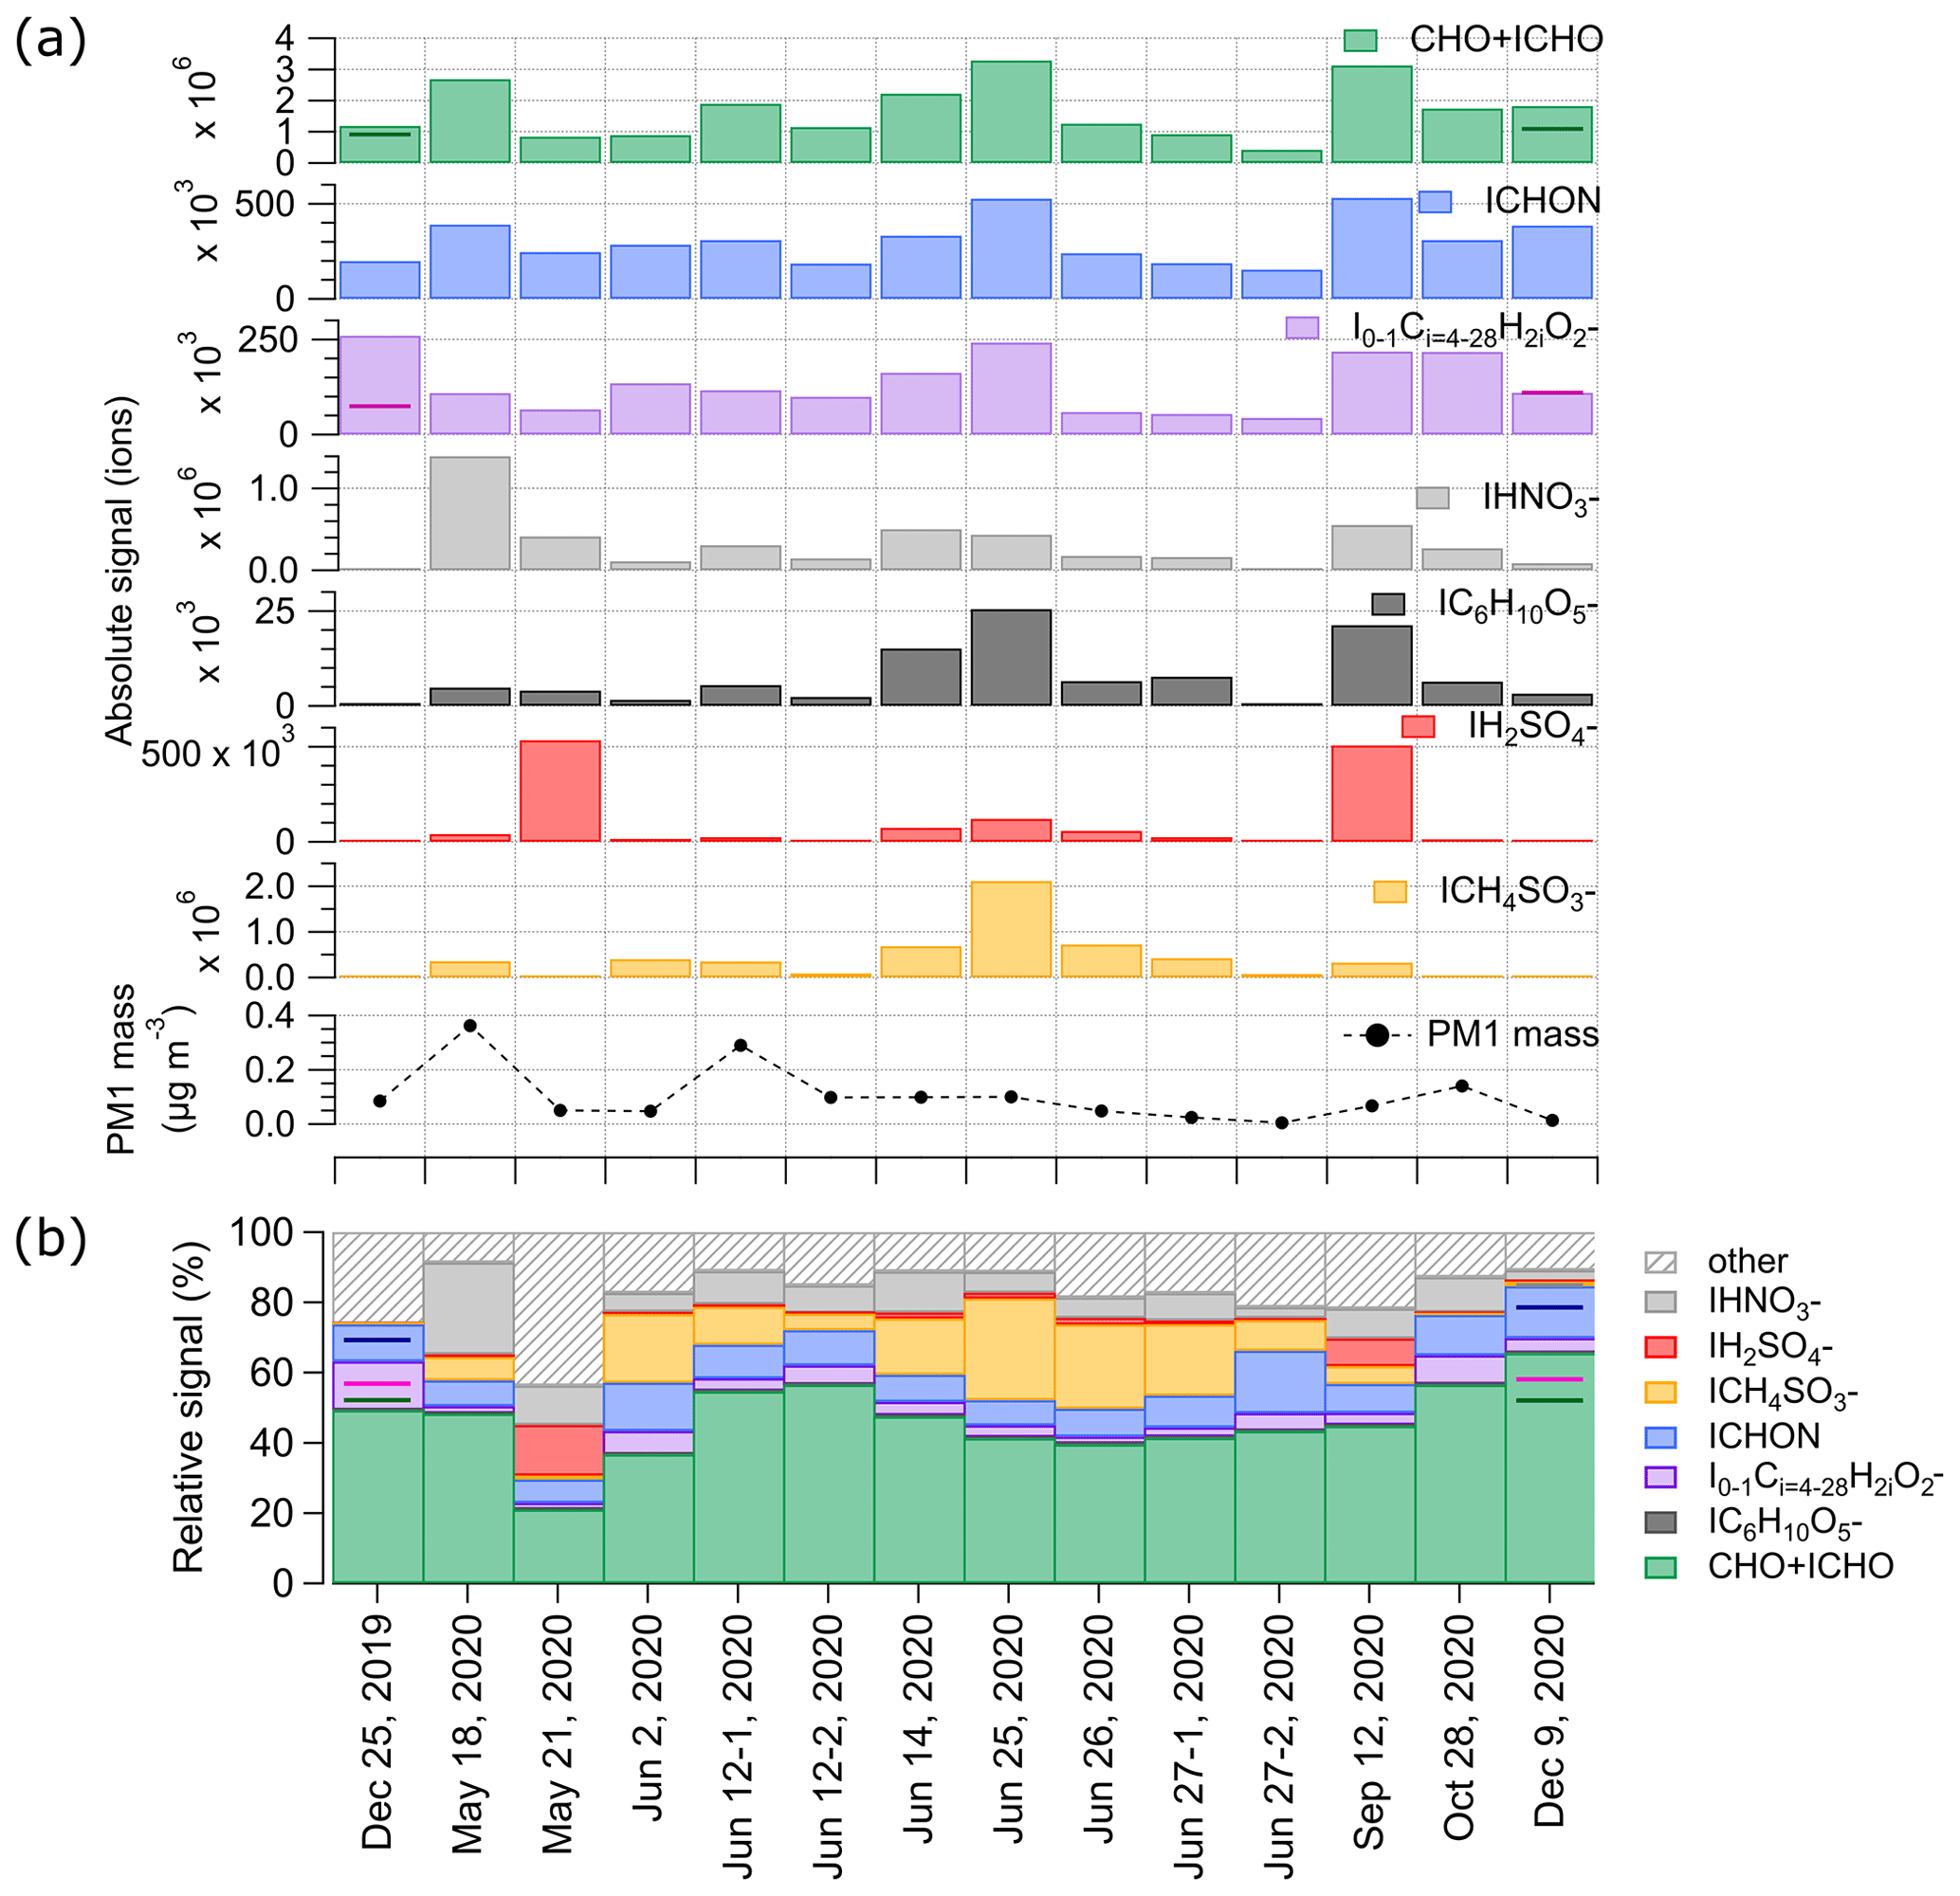
Figure 5(a) Absolute signal of different compound groups (CHO + ICHO, ICHON, I0−1CH2iO (fatty acids), IHNO (NA), IC6H10O (levoglucosan), IH2SO (SA), ICH4SO (MSA)) in the different cloud residual samples and the respective PM1 mass. (b) Relative signal of different compound groups in the different cloud residual samples. Note that in the absolute signal view in panel (a) the CHO + ICHO group contains also the signal of IC6H10O and I0−1CH2iO, whereas for the relative signal in panel (b) the signal from these two groups have been subtracted from CHO + ICHO. The colored horizontal lines in panel (a) indicate the absolute signals of CHO + ICHO and fatty acids when excluding the compounds that might be related to handling of the GCVI (lactic, palmitic, and stearic acid). In analogy, in panel (b) the colored horizontal lines indicate the relative signal of CHO + ICHO (green), fatty acids (purple), and ICHON (blue; see Sect. S6, Fig. S10 for the other compound groups) when excluding lactic, palmitic, and stearic acid.
3.5 Cloud residual composition and size
To investigate if there is a link between the size and the sources of the cloud residuals, we investigated the mass fraction of Aitken mode particles (<80 nm) to particles with a diameter smaller 1 µm (PM1) and the number fraction of Aitken mode particles to the sum of Aitken and accumulation mode particles (Fig. 6a), as well as the ratio of MSA-to-SA (Fig. 6b). Since MSA is only produced from natural sulfur emissions and SA can be produced from both natural and anthropogenic emissions, their ratio provides a relative estimate of the dominating source region. We note again that this is not a direct comparison of size and chemistry, as the overall contribution of the Aitken mode to the chemical composition is much smaller than that of the accumulation mode.
The number fraction of Aitken mode particles in the cloud residuals shows a minimum in spring and late fall (18 May and 28 October 2020) and a maximum in the summer (27-1 and 27-2 June 2020) and in the winter (25 December 2019 and 9 December 2020, Fig. 6a). The contribution of Aitken mode particles to the PM1 mass of the cloud residuals is clearly increasing from spring towards summer (18 May until 27-2 June 2020) and is low during the rest of the year. The dominating number of Aitken mode particles in the winter is most likely linked to the presence of ice particles that create artifacts in the GCVI (Karlsson et al., 2021).
In general, the summer period with a high number contribution of Aitken mode particles in the cloud residuals coincides with MSA SA ratios >10 and absolute MSA signals between around 75 000 and 200 000 ions in the cloud residuals (Fig. 6b). The highest MSA SA ratio is found in the cloud residual sample on 2 June 2020, suggesting that during this cloud case the contribution of natural sulfate was highest of all the cloud residual samples. In absolute terms, the largest signal of MSA is found in the cloud residual sample on 25 June 2020. Aitken mode aerosol particles measured in Ny-Ålesund have previously been associated with new particle formation (NPF) events during the summertime when local sources dominate the aerosol population (Tunved et al., 2013; Lee et al., 2020). Ambient particulate MSA concentrations have been reported to be highest during NPF events, and based on gas-phase measurements, this DMS oxidation product has been shown to be an important contributor to the growth of newly formed particles in Ny-Ålesund (Dall'Osto et al., 2017; Beck et al., 2021; Park et al., 2021). Aitken mode particles have previously been shown to play a role as CCN in the summertime Arctic (Kecorius et al., 2019; Bulatovic et al., 2021; Karlsson et al., 2022). The combination of the observed dominating Aitken mode and elevated levels of MSA in the cloud residual samples at the end of June 2020 further indicates that during this time of the year MSA clearly contributes to the growth of newly formed particles into CCN sizes.
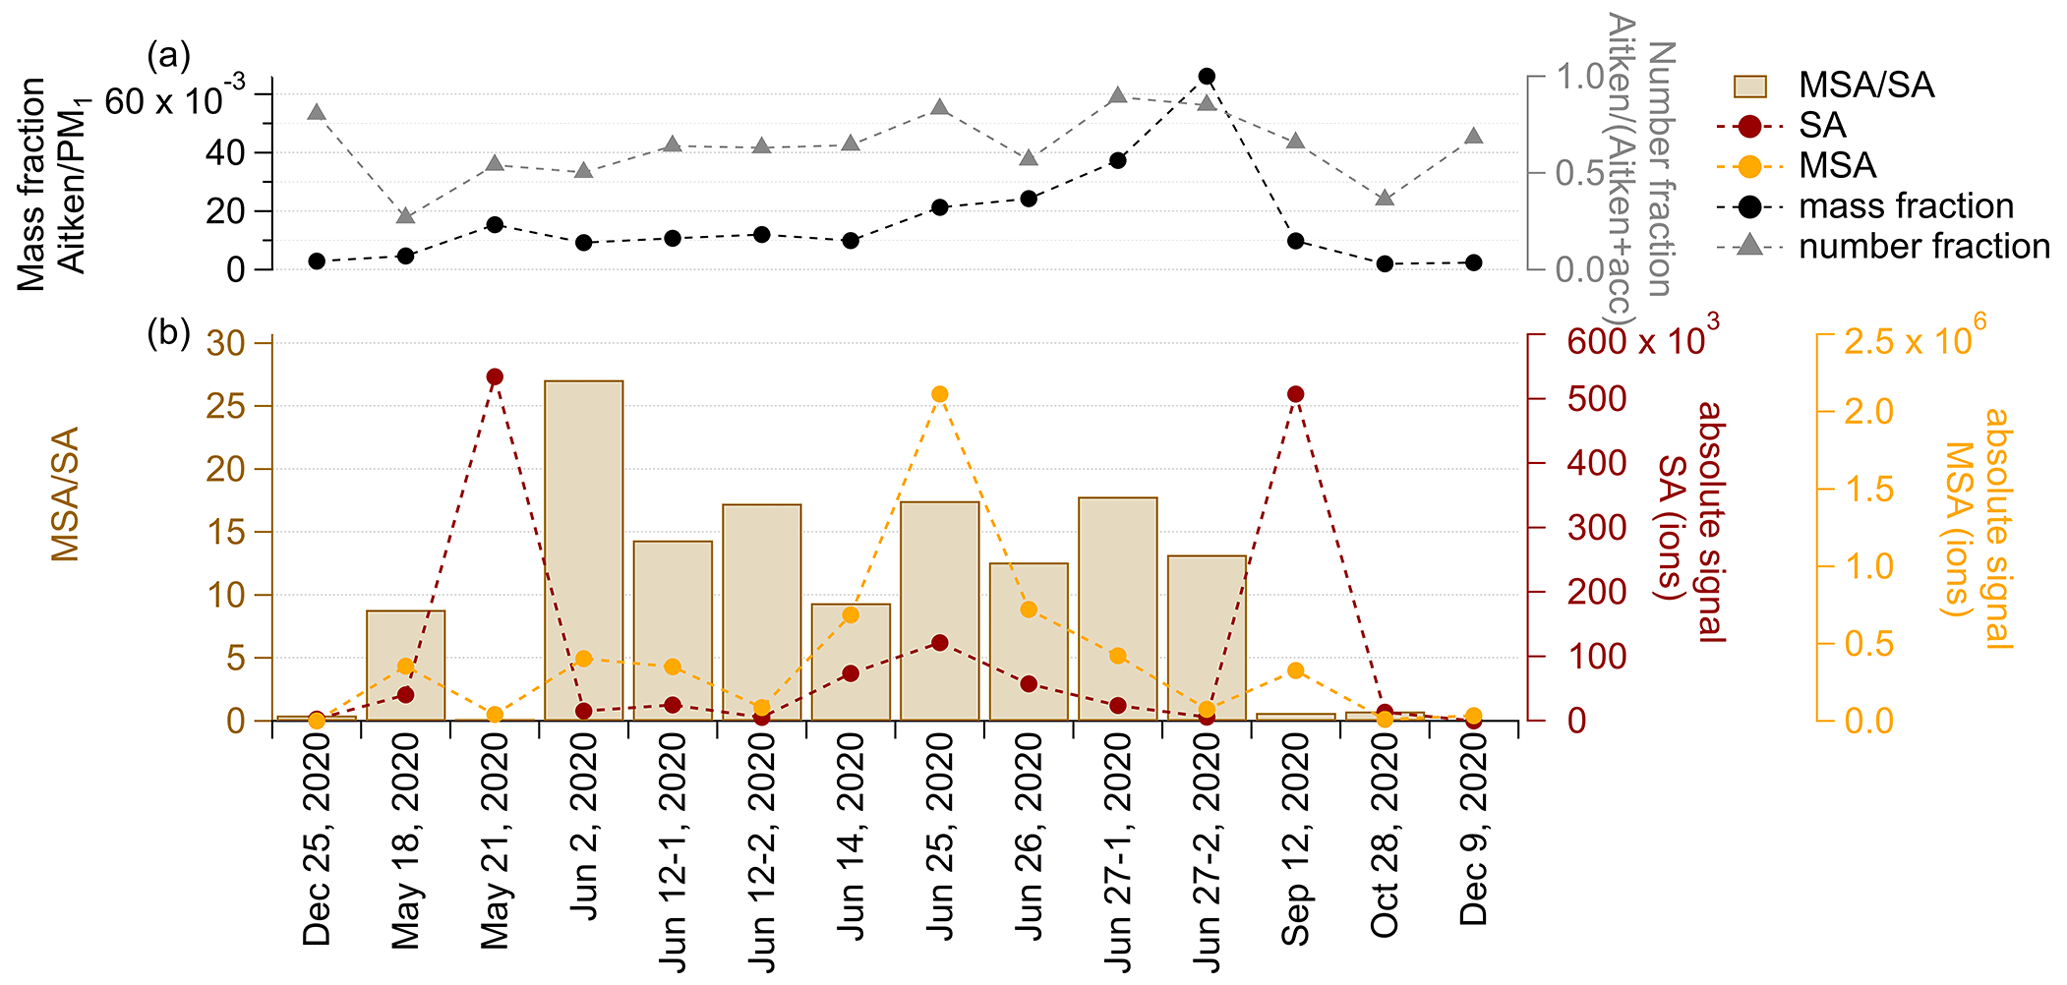
Figure 6(a) Mass fraction of Aitken mode particles to total PM1 and number fraction of Aitken mode particles to the total number of Aitken and accumulation (acc) mode particles. As Aitken mode particles we consider particles <80 nm. (b) Ratio of MSA to SA and their absolute signal for all cloud residuals.
3.6 Cloud case study – 18 May 2020
In Fig. 7 we present different ambient properties during a cloud event on 18 May 2020. On this day, we observed a cloud event before, during, and after which the air masses were originating from the same region (Fig. 7a). This situation allowed us to study potential cloud processing of aerosol particles in detail. To do so, we identified FIGAERO-CIMS samples before, during, and after the cloud occurrence based on the observed visibility (Fig. 7b). The Before period defines the 2.5 h directly before the cloud was observed at the Zeppelin Observatory, and the visibility was around 60 km. The During period is equal to the sampling time of the FIGAERO-CIMS cloud residual sample of 18 May 2020, measured in the beginning of the cloud when the median visibility was 49 m. For this time period we measured the size distribution of both the cloud residuals and the interstitial aerosol particles (together termed total particles) and the chemical composition of the cloud residuals only. The After period refers to the sampling time after the cloud had dissipated and the visibility was around 75 km. The average temperature during the cloud event was between −1.7 and −3.5 ∘C, indicating most likely a low-level mixed-phase cloud, which is also identified as such in the target classification (Fig. 7c). The air mass reached the Zeppelin Observatory from the east, where it spent time over the northern coast of Russia. Throughout the cloud event, the back trajectories show very similar source regions, with a slight shift to more marine influence over time. The air mass spent most of the time above the boundary layer (Sect. S8, Fig. S12). The accumulated precipitation along the back trajectories was on average 0.3 mm (median 0.2 mm, max. 1 mm, min. 0 mm).
3.6.1 Changes in aerosol number size distribution
In the before period, the aerosol number size distribution was composed of a dominating Aitken mode with a peak at around 45 nm and a smaller contribution of accumulation mode particles with a peak at around 125 nm (Fig. 7d). The total aerosol population also included particles in the nucleation mode (8–17 nm).
In the during period, the accumulation mode particles with a peak at around 144 nm dominated the number concentration in the cloud residuals (Fig. 7d). A few Aitken mode particles down to around 56 nm were observed in the cloud residuals as well. Overall, the cloud residuals span a size range of around 60 to 300 nm. Due to the larger size of the accumulation mode particles, they are expected to activate into cloud droplets first. The peak in number occurring at 144 nm for the cloud residuals and lower numbers towards the 56 nm sized cloud residuals confirm this expected behavior. The total particle population (activated and non-activated aerosol particles) exhibited fewer particles in the nucleation and Aitken mode, and slightly more particles in the accumulation mode compared to the before period. Additionally, another peak in the size distribution occurred at around 79 nm in the total particle population, and a minimum at around 56 nm. The reduced number of nucleation and Aitken mode particles in the total particle population was probably a result of their coagulation with the cloud droplets. The second peak in the Aitken mode could indicate the advection of a different air mass. The back trajectories indicate that in the during period, the air spent less time over the Russian coast compared to the before period, and more time over the Kara Sea (Fig. 7a). Additionally, while most of the time the air mass was above the boundary layer in the before, during, and after periods, there are indications in the back trajectories that in the during period the air was within the boundary layer when it was passing over the Kara Sea (Sect. S8, Fig. S12a, b). In this region, the air mass could have collected the particles visible as a peak in the number size distribution around 79 nm.
In the after period, the number size distribution showed a bimodal distribution of Aitken and accumulation mode particles (Fig. 7d). Compared to the during period, the nucleation mode particles were completely removed, and the number of Aitken mode particles had decreased further. Additionally, compared to the before period, the peak in the accumulation mode had shifted to a larger size at around 141 nm, similar to the during period. The average particle number concentration had decreased by about half, from 559 cm−3 in the before period to 344 cm−3 in the after period. In the during period, there were on average 456 cm−3 total particles and 105 cm−3 cloud residuals. This decrease in total number can be mainly attributed to the decrease in Aitken mode particles. In combination with the shift to larger particles in the after period, this could indicate growth of the accumulation mode particles due to coalescence with the Aitken mode particles in the during period, which resulted in larger aerosol particles in the after period when the cloud droplets had evaporated. It is also possible that the accumulation mode particles grew due to in-cloud processing. We investigate this in the next section.
The after-period bimodal size distribution with a minimum between Aitken and accumulation mode at 63 nm (known as the Hoppel minimum; Hoppel et al., 1986) indicates a non-precipitating cloud, and this agrees well with observations from the central Arctic (64 to 71 nm; Karlsson et al., 2022). According to Hoppel et al. (1986), this minimum is related to the activation diameter of the aerosol particles. The presence of a Hoppel minimum in the aerosol size distribution at the Zeppelin Observatory has frequently been observed (Tunved et al., 2013).
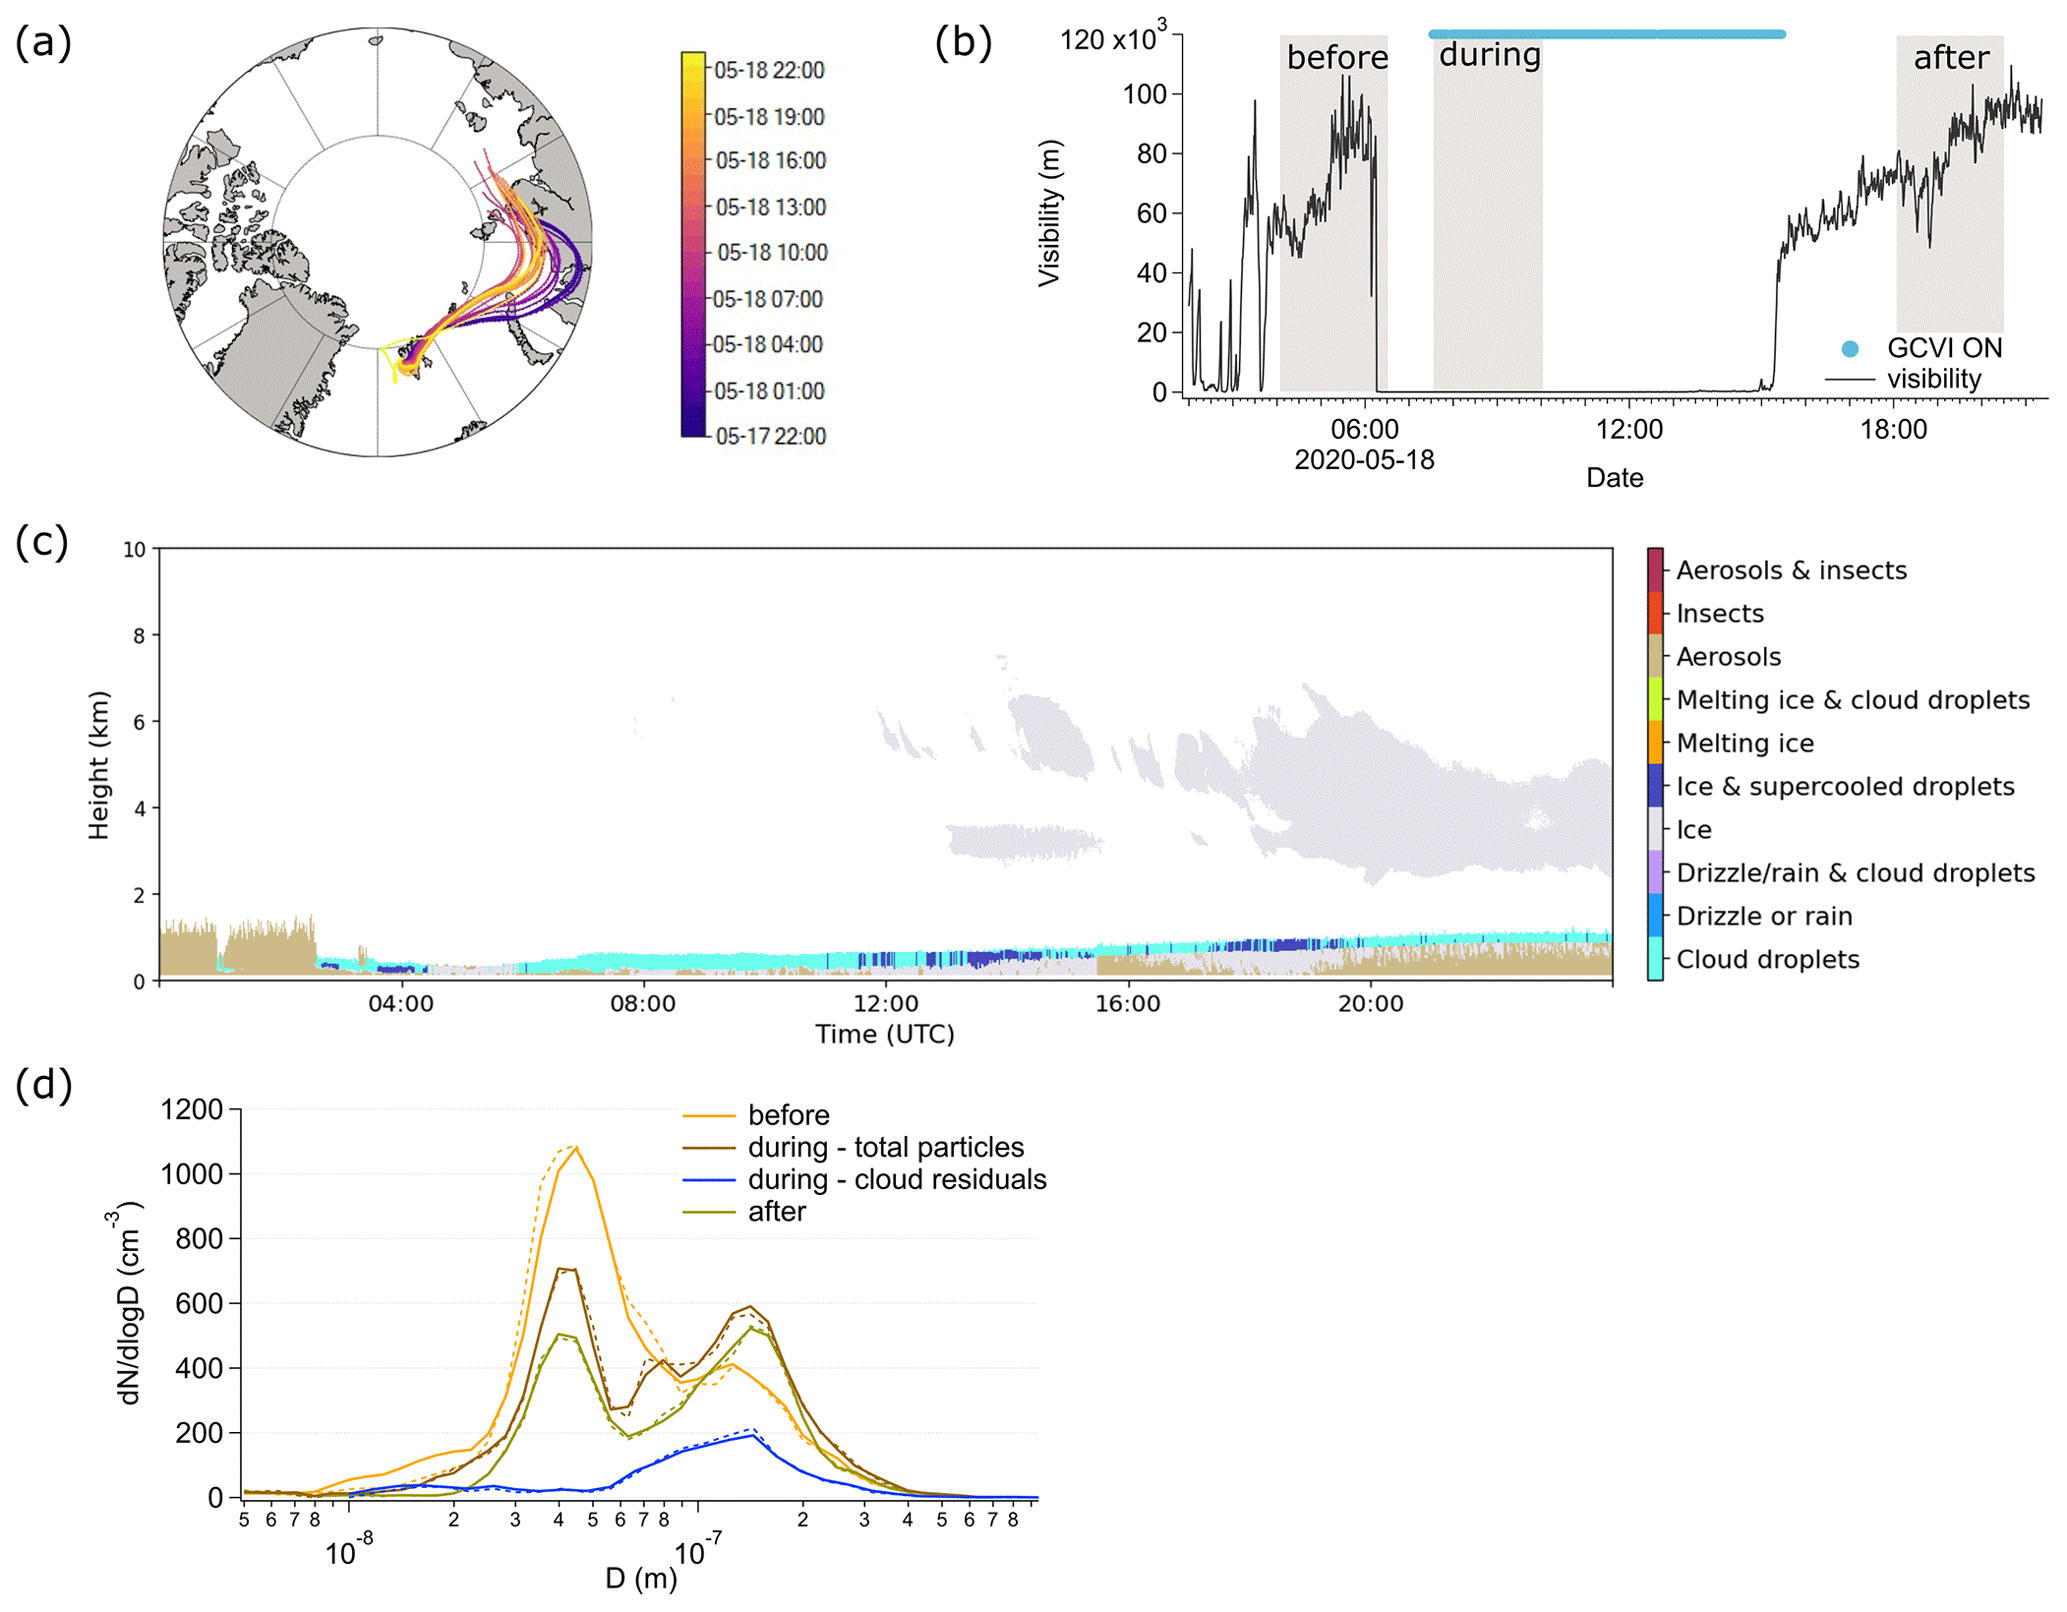
Figure 7Cloud case on 18 May 2020. (a) 5 d back trajectories of air masses arriving at the Zeppelin Observatory before, during, and after the cloud event color-coded by time. (b) Time evolution of the visibility and sampling times of the FIGAERO-CIMS samples before, during, and after the cloud event (grey shaded area). (c) Target classification on 18 May 2020 (Cloudnet, 2021) (d) Number size distributions before, during, and after the cloud event. Before and after the cloud event, the two DMPS systems both measure behind the whole-air inlet; hence, they both measure the same particle population during these times. For before and after, we only show the DMPS2 data. During the cloud event, DMPS1 measured behind the GCVI, and DMPS2 measured behind the whole-air inlet; hence, DMPS1 measured the cloud residuals, and DMPS2 measured the total particle population. Average total particle number concentrations: 552 cm3 before, 379 cm3 during – total particles, 96 cm3 during – cloud residuals, 285 cm3 after.
3.6.2 Changes in aerosol chemical composition
Overall, we observed only small changes in the chemical composition throughout the cloud event (Fig. 8a, pie charts). The “other” group, containing largely inorganic sulfur- and chloride-containing species, contributes the same fraction throughout the cloud event. The largest change from the before period to the after period is the increased fraction of CHO + ICHO (also in absolute terms, not shown here), whereas MSA and NA show a slight decrease. Also, the absolute signal of NA is decreasing from the before period to the after period (not shown here). MSA and NA show a decreasing trend also from the before period to the during period. However, the changes in chemical composition are not that pronounced, which is similar to a study conducted at a mountain site in Sweden using a quadrupole aerosol mass spectrometer behind a GCVI observing no significant change in aerosol composition between before and after a cloud event (Drewnick et al., 2006).
As the CHO + ICHO compounds contribute the largest fraction of cloud residual signal for the cloud case on 18 May 2020 and also of most of the cloud residuals measured with the FIGAERO-CIMS during the year (see Sect. 3.4), we investigate this group in more detail and look at its molecular composition. Overall, the molecular composition of the CHO + ICHO group does not change much during the cloud event. The majority of the CHO + ICHO compounds are composed of 2 to 11 carbon atoms and 3 to 6 oxygen atoms (Fig. 8a). Among these, the compounds with four oxygen atoms, likely dicarboxylic acids, dominate the signal in the before, during, and the after periods. Dicarboxylic acids have been shown to be part of the water-soluble fraction of organic aerosols (Saxena and Hildemann, 1996). In the during period, the number of oxygen atoms shifts to smaller numbers. Most of the CHO + ICHO signal comes from compounds with five and seven carbon atoms. The largest change is observed for compounds with three carbon atoms. Their relative contribution is much lower in the before than the during and after periods. Compounds that show a smaller change in relative contribution are those with 4 and 10 carbon atoms. Their contribution is much higher in the before and after periods than in the during period (Sect. S8, Fig. S13). The increase in absolute and relative signal in the after period compared to the before period is possibly linked to aqueous-phase oxidation in the cloud droplets.
In the following, we identify individual compounds that showed an increasing (79 compounds) or decreasing (46 compounds) trend from the before period to the after period in the cloud event, as well as compounds that are highest during the cloud residuals (Fig. 8b, including all CHO + CHOI, CHION, NA, MSA, SA groups). In Fig. 8b we show the trends in the form of a mass defect plot to show how the compounds are spread over the entire range. The highest during category comprises 428 compounds. Of all the compounds with a change in relative signal, no specific chemical families could be identified. We therefore focus on the three compounds showing the most pronounced relative change in signal in each of the three groups (increasing, decreasing, and highest during).
The three compounds with the strongest relative increase were IC4H6O, IC3H4O, and IC5H8O, which are the chemical formulae corresponding to succinic acid, malonic acid and glutaric acid, respectively. Succinic and malonic acid have previously been found in cloud water in continental Europe (Löflund et al., 2002). We also observed levoglucosan in this group. Except for succinic acid, these acids have been found to be able to serve as CCN in the laboratory (Cruz and Pandis, 1997; Giebl et al., 2002; Rosenørn et al., 2006). It is likely that the compounds in the increasing category are chemical tracers of good CCN or produced in the aqueous phase through oxidation of water-soluble or co-condensing gases and due to their higher oxidation state are more likely to stay in the particulate phase after the cloud droplets evaporate.
The three compounds that showed the strongest relative decrease were NA, IC2H4O (might be glycolic acid), and IC5H6O (might be citraconic acid or glutaconic acid). Their decrease could be due to either aqueous-phase reactions or evaporation.
The three compounds that showed the highest signal in the during period were IC3H6O, IC7H8O, and IC8H10O. IC3H6O can likely be attributed to lactic acid, whereas the other two compounds could not be unambiguously identified. The compounds in the highest during category may be particularly efficient as CCN or INPs or be formed in the aqueous phase. However, lactic acid is also a tracer of human activity, and the high lactic acid signal could therefore indicate contamination from handling of the GCVI during maintenance.
The normalized signal of SA showed that it belongs to the highest during category. The elevated level of SA in the cloud residuals indicates aqueous-phase reaction of dissolved SO2 in the cloud droplets (Hoppel et al., 1994). Elevated contributions of sulfate in the cloud residuals compared to the ambient aerosol particles were also found in an aircraft study during the haze season near Alaska (Zelenyuk et al., 2010). In contrast to our study, they measured the difference in ambient particle and cloud residual composition vertically, where ambient particles were measured below the cloud. It is interesting that the SA levels in the after period drop down to a similar level as in the before period (Fig. 8c). If SA is produced inside the cloud droplets, we would expect the evaporated cloud droplets in the after period to be enriched with SA. SA is rather non-volatile, and partitioning into the gas phase is therefore unlikely. From the changes in the total particle number size distribution, we saw an additional Aitken mode at around 79 nm in the during period, which we attributed to be linked to advection of a different air mass. Hence, a possible explanation for the lack of enrichment in SA after the cloud could be that we were not measuring the same air mass throughout the cloud event or different air masses were entrained from above throughout the cloud event.
MSA does not show a clear trend from the before period towards the after period (Fig. 8b). It showed the highest normalized signal in the before period and the lowest in the during period (Fig. 8c). Hence, our data do not support previous studies stating that MSA is mainly produced in the aqueous phase (Hoffmann et al., 2016; Chen et al., 2018; Baccarini et al., 2021; Xavier et al., 2022). The ratio of MSA to SA in the before and after periods is very similar, whereas in the during period the ratio is much smaller (Fig. 8c). This decrease in the cloud residuals is almost entirely driven by changes in SA and can either indicate that the during period is influenced by anthropogenic sources or that SA is formed in the cloud droplets through aqueous-phase oxidation of SO2.
Overall, the chemical composition of the aerosol particles is similar throughout the cloud event. This indicates that the aerosol particles were subject of cloud processing already before we observed this cloud case or cloud processing occurs on longer timescales than regarded in this study.
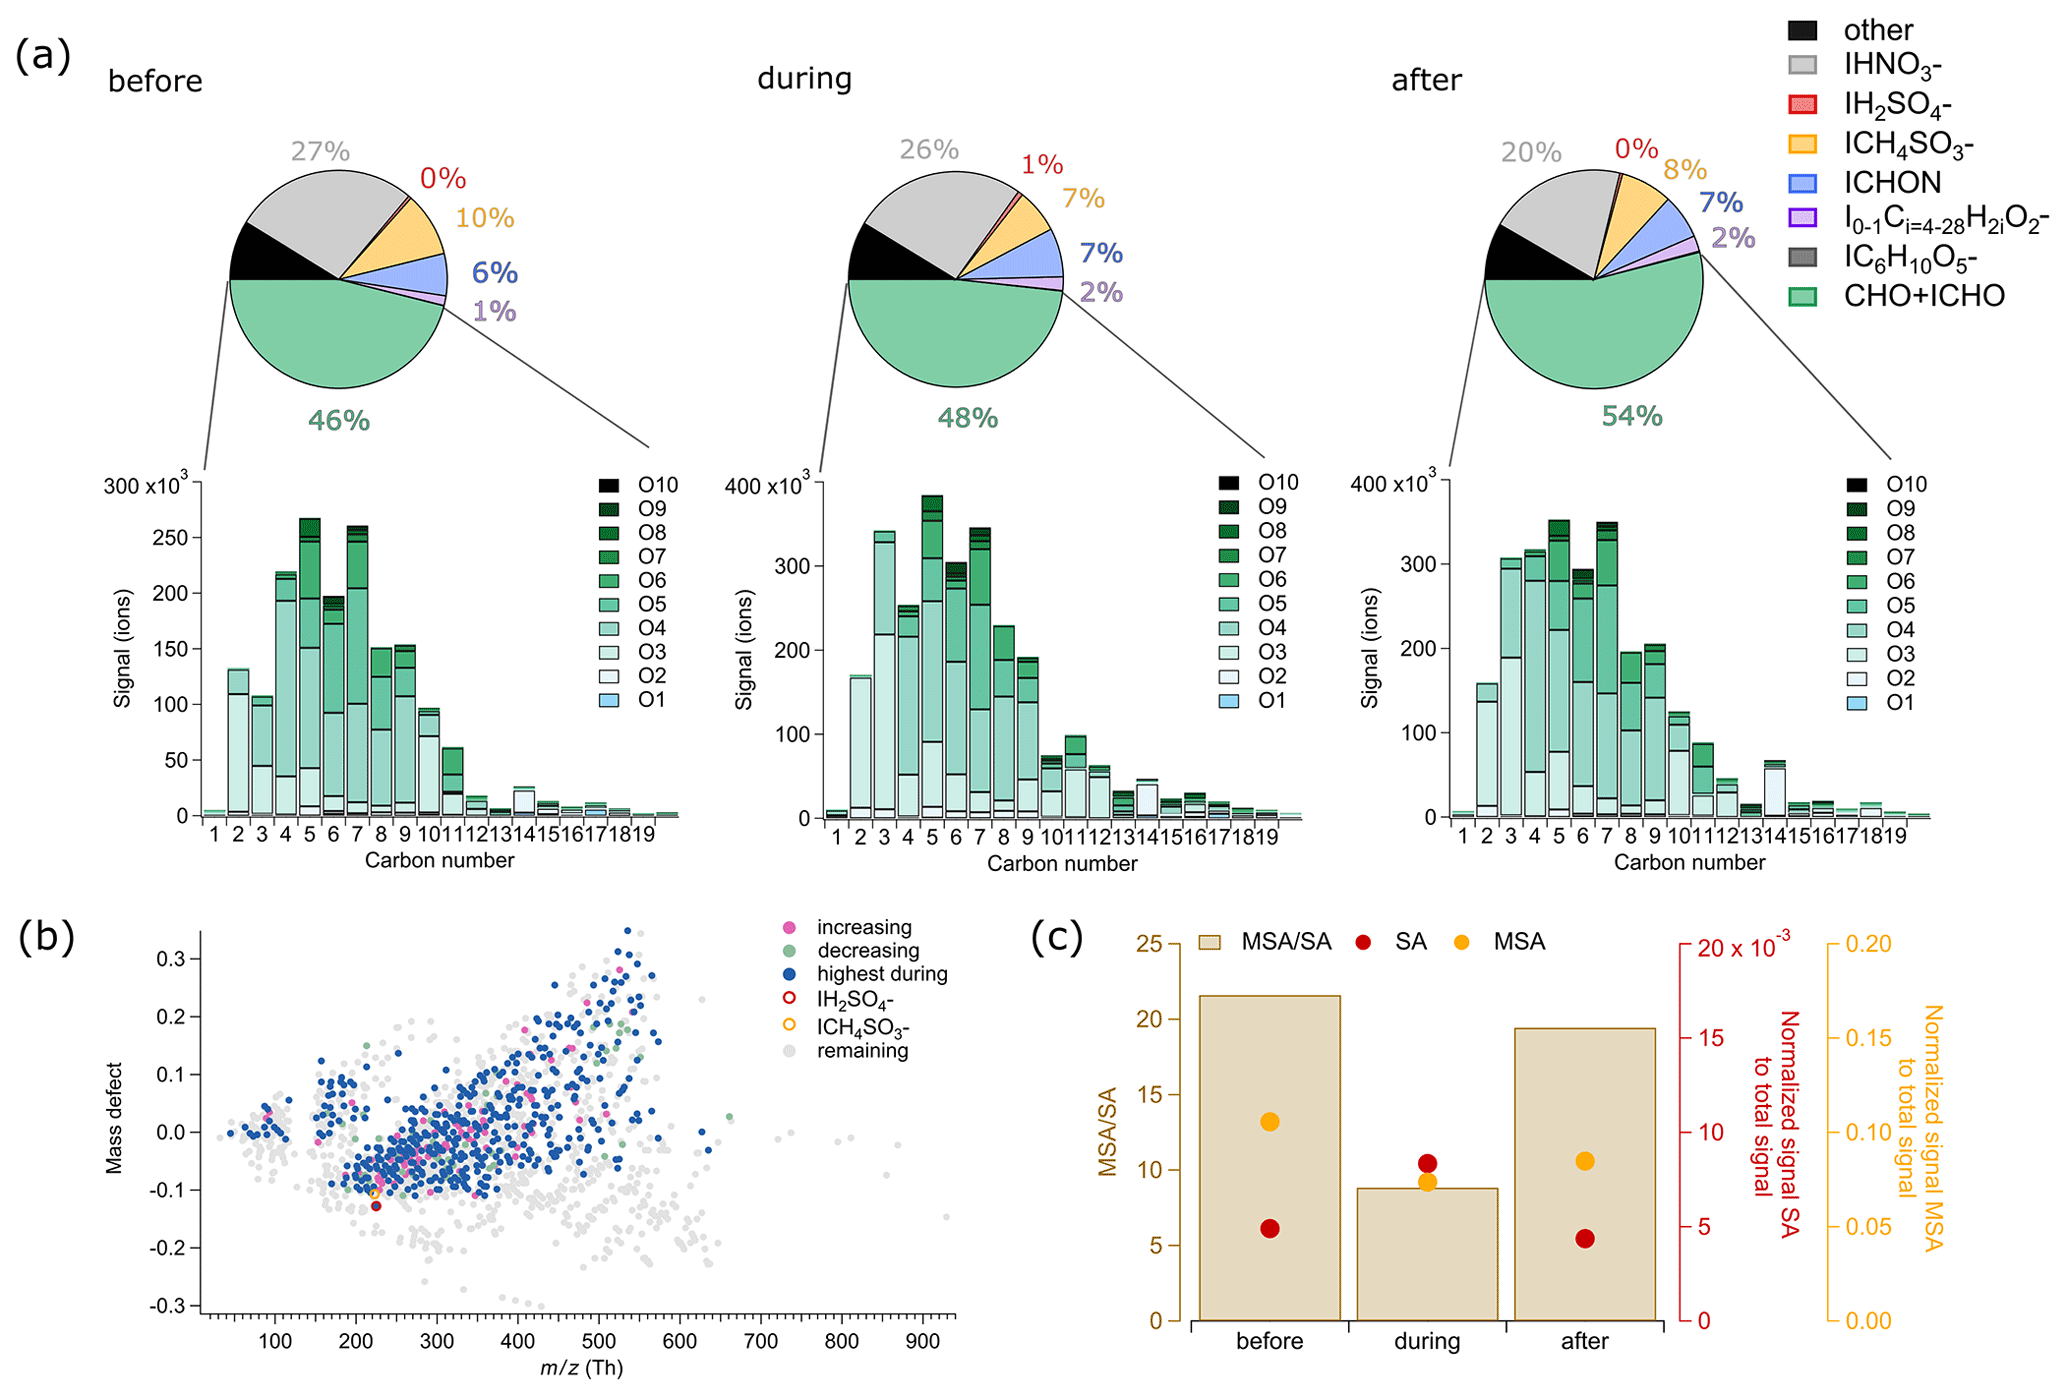
Figure 8Cloud case on 18 May 2020, chemical composition of total particles before, during and after the cloud event. (a) Pie charts showing the relative contribution of groups and individual compounds to the measured FIGAERO-CIMS signal. Green: CHO + ICHO, purple: fatty acids, blue: ICHON, yellow: ICH4O3S− (MSA), red: IH2O4S− (SA), and grey: IHNO (NA). Bar chart with absolute signal of CHO + ICHO compounds before, during, and after the cloud event grouped by the number of carbon (1–19) and oxygen (O1–O10) atoms. (b) Mass defect plot highlighting individual compounds that show an increasing or decreasing trend during the cloud event (all: all compounds detected with the FIGAERO-CIMS; increasing: compounds of which the relative signal is increasing from before via during to after the cloud; decreasing: compounds of which the relative signal is decreasing from before via during to after the cloud; highest during: compounds of which the relative signal is highest during the cloud compared to before and after). (c) Ratio of MSA to sulfuric acid (SA) and their normalized signal to the total signal before, during, and after the cloud event.
In this study, we provide the first year-long in situ chemical characterization of cloud residuals at molecular level from the Arctic. We investigated the chemical composition of cloud residuals measured with a FIGAERO-CIMS behind a GCVI inlet at the Zeppelin Observatory, Svalbard, during the NASCENT campaign. From December 2019 until December 2020, we analyzed in total 14 cloud events: two in December (one in 2019 and one in 2020), two in May 2020, eight in June 2020, one in September 2020, and one in October 2020. No cloud residual sample was collected during the haze period.
The number concentrations and size distributions of the cloud residuals agreed roughly with the seasonal pattern observed in the long-term study by Karlsson et al. (2021). We found that the overall chemical composition of the cloud residuals follows the expected annual cycle of aerosol chemical composition in the Arctic, with a large contribution of naturally derived secondary aerosol in the form of MSA during spring and summer. Organic aerosol was present in the cloud residuals during the entire year, with higher absolute signals in the summer compared to winter. Inorganic acids, namely nitric acid and sulfuric acid, had their largest contribution, both absolute and relative, in spring and late summer, indicating anthropogenic influence. The biomass burning tracer levoglucosan was observed in the summer cloud residuals as well, although its relative contribution to the total measured signal was below 1 % during the entire year. Our results indicate that most of the large enough aerosol particles serve as cloud seeds in the Arctic. In this aerosol-limited environment, the chemical properties of the aerosol particles are not as relevant as the physical properties (size and number).
We observed a general relation between the number of Aitken mode particles and the amount of MSA in the cloud residuals, where higher contributions of Aitken mode particles were present at elevated levels of MSA in the summer. This indicates that during this time of the year, MSA clearly contributes to the growth of newly formed particles into CCN sizes.
In a cloud case study from 18 May 2020, we investigated the change in the aerosol chemical composition due to cloud processing. To do so, we identified distinct periods before, during, and after the cloud event, during which the air was coming from the same region east of Svalbard. This cloud case revealed that after the cloud event, the aerosol population contained a larger relative and absolute signal of oxygenated hydrocarbons (CHO + ICHO), possibly linked to aqueous phase oxidation in the cloud droplets. Nitric acid showed decreasing relative and absolute signal, possibly linked to evaporation. Among individual compounds that showed a relative increase throughout the cloud event are succinic, malonic, and glutaric acid, as well as levoglucosan. No clear increase of MSA in the cloud residuals was observed, thus not supporting results from previous studies that indicated MSA to be formed in cloud droplets. However, we note that the observed cloud event was rather short (9 h). Overall, the presence of the cloud did not seem to change the chemical composition of the aerosol particles much. This indicates, at least for the timescales of a few hours the cloud could be observed, that cloud processing mainly has an impact on the mass of the aerosol particles and to a lesser extent on the relative contribution of individual compounds.
Whereas little change was observed for the chemical composition of the aerosol particles in comparison to the cloud residuals, the presence of the cloud reduced the number of nucleation and Aitken mode particles. This can be attributed to coagulation of particles and cloud droplets. Overall, the cloud event shifted the average submicron particle population to fewer but slightly larger accumulation mode particles.
The method used in this study allowed us to only investigate the organic fraction and some inorganic acids in the cloud residuals. As the Arctic aerosol also contains other species such as sea salt, heavy metals, or dust, our results only reflect part of the cloud residual composition. Nevertheless, our study highlights the importance of natural marine sources as CCN in the Arctic region and further suggests that the entire organic aerosol fraction can serve as CCN in the Arctic.
For future experiments, it would be crucial to identify the size-segregated cloud residual chemical composition, especially of the Aitken mode particles, which play an important role in acting as cloud seeds during a large part of the year (Lawler et al., 2021). In addition, the chemical composition of the total particle composition (cloud residuals and interstitial aerosol particles) along with the cloud residual composition should be investigated – in analogy to the data available for the size distributions. This additional information would shed light on the chemical composition of the interstitial aerosol particles and would allow us to better determine the properties of CCN. Offline and size-segregated filter sampling for later FIGAERO-CIMS analysis could be a suitable option.
In the sunlit part of the year, the contributions of natural, local aerosol particle sources to the Arctic aerosol are higher than in the dark period. Our results show that these sources provide relevant seeds for cloud formation in the Arctic. Since the highest cloud cover in Ny-Ålesund is usually expected in summer, the locally produced aerosol particles could be more important for cloud formation than the long-range-transported aerosol particles in the dark period. Especially in the context of a warming Arctic, where more open ocean provides a larger source for phytoplankton emissions and thereby also MSA formation, the marine environment could provide an important source of atmospheric aerosol particles able to activate as cloud droplets.
The data used in this study can be made available upon request to the corresponding author (Claudia Mohr, claudia.mohr@psi.ch).
The supplement related to this article is available online at: https://doi.org/10.5194/acp-23-6813-2023-supplement.
CM, PZ, and RK were responsible for funding and conceptualization. YG, KS, SH, and CM performed the FIGAERO-CIMS measurements. YG, KS, and SLH wrote code for FIGAERO-CIMS analysis. RK, PZ, and GF operated the GCVI and provided the GCVI data. GF provided the DMPS data. YG analyzed the FIGAERO-CIMS and visualized the GCVI, DMPS, and FIGAERO-CIMS data. KS visualized the trajectories. YG wrote the manuscript with input from CM. CM was responsible for supervision. All co-authors read and commented on the manuscript.
At least one of the (co-)authors is a member of the editorial board of Atmospheric Chemistry and Physics. The peer-review process was guided by an independent editor, and the authors also have no other competing interests to declare.
Publisher’s note: Copernicus Publications remains neutral with regard to jurisdictional claims in published maps and institutional affiliations.
We owe great thanks to Peter Tunved from ACES for harmonizing the DMPS2 data. We are grateful to Kerstin Ebell for help with the interpretation of the Cloudnet classification data. The authors thank NILU, Norway, especially Wenche Aas, Anne Hjellbrekke, and Ove Hermansen for providing the meteorological data (T, RH). We are very thankful for all the support from Helge Tore Markussen and Vera Sklet from the Norwegian Polar Institute in Ny-Ålesund and from the technicians from the Norwegian Polar Institute in Ny-Ålesund and from ACES, especially Christer Sørem, Christelle Guesnon, Håkon Jonsson Ruud, Svein-Torgar Oland Paulsen, Filip Heitmann, Ondrej Tesar, and Tabea Hennig. We owe great thanks to NILU for providing zero air. We acknowledge ACTRIS and the Finnish Meteorological Institute for providing the dataset which is available for download from https://cloudnet.fmi.fi/ (last access: 24 November 2022). The cloud radar data for Ny Ålesund were provided by the University of Cologne, and the ceilometer and microwave radiometer data were provided by the Alfred Wegener Institute, Helmholtz Centre for Polar and Marine Research. We gratefully acknowledge the funding by the Deutsche Forschungsgemeinschaft DFG (German Research Foundation) – project number 268020496 – TRR 172, within the “Transregional Collaborative Research Center' ArctiC Amplification: Climate Relevant Atmospheric and SurfaCe Processes, and Feedback Mechanisms (AC)3.
We gratefully acknowledge support from the Knut and Alice Wallenberg (KAW) foundation (WAF project CLOUDFORM, grant no. 2017.0165 and ACAS project no. 2016.0024). The work was also supported by the Swedish Environmental Protection Agency (Naturvårdsverket) and by the funding agency FORMAS (IWCAA project no. 2016-01427). This work was supported by the Swedish Research Council (Vetenskapsrådet starting grant, project number 2018-05045 and project number 2016-05100). This project has received support from the European Union's Horizon 2020 research and innovation program under grant agreement no. 821205 (FORCeS). The article processing charges for this open-access publication were covered by Stockholm University.
This paper was edited by Harald Saathoff and reviewed by two anonymous referees.
Adachi, K., Tobo, Y., Koike, M., Freitas, G., Zieger, P., and Krejci, R.: Composition and mixing state of Arctic aerosol and cloud residual particles from long-term single-particle observations at Zeppelin Observatory, Svalbard, Atmos. Chem. Phys., 22, 14421–14439, https://doi.org/10.5194/acp-22-14421-2022, 2022.
Alfarra, M. R., Paulsen, D., Gysel, M., Garforth, A. A., Dommen, J., Prévôt, A. S. H., Worsnop, D. R., Baltensperger, U., and Coe, H.: A mass spectrometric study of secondary organic aerosols formed from the photooxidation of anthropogenic and biogenic precursors in a reaction chamber, Atmos. Chem. Phys., 6, 5279–5293, https://doi.org/10.5194/acp-6-5279-2006, 2006.
Baccarini, A., Dommen, J., Lehtipalo, K., Henning, S., Modini, R. L., Gysel-Beer, M., Baltensperger, U., and Schmale, J.: Low-Volatility Vapors and New Particle Formation Over the Southern Ocean During the Antarctic Circumnavigation Expedition, J. Geophys. Res.-Atmos., 126, e2021JD035126, https://doi.org/10.1029/2021JD035126, 2021.
Beck, L. J., Sarnela, N., Junninen, H., Hoppe, C. J. M., Garmash, O., Bianchi, F., Riva, M., Rose, C., Peräkylä, O., Wimmer, D., Kausiala, O., Jokinen, T., Ahonen, L., Mikkilä, J., Hakala, J., He, X., Kontkanen, J., Wolf, K. K. E., Cappelletti, D., Mazzola, M., Traversi, R., Petroselli, C., Viola, A. P., Vitale, V., Lange, R., Massling, A., Nøjgaard, J. K., Krejci, R., Karlsson, L., Zieger, P., Jang, S., Lee, K., Vakkari, V., Lampilahti, J., Thakur, R. C., Leino, K., Kangasluoma, J., Duplissy, E., Siivola, E., Marbouti, M., Tham, Y. J., Saiz-Lopez, A., Petäjä, T., Ehn, M., Worsnop, D. R., Skov, H., Kulmala, M., Kerminen, V., and Sipilä, M.: Differing Mechanisms of New Particle Formation at Two Arctic Sites, Geophys. Res. Lett., 48, e2020GL091334, https://doi.org/10.1029/2020GL091334, 2021.
Behrenfeldt, U., Krejci, R., Ström, J., and Stohl, A.: Chemical properties of Arctic aerosol particles collected at the Zeppelin station during the aerosol transition period in May and June of 2004, Tellus B, 60, 405–415, https://doi.org/10.1111/j.1600-0889.2008.00349.x, 2008.
Bulatovic, I., Igel, A. L., Leck, C., Heintzenberg, J., Riipinen, I., and Ekman, A. M. L.: The importance of Aitken mode aerosol particles for cloud sustenance in the summertime high Arctic – a simulation study supported by observational data, Atmos. Chem. Phys., 21, 3871–3897, https://doi.org/10.5194/acp-21-3871-2021, 2021.
Burkart, J., Hodshire, A. L., Mungall, E. L., Pierce, J. R., Collins, D. B., Ladino, L. A., Lee, A. K. Y., Irish, V., Wentzell, J. J. B., Liggio, J., Papakyriakou, T., Murphy, J., and Abbatt, J.: Organic Condensation and Particle Growth to CCN Sizes in the Summertime Marine Arctic Is Driven by Materials More Semivolatile Than at Continental Sites: Organic Condensation and Particle Growth, Geophys. Res. Lett., 44, 10725–10734, https://doi.org/10.1002/2017GL075671, 2017.
Cai, J., Daellenbach, K. R., Wu, C., Zheng, Y., Zheng, F., Du, W., Haslett, S. L., Chen, Q., Kulmala, M., and Mohr, C.: Characterization of offline analysis of particulate matter with FIGAERO-CIMS, Atmos. Meas. Tech., 16, 1147–1165, https://doi.org/10.5194/amt-16-1147-2023, 2023.
Cavalli, F., Facchini, M. C., Decesari, S., Mircea, M., Emblico, L., Fuzzi, S., Ceburnis, D., Yoon, Y. J., O'Dowd, C. D., Putaud, J.-P., and Dell'Acqua, A.: Advances in characterization of size-resolved organic matter in marine aerosol over the North Atlantic, J. Geophys. Res., 109, D24215, https://doi.org/10.1029/2004JD005137, 2004.
Chen, Q., Sherwen, T., Evans, M., and Alexander, B.: DMS oxidation and sulfur aerosol formation in the marine troposphere: a focus on reactive halogen and multiphase chemistry, Atmos. Chem. Phys., 18, 13617–13637, https://doi.org/10.5194/acp-18-13617-2018, 2018.
Chernokulsky, A. V., Esau, I., Bulygina, O. N., Davy, R., Mokhov, I. I., Outten, S., and Semenov, V. A.: Climatology and Interannual Variability of Cloudiness in the Atlantic Arctic from Surface Observations since the Late Nineteenth Century, J. Climate, 30, 2103–2120, https://doi.org/10.1175/JCLI-D-16-0329.1, 2017.
Cloudnet: Classification data from Ny-Ålesund on 18 May 2020, ACTRIS Cloud remote sensing data centre unit (CLU), https://hdl.handle.net/21.12132/1.6ad98e2e244346e8 (last access: 24 November 2022), 2021.
Cruz, C. N. and Pandis, S. N.: A study of the ability of pure secondary organic aerosol to act as cloud condensation nuclei, Atmos. Environ., 31, 2205–2214, https://doi.org/10.1016/S1352-2310(97)00054-X, 1997.
Dall'Osto, M., Beddows, D. C. S., Tunved, P., Krejci, R., Ström, J., Hansson, H.-C., Yoon, Y. J., Park, K.-T., Becagli, S., Udisti, R., Onasch, T., O'Dowd, C. D., Simó, R., and Harrison, R. M.: Arctic sea ice melt leads to atmospheric new particle formation, Sci. Rep., 7, 3318, https://doi.org/10.1038/s41598-017-03328-1, 2017.
Dekhtyareva, A., Holmén, K., Maturilli, M., Hermansen, O., and Graversen, R.: Effect of seasonal mesoscale and microscale meteorological conditions in Ny-Ålesund on results of monitoring of long-range transported pollution, Polar Res., 37, 1508196, https://doi.org/10.1080/17518369.2018.1508196, 2018.
Drewnick, F., Schneider, J., Hings, S. S., Hock, N., Noone, K., Targino, A., Weimer, S., and Borrmann, S.: Measurement of Ambient, Interstitial, and Residual Aerosol Particles on a Mountaintop Site in Central Sweden using an Aerosol Mass Spectrometer and a CVI, J. Atmos. Chem., 56, 1–20, https://doi.org/10.1007/s10874-006-9036-8, 2006.
Eckhardt, S., Hermansen, O., Grythe, H., Fiebig, M., Stebel, K., Cassiani, M., Baecklund, A., and Stohl, A.: The influence of cruise ship emissions on air pollution in Svalbard – a harbinger of a more polluted Arctic?, Atmos. Chem. Phys., 13, 8401–8409, https://doi.org/10.5194/acp-13-8401-2013, 2013.
Giebl, H., Berner, A., Reischl, G., Puxbaum, H., Kasper-Giebl, A., and Hitzenberger, R.: CCN activation of oxalic and malonic acid test aerosols with the University of Vienna cloud condensation nuclei counter, J. Aerosol Sci., 33, 1623–1634, https://doi.org/10.1016/S0021-8502(02)00115-5, 2002.
Gierens, R., Kneifel, S., Shupe, M. D., Ebell, K., Maturilli, M., and Löhnert, U.: Low-level mixed-phase clouds in a complex Arctic environment, Atmos. Chem. Phys., 20, 3459–3481, https://doi.org/10.5194/acp-20-3459-2020, 2020.
Haywood, J. and Boucher, O.: Estimates of the direct and indirect radiative forcing due to tropospheric aerosols: A review, Rev. Geophys., 38, 513–543, https://doi.org/10.1029/1999RG000078, 2000.
Heslin-Rees, D., Burgos, M., Hansson, H.-C., Krejci, R., Ström, J., Tunved, P., and Zieger, P.: From a polar to a marine environment: has the changing Arctic led to a shift in aerosol light scattering properties?, Atmos. Chem. Phys., 20, 13671–13686, https://doi.org/10.5194/acp-20-13671-2020, 2020.
Hiranuma, N., Brooks, S. D., Moffet, R. C., Glen, A., Laskin, A., Gilles, M. K., Liu, P., Macdonald, A. M., Strapp, J. W., and McFarquhar, G. M.: Chemical characterization of individual particles and residuals of cloud droplets and ice crystals collected on board research aircraft in the ISDAC 2008 study: ISDAC CLOUD PARTICLE RESIDUALS, J. Geophys. Res.-Atmos., 118, 6564–6579, https://doi.org/10.1002/jgrd.50484, 2013.
Hoffmann, E. H., Tilgner, A., Schrödner, R., Bräuer, P., Wolke, R., and Herrmann, H.: An advanced modeling study on the impacts and atmospheric implications of multiphase dimethyl sulfide chemistry, P. Natl. Acad. Sci. USA, 113, 11776–11781, https://doi.org/10.1073/pnas.1606320113, 2016.
Hoppel, W. A., Frick, G. M., and Larson, R. E.: Effect of nonprecipitating clouds on the aerosol size distribution in the marine boundary layer, Geophys. Res. Lett., 13, 125–128, https://doi.org/10.1029/GL013i002p00125, 1986.
Hoppel, W. A., Frick, G. M., Fitzgerald, J. W., and Wattle, B. J.: A Cloud Chamber Study of the Effect That Nonprecipitating Water Clouds Have on the Aerosol Size Distribution, Aerosol Sci. Technol., 20, 1–30, https://doi.org/10.1080/02786829408959660, 1994.
Huang, J. and Jaeglé, L.: Wintertime enhancements of sea salt aerosol in polar regions consistent with a sea ice source from blowing snow, Atmos. Chem. Phys., 17, 3699–3712, https://doi.org/10.5194/acp-17-3699-2017, 2017.
Jang, S., Park, K.-T., Lee, K., Yoon, Y. J., Kim, K., Chung, H. Y., Jang, E., Becagli, S., Lee, B. Y., Traversi, R., Eleftheriadis, K., Krejci, R., and Hermansen, O.: Large seasonal and interannual variations of biogenic sulfur compounds in the Arctic atmosphere (Svalbard; 78.9∘ N, 11.9∘ E), Atmos. Chem. Phys., 21, 9761–9777, https://doi.org/10.5194/acp-21-9761-2021, 2021.
Karlsson, L., Krejci, R., Koike, M., Ebell, K., and Zieger, P.: A long-term study of cloud residuals from low-level Arctic clouds, Atmos. Chem. Phys., 21, 8933–8959, https://doi.org/10.5194/acp-21-8933-2021, 2021.
Karlsson, L., Baccarini, A., Duplessis, P., Baumgardner, D., Brooks, I. M., Chang, R. Y. -W., Dada, L., Dällenbach, K. R., Heikkinen, L., Krejci, R., Leaitch, W. R., Leck, C., Partridge, D. G., Salter, M. E., Wernli, H., Wheeler, M. J., Schmale, J., and Zieger, P.: Physical and Chemical Properties of Cloud Droplet Residuals and Aerosol Particles During the Arctic Ocean 2018 Expedition, J. Geophys. Res.-Atmos., 127, e2021JD035126, https://doi.org/10.1029/2021JD036383, 2022.
Kecorius, S., Vogl, T., Paasonen, P., Lampilahti, J., Rothenberg, D., Wex, H., Zeppenfeld, S., van Pinxteren, M., Hartmann, M., Henning, S., Gong, X., Welti, A., Kulmala, M., Stratmann, F., Herrmann, H., and Wiedensohler, A.: New particle formation and its effect on cloud condensation nuclei abundance in the summer Arctic: a case study in the Fram Strait and Barents Sea, Atmos. Chem. Phys., 19, 14339–14364, https://doi.org/10.5194/acp-19-14339-2019, 2019.
Kirpes, R. M., Bonanno, D., May, N. W., Fraund, M., Barget, A. J., Moffet, R. C., Ault, A. P., and Pratt, K. A.: Wintertime Arctic Sea Spray Aerosol Composition Controlled by Sea Ice Lead Microbiology, ACS Cent. Sci., 5, 1760–1767, https://doi.org/10.1021/acscentsci.9b00541, 2019.
Köhler, H.: The nucleus in and the growth of hygroscopic droplets, T. Faraday Soc., 32, 1152–1161, https://doi.org/10.1039/TF9363201152, 1936.
Korhonen, H., Carslaw, K. S., Spracklen, D. V., Ridley, D. A., and Ström, J.: A global model study of processes controlling aerosol size distributions in the Arctic spring and summer, J. Geophys. Res., 113, D08211, https://doi.org/10.1029/2007JD009114, 2008.
Lawler, M. J., Saltzman, E. S., Karlsson, L., Zieger, P., Salter, M., Baccarini, A., Schmale, J., and Leck, C.: New Insights Into the Composition and Origins of Ultrafine Aerosol in the Summertime High Arctic, Geophys. Res. Lett., 48, e2021GL094395, https://doi.org/10.1029/2021GL094395, 2021.
Leaitch, W. R., Korolev, A., Aliabadi, A. A., Burkart, J., Willis, M. D., Abbatt, J. P. D., Bozem, H., Hoor, P., Köllner, F., Schneider, J., Herber, A., Konrad, C., and Brauner, R.: Effects of 20–100 nm particles on liquid clouds in the clean summertime Arctic, Atmos. Chem. Phys., 16, 11107–11124, https://doi.org/10.5194/acp-16-11107-2016, 2016.
Lee, B. H., Lopez-Hilfiker, F. D., Mohr, C., Kurtén, T., Worsnop, D. R., and Thornton, J. A.: An Iodide-Adduct High-Resolution Time-of-Flight Chemical-Ionization Mass Spectrometer: Application to Atmospheric Inorganic and Organic Compounds, Environ. Sci. Technol., 48, 6309–6317, https://doi.org/10.1021/es500362a, 2014.
Lee, H., Lee, K., Lunder, C. R., Krejci, R., Aas, W., Park, J., Park, K.-T., Lee, B. Y., Yoon, Y. J., and Park, K.: Atmospheric new particle formation characteristics in the Arctic as measured at Mount Zeppelin, Svalbard, from 2016 to 2018, Atmos. Chem. Phys., 20, 13425–13441, https://doi.org/10.5194/acp-20-13425-2020, 2020.
Löflund, M., Kasper-Giebl, A., Schuster, B., Giebl, H., Hitzenberger, R., and Puxbaum, H.: Formic, acetic, oxalic, malonic and succinic acid concentrations and their contribution to organic carbon in cloud water, Atmos. Environ., 36, 1553–1558, https://doi.org/10.1016/S1352-2310(01)00573-8, 2002.
Lopez-Hilfiker, F. D., Mohr, C., Ehn, M., Rubach, F., Kleist, E., Wildt, J., Mentel, Th. F., Lutz, A., Hallquist, M., Worsnop, D., and Thornton, J. A.: A novel method for online analysis of gas and particle composition: description and evaluation of a Filter Inlet for Gases and AEROsols (FIGAERO), Atmos. Meas. Tech., 7, 983–1001, https://doi.org/10.5194/amt-7-983-2014, 2014.
Malloy, Q. G. J., Nakao, S., Qi, L., Austin, R., Stothers, C., Hagino, H., and Cocker, D. R.: Real-Time Aerosol Density Determination Utilizing a Modified Scanning Mobility Particle Sizer – Aerosol Particle Mass Analyzer System, Aerosol Sci. Technol., 43, 673–678, https://doi.org/10.1080/02786820902832960, 2009.
Mashayekhy Rad, F., Leck, C., Ilag, L. L., and Nilsson, U.: Investigation of ultrahigh-performance liquid chromatography/travelling-wave ion mobility/time-of-flight mass spectrometry for fast profiling of fatty acids in the high Arctic sea surface microlayer, Rapid Commun. Mass Spectrom., 32, 942–950, https://doi.org/10.1002/rcm.8109, 2018.
Mauritsen, T., Sedlar, J., Tjernström, M., Leck, C., Martin, M., Shupe, M., Sjogren, S., Sierau, B., Persson, P. O. G., Brooks, I. M., and Swietlicki, E.: An Arctic CCN-limited cloud-aerosol regime, Atmos. Chem. Phys., 11, 165–173, https://doi.org/10.5194/acp-11-165-2011, 2011.
McFarquhar, G. M., Ghan, S., Verlinde, J., Korolev, A., Strapp, J. W., Schmid, B., Tomlinson, J. M., Wolde, M., Brooks, S. D., Cziczo, D., Dubey, M. K., Fan, J., Flynn, C., Gultepe, I., Hubbe, J., Gilles, M. K., Laskin, A., Lawson, P., Leaitch, W. R., Liu, P., Liu, X., Lubin, D., Mazzoleni, C., Macdonald, A.-M., Moffet, R. C., Morrison, H., Ovchinnikov, M., Shupe, M. D., Turner, D. D., Xie, S., Zelenyuk, A., Bae, K., Freer, M., and Glen, A.: Indirect and Semi-direct Aerosol Campaign: The Impact of Arctic Aerosols on Clouds, B. Am. Meteorol. Soc., 92, 183–201, https://doi.org/10.1175/2010BAMS2935.1, 2011.
Moroni, B., Ritter, C., Crocchianti, S., Markowicz, K., Mazzola, M., Becagli, S., Traversi, R., Krejci, R., Tunved, P., and Cappelletti, D.: Individual Particle Characteristics, Optical Properties and Evolution of an Extreme Long-Range Transported Biomass Burning Event in the European Arctic (Ny-Ålesund, Svalbard Islands), J. Geophys. Res.-Atmos., 125, e2019JD0315, https://doi.org/10.1029/2019JD031535, 2020.
Moschos, V., Schmale, J., Aas, W., Becagli, S., Calzolai, G., Eleftheriadis, K., Moffett, C. E., Schnelle-Kreis, J., Severi, M., Sharma, S., Skov, H., Vestenius, M., Zhang, W., Hakola, H., Hellén, H., Huang, L., Jaffrezo, J.-L., Massling, A., Nøjgaard, J. K., Petäjä, T., Popovicheva, O., Sheesley, R. J., Traversi, R., Yttri, K. E., Prévôt, A. S. H., Baltensperger, U., and El Haddad, I.: Elucidating the present-day chemical composition, seasonality and source regions of climate-relevant aerosols across the Arctic land surface, Environ. Res. Lett., 17, 034032, https://doi.org/10.1088/1748-9326/ac444b, 2022a.
Moschos, V., Dzepina, K., Bhattu, D., Lamkaddam, H., Casotto, R., Daellenbach, K. R., Canonaco, F., Rai, P., Aas, W., Becagli, S., Calzolai, G., Eleftheriadis, K., Moffett, C. E., Schnelle-Kreis, J., Severi, M., Sharma, S., Skov, H., Vestenius, M., Zhang, W., Hakola, H., Hellén, H., Huang, L., Jaffrezo, J.-L., Massling, A., Nøjgaard, J. K., Petäjä, T., Popovicheva, O., Sheesley, R. J., Traversi, R., Yttri, K. E., Schmale, J., Prévôt, A. S. H., Baltensperger, U., and El Haddad, I.: Equal abundance of summertime natural and wintertime anthropogenic Arctic organic aerosols, Nat. Geosci., 15, 196–202, https://doi.org/10.1038/s41561-021-00891-1, 2022b.
Nomokonova, T., Ebell, K., Löhnert, U., Maturilli, M., Ritter, C., and O'Connor, E.: Statistics on clouds and their relation to thermodynamic conditions at Ny-Ålesund using ground-based sensor synergy, Atmos. Chem. Phys., 19, 4105–4126, https://doi.org/10.5194/acp-19-4105-2019, 2019.
Noone, K. J., Ogren, J. A., Heintzenberg, J., Charlson, R. J., and Covert, D. S.: Design and Calibration of a Counterflow Virtual Impactor for Sampling of Atmospheric Fog and Cloud Droplets, Aerosol Sci. Technol., 8, 235–244, https://doi.org/10.1080/02786828808959186, 1988.
Ogren, J. A., Heintzenberg, J., and Charlson, R. J.: In-situ sampling of clouds with a droplet to aerosol converter, Geophys. Res. Lett., 12, 121–124, https://doi.org/10.1029/GL012i003p00121, 1985.
Park, K., Yoon, Y. J., Lee, K., Tunved, P., Krejci, R., Ström, J., Jang, E., Kang, H. J., Jang, S., Park, J., Lee, B. Y., Traversi, R., Becagli, S., and Hermansen, O.: Dimethyl Sulfide-Induced Increase in Cloud Condensation Nuclei in the Arctic Atmosphere, Global Biogeochem. Cy., 35, e2021GB006969, https://doi.org/10.1029/2021GB006969, 2021.
Pasquier, J. T., David, R. O., Freitas, G., Gierens, R., Gramlich, Y., Haslett, S., Li, G., Schäfer, B., Siegel, K., Wieder, J., Adachi, K., Belosi, F., Carlsen, T., Decesari, S., Ebell, K., Gilardoni, S., Gysel-Beer, M., Henneberger, J., Inoue, J., Kanji, Z. A., Koike, M., Kondo, Y., Krejci, R., Lohmann, U., Maturilli, M., Mazzolla, M., Modini, R., Mohr, C., Motos, G., Nenes, A., Nicosia, A., Ohata, S., Paglione, M., Park, S., Pileci, R. E., Ramelli, F., Rinaldi, M., Ritter, C., Sato, K., Storelvmo, T., Tobo, Y., Traversi, R., Viola, A., and Zieger, P.: The Ny-Ålesund Aerosol Cloud Experiment (NASCENT): Overview and First Results, B. Am. Meteorol. Soc., 103, 2533–2558, https://doi.org/10.1175/BAMS-D-21-0034.1, 2022.
Pekour, M. S. and Cziczo, D. J.: Wake Capture, Particle Breakup, and Other Artifacts Associated with Counterflow Virtual Impaction, Aerosol Sci. Technol., 45, 758–764, https://doi.org/10.1080/02786826.2011.558942, 2011.
Platt, S. M., Hov, Ø., Berg, T., Breivik, K., Eckhardt, S., Eleftheriadis, K., Evangeliou, N., Fiebig, M., Fisher, R., Hansen, G., Hansson, H.-C., Heintzenberg, J., Hermansen, O., Heslin-Rees, D., Holmén, K., Hudson, S., Kallenborn, R., Krejci, R., Krognes, T., Larssen, S., Lowry, D., Lund Myhre, C., Lunder, C., Nisbet, E., Nizzetto, P. B., Park, K.-T., Pedersen, C. A., Aspmo Pfaffhuber, K., Röckmann, T., Schmidbauer, N., Solberg, S., Stohl, A., Ström, J., Svendby, T., Tunved, P., Tørnkvist, K., van der Veen, C., Vratolis, S., Yoon, Y. J., Yttri, K. E., Zieger, P., Aas, W., and Tørseth, K.: Atmospheric composition in the European Arctic and 30 years of the Zeppelin Observatory, Ny-Ålesund, Atmos. Chem. Phys., 22, 3321–3369, https://doi.org/10.5194/acp-22-3321-2022, 2022.
Pöhlker, M. L., Zhang, M., Campos Braga, R., Krüger, O. O., Pöschl, U., and Ervens, B.: Aitken mode particles as CCN in aerosol- and updraft-sensitive regimes of cloud droplet formation, Atmos. Chem. Phys., 21, 11723–11740, https://doi.org/10.5194/acp-21-11723-2021, 2021.
Quinn, P. K., Shaw, G., Andrews, E., Dutton, E. G., Ruoho-Airola, T., and Gong, S. L.: Arctic haze: current trends and knowledge gaps, Tellus B, 59, 99–114, https://doi.org/10.1111/j.1600-0889.2006.00236.x, 2007.
Rosenørn, T., Kiss, G., and Bilde, M.: Cloud droplet activation of saccharides and levoglucosan particles, Atmos. Environ., 40, 1794–1802, https://doi.org/10.1016/j.atmosenv.2005.11.024, 2006.
Saxena, P. and Hildemann, L. M.: Water-soluble organics in atmospheric particles: A critical review of the literature and application of thermodynamics to identify candidate compounds, J. Atmos. Chem., 24, 57–109, https://doi.org/10.1007/BF00053823, 1996.
Seinfeld, J. H. and Pandis, S. N.: Atmospheric chemistry and physics: from air pollution to climate change, 2nd ed., J. Wiley, Hoboken, N.J, 1203 pp., 2006.
Shingler, T., Dey, S., Sorooshian, A., Brechtel, F. J., Wang, Z., Metcalf, A., Coggon, M., Mülmenstädt, J., Russell, L. M., Jonsson, H. H., and Seinfeld, J. H.: Characterisation and airborne deployment of a new counterflow virtual impactor inlet, Atmos. Meas. Tech., 5, 1259–1269, https://doi.org/10.5194/amt-5-1259-2012, 2012.
Shupe, M. D. and Intrieri, J. M.: Cloud Radiative Forcing of the Arctic Surface: The Influence of Cloud Properties, Surface Albedo, and Solar Zenith Angle, J. Climate, 17, 616–628, https://doi.org/10.1175/1520-0442(2004)017<0616:CRFOTA>2.0.CO;2, 2004.
Siegel, K., Karlsson, L., Zieger, P., Baccarini, A., Schmale, J., Lawler, M., Salter, M., Leck, C., Ekman, A. M. L., Riipinen, I., and Mohr, C.: Insights into the molecular composition of semi-volatile aerosols in the summertime central Arctic Ocean using FIGAERO-CIMS, Environ. Sci. Atmos., 1, 161–175, https://doi.org/10.1039/D0EA00023J, 2021.
Siegel, K., Neuberger, A., Karlsson, L., Zieger, P., Mattsson, F., Duplessis, P., Dada, L., Daellenbach, K., Schmale, J., Baccarini, A., Krejci, R., Svenningsson, B., Chang, R., Ekman, A. M. L., Riipinen, I., and Mohr, C.: Using Novel Molecular-Level Chemical Composition Observations of High Arctic Organic Aerosol for Predictions of Cloud Condensation Nuclei, Environ. Sci. Technol., 56, 13888–13899, https://doi.org/10.1021/acs.est.2c02162, 2022.
Siegel, K., Gramlich, Y., Haslett, S. L., Freitas, G., Krejci, R., Zieger, P., and Mohr, C.: Arctic observations of Hydroperoxymethyl Thioformate (HPMTF) – seasonal behavior and relationship to other oxidation products from Dimethyl Sulfide at the Zeppelin Observatory, Svalbard, EGUsphere [preprint], https://doi.org/10.5194/egusphere-2023-146, 2023.
Simoneit, B. R. T., Schauer, J. J., Nolte, C. G., Oros, D. R., Elias, V. O., Fraser, M. P., Rogge, W. F., and Cass, G. R.: Levoglucosan, a tracer for cellulose in biomass burning and atmospheric particles, Atmos. Environ., 33, 173–182, https://doi.org/10.1016/S1352-2310(98)00145-9, 1999.
Sipilä, M., Sarnela, N., Neitola, K., Laitinen, T., Kemppainen, D., Beck, L., Duplissy, E.-M., Kuittinen, S., Lehmusjärvi, T., Lampilahti, J., Kerminen, V.-M., Lehtipalo, K., Aalto, P. P., Keronen, P., Siivola, E., Rantala, P. A., Worsnop, D. R., Kulmala, M., Jokinen, T., and Petäjä, T.: Wintertime subarctic new particle formation from Kola Peninsula sulfur emissions, Atmos. Chem. Phys., 21, 17559–17576, https://doi.org/10.5194/acp-21-17559-2021, 2021.
Stein, A. F., Draxler, R. R., Rolph, G. D., Stunder, B. J. B., Cohen, M. D., and Ngan, F.: NOAA's HYSPLIT Atmospheric Transport and Dispersion Modeling System, B. Am. Meteorol. Soc., 96, 2059–2077, https://doi.org/10.1175/BAMS-D-14-00110.1, 2015.
Stohl, A., Berg, T., Burkhart, J. F., Fjǽraa, A. M., Forster, C., Herber, A., Hov, Ø., Lunder, C., McMillan, W. W., Oltmans, S., Shiobara, M., Simpson, D., Solberg, S., Stebel, K., Ström, J., Tørseth, K., Treffeisen, R., Virkkunen, K., and Yttri, K. E.: Arctic smoke – record high air pollution levels in the European Arctic due to agricultural fires in Eastern Europe in spring 2006, Atmos. Chem. Phys., 7, 511–534, https://doi.org/10.5194/acp-7-511-2007, 2007.
Ström, J., Umegård, J., Tørseth, K., Tunved, P., Hansson, H.-C., Holmén, K., Wismann, V., Herber, A., and König-Langlo, G.: One year of particle size distribution and aerosol chemical composition measurements at the Zeppelin Station, Svalbard, March 2000–March 2001, Phys. Chem. Earth Parts ABC, 28, 1181–1190, https://doi.org/10.1016/j.pce.2003.08.058, 2003.
Struthers, H., Ekman, A. M. L., Glantz, P., Iversen, T., Kirkevåg, A., Mårtensson, E. M., Seland, Ø., and Nilsson, E. D.: The effect of sea ice loss on sea salt aerosol concentrations and the radiative balance in the Arctic, Atmos. Chem. Phys., 11, 3459–3477, https://doi.org/10.5194/acp-11-3459-2011, 2011.
Targino, A. C., Noone, K. J., Drewnick, F., Schneider, J., Krejci, R., Olivares, G., Hings, S., and Borrmann, S.: Microphysical and chemical characteristics of cloud droplet residuals and interstitial particles in continental stratocumulus clouds, Atmos. Res., 86, 225–240, https://doi.org/10.1016/j.atmosres.2007.05.001, 2007.
Thornton, J. A., Mohr, C., Schobesberger, S., D'Ambro, E. L., Lee, B. H., and Lopez-Hilfiker, F. D.: Evaluating Organic Aerosol Sources and Evolution with a Combined Molecular Composition and Volatility Framework Using the Filter Inlet for Gases and Aerosols (FIGAERO), Acc. Chem. Res., 53, 1415–1426, https://doi.org/10.1021/acs.accounts.0c00259, 2020.
Topping, D., Connolly, P., and McFiggans, G.: Cloud droplet number enhanced by co-condensation of organic vapours, Nat. Geosci., 6, 443–446, https://doi.org/10.1038/ngeo1809, 2013.
Topping, D. O. and McFiggans, G.: Tight coupling of particle size, number and composition in atmospheric cloud droplet activation, Atmos. Chem. Phys., 12, 3253–3260, https://doi.org/10.5194/acp-12-3253-2012, 2012.
Tørseth, K., Aas, W., Breivik, K., Fjæraa, A. M., Fiebig, M., Hjellbrekke, A. G., Lund Myhre, C., Solberg, S., and Yttri, K. E.: Introduction to the European Monitoring and Evaluation Programme (EMEP) and observed atmospheric composition change during 1972–2009, Atmos. Chem. Phys., 12, 5447–5481, https://doi.org/10.5194/acp-12-5447-2012, 2012.
Tunved, P., Ström, J., and Krejci, R.: Arctic aerosol life cycle: linking aerosol size distributions observed between 2000 and 2010 with air mass transport and precipitation at Zeppelin station, Ny-Ålesund, Svalbard, Atmos. Chem. Phys., 13, 3643–3660, https://doi.org/10.5194/acp-13-3643-2013, 2013.
Twohy, C. H. and Anderson, J. R.: Droplet nuclei in non-precipitating clouds: composition and size matter, Environ. Res. Lett., 3, 045002, https://doi.org/10.1088/1748-9326/3/4/045002, 2008.
Wendisch, M., Macke, A., Ehrlich, A., Lüpkes, C., Mech, M., Chechin, D., Dethloff, K., Velasco, C. B., Bozem, H., Brückner, M., Clemen, H.-C., Crewell, S., Donth, T., Dupuy, R., Ebell, K., Egerer, U., Engelmann, R., Engler, C., Eppers, O., Gehrmann, M., Gong, X., Gottschalk, M., Gourbeyre, C., Griesche, H., Hartmann, J., Hartmann, M., Heinold, B., Herber, A., Herrmann, H., Heygster, G., Hoor, P., Jafariserajehlou, S., Jäkel, E., Järvinen, E., Jourdan, O., Kästner, U., Kecorius, S., Knudsen, E. M., Köllner, F., Kretzschmar, J., Lelli, L., Leroy, D., Maturilli, M., Mei, L., Mertes, S., Mioche, G., Neuber, R., Nicolaus, M., Nomokonova, T., Notholt, J., Palm, M., van Pinxteren, M., Quaas, J., Richter, P., Ruiz-Donoso, E., Schäfer, M., Schmieder, K., Schnaiter, M., Schneider, J., Schwarzenböck, A., Seifert, P., Shupe, M. D., Siebert, H., Spreen, G., Stapf, J., Stratmann, F., Vogl, T., Welti, A., Wex, H., Wiedensohler, A., Zanatta, M., and Zeppenfeld, S.: The Arctic Cloud Puzzle: Using ACLOUD/PASCAL Multiplatform Observations to Unravel the Role of Clouds and Aerosol Particles in Arctic Amplification, B. Am. Meteorol. Soc., 100, 841–871, https://doi.org/10.1175/BAMS-D-18-0072.1, 2019.
Willis, M. D., Burkart, J., Thomas, J. L., Köllner, F., Schneider, J., Bozem, H., Hoor, P. M., Aliabadi, A. A., Schulz, H., Herber, A. B., Leaitch, W. R., and Abbatt, J. P. D.: Growth of nucleation mode particles in the summertime Arctic: a case study, Atmos. Chem. Phys., 16, 7663–7679, https://doi.org/10.5194/acp-16-7663-2016, 2016.
World Meteorological Organization: Guide to meteorological instruments and methods of observation, 7th ed., World Meteorological Organization, Geneva, Switzerland, ISBN 978-92-63-10008-5, 2018.
Xavier, C., Baykara, M., Wollesen de Jonge, R., Altstädter, B., Clusius, P., Vakkari, V., Thakur, R., Beck, L., Becagli, S., Severi, M., Traversi, R., Krejci, R., Tunved, P., Mazzola, M., Wehner, B., Sipilä, M., Kulmala, M., Boy, M., and Roldin, P.: Secondary aerosol formation in marine Arctic environments: a model measurement comparison at Ny-Ålesund, Atmos. Chem. Phys., 22, 10023–10043, https://doi.org/10.5194/acp-22-10023-2022, 2022.
Zangrando, R., Barbaro, E., Zennaro, P., Rossi, S., Kehrwald, N. M., Gabrieli, J., Barbante, C., and Gambaro, A.: Molecular Markers of Biomass Burning in Arctic Aerosols, Environ. Sci. Technol., 47, 8565–8574, https://doi.org/10.1021/es400125r, 2013.
Zelenyuk, A., Imre, D., Earle, M., Easter, R., Korolev, A., Leaitch, R., Liu, P., Macdonald, A. M., Ovchinnikov, M., and Strapp, W.: In Situ Characterization of Cloud Condensation Nuclei, Interstitial, and Background Particles Using the Single Particle Mass Spectrometer, SPLAT II, Anal. Chem., 82, 7943–7951, https://doi.org/10.1021/ac1013892, 2010.