the Creative Commons Attribution 4.0 License.
the Creative Commons Attribution 4.0 License.
 | 09 Jun 2023
The (mis)identification of high-latitude dust events using remote sensing methods in the Yukon, Canada: a sub-daily variability analysis
Rosemary Huck
Robert G. Bryant
James King
The observation and quantification of mineral dust fluxes from high-latitude sources remains difficult due to a known paucity of year-round in situ observations and known limitations of satellite remote sensing data (e.g. cloud cover and dust detection). Here we explore the chronology of dust emissions at a known and instrumented high-latitude dust source: Lhù'ààn Mân (Kluane Lake) in Yukon, Canada. At this location we use oblique time-lapse (RC) cameras as a baseline for analysis of aerosol retrievals from in situ metrological data, AERONET, and co-incident MODIS MAIAC to (i) investigate the daily to annual chronology of dust emissions recorded by these instrumental and remote sensing methods (at timescales ranging from minutes to years) and (ii) use data intercomparisons to comment on the principal factors that control the detection of dust in each case.
Lhù'ààn Mân is a prolific mineral dust source; on 24 May 2018 the RC captured dust in motion throughout the entire day, with the longest dust-free period lasting only 30 min. When compared with time series of RC data, optimized AERONET data only manage an overall 26 % detection rate for events (sub-day) but 100 % detection rate for dust event days (DEDs) when dust was within the field of view. In this instance, RC and remote sensing data were able to suggest that the low event detection rate was attributed to fundamental variations in dust advection trajectory, dust plume height, and inherent restrictions in sun angle at high latitudes. Working with a time series of optimized aerosol optical depth (AOD) data (covering 2018/2019), we were able to investigate the gross impacts of data quality (DQ) choice on DED detection at the month or year scale. Relative to ground observations, AERONET's DQ2.0 cloud-screening algorithm may remove as much as 97 % of known dust events (3 % detection). Finally, when undertaking an AOD comparison for DED and non-DED retrievals, we find that cloud screening of MODIS/AERONET lead to a combined low sample of co-incident dust events and weak correlations between retrievals. Our results quantify and explain the extent of under-representation of dust in both ground and space remote sensing methods; this is a factor that impacts on the effective calibration and validation of global climate and dust models.
- Article
(7908 KB) - Full-text XML
-
Supplement
(7341 KB) - BibTeX
- EndNote


Mineral aerosols (MA or dust) are a large source of uncertainty in assessments and predictions of climate change (IPCC, 2013) and the importance of dust sources in the high-latitude (≥50∘ N and ≥40∘ S, including the Arctic as a subregion ≥60∘ N) in land–ocean–atmosphere systems has recently been recognized (IPCC, 2019; Meinander et al., 2022; Schmale et al., 2021; Tobo et al., 2019; Groot Zwaaftink et al., 2016). Plumes of dust are known as dust events, and when dust is suspended in the atmosphere it can change the scattering and absorption of incoming solar radiation, reducing the amount of incoming solar radiation (Arnalds et al., 2016; Haywood and Boucher, 2000; Kylling et al., 2018; Yoshioka et al., 2007) and affect local meteorology through altering cloud properties by becoming condensation or ice nuclei, triggering cloud formation (Murray et al., 2021; Tobo et al., 2019; Xi et al., 2022). Deposited dust are important sources of nutrients in both aquatic (Crusius et al., 2017; Schroth et al., 2017) and terrestrial (Moroni et al., 2018) ecosystems.
The impact that dust suspended in the atmosphere has on the climate system varies with dust characteristics such as particle shape, size, and composition (Kok et al., 2012; Bryant, 2013; Bullard et al., 2016), all of which are highly influenced by their origin. Some high-latitude mineral aerosols (HLMA) can be distinguished from low-latitude mineral aerosols through different physical, optical, and chemical properties, owing to their glaciogenic beginnings (Bachelder et al., 2020; Baldo et al., 2020; Crocchianti et al., 2021; Crusius, 2021; Meinander et al., 2022). High-latitude dust also have an important role influencing ice and snow albedo, with dust depositing onto glaciers and ice sheets forming cryoconite and subsequently influencing glacier hydrology and mass balance and inducing cryospheric melt (Cooke et al., 2016; IPCC, 2019; Krinner et al., 2006; Réveillet et al., 2022; Wientjes et al., 2011). With increased deglaciation, deposition of dust onto ice has been increasing, indicating a greater influence of high-latitude dust on the future climate system (Amino et al., 2021; Shi et al., 2022).
Although an estimated 5 % of global dust emissions originate from high-latitude sources (Bullard et al., 2016; Groot Zwaaftink et al., 2016), the periods when emissions occur are highly seasonal (van Soest et al., 2022). The supply of glacially derived sediment is dependent upon glacier dynamics and related hydrology (Bullard et al., 2011). Spatially explicit sources are mostly deglaciated valleys that have an abundance of fine glacially derived sediment known as “glacial flour” providing near-perfect conditions for entrainment, linked to a particle size mean of ∼100 µm (e.g. Mockford et al., 2018). But emissions are also temporarily limited to when the snow has melted, the ground has thawed, and the rivers are low, as to when sediment can be made available for transport by wind (e.g. Crusius et al., 2011). The inherent challenges of operating in these polar regions (including inaccessibility and expense) and capturing events have led to, aside from a few well-monitored sites, high-latitude emission locations being poorly instrumented and emission characteristics largely being derived from remotely sensed platforms (Ranjbar et al., 2021; van Soest et al., 2022).
Ultimately, global dust models can struggle to predict the amount of dust emitted from high-latitude sources (e.g. Schmale et al., 2021). Crusius (2021) suggests that this may be due to challenges of matching model spatial resolution to the scale at which complex thermally driven, high-speed winds are topographically funnelled down narrow proglacial valleys and operate to drive dust emissions. At the same time, detection, and quantification of high-latitude dust events and dust sources is known to be challenging (Bullard et al., 2016). Dust events are often detected through increases in aerosol optical depth (AOD), whether this be through ground (e.g. AERONET) or space-based (e.g. MODIS products) methods. Both approaches are impacted by cloud and the discrete nature of events in space and time (Bryant and Baddock, 2022). Nevertheless, improved detection, understanding, and quantification of high-latitude dust events remains integral to the development and accuracy of global dust and climate models (Arnalds et al., 2016; Bullard et al., 2016).
Dust particles suspended in the atmosphere often have a short lifetime and are heterogeneous in nature (Schepanski, 2018). They are difficult to detect and characterize, especially using space-based techniques (Ciren and Kondragunda, 2014; Kahn et al., 2015; Luo et al., 2015). Consequently, ground-based detection techniques have become a useful aid to verify and improve the accuracy of satellite retrievals, as well as a foundation for independent atmospheric investigation (Estevan et al., 2019; Formenti et al., 2011). The Aerosol Robotic Network (AERONET) is a ground-based collaborative network of automated sun–sky scanning spectral radiometers that determine the aerosol optical and microphysical properties by direct sun and “sky-scan” measurements (Holben, 1998). AERONET is often used in comparison to space-based aerosol detection techniques, as it is used as a standard means of data calibration and validation (Martins et al., 2017; Mhawish et al., 2019). The spectral aerosol optical depth determined from these data are also used to derive an Ångström exponent (α), which can in turn allow estimation of aerosol particle size (O'Neill et al., 2003). These data have been used to differentiate between coarse-mode particles (dust) and fine-mode particles (such as smoke and anthropogenic pollutants; Eck et al., 1999; Ciren and Kondragunta, 2014).
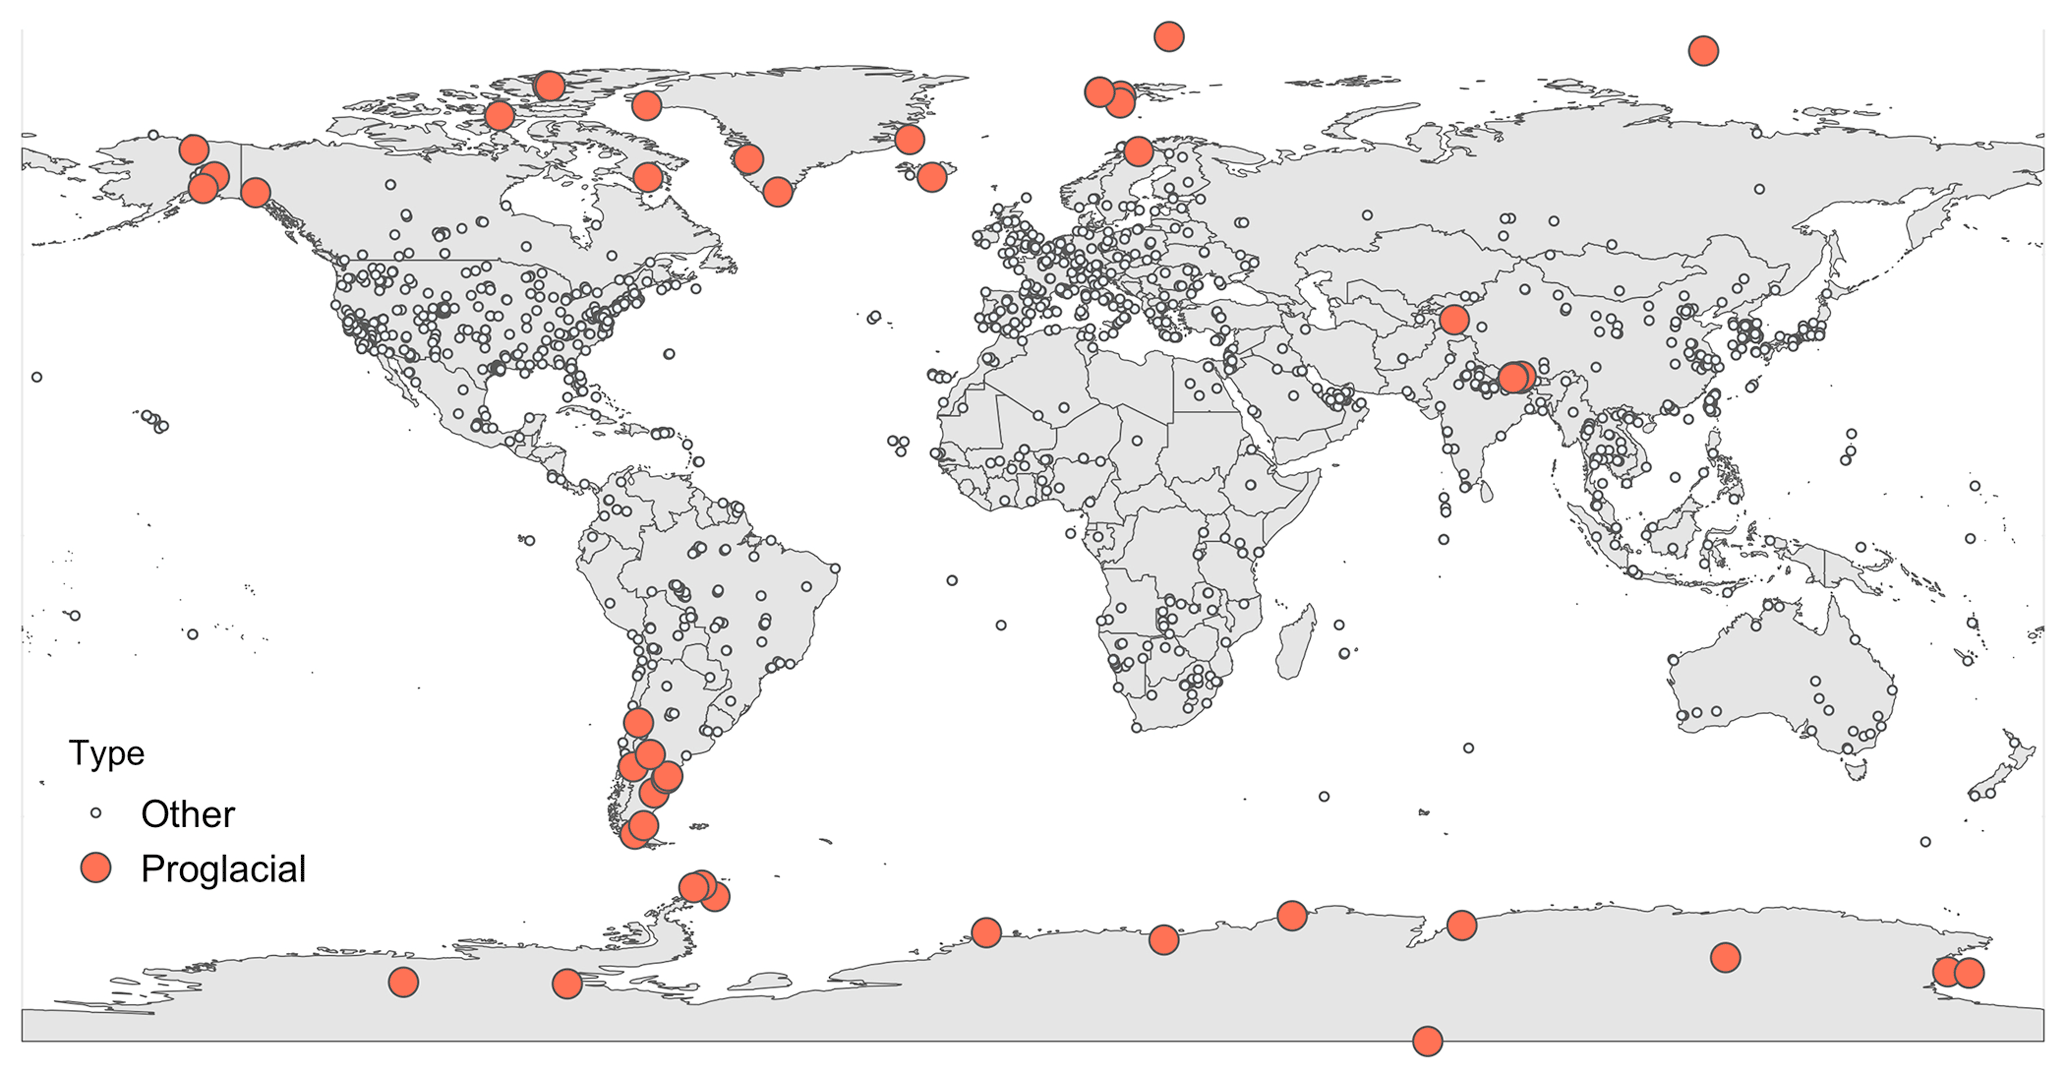
Figure 1Location of all AERONET stations with stations in the high latitudes or proglacial areas highlighted in orange. Cryospheric stations account for 48 out of 1655 global AERONET (data from the AERONET website: https://aeronet.gsfc.nasa.gov, last access: 13 May 2023).
Understandably, the small number of high-latitude AERONET stations relative to lower-latitude stations (3 %; see Fig. 1) has made studies of the radiative properties of HLMA for both calibration and validation of models and optimization of detection algorithms difficult. The most readily available resource for the processes of detection and quantification of HLMA events and advection are a suite of Low Earth Orbit (LEO) sensors such as Moderate Resolution Imaging Spectroradiometer (MODIS) onboard the Aqua and Terra NASA satellites (e.g. Bryant, 2013; Kandakji et al., 2020; McGrath et al., 2010; Mhawish et al., 2019). MODIS has been used successfully to monitor single HLMA events at Ellesmere Island, Nunavut, Canada (Ranjbar et al., 2021), but consistent monitoring of high-latitude dust sources using LEO sensors poses specific challenges. Importantly, there are some identifiable spatial and temporal bias inherent in remote sensing of high-latitude dust using LEO sensors, which includes an understanding of the impact of clouds on dust event and dust source detection (e.g. Gassó and Stein, 2007) and the fact that most polar-orbiting LEO platforms and sensors have overpass times that may observe dust in transport (i.e. dust advection) rather than active emission near to the source or not at all. It is clear, for example, that remote sensing observations of HLMA are significantly under-estimated as a result (Prospero et al., 2012; Bullard et al., 2016). Where possible, satellite observations are often augmented with ground-based meteorological and dust flux data (e.g. Arnalds, 2010; Schroth et al., 2017; Thorsteinsson et al., 2011) and occasionally verified through use of ground-based AERONET (Baddock et al., 2009; Harley et al., 2017). As a result, our understanding of the spectral signatures of HLMA in AERONET data remains important, as the few well-monitored research areas that have AERONET stations in the high latitudes are necessarily used as analogues for other HLMA emission locations (e.g. Shi et al., 2022).
Here we seek to improve our understanding of high-latitude dust event detection in space and time. Our research focuses on dust event detection at a known persistent dust source in the proglacial area of Lhù'ààn Mân (Kluane Lake) in the Yukon, Canada, and involves synergistic analysis of dust aerosol optical properties via both space and ground-based remote sensing platforms to characterize dust event occurrence and locate dust sources. As part of this endeavour, we seek to address the following research questions.
-
What is the annual chronology of high-latitude mineral aerosol (HLMA) emissions at Lhù'ààn Mân (Kluane Lake) as observed via different remote sensing retrieval approaches (LEO, and ground-based AERONET)?
-
How do remote observations of dust compare to ground (Met, RC) and AERONET observations at the high-latitude dust event scale?
The proglacial area surrounding Lhù'ààn Mân (61∘1′5" N, 138∘29′40" W), Yukon, provides an exceptional opportunity for quantifying and detecting dust emissions where events are not supply limited. The site is uniquely heavily instrumented with a suite of ground-based environmental monitoring and remote sensing platforms. Á'áy Chù (Slims River) is a proglacial river from the Kaskawulsh Glacier, in the Yukon, Canada. The river delta is ∼25 km from the glacier terminus and until recently flowed into Lhù'ààn Mân. The soils in the 8 km wide valley consist mostly of glacial flour and are subject to strong topographically funnelled and thermally driven winds (Bachelder et al., 2020).
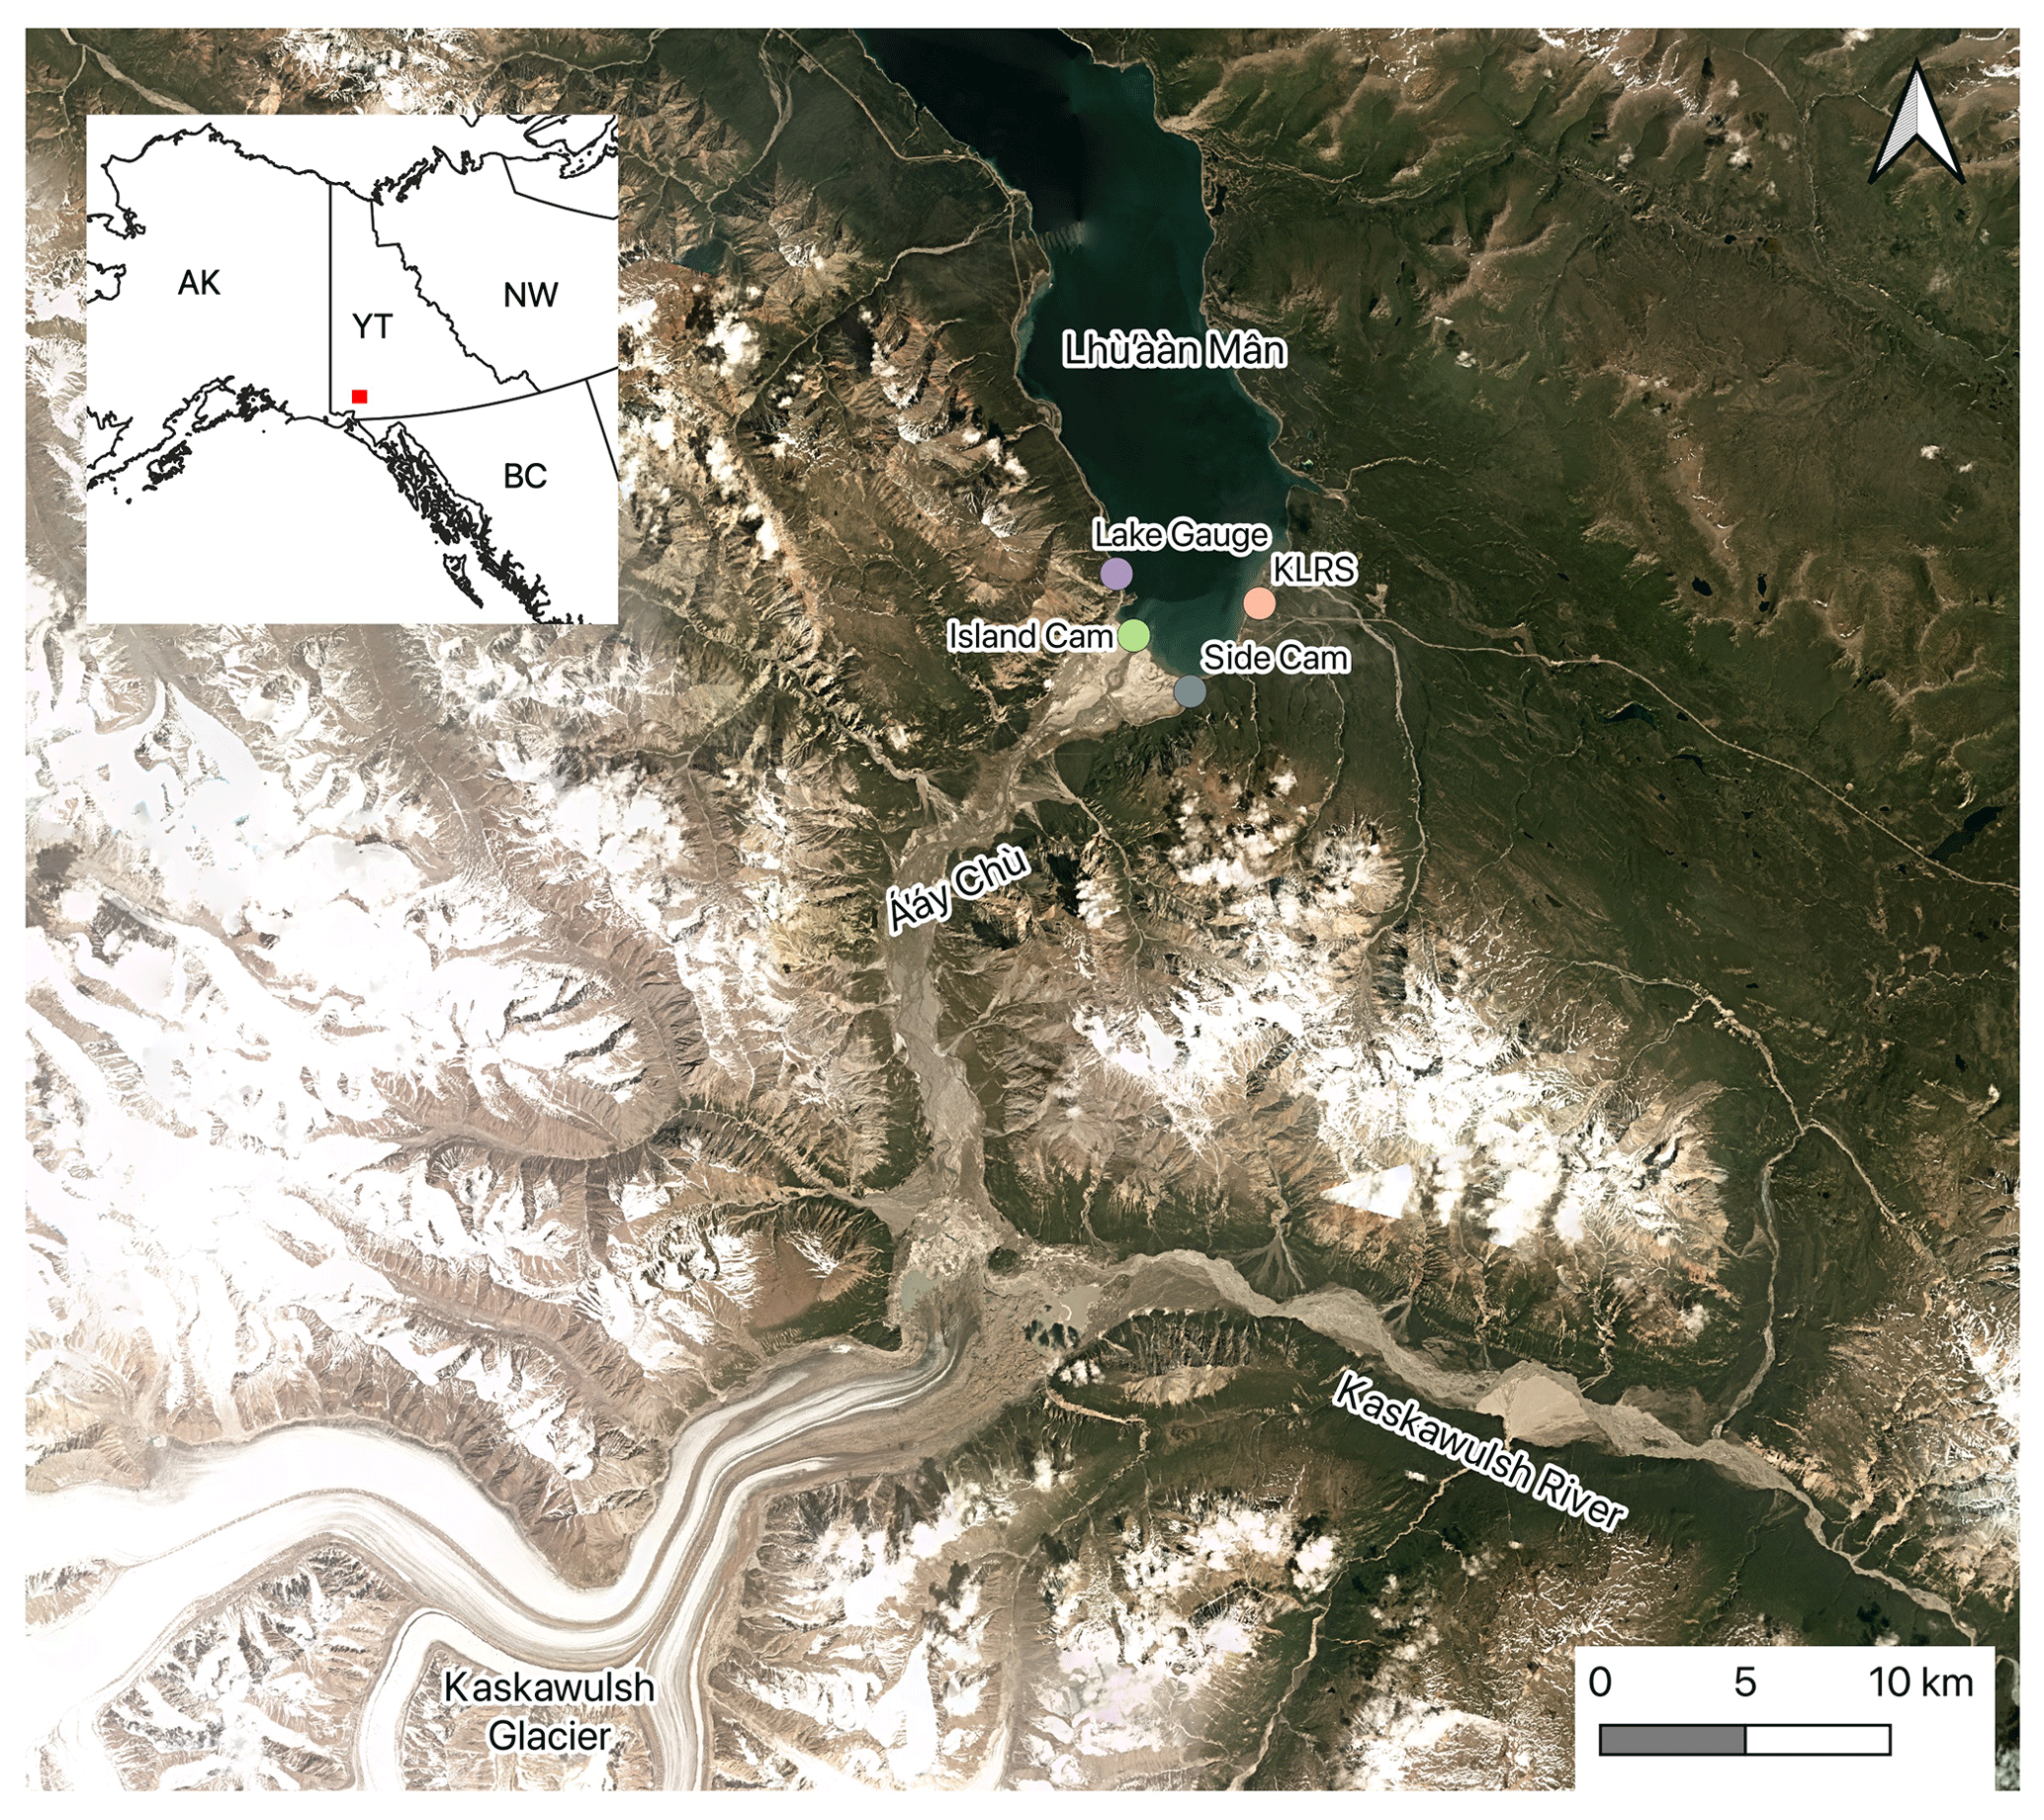
Figure 2The Lhù'ààn Mân study site and setting with notable measuring stations and features highlighted. Kluane Lake Research Station (KLRS) contains both the AERONET and meteorological stations. Base imagery is from Planet imagery in June 2018.
2.1 Climatology
The region is in the shadow of some of the highest peaks in North America (e.g. Mount Logan, 5959 m above sea level). Subsequently the Lhù'ààn Mân region is in a prominent orographic rain shadow by the St. Elias Mountain and has a dry, cold continental climate with an annual precipitation of 300–800 mm (Williamson et al., 2014). As with many of the large lakes in the Yukon, historical scientific data around Lhù'ààn Mân is limited (McKnight et al., 2021). A weather station was established at Burwash Landing at the northern end of the lake in 1967; however, the station is ∼45 km from the research site and strong meteorological gradients towards the alpine glaciers produce a highly variable climate in the region. The climate of southwestern Yukon was warmer than it is today in the late Holocene, and Lhù'ààn Mân discharged south towards the Alsek River. Climate statistics collected at the Lhù'ààn Mân research site in 2018 show an average temperature of 8.7±6.4 ∘C during May to October with a 0 ∘C crossing occurring in late April.
2.2 Glacial Retreat and Riverbed Exposure
The Kaskawulsh glacier (Fig. 2) has been in retreat since the 19th century, with retreat increasing in the late 20th and early 21st centuries, with the glacier retreating 655 m from 1956–2007 (Foy et al., 2011; Shugar et al., 2017). The retreat led to the Á'áy Chù being the first recorded river to be impacted by climate change as the meltwaters were redirected into the eastward flowing Kaskawulsh river, dramatically reducing the Á'áy Chù's discharge and leaving more riverbed exposed for aeolian sediment deflation (Shugar et al., 2017; Bachelder et al., 2020). The re-routing of the river has resulted in a significant increase in the frequency of dust events at the river delta.
2.3 Prior dust observations
The delta of the Á'áy Chù is known to be a persistent dust source with events observed daily during the spring and summer during previous field research (Nickling, 1978; Nickling and Brazel, 1985; Bachelder et al., 2020). As a result, the site has been carefully and highly instrumented to understand dust emissions. In 2018 during a month-long field trip in May, dust in motion was observed almost daily and emitted dust exceeded local air quality safety thresholds (Bachelder et al., 2020). Dust emitted at the site comprises primarily non-spherical aluminosilicate clay mineral aggregates, as well as other pure minerals (Bachelder et al., 2020). As over half the sediment entrained at the site are composed of clay, the suggested predominant mechanism of dust emission is through the rupturing of clay coatings and release of resident fine particles (Bachelder et al., 2020). This site is highly dynamic, where glacial, fluvial, and aeolian processes meet and interplay and are stressed by climate warming and typical of dust emissions in the Yukon. However, the relative lack of observations of high-latitude dust in North America compared to other high-latitude sources (e.g. Iceland and Greenland) results in the specific need for enhanced remote sensing data monitoring approaches and forecast models to fully understand the contribution of North American high-latitude dust in the global dust cycle.
3.1 Meteorological measurements
Half-hourly maximum wind speed, average wind direction, rainfall total, atmospheric pressure, relative humidity, snow depth, and average temperature are recorded at Kluane Lake Research Station (KLRS). Lake depth is taken from the Environment Canada recording station Kluane Lake near Burwash Landing (9CA001). Following the river diversion in 2016, Lhù'ààn Mân has been receding in height due to the decreased discharge of the Á'áy Chù, with maximum lake depth dropping from 4.51 m in 2013 to 2.20 m in 2016 at the Burwash Landing recording site. In this region, there are quite complex wind regimes that are influenced by the topography, the ice caps on the mountains, and the presence of Lhù'ààn Mân. The meteorological station at KLRS is located on the southern end of the lake ∼7 km east of the river–lake confluence. This location means that the station is influenced by stronger synoptic winds travelling down the valley and across the lake; however, thermal drainage winds channel down the steep-sided valleys and influence wind direction at the study site. This is evidenced in meteorological stations further up and down the valley which are much less directionally variable than KLRS, with dominant wind directions of north-northeast (see Fig. S1). The average wind speed over the 2018 dust season at KLRS was 3.60 m s−1 varying from 0.00 to 15.01 m s−1.
3.2 AERONET observations
The AERONET (Aerosol Robotic Network; Holben, 1998) is a federated network of ground-based sun photometers that measure the rate of solar ray extinction in the atmospheric column above the photometer to determine AOD alongside other atmospheric properties. Data from the network of sun photometers are uploaded in near-real time (within 2 h of being recorded) and are freely available for download from NASA's AERONET website (https://aeronet.gsfc.nasa.gov, last access: 13 May 2023) processed by the version 3 automated control algorithm (Giles et al., 2019). Both AOD data and α (Eck et al., 1999) AERONET data are often available for immediate or near-real time download.
The Kluane Lake AERONET station (see Figs. 2 and S1 for location) recorded data from early May to late October in 2018, 2019, 2020, and 2021. AERONET returns at 1.0 data quality (DQ) range between 232 measurements per day (maximum observed on 21 June 2019) to 1 measurement per day (minimum observed on 6 July 2018) at KLRS. At the study site, dust events were observed and recorded throughout the May–October period, along with the presence of other aerosols (e.g. smoke). AERONET AOD data are computed at three DQ levels: level 1.0 (unscreened), level 1.5 (represents near-real-time automatic cloud screening and automatic instrument anomaly quality controls), and level 2.0 (all of above and applying pre-field and post-field calibrations) with the version 3 automated control algorithm. For this study, all DQ level AOD returns at 1020 and 500 nm were used and evaluated, and all AERONET data were derived using the version 3 retrieval algorithm. The absolute error in AERONET AOD retrievals at all wavelengths used in this study is assumed to be 0.01–0.02 (Holben et al., 1998; AERONET website).
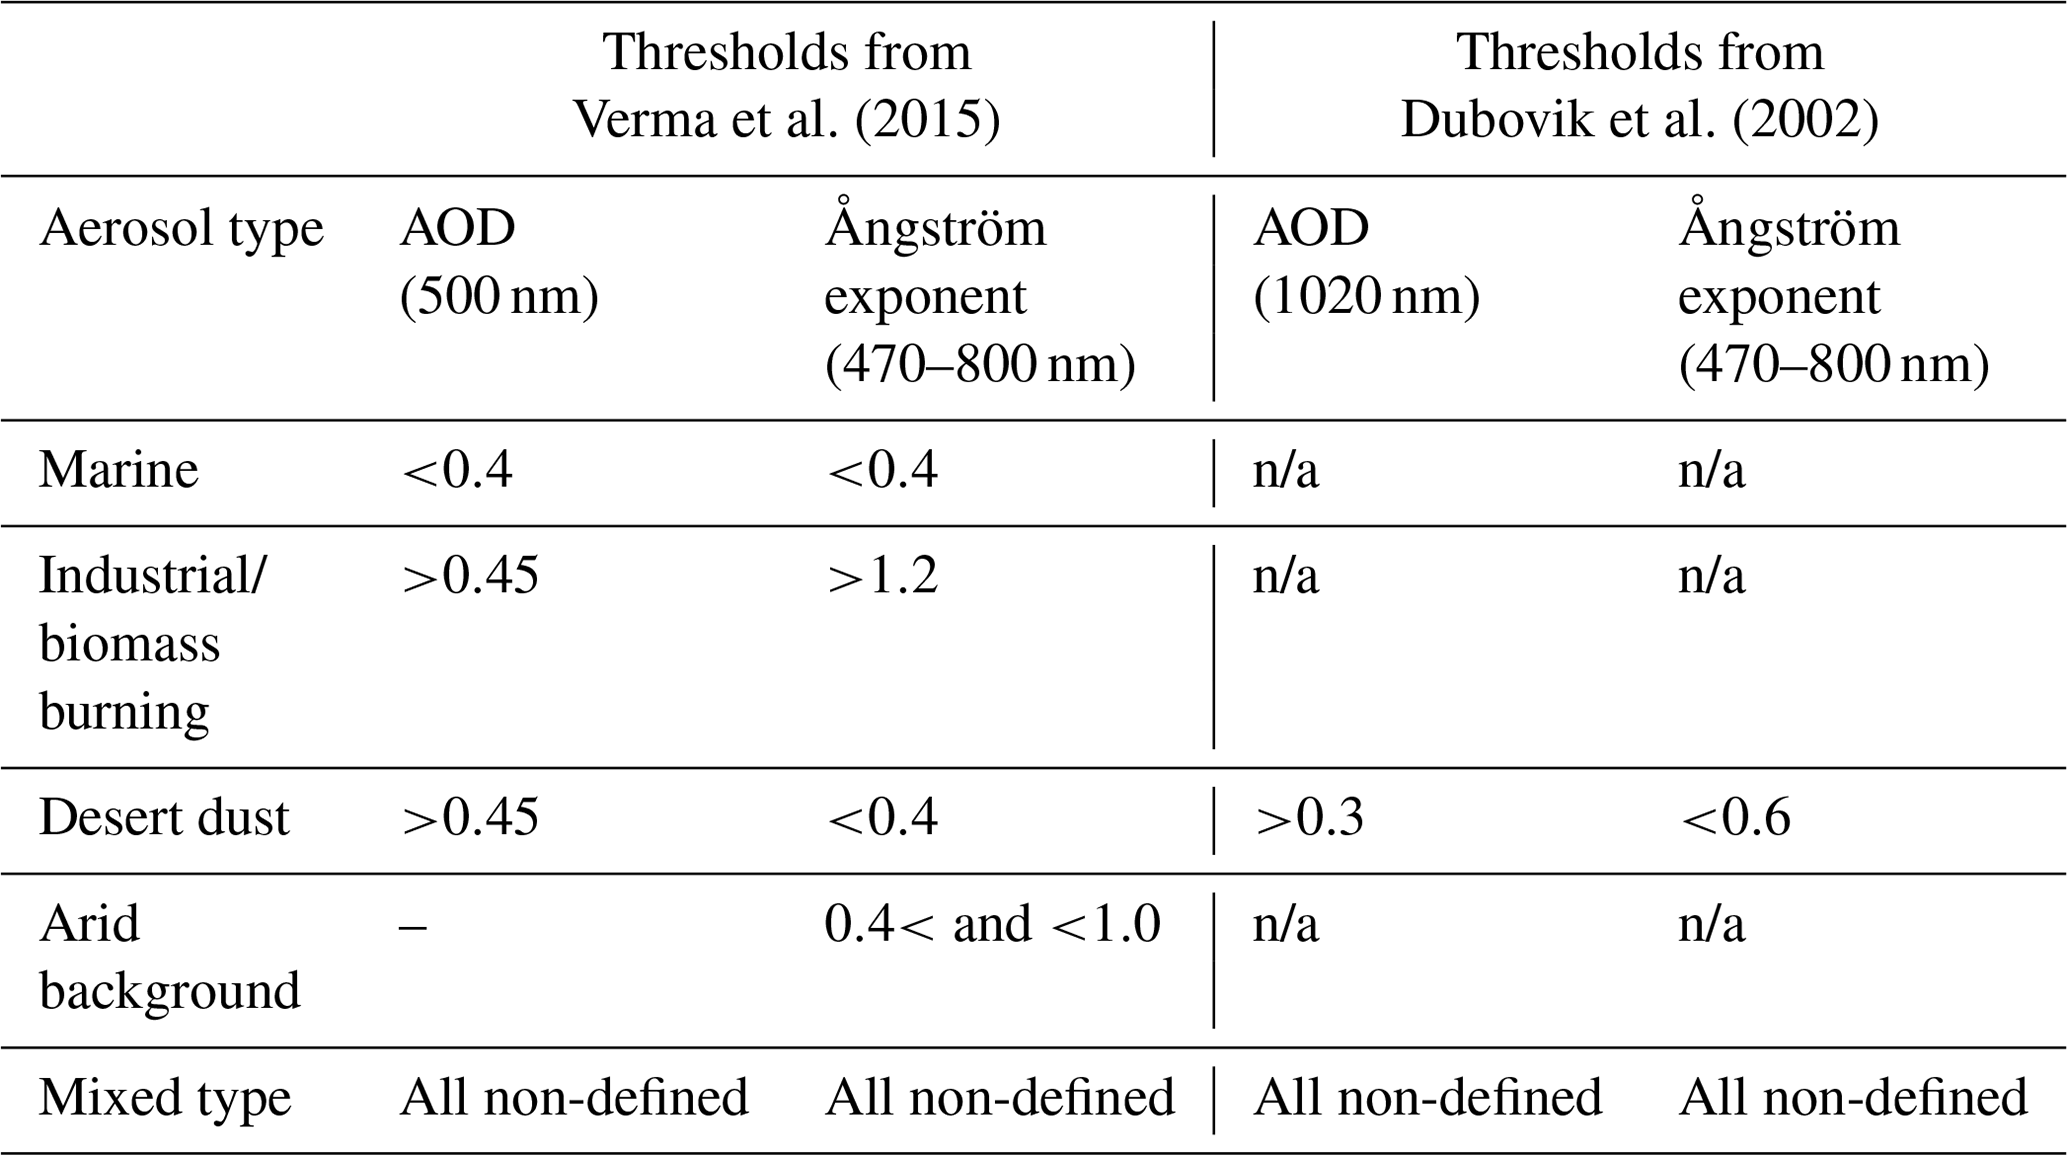
The primary AERONET station used in this study is located at the Kluane Lake Research Station (KLRS) at Silver City Airport (61∘1′38.14" N 138∘24′38.58" W). This is at the southern end of the lake ∼7 km east of the river–lake confluence (see Fig. 2). As the sun photometer undertakes almucantar retrievals during daylight hours, dust entrained from the delta that interacts with the scanning field-of-view is recorded. As noted, other aerosol pollutants also contribute to AOD at this site, so to discern the presence of dust, a combination of AERONET observation at 1020 nm with an AOD greater than 0.3 and an α of less than 0.6 between 440 and 870 nm was used (Dubovik et al., 2002). In this case, we use detection at 1020 nm as the regression curves of optical parameters are more robust than those of other wavelengths for suspended dust (Dubovik et al., 2002). Days in which these criteria were met in the AERONET 1.0 DQ data for a period longer than 30 min were then classified as dust event days (DEDs).
To better understand the overall aerosol composition at the study site location, shorter wavelengths were then examined to classify the other aerosol pollutants. Fine-mode aerosols are more accurately recorded at short wavelengths to get accurately observed optical thickness (Dubovik et al., 2002) and are used here to examine and define these aerosol types (Table 1; Dubovik et al., 2002; Verma et al., 2015). The AERONET retrieval algorithm uses AOD, and sky radiance measurements are input to determine volume particle size distributions at 22 logarithmically equidistant discrete effective radius (r) sizes from 0.05 µm ≤ r≤15 µm (Dubovik et al., 2000), which are used to estimate particle diameters. These data allow some calculation of the aggregated range of aerosol diameters observed at the site, and their relative frequency (Dubovick et al., 2002). In addition, given that α values of >2.0 indicates fine mode and lower values indicate coarse mode (Santese et al., 2007; Schuster et al., 2006), these data can also be used to explore how dust properties change over the duration of an event and how they differ between sites. Single scattering albedo (SSA) data were also derived from the AERONET inversion products. SSA provides the ratio of scattering and extinction coefficients, and is dependent upon concentration of particles, shape, and size distribution (Jacobson, 2000; Yu et al., 2013).
Particle size is an important indicator to help understand what wavelength should be selected to detect coarse-mode dust in AERONET data (Dubovik et al., 2002; Eck et al., 2010). Other polluting aerosols are fine mode, and therefore shorter wavelengths are used for their detection (Eck et al., 2010). To identify dust in combination with other aerosols these shorter wavelengths must be used. Typical aerosol definitions were used for 500 nm wavelength data (e.g. Verma et al., 2015) and then amalgamated with typical desert dust thresholds that have been previously applied at 1020 nm (Dubovik et al., 2002). Dust events are best recorded at the longer 1020 nm wavelength as non-spherical dust grains cause scattering that give artificial spectral dependence of the real part of the refractive index at shorter wavelengths, allowing for more robust regression of optical parameters at longer wavelengths (Dubovik et al., 2002). The Verma et al. (2015) threshold is used in this study for broad characterization of the aerosols at the site and has been used in other scholarly articles for helping define thresholds (e.g. Bibi et al., 2016; Djossou et al., 2018; Iftikhar et al., 2018; Léon et al., 2021; Platero et al., 2018; Singh et al., 2020). Under the Verma et al. (2015) classification, marine aerosols are flagged, but at KLRS we concur and assume that these possibly represent clouds and/or other arid background aerosols present at the site (see Table 1).
Table 1Aerosol type and the threshold used to classify them at the 500 nm wavelength from Verma et al. (2015) and 1020 nm wavelength from Dubovik et al. (2002); n/a indicates values that are not defined.
3.3 Remote sensing data
3.3.1 Remote cameras (RCs)
As noted, dust events are not always recorded by satellite remote sensing systems due to issues related to the low magnitude, discrete space, timescale of dust emission and advection (Murray et al., 2016; Bryant and Baddock, 2022), or bias associated with the cloud cover and the satellite overpass time, with the two last points being especially important for the observation of HLMA (e.g. Bullard et al., 2016). Urban et al. (2018) refined this understanding further using remote cameras (RC) with images taken of a low-latitude desert dust source every 0.25 h during daylight between 2010 and 2016, yielding a time series of 135 000 images. Despite reporting that dust emissions occurred on 20 % of the camera-sampled days, Urban et al. (2018) were able to confirm from (i) examination of MODIS satellite images on the same days and (ii) ground observations (e.g. visibility) that dust was not observed by either of those techniques. Evan (2019) develops the RC approach further to combine field PM10 (particulate matter less than 10 µm) measurements and a time-lapse RC (0.3 h sample) with a 360∘ field of view (FOV) and was able to monitor and quantify fugitive dust emissions in the Salton Sea, California. In our study, to determine the presence of dust events, oblique RCs were set up at various locations across the Á'áy Chù delta to capture a range of dust event information (Fig. 3; dust event time, source location, dust advection trajectory). The dust plume origin, height, and frequency data collected by RCs operated at a spatial scale and timescale that facilitated direct comparison with synergistic ground (e.g. AERONET, meteorological data) and space-based (e.g. LEO remote sensing) observations. Two cameras were used in the study, one directed down-valley from the former island located at the mouth of the delta and second just off the Alaskan highway to the south of the delta (refer to Fig. 3). These RCs recorded images of the study site every 10 min over a full 24 h period each day and allowed us to generate a complete chronology of dust emissions for specific time periods within the study period (covering the dust seasons of 2018 and 2019).
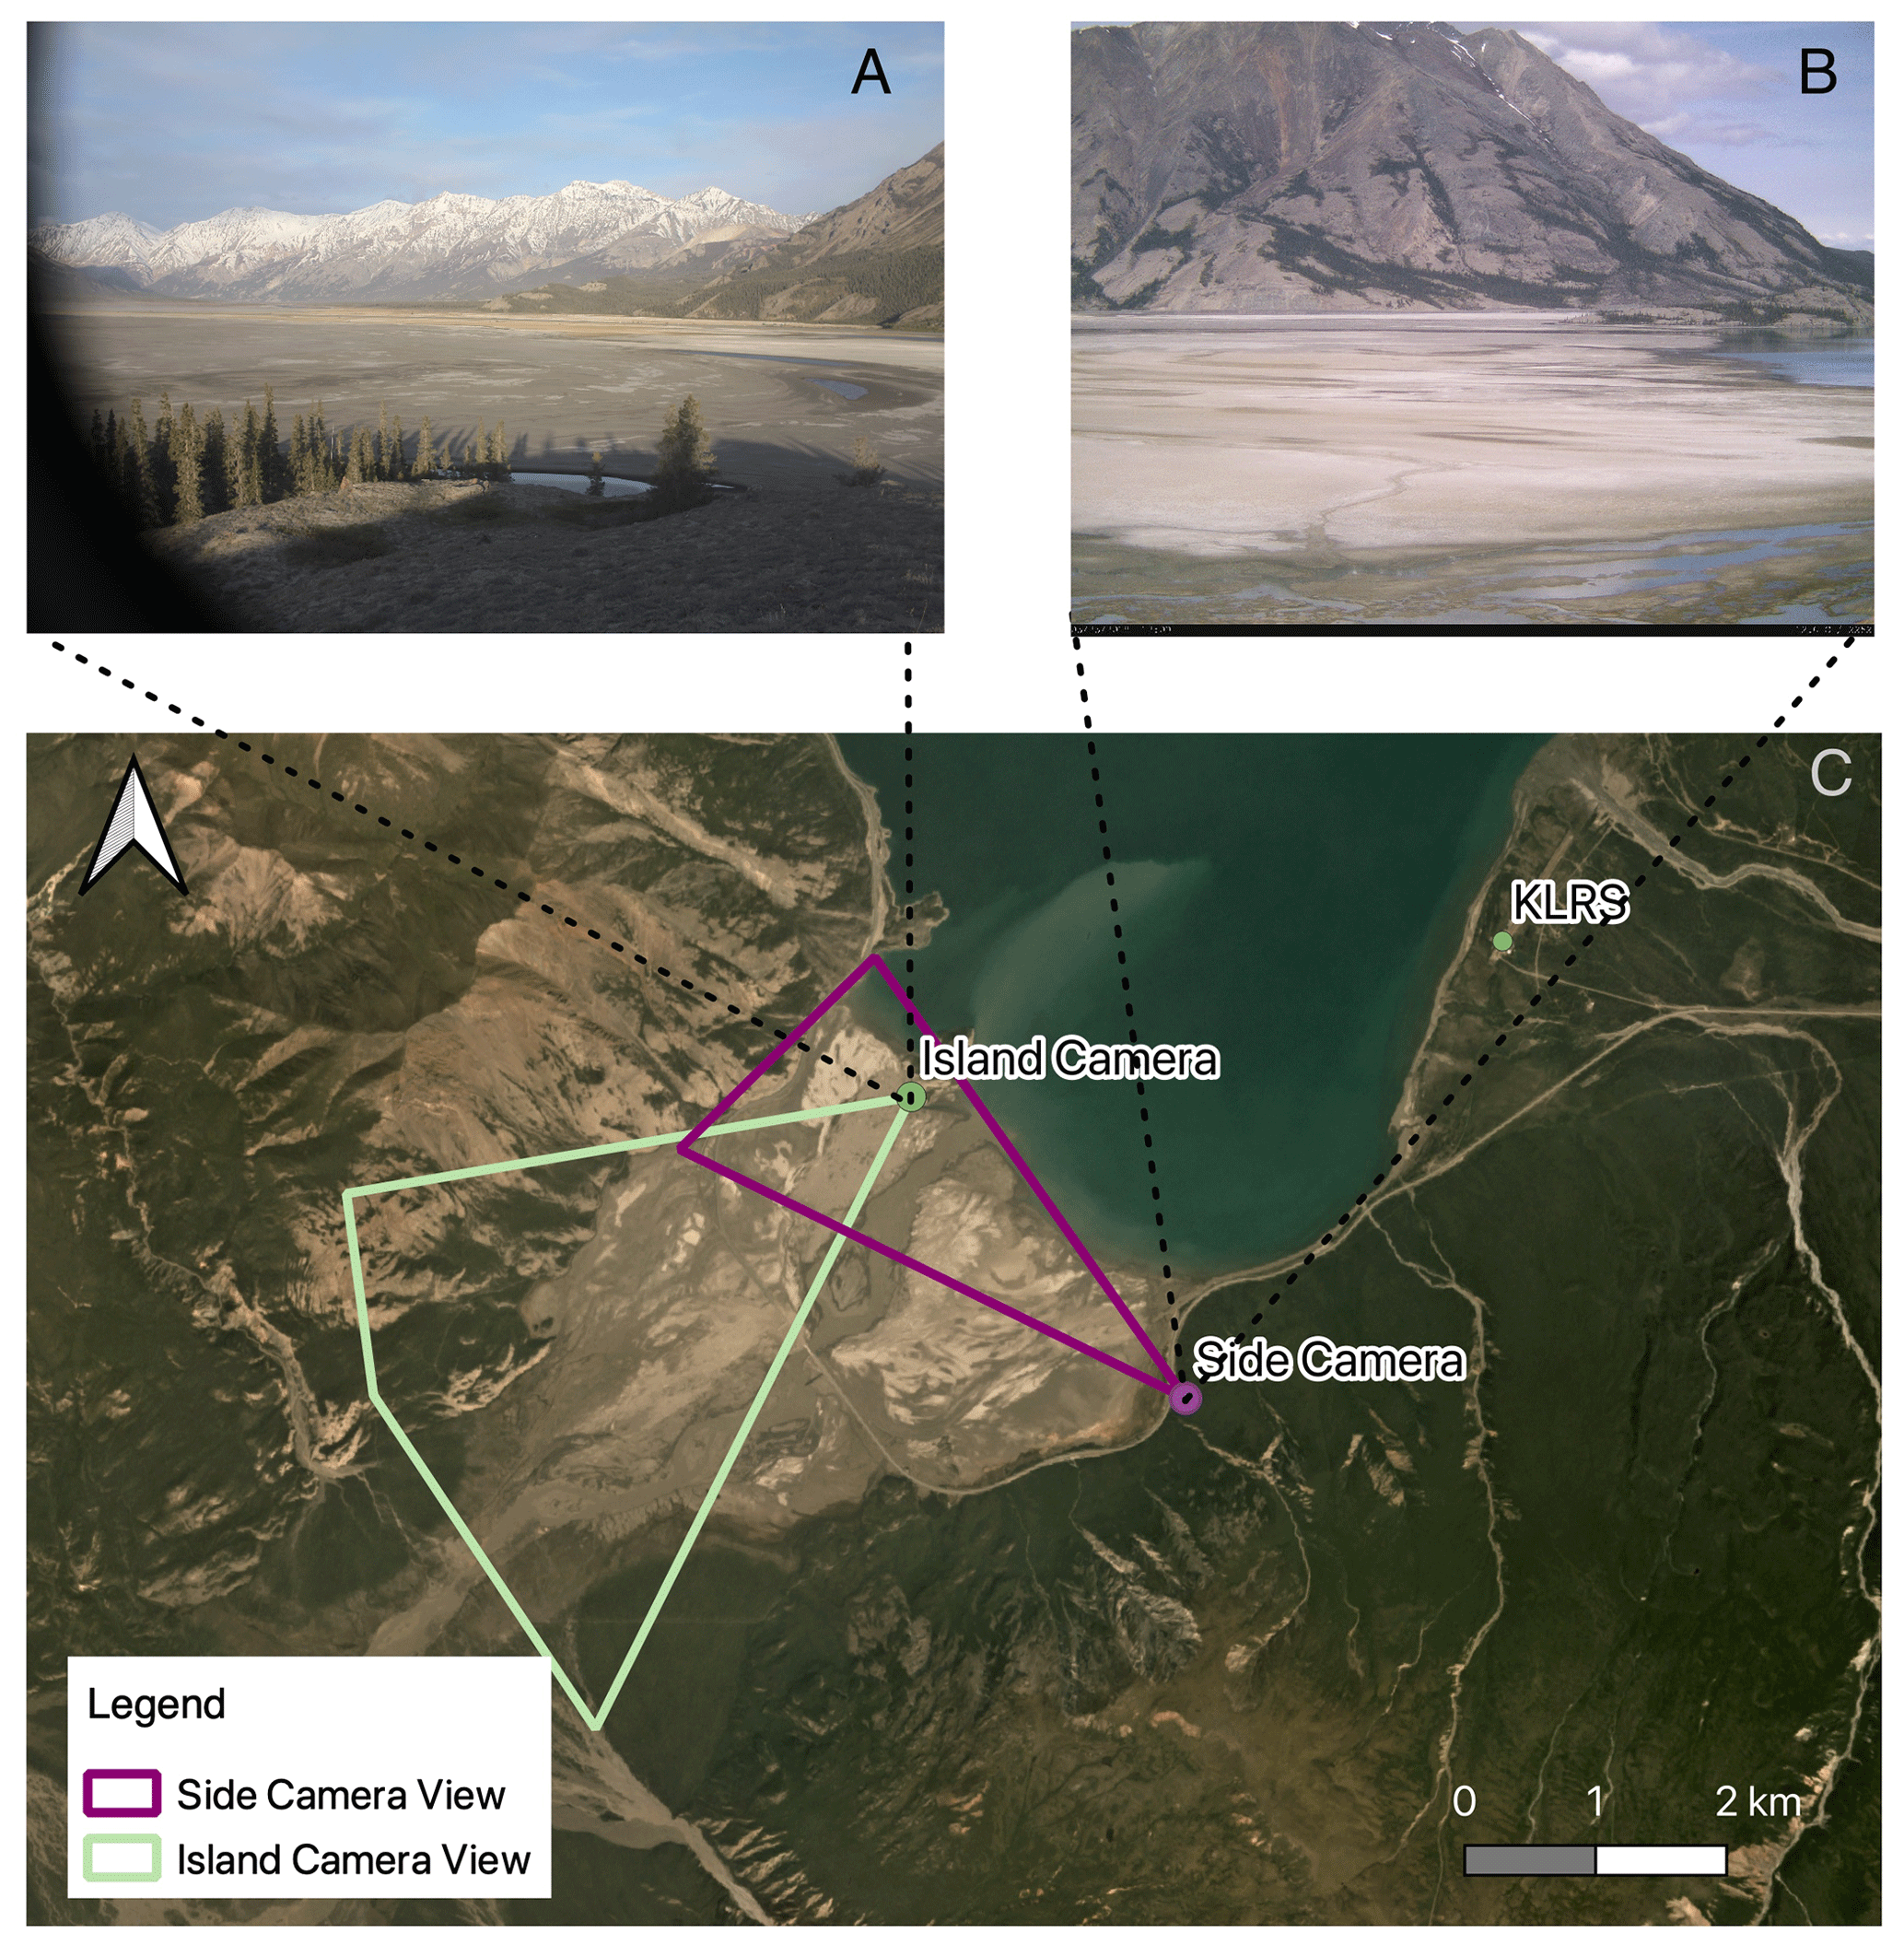
Figure 3Locations of the oblique cameras and their approximate fields of view (c). The island camera in green is located on the former island in the delta looking south-west (a). The side camera is located near the Alaskan Highway looking north-west. Images show dust-free views of the cameras (b). Base imagery is from PlanetScope imagery in June 2018.
3.3.2 PlanetScope Data (LEO)
At the time of the study Planet Labs operated approximately 120 CubeSat satellites in orbit that cover the whole globe every day (Foster et al., 2016; Baddock et al., 2021). The constellation of satellites used in this study are the PlanetScope satellites, which have a spatial resolution of around 3 m. PlanetScope imagery provides high-resolution four-band (red, green, blue, and near infra-red (NIR)) images of the study site, with overpass time often occurring near to solar noon. Recently, PlanetScope imagery has proved a useful tool for identifying dust plume origins at a scale comparable to field measurement (Baddock et al., 2021). Here, cloud-free PlanetScope images were examined to look for evidence of dust activity, from which eight dust images were identified from five DEDs, as on some days there were multiple overpasses. Methods described by Baddock et al. (2021) were used to track dust advection and to determine point dust sources (PDSs).
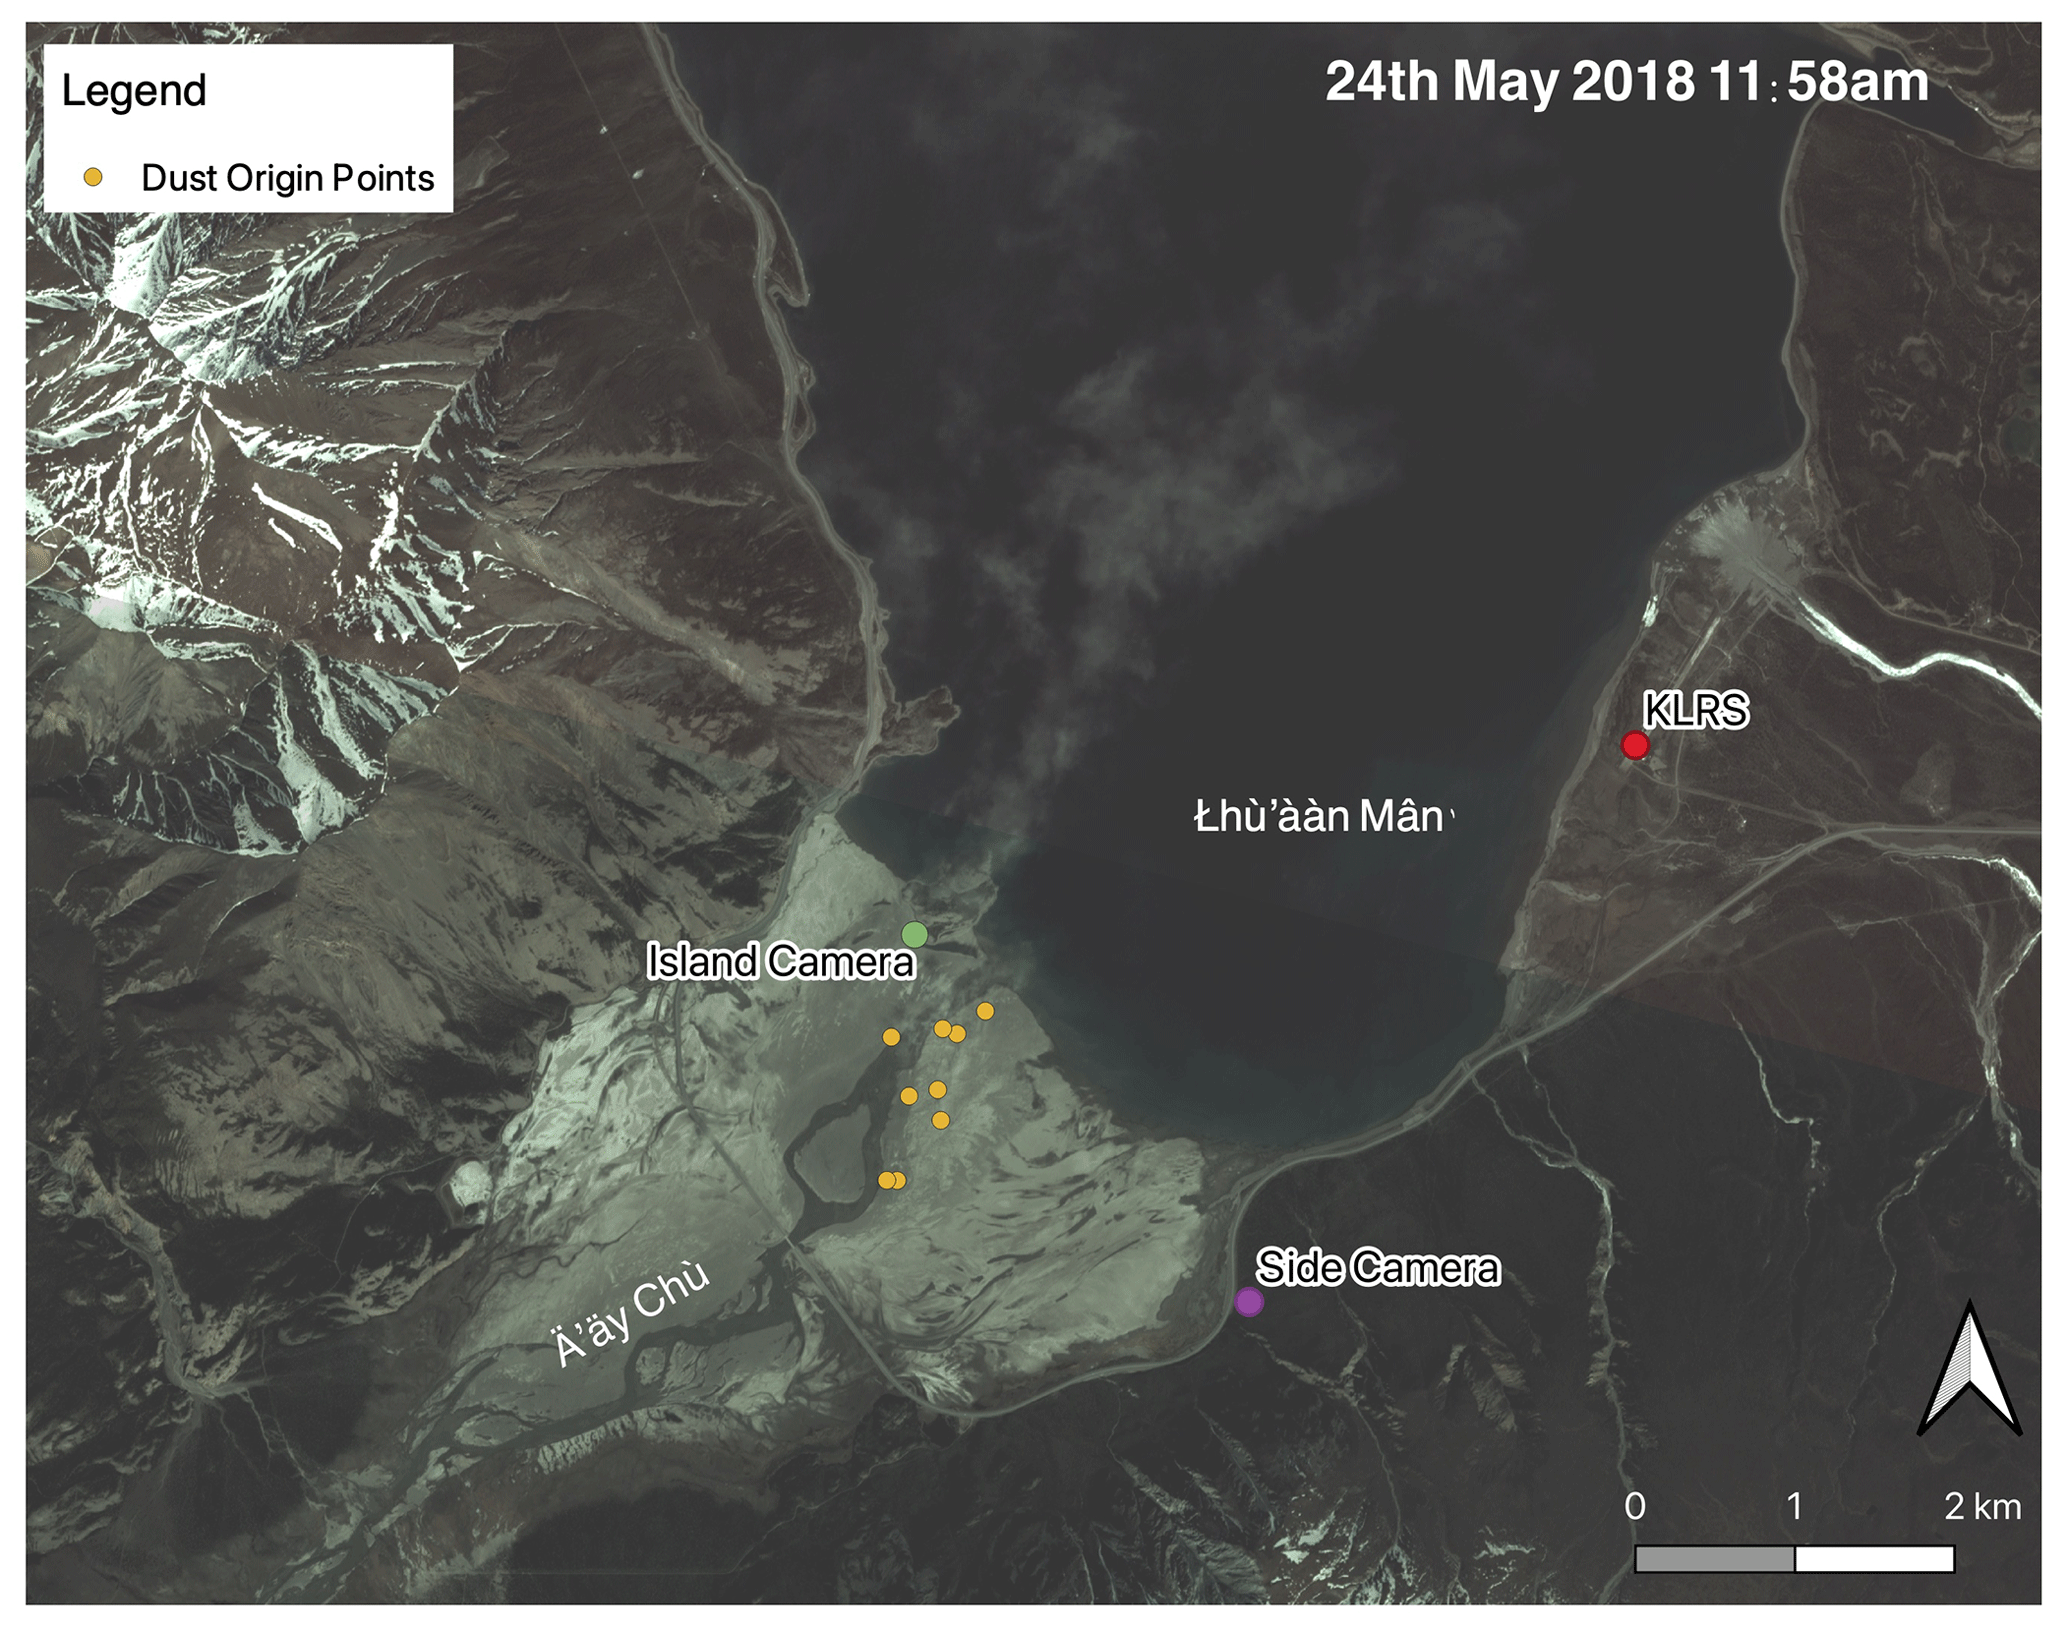
Figure 4Image shows the plume rising from the Á'áy Chù delta and going out across the lake captured by PlanetScope (24 May 2018 at 11:58 LT, local time) overlaid point dust source locations (PDSs). Due to the high resolution of the PlanetScope imagery (ca. 3 m) we were able to trace the plume to the up-valley source on the delta. The Kluane Lake Research Station's position is identified in red (KLRS), with the RC side camera identified in purple and the island camera in green.
3.3.3 MODIS data (LEO)
Data from the MODIS (Moderate Resolution Imaging Spectrometer) aerosol algorithm Multiangle Implementation of Atmospheric Correction (MAIAC) were used to obtain AOD at 470 nm observations at 1 km spatial resolution for the study site (Lyapustin et al., 2018). The MODIS sensor routinely derives AOD onboard the Terra and Aqua polar-orbiting platforms. The MAIAC collection 6 processing algorithm (Lyapustin et al., 2018) used in this study divides the globe into fixed 1 km grids and then uses a two-stage combination of time series analysis and pixel- or image-based processing to enhance differentiation between background conditions and dynamic atmospheric constituents such as clouds and aerosols (Mharwish et al., 2019). Areas where high AOD gradients exist (e.g. where smoke or dust are both apparent) would normally be at risk of removal by the time series component algorithm (Lyapustin et al., 2012). To prevent this and to accommodate for changes in aerosols properties attributed to dust, the MAIAC algorithm deploys a dust test and model to extract AOD in typical “dusty” regions (Lyapustin et al., 2018). However, as high-latitude regions are not flagged as dust regions, the dust test is not conducted at Lhù'ààn Mân, possibly increasing uncertainty in AOD retrievals where cloud and other aerosols are present. MAIAC AOD from blue (470 nm) and green (550 nm) bands were collected from each of the MODIS overpasses on each day, along with AOD uncertainty based on the blue-band surface brightness; 1 km by 1 km pixels within the 70 km2 southern portion of Lhù'ààn Mân was analysed in this study. The mean MAIAC AOD retrieval for each day was then used for analysis. The valley floor is 4–5 km wide, and the dust plume size is often bigger than this (around ∼25 km2). With dust advecting over the lake, a uniform brightness background should aid in MAIAC AOD retrieval.
Table 2Spectral bands and data quality of spectral data used in this study; n/a stands for not applicable.
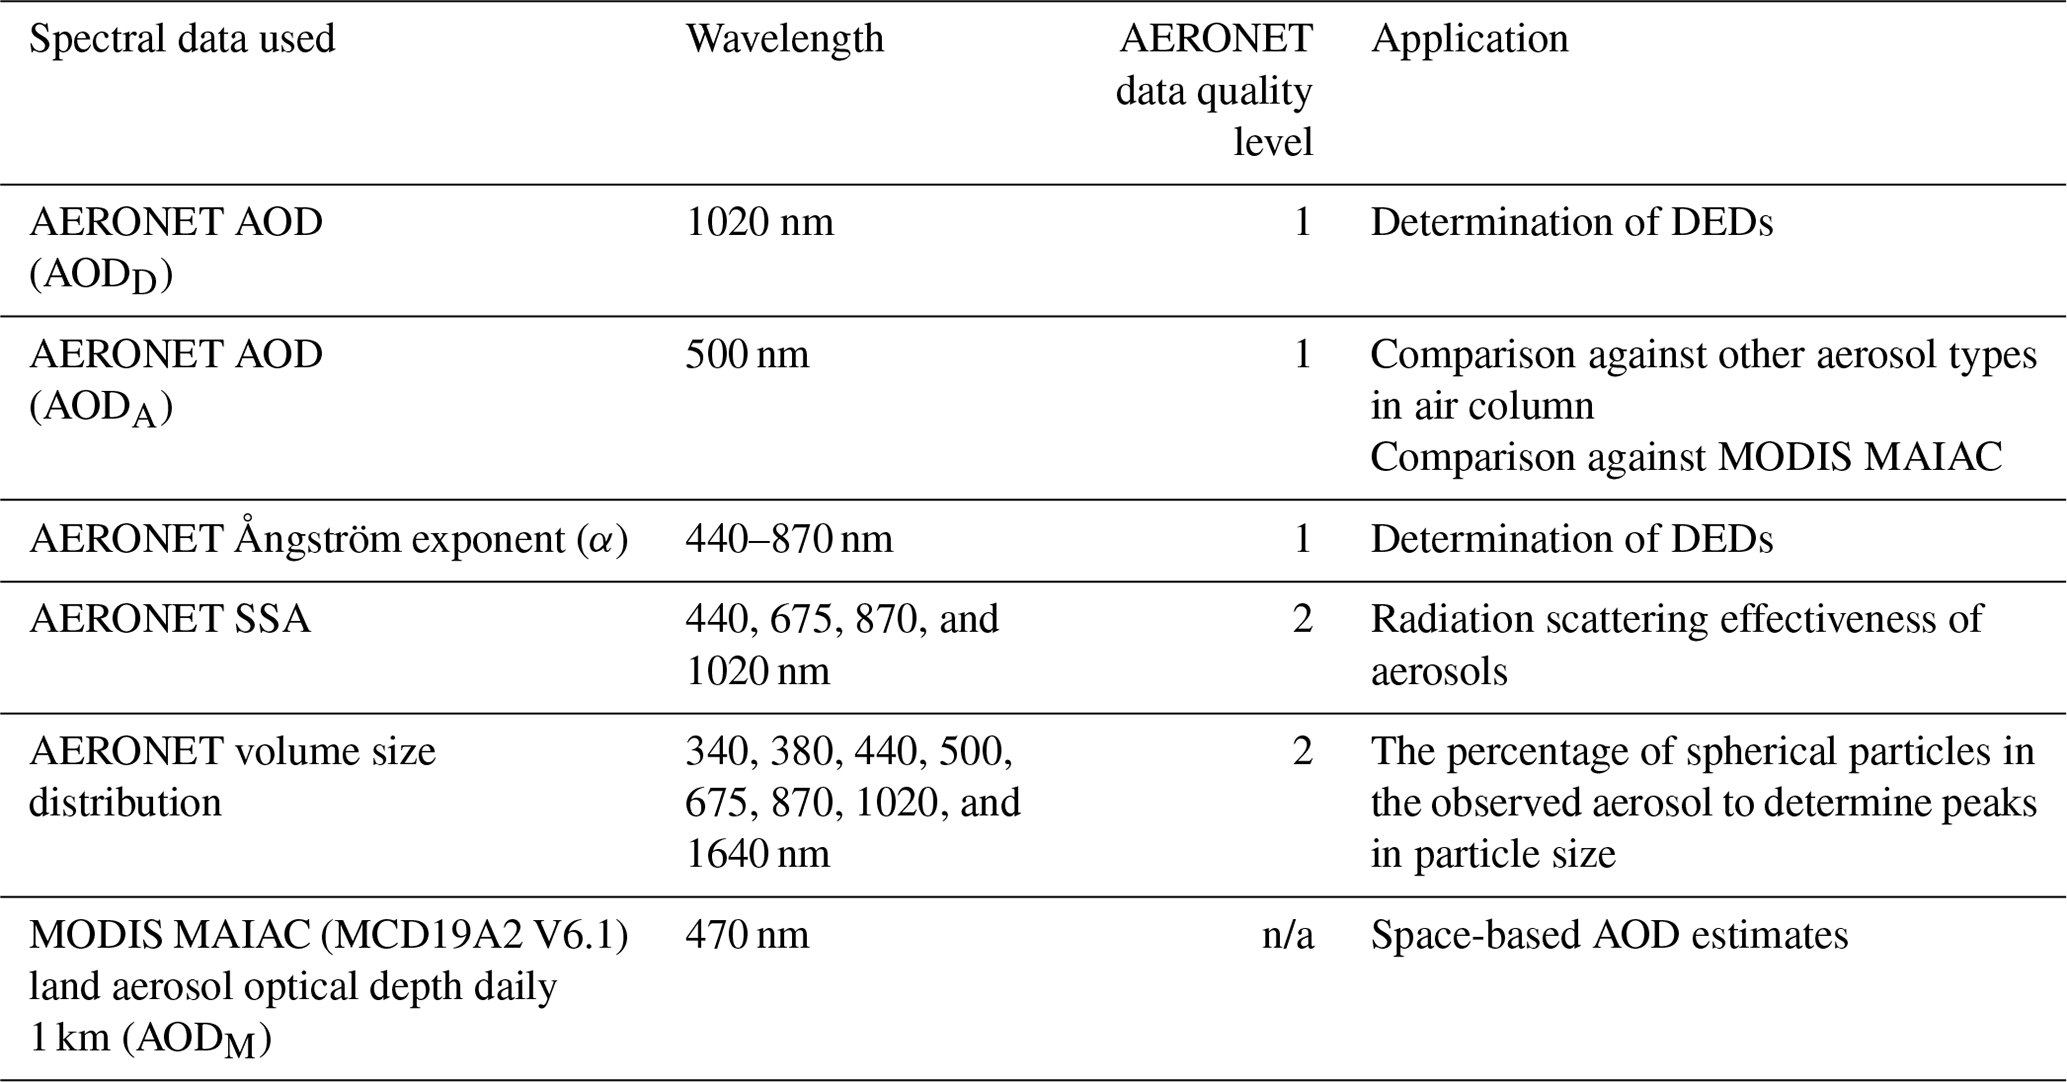
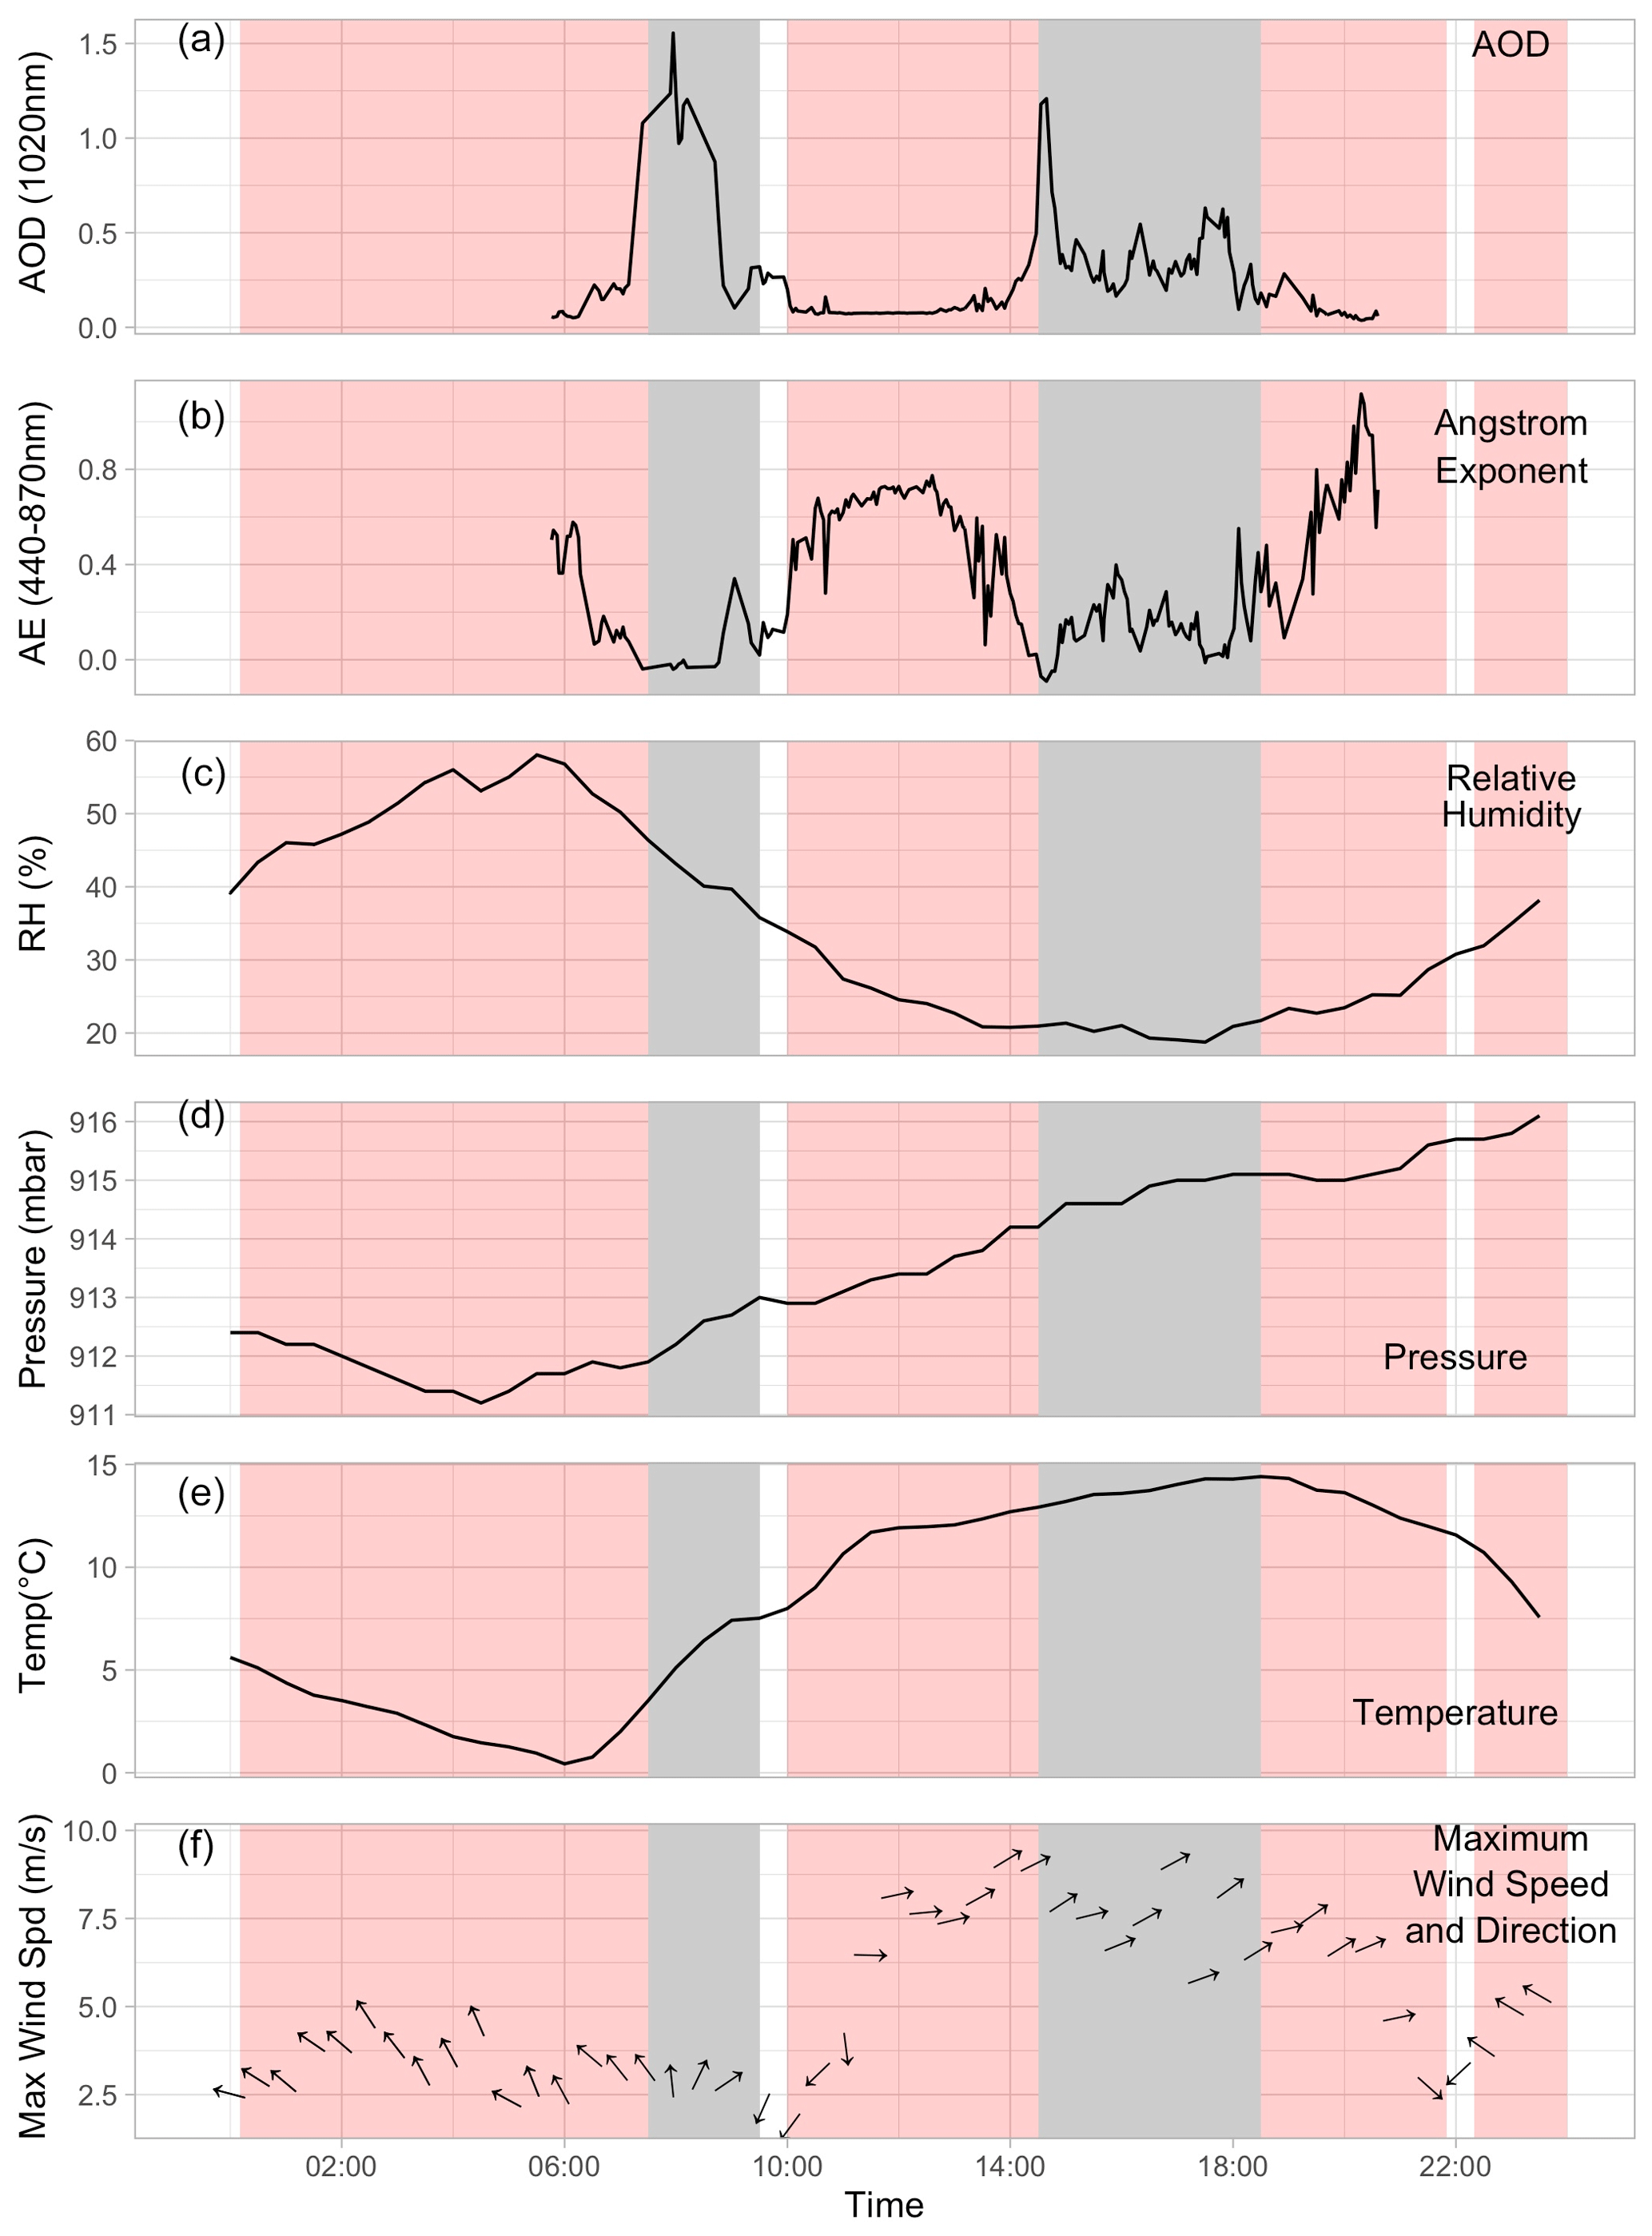
Figure 5Aerosol spectral parameters and meteorological conditions for 24 May 2018. Dust events defined by the Dubovik et al. (2002) threshold are highlighted in grey, and dust events evident on the oblique imagery are highlighted in pink. Panel (a) is AODD, panel (b) is DQ 1.0 Ångström exponent (α) at 440–870 nm, panel (c) is relative humidity (%), panel (d) is half-hourly pressure (mbar), panel (e) is half-hourly temperature (∘C), and panel (f) is maximum wind speed (m s−1) and direction (∘). There are no AERONET AOD returns in DQ 1.5 and 2.0 for this day.
4.1 Event-scale observations
AERONET AOD retrieval
By combining the oblique camera images, AERONET, and meteorological data, a detailed picture of dust activity and detection at the site can be drawn. Relationships between AOD or α and various meteorological factors on 24 May 2018 are examined at an event scale in Fig. 5. Two dust events were recorded by the AERONET station on this day, one in the morning from 07:30 to 09:30 LT and another in the afternoon at 14:30 to 18:30 LT. Maximum wind speed and AODD (see Table 2) do not increase in tandem during the dust events, with the two factors observing a negative relationship. In the morning, the event starts at a maximum wind speed of 3.7 m s−1, which is below typical initiation thresholds. A large increase in wind maximum speed occurs after 10:00 LT and is sustained above 6 m s−1 from 12:00 to 20:00 LT. The dust event in the afternoon and subsequent increase in AODD does not start until 14:30 LT, 4 h after the increase in wind speed; in these initial 4 h AODD decreases and remains below 0.25 for this time. Finer particles, which had limited effect on the AODD, are initially picked up during the increase in wind speed, evidenced by Fig. 5b where α remains consistently high, fluctuating between 0.25 and 0.75 until the start of the dust event at 14:30 LT. Wind direction (Fig. 5f) changes abruptly at 11:30 LT to be orientated from 230–260∘. This shift coincides with a steep increase in wind speed. In the afternoon, the wind direction is consistently coming from the direction of the delta (230–260∘), indicating topographically forced drainage winds, before shifting back to the south-east in the night. Both dramatic drops in wind speed at 09:00 and 19:30 LT coincide with periods of no dust being observed in the oblique camera images.
Relative humidity and temperature seem to follow no distinct pattern in α and AODD. The relative humidity follows a diurnal pattern of peaking just after sunrise at 60 %, decreasing to 18.8 % in the late afternoon, and then increasing again at dusk. On 24 May 2018, the start of the increase in relative humidity coincided with the end of the afternoon dust event. Temperature follows the opposite cycle of the relative humidity with temperatures being at their lowest at 06:00 LT at 0.9∘C, then increasing through the day, peaking at 14.4 ∘C at 18:30 LT. A steep increase in temperature coincides with the change in wind speed and direction at 11:30 LT.
From the island camera, a large dust event was detected at 13:30 LT, where a high and dense dust plume can be seen crossing the island, resulting in poor visibility. In Fig. 6, images taken at the start and subsequent peak of dust events detected by the AERONET station were used to check if plume orientation affected detection. At 07:40 LT, dust is observed further south along the delta than at other times in the day; a southern movement is not detected on the afternoon event.
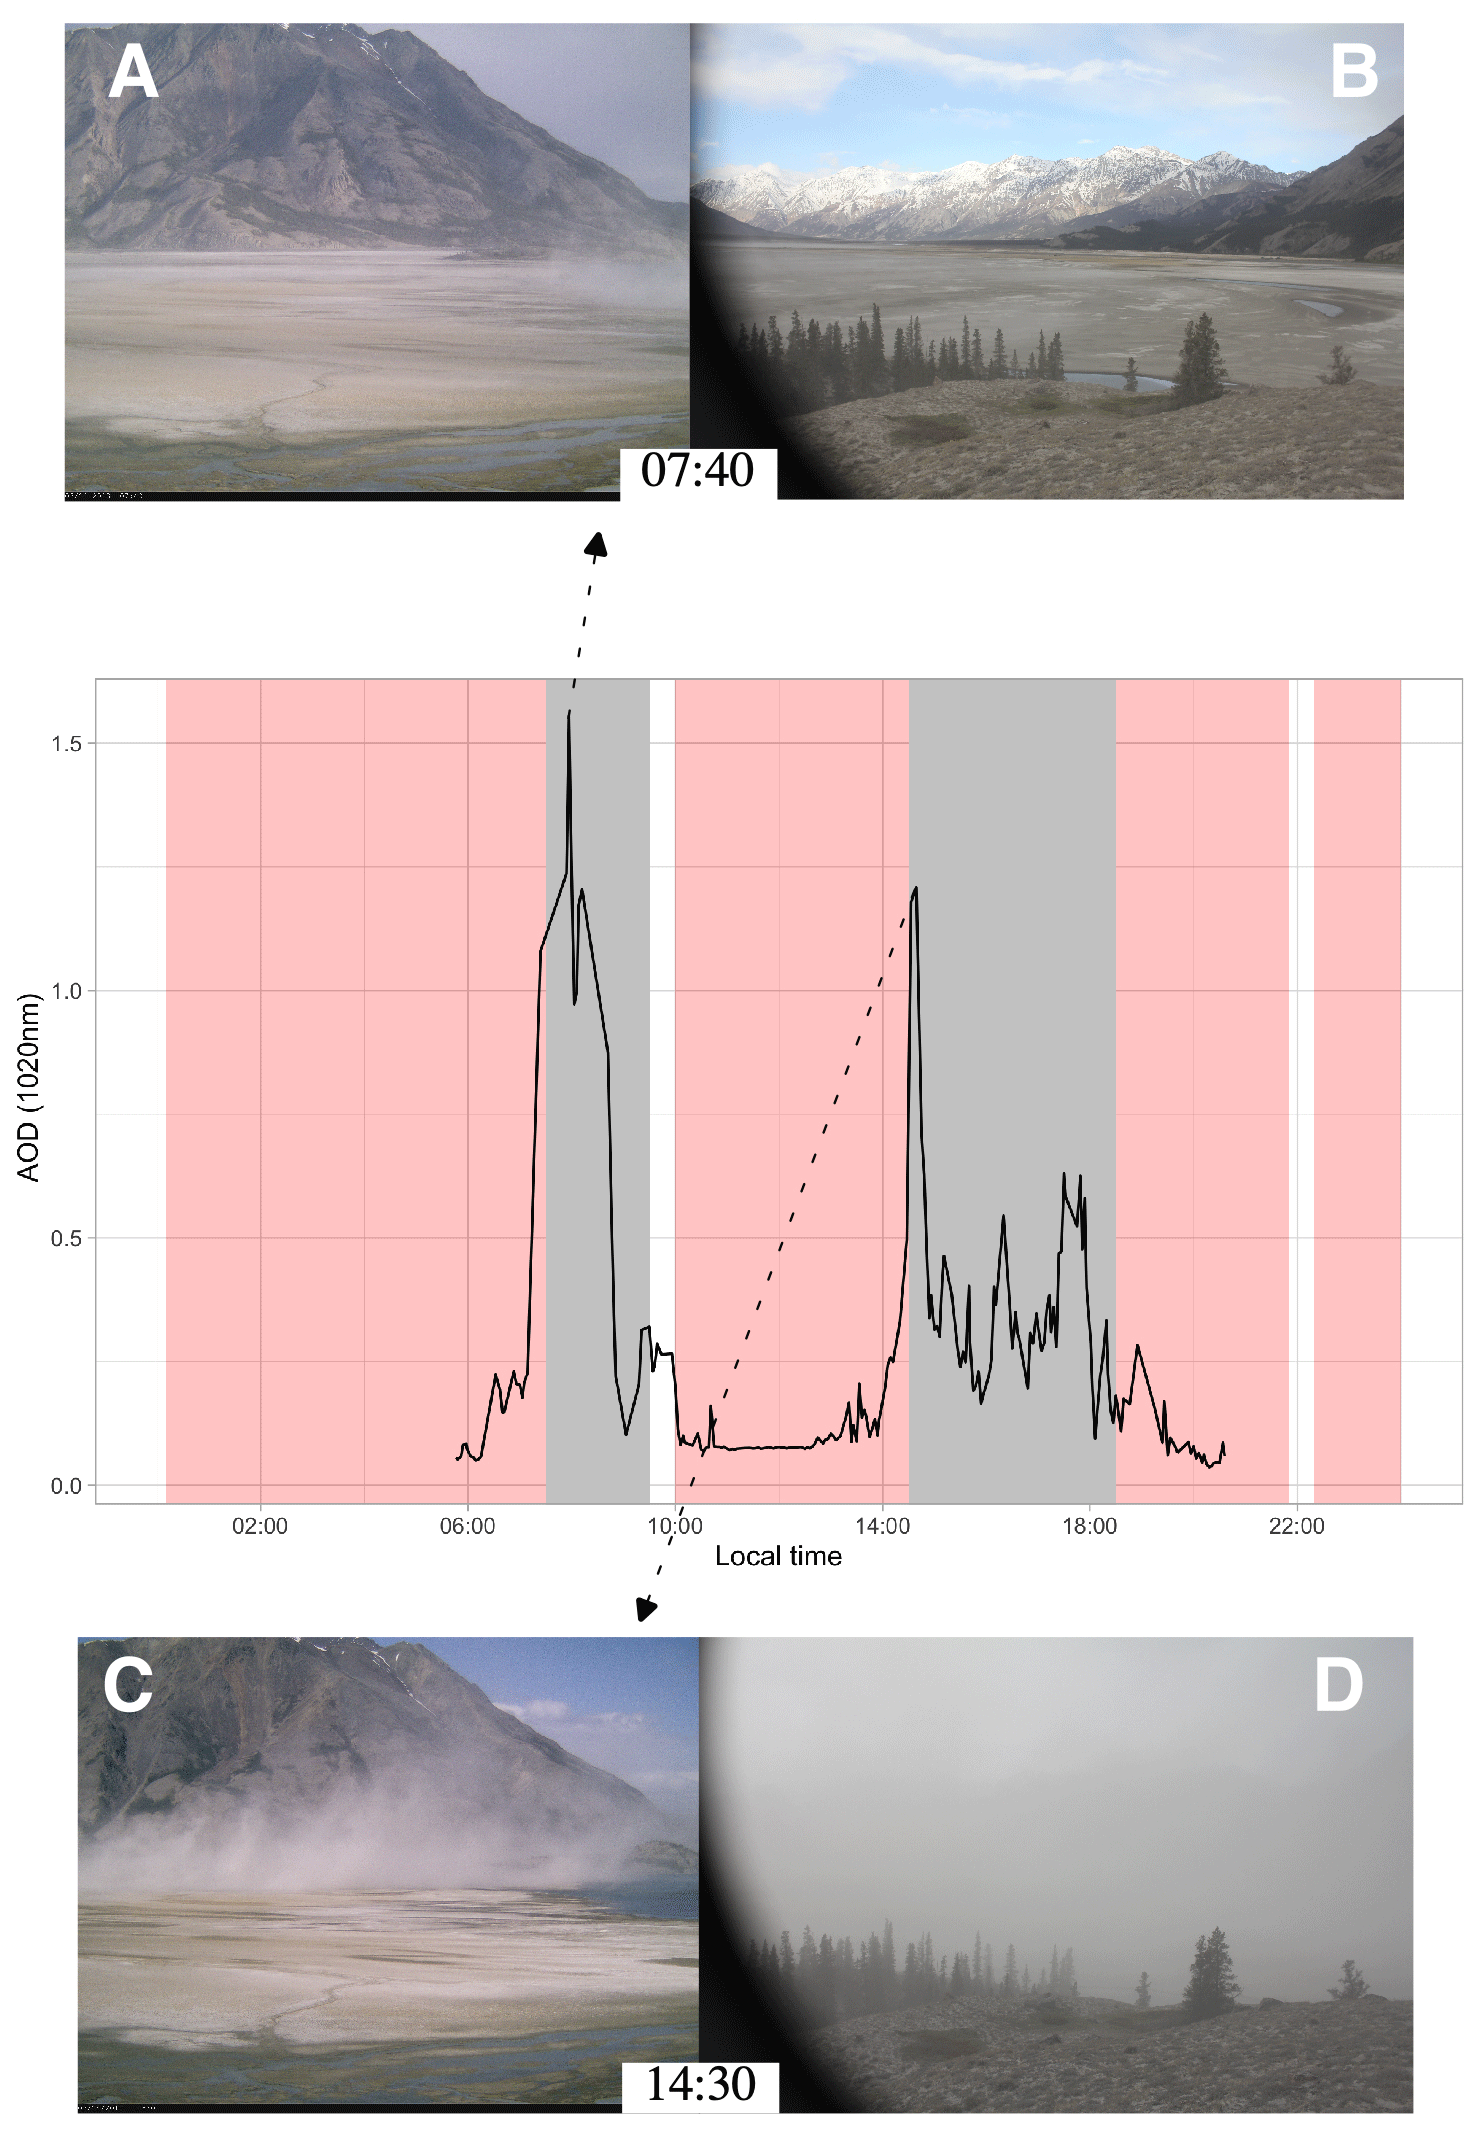
Figure 6AODD returns from 24 May 2018 visualized with the corresponding oblique camera images during peak events. In the morning dust is in the southern section of the delta. The distance to the mountain from the side camera (a, c) is ∼5 km, and the elevation of the small peak at the top and centre of the image frame is roughly 1100 m above the lake surface. As for the island camera (b, d), the closest set of mountains on the right of the frame that are snow-capped are 14 km away and 2270 m a.s.l.
Throughout both AERONET-detected dust events on 24 May 2018 the AODD fluctuates. The start of both events is signified by steep increases in AOD followed by significant decreases. In the morning event (Fig. 6a, b), AODD dropped from 1.2 to a considerably lower 0.32, and the afternoon event started at 0.49, decreasing to 0.31 after 30 min, and then peaked at 0.63 1 h later. When wind is above the threshold, dry surface sediments are quickly entrained, allowing for the peak in AODD at the start of dust events. Once the surface layer of sediment has been removed through aeolian processes, damp sediment is exposed and temporarily limits sediment availability (Chepil, 1956), resulting in the drop in AODD. Over time, surface winds that are above entrainment threshold (Fig. 5f) coupled with high temperatures (Fig. 5e) work to dry these sediments and increase the availability for transport (Cornelis and Gabriels, 2003). These processes were observed at the study site by Nickling (1978), who concluded that the dynamic relationship between wind and sediment moisture resulted in highly periodic dust emissions at the site, where the wetting and drying cycle controls the wind erosion process (Wang et al., 2014). Complex microtopography of the delta evident in the RC images (Figs. 6 and 7) also leads to heterogeneity and variability in sediment drying rates. This process accounts for localized resumption of dust emissions and fluctuations in AOD observed here (Ravi et al., 2006).
When investigating similar dust events at the study site across the 2018 measurement period, a significant positive relationship between AODD and maximum wind speed was not observed, suggesting that wind speed is not the only factor that affected dust emission. Several factors may account for the lack of relationship between the wind speed and changes in both AODD and α, including soil moisture, relative humidity, and air turbulence. Nickling (1978) observed at the Á'áy Chù delta that suspended sediment transport rates are more closely related to air turbulence than wind velocity. The meteorological station used in this study is located 4 km away from the dust source, and wind velocity is measured at one height (2 m above the ground), so measures of turbulence are not routinely quantified. The distance from source and complex wind regimes at the study site may mean that local discrete winds and relative humidity fluctuations are not observed by the KLRS meteorological station. Without use of a higher density of observations along the valley to characterize dust source wind velocity, turbulence, and relative humidity, it is impossible to determine definitive wind threshold controls on dust emissions at the site.
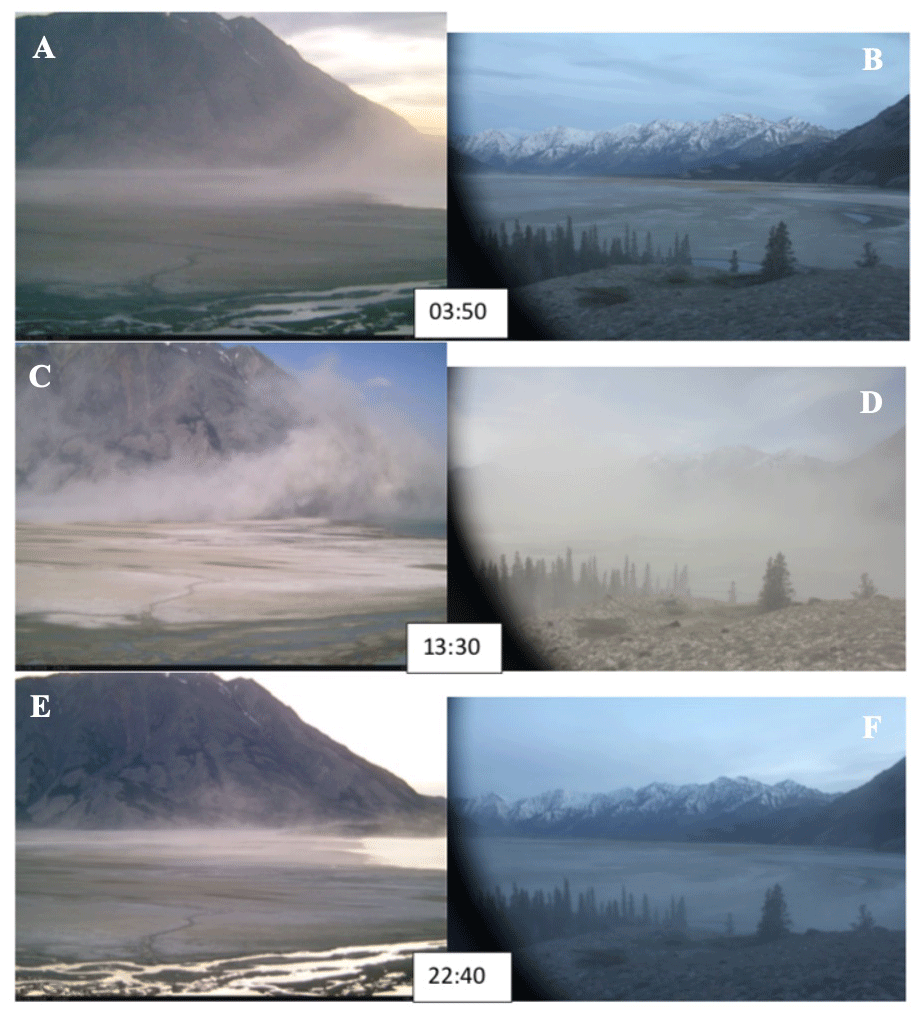
Figure 7Oblique camera images from selected times of dust events on 24 May 2018. These images were all captured when dust is not detected at the AERONET station but reveal that dust is present at the site and is not detected by AERONET. Locations of cameras are detailed in Fig. 3. In (a), (c), and (e) the images are taken from the side camera, and in (b), (d), and (f) the images are taken from the island camera.
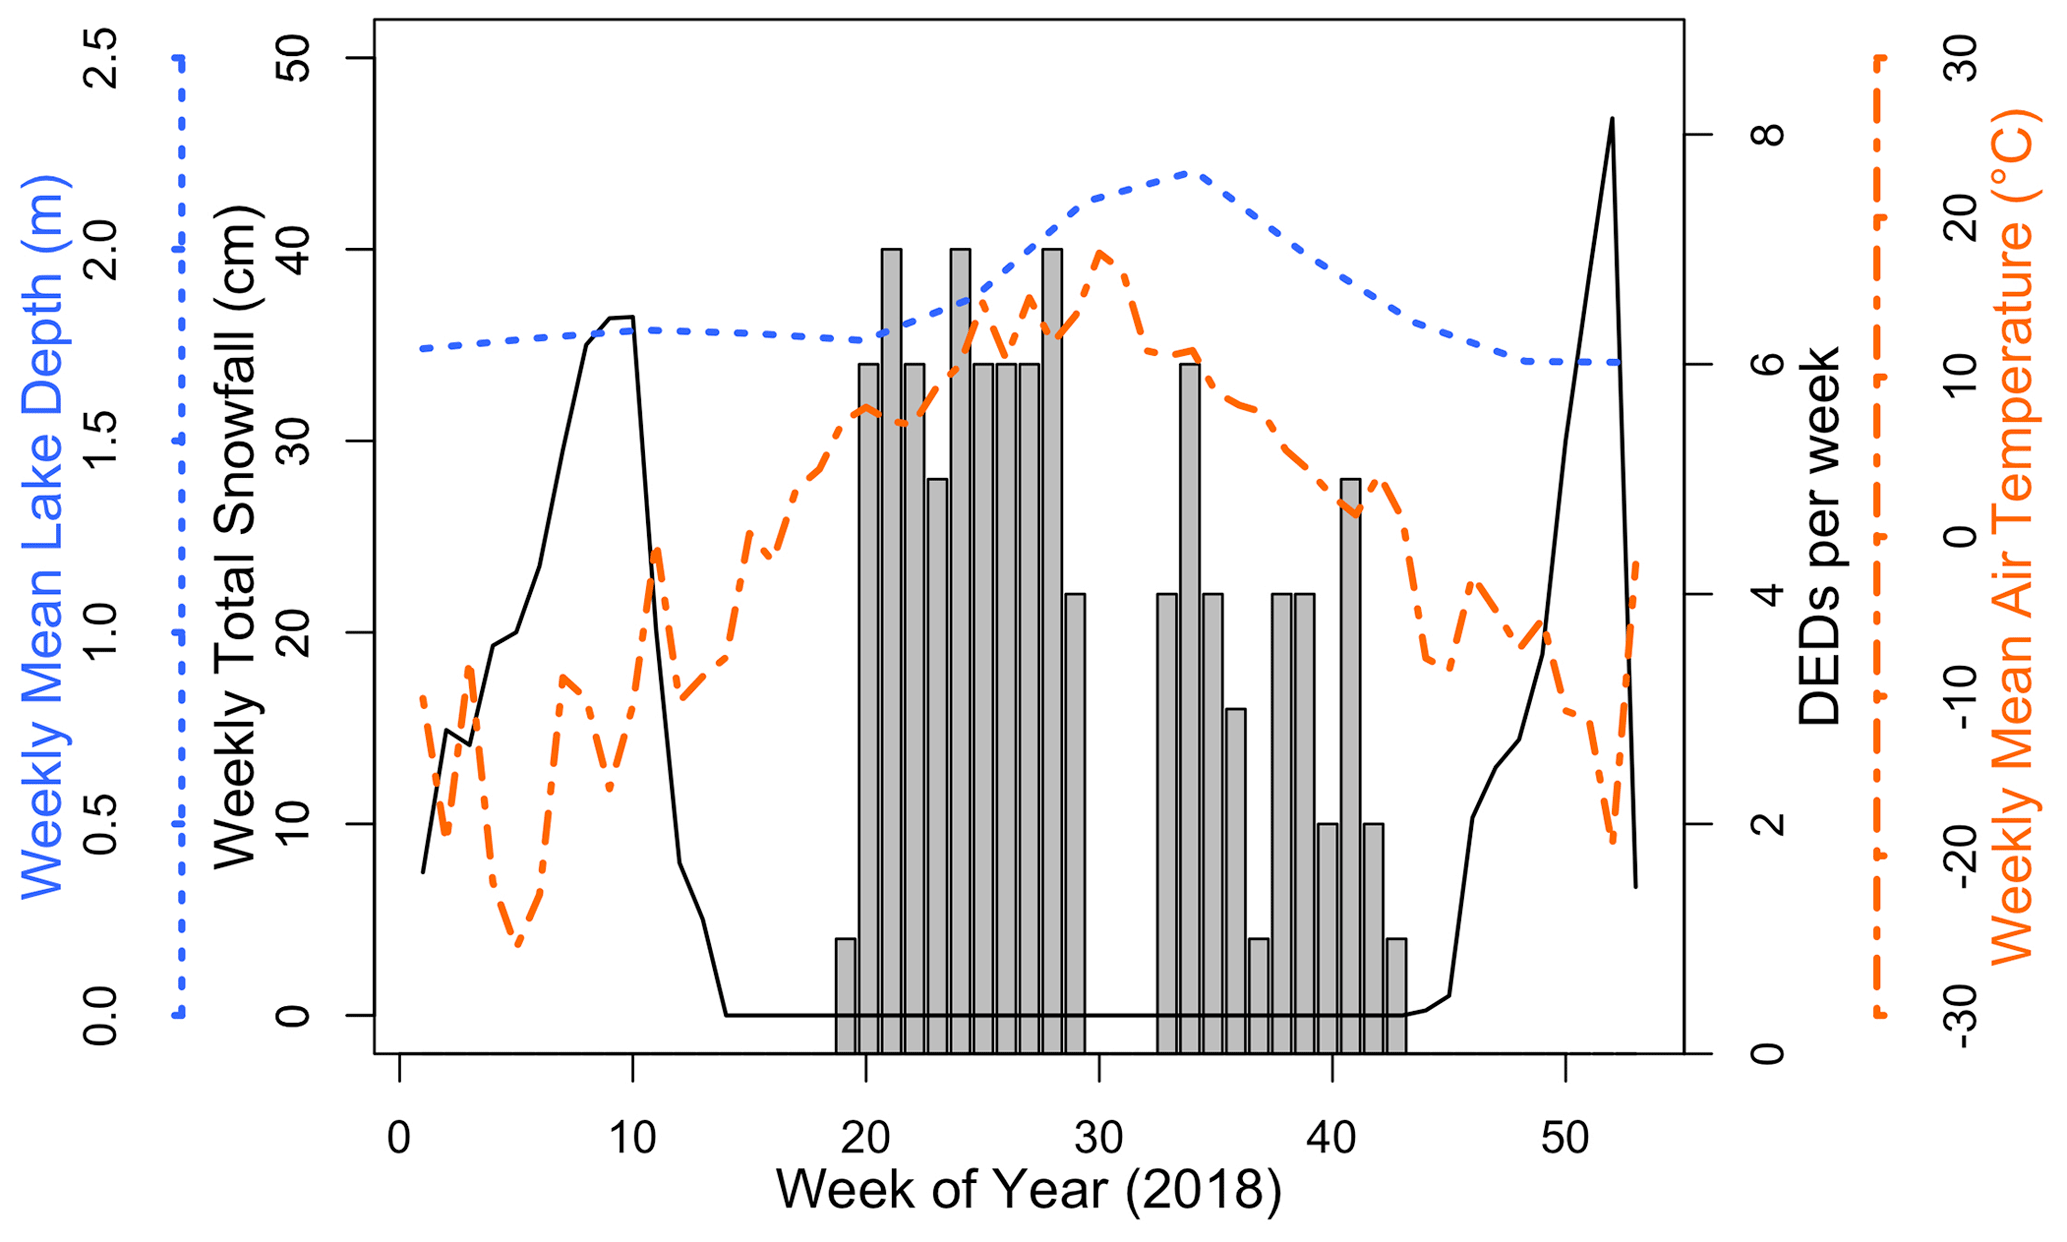
Figure 8Variability in DEDs in 2018 and selected seasonal variables that affect dust emission. The vertical bars display the total number of dust event days recorded by AERONET from AODD per week. The AERONET station was recording from 14 May until 21 October 2018, but no data were recorded between 24 July and 14 August 2018. Average weekly depth (cm) is displayed with the solid line, and average weekly air temperature (∘C) is displayed with the dotted–dashed line recorded at the Lhù'ààn Mân Research Site. Lake height is displayed with the dashed blue line, is taken from the Environment Canada lake depth gauge 09CA001 at Kluane Lake near Burwash Landing, and is the average weekly water depth at that site.
Dust within the AERONET FOV
Even with high-quality AERONET data within kilometres from the dust source, it is evident from RC data that dust events may not always be detected within the FOV of the AERONET station. When the RC data are used in conjunction with the high-resolution PlanetScope imagery (see Fig. 4), the location of plume origins and plume advection allows AERONET station FOV detection and overall rates to be characterized.
Several factors may explain why events are not being captured. The side camera images display that when dust is detected by AERONET in the morning, the dust is in motion more on the southern side of the delta (Fig. 6a, b), possibly suggesting that to be observed by the AERONET station, dust emissions need to originate in the southern sector of the delta. Southern emissions of dust were not observed in the afternoon event (Fig. 6c, d). In fact, most plume origins from 2018 were mapped to be in the central to northern section of the delta (Fig. 4). Once sediment is suspended, katabatic winds blow it out across the lake, where it meets the valley wind and is blown north–north-west away from the AERONET station. This dust does not pass directly over the sensor and may also remain relatively low and below the detection arc of the sun photometer. Sun photometers use direct sun measurements to determine AOD and α (Holben et al., 1998). However, in mountainous terrain, if dust remains below the mountain line, the photometer will be unlikely to record it. At this time of year oblique camera images (Fig. 7) can observe dust in suspension for an extended period after the sun has gone below the horizon. This is not recorded by the sun photometer. A possible explanation as to why AERONET detected dust in the afternoon when the plume was not originating in the southern section of the delta is that the vertical motion of emitted dust was greater so that it was above the mountain line and thus detectable by AERONET. Furthermore, AERONET requires a direct sun measurement because if it is cloudy the dust will not be recorded (see Table S1 for more information). Dust must be in the AERONET stations FOV, when the sun is south of KLRS and the dust plume advects north, it will not be captured. A combination of dust emission in the evening and the low height of the dust led to the dust event detection being underrepresented at Lhù'ààn Mân.
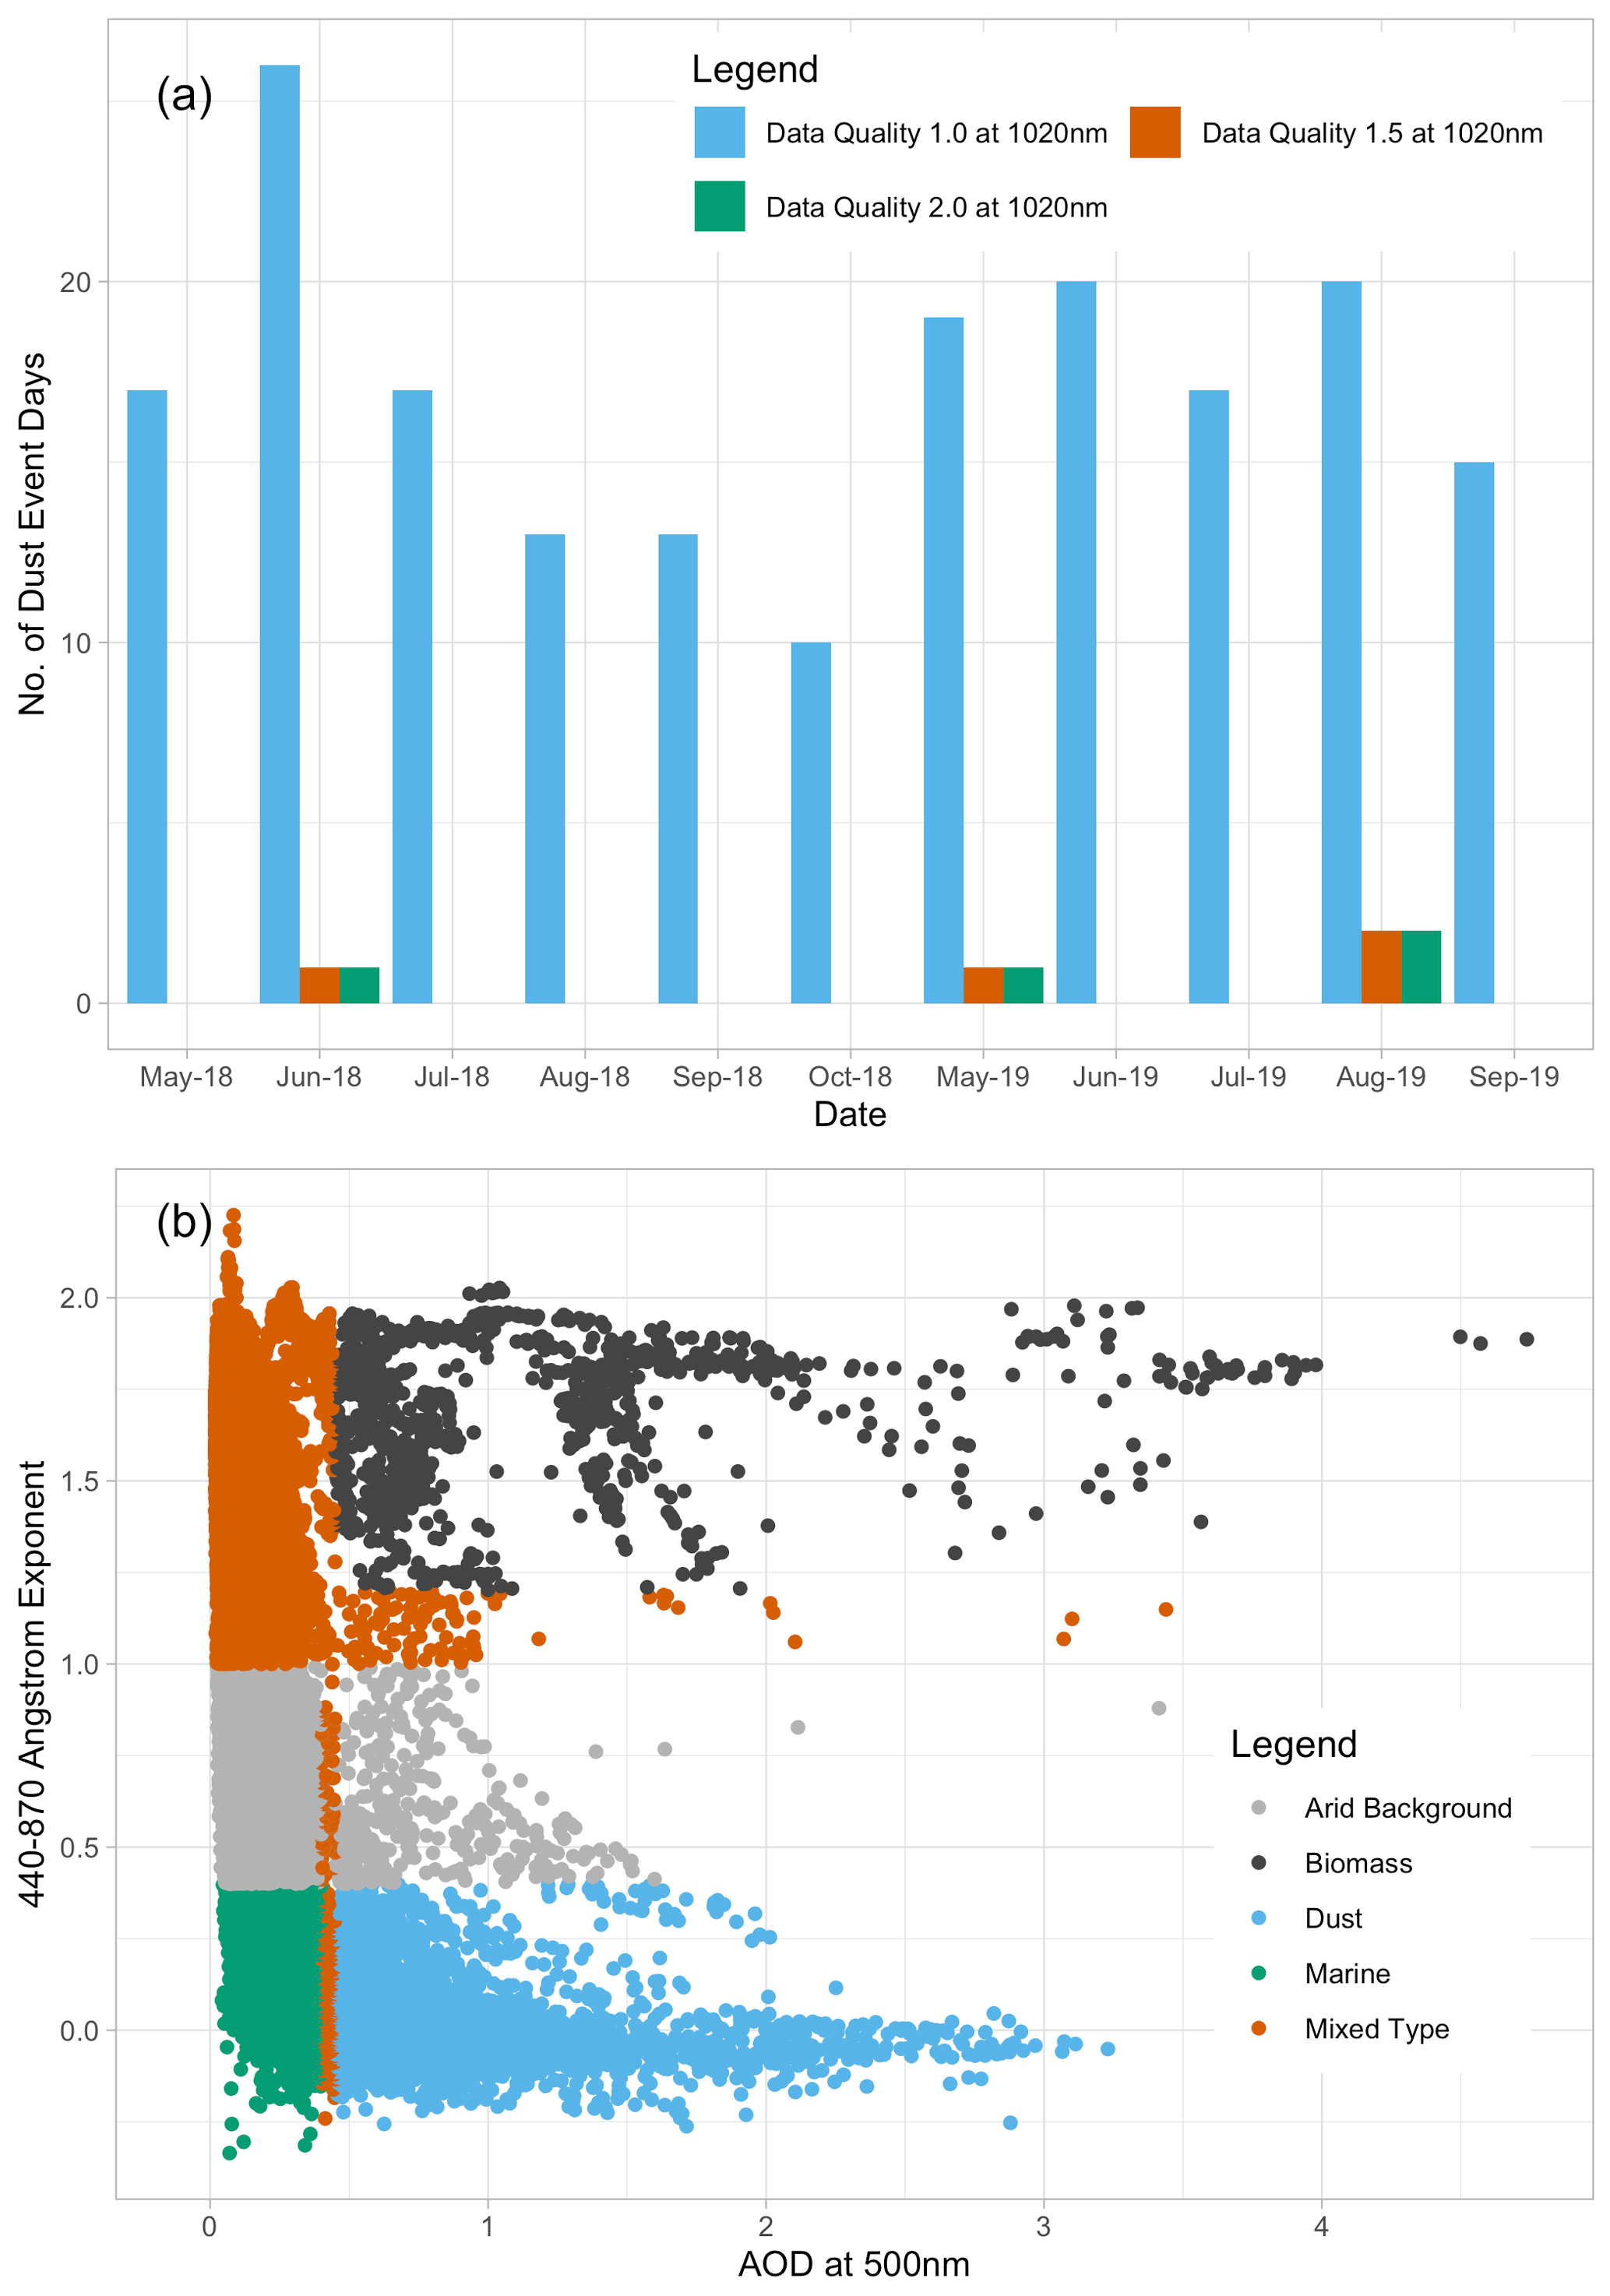
Figure 9(a) The number of DEDs by month from 1020 nm over the 2018 and 2019 Lhù'ààn Mân dust seasons detected by the different data quality levels computed by AERONET. DQ 1.0 is represented in blue, DQ 1.5 is represented in orange, and DQ 2.0 in green. (b) Scatterplot of daily DQ 1.0 AODA and α at 440–870 nm used to broadly characterize aerosols at Lhù'ààn Mân for DEDs in the dust seasons of 2018 and 2019. Blue shows the dust, black shows biomass and industrial aerosols, grey shows the arid background, green shows marine-type aerosols, and mixed types are shown in orange. Thresholds for each class are taken from Verma et al. (2015), whose definitions stem from Jaipur in India; these thresholds may vary from those found a KLRS but give a broad characterization of aerosols present.
4.2 Controls on dust emissions
The occurrence of dust events in this region reflects the relationships between sediment supply and availability and the co-dependency between aeolian, fluvial, and glacial systems. Average air temperature, snow depth, and lake depth displayed in Fig. 8, all affect the supply or availability of sediment entrainment in the valley. Over the winter, cold air temperatures result in very low discharge from the Kaskawulsh glacier, and snow covering the ground inhibits dust entrainment as the layer of snow protects the underlying sediment from the wind (Bullard, 2013; Bullard et al., 2016). In April, snow cover begins to rapidly decrease, and with this dust events are expected to increase as seen in other high-latitude locations (Bullard et al., 2016). This is not reflected at Lhù'ààn Mân in 2018. The AERONET station began recording on 13 May 2018 when dust was recorded at the site. With no aerosol records for April, dust events cannot be determined. Consequently, 14 May was most likely not the first DED. Any lack of events in April can be attributed to several factors: the average air temperature in the month of April is still −1.51∘ C, snow cover is still decreasing over this month, and melted snow refreezing in the ground increases interparticle cohesion and cements the particles together (Wang et al., 2014). Dust events are pronounced in May, when the average air temperature is 6.82∘ C, the soil over the delta has thawed, and the mostly dry and loose surface soil is easily deflated. Through the freeze–thaw process, a degree of sediment sorting occurs whereby finer sediments are moved to the surface (Corte, 1971; Bateman, 2013). These finer particles are more readily entrained by the wind as the smaller diameter requires a lower critical shear velocity, and the finer grains are no longer shielded by coarser particles. Sorting is more pronounced after several freeze–thaw cycles. The frequency of dust events decreases in October, when the average air temperature is 1.61∘ C and the ground begins to freeze again. The decrease in DEDs in October can also be attributed to the removal of the AERONET station during this month.
The diversion occurring in June 2016 (Shugar et al., 2017) resulted in the highly dynamic braided Á'áy Chù becoming incised, with the main river channel having not changed position since 2017. Sediment is therefore available for entrainment through the entire summer season, as at peak discharge the floodplain does not become inundated with meltwater. Other high-latitude locations observe two distinct peaks in dust emission over the melt season, one early season when the snow has melted and one later season when flow is again reduced (Bullard and Mockford, 2018; Crusius et al., 2011). Lhù'ààn Mân differs from traditional high-latitude-region seasonality in dust emissions as it does not experience the reduction in dust events coinciding with flooding associated with peak river discharge. The delta is no longer inundated with meltwater, and sediment is no longer replenished on a yearly scale. Dust is emitted again at the start of the following season due to freeze–thaw action bringing smaller grains to the surface (Corte, 1971; Bateman, 2013). Recolonization of vegetation on the floodplain may increase surface roughness, decreasing dust emissions at the site into the future.
4.3 AERONET aerosol retrievals and a DED time series
Cloud screening is an essential aspect of the AERONET network data refinement, as clouds affect AOD, with cirrus clouds contributing to fine-mode AOD and other cloud types impacting coarse-mode retrievals (Arola et al., 2017). Cloud screening is applied to all AERONET data to remove any cloud-related uncertainties in AOD retrievals at all wavelengths (Arola et al., 2017). However, at our study site, this approach removes most of the data relating to either known or observable dust fluxes at the study site. As noted in Fig. 9a, the number of possible AERONET DEDs recorded in 2018 and 2019 using the definition at each DQ level varies significantly. The initial DQ 2.0 algorithm inevitably excludes the vast majority (97.8 %) of retrievals, and a distinct decrease in number of possible DEDs are also observed as processing steps between DQ 1.0 and level 1.5, with 8 months where no DED are recorded at DQ 1.5 and 2.0. Figure 9a also displays the annual cycle of DQ 1.0 DEDs at Lhù'ààn Mân, with DEDs occurring through the recording months. In both 2018 and 2019, June produced the highest frequency of DEDs at 26 and 20, respectively.
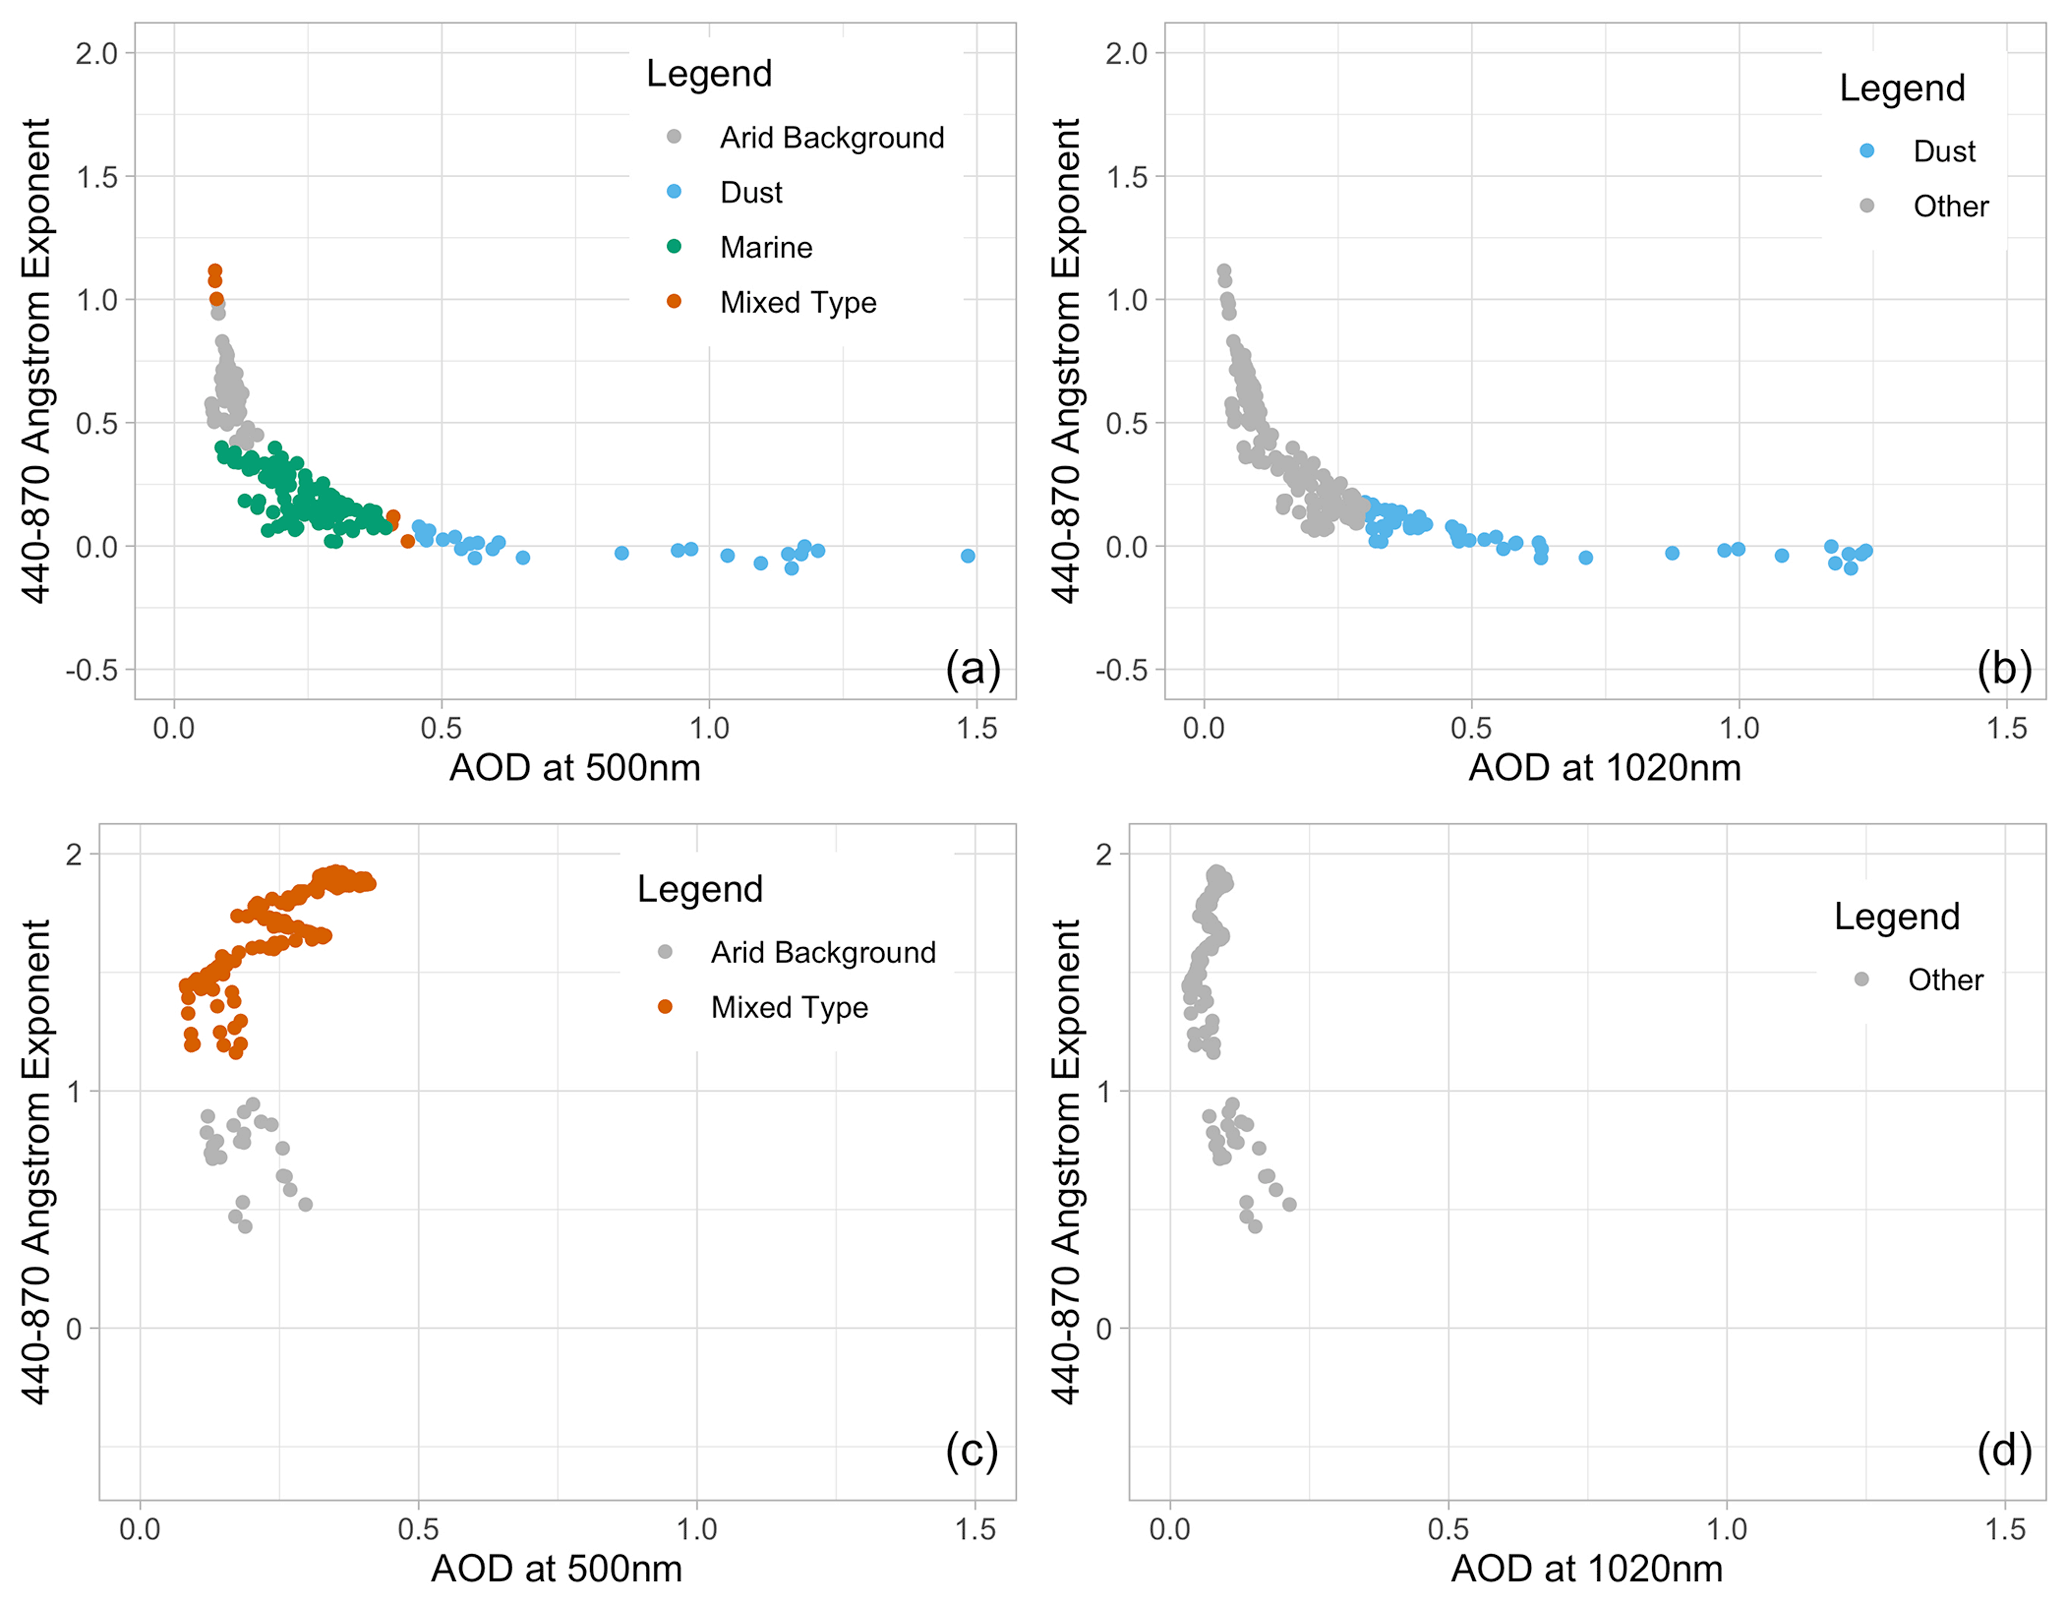
Figure 10Aerosol composition comparisons at Lhù'ààn Mân on a DED on 24 May 2018 (a, b) and a non-dust event day on 23 July 2018 (c, d). Scatterplots (a) and (c) are at DQ 1.0 AOD at 500 nm with thresholds from Verma et al. (2015) for broad characterization of aerosols present at the site. Scatterplots (b) and (d) are at DQ 1.0 AODD with thresholds from Dubovik et al. (2002). Blue shows the dust, grey shows the arid background, green shows marine aerosols, and mixed types are shown in orange.
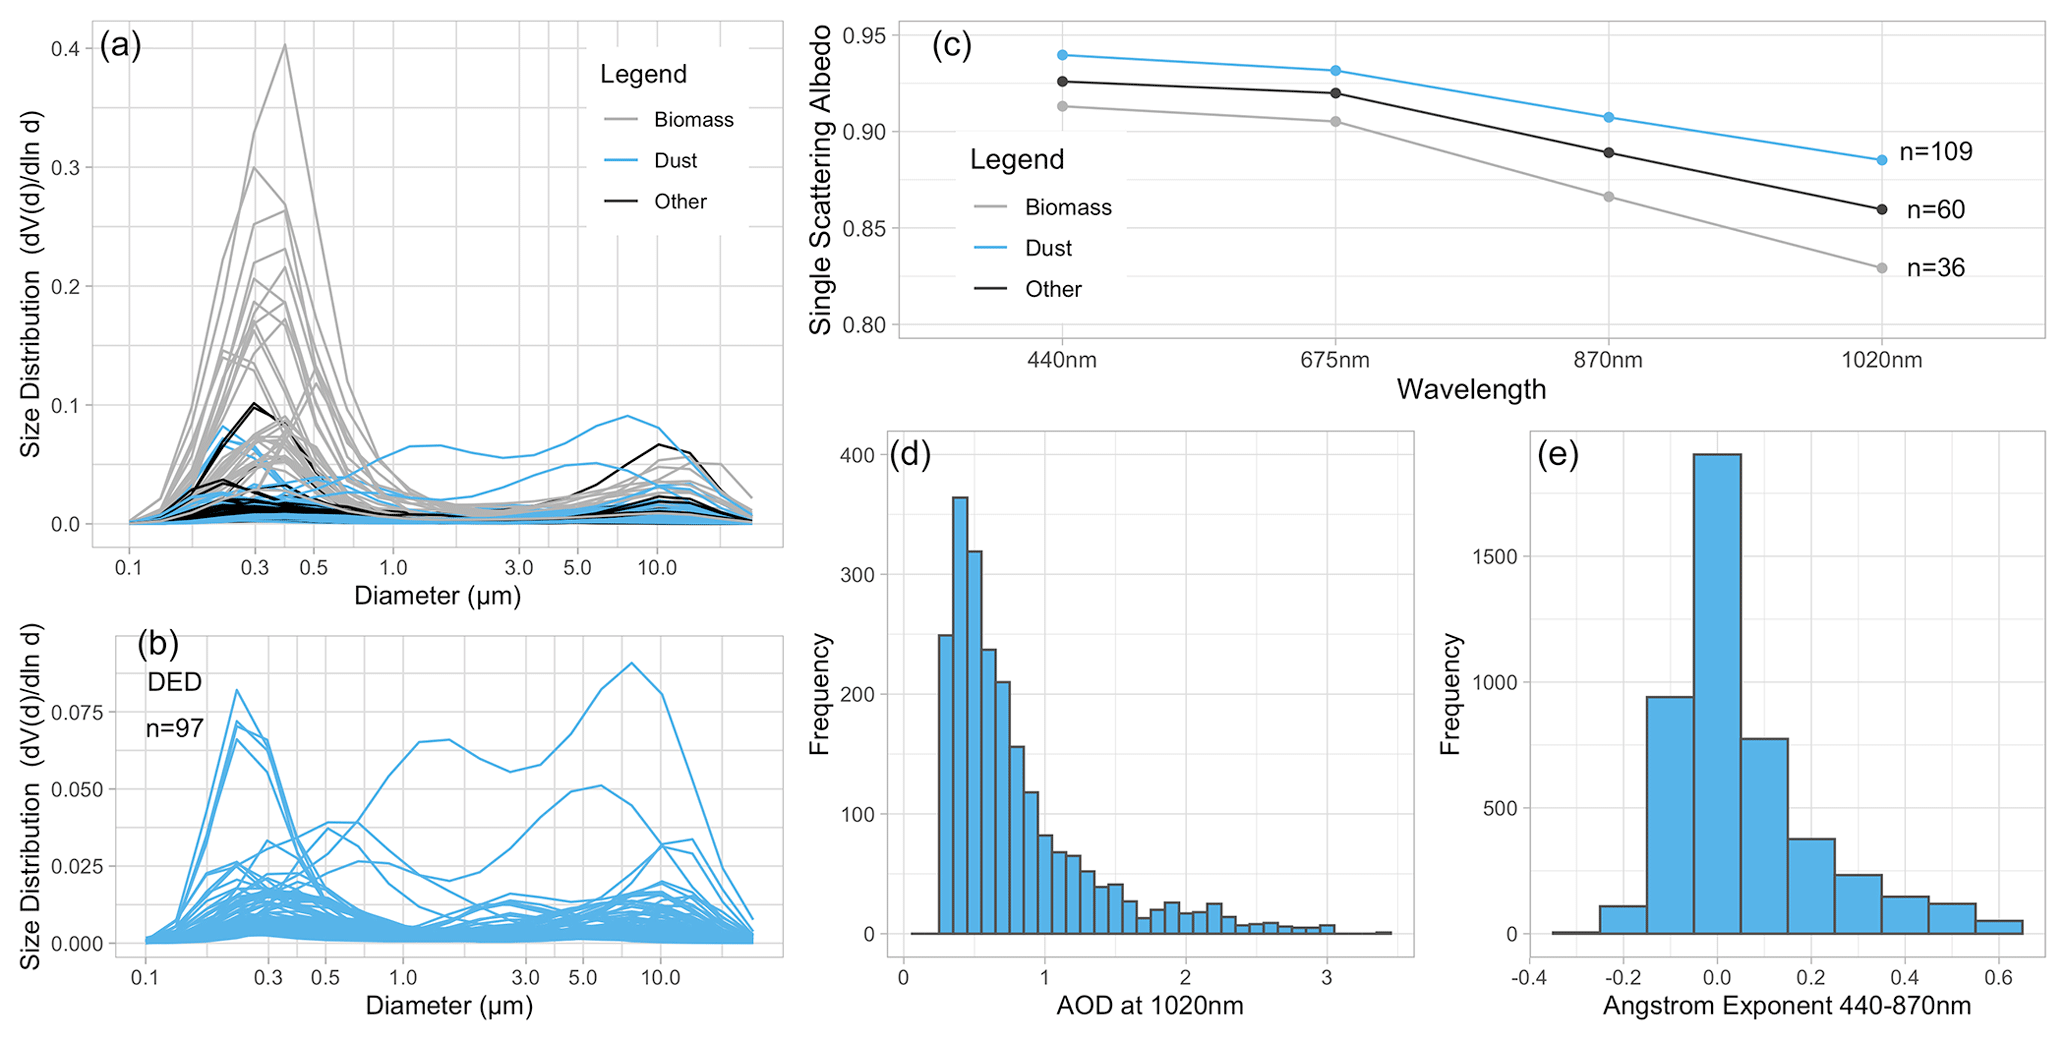
Figure 11(a) Volume size distribution of aerosols at Lhù'ààn Mân. Recordings that were taken on a DED (DED definition is from Dubovik et al., 2002, in the 1020 nm band) are in blue, and recordings taken when there were biomass burning (defined from Verma et al., 2015) events (smoke) are in grey. Any days where dust or smoke were not detected in AERONET are displayed in black. Models used to calculate volume size distribution are based on AERONET level 2.0 DQ with an AOD >0.4. Dust event days are then pulled out for (b) to show the presence of trimodal dust size. (c) Single scattering albedo for the principal aerosol types recorded at the Lhù'ààn Mân AERONET station for 2019 when AOD >0.4. Dust events are in green, biomass burning events are in pink, and all other aerosol types are in blue. Models that calculate SSA are based on AERONET level 2.0 DQ. Frequency histograms of AOD (d) and Ångström exponent (e) at Kluane Lake AERONET station in 2019.
Nevertheless, where DQ 1.0, 1.5, and 2.0 data are applied, it remains likely that some cloud optical depth may also be included in the spectral AOD measurements. However, Arola et al. (2017) found that non-cloud-screened DQ data added roughly 0.007 and 0.0012 onto the AOD values. To investigate aerosol types at out study site, we applied a combined approach, whereby DQ 1.0 data were used to build an inventory of DEDs for comparison with in situ data, and SSA and volume size distribution inversion products were generated using DQ 2.0 cloud-screened data. The average AODD at Lhù'ààn Mân for the 2018 measurement season was 0.181, 0.031, 0.03 for DQ 1.0, 1.5, and 2.0, respectively, which depicts an almost pristine atmosphere (also see Fig. 10c, d). However, Fig. 9b, which derives aerosol types from the DQ 1.0 data using the method of Verma et al. (2015), also highlights the possible presence of a range of aerosol types at this site. From these data we suggest that the two dominant aerosols that alter the incoming solar radiation at this location are dust and biomass burning particles, where dust accounts for 11.4 % of daily aerosol occurrences at the site.
Given the distribution of monitoring sites, most previous studies which investigate the radiative signature of dust using AERONET returns have been conducted at low latitudes (desert dust) using DQ 1.5 AERONET data (e.g. Santese et al., 2007; Binietoglou et al., 2015). In this study, the likely presence of dust events was determined through use of initial generic thresholds at two different AERONET wavelengths: 500 and 1020 nm. Thresholds at 500 nm were used to broadly characterize aerosols at Lhù'ààn Mân with thresholds used in arid environments (Verma et al., 2015). Therefore, whilst the 500 nm definitions are useful to understand the aerosol environment at KLRS, it may not be truly representative of dust emissions. This is evident when compared to direct ground data observations, AERONET-derived dust events in this study recorded at longer wavelengths were found to be a closer match to the known frequency of events than those at shorter wavelengths (Fig. 9a, b). For example, on a day where RC data shows dust events for 95.8 % of the day (24 May 2018), 11.6 % of AOD readings were classified as dust using the thresholds from Verma et al. (2015), whereas thresholds from Dubovik et al. (2002) yielded 24.2 % AOD readings as dust. We therefore note that careful consideration in wavelength and definition thresholds and the possible inclusion of spectral deconvolution algorithm data (SDA) are needed when quantifying HLMA in AERONET data.
When investigating AERONET retrievals at this location, consideration of differences in the optical properties of glacially derived dust when compared to those derived in the mid-latitudes are important. Mid-latitude AOD and α thresholds (from Verma et al., 2015 and Dubovik et al., 2002) have been used to define dust presence in this study. However, these thresholds may not encompass the optical parameters of HLMA, and this may also impact retrievals at this site. Further exploration of other AERONET products, for example the SDA, may further help define thresholds for HLMA. Furthermore, it is also important to note the location of the AERONET station relative to the dust source. KLRS is extremely close to the dust course, which contributes to rapid variability in dust concentrations that will not be seen at mid-latitude locations far from the source. It is likely that dust from this site will consequently have a higher coarse-mode fraction than the AOD and Ångström exponent (AE) at mid-latitude sites.
For DEDs in 2018 (using definitions from Dubovik et al., 2002 and at DQ 1.0) at Lhù'ààn Mân, the average α was −0.003 indicating a very coarse grain size. The average α increased in 2019 to 0.12, suggesting a slight decrease in grain size. Both the α and AODD for DEDs at Lhù'ààn Mân suggest a predominantly unimodal grain size distribution (Fig. 11c), suggesting that grains in suspension have comparable size and optical properties. Figure 11a outlines AERONET inversion volume size distributions for DEDs at the study site. The study site is dominated by the presence of biomass burning aerosols (smoke). Scans made on DEDs (Fig. 11a) show a trimodal distribution with peaks at 2.6 and 10.1 µm. Bachelder et al. (2020) calculated the normalized particle size distribution through deposition traps and optical particle counters at Lhù'ààn Mân and recorded a maximum frequency at a particle diameter of 3.25 µm. This is coarser than the first maximum frequency observed at 2.6 µm from the first peak and significantly finer than the 10.1 µm second peak calculated from the AERONET inversion products in this study. The second peak observed in the volume size distributions is similar to studies of well-characterized dust sources in the mid-latitudes, which peak around 10 µm (Kok et al., 2017; Huang et al., 2019). SSA was derived for the aerosol types and shows that dust scatters the most incoming radiation, with biomass burning aerosols scattering slightly less (Fig. 11c).
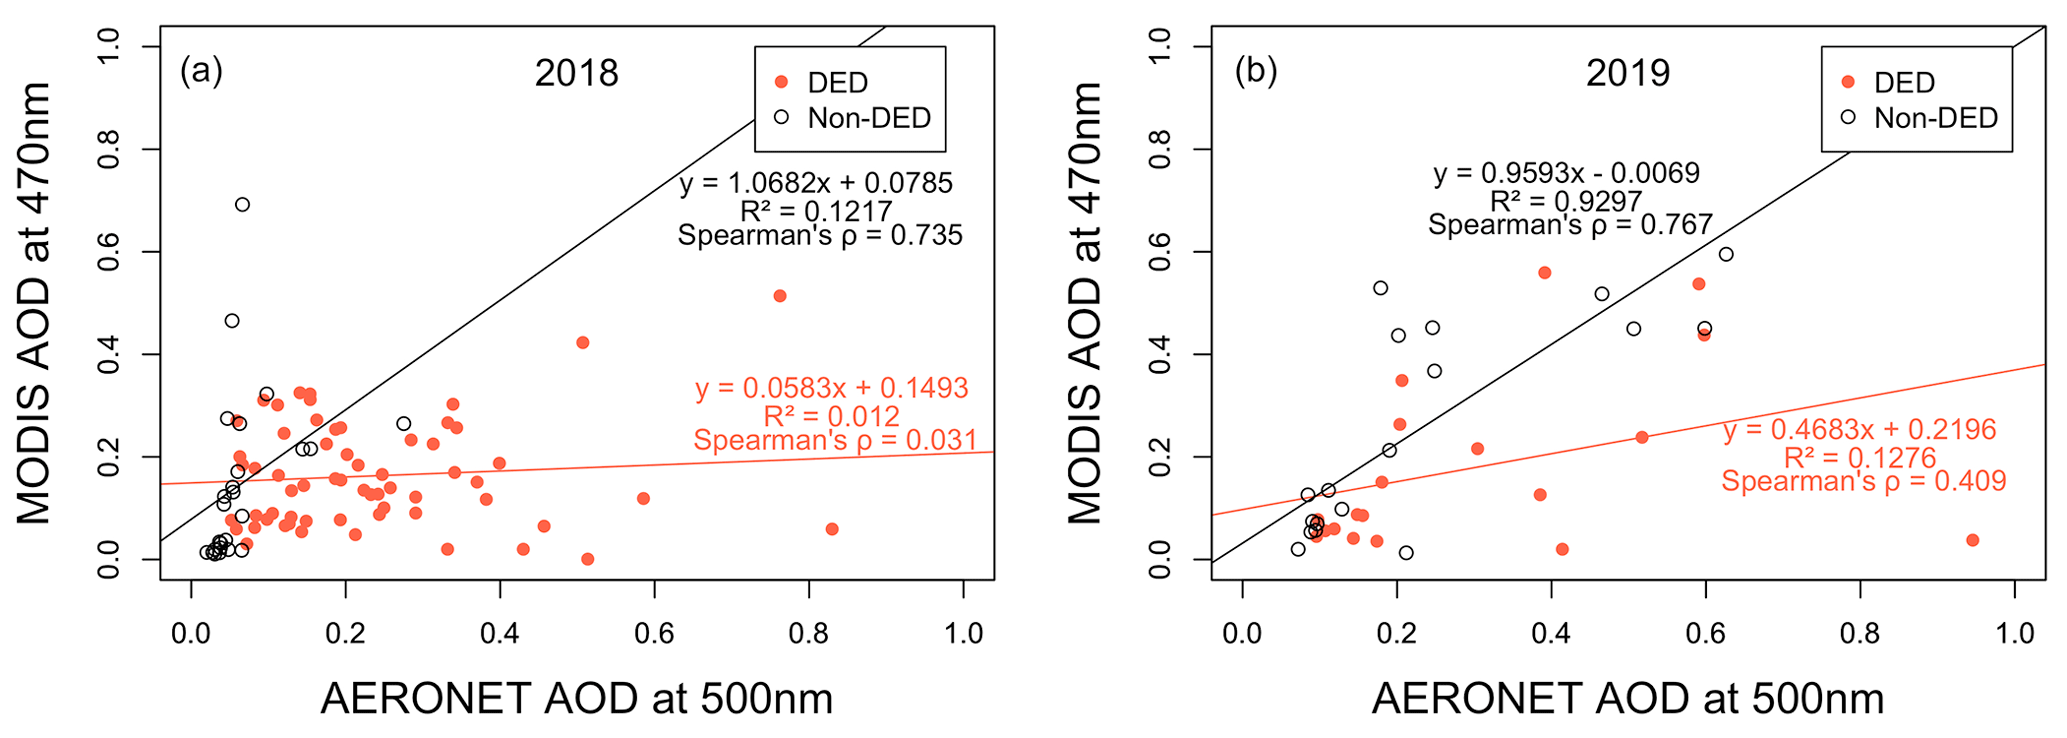
Figure 12Evaluation of daily mean MAIAC (v6) 1 km AOD at 470 nm against daily AERONET mean AOD at 500 nm at Lhù'ààn Mân over 2018 (a) and 2019 (b). Note that MAIAC operates using AOD at two wavelengths, 470 and 550 nm; 470 nm was chosen due to its relative closeness AERONET AOD at 500 nm. DEDs are visualized in red, and non-event days are in black. Regression line equations, R2 values, and Spearman's rho for the different day types are also provided.
4.4 LEO-based observations
MODIS MAIAC data were analysed to establish dust event occurrence, typical associated AODM returns, and gross comparison with synergistic AERONET AODA (see Table 2) data at the study site. Differences in retrievals between DEDs and non-event days were recorded (see Fig. 12). The relationship between AERONET and MODIS AOD on DEDs is weak (Spearman's rho value of 0.031 and 0.409 in 2018 and 2019, respectively); many events are recorded via AODA, but those matched with AODM are relatively limited. Non-dust event days observe a stronger association (Spearman's rho value of 0.735 in 2018 and 0.767 in 2019).
Figure 12 suggests a weak relationship between AODA and AODM at Lhù'ààn Mân during 2018. Previous studies using similar data but based in the mid-latitudes have shown significantly stronger correlation between these variables over similar time intervals (e.g. Jethva et al., 2019; Martins et al., 2017; Mhawish et al., 2019). Analysis of AODM and AODA data in this study is constrained by the retrieval wavelengths used to obtain AOD. The MODIS MAIAC algorithm derives AOD at both 470 and 550 nm, and the closest AERONET wavelength is 500 nm. While the difference in wavelengths may increase uncertainty in the relationship between the two detection approaches, it is clear from AERONET data that cloud-screening quality controls are likely to be more important confounding issues. However, because of the nature of how MAIAC and similar MODIS aerosol retrievals are generated, non-cloud-screened AOD are not available. In this instance, the MAIAC collection 6 processing algorithm uses a background time series to identify atmospheric conditions that change quickly (e.g. to capture clouds or dust). As noted, a dust test is conducted at low latitudes to differentiate dust, meaning that this aerosol species is not systematically excluded from the data (Lyapustin et al., 2018). However, the region containing Lhù'ààn Mân is not in this dust test, and consequently dust events that are active at the time of overpass are often excluded. Indeed, maximum AODA values observed by non-cloud-screened AERONET data during dust events are often missing in the MAIAC AODM data (see Fig. S5 in the Supplement). We therefore suggest that systematic removal of dust events in MAIAC and other similar LEO AOD retrievals accounts for the large discrepancies in AODA and AODM for DEDs here (Fig. 12).
It is evident from this study that high-latitude dust is being fundamentally under-represented when using both ground and space remote sensing methods and therefore in both past and present global dust and climate models. Understanding the effect that high-latitude dust has on the planet is extremely important as we move forward into a time of increased climate warming. This effect is calculated using models, which often use remote sensing to set their parameters. Correct parameterization of model inputs, such as dust grain size, spectral signatures, source locations, and detection rates, are extremely important to ensure that the influence of dust is properly assessed and that future predictions are accurate. At Lhù'ààn Mân, an exceptional frequent emitter of dust, more than 97.8 % of events are not being detected due to AERONET cloud-screening algorithms. This number may be much greater at other high-latitude locations without an AERONET station and with more discrete dust emissions, for example the Copper River in Alaska. Thresholds used for the detection of dust events in this study may also not encompass all dust events at the sites, as different wavelengths return different frequencies of events. Oblique camera images provide evidence that most dust events are being missed by AERONET. On an event scale, 73.9 % of emissions were missed. Missed events possibly occur due to a combination of the thresholds for detecting high-latitude dust being incorrect and AERONET detection issues in mountainous areas and during darkness. For dust to be detected correctly the high-latitude dust threshold in AERONET data needs to be revisited.
AERONET data are available to download at https://aeronet.gsfc.nasa.gov/cgi-bin/data_display_aod_v3?site=Kluane_Lake&nachal=2&level=3&place_code=10 (NASA, 2023). The Burwash Landing lake depth gauge data are available to download at https://wateroffice.ec.gc.ca/report/historical_e.html?stn=09CA001 (Environment Canada, 2023). All RC and meteorological data used in this study have been placed on an open-access repository and can be found at the following DOI: https://doi.org/10.5281/zenodo.7249227 (Huck et al., 2022).
The supplement related to this article is available online at: https://doi.org/10.5194/acp-23-6299-2023-supplement.
RH: conceptualization, methodology, formal analysis, writing – original draft. RGB: conceptualization, methodology, writing – review and editing. JK: data collection, methodology, writing – review and editing.
The contact author has declared that none of the authors has any competing interests.
Publisher's note: Copernicus Publications remains neutral with regard to jurisdictional claims in published maps and institutional affiliations.
We would also like to acknowledge that the Kluane Lake Research Station is located on the traditional territories of the Kluane First Nations and the Champagne and Aishihik First Nations. Thanks is also due to Environment and Climate Change Canada for their effort in establishing and maintaining Kluane Lake AERONET station. Environment Canada is thanked for the use of their data for the lake depth gauge at Burwash Landing. Funding support is acknowledged for James King by NSERC RGPIN-2016-05417 and from the Canadian Mountain Network. The authors acknowledge Planet Labs for their provision of free data access to education and research users.
This research has been supported by the Natural Sciences and Engineering Research Council of Canada (grant no. RGPIN-2016-05417). We have received support from the University of Sheffield Institutional Open Access Fund.
This paper was edited by Jianping Huang and reviewed by two anonymous referees.
Amino, T., Iizuka, Y., Matoba, S., Shimada, R., Oshima, N., Suzuki, T., Ando, T., Aoki, T., and Fujita, K.: Increasing dust emission from ice free terrain in southeastern Greenland since 2000, Polar Sci., 27, 100599, https://doi.org/10.1016/j.polar.2020.100599, 2021.
Arnalds, O.: Dust sources and deposition of aeolian materials in Iceland, Icel. Agric. Sci., 23, 3–21, 2010.
Arnalds, O., Dagsson-Waldhauserova, P., and Olafsson, H.: The Icelandic volcanic aeolian environment: Processes and impacts – A review, Aeolian Res., 20, 176–195, https://doi.org/10.1016/j.aeolia.2016.01.004, 2016.
Arola, A., Eck, T. F., Kokkola, H., Pitkänen, M. R. A., and Romakkaniemi, S.: Assessment of cloud-related fine-mode AOD enhancements based on AERONET SDA product, Atmos. Chem. Phys., 17, 5991–6001, https://doi.org/10.5194/acp-17-5991-2017, 2017.
Bachelder, J., Cadieux, M., Liu-Kang, C., Lambert, P., Filoche, A., Galhardi, J. A., Hadioui, M., Chaput, A., Bastien-Thibault, M. P., Wilkinson, K. J., King, J., and Hayes, P. L.: Chemical and microphysical properties of wind-blown dust near an actively retreating glacier in Yukon, Canada, Aerosol Sci. Technol., 54, 2–20, https://doi.org/10.1080/02786826.2019.1676394, 2020.
Baddock, M. C., Bullard, J. E., and Bryant, R. G.: Dust source identification using MODIS: A comparison of techniques applied to the Lake Eyre Basin, Australia, Remote Sens. Environ., 113, 1511–1528, https://doi.org/10.1016/j.rse.2009.03.002, 2009.
Baddock, M. C., Bryant, R. G., Acosta, M. D., and Gill, T. E.: Understanding dust sources through remote sensing: Making a case for CubeSats, J. Arid Environ., 184, 104335, https://doi.org/10.1016/j.jaridenv.2020.104335, 2021.
Baldo, C., Formenti, P., Nowak, S., Chevaillier, S., Cazaunau, M., Pangui, E., Di Biagio, C., Doussin, J.-F., Ignatyev, K., Dagsson-Waldhauserova, P., Arnalds, O., MacKenzie, A. R., and Shi, Z.: Distinct chemical and mineralogical composition of Icelandic dust compared to northern African and Asian dust, Atmos. Chem. Phys., 20, 13521–13539, https://doi.org/10.5194/acp-20-13521-2020, 2020.
Bibi, H., Alam, K., and Bibi, S.: In-depth discrimination of aerosol types using multiple clustering techniques over four locations in Indo-Gangetic plains, Atmos. Res., 181, 106–114, https://doi.org/10.1016/j.atmosres.2016.06.017, 2016.
Bateman, M. D.: Aeolian Processes in Periglacial Environments – Treatise of Geomorphology, 5–10, ISBN 978-0-08-088522-3, 2013.
Binietoglou, I., Basart, S., Alados-Arboledas, L., Amiridis, V., Argyrouli, A., Baars, H., Baldasano, J. M., Balis, D., Belegante, L., Bravo-Aranda, J. A., Burlizzi, P., Carrasco, V., Chaikovsky, A., Comerón, A., D'Amico, G., Filioglou, M., Granados-Muñoz, M. J., Guerrero-Rascado, J. L., Ilic, L., Kokkalis, P., Maurizi, A., Mona, L., Monti, F., Muñoz-Porcar, C., Nicolae, D., Papayannis, A., Pappalardo, G., Pejanovic, G., Pereira, S. N., Perrone, M. R., Pietruczuk, A., Posyniak, M., Rocadenbosch, F., Rodríguez-Gómez, A., Sicard, M., Siomos, N., Szkop, A., Terradellas, E., Tsekeri, A., Vukovic, A., Wandinger, U., and Wagner, J.: A methodology for investigating dust model performance using synergistic EARLINET/AERONET dust concentration retrievals, Atmos. Meas. Tech., 8, 3577–3600, https://doi.org/10.5194/amt-8-3577-2015, 2015.
Bryant, R. G.: Recent advances in our understanding of dust source emission processes, Prog. Phys. Geogr., 37, 397–421, https://doi.org/10.1177/0309133313479391, 2013.
Bryant, R. G. and Baddock, M. C.: Remote Sensing of Aeolian Processes, in: Treatise on Geomorphology, 44, 84–119, https://doi.org/10.1016/b978-0-12-818234-5.00132-2, 2022.
Bullard, J. E.: Contemporary glaciogenic inputs to the dust cycle, Earth Surf. Proc. Land., 38, 71–89, https://doi.org/10.1002/esp.3315, 2013.
Bullard, J. E. and Mockford, T.: Seasonal and decadal variability of dust observations in the Kangerlussuaq area, west Greenland, Arctic, Antarct. Alp. Res., 50, S100011, https://doi.org/10.1080/15230430.2017.1415854, 2018.
Bullard, J. E., Harrison, S. P., Baddock, M. C., Drake, N., Gill, T. E., McTainsh, G., and Sun, Y.: Preferential dust sources: A geomorphological classification designed for use in global dust-cycle models, J. Geophys. Res.-Earth, 116, F04034, https://doi.org/10.1029/2011JF002061, 2011.
Bullard, J. E., Matthew, B., Tom, B., John, C., Eleanor, D., Diego, G., Santiago, G., Gudrun, G., Richard, H., Robert, M., Cheryl, M.-N., Tom, M., Helena, S., and Thorsteinsson, T.: High latitude dust in the Earth system, Rev. Geophys., 54, 447–485, https://doi.org/10.1002/2016RG000518, 2016.
Chepil, W. S.: Influence of moisture on erodibility of soil by wind, Soil Sci. Soc. America Proc., 20, 288–292, 1956.
Ciren, P. and Kondragunta, S.: Journal Dust aerosol index (DAI) algorithm for MODIS, J. Geophys. Res., 119, 6196–6206, https://doi.org/10.1002/2014JD021606, 2014.
Cook, J., Edwards, A., Takeuchi, N., and Irvine-Fynn, T.: Cryoconite: The dark biological secret of the cryosphere, Prog. Phys. Geogr., 40, 66–111, https://doi.org/10.1177/0309133315616574, 2016.
Cornelis, W. M. and Gabriels, D.: The effect of surface moisture on the entrainment of dune sand by wind: An evaluation of selected models, Sedimentology, 50, 771–790, https://doi.org/10.1046/j.1365-3091.2003.00577.x, 2003.
Corte, A. E.: Laboratory formation of extrusion features by multicyclic freeze-thaw in soils, Bulletin-Centre de Géomorphologie de Caen, 13–15, 157–182, 1971.
Crocchianti, S., Moroni, B., Waldhauserová, P. D., Becagli, S., Severi, M., Traversi, R., and Cappelletti, D.: Potential source contribution function analysis of high latitude dust sources over the arctic: Preliminary results and prospects, Atmosphere-Basel, 12, 347, https://doi.org/10.3390/atmos12030347, 2021.
Crusius, J.: Dissolved Fe Supply to the Central Gulf of Alaska Is Inferred to Be Derived From Alaskan Glacial Dust That Is Not Resolved by Dust Transport Models, J. Geophys. Res.-Biogeo., 126, 1–13, https://doi.org/10.1029/2021JG006323, 2021.
Crusius, J., Schroth, A. W., Gassó, S., Moy, C. M., Levy, R. C., and Gatica, M.: Glacial flour dust storms in the Gulf of Alaska: Hydrologic and meteorological controls and their importance as a source of bioavailable iron, Geophys. Res. Lett., 38, 1–5, https://doi.org/10.1029/2010GL046573, 2011.
Crusius, J., Schroth, A. W., Resing, J. A., Cullen, J., and Campbell, R. W.: Seasonal and spatial variabilities in northern Gulf of Alaska surface water iron concentrations driven by shelf sediment resuspension, glacial meltwater, a Yakutat eddy, and dust, Global Biogeochem. Cy., 31, 942–960, https://doi.org/10.1002/2016GB005493, 2017.
Djossou, J., Léon, J.-F., Akpo, A. B., Liousse, C., Yoboué, V., Bedou, M., Bodjrenou, M., Chiron, C., Galy-Lacaux, C., Gardrat, E., Abbey, M., Keita, S., Bahino, J., Touré N'Datchoh, E., Ossohou, M., and Awanou, C. N.: Mass concentration, optical depth and carbon composition of particulate matter in the major southern West African cities of Cotonou (Benin) and Abidjan (Côte d'Ivoire), Atmos. Chem. Phys., 18, 6275–6291, https://doi.org/10.5194/acp-18-6275-2018, 2018.
Dubovik, O., Smirnov, A., Holben, B. N., King, M. D., Kaufman, Y. J., Eck, T. F., and Slutsker, I.: Accuracy assessments of aerosol optical properties retrieved from Aerosol Robotic Network (AERONET) Sun and sky radiance measurements, J. Geophys. Res.-Atmos., 105, 9791–9806, https://doi.org/10.1029/2000JD900040, 2000.
Dubovik, O., Holben, B., Eck, T. F., Smirnov, A., Kaufman, Y. J., King, M. D., Tanré, D., and Slutsker, I.: Variability of absorption and optical properties of key aerosol types observed in worldwide locations, J. Atmos. Sci., 59, 590–608, https://doi.org/10.1175/1520-0469(2002)059<0590:voaaop>2.0.co;2, 2002.
Eck, T. F., Holben, B. N., Reid, J. S., Dubovik, O., Smirnov, A., O'Neill, N. T., Slutsker, I., and Kinne, S.: Wavelength dependence of the optical depth of biomass burning, urban, and desert dust aerosols, J. Geophys. Res.-Atmos., 104, 31333–31349, https://doi.org/10.1029/1999JD900923, 1999.
Eck, T. F., Holben, B. N., Sinyuk, A., Pinker, R. T., Goloub, P., Chen, H., Chatenet, B., Li, Z., Singh, R. P., Tripathi, S. N., Reid, J. S., Giles, D. M., Dubovik, O., O'Neill, N. T., Smirnov, A., Wang, P., and Xia, X.: Climatological aspects of the optical properties of fine/coarse mode aerosol mixtures, J. Geophys. Res.-Atmos., 115, 1–20, https://doi.org/10.1029/2010JD014002, 2010.
Environment Canada: Daily Water Level Graph for KLUANE LAKE NEAR BURWASH LANDING (09CA001) [YT], Environment Canada [data set], https://wateroffice.ec.gc.ca/report/historical_e.html?stn=09CA001, last access: 13 May 2023.
Estevan, R., Martínez-Castro, D., Suarez-Salas, L., Moya, A., and Silva, Y.: First two and a half years of aerosol measurements with an AERONET sunphotometer at the Huancayo Observatory, Peru, Atmos. Environ., 3, 100037, https://doi.org/10.1016/j.aeaoa.2019.100037, 2019.
Evan, A. T.: Downslope winds and dust storms in the salton basin, Mon. Weather Rev., 147, 2387–2402, https://doi.org/10.1175/MWR-D-18-0357.1, 2019.
Formenti, P., Schütz, L., Balkanski, Y., Desboeufs, K., Ebert, M., Kandler, K., Petzold, A., Scheuvens, D., Weinbruch, S., and Zhang, D.: Recent progress in understanding physical and chemical properties of African and Asian mineral dust, Atmos. Chem. Phys., 11, 8231–8256, https://doi.org/10.5194/acp-11-8231-2011, 2011.
Foster, C., Hallam, H., and Mason, J.: Orbit determination and differential-drag control of Planet Labs cubesat constellations, Adv. Astronaut. Sci., 156, 645–657, 2016.
Foy, N., Copland, L., Zdanowicz, C., Demuth, M., and Hopkinson, C.: Recent volume and area changes of Kaskawulsh Glacier, Yukon, Canada, J. Glaciol., 57, 515–525, https://doi.org/10.3189/002214311796905596, 2011.
Gassó, S. and Stein, A. F.: Does dust from Patagonia reach the sub-Antarctic Atlantic Ocean?, Geophys. Res. Lett., 34, L01801, https://doi.org/10.1029/2006GL027693, 2007.
Giles, D. M., Sinyuk, A., Sorokin, M. G., Schafer, J. S., Smirnov, A., Slutsker, I., Eck, T. F., Holben, B. N., Lewis, J. R., Campbell, J. R., Welton, E. J., Korkin, S. V., and Lyapustin, A. I.: Advancements in the Aerosol Robotic Network (AERONET) Version 3 database – automated near-real-time quality control algorithm with improved cloud screening for Sun photometer aerosol optical depth (AOD) measurements, Atmos. Meas. Tech., 12, 169–209, https://doi.org/10.5194/amt-12-169-2019, 2019.
Groot Zwaaftink, C. D., Grythe, H., Skov, H., and Stohl, A.: Substantial contribution of northern high-latitude sources to mineral dust in the Arctic, J. Geophys. Res., 121, 13678–13697, https://doi.org/10.1002/2016JD025482, 2016.
Harley, G. L., King, J., and Maxwell, J. T.: Trans-Atlantic connections between North African dust flux and tree growth in the Florida Keys, United States, Earth Interact., 21, 1–22, https://doi.org/10.1175/EI-D-16-0035.1, 2017.
Haywood, J. and Boucher, O.: Estimates of the direct and indirect radiative forcing due to tropospheric aerosols: A review, Rev. Geophys., 38, 513–543, https://doi.org/10.1029/1999RG000078, 2000.
Holben, B. N., Eck, T. F., Slutsker, I., Tanré, D., Buis, J. P., Setzer, A., Vermote, E., Reagan, J. A., Kaufman, Y. J., Nakajima, T., Lavenu, F., Jankowiak, I., and Smirnov, A.: AERONET – A federated instrument network and data archive for aerosol characterization, Remote Sens. Environ., 66, 1–16, https://doi.org/10.1016/S0034-4257(98)00031-5, 1998.
Huang, Y., Kok, J. F., Martin, R. L., Swet, N., Katra, I., Gill, T. E., Reynolds, R. L., and Freire, L. S.: Fine dust emissions from active sands at coastal Oceano Dunes, California, Atmos. Chem. Phys., 19, 2947–2964, https://doi.org/10.5194/acp-19-2947-2019, 2019.
Huck, R., Bryant, R. G., and King, J.: Meterological data, Remote camera images, Zenodo [data set], https://doi.org/10.5281/zenodo.7249227, 2022.
Iftikhar, M., Alam, K., Sorooshian, A., Syed, W. A., Bibi, S., and Bibi, H.: Contrasting aerosol optical and radiative properties between dust and urban haze episodes in megacities of Pakistan, Atmos. Environ., 173, 157–172, https://doi.org/10.1016/j.atmosenv.2017.11.011, 2018.
IPCC: Climate Change 2013: The Physical Science Basis. Contribution of Working Group I to the Fifth Assessment Report of the Intergovernmental Panel on Climate Change, edited by: Stocker, T. F., Qin, D., Plattner, G.-K., Tignor, M., Allen, S. K., Boschung, J., Nauels, A., Xia, Y., Bex, V., and Midgley, P. M., Cambridge University Press, Cambridge, United Kingdom and New York, NY, USA, 1535 pp., ISBN 978-1-107-05799-1, 2013.
IPCC: IPCC Special Report on the Ocean and Cryosphere in a Changing Climate, edited by: Pörtner, H.-O., Roberts, D. C., Masson-Delmotte, V., Zhai, P., Tignor, M., Poloczanska, E., Mintenbeck, K., Alegría, A., Nicolai, M., Okem, A., Petzold, J., Rama, B., and Weyer, N. M., Cambridge University Press, Cambridge, UK and New York, NY, USA, 755 pp., https://doi.org/10.1017/9781009157964, 2019.
Jacobson, Z.: A physically-based treatment of elemental carbon optics: Implications for global direct forcing of aerosols, Geophys. Res. Lett., 27, 217–220, 2000.
Jethva, H., Torres, O., and Yoshida, Y.: Accuracy assessment of MODIS land aerosol optical thickness algorithms using AERONET measurements over North America, Atmos. Meas. Tech., 12, 4291–4307, https://doi.org/10.5194/amt-12-4291-2019, 2019.
Kahn, R. A. and Gaitley, B. J.: An analysis of global aerosol type as retrieved by MISR, J. Geophys. Res.-Atmos., 120, 4248–4281, https://doi.org/10.1002/2015JD023322, 2015.
Kandakji, T., Gill, T. E., and Lee, J. A.: Identifying and characterizing dust point sources in the southwestern United States using remote sensing and GIS, Geomoprhology, 353, 107019, https://doi.org/10.1016/j.geomorph.2019.107019, 2020.
Kok, J. F., Parteli, E. J. R., Michaels, T. I., and Karam, D. B.: The physics of wind-blown sand and dust, Rep. Prog. Phys., 75, 106901, https://doi.org/10.1088/0034-4885/75/10/106901, 2012.
Kok, J. F., Ridley, D. A., Zhou, Q., Miller, R. L., Zhao, C., Heald, C. L., Ward, D. S., Albani, S., and Haustein, K.: Smaller desert dust cooling effect estimated from analysis of dust size and abundance, Nat. Geosci., 10, 274–278, https://doi.org/10.1038/ngeo2912, 2017.
Krinner, G., Boucher, O., and Balkanski, Y.: Ice-free glacial northern Asia due to dust deposition on snow, Clim. Dynam., 27, 613–625, https://doi.org/10.1007/s00382-006-0159-z, 2006.
Kylling, A., Groot Zwaaftink, C. D., and Stohl, A.: Mineral Dust Instantaneous Radiative Forcing in the Arctic, Geophys. Res. Lett., 45, 4290–4298, https://doi.org/10.1029/2018GL077346, 2018.
Léon, J.-F., Akpo, A. B., Bedou, M., Djossou, J., Bodjrenou, M., Yoboué, V., and Liousse, C.: PM2.5 surface concentrations in southern West African urban areas based on sun photometer and satellite observations, Atmos. Chem. Phys., 21, 1815–1834, https://doi.org/10.5194/acp-21-1815-2021, 2021.
Luo, T., Wang, Z., Zhang, D., Liu, X., Wang, Y., and Yuan, R.: Global dust distribution from improved thin dust layer detection using A-train satellite lidar observations, Geophys. Res. Lett., 42, 620–628, https://doi.org/10.1002/2014GL062111, 2015.
Lyapustin, A., Korkin, S., Wang, Y., Quayle, B., and Laszlo, I.: Discrimination of biomass burning smoke and clouds in MAIAC algorithm, Atmos. Chem. Phys., 12, 9679–9686, https://doi.org/10.5194/acp-12-9679-2012, 2012.
Lyapustin, A., Wang, Y., Korkin, S., and Huang, D.: MODIS Collection 6 MAIAC algorithm, Atmos. Meas. Tech., 11, 5741–5765, https://doi.org/10.5194/amt-11-5741-2018, 2018.
Martins, V. S., Lyapustin, A., De Carvalho, L. A. S., Barbosa, C. C. F., and Novo, E. M. L. M.: Validation of high-resolution MAIAC aerosol product over South America, J. Geophys. Res., 122, 7537–7559, https://doi.org/10.1002/2016JD026301, 2017.
McGrath, D., Steffen, K., Overeem, I., Mernild, S. H., Hasholt, B., and Van Den Broeke, M.: Sediment plumes as a proxy for local ice-sheet runoff in Kangerlussuaq Fjord, West Greenland, J. Glaciol., 56, 813–821, https://doi.org/10.3189/002214310794457227, 2010.
McKnight, E. A., Swanson, H., Brahney, J., and Hik, D. S.: The physical and chemical limnology of yukon's largest lake, lhù'ààn mân' (Kluane lake), prior to the 2016 `aäy chù' diversion, Arct. Sci., 7, 655–678, https://doi.org/10.1139/as-2020-0012, 2021.
Meinander, O., Dagsson-Waldhauserova, P., Amosov, P., Aseyeva, E., Atkins, C., Baklanov, A., Baldo, C., Barr, S. L., Barzycka, B., Benning, L. G., Cvetkovic, B., Enchilik, P., Frolov, D., Gassó, S., Kandler, K., Kasimov, N., Kavan, J., King, J., Koroleva, T., Krupskaya, V., Kulmala, M., Kusiak, M., Lappalainen, H. K., Laska, M., Lasne, J., Lewandowski, M., Luks, B., McQuaid, J. B., Moroni, B., Murray, B., Möhler, O., Nawrot, A., Nickovic, S., O’Neill, N. T., Pejanovic, G., Popovicheva, O., Ranjbar, K., Romanias, M., Samonova, O., Sanchez-Marroquin, A., Schepanski, K., Semenkov, I., Sharapova, A., Shevnina, E., Shi, Z., Sofiev, M., Thevenet, F., Thorsteinsson, T., Timofeev, M., Umo, N. S., Uppstu, A., Urupina, D., Varga, G., Werner, T., Arnalds, O., and Vukovic Vimic, A.: Newly identified climatically and environmentally significant high-latitude dust sources, Atmos. Chem. Phys., 22, 11889–11930, https://doi.org/10.5194/acp-22-11889-2022, 2022.
Mhawish, A., Banerjee, T., Sorek-Hamer, M., Lyapustin, A., Broday, D. M., and Chatfield, R.: Comparison and evaluation of MODIS Multi-angle Implementation of Atmospheric Correction (MAIAC) aerosol product over South Asia, Remote Sens. Environ., 224, 12–28, https://doi.org/10.1016/j.rse.2019.01.033, 2019.
Mockford, T., Bullard, J. E., and Thorsteinsson, T.: The dynamic effects of sediment availability on the relationship between wind speed and dust concentration, Earth Surf. Proc. Land, 43, 2484–2492, https://doi.org/10.1002/esp.4407, 2018.
Moroni, B., Arnalds, O., Dagsson-Waldhauserová, P., Crocchianti, S., Vivani, R., and Cappelletti, D.: Mineralogical and chemical records of Icelandic dust sources upon Ny-Ålesund (Svalbard Islands), Front. Earth Sci., 6, 1–13, https://doi.org/10.3389/feart.2018.00187, 2018.
Murray, B. J., Carslaw, K. S., and Field, P. R.: Opinion: Cloud-phase climate feedback and the importance of ice-nucleating particles, Atmos. Chem. Phys., 21, 665–679, https://doi.org/10.5194/acp-21-665-2021, 2021.
Murray, J. E., Brindley, H. E., Bryant, R. G., Russell, J. E., Jenkins, K. F., and Washington, R.: Enhancing weak transient signals in SEVIRI false color imagery: Application to dust source detection in southern Africa, J. Geophys. Res.-Atmos., 121, 10199–10219, https://doi.org/10.1002/2016JD025221, 2016.
NASA: Kluane Lake V3 AOD, AERONET, NASA [data set], https://aeronet.gsfc.nasa.gov/cgi-bin/data_display_aod_v3?site=Kluane_Lake&nachal=2&level=3&place_code=10, last access: 13 May 2023.
Nickling, W. G.: Eolian Sediment Transport During Dust Storms: Slims River Valley, Yukon Territory, Can. J. Earth Sci., 15, 1069–1084, https://doi.org/10.1139/e78-114, 1978.
Nickling, W. G. and Brazel, A. J.: Surface wind characteristics along the Icefield Ranges, Yukon Territory, Canada, Arct. Alp. Res., 17, 125–134, https://doi.org/10.2307/1550842, 1985.
O'Neill, N. T., Eck, T. F., Smirnov, A., Holben, B. N., and Thulasiraman, S.: Spectral discrimination of coarse and fine mode optical depth, J. Geophys. Res., 108, 4559–4573, https://doi.org/10.1029/2002JD002975, 2003.
Ranjbar, K., O'Neill, N. T., Ivanescu, L., King, J., and Hayes, P. L.: Remote sensing of a high-Arctic, local dust event over Lake Hazen (Ellesmere Island, Nunavut, Canada), Atmos. Environ., 246, 118102, https://doi.org/10.1016/j.atmosenv.2020.118102, 2021.
Platero, I. Y., Estevan, R., Moya, A., and Yuli, R. A.: Determining the desert dust aerosol presence in the Mantaro Valley, Peru, Opt. Pura y Apl., 51, 1–14, https://doi.org/10.7149/OPA.51.3.50023, 2018.
Prospero, J. M., Bullard, J. E., and Hodgkins, R.: High-latitude dust over the North Atlantic: Inputs from Icelandic proglacial dust storms, Science, 335, 1078–1082, https://doi.org/10.1126/science.1217447, 2012.
Ravi, S., Zobeck, T. M., Over, T. M., Okin, G. S., and D'Odorico, P.: On the effect of moisture bonding forces in air-dry soils on threshold friction velocity of wind erosion, Sedimentology, 53, 597–609, https://doi.org/10.1111/j.1365-3091.2006.00775.x, 2006.
Réveillet, M., Dumont, M., Gascoin, S., Lafaysse, M., Nabat, P., Ribes, A., Nheili, R., Tuzet, F., Ménégoz, M., Morin, S., Picard, G., and Ginoux, P.: Black carbon and dust alter the response of mountain snow cover under climate change, Nat. Commun., 13, 1–12, https://doi.org/10.1038/s41467-022-32501-y, 2022.
Santese, M., De Tomasi, F., and Perrone, M. R.: Moderate Resolution Imaging Spectroradiometer (MODIS) and Aerosol Robotic Network (AERONET) retrievals during dust outbreaks over the Mediterranean, J. Geophys. Res.-Atmos., 112, 1–14, https://doi.org/10.1029/2007JD008482, 2007.
Schepanski, K.: Transport of mineral dust and its impact on climate, Geosci., 8, 151, https://doi.org/10.3390/geosciences8050151, 2018.
Schmale, J., Zieger, P., and Ekman, A. M. L.: Aerosols in current and future Arctic climate, Nat. Clim. Chang., 11, 95–105, https://doi.org/10.1038/s41558-020-00969-5, 2021.
Schroth, A. W., Crusius, J., Gassó, S., Moy, C. M., Buck, N. J., Resing, J. A., and Campbell, R. W.: Atmospheric deposition of glacial iron in the Gulf of Alaska impacted by the position of the Aleutian Low, Geophys. Res. Lett., 44, 5053–5061, https://doi.org/10.1002/2017GL073565, 2017.
Schuster, G. L., Dubovik, O., and Holben, B. N.: Angstrom exponent and bimodal aerosol size distributions, J. Geophys. Res.-Atmos., 111, 1–14, https://doi.org/10.1029/2005JD006328, 2006.
Shi, Y., Liu, X., Wu, M., Zhao, X., Ke, Z., and Brown, H.: Relative importance of high-latitude local and long-range-transported dust for Arctic ice-nucleating particles and impacts on Arctic mixed-phase clouds, Atmos. Chem. Phys., 22, 2909–2935, https://doi.org/10.5194/acp-22-2909-2022, 2022.
Shugar, D. H., Clague, J. J., Best, J. L., Schoof, C., Willis, M. J., Copland, L., and Roe, G. H.: River piracy and drainage basin reorganization led by climate-driven glacier retreat, Nat. Geosci., 10, 370–375, https://doi.org/10.1038/ngeo2932, 2017.
Singh, P., Vaishya, A., Rastogi, S., and Babu, S. S.: Seasonal heterogeneity in aerosol optical properties over the subtropical humid region of northern India, J. Atmos. Sol.-Terr. Phys., 201, 105246, https://doi.org/10.1016/j.jastp.2020.105246, 2020.
Thorsteinsson, T., Gísladóttir, G., Bullard, J., and McTainsh, G.: Dust storm contributions to airborne particulate matter in Reykjavík, Iceland, Atmos. Environ., 45, 5924–5933, https://doi.org/10.1016/j.atmosenv.2011.05.023, 2011.
Tobo, Y., Adachi, K., DeMott, P. J., Hill, T. C. J., Hamilton, D. S., Mahowald, N. M., Nagatsuka, N., Ohata, S., Uetake, J., Kondo, Y., and Koike, M.: Glacially sourced dust as a potentially significant source of ice nucleating particles, Nat. Geosci., 12, 253–258, https://doi.org/10.1038/s41561-019-0314-x, 2019.
Urban, F. E., Goldstein, H. L., Fulton, R., and Reynolds, R. L.: Unseen Dust Emission and Global Dust Abundance: Documenting Dust Emission from the Mojave Desert (USA) by Daily Remote Camera Imagery and Wind-Erosion Measurements, J. Geophys. Res.-Atmos., 123, 8735–8753, https://doi.org/10.1029/2018JD028466, 2018.
van Soest, M. A. J., Bullard, J. E., Prater, M. C., Baddock, M. C., and Anderson, N. J.: Annual and seasonal variability in high latitude dust deposition, West Greenland, Earth Surf. Proc. Land., 47, 2393–2409, https://doi.org/10.1002/esp.5384, 2022.
Verma, S., Prakash, D., Ricaud, P., Payra, S., Attié, J. L., and Soni, M.: A new classification of aerosol sources and types as measured over Jaipur, India, Aerosol Air Qual. Res., 15, 985–993, https://doi.org/10.4209/aaqr.2014.07.0143, 2015.
Wang, L., Shi, Z. H., Wu, G. L., and Fang, N. F.: Freeze/thaw and soil moisture effects on wind erosion, Geomorphology, 207, 141–148, https://doi.org/10.1016/j.geomorph.2013.10.032, 2014.
Wientjes, I. G. M., Van de Wal, R. S. W., Reichart, G. J., Sluijs, A., and Oerlemans, J.: Dust from the dark region in the western ablation zone of the Greenland ice sheet, The Cryosphere, 5, 589–601, https://doi.org/10.5194/tc-5-589-2011, 2011.
Williamson, S. N., Hik, D. S., Gamon, J. A., Kavanaugh, J. L., and Koh, S.: Evaluating cloud contamination in clear-sky MODIS Terra daytime land surface temperatures using ground-based meteorology station observations, J. Climate, 26, 1551–1560, https://doi.org/10.1175/JCLI-D-12-00250.1, 2014.
Xi, Y., Xu, C., Downey, A., Stevens, R., Bachelder, J. O., King, J., Hayes, P. L., and Bertram, A. K.: Ice nucleating properties of airborne dust from an actively retreating glacier in Yukon, Canada, RSC Chem. Biol., 2, 714–726, https://doi.org/10.1039/d1ea00101a, 2022.
Yoshioka, M., Mahowald, N. M., Conley, A. J., Collins, W. D., Fillmore, D. W., Zender, C. S., and Coleman, D. B.: Impact of desert dust radiative forcing on sahel precipitation: Relative importance of dust compared to sea surface temperature variations, vegetation changes, and greenhouse gas warming, J. Climate, 20, 1445–1467, https://doi.org/10.1175/JCLI4056.1, 2007.
Yu, X., Shi, C., Ma, J., Zhu, B., Li, M., Wang, J., Yang, S., and Kang, N.: Aerosol optical properties during firework, biomass burning and dust episodes in Beijing, Atmos. Environ., 81, 475–484, https://doi.org/10.1016/j.atmosenv.2013.08.067, 2013.