the Creative Commons Attribution 4.0 License.
the Creative Commons Attribution 4.0 License.
 | 07 Jun 2023
Measurement report: Diurnal variations of brown carbon during two distinct seasons in a megacity in northeast China
Yuan Cheng
Xu-bing Cao
Ying-jie Zhong
Qin-qin Yu
Qiang Zhang
Ke-bin He
Brown carbon (BrC) represents an important target for the “win-win” strategy of mitigating climate change and improving air quality. However, estimating co-benefits of BrC control remains difficult for China, partially because current measurement results are insufficient to represent the highly variable emission sources and meteorological conditions across different regions. In this study, we investigated, for the first time, the diurnal variations of BrC during two distinct seasons in a megacity in northeast China. The winter campaign conducted in January 2021 was characterized by low temperatures rarely seen in other Chinese megacities (down to about −20 ∘C). The mass absorption efficiencies of BrC at 365 nm (MAE365) were found to be ∼ 10 % higher at night. The variations of MAE365 could not be explained by the influence of residential biomass burning emissions or secondary aerosol formation but were strongly associated with the changes of a diagnostic ratio for the relative importance of coal combustion and vehicle emissions (). Given that most coal combustion activities were uninterruptible, the higher nighttime MAE365 in winter were attributed primarily to increased emissions from heavy-duty diesel trucks. The spring campaign conducted in April 2021 was characterized by frequent occurrences of agricultural fires, as supported by the intensive fire hotspots detected around Harbin and the more-than-doubled ratios of levoglucosan to organic carbon () compared to the winter campaign. In spring, the MAE365 depended little on but exhibited a strong positive correlation with , suggesting open burning emissions as the dominant influencing factor for BrC's light absorption capacity. MAE365 were ∼ 70 % higher at night for the spring campaign, pointing to the prevalence of nighttime agricultural fires, which were presumably in response to local bans on open burning. It is noteworthy that the agricultural-fire emissions resulted in a distinct peak at ∼ 365 nm for the light absorption spectra of BrC, and candidates for the compounds at play were inferred to be aromatic species with nitro-functional groups. The presence of the ∼ 365 nm peak complicated the determination of absorption Ångström exponents for the agricultural-fire-impacted samples. In addition, the ∼ 365 nm peak became much less significant during the day, likely due to photobleaching of the relevant chromophores.
- Article
(2910 KB) - Full-text XML
-
Supplement
(487 KB) - BibTeX
- EndNote


Light-absorbing organic carbon, i.e., brown carbon (BrC), exerts important yet poorly understood effects on climate and the environment (Brown et al., 2018; Zeng et al., 2020; Sand et al., 2021). As a mixture of numerous organic compounds from both primary emissions and secondary formation, BrC exhibits extreme complexity in spectroscopy, composition, and evolution (Laskin et al., 2015; Brege et al., 2021; Washenfelder et al., 2022). Measurement techniques for BrC absorption mainly fall into two categories, including solvent extraction followed by light absorption spectrum measurement (Chen and Bond, 2010; Hecobian et al., 2010) and apportionment of total aerosol absorption to the contributions from black carbon and BrC (Yang et al., 2009; Lack et al., 2012). So far, consistency between BrC results from these two types of approaches has not been addressed, with variable relationships, either linear or nonlinear, and unclear influencing factors (Kumar et al., 2018; Zeng et al., 2022). This inconsistency introduced substantial difficulties to the integration of BrC measurement results across studies and regions (Wang et al., 2022), which is essential for unfolding the links between BrC sources and optical properties. In addition, efforts were also made to explain BrC absorption on a molecular level. Several techniques were shown to be powerful, such as electrospray ionization Fourier transform ion cyclotron resonance mass spectrometry (ESI FT-ICR MS; Wozniak et al., 2008; Jiang et al., 2021; Zeng et al., 2021), high-performance liquid chromatography coupled with high-resolution mass spectrometry (HPLC–HRMS; Lin et al., 2018; Huang et al., 2022; Xu et al., 2022), and two-dimensional gas chromatography with time-of-flight mass spectrometer (GC × GC-ToF-MS; Huo et al., 2021). These techniques were more frequently applied to laboratory-generated primary or secondary BrC (e.g., Lin et al., 2015), which usually had less complex composition than ambient BrC and thus showed a relatively high fraction of resolvable chromophores, e.g., up to ∼ 85 % for those emitted by biomass burning (Huang et al., 2022).
The absorbing nature of BrC makes it a non-negligible contributor to positive radiative forcing (Saleh, 2020), while the considerable contribution of organic aerosol to fine particulate matter (PM2.5) makes BrC an important source of air pollution (Wang et al., 2019). Consequently, BrC represents a key species for the “win-win” strategy of mitigating climate change and improving air quality. Given the highly variable emission sources and meteorological conditions across different regions in China, field observational results on BrC are far from enough to constrain air quality and climate models, limiting the ability to evaluate the co-benefits of BrC control. In this study, we focused on a largely unexplored city cluster, the Harbin–Changchun (HC) metropolitan area in northeast China. Compared to other regions with intensive studies of BrC, as well as other air pollutants (e.g., the North China Plain), HC was characterized by extremely cold winters and strong impacts of biomass burning on top of other anthropogenic emissions (e.g., from coal combustion). The first feature was related to the relatively high latitudes of HC. For example, as the northernmost megacity in China, Harbin has an average temperature of about −20 ∘C in January, significantly lower than that of Beijing (∼ 0 ∘C). The second feature was related to the massive agricultural sector in HC. Until recently, open burning was still an irreplaceable approach for the disposal of crop residues in this region, presumably because the amount of agricultural waste was too huge for the capacity of sustainable use. The agricultural fires frequently resulted in heavily polluted episodes, with high PM2.5 concentrations rarely encountered in other Chinese megacities (e.g., hourly average of ∼ 1000 µg m−3 in Harbin; Y. C. Li et al., 2019). These two features highlighted the uniqueness of HC for haze studies in China.
This measurement report, for the first time, presented field observational results on the diurnal variations of BrC during two distinct seasons, i.e., a frigid winter and an agricultural-fire-impacted spring, in the central city of HC. Drivers for the diurnal variations were discussed based on indicators of various sources. Particularly, the agricultural fires were found to result in unique absorption spectra of brown carbon. This study provided implications for parameterization of BrC in climate models.
2.1 Field sampling
Daytime and nighttime PM2.5 samples were collected on the campus of the Harbin Institute of Technology (HIT) during winter and spring of 2021. HIT was surrounded by residential and commercial areas, without major industrial sources nearby, and thus represented a typical urban site. The sampling was done by a mass flow controlled high-volume sampler (TE-6070BLX-2.5-HVS; Tisch Environmental, Inc., OH, USA), which was operated at a flow rate of 1.13 m3 min−1 using pre-baked quartz-fiber filters (2500 QAT-UP; Pall Corporation, NY, USA). To avoid rush hours and considering the relatively early sunset time in winter (∼ 16:00–17:00 CST, UTC+8), daytime and nighttime samples were collected from 09:00 to 16:00 and from 21:00 to 05:00 of the next day, respectively. The winter campaign covered the entirety of January 2021, and the spring campaign was conducted during 10–30 April 2021.
2.2 Laboratory analysis
Two punches with diameters of 20 mm were taken from each sample, combined, and then extracted by deionized water. The water extract was analyzed using a Dionex ion chromatography system (ICS-5000+; Thermo Fisher Scientific Inc., MA, USA). Levoglucosan (LG), an organic tracer for biomass burning, was determined by the high-performance anion-exchange chromatography coupled with pulsed amperometric detection (HPAEC-PAD) method (Engling et al., 2006; Yttri et al., 2015). Inorganic ions such as nitrate, sulfate, chloride, ammonium, and potassium were also measured. Linear regression of the total cation concentration on that of total anions (both in µmol m−3) led to a slope of 1.14 ± 0.01 (intercept was set as 0; r=0.99), indicating a neutralized feature of the Harbin aerosols.
Two punches with diameters of 47 mm were taken from each sample and used to determine carbon fractions. Following the method developed by Chen and Bond (2010) and refined by Cheng et al. (2016), one punch was directly measured for organic carbon and elemental carbon, while the other punch was immersed in methanol (HPLC grade; Fisher Scientific Company L.L.C., NJ, USA) for an hour without stirring or sonication, dried in air for another hour, and then analyzed. Both punches were measured by a thermal/optical carbon analyzer (DRI-2001; Atmoslytic Inc., CA, USA), which was operated with two commonly used temperature protocols (i.e., IMPROVE-A and NIOSH) and transmittance charring correction. The difference of total carbon (TC) concentrations between the untreated and extracted punches (TCuntreated − TCextracted) was used to represent the amount of organic carbon that is soluble in methanol (MSOC). Given that the TC measurement was independent of the temperature protocol used, both TCuntreated and TCextracted were determined as the averages of total carbon results from IMPROVE-A and NIOSH. A benefit of this approach was that the uncertainty of MSOC (σ) could be estimated for each sample based on the parallel TC measurements by different protocols:
where SD indicates standard deviation. In this study, σ averaged 3.3±2.9 % with a median of 2.4 %. In addition, organic compounds that are insoluble in methanol, i.e., MIOC, were measured as the organic carbon concentration of the extracted punch. Unless stated otherwise, (i) OC involved in the following discussions indicates the sum of MSOC and MIOC, and correspondingly, EC indicates elemental carbon measured by the extracted punch, and (ii) all the carbonaceous aerosol concentrations are based on IMPROVE-A, except MSOC which did not rely on analytical protocol. The ratios of MSOC to OC averaged 0.90±0.05, indicating an overall high extraction efficiency of methanol for dissolving organic aerosols.
Light absorption spectra of the methanol extracts were measured over the wavelength (λ) range of 200–1110 nm, using a spectrophotometer coupled with a 2.5 m long liquid waveguide capillary cell (LWCC; World Precision Instrument, FL, USA). The spectrophotometer, consisting of a DH-mini UV–VIS–NIR light source and a Maya2000 Pro spectrometer (Ocean Optics Inc., FL, USA), provided wavelength-resolved optical attenuation (ATNλ) of the dissolved BrC, which could then be converted to the BrC absorption coefficient (babs)λ (Hecobian et al., 2010). The ratio of (babs)λ to MSOC concentration was considered the bulk mass absorption efficiency (MAEλ) of brown carbon, given the close-to-one . The wavelength dependence of BrC absorption was determined based on ln(ATNλ) and ln(λ) and was expressed as the absorption Ångström exponent (AAE). The AAE calculation was performed over 310–460 nm, the same λ range adopted by previous studies conducted at the same site using the same laboratory analysis procedures (Cheng et al., 2022a).
2.3 Additional data sets used
Air quality data and meteorological data were obtained with a time resolution of 1 h from the China National Environmental Monitoring Center (CNEMC; https://air.cnemc.cn:18007/, last access: 1 January 2023) and Weather Underground (https://www.wunderground.com/, last access: 1 January 2023), respectively. CNEMC operated 12 monitoring sites in Harbin, with three of them located within ∼ 5 km of the HIT sampling site. The reconstructed PM2.5 masses, which were derived from observational results on aerosol compositions at HIT, were generally in line with the fine particle concentrations directly measured at the nearby CNEMC sites. Here the reconstructed PM2.5 was calculated as the sum of organic matter (1.6 × OC), elemental carbon, and inorganic ions. Comparison of the reconstructed and directly measured PM2.5 concentrations showed relative standard deviations of 9 %–11 % (in terms of median value) for the three CNEMC sites nearby, demonstrating HIT as a representative urban site for Harbin. In this study, only the air quality data from the nearest CNEMC site, i.e., Taiping Hongwei Park, were further investigated together with the aerosol components measured at HIT.
3.1 Why was the wintertime brown carbon more absorbing at night?
The wavelength-resolved babs and MAE were primarily explored at 365 nm, and the corresponding values were referred to as (babs)365 and MAE365, respectively. (babs)365 and MSOC correlated strongly for the winter campaign (Fig. 1a) such that the linear regression of (babs)365 against MSOC led to an r value of 0.97 and a slope of 1.63±0.02 m2 gC−1 (with the intercept set as 0; the MAE365 averaged 1.55 ± 0.18 m2 gC−1). However, as shown in Fig. 1b, the nighttime samples were found to exhibit higher MAE365 values (averaging 1.61 ± 0.15 m2 gC−1) than the daytime ones (averaging 1.48 ± 0.18 m2 gC−1), with significant differences at the 95 % confidence level (two-tailed p=0.004). In this study, we did not perform source apportionment analysis for brown carbon due to the relatively small number of samples collected. Instead, several indirect indicators were introduced to interpret the diurnal variations of MAE365. Statistical results for the comparisons performed in the following discussions are summarized in Table S1 in the Supplement.
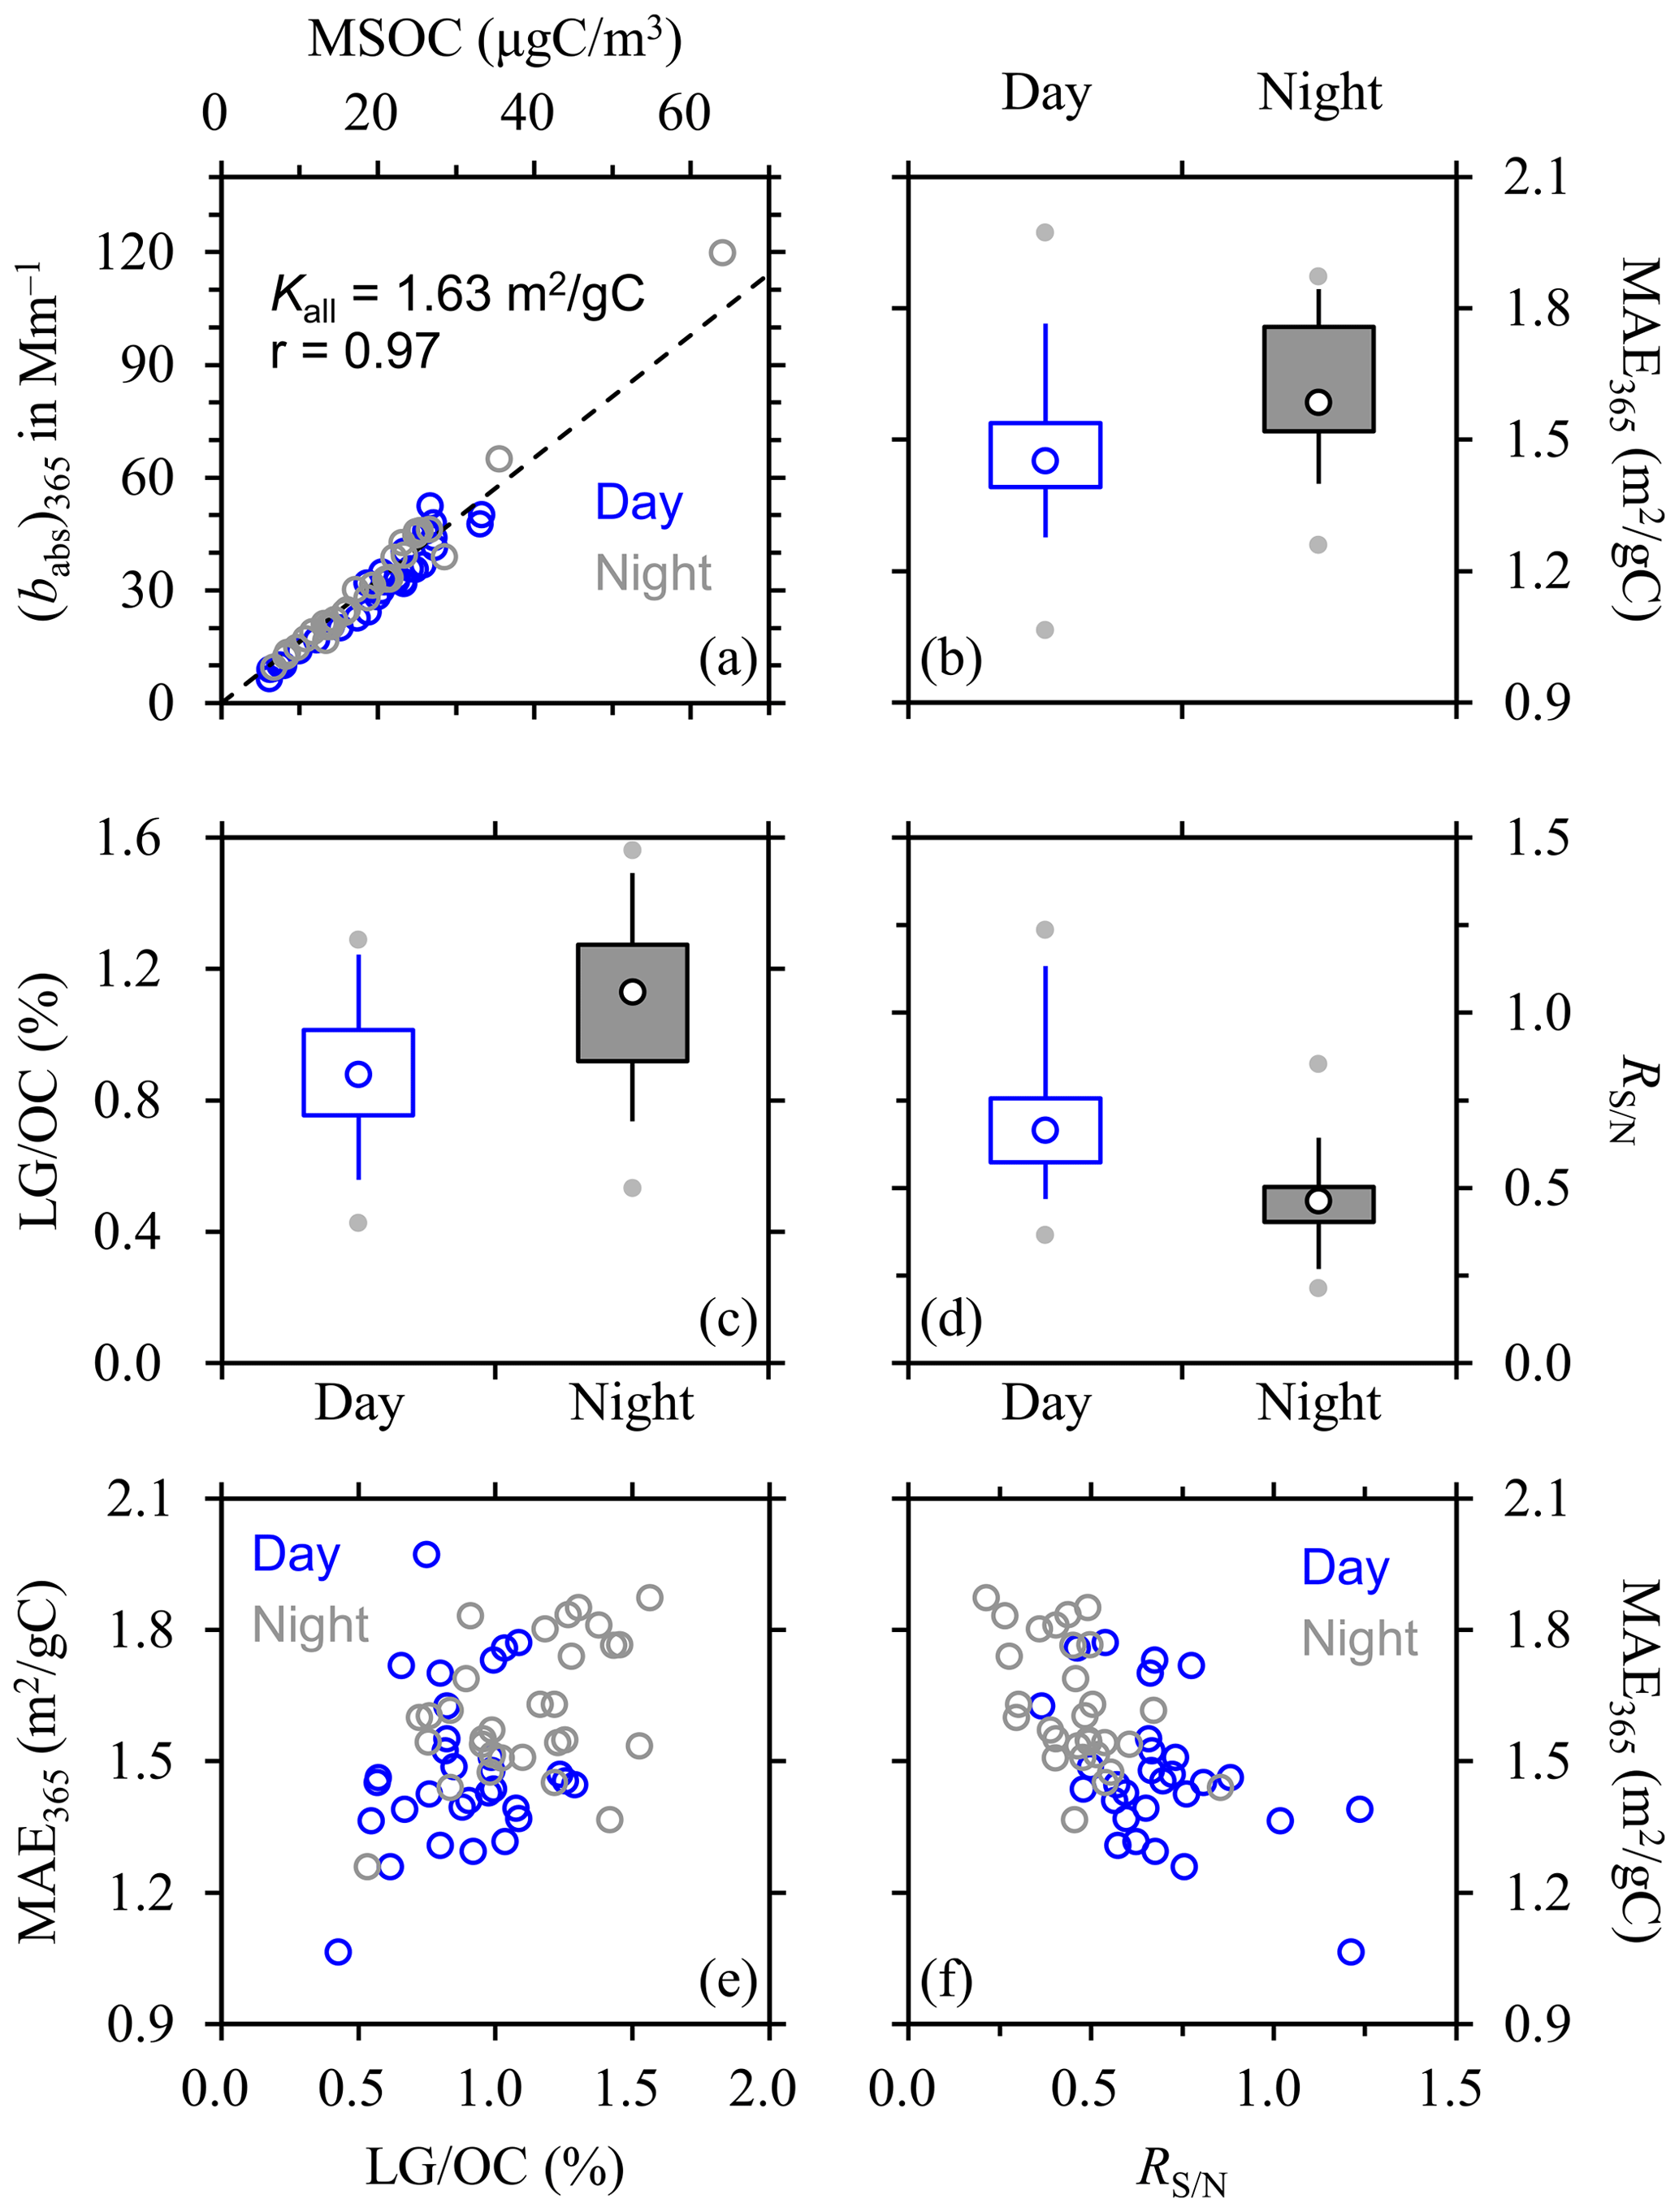
Figure 1(a) Dependence of (babs)365 on MSOC; (b–d) diurnal variations of MAE365, (on the basis of carbon mass), and ; and (e–f) dependences of MAE365 on or during winter. In panel (a), the dashed line indicates the linear regression result based on all the winter samples, with Kall as slope (intercept was set as 0). In panels (b)–(d), lower and upper box bounds indicate the 25th and 75th percentiles, the whiskers below and above the box indicate the 5th and 95th percentiles, the solid circles below and above the box indicate the minimum and maximum, and the open circle within the box marks the median (the same hereinafter). Comparison of panels (e) and (f) suggests that the wintertime MAE365 was more strongly influenced by compared to . The dependence shown in panel (f) could be approximated by the following function for all the winter samples (r=0.61): MAE365 = (−0.51 ± 0.09) × + (1.84 ± 0.05).
The first indicator was the ratio of levoglucosan to OC (; on the basis of carbon mass, the same hereinafter). In general, higher values indicate a stronger contribution of biomass burning (BB) emissions to OC. The BB activities in January could be attributed primarily to household use of biofuels, e.g., for heating and cooking. This is because (i) few fire hotspots were detected in Harbin and the surrounding regions throughout the winter campaign (Fig. 2a), and (ii) the relationship between LG and water-soluble potassium (K+), another commonly used BB tracer, did not show evidence for apparent influence of open burning (Fig. 3a). As suggested by previous studies conducted during heating season in Harbin (Cheng et al., 2022b), the ratios of LG to K+ were relatively low and constant (∼ 0.5) with the absence of agricultural fires but became substantially higher (typically above 1.0) during open burning episodes. This pattern was attributed to the relatively low combustion efficiencies (CEs) of agricultural fires, which favored the increase of LG emissions but would not change K+ emissions significantly (Gao et al., 2003). It should be noted that in Cheng et al. (2022b), CEs were not directly measured for different types of burning activities and instead were investigated based on the ratios of BB organic carbon to BB elemental carbon (RBB, derived from positive matrix factorization, i.e., PMF, analysis). Substantial increases of RBB were repeatedly observed during open burning episodes occurring in different seasons, e.g., winter or spring depending on the regulatory policies. Thus, the agricultural fires were inferred to have relatively low CE levels compared to residential burning of crop residues (Cheng et al., 2022b), as BB source emission studies typically showed a decreasing trend for the emission ratio of organic carbon to elemental carbon with increasing combustion efficiency (Pokhrel et al., 2016; McClure et al., 2020). Actually, crop residues burned on farmland were usually not intentionally dried and thus could have relatively high water contents. This may partially explain the relatively low CEs of agricultural fires. In the present study, LG correlated strongly with K+ for the entirety of January (r=0.96, with a slope, i.e., , of 0.55 ± 0.02; Fig. 3a), and the ratios of LG to K+ averaged 0.46 ± 0.11, pointing to the dominance of residential burning in BB emissions. In addition, the residential burning activities were more intensive at night, as can be seen from the elevated compared to daytime results (1.10 ± 0.26 % vs. 0.88 ± 0.22 %, two-tailed p=0.001; Fig. 1c). Comparison of the ratios of LG to EC between the nighttime and daytime samples (0.22 ± 0.06 vs. 0.15 ± 0.05, two-tailed p=0.000) reached the same conclusion. Indeed, biomass burning could emit a number of strong chromophores, such as nitrogen-containing aromatic compounds (Mohr et al., 2013; Lin et al., 2016, 2017; Xie et al., 2019; Salvador et al., 2021). However, for the January samples, the MAE365 did not show clear dependence on or (r=0.42 and 0.12, respectively; Fig. 1e), suggesting that in addition to BB emissions, there must exist other factors that were more responsible for the diurnal variations of wintertime MAE365.
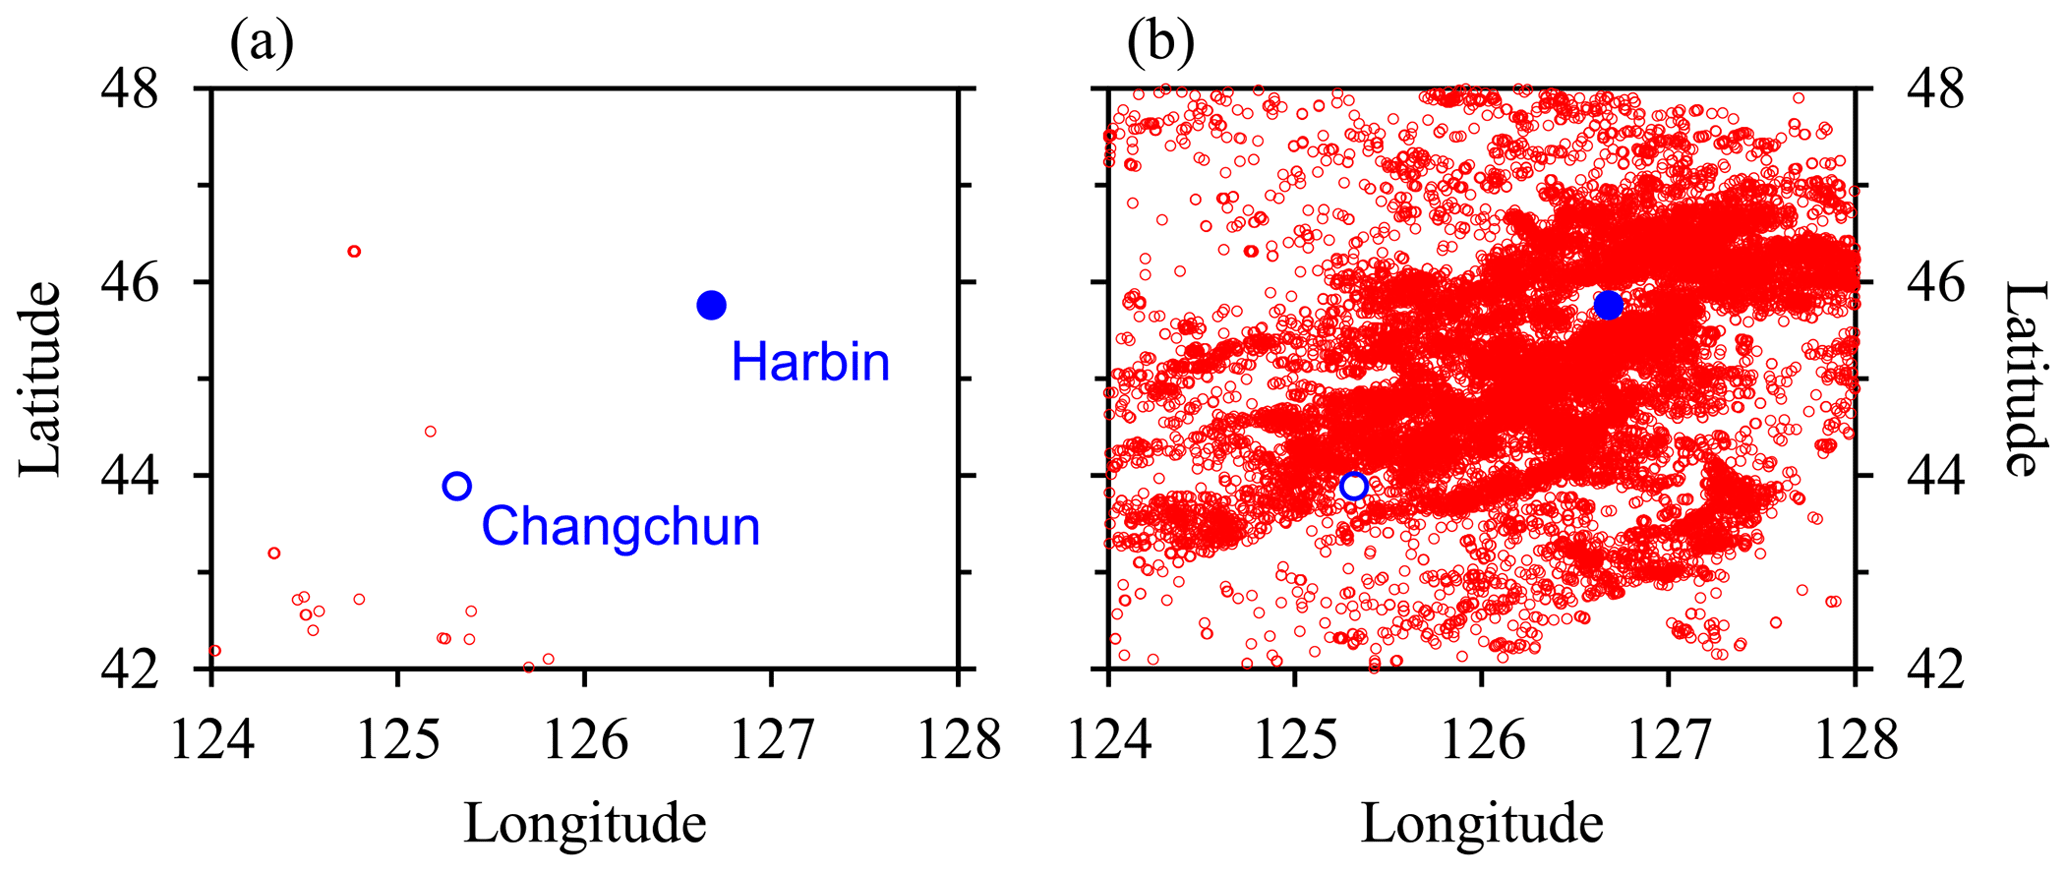
Figure 2Cumulative fire hotspots detected throughout the (a) winter and (b) spring measurement periods around Harbin, with their locations shown by the red circles. The HC metropolitan area has two central cities, as marked by the blue circles. The fire data were based on the joint NASA–NOAA Suomi National Polar-orbiting Partnership (S-NPP) satellite and were downloaded from the Fire Information for Resource Management System (FIRMS; https://firms.modaps.eosdis.nasa.gov/, last access: 1 January 2023).

Figure 3Dependences of levoglucosan on K+ during (a) winter and (b) spring. In panel (a), the dashed line indicates the linear regression result based on all the winter samples, with Kall as slope. The regression line of the winter campaign is also shown in panel (b) for comparison to highlight the increased and variable ratios in spring. The relatively low and constant ratios in winter were attributed to residential burning of crop residues, a routine activity occurring every day in rural areas for cooking and heating. The higher ratios in spring were associated with agricultural fires, as supported by the intensive fire hotspots detected.
The second indicator was , defined as the ratio of (n-sulfur dioxide + n-sulfate) to (n-nitrogen dioxide + n-nitrate), where “n” indicates molar concentration. Given that sulfate and nitrate are typically considered as secondary, could be roughly traced back to the emission ratios of sulfur dioxide (SO2) to nitrogen oxides (NOx), i.e., , from combustion of various types of fuels (e.g., coal, gasoline, diesel, and biomass). Previous studies suggested that differed substantially between emissions from vehicles, coal combustion, and biomass burning. In China, the fuel quality standards have been greatly strengthened for on-road vehicles since the early 2000s, e.g., the maximum sulfur content allowed in diesel was reduced from 2000 ppm (required by the China I standard implemented in 2002) to 10 ppm (required by the China V standard implemented in 2017). Thus, recent studies on vehicular exhausts typically suggested that the SO2 emission factors (EF-SO2) were about two orders of magnitude lower than those of NOx (EF-NOx; Zhang et al., 2015; Y. Li et al., 2019), and consequently, the corresponding should be approximately ∼ 10−2. The EF-SO2 were also usually lower than the EF-NOx for biomass burning (Zhang et al., 2000; McMeeking et al., 2009; Liu et al., 2016; Wu et al., 2022), but their differences were not as large as those observed in vehicle emissions, leading to values of ∼ 10−1. Unlike vehicles or biomass burning, coal combustion usually resulted in higher EF-SO2 compared to EF-NOx (Zhang et al., 2000; Du et al., 2017; Li et al., 2017), which could be translated to values of above 1. On the other hand, primary species could be transformed rapidly during atmospheric aging, e.g., a sharp loss of NOx and a corresponding burst in nitrate were observed shortly after emission when tracking plumes from diesel trucks (Shen et al., 2021) and agricultural fires (Akagi et al., 2012; Liu et al., 2016). Thus, it should be acceptable to assume that, for the pollutants emitted by a specific source, the of aged plumes was generally comparable with the of fresh emissions.
The ambient averaged 0.6 ± 0.2 during the winter campaign, differing substantially from the of coal combustion or vehicle emissions but in the same order of magnitude as the of biomass burning. Actually, no evidence supported BB emissions as a major regulating factor for , e.g., as indicated by the insignificant correlations between and (r=0.24 and 0.01 for the daytime and nighttime samples, respectively). Then was expected to be more sensitive to the changes of coal combustion and vehicle emissions, e.g., increase of coal combustion emissions would effectively elevate , whereas higher vehicle emissions favor the decrease of . During the winter campaign, lower values were observed at night (Fig. 1d), averaging 0.5 ± 0.1 compared to an average of 0.7 ± 0.2 for the daytime samples (two-tailed p=0.000). In principle, this pattern could be caused by decreased coal combustion emissions and/or increased vehicle emissions at night. However, it seemed that the former did not play an important role, since many coal combustion activities (e.g., those for heating supply, power generation, and some industrial processes) were uninterruptible, i.e., would not be stopped at night (Lian et al., 2020; Chu et al., 2021; Yuan et al., 2021). Then the most likely cause for the lower nighttime was increased vehicle emissions. According to the road traffic regulations released by Harbin, heavy-duty diesel trucks (HDDTs), which are known to include high emitters or superemitters (Dallmann et al., 2012), are allowed to run on the roads in the main urban area only from 21:00 to 05:00 of the next day. This to a large extent explains the inference on the increase of vehicle emissions during nighttime. The MAE365 exhibited a clear negative dependence on for all the winter samples (Fig. 1f), suggesting vehicle emissions, especially those from HDDTs, as a dominant influencing factor for MAE365 (under the precondition of relatively stable coal combustion emissions).
The last two indicators were associated with secondary aerosol formation, including the sulfur oxidation ratio (SOR) and the nitrogen oxidation ratio (NOR), defined as n-sulfate(n-sulfate + n-SO2) and n-nitrate(n-nitrate + n-NO2), respectively. The entire winter campaign experienced low temperatures, which averaged and ∘C for the daytime and nighttime samples, respectively. In general, the transformation of gaseous precursors to secondary inorganic ions was inefficient in the frigid atmosphere, as indicated by the overall low levels of both the SOR and NOR. However, both indicators exhibited noticeable differences between daytime and nighttime samples. The diurnal variation of the SOR was found to be associated with the higher relative humidity (RH) levels at night (Fig. 4a). For the vast majority of winter samples, RH fell into the ranges of 60 %–80 % and 70 %–90 % during daytime and nighttime, respectively. The SOR values were largely unchanged when RH increased from 60 %–70 % to 70 %–80 % during the day, whereas for the common RH range shared by the daytime and nighttime samples (i.e., 70 %–80 %), the SOR tended to be slightly lower at night, likely due to the drop in temperature. In addition, a positive dependence of SOR on RH was evident for the nighttime samples. Although SOR showed almost the same median values (∼ 0.1) for the RH ranges of 70 %–80 % and 80 %–90 % at night, relatively high SOR levels of above 0.2 were more frequently observed in the latter case. Such high SOR values were rarely seen during the day, indicating that RH played a more important role than temperature in sulfate formation. The enhanced sulfate formation at high RH was presumably through heterogeneous reactions (Su et al., 2020; Liu et al., 2021), since the low temperatures encountered during the winter campaign did not rule out the presence of aerosol water, e.g., liquid water was observed to remain supercooled in clouds down to temperatures of as low as −40 ∘C (Tabazadeh et al., 2002). Compared to SOR, different patterns of diurnal variation were observed for NOR (Fig. 4b). First, the difference between daytime and nighttime NOR levels was more significant for the RH range of 70 %–80 %, e.g., as indicated by the larger decrease of median NOR at night (0.06, compared to a corresponding value of 0.02 for the SOR). Second, the nighttime NOR elevated substantially as RH increased from 70 %–80 % to 80 %–90 % but still with lower levels compared to the daytime results. Given that relatively low temperatures favor the partitioning of semi-volatile nitrate into aerosol phase, the less efficient nitrate formation at night could not be explained by the partitioning process and instead should be primarily attributed to reduced photooxidation of NO2 (Chen et al., 2020). Based on a synthesis of the diurnal variations observed for SOR and NOR, the nighttime samples were characterized by enhanced heterogeneous chemistry, which did not require sunlight as indicated by the RH-dependent increase of the SOR under dark conditions, and weakened photochemical reactions. The overall effect of these two factors on secondary organic aerosol (SOA) formation was inconclusive, and thus it remained difficult to robustly unfold the role of SOA in the diurnal variations of MAE365. Actually, it appeared that the MAE365 was not strongly influenced by SOA during the winter campaign. For example, when RH increased from 70 %–80 % to 80 %–90 % at night, the MAE365 were nearly constant (e.g., with the same average value of 1.6 m2 gC−1 for the two RH ranges) despite the enhancement of heterogeneous chemistry.
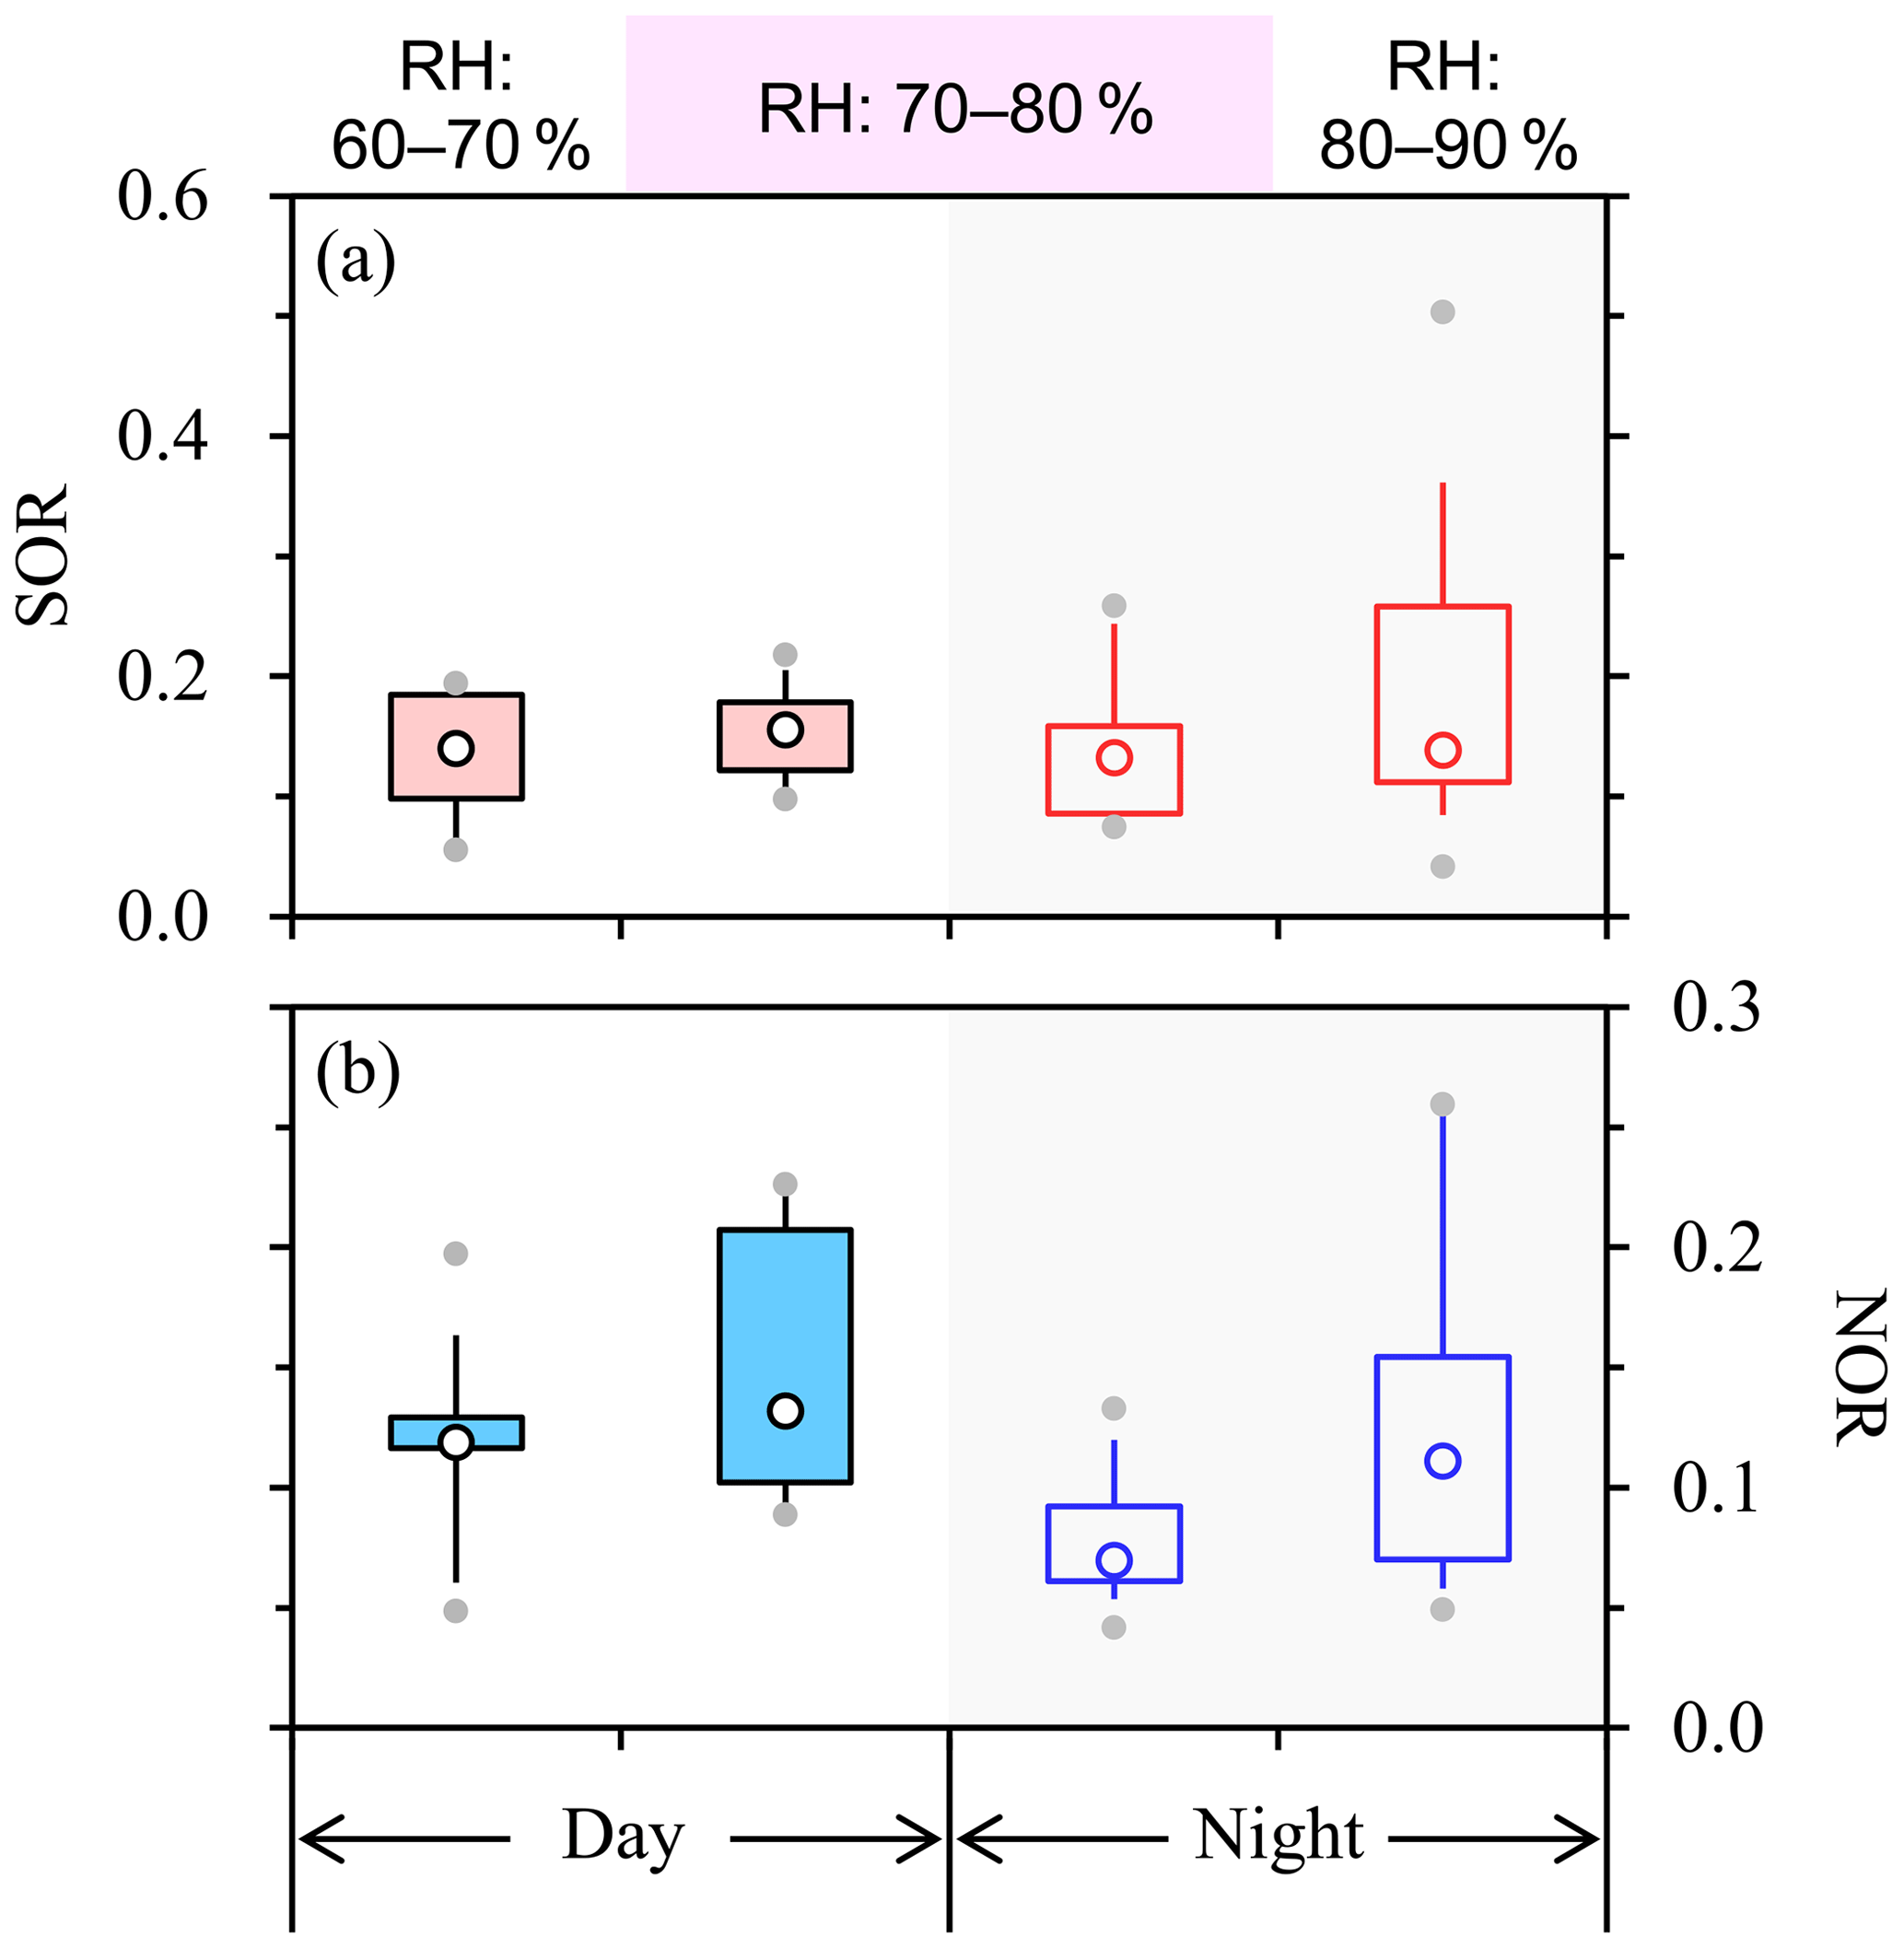
Figure 4Diurnal variations of (a) SOR and (b) NOR in winter, with results from different RH ranges shown separately. Daytime and nighttime samples had a common RH range of 70 %–80 %, whereas low RH levels of 60 %–70 % and high RH levels of 80 %–90 % occurred only during the day and at night, respectively.
3.2 Why did the springtime MAE365 show more significant diurnal variations?
Compared to the wintertime results, the average MAE365 was lower in spring (1.33 vs. 1.55 m2 gC−1), but the corresponding standard deviation was much higher (0.62 vs. 0.18 m2 gC−1), indicating that the spring samples varied more significantly with respect to the absorption capacity of brown carbon (Fig. 5a). This feature could also be seen from the more pronounced diurnal variations of MAE365 observed in spring (Fig. 5b), e.g., the nighttime MAE365 were on average ∼ 70 % (two-tailed p=0.000) and 10 % (two-tailed p=0.004) larger than the daytime values during the spring and winter measurement periods, respectively. For the winter campaign, the slightly elevated MAE365 at night had been primarily attributed to increased vehicle emissions, as indicated by a ∼ 35 % decrease of . In spring, values were also lower at night (two-tailed p=0.000) by ∼ 40 %, compared to the daytime results (Fig. 5d). Given that the two campaigns showed comparable discrepancies between the nighttime and daytime , the increase of vehicle emissions at night was presumably not the dominant driver for the much stronger diurnal variations of MAE365 observed in spring. Actually, the MAE365 was almost independent of for the spring samples. For example, the MAE365 values were found to fall into two well-separated ranges (above 2 and ∼ 0.5–1.5 m2 gC−1, with the former observed only at night) for the samples with relatively low levels (below 0.4), indicating that reduced was ineffective to explain the high-MAE365 events encountered in spring (Fig. 5f). In addition to increased vehicle emissions at night, therefore, there must exist other factors which were more responsible for the significant diurnal variations of springtime MAE365.
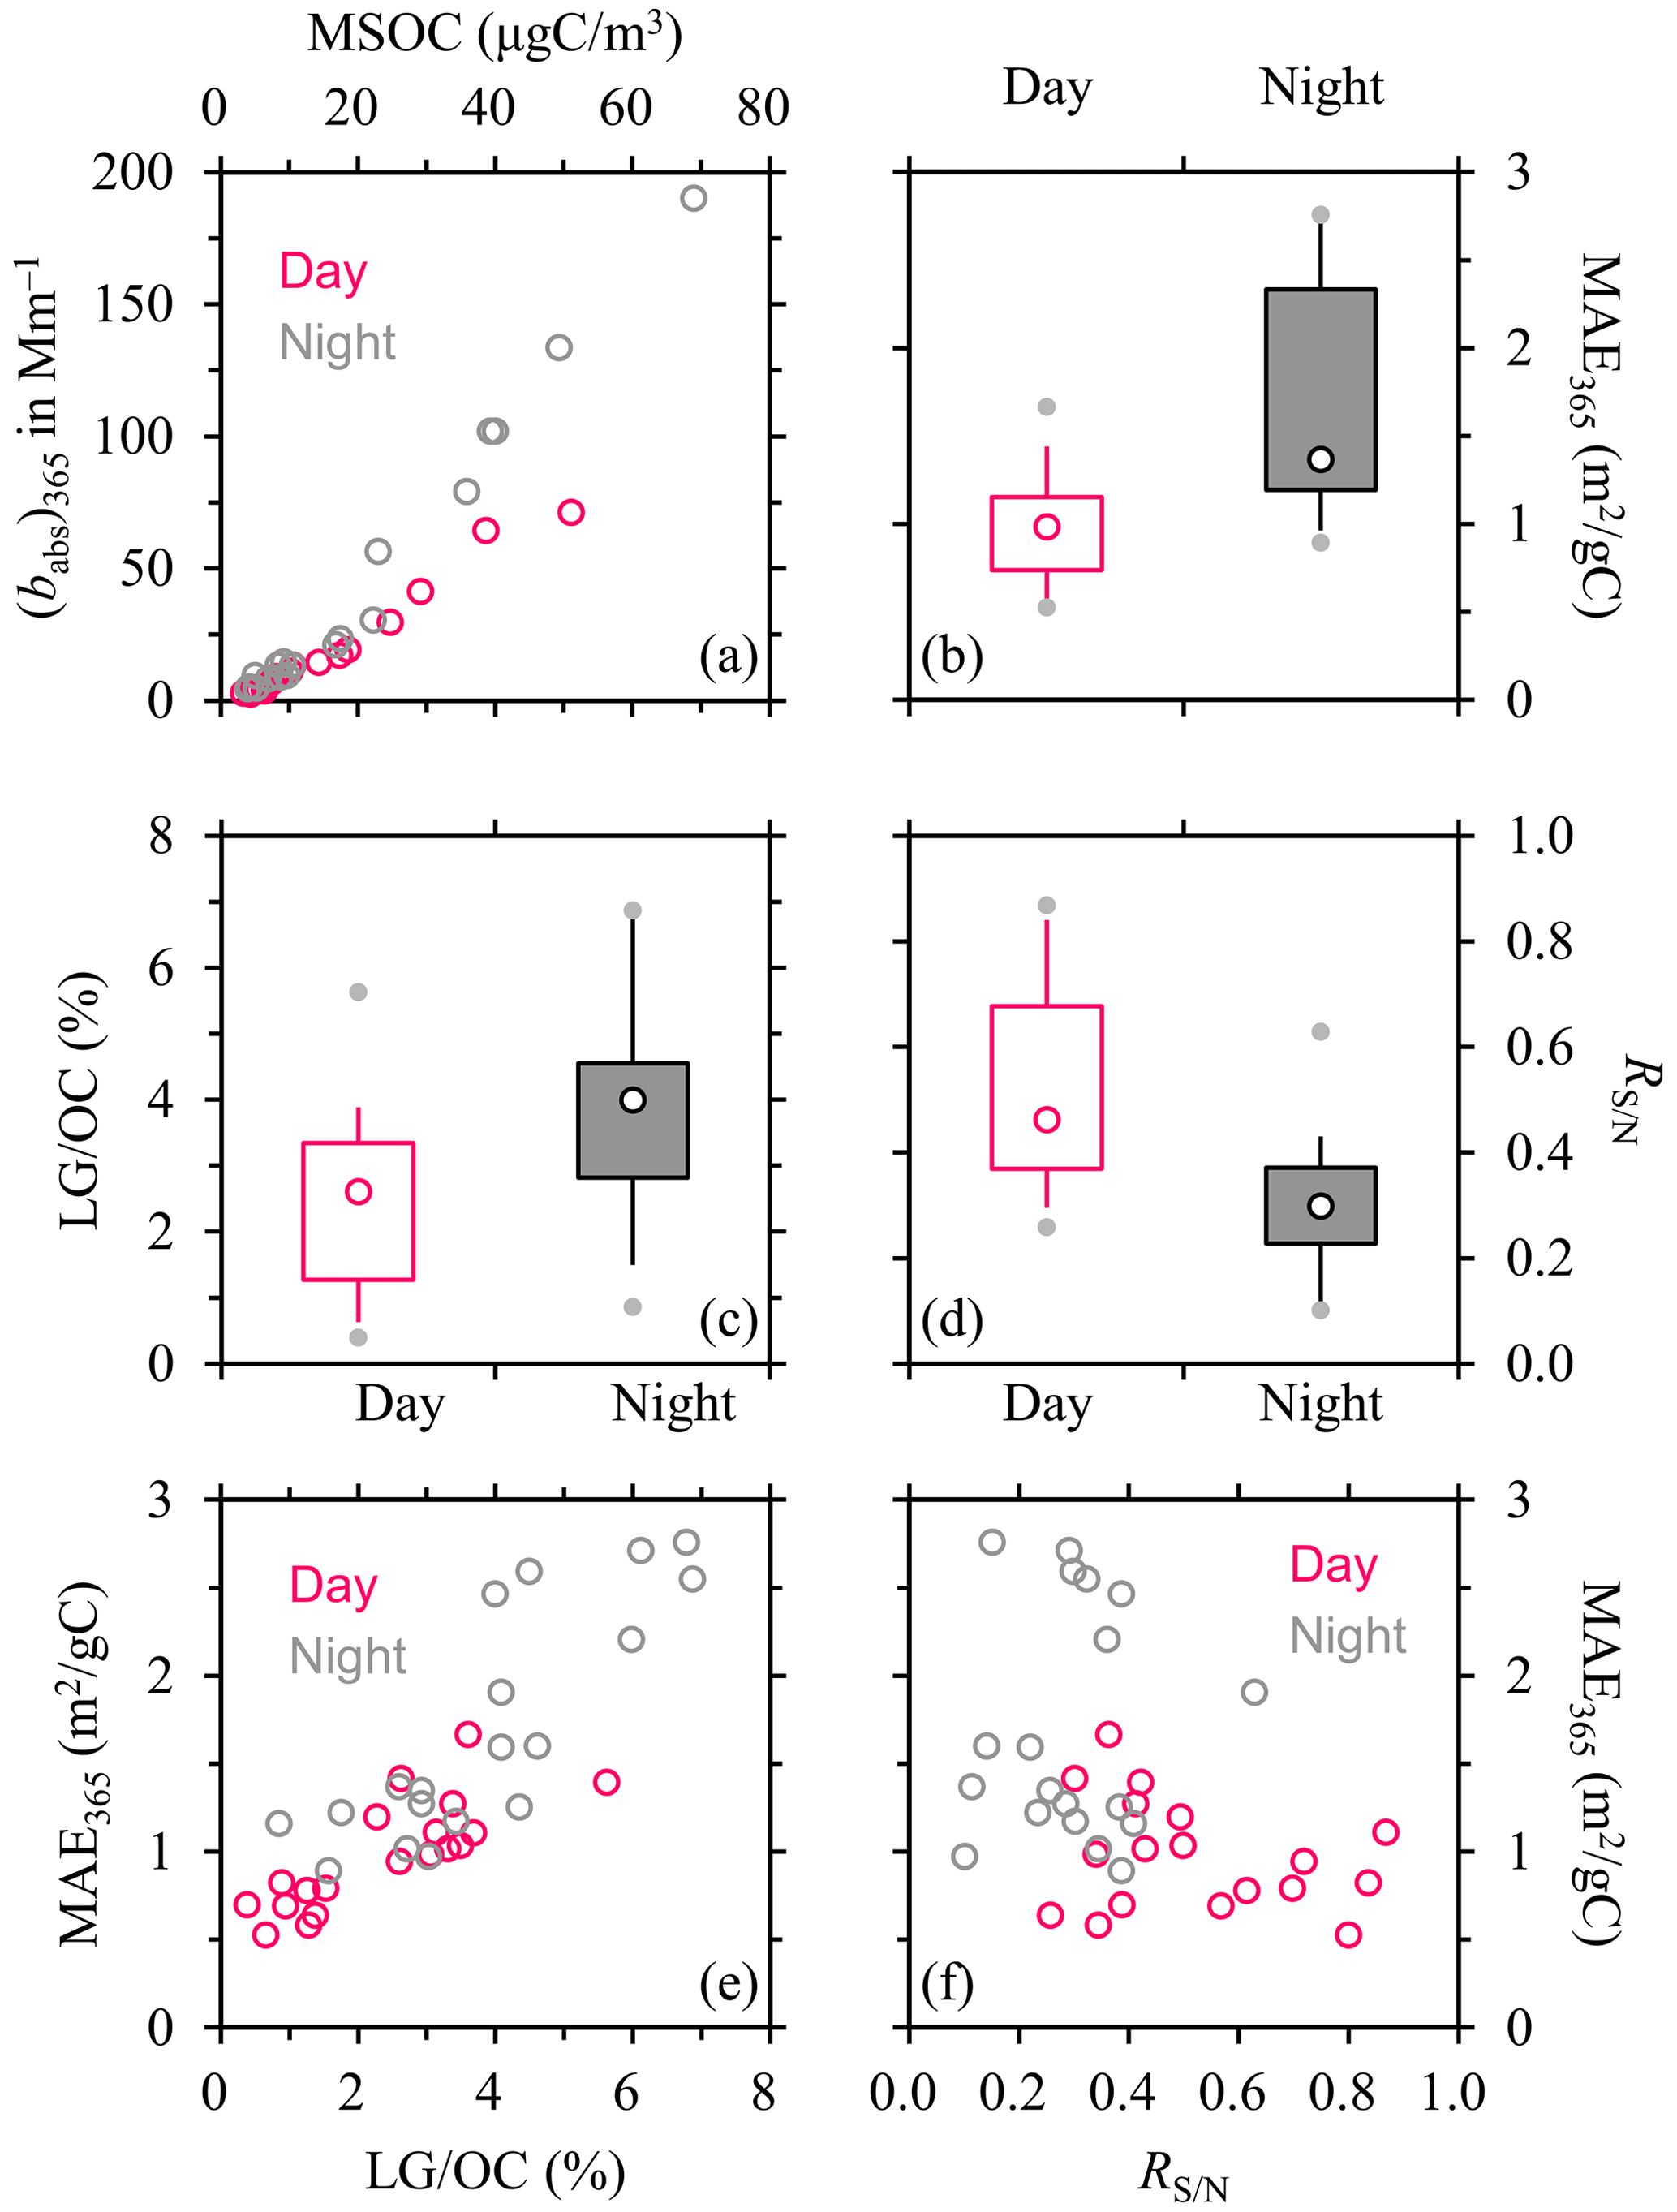
Figure 5The same as Fig. 1 but for spring. The MAE365 showed more pronounced diurnal variations in spring than winter, although the daytime vs. nighttime discrepancies in were comparable between the two seasons. Comparison of panels (e) and (f) suggests that, unlike winter, the springtime MAE365 was more strongly influenced by than by . The dependence shown in panel (e) could be approximated by the following function for all the spring samples (r=0.84): MAE365 = (30.48 ± 3.28) × + (0.39 ± 0.12), where is on the basis of carbon mass and in percent.
We first evaluated the influence of secondary aerosol formation. The spring campaign experienced lower RH and substantially higher temperatures compared to winter, by ∼ 25 % and 30 ∘C, respectively. The springtime SOR appeared to be slightly lower than the wintertime results (0.12 ± 0.06 vs. 0.15 ± 0.07), whereas an opposite pattern was observed for the NOR (0.16 ± 0.08 vs. 0.12 ± 0.06). The seasonal variations of the SOR and NOR provided additional evidence for the inferences that the sulfate and nitrate formation was more strongly contributed by heterogeneous and photochemical reactions, respectively. For the spring campaign, the daytime and nighttime SOR levels were in general comparable (Fig. S1a in the Supplement), and no clear evidence was observed for the prevalence of heterogeneous chemistry, presumably due to the rare occurrence of high-RH conditions either during the day or at night. Unlike the SOR, the daytime NOR tended to be slightly higher than the nighttime results (0.18 ± 0.09 vs. 0.14 ± 0.08; Fig. S1b), pointing to enhanced photochemistry during the day. This pattern could be partially responsible for the relatively low daytime MAE365, since secondary brown carbon was typically less light absorbing than primary BrC (Kumar et al., 2018; Cappa et al., 2020; Ni et al., 2021). However, the MAE365 did not exhibit clear dependence on NOR or the ratio of nitrate to OC (), e.g., the high-MAE365 events were found to be associated with moderate NOR and levels (Fig. S2). Thus for the spring campaign, photochemistry should not be the major influencing factor for the MAE365 either.
We then investigated the role of biomass burning. Unlike the wintertime results, the MAE365 showed a strong positive correlation with (r=0.84) in spring (Fig. 5e), suggesting biomass burning emissions as the dominant driver for the variations of MAE365. It is noteworthy that the ratios of LG to OC were substantially higher in spring than in winter (two-tailed p=0.000), with averages of 3.11 ± 1.70 % and 0.99 ± 0.26 %, respectively. This pattern could not be explained by seasonal variations in residential consumption of biofuels, since April experienced much higher temperatures than January (averaging 11 and −19 ∘C, respectively). Instead, the elevated springtime should be attributed primarily to open burning, as supported by the intensive fire hotspots detected around Harbin in April (Fig. 2b). The seasonal variations of the LG-to-K+ ratio () also suggested that the dominant burning ways were different between winter and spring. Compared to the relatively small and constant observed in January (0.46 ± 0.11), the ratios were nearly tripled in April (1.28 ± 0.61), with more significant sample-by-sample differences (between ∼ 0.5–3.5) (Fig. 3b). Recalling that the transition from flaming to smoldering combustion favored the increase of (Gao et al., 2003), the springtime burning should have relatively low and variable combustion efficiencies. This inference was in line with the fact that the agricultural fires were usually uncontrolled, e.g., with respect to water content of crop residues and abundance of oxygen. In all, for the spring campaign, the dominant driver for the variations of and MAE365 could be further identified as open burning. Subsequently, the higher and MAE365 at night (Fig. 5b–c) could be attributed primarily to increased agricultural fires. The preference for nighttime burning was not surprising, since the agricultural fires were illegal, i.e., nominally prohibited by the government of Heilongjiang Province.
It should be noted that the agricultural-fire emissions increased but had minimal influence on (Fig. S3). For example, the nighttime samples collected in spring differed substantially with respect to the impact of agricultural fires, as indicated by their variable which spanned nearly 1 order of magnitude. However, no clear pattern was observed for with increasing , e.g., linear regression of on showed an extremely low r value of 0.07.
The frequent occurrences of agricultural fires during April 2021 to some extent masked the “background” MAE365, i.e., the value representative of the spring conditions without significant influence of open burning. In spring, all the samples with ratios of above 1, i.e., a chemical signature for apparent impacts of agricultural fires, were found to have ratios larger than 2 %. In addition, the ratio could also work as an estimate of the strength of the biomass burning impact. Thus, in the following discussions, of >2 % was used as an indicator for open burning episodes, and correspondingly, spring samples with of below 2 % were referred to as typical ones. The MAE365 averaged 0.80 ± 0.22 m2 gC−1 for the typical samples of spring, lower than results from the winter campaign (1.55 ± 0.18 m2 gC−1; Fig. S4a). This seasonal pattern coincided with the overall lower in spring (Fig. S4b). It was unlikely that the number of in-use vehicles or the fleet composition in Harbin could vary significantly between January and April of the same year. Thus, the reduced springtime , i.e., the relatively low MAE365 with the absence of agricultural fires, should be caused mainly by the decrease of coal combustion emissions, e.g., due to the less demand for heating.
3.3 Unique wavelength dependence of BrC absorption during agricultural-fire episodes
The agricultural fires not only elevated the MAE365 but also changed the wavelength dependence of brown carbon. For the wavelength range used for AAE calculation (310–460 nm), the detection limit of optical attenuation (ATNLOD) was ∼ 0.02, which was determined as 3 times the maximum standard deviation of parallel ATNλ results from blank filters. Before further discussions, we introduced a new term, “relative ln(ATNλ)”, i.e., ln(ATNλ)∗ calculated as ln(ATNλ) − ln(ATNLOD). A benefit of using the new term was that a ln(ATNλ)∗ value of 0 corresponded to ATNλ = ATNLOD and thus ln(ATNλ)∗ could be considered “real” absorption by chromophores in solutions. It should be noted that the use of ln(ATNλ)∗ would not influence the determination of AAE, since the same slope would be derived from the regressions of ln(ATNλ)∗ and ln(ATNλ) on ln(λ). For the typical samples of spring, the dependence of ln(ATNλ)∗ on ln(λ) could be properly approximated by a linear function, usually with r values of above 0.995. In this case, AAE could be reliably determined, and an average value of 6.92 ± 0.28 was obtained.
The relationship between ln(ATNλ)∗ and ln(λ) became nonlinear for the open burning episodes. To more quantitatively describe the nonlinearity, we added an “auxiliary line” to each measured spectrum (Fig. 6a) by drawing a line between the two points with x values of ln(310) and ln(460). The auxiliary line could be considered an assumed spectrum, with linear dependence of ln(ATNλ)∗ on ln(λ). The measured spectrum was always above the assumed one, and their largest difference was typically observed at ∼ 365 nm, pointing to the presence of distinct BrC chromophores with absorption peak around this wavelength.
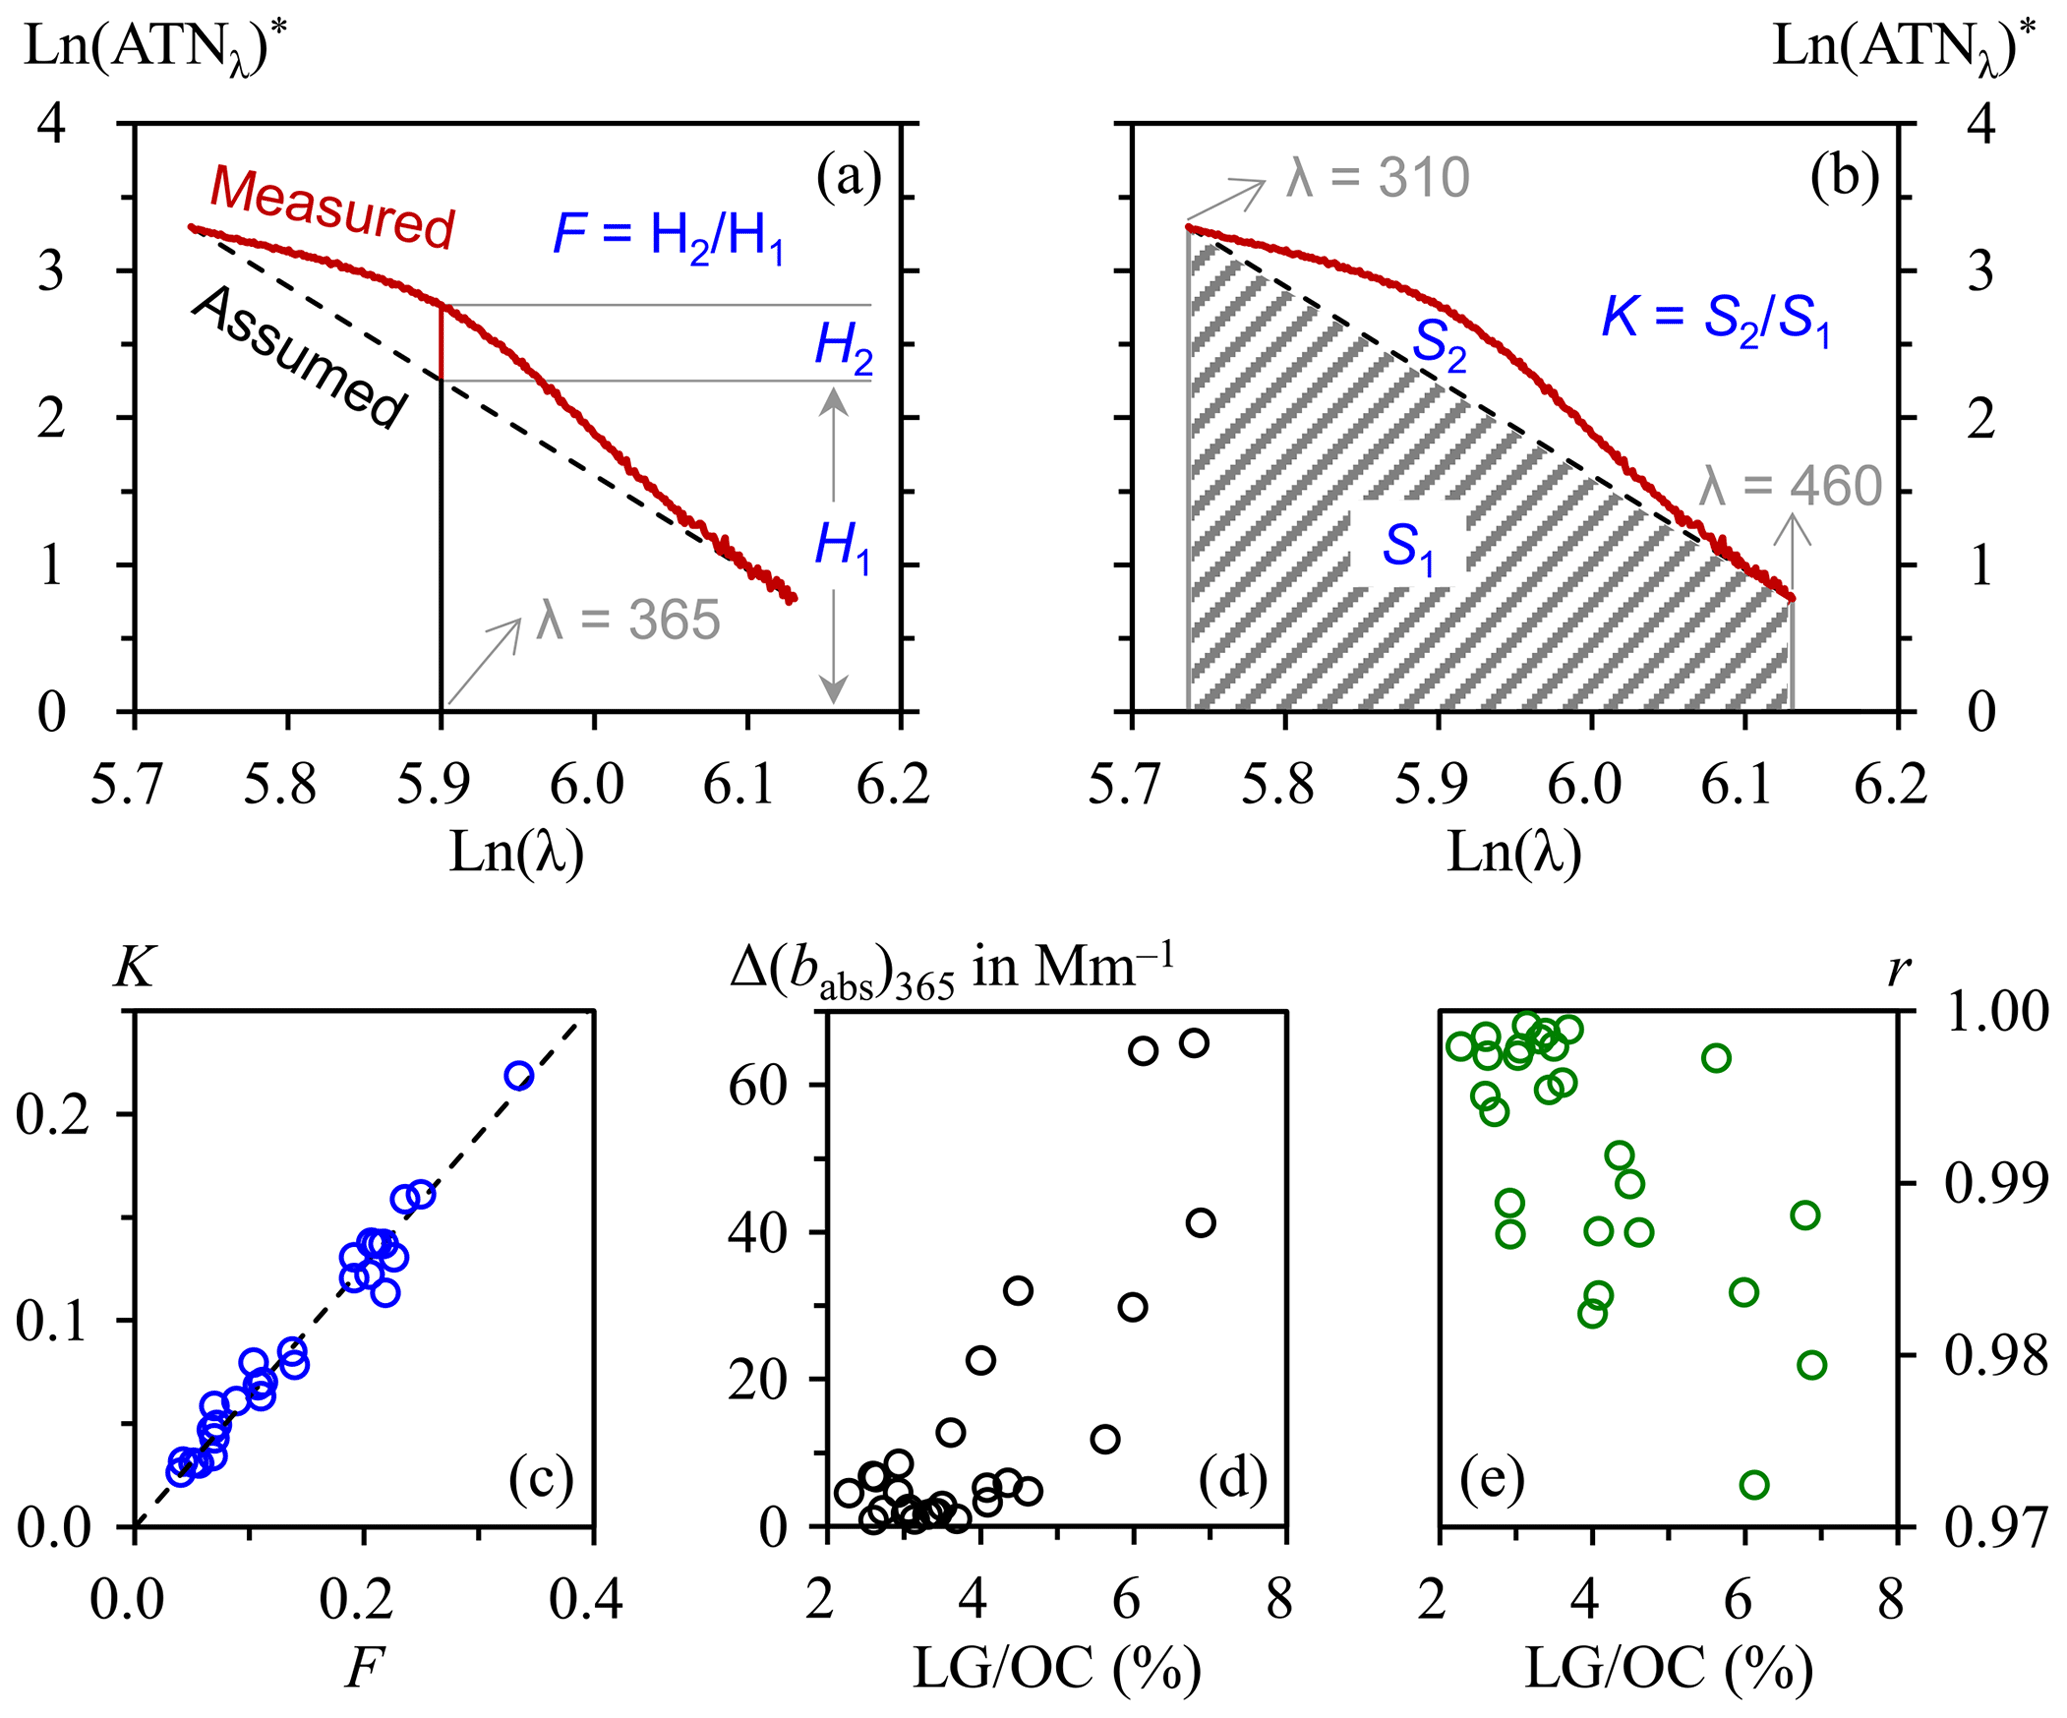
Figure 6Nonlinearity of ln(ATNλ)∗ on ln(λ) during agricultural-fire episodes in spring: (a–b) illustrations of the determination of F and K, (c) comparison of K and F, and (d–e) dependences of Δ(babs)365 and r on . In panels (a) and (b), the measured spectrum corresponds to the nighttime sample collected on 21 April 2021, which had an of 6.87 %; the assumed spectrum was generated by drawing a line between the two points with x values of ln(310) and ln(460); H1 indicates ln(ATN365)∗ of the assumed spectrum, while H2 indicates the difference in ln(ATN365)∗ between the two spectra; and S1 indicates the area enclosed by the assumed spectrum and the x axis, while S2 indicates the area enclosed between the two spectra. In panel (c), the dashed line indicates the linear regression result (intercept was set as 0), and the corresponding r value was 0.99. In panel (e), r was derived from linear regression of ln(ATNλ)∗ on ln(λ). Although the r values seemed reasonable, the AAE results should be interpreted with caution given the apparent absorption peak at ∼ 365 nm.
The influence of such chromophores on BrC absorption could be estimated by the following three indicators. The first one (F) was related to the difference between the measured and assumed ln(ATNλ)∗ at 365 nm:
where the subscripts “m” and “a” indicate results from the measured and assumed spectra, respectively (Fig. 6a). The second indicator (K) was related to the area enclosed between the two spectra (S2): , where S1 indicates the area enclosed by the assumed spectrum and x axis (Fig. 6b). The last indicator was Δ(babs)365, calculated as , where the superscripts “m” and “a” indicate absorption coefficients calculated based on the measured and assumed spectra, respectively. F and K exhibited a strong linear correlation for the open burning episodes (r=0.99; Fig. 6c), indicating that the differences between the measured and assumed spectra were likely caused by the same class of BrC compounds. In addition, these compounds could be primarily traced back to biomass burning, since Δ(babs)365 showed a positive dependence on (Fig. 6d). Candidates for such compounds were aromatic species with nitro-functional groups, based on a synthesis of absorption spectra measured for various BrC chromophores (Huang et al., 2020) and molecular characterization results for biomass burning emissions (Lin et al., 2016, 2017; Xie et al., 2019, 2020). Chamber experiments by Iinuma et al. (2010) suggested that aromatic compounds with nitro-functional groups could also be formed through photooxidation of gaseous precursors emitted by biomass burning (m-cresol). In this study, however, all the samples with relatively high Δ(babs)365 levels (e.g., above 20 Mm−1) were collected at night, indicating that the distinct BrC chromophores with absorption peak at ∼ 365 nm were more strongly associated with primary emissions from agricultural fires. In addition, the chromophores seemed to be subject to photobleaching, as both F and K decreased substantially (by ∼ 65 %) during the day compared to the nighttime results (Fig. 7).
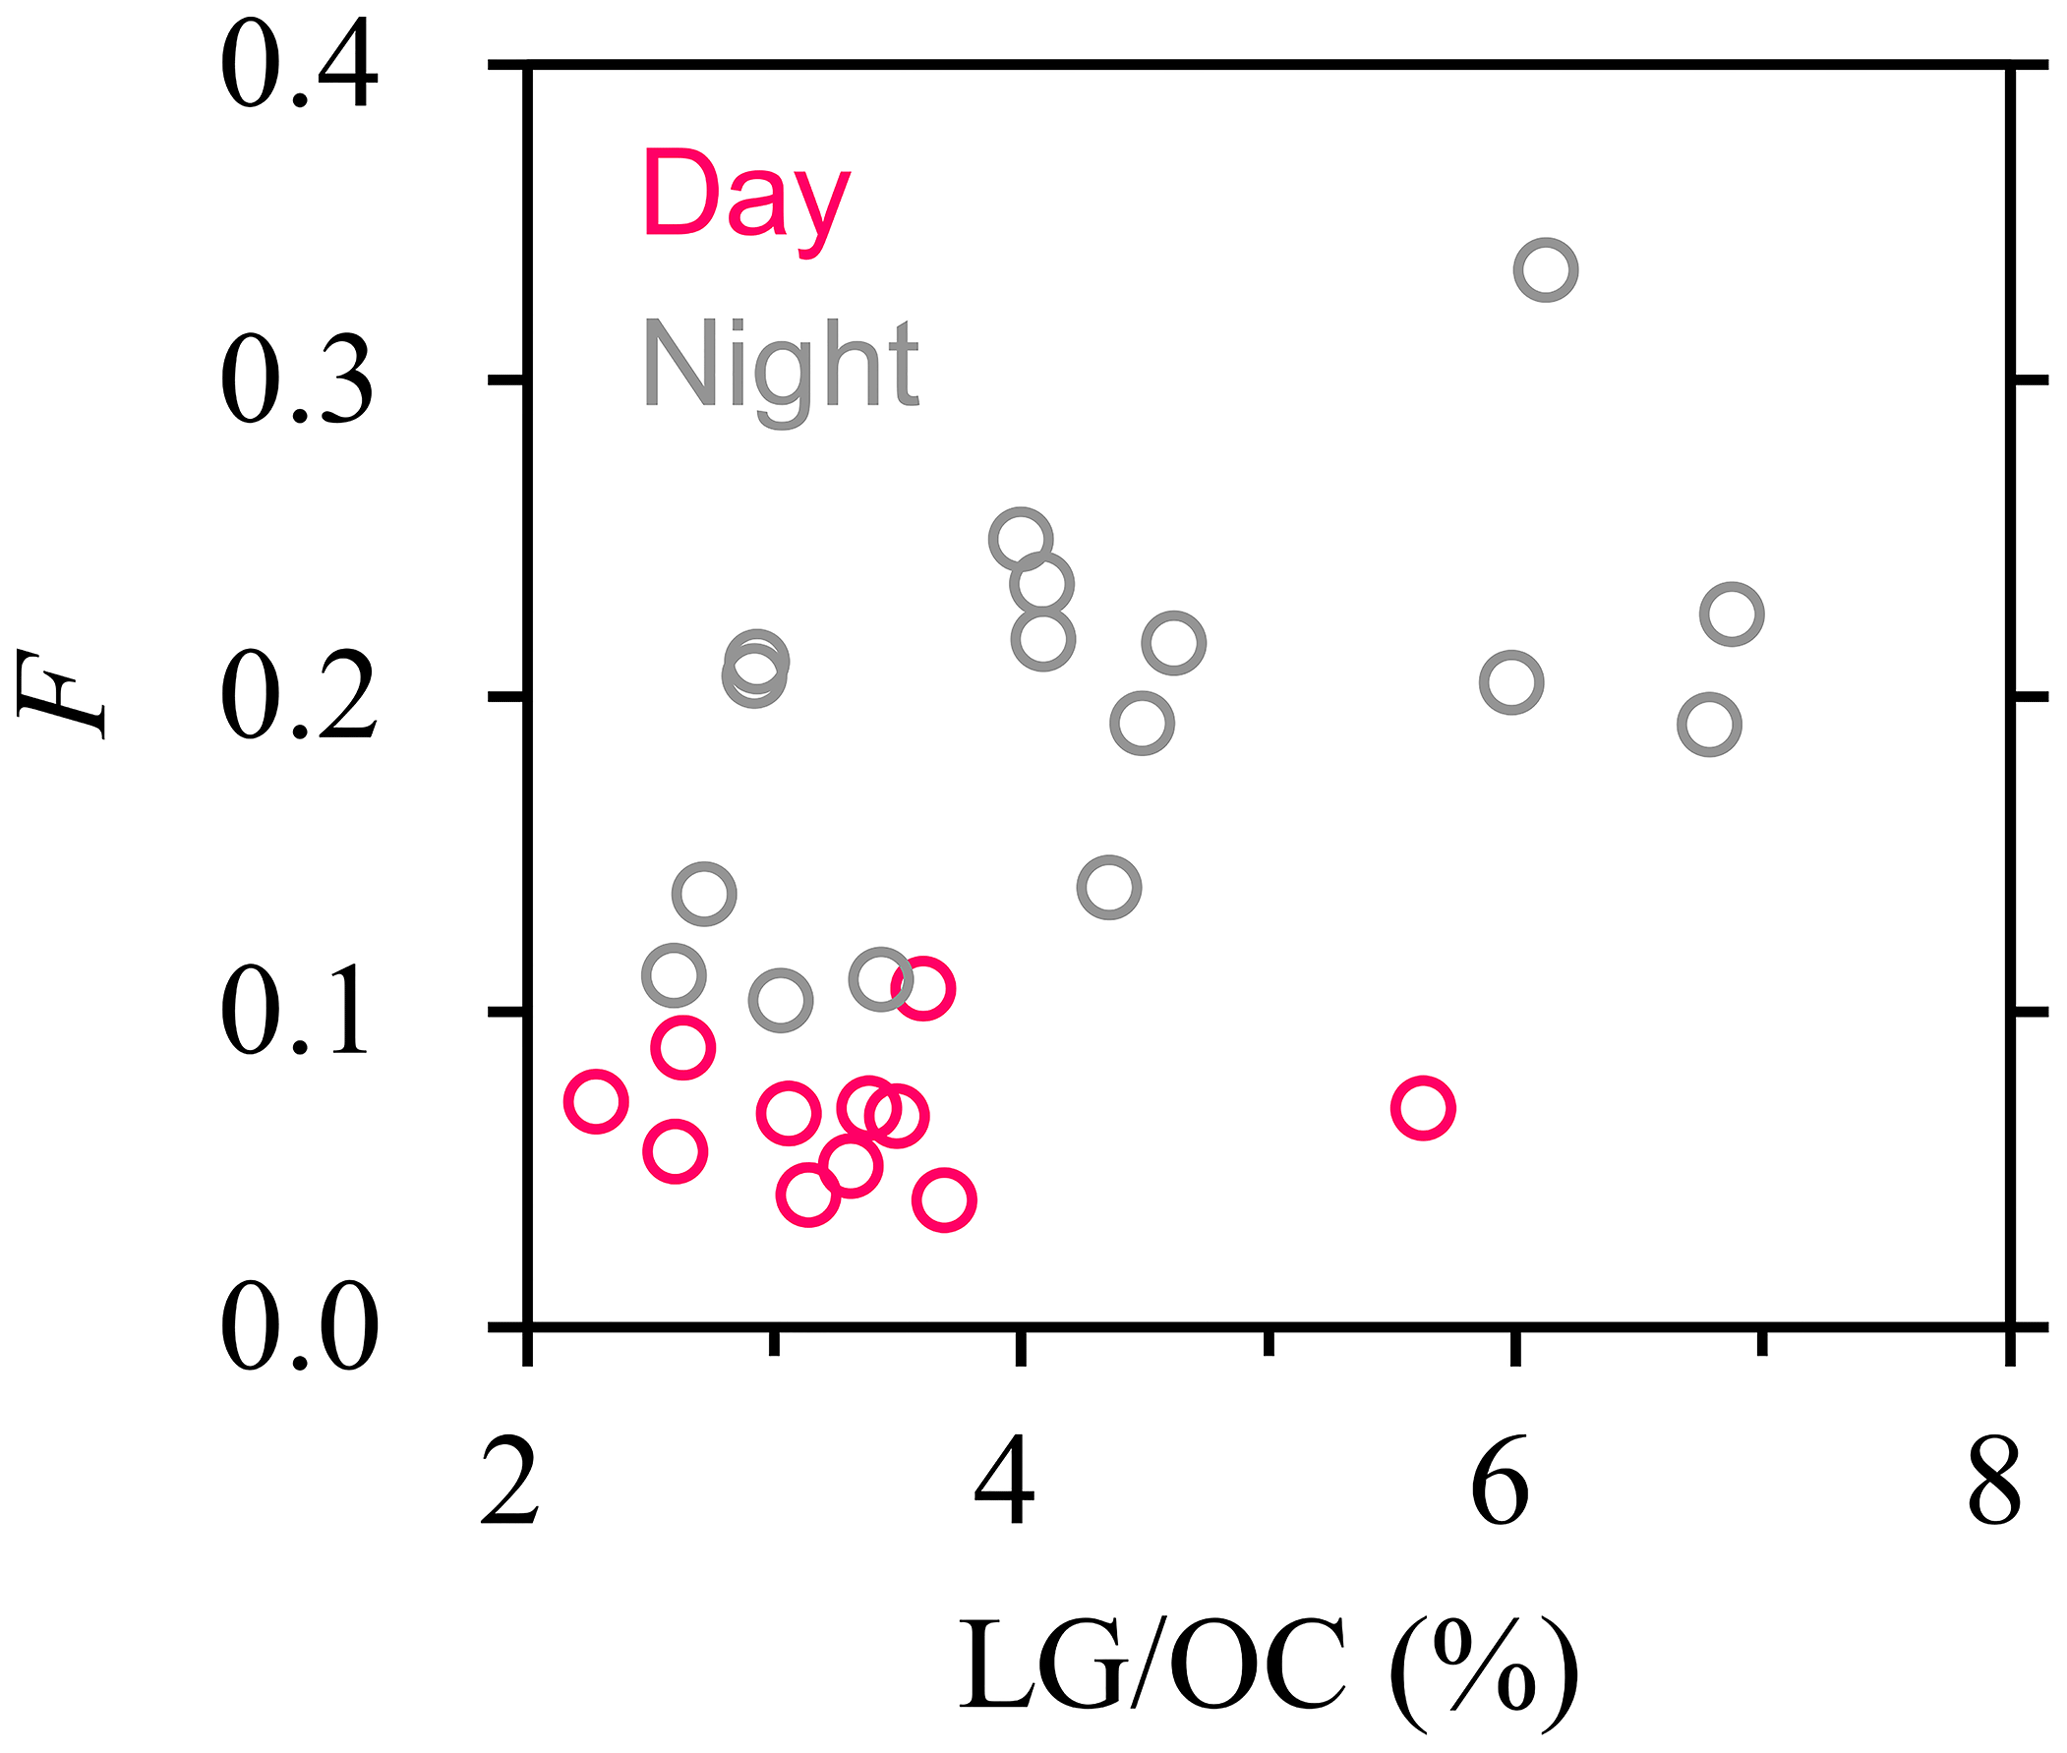
Figure 7Dependence of F, a measure of the significance of the ∼ 365 nm absorption peak, on during agricultural-fire episodes in spring. For a given range, F decreased substantially during the day, likely due to photobleaching of chromophores associated with the ∼ 365 nm peak. The same conclusion could be reached based on K, another indicator for the significance of the ∼ 365 nm peak.
For the open burning episodes, the distinct absorption peak at ∼ 365 nm prohibited a proper determination of AAE. If enforcing a linear function for the dependence of ln(ATNλ)∗ on ln(λ), lower r values would be derived (down to ∼ 0.97, with an average of 0.992 ± 0.007) compared to the typical samples (averaging 0.998 ± 0.002). In addition, r showed decreasing trends with the increases of (Fig. 6e) and F (Fig. S5), suggesting that the relationship between ln(ATNλ)∗ and ln(λ) deviated more significantly from linearity as the ∼ 365 nm absorption peak, i.e., the influence of agricultural fires, became more significant. We suggest that for the open burning episodes, the AAE results should be interpreted with caution, although they could be calculated mathematically with reasonable r values (e.g., even the minimum r appeared acceptable).
3.4 Diurnal variations of wintertime AAE
Similar to the typical samples of spring, ln(ATNλ)∗ exhibited linear dependences on ln(λ) for all the winter samples. The wintertime AAE values were higher at night compared to those observed during the day (with averages of 7.33 ± 0.14 and 6.76 ± 0.11, respectively; two-tailed p=0.000), consistent with the pattern observed during winter in Beijing (Li et al., 2020). The relative abundance of secondary OC (SOC) has been considered an important influencing factor for AAE, e.g., an increasing trend was observed for AAE during long-range transport of BrC over the Indo-Gangetic Plain (Dasari et al., 2019). Although SOC or its organic tracer was not determined in this study, previous source apportionment results from Harbin (based on PMF) showed a strong correlation between SOC and sulfate, with largely consistent relationships among different campaigns (Cheng et al., 2022b). Thus, we used sulfate as an indicator for SOC. During the winter campaign, the ratios of sulfate to OC were lower at night (averaging 0.38, compared to 0.44 during the day; two-tailed p=0.011), pointing to decreased fractions of SOC in OC. This inference was consistent with the higher and levels observed at night, which had been attributed to increased emissions from residential biomass burning and vehicular exhausts, respectively. Thus, regarding the association between AAE and SOC formation, results from the winter campaign were inconsistent with Dasari et al. (2019), but the reason remained unclear. Molecular characterization of organic aerosols should be necessary to unfold the response of AAE to changes in BrC sources.
Diurnal variations of BrC were investigated during two distinct seasons in the northernmost megacity in China. The winter campaign was characterized by low temperatures rarely seen in other hotspots of air pollution studies, such as the North China Plain. The wintertime BrC aerosols were slightly more absorbing at night, with an average MAE365 of 1.61 ± 0.15 m2 gC−1 compared to 1.48 ± 0.18 m2 gC−1 during the day. Various indicators were used to explain the observed diurnal variations of MAE365, including those associated with biomass burning emissions ( and ), relative importance of coal combustion and vehicle emissions (), and secondary aerosol formation (SOR and NOR). For the winter campaign, the nighttime samples were characterized by increased BB emissions from residential sources, enhanced heterogeneous chemistry, and weakened photochemical reactions. But none of these factors was identified as the dominant driver for the higher MAE365 at night. Instead, the MAE365 exhibited a negative dependence on , and the lower and thus higher MAE365 at night were primarily attributed to increased emissions from heavy-duty diesel trucks, which were not allowed in the main urban area during the day. In addition, the wintertime AAE were higher at night, but it remained difficult to unfold the underlying connection between this diurnal pattern and the changes in BrC sources.
The spring campaign was characterized by frequent occurrences of agricultural fires, with more pronounced diurnal variations of MAE365 (averaging 0.98 ± 0.31 and 1.69 ± 0.65 m2 gC−1 for the daytime and nighttime samples, respectively). Unlike winter, the springtime MAE365 were mainly influenced by open burning emissions, as suggested by the positive dependence of MAE365 on and the lack of correlation between MAE365 and . The higher nighttime indicated that the farmers preferred burning the crop residues at night, presumably because agricultural fires were nominally prohibited by the local government. In addition, BrC exhibited distinct light absorption spectra during agricultural-fire episodes, as indicated by the nonlinear relationship between ln(ATNλ)∗ on ln(λ). The nonlinearity was mainly caused by chromophores with absorption peak at ∼ 365 nm, which became more significant with increasing BB influence. Aromatic species with nitro-functional groups were a possible class of compounds that were at play. The presence of such chromophores, i.e., the distinct absorption peak at ∼ 365 nm, prohibited a proper determination of AAE for the spring samples impacted by agricultural fires.
The MAE365 and AAE are key parameters for simulating climate effects of brown carbon. In winter, although Harbin experiences low temperatures rarely seen in other Chinese megacities, the observed MAE365 and AAE were largely comparable with the typical results from other regions in northern China (e.g., Beijing; Cheng et al., 2016). In addition, BrC's optical properties were indeed different between daytime and nighttime samples, which were likely associated with increased HDDT emissions at night. However, the diurnal variations (∼ 10 % higher at night for both the MAE365 and AAE) appeared negligible compared to uncertainties in simulating the mass concentration of BrC, i.e., organic aerosol. Thus, for typical winter conditions in northern China (without open burning), it may be practical to use fixed MAE365 and AAE values for estimating the wavelength-resolved absorption by organic aerosol in climate models.
The spring campaign suggested another scenario, that the agricultural fires exhibited strong influences on optical properties of brown carbon, as highlighted by the ∼ 365 nm peak in BrC's absorption spectra. The distinct peak on the one hand effectively elevated MAE365 and on the other hand complicated the determination of AAE. In addition, the peak became less significant during the day, indicating that the organic compounds at play were likely subject to photobleaching. BrC emitted by the fires remained difficult to constrain, partially due to the variable combustion efficiencies. This in turn resulted in challenges for simulating climate effects of the open burning aerosols. Given the massive agricultural sector in northeast China, more studies are necessary to understand the emissions, transformation, and impacts of the fire-induced pollutants.
Data described in this paper can be accessed at https://doi.org/10.5281/Zenodo.7874760 (Cheng, 2023).
The supplement related to this article is available online at: https://doi.org/10.5194/acp-23-6241-2023-supplement.
YC and JL designed the study and prepared the paper, with inputs from all the co-authors. XC, YZ, and QY carried out the experiments. QZ and KH validated the results and supervised the study.
At least one of the (co-)authors is a member of the editorial board of Atmospheric Chemistry and Physics. The peer-review process was guided by an independent editor, and the authors also have no other competing interests to declare.
Publisher’s note: Copernicus Publications remains neutral with regard to jurisdictional claims in published maps and institutional affiliations.
The authors thank Zhen-yu Du at the National Research Center for Environmental Analysis and Measurement and Lin-lin Liang at the Chinese Academy of Meteorological Sciences for their help in sample analysis.
This research has been supported by the National Natural Science Foundation of China (grant no. 42222706), the Natural Science Foundation of Heilongjiang Province (grant no. LH2020D011), the Fundamental Research Funds for the Central Universities, and the Heilongjiang Touyan Innovation Team Program.
This paper was edited by Irena Grgić and reviewed by two anonymous referees.
Akagi, S. K., Craven, J. S., Taylor, J. W., McMeeking, G. R., Yokelson, R. J., Burling, I. R., Urbanski, S. P., Wold, C. E., Seinfeld, J. H., Coe, H., Alvarado, M. J., and Weise, D. R.: Evolution of trace gases and particles emitted by a chaparral fire in California, Atmos. Chem. Phys., 12, 1397–1421, https://doi.org/10.5194/acp-12-1397-2012, 2012.
Brege, M. A., China, S., Schum, S., Zelenyuk, A., and Mazzoleni, L. R.: Extreme molecular complexity resulting in a continuum of carbonaceous species in biomass burning tar balls from wildfire smoke, ACS Earth Space Chem., 5, 2729–2739, https://doi.org/10.1021/acsearthspacechem.1c00141, 2021.
Brown, H., Liu, X., Feng, Y., Jiang, Y., Wu, M., Lu, Z., Wu, C., Murphy, S., and Pokhrel, R.: Radiative effect and climate impacts of brown carbon with the Community Atmosphere Model (CAM5), Atmos. Chem. Phys., 18, 17745–17768, https://doi.org/10.5194/acp-18-17745-2018, 2018.
Cappa, C. D., Lim, C. Y., Hagan, D. H., Coggon, M., Koss, A., Sekimoto, K., de Gouw, J., Onasch, T. B., Warneke, C., and Kroll, J. H.: Biomass-burning-derived particles from a wide variety of fuels – Part 2: Effects of photochemical aging on particle optical and chemical properties, Atmos. Chem. Phys., 20, 8511–8532, https://doi.org/10.5194/acp-20-8511-2020, 2020.
Chen, X. R., Wang, H. C., Lu, K. D., Li, C. M., Zhai, T. Y., Tan, Z. F., Ma, X. F., Yang, X. P., Liu, Y. H., Chen, S. Y., Dong, H. B., Li, X., Wu, Z. J., Hu, M., Zeng, L. M., and Zhang, Y. H.: Field determination of nitrate formation pathway in winter Beijing, Environ. Sci. Technol., 54, 9243–9253, https://doi.org/10.1021/acs.est.0c00972, 2020.
Chen, Y. and Bond, T. C.: Light absorption by organic carbon from wood combustion, Atmos. Chem. Phys., 10, 1773–1787, https://doi.org/10.5194/acp-10-1773-2010, 2010.
Cheng, Y.: Diurnal variations of brown carbon during two distinct seasons in a megacity in Northeast China, Zenodo [data set], https://doi.org/10.5281/zenodo.7874760, 2023.
Cheng, Y., He, K. B., Du, Z. Y., Engling, G., Liu, J. M., Ma, Y. L., Zheng, M., and Weber, R. J.: The characteristics of brown carbon aerosol during winter in Beijing, Atmos. Environ., 127, 355–364, https://doi.org/10.1016/j.atmosenv.2015.12.035, 2016.
Cheng, Y., Cao, X. B., Liu, J. M., Yu, Q. Q., Wang, P., Yan, C. Q., Du, Z. Y., Liang, L. L., Zhang, Q., and He, K. B.: Primary nature of brown carbon absorption in a frigid atmosphere with strong haze chemistry, Environ. Res., 204, 112324, https://doi.org/10.1016/j.envres.2021.112324, 2022a.
Cheng, Y., Cao, X. B., Liu, J. M., Yu, Q. Q., Zhong, Y. J., Geng, G. N., Zhang, Q., and He, K. B.: New open burning policy reshaped the aerosol characteristics of agricultural fire episodes in Northeast China, Sci. Total Environ., 810, 152272, https://doi.org/10.1016/j.scitotenv.2021.152272, 2022b.
Chu, B. W., Zhang, S. P., Liu, J., Ma, Q. X., and He, H.: Significant concurrent decrease in PM2.5 and NO2 concentrations in China during COVID-19 epidemic, J. Environ. Sci., 99, 346–353, https://doi.org/10.1016/j.jes.2020.06.031, 2021.
Dallmann, T. R., DeMartini, S. J., Kirchstetter, T. W., Herndon, S. C., Onasch, T. B., Wood, E. C., and Harley, R. A.: On-road measurement of gas and particle phase pollutant emission factors for individual heavy-duty diesel trucks, Environ. Sci. Technol., 46, 8511–8518, https://doi.org/10.1021/es301936c, 2012.
Dasari, S., Andersson, A., Bikkina, S., Holmstrand, H., Budhavant, K., Satheesh, S., Asmi, E., Kesti, J., Backman, J., Salam, A., Bisht, D. S., Tiwari, S., Hameed, Z., and Gustafsson, Ö.: Photochemical degradation affects the light absorption of water-soluble brown carbon in the South Asian outflow, Sci. Adv., 5, eaau8066, https://doi.org/10.1126/sciadv.aau8066, 2019.
Du, W., Shen, G. F., Chen, Y. C., Zhu, X., Zhuo, S. J., Zhong, Q. R., Qi, M., Xue, C. Y., Liu, G. Q., Zeng, E., Xing, B. S., and Tao, S.: Comparison of air pollutant emissions and household air quality in rural homes using improved wood and coal stoves, Atmos. Environ., 166, 215–223, https://doi.org/10.1016/j.atmosenv.2017.07.029, 2017.
Engling, G., Carrico, C. M., Kreidenweis, S. M., Collett Jr., J. L., Day, D. E., Malm, W. C., Lincoln, L., Hao, W. M., Iinuma, Y., and Herrmann, H.: Determination of levoglucosan in biomass combustion aerosol by high-performance anion-exchange chromatography with pulsed amperometric detection, Atmos. Environ., 40, S299–S311, https://doi.org/10.1016/j.atmosenv.2005.12.069, 2006.
Gao, S., Hegg, D. A., Hobbs, P. V., Kirchstetter, T. W., Magi, B. I., and Sadilek, M.: Water-soluble organic components in aerosols associated with savanna fires in southern Africa: identification, evolution, and distribution, J. Geophys. Res., 108, 8491, https://doi.org/10.1029/2002JD002324, 2003.
Hecobian, A., Zhang, X., Zheng, M., Frank, N., Edgerton, E. S., and Weber, R. J.: Water-Soluble Organic Aerosol material and the light-absorption characteristics of aqueous extracts measured over the Southeastern United States, Atmos. Chem. Phys., 10, 5965–5977, https://doi.org/10.5194/acp-10-5965-2010, 2010.
Huang, R. J., Yang, L., Shen, J .C., Yuan, W., Gong, Y. Q., Guo, J., Cao, W. J., Duan, J., Ni, H. Y., Zhu, C. S., Dai, W. T., Li, Y. J., Chen, Y., Chen, Q., Wu, Y. F., Zhang, R. J., Dusek, U., and O'Dowd, C.: Water-Insoluble organics dominate brown carbon in wintertime urban aerosol of China: chemical characteristics and optical properties, Environ. Sci. Technol., 54, 7836–7847, https://doi.org/10.1021/acs.est.0c01149, 2020.
Huang, R. J., Yang, L., Shen, J. C., Yuan, W., Gong, Y. Q., Ni, H. Y., Duan, J., Yan, J., Huang, H. B., You, Q. H., and Li, Y. J.: Chromophoric fingerprinting of brown carbon from residential biomass burning, Environ. Sci. Tech. Let., 9, 102–111, https://doi.org/10.1021/acs.estlett.1c00837, 2022.
Huo, Y. Q., Guo, Z. H., Li, Q., Wu, D., Ding, X., Liu, A. L., Huang, D., Qiu, G. K., Wu, M. M., Zhao, Z. J., Sun, H., Song, W. H., Li, X., Chen, Y. J., Wu, T. C., and Chen, J. M.: Chemical fingerprinting of HULIS in particulate matters emitted from residential coal and biomass combustion, Environ. Sci. Technol., 55, 3593–3603, https://doi.org/10.1021/acs.est.0c08518, 2021.
Iinuma, Y., Böge, O., Gräfe, R., and Herrmann, H.: Methyl-nitrocatechols: atmospheric tracer compounds for biomass burning secondary organic aerosols, Environ. Sci. Technol., 44, 8453–8459, https://doi.org/10.1021/es102938a, 2010.
Jiang, H. X., Li, J., Sun, R., Tian, C. G., Tang, J., Jiang, B., Liao, Y. H., Chen, C. E., and Zhang, G.: Molecular dynamics and light absorption properties of atmospheric dissolved organic matter, Environ. Sci. Technol., 55, 10268–10279, https://doi.org/10.1021/acs.est.1c01770, 2021.
Kumar, N. K., Corbin, J. C., Bruns, E. A., Massabó, D., Slowik, J. G., Drinovec, L., Močnik, G., Prati, P., Vlachou, A., Baltensperger, U., Gysel, M., El-Haddad, I., and Prévôt, A. S. H.: Production of particulate brown carbon during atmospheric aging of residential wood-burning emissions, Atmos. Chem. Phys., 18, 17843–17861, https://doi.org/10.5194/acp-18-17843-2018, 2018.
Lack, D. A., Langridge, J. M., Bahreini, R., Cappa, C. D., Middlebrook, A. M., and Schwarz, J. P.: Brown carbon and internal mixing in biomass burning particles, P. Natl. Acad. Sci. USA, 109, 14802–14807, https://doi.org/10.1073/pnas.1206575109, 2012.
Laskin, A., Laskin, J., and Nizkorodov, S. A.: Chemistry of atmospheric brown carbon, Chem. Rev., 115, 4335–4382, https://doi.org/10.1021/cr5006167, 2015.
Li, M., Liu, H., Geng, G. N., Hong, C. P., Liu, F., Song, Y., Tong, D., Zheng, B., Cui, H. Y., Man, H. Y., Zhang, Q., and He, K. B.: Anthropogenic emission inventories in China: a review, Natl. Sci. Rev., 4, 834–866, https://doi.org/10.1093/nsr/nwx150, 2017.
Li, X., Wang, Y. J., Hu, M., Tan, T. Y., Li, M. R., Wu, Z. J., Chen, S. Y., and Tang, X. Y.: Characterizing chemical composition and light absorption of nitroaromatic compounds in the winter of Beijing, Atmos. Environ., 237, 117712, https://doi.org/10.1016/j.atmosenv.2020.117712, 2020.
Li, Y., Tan, Z., Ye, C., Wang, J., Wang, Y., Zhu, Y., Liang, P., Chen, X., Fang, Y., Han, Y., Wang, Q., He, D., Wang, Y., and Zhu, T.: Using wavelet transform to analyse on-road mobile measurements of air pollutants: a case study to evaluate vehicle emission control policies during the 2014 APEC summit, Atmos. Chem. Phys., 19, 13841–13857, https://doi.org/10.5194/acp-19-13841-2019, 2019.
Li, Y. C., Liu, J., Han, H., Zhao, T. L., Zhang, X., Zhuang, B. L., Wang, T. J., Chen, H. M., Wu, Y., and Li, M. M.: Collective impacts of biomass burning and synoptic weather on surface PM2.5 and CO in Northeast China, Atmos. Environ., 213, 64–80, https://doi.org/10.1016/j.atmosenv.2019.05.062, 2019.
Lian, X. B., Huang, J. P., Huang, R. J., Liu, C. W., Wang, L. N., and Zhang, T. H.: Impact of city lockdown on the air quality of COVID-19-hit of Wuhan city, Sci. Total Environ., 742, 140556, https://doi.org/10.1016/j.scitotenv.2020.140556, 2020.
Lin, P., Laskin, J., Nizkorodov, S. A., and Laskin, A.: Revealing brown carbon chromophores produced in reactions of methylglyoxal with ammonium sulfate, Environ. Sci. Technol., 49, 14257–14266, https://doi.org/10.1021/acs.est.5b03608, 2015.
Lin, P., Aiona, P. K., Li, Y., Shiraiwa, M., Laskin, J., Nizkorodov, S. A., and Laskin, A.: Molecular characterization of brown carbon in biomass burning aerosol particles, Environ. Sci. Technol., 50, 11815–11824, https://doi.org/10.1021/acs.est.6b03024, 2016.
Lin, P., Bluvshtein, N., Rudich, Y., Nizkorodov, S. A., Laskin, J., and Laskin, A.: Molecular chemistry of atmospheric brown carbon inferred from a nationwide biomass burning event, Environ. Sci. Technol., 51, 11561–11570, https://doi.org/10.1021/acs.est.7b02276, 2017.
Lin, P., Fleming, L. T., Nizkorodov, S. A., Laskin, J., and Laskin, A.: Comprehensive molecular characterization of atmospheric brown carbon by high resolution mass spectrometry with electrospray and atmospheric pressure photoionization, Anal. Chem., 90, 12493–12502, https://doi.org/10.1021/acs.analchem.8b02177, 2018.
Liu, T. Y., Chan, A. W. H., and Abbatt, J. P. D.: Multiphase oxidation of sulfur dioxide in aerosol particles: implications for sulfate formation in polluted environments, Environ. Sci. Technol., 8, 4227–4242, https://doi.org/10.1021/acs.est.0c06496, 2021.
Liu, X. X., Zhang, Y., Huey, L. G., Yokelson, R. J., Wang, Y., Jimenez, J. L., Campuzano-Jost, P., Beyersdorf, A. J., Blake, D. R., Choi, Y., St Clair, J. M., Crounse, J. D., Day, D. A., Diskin, G. S., Fried, A., Hall, S. R., Hanisco, T. F., King, L. E., Meinardi, S., Mikoviny, T., Palm, B. B., Peischl, J., Perring, A. E., Pollack, I. B., Ryerson, T. B., Sachse, G., Schwarz, J. P., Simpson, I. J., Tanner, D. J., Thornhill, K. L., Ullmann, K., Weber, R. J., Wennberg, P. O., Wisthaler, A., Wolfe, G. M., and Ziemba, L. D.: Agricultural fires in the southeastern U.S. during SEAC4RS: emissions of trace gases and particles and evolution of ozone, reactive nitrogen, and organic aerosol, J. Geophys. Res.-Atmos., 121, 7383–7414, https://doi.org/10.1002/2016JD025040, 2016.
McClure, C. D., Lim, C. Y., Hagan, D. H., Kroll, J. H., and Cappa, C. D.: Biomass-burning-derived particles from a wide variety of fuels – Part 1: Properties of primary particles, Atmos. Chem. Phys., 20, 1531–1547, https://doi.org/10.5194/acp-20-1531-2020, 2020.
McMeeking, G. R., Kreidenweis, S. M., Baker, S., Carrico, C. M., Chow, J. C., Collett Jr., J. L., Hao, W. M., Holden, A. S., Kirchstetter, T. W., Malm, W. C., Moosmüller, H., Sullivan, A. P., and Wold, C. E.: Emissions of trace gases and aerosols during the open combustion of biomass in the laboratory, J. Geophys. Res., 114, D19210, https://doi.org/10.1029/2009JD011836, 2009.
Mohr, C., Lopez-Hilfiker, F. D., Zotter, P., Prévôt, A. S. H., Xu, L., Ng, N. L., Herndon, S. C., Williams, L. R., Franklin, J. P., Zahniser, M. S., Worsnop, D. R., Knighton, W. B., Aiken, A. C., Gorkowski, K. J., Dubey, M. K., Allan, J. D., and Thornton, J. A.: Contribution of nitrated phenols to wood burning brown carbon light absorption in Detling, United Kingdom during winter time, Environ. Sci. Technol., 47, 6316–6324, https://doi.org/10.1021/es400683v, 2013.
Ni, H. Y., Huang, R. J., Pieber, S. M., Corbin, J. C., Stefenelli, G., Pospisilova, V., Klein, F., Gysel-Beer, M., Yang, L., Baltensperger, U., El Haddad, I., Slowik, J. G., Cao, J. J., Prévôt, A. S. H., and Dusek, U.: Brown carbon in primary and aged coal combustion emission, Environ. Sci. Technol., 55, 5701–5710, https://doi.org/10.1021/acs.est.0c08084, 2021.
Pokhrel, R. P., Wagner, N. L., Langridge, J. M., Lack, D. A., Jayarathne, T., Stone, E. A., Stockwell, C. E., Yokelson, R. J., and Murphy, S. M.: Parameterization of single-scattering albedo (SSA) and absorption Ångström exponent (AAE) with for aerosol emissions from biomass burning, Atmos. Chem. Phys., 16, 9549–9561, https://doi.org/10.5194/acp-16-9549-2016, 2016.
Saleh, R.: From measurements to models: toward accurate representation of brown carbon in climate calculations, Curr. Pollut. Rep., 6, 90–104, https://doi.org/10.1007/s40726-020-00139-3, 2020.
Salvador, C. M. G., Tang, R., Priestley, M., Li, L., Tsiligiannis, E., Le Breton, M., Zhu, W., Zeng, L., Wang, H., Yu, Y., Hu, M., Guo, S., and Hallquist, M.: Ambient nitro-aromatic compounds – biomass burning versus secondary formation in rural China, Atmos. Chem. Phys., 21, 1389–1406, https://doi.org/10.5194/acp-21-1389-2021, 2021.
Sand, M., Samset, B. H., Myhre, G., Gliß, J., Bauer, S. E., Bian, H., Chin, M., Checa-Garcia, R., Ginoux, P., Kipling, Z., Kirkevåg, A., Kokkola, H., Le Sager, P., Lund, M. T., Matsui, H., van Noije, T., Olivié, D. J. L., Remy, S., Schulz, M., Stier, P., Stjern, C. W., Takemura, T., Tsigaridis, K., Tsyro, S. G., and Watson-Parris, D.: Aerosol absorption in global models from AeroCom phase III, Atmos. Chem. Phys., 21, 15929–15947, https://doi.org/10.5194/acp-21-15929-2021, 2021.
Shen, X. B., Hao, J. T., Kong, L., Shi, Y., Cao, X. Y., Shi, J. C., Yao, Z. L., Li, X., Wu, B. B., Xu, Y. M., and He, K. B.: Variation characteristics of fine particulate matter and its components in diesel vehicle emission plumes, J. Environ. Sci., 107, 138–149, https://doi.org/10.1016/j.jes.2021.01.034, 2021.
Su, H., Cheng, Y. F., and Pöschl, U.: New multiphase chemical processes influencing atmospheric aerosols, air quality, and climate in the Anthropocene, Accounts Chem. Res., 53, 2034–2043, https://doi.org/10.1021/acs.accounts.0c00246, 2020.
Tabazadeh, A., Djikaev, Y. S., and Reiss, H.: Surface crystallization of supercooled water in clouds, P. Natl. Acad. Sci. USA, 99, 15873–15878, https://doi.org/10.1073/pnas.252640699, 2002.
Wang, Q. Q., Zhou, Y. Y., Ma, N., Zhu, Y., Zhao, X. C., Zhu, S. W., Tao, J. C., Hong, J., Wu, W. J., Cheng, Y. F., and Su, H.: Review of brown carbon aerosols in China: pollution level, optical properties, and emissions, J. Geophys. Res.-Atmos., 127, e2021JD035473, https://doi.org/10.1029/2021JD035473, 2022.
Wang, Y. S., Li, W. J., Gao, W. K., Liu, Z. R., Tian, S. L., Shen, R. R., Ji, D. S., Wang, S., Wang, L. L., Tang, G. Q., Song, T., Cheng, M. T., Wang, G. H., Gong, Z. Y., Hao, J. M., and Zhang, Y. H.: Trends in particulate matter and its chemical compositions in China from 2013–2017, Sci. China Earth Sci., 62, 1857–1871, https://doi.org/10.1007/s11430-018-9373-1, 2019.
Washenfelder, R. A., Azzarello, L., Ball, K., Brown, S. S., Decker, Z. C. J., Franchin, A., Fredrickson, C. D., Hayden, K., Holmes, C. D., Middlebrook, A. M., Palm, B. B., Pierce, R. B., Price, D. J., Roberts, J. M., Robinson, M. A., Thornton, J. A., Womack, C. C., and Young, C. J.: Complexity in the evolution, composition, and spectroscopy of brown carbon in aircraft measurements of wildfire plumes, Geophys. Res. Lett., 49, e2022GL098951, https://doi.org/10.1029/2022GL098951, 2022.
Wozniak, A. S., Bauer, J. E., Sleighter, R. L., Dickhut, R. M., and Hatcher, P. G.: Technical Note: Molecular characterization of aerosol-derived water soluble organic carbon using ultrahigh resolution electrospray ionization Fourier transform ion cyclotron resonance mass spectrometry, Atmos. Chem. Phys., 8, 5099–5111, https://doi.org/10.5194/acp-8-5099-2008, 2008.
Wu, J., Kong, S. F., Yan, Y. Y., Yao, L. Q., Yan, Q., Liu, D. T., Shen, G. F., Zhang, X. Y., and Qi, S. H.: Neglected biomass burning emissions of air pollutants in China-views from the corncob burning test, emission estimation, and simulations, Atmos. Environ., 278, 119082, https://doi.org/10.1016/j.atmosenv.2022.119082, 2022.
Xie, M., Chen, X., Hays, M. D., and Holder, A. L.: Composition and light absorption of N-containing aromatic compounds in organic aerosols from laboratory biomass burning, Atmos. Chem. Phys., 19, 2899–2915, https://doi.org/10.5194/acp-19-2899-2019, 2019.
Xie, M., Zhao, Z., Holder, A. L., Hays, M. D., Chen, X., Shen, G., Jetter, J. J., Champion, W. M., and Wang, Q.: Chemical composition, structures, and light absorption of N-containing aromatic compounds emitted from burning wood and charcoal in household cookstoves, Atmos. Chem. Phys., 20, 14077–14090, https://doi.org/10.5194/acp-20-14077-2020, 2020.
Xu, J. Z., Hettiyadura, A. P. S., Liu, Y. M., Zhang, X. H., Kang, S. C., and Laskin, A.: Atmospheric brown carbon on the Tibetan Plateau: regional differences in chemical composition and light absorption properties, Environ. Sci. Tech. Let., 9, 219–225, https://doi.org/10.1021/acs.estlett.2c00016, 2022.
Yang, M., Howell, S. G., Zhuang, J., and Huebert, B. J.: Attribution of aerosol light absorption to black carbon, brown carbon, and dust in China – interpretations of atmospheric measurements during EAST-AIRE, Atmos. Chem. Phys., 9, 2035–2050, https://doi.org/10.5194/acp-9-2035-2009, 2009.
Yttri, K. E., Schnelle-Kreis, J., Maenhaut, W., Abbaszade, G., Alves, C., Bjerke, A., Bonnier, N., Bossi, R., Claeys, M., Dye, C., Evtyugina, M., García-Gacio, D., Hillamo, R., Hoffer, A., Hyder, M., Iinuma, Y., Jaffrezo, J.-L., Kasper-Giebl, A., Kiss, G., López-Mahia, P. L., Pio, C., Piot, C., Ramirez-Santa-Cruz, C., Sciare, J., Teinilä, K., Vermeylen, R., Vicente, A., and Zimmermann, R.: An intercomparison study of analytical methods used for quantification of levoglucosan in ambient aerosol filter samples, Atmos. Meas. Tech., 8, 125–147, https://doi.org/10.5194/amt-8-125-2015, 2015.
Yuan, Q., Qi, B., Hu, D. Y., Wang, J. J., Zhang, J., Yang, H. Q., Zhang, S. S., Liu, L., Xu, L., and Li, W. J.: Spatiotemporal variations and reduction of air pollutants during the COVID-19 pandemic in a megacity of Yangtze River Delta in China, Sci. Total Environ., 751, 141820, https://doi.org/10.1016/j.scitotenv.2020.141820, 2021.
Zeng, L., Dibb, J., Scheuer, E., Katich, J. M., Schwarz, J. P., Bourgeois, I., Peischl, J., Ryerson, T., Warneke, C., Perring, A. E., Diskin, G. S., DiGangi, J. P., Nowak, J. B., Moore, R. H., Wiggins, E. B., Pagonis, D., Guo, H., Campuzano-Jost, P., Jimenez, J. L., Xu, L., and Weber, R. J.: Characteristics and evolution of brown carbon in western United States wildfires, Atmos. Chem. Phys., 22, 8009–8036, https://doi.org/10.5194/acp-22-8009-2022, 2022.
Zeng, L. H., Zhang, A. X., Wang, Y. H., Wagner, N. L., Katich, J. M., Schwarz, J. P., Schill, G. P., Brock, C., Froyd, K. D., Murphy, D. M., Williamson, C. J., Kupc, A., Scheuer, E., Dibb, J., and Weber, R. J.: Global measurements of brown carbon and estimated direct radiative effects, Geophys. Res. Lett., 47, e2020GL088747, https://doi.org/10.1029/2020GL088747, 2020.
Zeng, Y. L., Ning, Y. L., Shen, Z. X., Zhang, L. M., Zhang, T., Lei, Y. L., Zhang, Q., Li, G. H., Xu, H. M., Ho, S. S. H., and Cao, J. J.: The roles of N, S, and O in molecular absorption features of brown carbon in PM2.5 in a typical semi-arid megacity in Northwestern China, J. Geophys. Res.-Atmos., 126, e2021JD034791, https://doi.org/10.1029/2021JD034791, 2021.
Zhang, J., Smith, K. R., Ma, Y., Ye, S., Jiang, F., Qi, W., Liu, P., Khalil, M. A. K., Rasmussen, R. A., and Thorneloe, S. A.: Greenhouse gases and other airborne pollutants from household stoves in China: a database for emission factors, Atmos. Environ., 34, 4537–4549, https://doi.org/10.1016/S1352-2310(99)00450-1, 2000.
Zhang, Y. L., Wang, X. M., Li, G. H., Yang, W. Q., Huang, Z. H., Zhang, Z., Huang, X. Y., Deng, W., Liu, T. Y., Huang, Z. Z., and Zhang, Z. Y.: Emission factors of fine particles, carbonaceous aerosols and traces gases from road vehicles: recent tests in an urban tunnel in the Pearl River Delta, China, Atmos. Environ., 122, 876–884, https://doi.org/10.1016/j.atmosenv.2015.08.024, 2015.