the Creative Commons Attribution 4.0 License.
the Creative Commons Attribution 4.0 License.
 | 07 Jun 2023
Transported aerosols regulate the pre-monsoon rainfall over north-east India: a WRF-Chem modelling study
Neeldip Barman
Sharad Gokhale
The study differentiates and quantifies the impacts of aerosols emitted locally within the north-east (NE) India region and those transported from outside this region to ascertain whether local or transported aerosols are more impactful in influencing this region's rainfall during the pre-monsoon season (March–April–May). Due to the existence of a declining pre-monsoon rainfall trend in NE India, the study also quantified the role of different aerosol effects in radiative forcing (RF) and rainfall. The study has been carried out using the WRF-Chem model by comparing simulation scenarios where emissions were turned on and off within and outside the NE region. The impact of all emissions as a whole and black carbon (BC) specifically was studied. Results show that aerosols transported primarily from the Indo-Gangetic Plain (IGP) were responsible for 93.98 % of the PM10 mass over NE India's atmosphere and 64.18 % of near-surface PM10 concentration. Transported aerosols contributed >50 % of BC, organic carbon, sulfate, nitrate, ammonium and dust aerosol concentration and are hence a major contributor to air pollution. Hence, the aerosol effects were much greater with transported aerosols. An indirect aerosol effect was found to be the major effect and more impactful, with transported aerosols that dominated both rainfall and RF and suppressed rainfall more significantly than the direct and semi-direct effect. However, the increase in direct radiative effects with an increase in transported BC counteracted the rainfall suppression caused by relevant processes of other aerosol effects. Thus, this study shows atmospheric transport to be an important process for this region, as transported emissions, specifically from the IGP, were also found to have greater control over the region's rainfall. Thus, emission control policies implemented in the IGP will reduce air pollution as well as the climatic impacts of aerosols over the NE India region.
- Article
(9991 KB) - Full-text XML
-
Supplement
(1853 KB) - BibTeX
- EndNote


Aerosols regulate the Earth's energy budget and hydrological cycle through scattering and absorption of solar radiation and acting as sites for the formation of cloud droplets, which leads to its varied effects, viz. direct, semi-direct and indirect effects (Mitchell, 1971; Rosenfeld, 2012; Menon et al., 2002). The effects differ spatially depending on the constituents of aerosols, their physical and chemical properties, and the quantity. Among these factors, atmospheric transport also plays an important role, which extends the climatic impacts to the transported region from the source region (Lee et al., 2022). The IGP is a global hotspot of diverse aerosols (Ojha et al., 2020; Kumar et al., 2018) that impacts regional and global climate (Ramanathan et al., 2005; Tripathi et al., 2005; Sarangi et al., 2015). Air masses transport aerosols from the IGP to nearby regions, which also impacts air quality (Bhat et al., 2022; Ojha et al., 2012). Bonasoni et al. (2010) showed that pollutants from the IGP follow the southern slope of the Himalayas as a path into the Bay of Bengal and NE India, and similar observations were made by Gogoi et al. (2017). The condition becomes more critical in the pre-monsoon season when the westerlies directly transport air pollutants from the IGP to NE India. Among the aerosols, BC is a highly climate-influencing aerosol component due to its strong absorption capability (Bond et al., 2013; Nenes et al., 2002; Koch and Del Genio, 2010), and the IGP is the largest source region of it in India (Rana et al., 2019). Several studies (Guha et al., 2015; Sarkar et al., 2019; Chatterjee et al., 2010) found BC, among other aerosols, measured at sites in NE India to be transported from the IGP. Moreover, in the NE India region, an increase in BC emissions was observed along with high BC concentrations near the surface level (Barman and Gokhale, 2019; Chaudhury et al., 2022; Singh and Gokhale, 2021). Tiwari et al. (2016) observed maximum BC concentration during this season in this region along with the highest surface RF. The region also observes the highest atmospheric heating and highest aerosol optical depth with an increasing trend during this period (Nair et al., 2017; Dahutia et al., 2018, 2019; Gogoi et al., 2017; Pathak et al., 2010, 2016). The presence of high aerosol loading along with high atmospheric heating is likely to have varied aerosol effects over the region and may also have an important role to play in the rainfall. Mondal et al. (2018) showed a decreasing trend of pre-monsoon rainfall in this biodiversity hotspot region. A few modelling studies (Kant et al., 2021; Kedia et al., 2016, 2019) are available that have studied the aerosol effect on rainfall over India. However, only Soni et al. (2017) and Barman and Gokhale (2022) studied the BC effect on pre-monsoon rainfall in this region but without the inclusion of the aerosol indirect effect. Both studies found BC to increase the total rainfall, but Barman and Gokhale (2022) also found the semi-direct effect to be a rainfall-suppression mechanism by evaporating clouds between 1 to 2 km above ground level.
However, a few questions remained to be answered. How much is the contribution of transported aerosols to air pollution and climatic effects compared to those emitted within the NE India region? What is the role of different aerosol effects in the rainfall mechanisms? Thus, this study was carried out with the following objectives: (a) to compare the contributions of local and transported aerosols to air pollution and different climatic effects over NE India, (b) to quantify the role of different aerosol effects in the climatic effects, and (c) to investigate the role of BC emitted within NE India and transported BC in such climatic effects. Here, transported aerosols include the transported primary aerosols emitted from outside NE India as well as the secondary aerosols formed from the transported emissions. The same goes for local emissions. Through a qualitative and quantitative comparison of the impacts of local and transported aerosols, the study tries to find the source region of aerosols that has a greater impact on the atmosphere over NE India during the pre-monsoon season. Since observational studies cannot distinguish between the local and transported aerosol impacts, the study was carried out with numerical modelling. The effect of transported aerosols on different regions of the world has been studied (Krishnamohan et al., 2021; Wang et al., 2020; Bagtasa et al., 2019), but none of them covered the IGP and its impact on the nearby region.
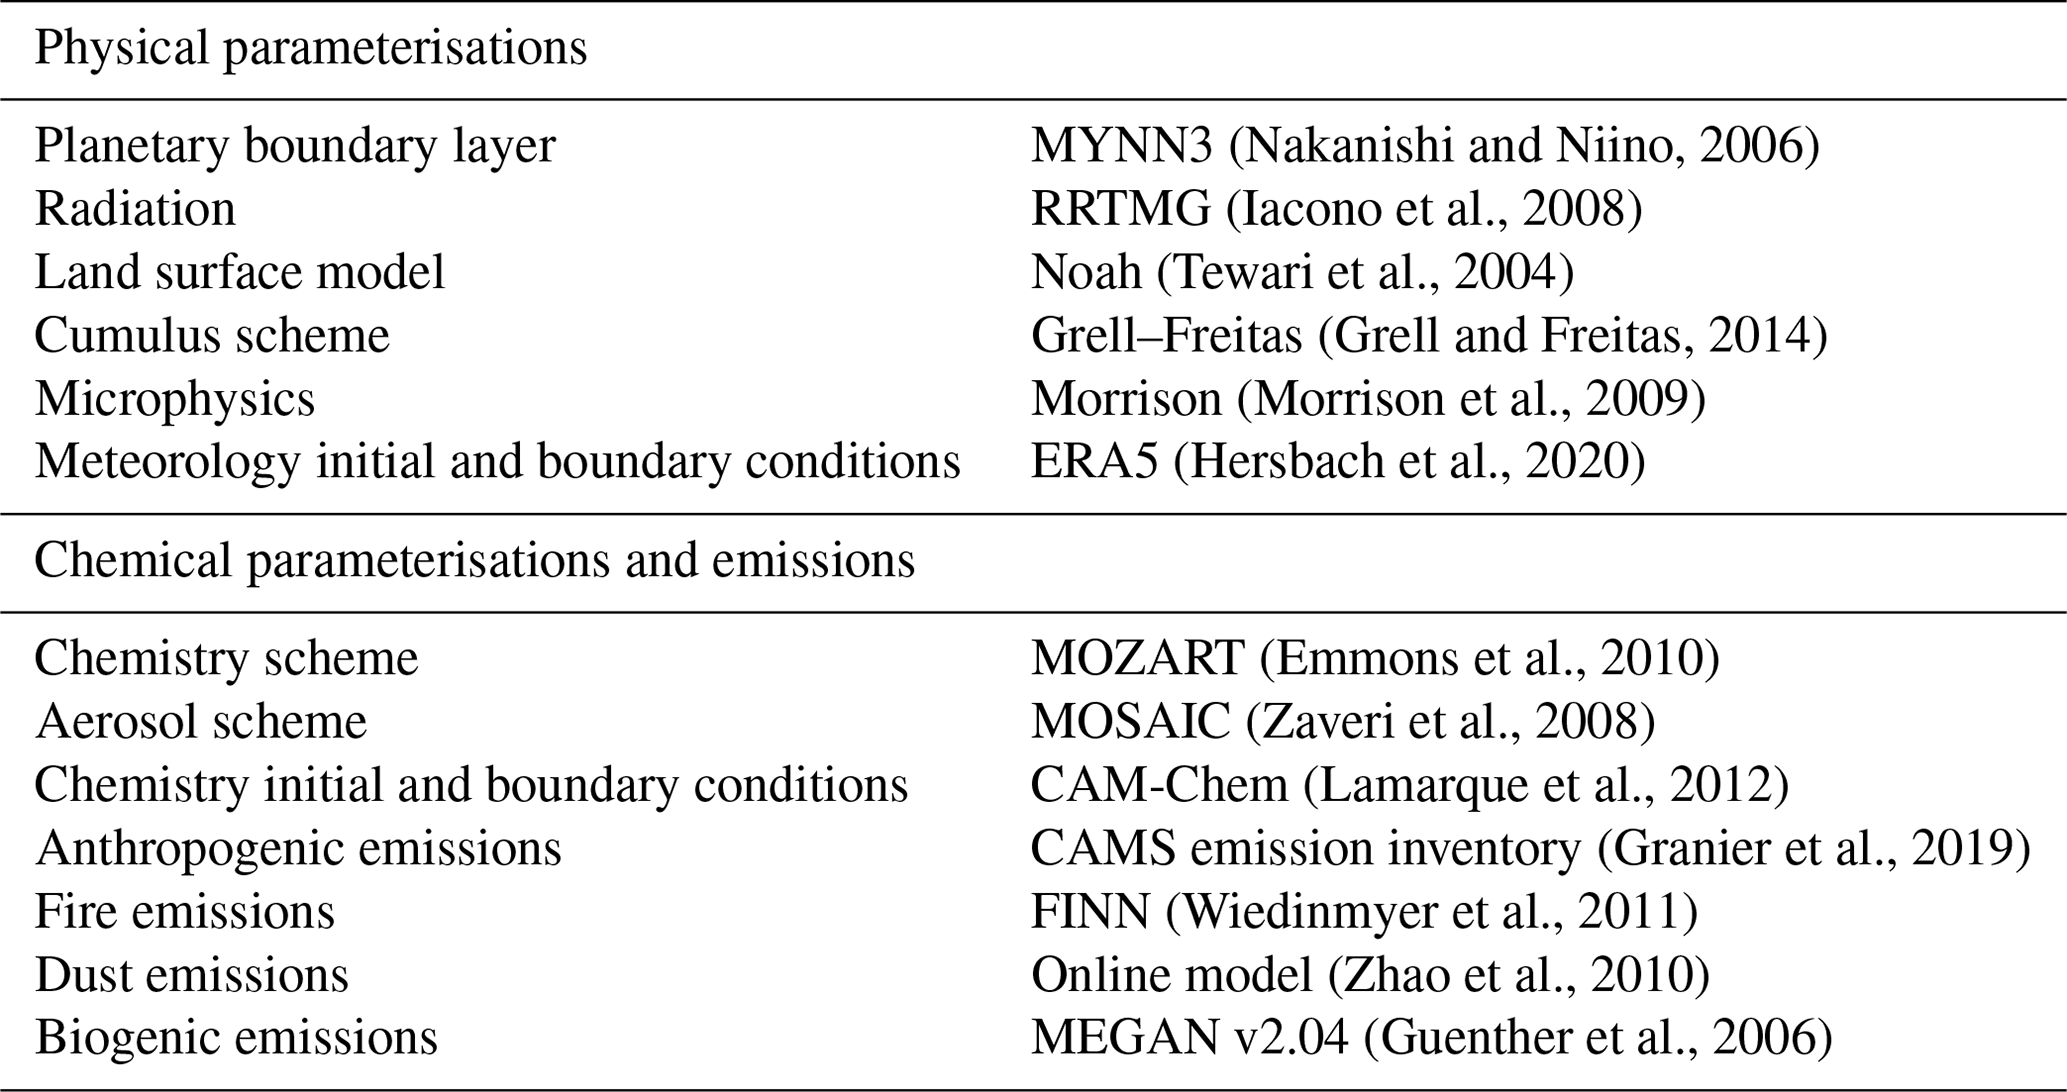
The study used the WRF-Chem v4.2.1 model (Grell et al., 2005). The model configuration, modelling domain, model inputs and simulation period are similar to that used in Barman and Gokhale (2022). Details regarding the physical and chemical parameterisation schemes and the emissions are provided in Table 1.
Table 1Details of physical parameterisations, chemical parameterisations and emissions.
The model was run at a 10 km grid size for a duration of 13 d from 7–19 April 2018, out of which a 3 d period from 7–9 April 2018 was discarded as spin-up, and outputs from 10–19 April 2018 were used for analysis. The period represents the middle of the pre-monsoon season. Also, April 2018 was the Indian Ocean Dipole and ENSO neutral period and hence suitable for the study of aerosol effects. The model domain is shown in Fig. 1a, which extends from 10.65 to 31.22∘ N and 71.68 to 100.43∘ E, and NE India is the part of India within the region bounded by the blue box. The region within the box is bounded by 22 and 29∘ N latitudes and 89 and 97∘ E longitudes. The climatic situation during the study period was also described in Barman and Gokhale (2022). The near-surface wind flow was from the Bay of Bengal towards NE India, which gradually changed to westerly wind flow, carrying aerosols from the IGP towards NE India. Hence the domain was selected by keeping the NE India region near the upper-right corner of the domain. Descriptions of the simulations are provided in Table 2.
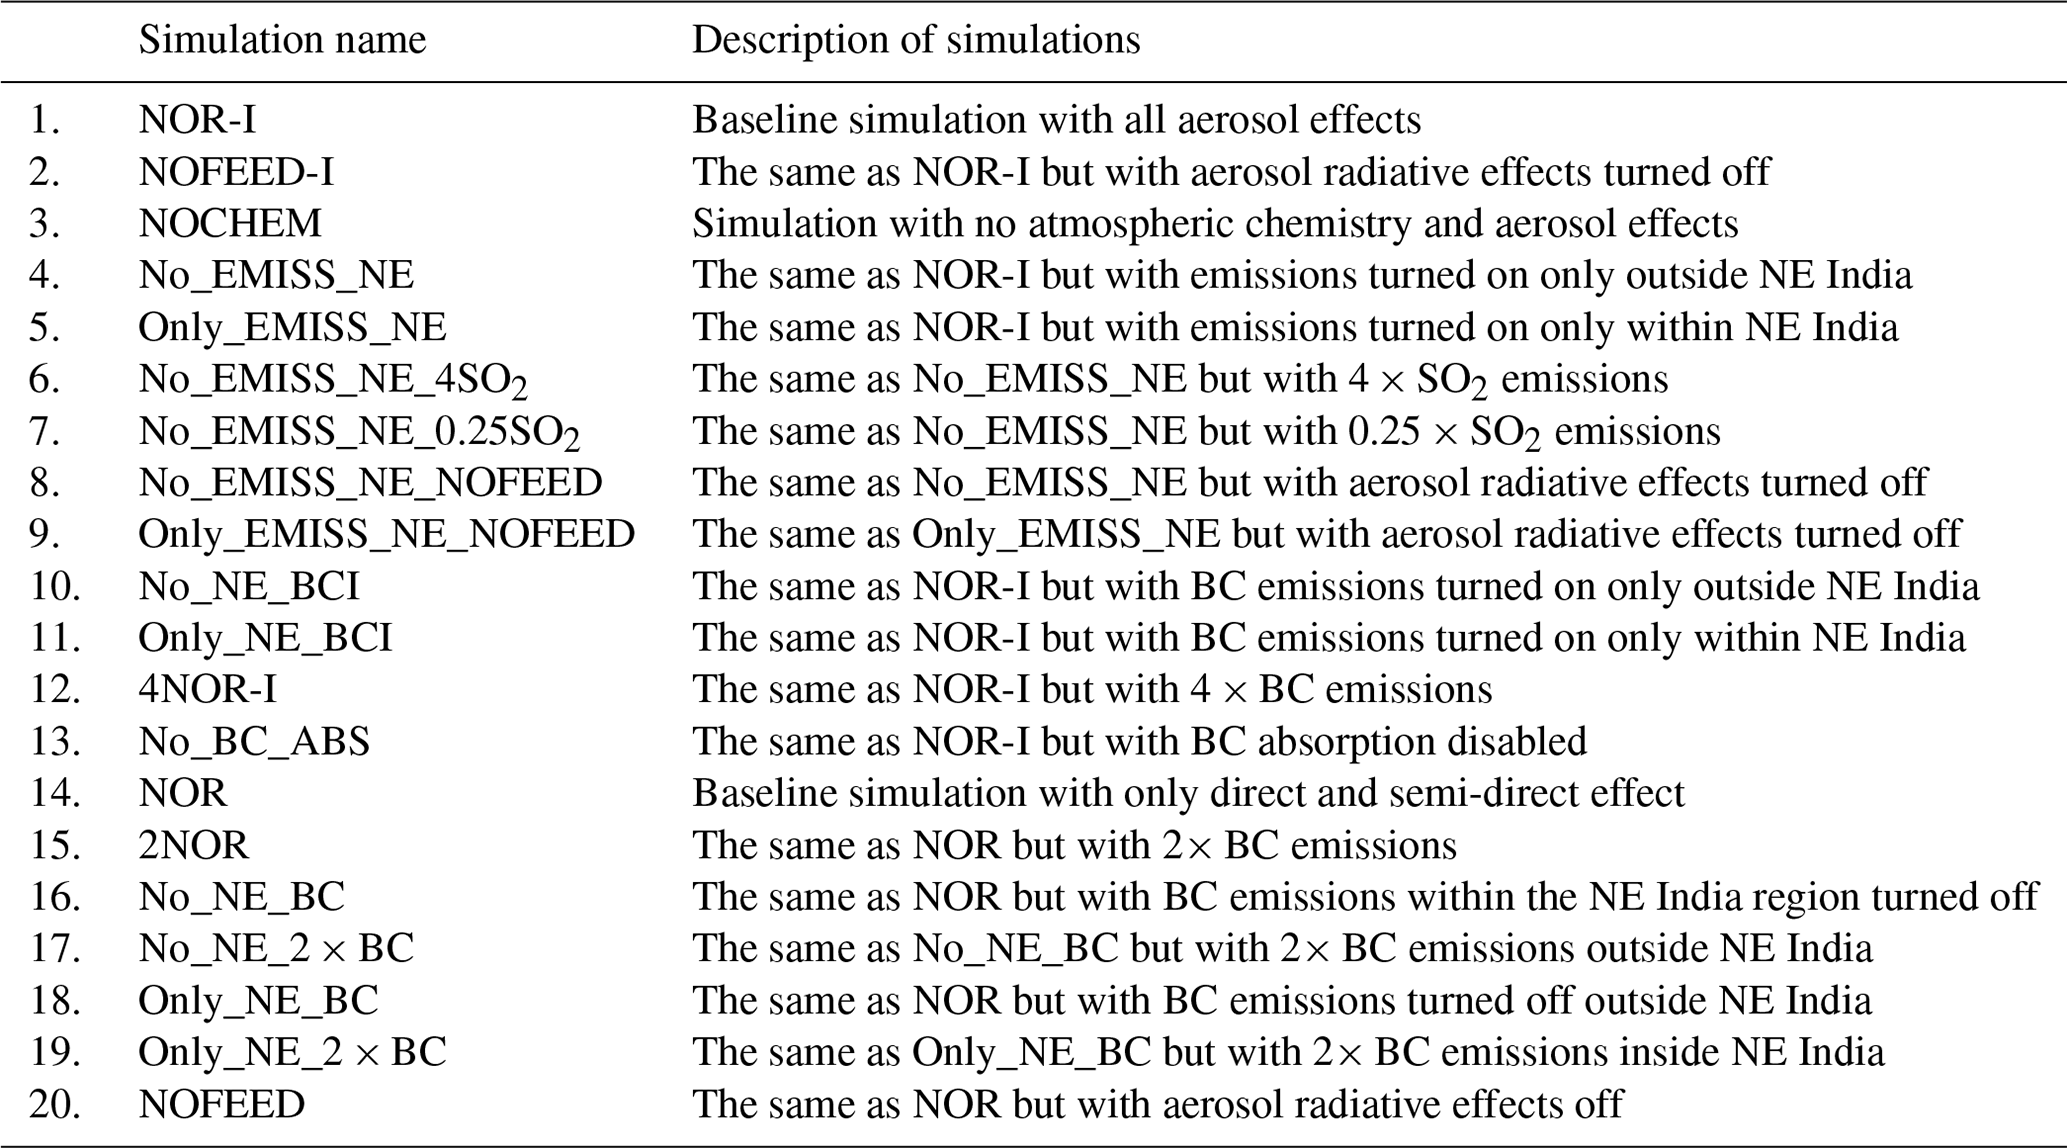
All the simulations were conducted with the MOZART-MOSAIC scheme, except simulation 3, which was purely a meteorology simulation and did not include any atmospheric chemistry and aerosol effects. Moreover, simulations 1 to 13 (except 3), were conducted with the version of the MOZART-MOSAIC scheme which also supports the indirect aerosol effect by coupling it with the Morrison microphysics scheme along with direct and semi-direct effects, while simulations 14 to 20 did not include the indirect effect. The NOR simulation used in Barman and Gokhale (2022) was also used in this study. NOR-I is also the baseline simulation run with the same baseline emissions for the study period as NOR but also includes the indirect aerosol effect. No_EMISS_NE had all emissions (biogenic, anthropogenic and dust) disabled within the region bounded by 22 and 29∘ N latitudes and 89 and 97∘ E longitudes, shown by the blue box in Fig. 1a, while No_NE_BC and No_NE_BCI only had BC emissions disabled within the same region. Only_EMISS_NE had all emissions disabled outside of the above region along with boundary conditions for all chemical species modified to 0 to nullify the transport of emissions from outside the domain, and similarly, Only_NE_BC and Only_NE_BCI had BC emissions disabled outside the NE India region with boundary conditions for BC modified to 0. Remaining simulations can be understood from Table 2, and their applications are understood from the “Results and discussion” section in Sect. 3.
As per Ghan et al. (2012) and Bauer and Menon (2012), the total aerosol effect is the algebraic sum of direct, indirect and semi-direct effects. Similar approaches were used by Yang et al. (2011). Thus
Both NOFEED-I and NOR-I include the indirect effect, but NOFEED-I does not include aerosol radiative effects. Thus
Also, since NOFEED-I includes only the indirect effect,
Similar approaches were used by Wang et al. (2015).
The NOR simulation utilised in this study was evaluated in Barman and Gokhale (2022). Moreover, meteorological evaluation of NOR-I with respect to wind direction, wind speed, temperature and humidity was carried out against surface station datasets (https://mesonet.agron.iastate.edu/sites/locate.php, last access: 23 February 2022) at Guwahati (26.10∘ N, 91.58∘ E), Kolkata (22.65∘ N, 88.45∘ E), Bengaluru (13.20∘ N, 77.70∘ E), Patna (25.59∘ N, 85.08∘ E), Delhi (28.56∘ N, 77.11∘ E) and Mumbai (19.10∘ N, 72.86∘ E). Simulated rainfall was evaluated against the India Meteorological Department (IMD) rainfall dataset of Pai et al. (2014) (https://www.imdpune.gov.in/cmpg/Griddata/Rainfall_25_Bin.html, last access: 7 March 2022). Index of agreement (IOA), root mean square error (RMSE) and mean error (ME) were used as statistical parameters. As per the criteria of Emery et al. (2001), the NOR-I simulation underpredicted temperature but showed good performance with wind speed and wind direction but had a large RMSE with wind direction, similar to the NOR simulation. Performance statistics are provided in Table S1. Moreover, NOR- and NOR-I-simulated chemical species (BC, organic carbon, dust and sulfate aerosol) were compared against the MERRA-2 dataset (https://disc.gsfc.nasa.gov/datasets/M2T1NXAER_5.12.4/summary, last access: 14 May 2022) at the above locations. Performance statistics are shown in Table S2. NOR gave a much better estimation of all the chemical species at all locations. Moreover, the predicted chemical species of nitric oxide (NO), nitrogen dioxide (NO2), sulfur dioxide (SO2), PM2.5 and PM10 were compared against in situ observations in Delhi (28.56∘ N, 77.11∘ E), Kanpur (26.57∘ N, 80.32∘ E), Patna (25.61∘ N, 85.13∘ E) and Siliguri (26.69∘ N, 88.41∘ E), obtained from the Central Pollution Control Board, India (https://app.cpcbccr.com/ccr/#/caaqm-dashboard-all/caaqm-landing/caaqm-data-availability, last access: 26 December 2022). These locations are located along the IGP. Performance statistics are given in Table S3. The performance statistics were better with both PM2.5 and PM10 than with gaseous species. Comparatively the performance was better with MERRA-2. The relatively lower performance with in situ comparison may be due to the grid size, as in situ observations are affected by local emission sources as well the deficiencies in emission inventory. However, the inclusion of all aerosol effects greatly improved simulated rainfall performance with the NE India regional average IOA being 0.52, ME 3.72 mm d−1 and RMSE 13.55 mm d−1 compared to only considering direct + semi-direct effects (IOA: 0.40, ME: 9.22 mm d−1, RMSE: 21.26 mm d−1) in Barman and Gokhale (2022). The improvement in performance and decrease in ME show that the indirect effect played a major role during this period in controlling and suppressing rainfall.
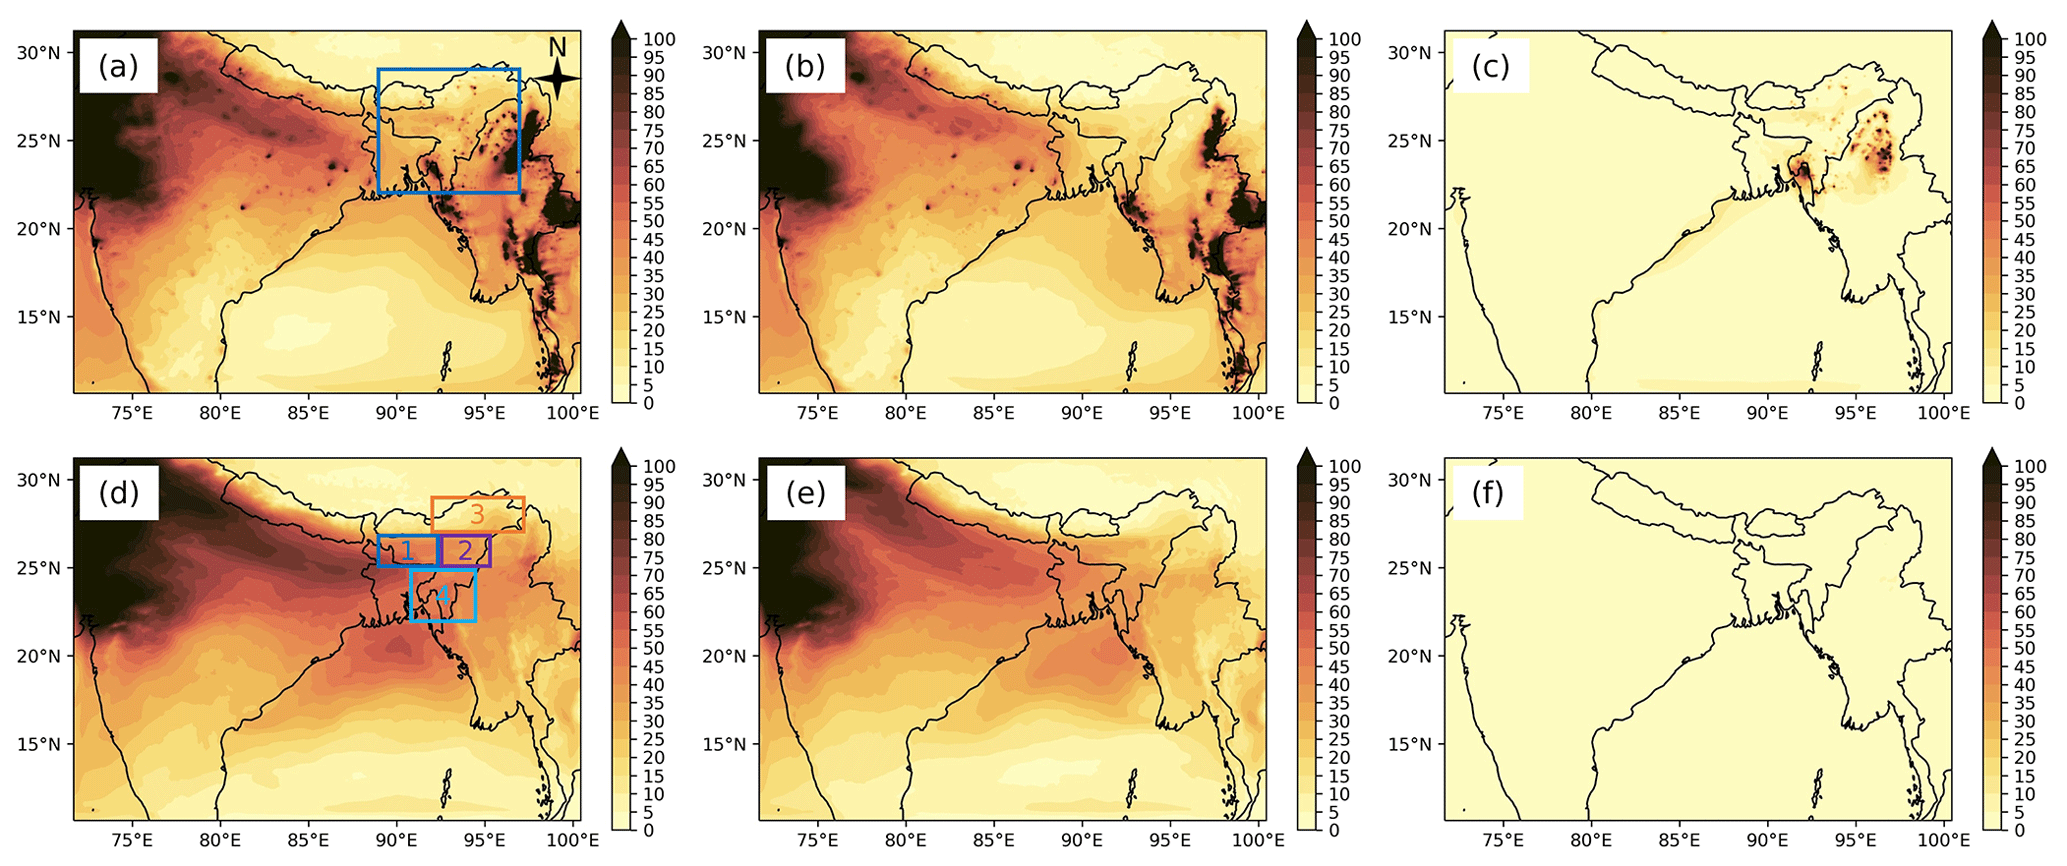
Figure 1Spatial distribution of PM10 concentration (µg m−3) in NOR-I (a, d), No_EMISS_NE (b, e) and Only_EMISS_NE (c, f). Upper row shows distribution at model level 0 (near surface) and the lower row at model level 15.
3.1 PM10 spatial and vertical distribution
Figure 1 shows the time-averaged spatial distribution of the PM10 concentration. The NE India region was divided into four regions based on the proximity from the IGP, shown in Fig. 1d. Region 1 and region 2 fall along the Brahmaputra River valley, with region 1 being the closest to the IGP. Region 3 is mostly a mountainous region, and 4 is the southern region closer to the Bay of Bengal. The spatial distributions of the geopotential heights of model level 0 and 15 are shown in Fig. S1, while region-wise (Fig. 1d) concentration values within NE India at the two atmospheric heights are shown in Table S4. PM10 concentration contours shown in Fig. 1a, b, d and e, emanating from the IGP and spreading into NE India, indicated the transport of aerosols from the IGP into NE India. The similarity of these spatial distributions of No_EMISS_NE to the baseline scenario, NOR-I, especially within the NE India region, inferred that most of the aerosol mass within NE India was contributed by transported aerosols, while PM10 emitted or formed over NE India remained mainly confined within the region as shown in Fig. 1c, possibly due to the mountainous terrain, as also described in Kundu et al. (2018). The transport of PM10 can also be seen from Fig. 2, in which the streamline's arrow from the IGP to NE India shows the transport of air mass, and the colour of the streamlines shows the PM10 mass flux in . The flux was higher over the IGP.
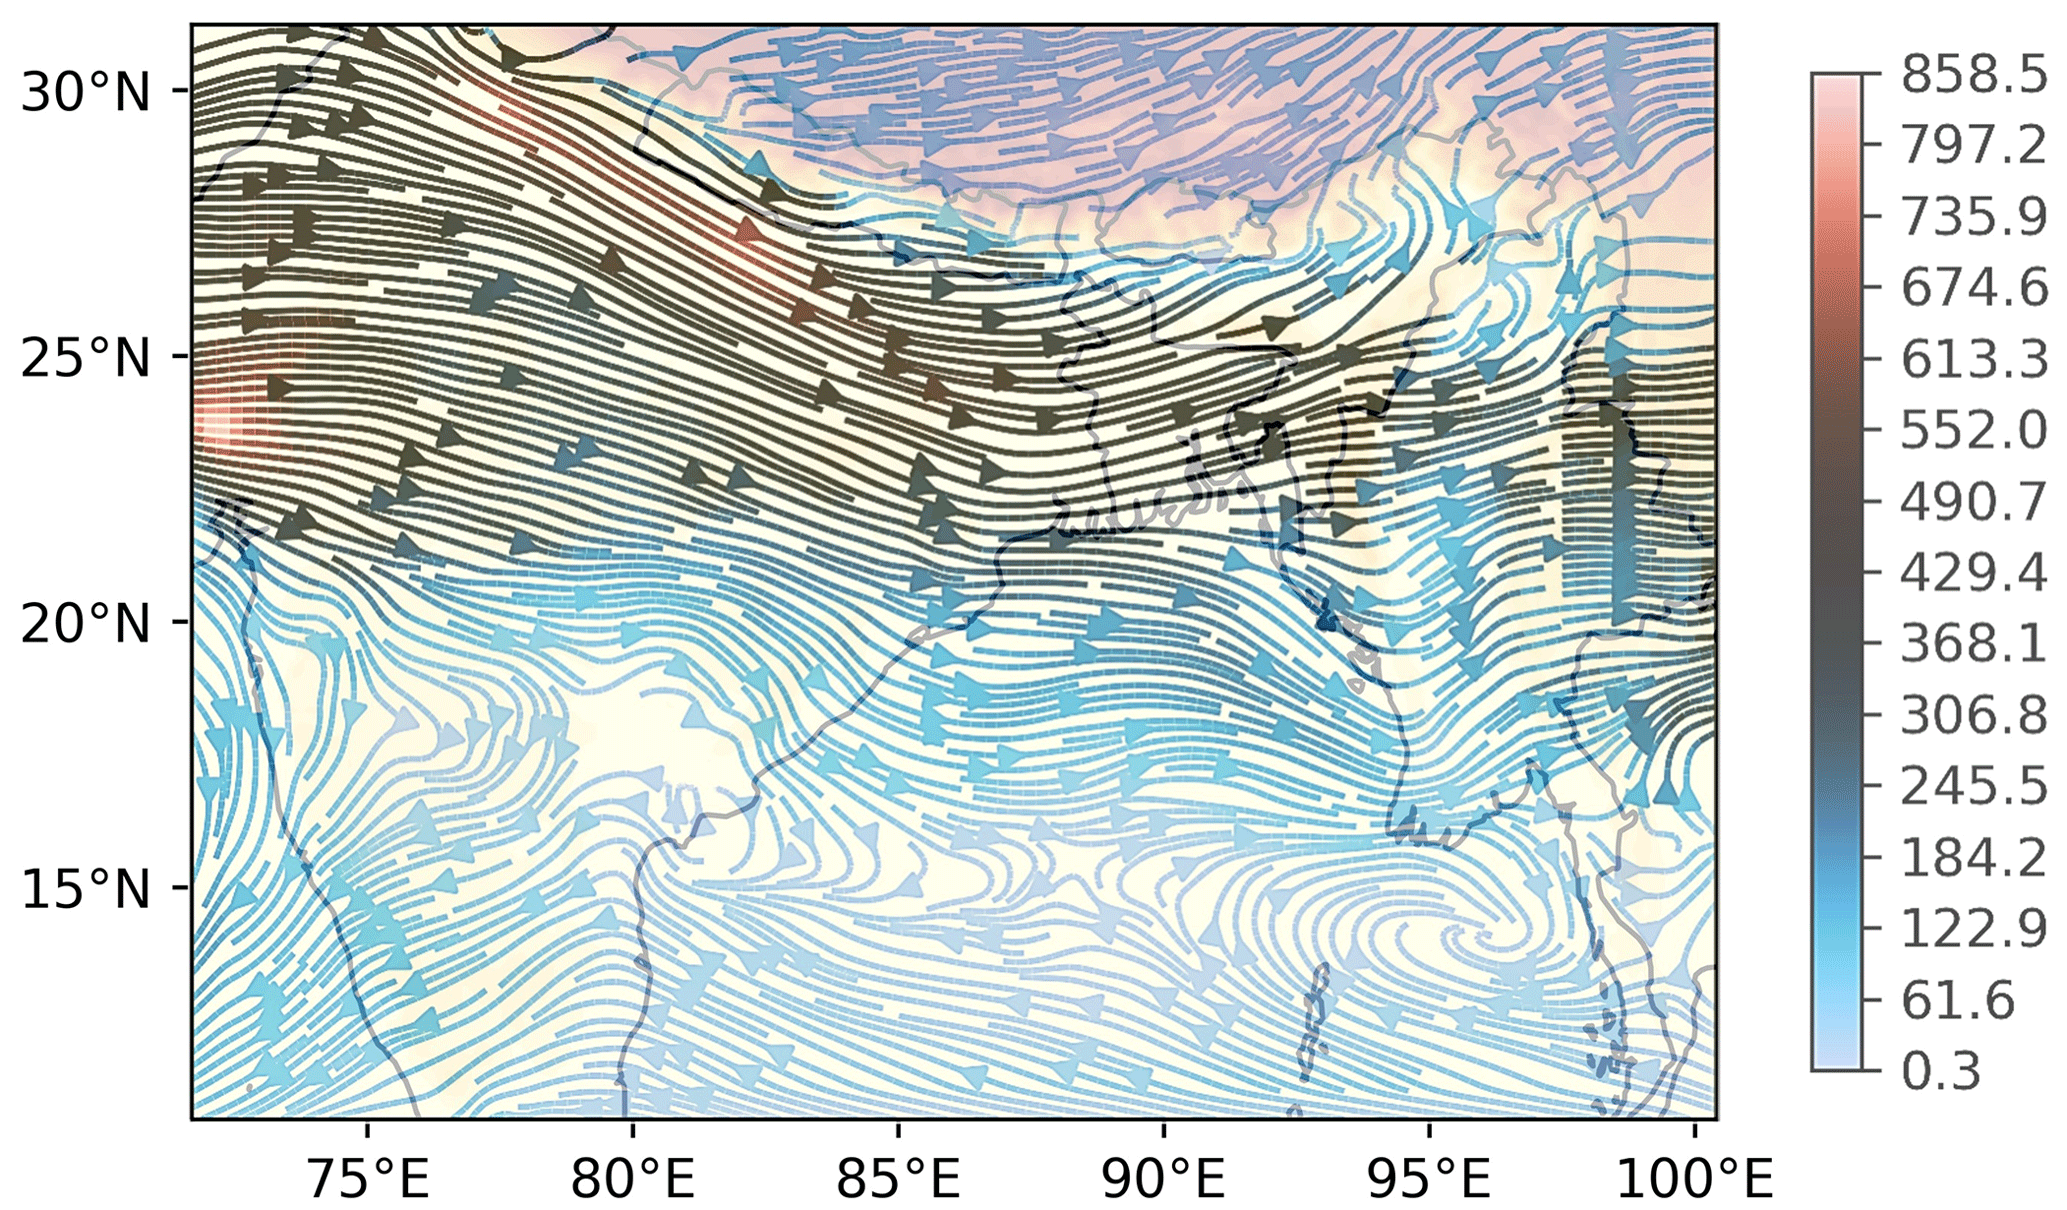
Figure 2Streamlines showing transport of air mass from the IGP to NE India and PM10 mass flux () at 1300 m above terrain.
Both near the surface and at higher atmosphere (level 15), No_EMISS_NE showed a higher regional average concentration (surface: 14.46 µg m−3, higher atmosphere: 24.43 µg m−3), which was closer to the baseline scenario of NOR-I (surface: 27.43 µg m−3, higher atmosphere: 34.13 µg m−3), compared to the local emission scenario of Only_EMISS_NE (surface: 8.07 µg m−3, higher atmosphere: 0.98 µg m−3). Thus, transported aerosols contributed a higher PM10 concentration (64.18 %) than local emissions, and the contribution from local emissions was negligible at the higher atmosphere, as also seen in Fig. 1f, and 96.14 % of it was contributed by transported aerosols. The higher concentration at the higher atmosphere was due to transported aerosols developing an elevated PM10 profile (Fig. S2) having maximum concentration near 2000 m and which shows much greater similarity with the baseline scenario. The long-range transport and strong convective active during this season are responsible for the elevated profile (Pathak et al., 2016). Hence, transported aerosols contributed to the bulk of the aerosols over NE India throughout the atmospheric column (93.98 %), indicated by the column-integrated PM10 mass of 313.97 g m−2 (No_EMISS_NE) and 20.08 g m−2 (Only_EMISS_NE). NOR-I had a column-integrated PM10 mass of 466.63 g m−2. Further analysis indicated that transported aerosols accounted for >50 % of BC, organic carbon, sulfate, nitrate, ammonium and dust aerosol mass over NE India's atmosphere, as the column-integrated mass for these species in No_EMISS_NE were 4.55, 19.59, 51.66, 2.20, 13.74 and 207.82 g m−2, respectively, while it was 0.94, 6.51, 1.79, 0.12, 0.56 and 6.60 g m−2, respectively, in Only_EMISS_NE. The spatial distribution of the column-integrated mass of these species can be seen in Figs. S3, S4, S5, S6, S7 and S8. Region 1, being in close proximity to the IGP, as seen in Fig. 1c, received maximum near-surface aerosol mass (73.70 %) from transported aerosols compared to the other regions, followed by region 2 (66.86 %), 3 (60.48 %) and 4 (57.43 %). However, even though No_EMISS_NE and Only_EMISS_NE are the bifurcations of NOR-I into two separate emission regions, the sum of No_EMISS_NE and Only_EMISS_NE column-integrated mass as well as concentrations did not equate to NOR-I values and are always less than them. This indicated formation of extra aerosol mass is due to the interaction of emissions of the two regions.
3.2 Aerosol effects of local and transported aerosols on radiative forcing
RF due to different aerosol effects was estimated based on the methodology described in Sect. 2. Further details regarding its estimation are provided in the Supplement.
The baseline scenario indicated that direct and indirect aerosol effects caused net (NET) surface and top-of-the-atmosphere (TOA) dimming while causing atmospheric heating, as seen in Fig. 3. This is due to the presence of aerosols that scatter and absorb solar radiation, reducing it at the surface, while increasing it at the top of the atmosphere, as well as causing atmospheric heating. Net direct surface, TOA and atmospheric RF were −15.34, −7.49 and 7.85 W m−2 and were mainly contributed by short-wave (SW) radiation. The indirect effect had the same effect on solar radiation as the direct effect and was due to the formation of numerous smaller cloud droplets, which have better reflectivity to solar radiation, also known as the first indirect effect or Twomey effect (Twomey, 1977). However, positive atmospheric RF (18.20 W m−2) causing atmospheric heating (10.06 W m−2) was mainly caused by long-wave (LW) radiation (16.22 W m−2) at the TOA, contributed by the indirect effect. This was due to greater cloud cover (Fig. S9) at 8–10 km, which is not seen in the other two scenarios. The indirect effect also caused warming at the surface (6.17 W m−2), as it contributed to greater cloud cover (Nandan et al., 2022) and caused heating of the surface through LW radiation. The total net surface RF was −27.88 W m−2, out of which −23.92 W m−2 or 85.80 % was contributed by indirect forcing. Indirect SW forcing (−30.08 W m−2) was almost twice the direct SW forcing (−15.82 W m−2), while semi-direct SW forcing (+11.58 W m−2) was ∼75 % of the direct forcing. The semi-direct effect showed positive surface RF due to cloud cover reduction. Thus, atmospheric heating and the subsequent evaporation of clouds compensated to a large extent to the reduction in solar radiation due to aerosols. The atmospheric RF (0.76 W m−2) due to the semi-direct effect was due to LW radiation, which may be due to increased solar radiation at the surface, which released the heat into the atmosphere in the form of LW radiation. However, this value was very small. The indirect RF contributed the most to the total surface, TOA and atmospheric RF at both SW and LW wavelengths and hence was found to be the dominant aerosol effect affecting radiation over NE India.
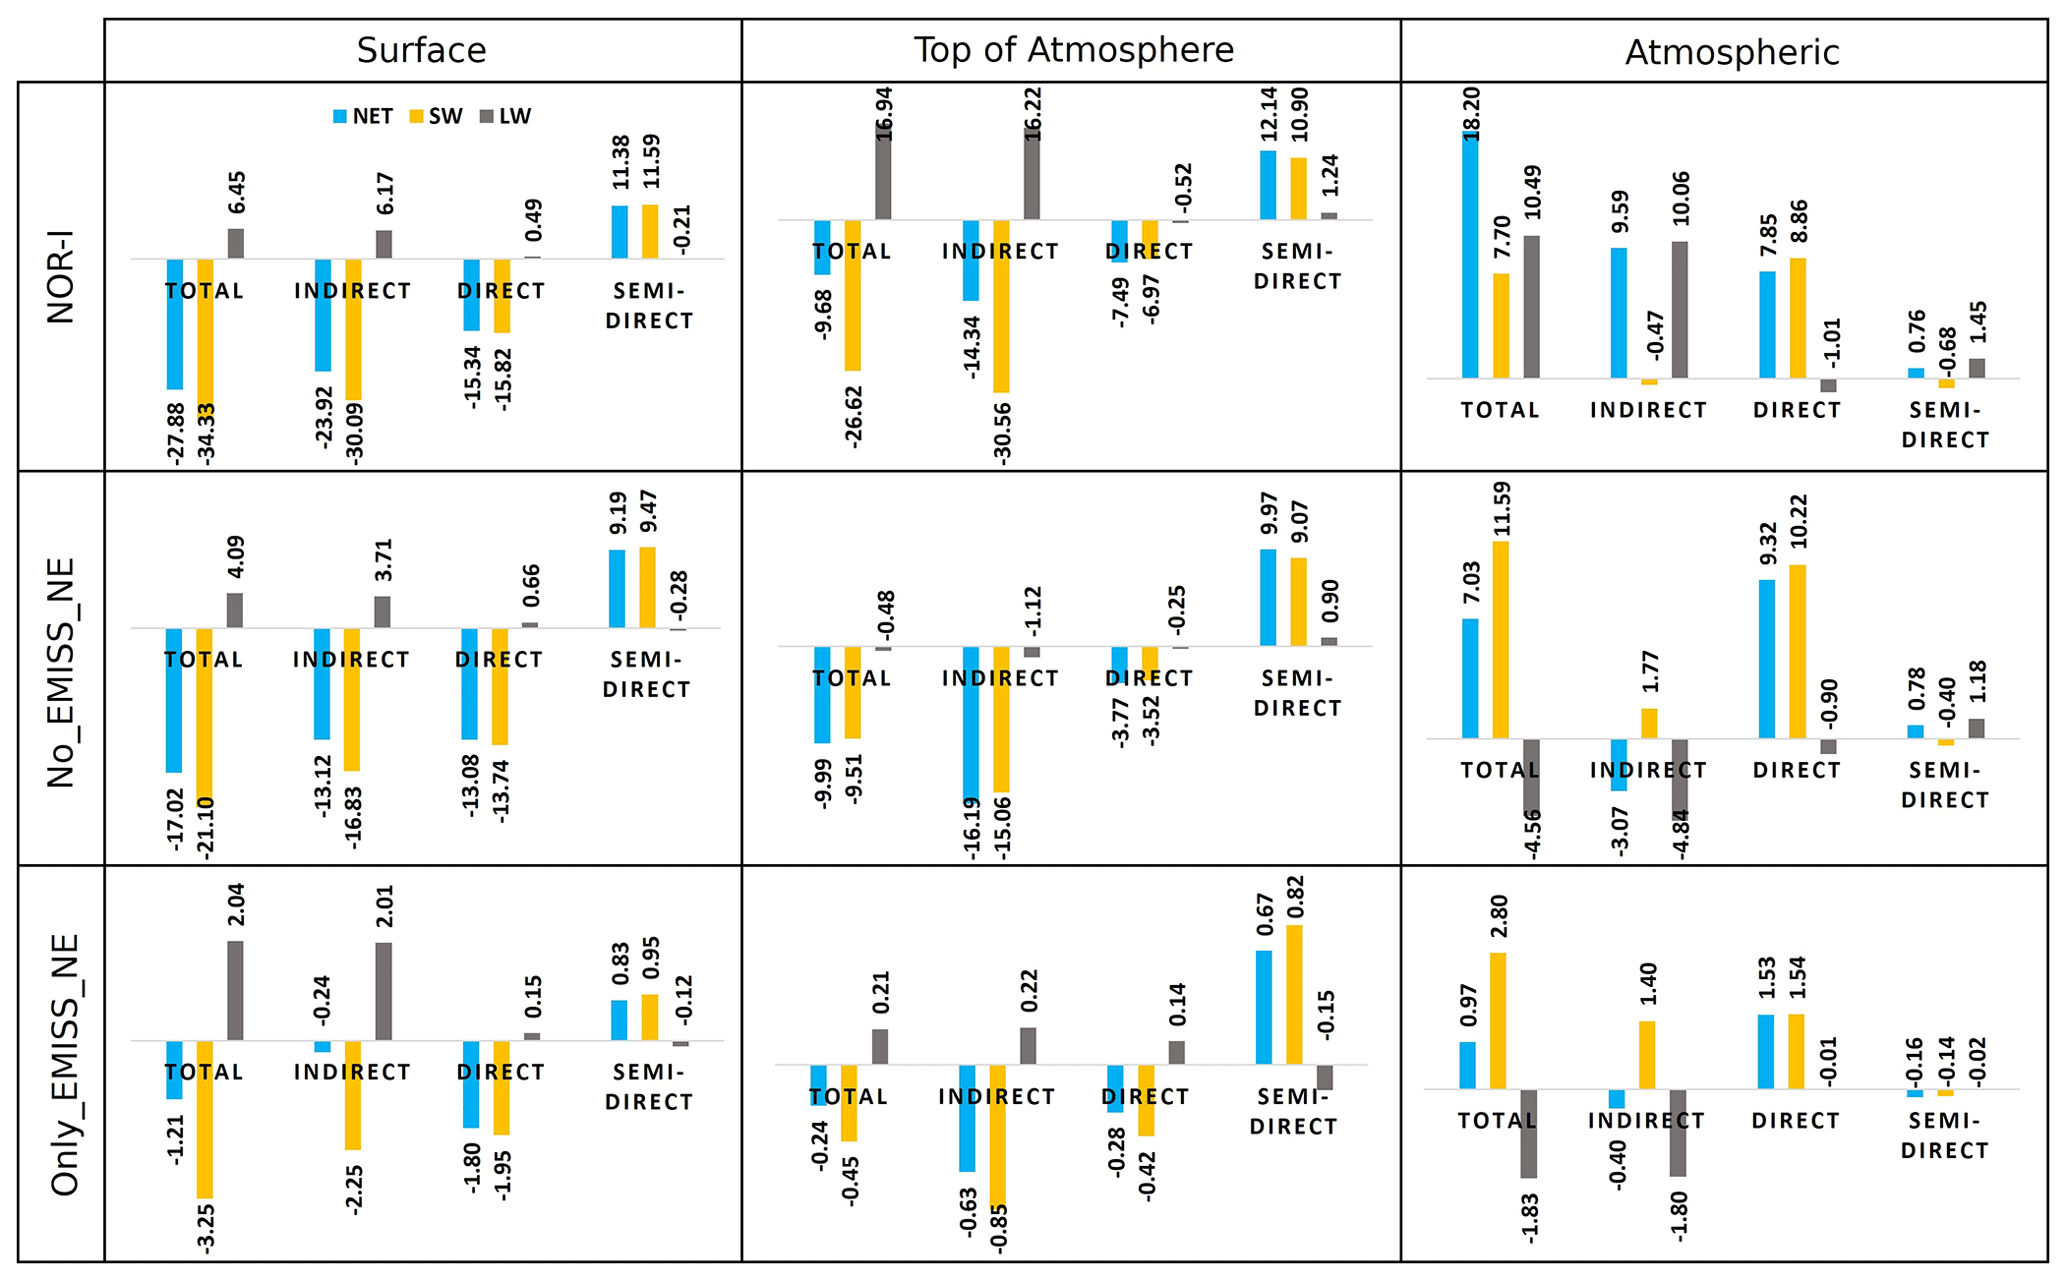
Figure 3NE India regional average RF (W m−2) due to different aerosol effects at NET, SW and LW wavelengths in different emission scenarios.
Quantitatively, No_EMISS_NE provided RF values (surface: −17.02 W m−2, TOA: −9.99 W m−2 and atmospheric RF: 7.03 W m−2) that were more similar and closer to the baseline scenario (surface: −27.88 W m−2, TOA: −9.68 W m−2 and atmospheric RF: 18.20 W m−2) than Only_EMISS_NE (surface: −1.21 W m−2, TOA: −0.24 W m−2 and atmospheric RF: 0.97 W m−2). Consequently, the No_EMISS_NE net indirect, direct and semi-direct surface RF values of −13.12, −13.08 and 9.19 W m−2 were significantly larger than the corresponding Only_EMISS_NE RF values of −0.24, −1.80 and 0.83 W m−2. A similar conclusion could also be inferred at TOA. Hence transported aerosols were primarily responsible for all the different aerosol effects on radiation over NE India, as a greater amount of aerosol mass was contributed by it. Moreover, No_EMISS_NE net direct atmospheric RF (9.32 W m−2) was found to be even higher than the baseline scenario (7.85 W m−2). This indicated that the NE India region contained more scattering aerosols, while transported aerosols contained more absorbing aerosols, as the difference in the direct atmospheric RF is mainly driven by changes in the TOA RF (−7.49 vs. −3.77 W m−2) than surface RF (−15.34 vs. −13.08 W m−2). Region 1 had the highest direct and semi-direct net surface RF of −20.41 and 19.20 W m−2, respectively, due to its close proximity to the IGP.
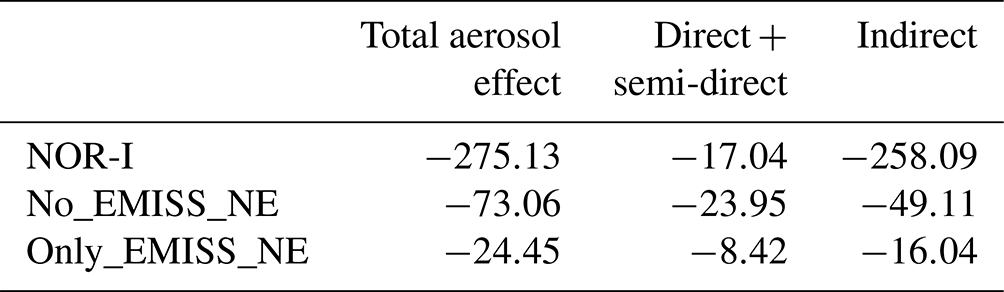
Table 3Changes in rainfall due to different aerosol effects in different scenarios (mm).
3.3 Aerosol effects of local and transported aerosols on rainfall
The quantitative changes in regional average rainfall amounts over NE India due to the different aerosol effects induced by the aerosols in different scenarios are provided in Table 3. Region-wise values can be read from Table S5. Rainfall from region 4 was not considered due to large errors being associated with it (Fig. S10). In the baseline scenario (NOR-I), the total aerosol effect caused rainfall suppression in all three regions, with a regional total of −275.13 mm, shown in Table 3. Reductions in rainfall due to the total aerosol effect were contributed by suppressions due to both the direct + semi-direct and indirect effect and were observed in all the considered regions. The highest suppression was observed in region 3 (−102.60 mm), followed by region 1 (−100.60 mm). The role of the direct + semi-direct effect was observed to be minimal with a total regional suppression of −17.04 mm, while the indirect effect (−258.09 mm) was responsible for almost the whole of the suppression of −275.13 mm. Region 1 observed the highest suppression of −13.21 mm due to the direct + semi-direct effect, as this region's radiation was impacted the most by these effects.
The direct effect could suppress rainfall by reducing surface evaporation and convection through surface dimming, while the semi-direct effect by the evaporation of clouds (Talukdar et al., 2019; Lohmann and Feichter, 2001; Habib et al., 2006; Bollasina et al., 2011; Koch and Del Genio, 2010). However, the surface dimming by the indirect effect (−23.92 W m−2) with NOR-I was much larger than the combined direct + semi-direct effect (−3.96 W m−2). Hence the reduction in the surface moisture flux due to the indirect effect ( kg m−2 s−1) was much greater than due to the combined direct + semi-direct effect ( kg m−2 s−1) and very similar to the reduction due to the total aerosol effect ( kg m−2 s−1). This was also observed in the case of No_EMISS_NE. The greater surface dimming of −17.02 W m−2 in No_EMISS_NE caused a much higher negative surface moisture flux change of kg m−2 s−1 due to the total aerosol effect, mostly contributed by the indirect effect ( kg m−2 s−1) compared to the direct + semi-direct effect ( kg m−2 s−1). Hence, the indirect effect in NOR-I and No_EMISS_NE dominated moisture reduction through the reduction in the surface moisture flux over most areas of NE India at both low- and high-terrain regions, as seen in Fig. 4.
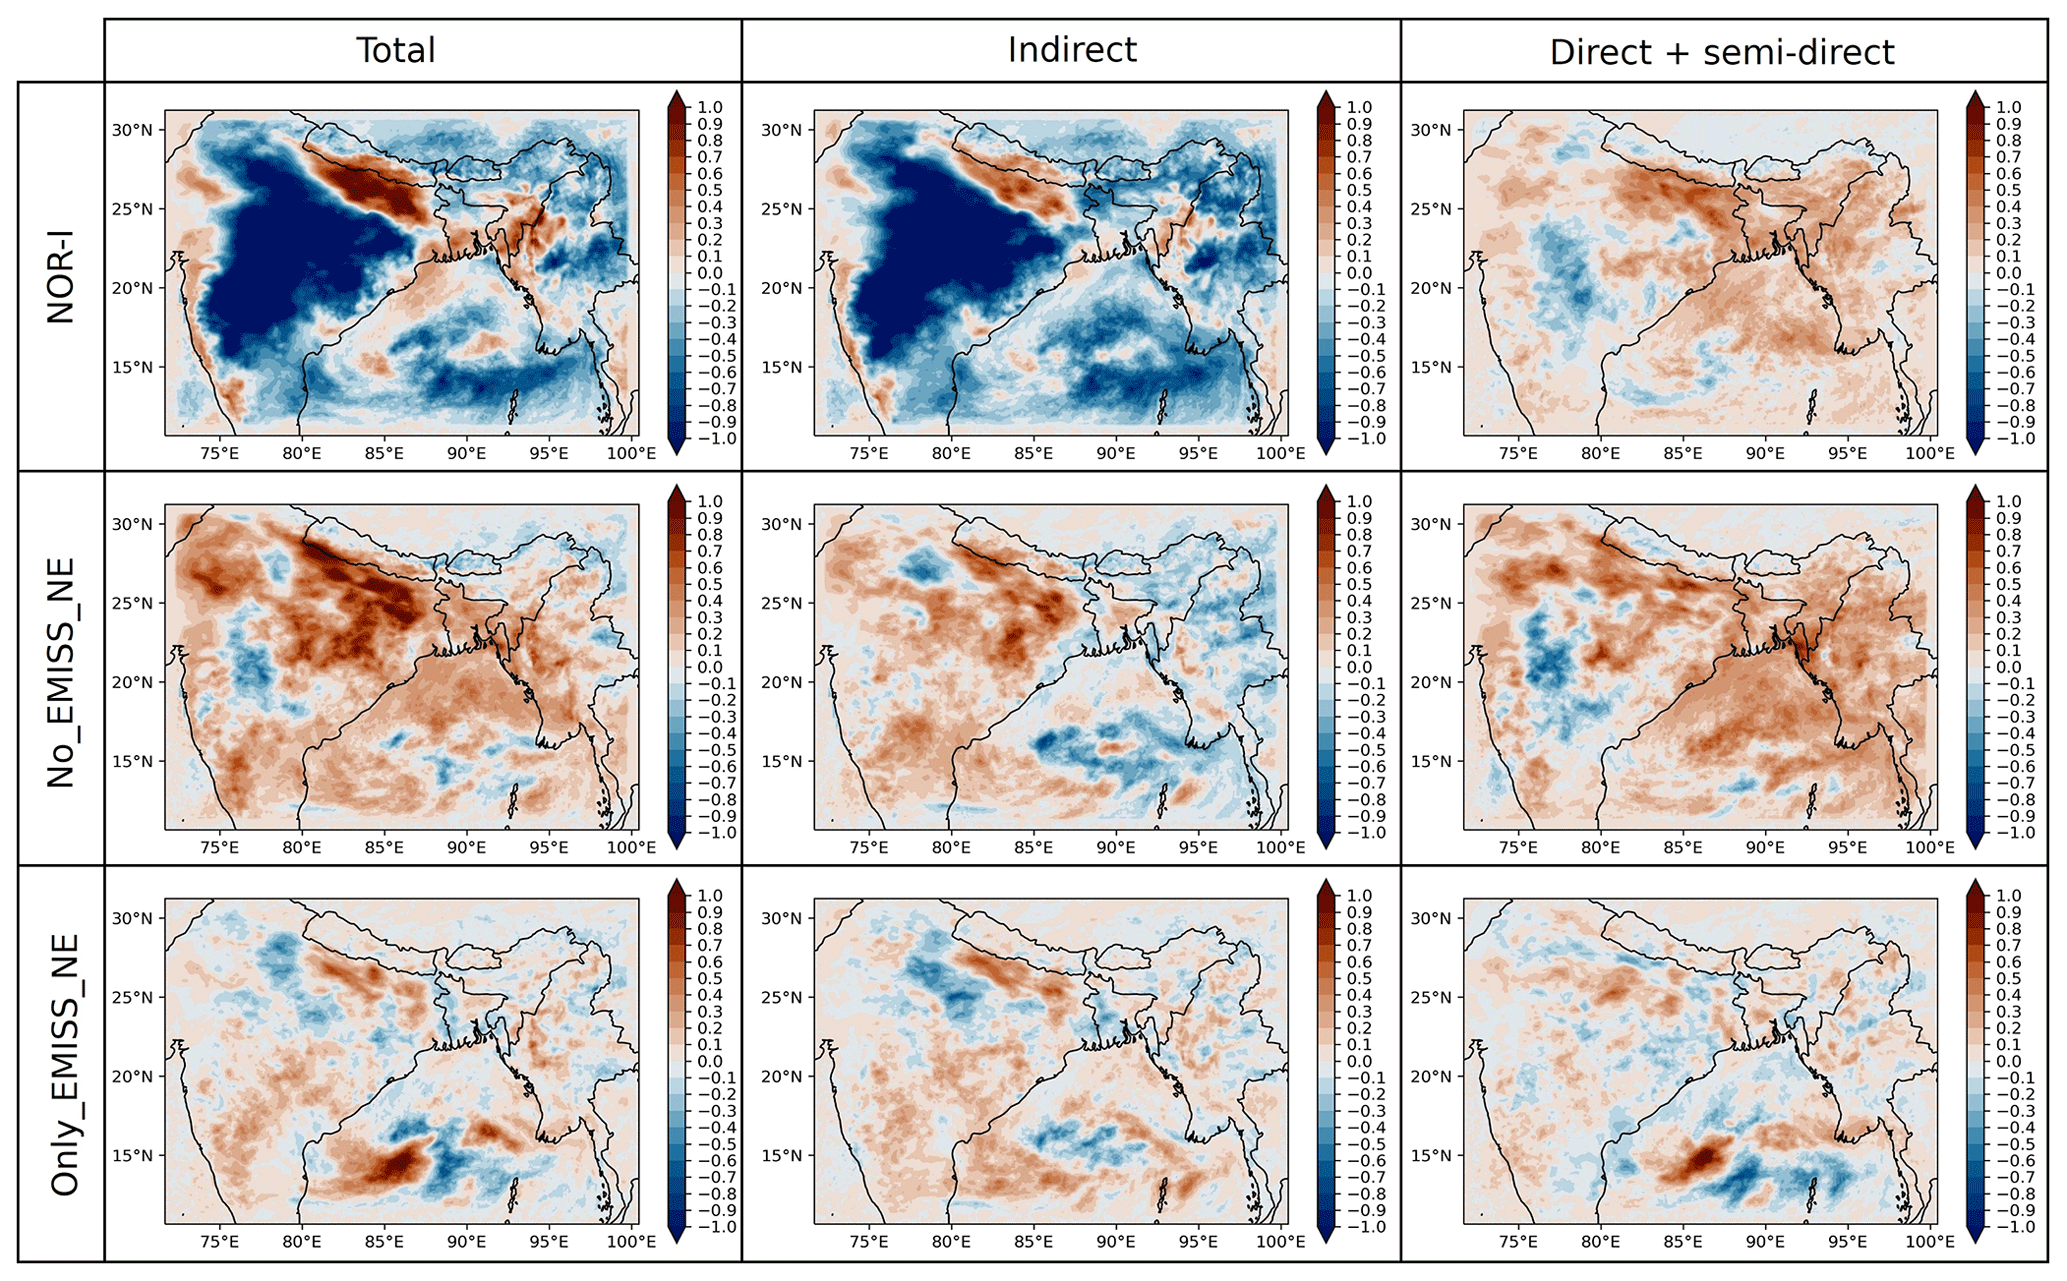
Figure 4Spatial distribution of change in near-surface water vapour mixing ratio (g kg−1) due to the total aerosol effect, direct + semi-direct effect and indirect effect.
However, the direct + semi-direct effect caused an increase in moisture in NOR-I and No_EMISS_NE over most of NE India in spite of a negative surface moisture flux not observed in Only_EMISS_NE. This indicated that the direct + semi-direct effect caused an increase in the transport of moisture from another region, in this case from the Bay of Bengal. The equivalent potential temperature (EPT) profiles in Fig. 5 compared the atmospheric stability due to different aerosol effects. The greater surface dimming due to the indirect effect in No_EMISS_NE caused not only a negative surface moisture flux but also a significant increase in atmospheric stability (indicated by the increasing value of the indirect effect EPT profile with height), reducing convection, which possibly also contributed to the reduction in rainfall suppression. However, although the direct + semi-direct EPT profile showed increased atmospheric stability below 1 km, it created an overall unstable atmosphere in the lower atmosphere. This instability, primarily caused due to atmospheric heating of BC, created an unstable region over NE India, which facilitated the increased transport of moisture from the Bay of Bengal (discussed later). Hence, the direct effect reduces rainfall by reducing surface moisture flux and convection but also possibly enhances it by transporting moisture. This transported moisture possibly compensated to some extent to the rainfall reduction due to a decrease in surface moisture flux, convection and cloud evaporation caused by direct and semi-direct effects. Hence, the rainfall reduction due to the direct + semi-direct effect (−17.04 mm) was possibly significantly less than in the indirect effect (−258.09 mm). Thus, the effect of direct and indirect effects on dynamics was distinctly different. The EPT profile of the total aerosol effect in No_EMISS_NE showed an unstable lower atmosphere, supporting moisture transport. A similar explanation could be given for the moisture increase due to the direct + semi-direct effect in NOR-I, but the increase in atmospheric stability and moisture reduction due to greater surface dimming by its indirect effect was significantly larger, which created an overall stable atmosphere due to the total aerosol effect in NOR-I. The EPT profiles of Only_EMISS_NE showed almost zero perturbation throughout the atmosphere and hence was unable to affect atmospheric stability and cause moisture transport. Thus, the direct + semi-direct effect in Only_EMISS_NE did not show significant moisture change in Fig. 4. Moreover, the significantly smaller surface dimming (−1.21 W m−2) in Only_EMISS_NE caused a very small but positive change of kg m−2 s−1 due to the total aerosol effect, and hence similar moisture change is observed in Fig. 4. Hence aerosols emitted solely from NE India had negligible capability in affecting moisture through different aerosol effects. Moisture reduction over NE India was much greater due to the indirect effect in No_EMISS_NE compared to Only_EMISS_NE, while moisture increase was much greater in No_EMISS_NE compared to Only_EMISS_NE due to a higher direct + semi-direct effect.
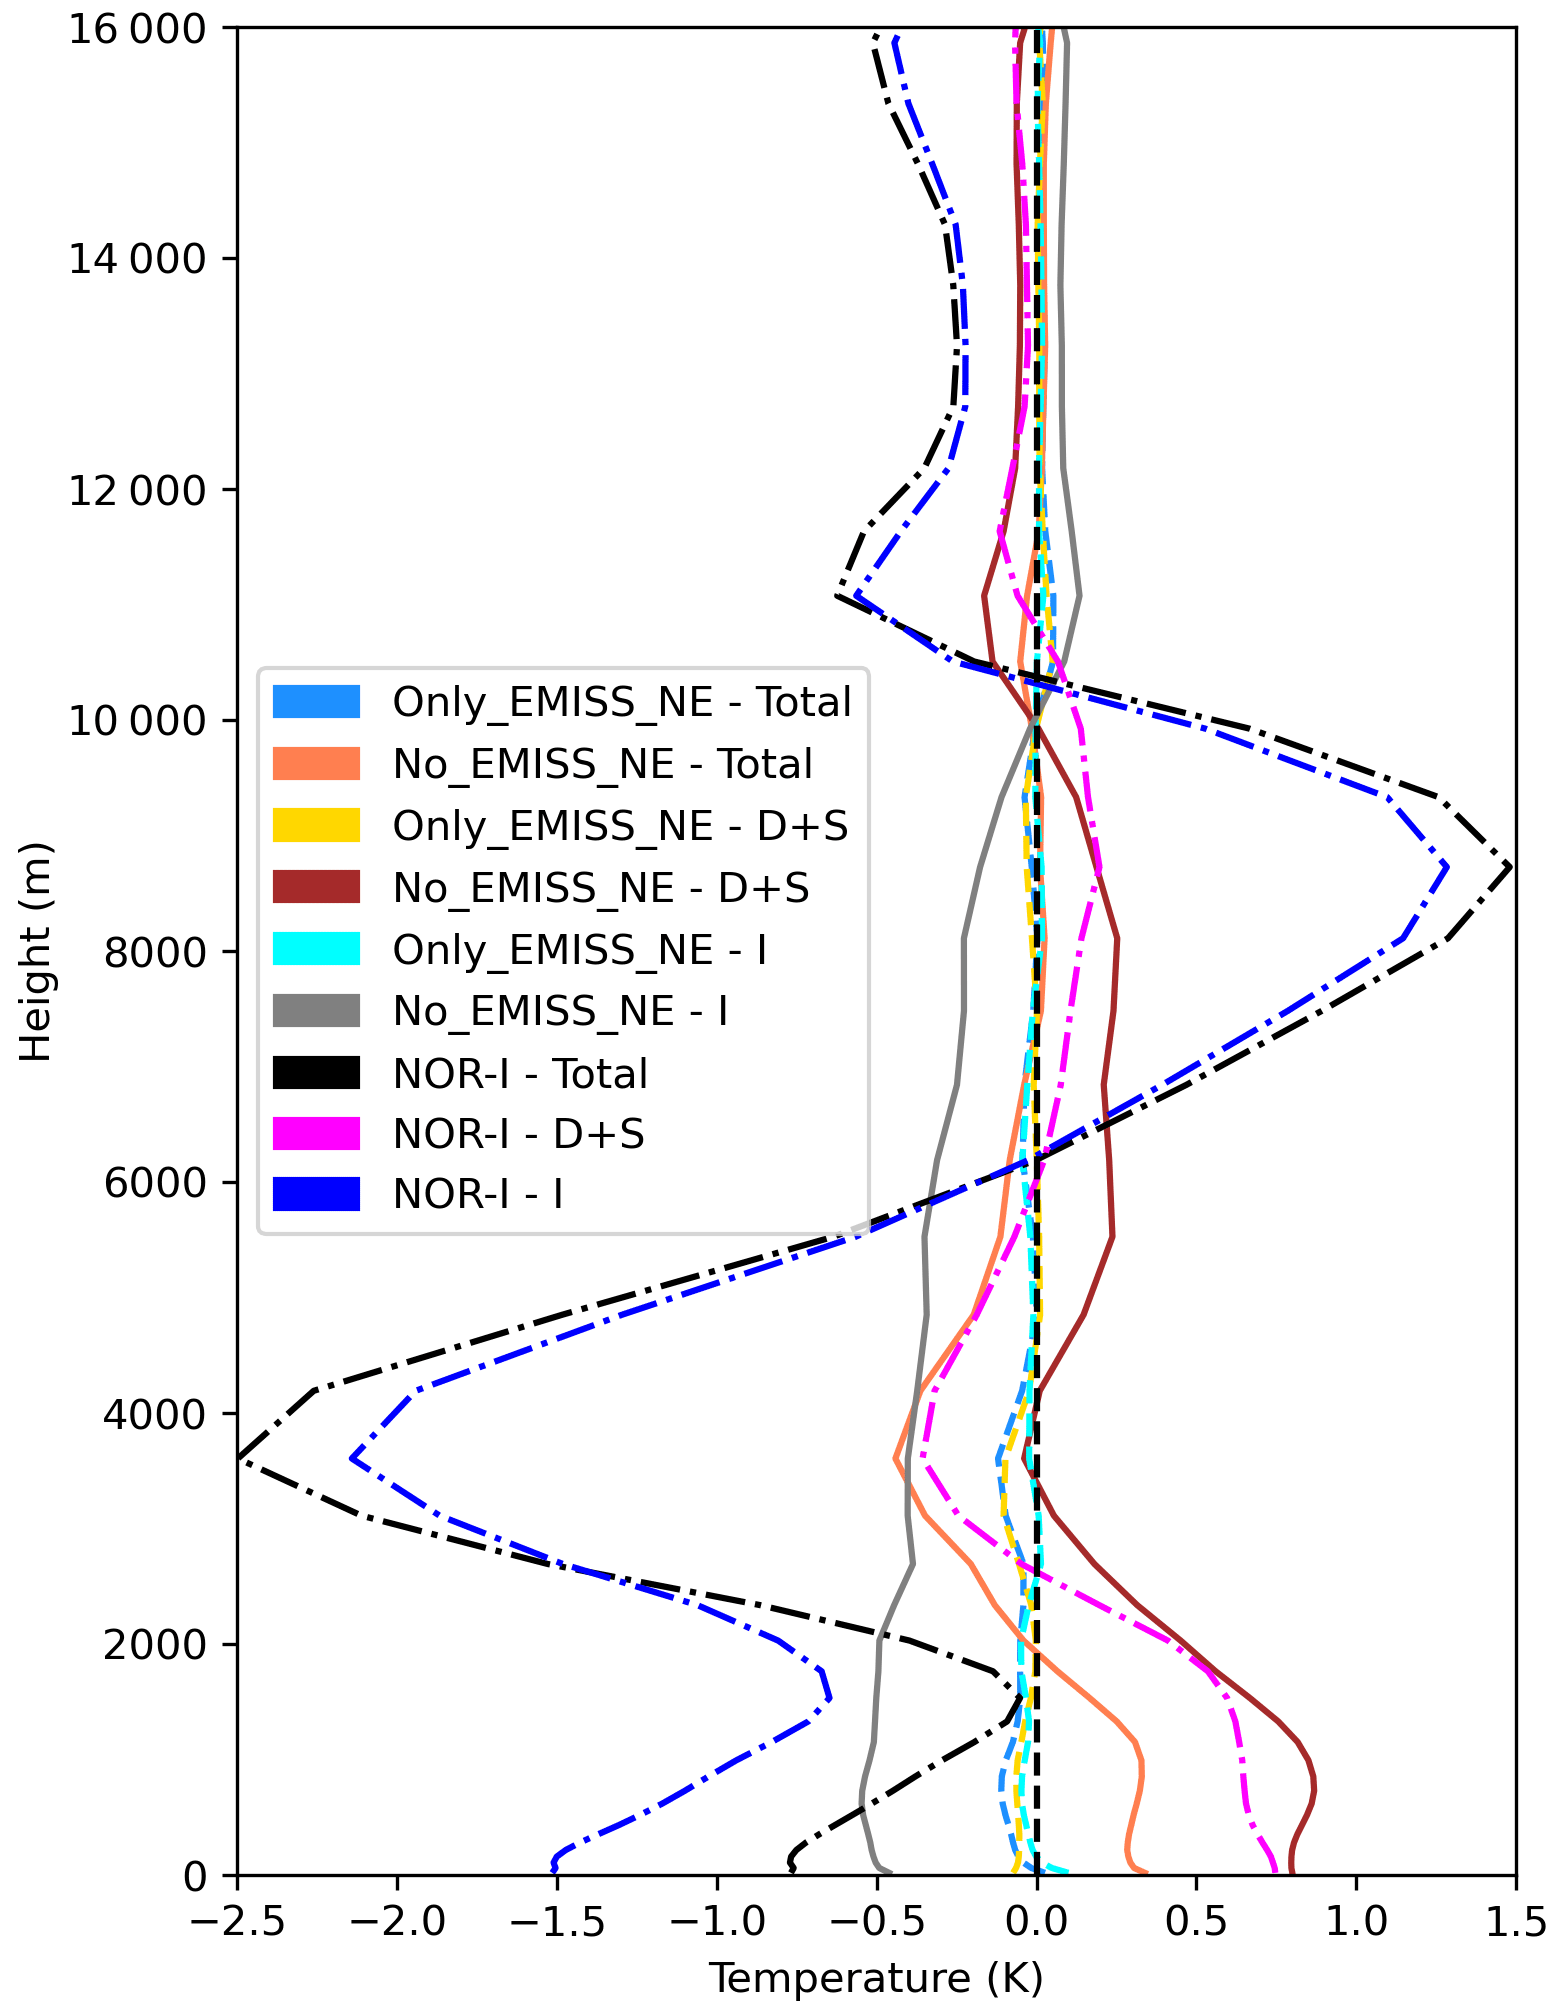
Figure 5Perturbation of EPT (K) due to the total aerosol effect (Total), direct + semi-direct (D + S) effect and indirect (I) aerosol effect in No_EMISS_NE (non-dashed), Only_EMISS_NE (dashed) and NOR-I (dashed–dotted line).
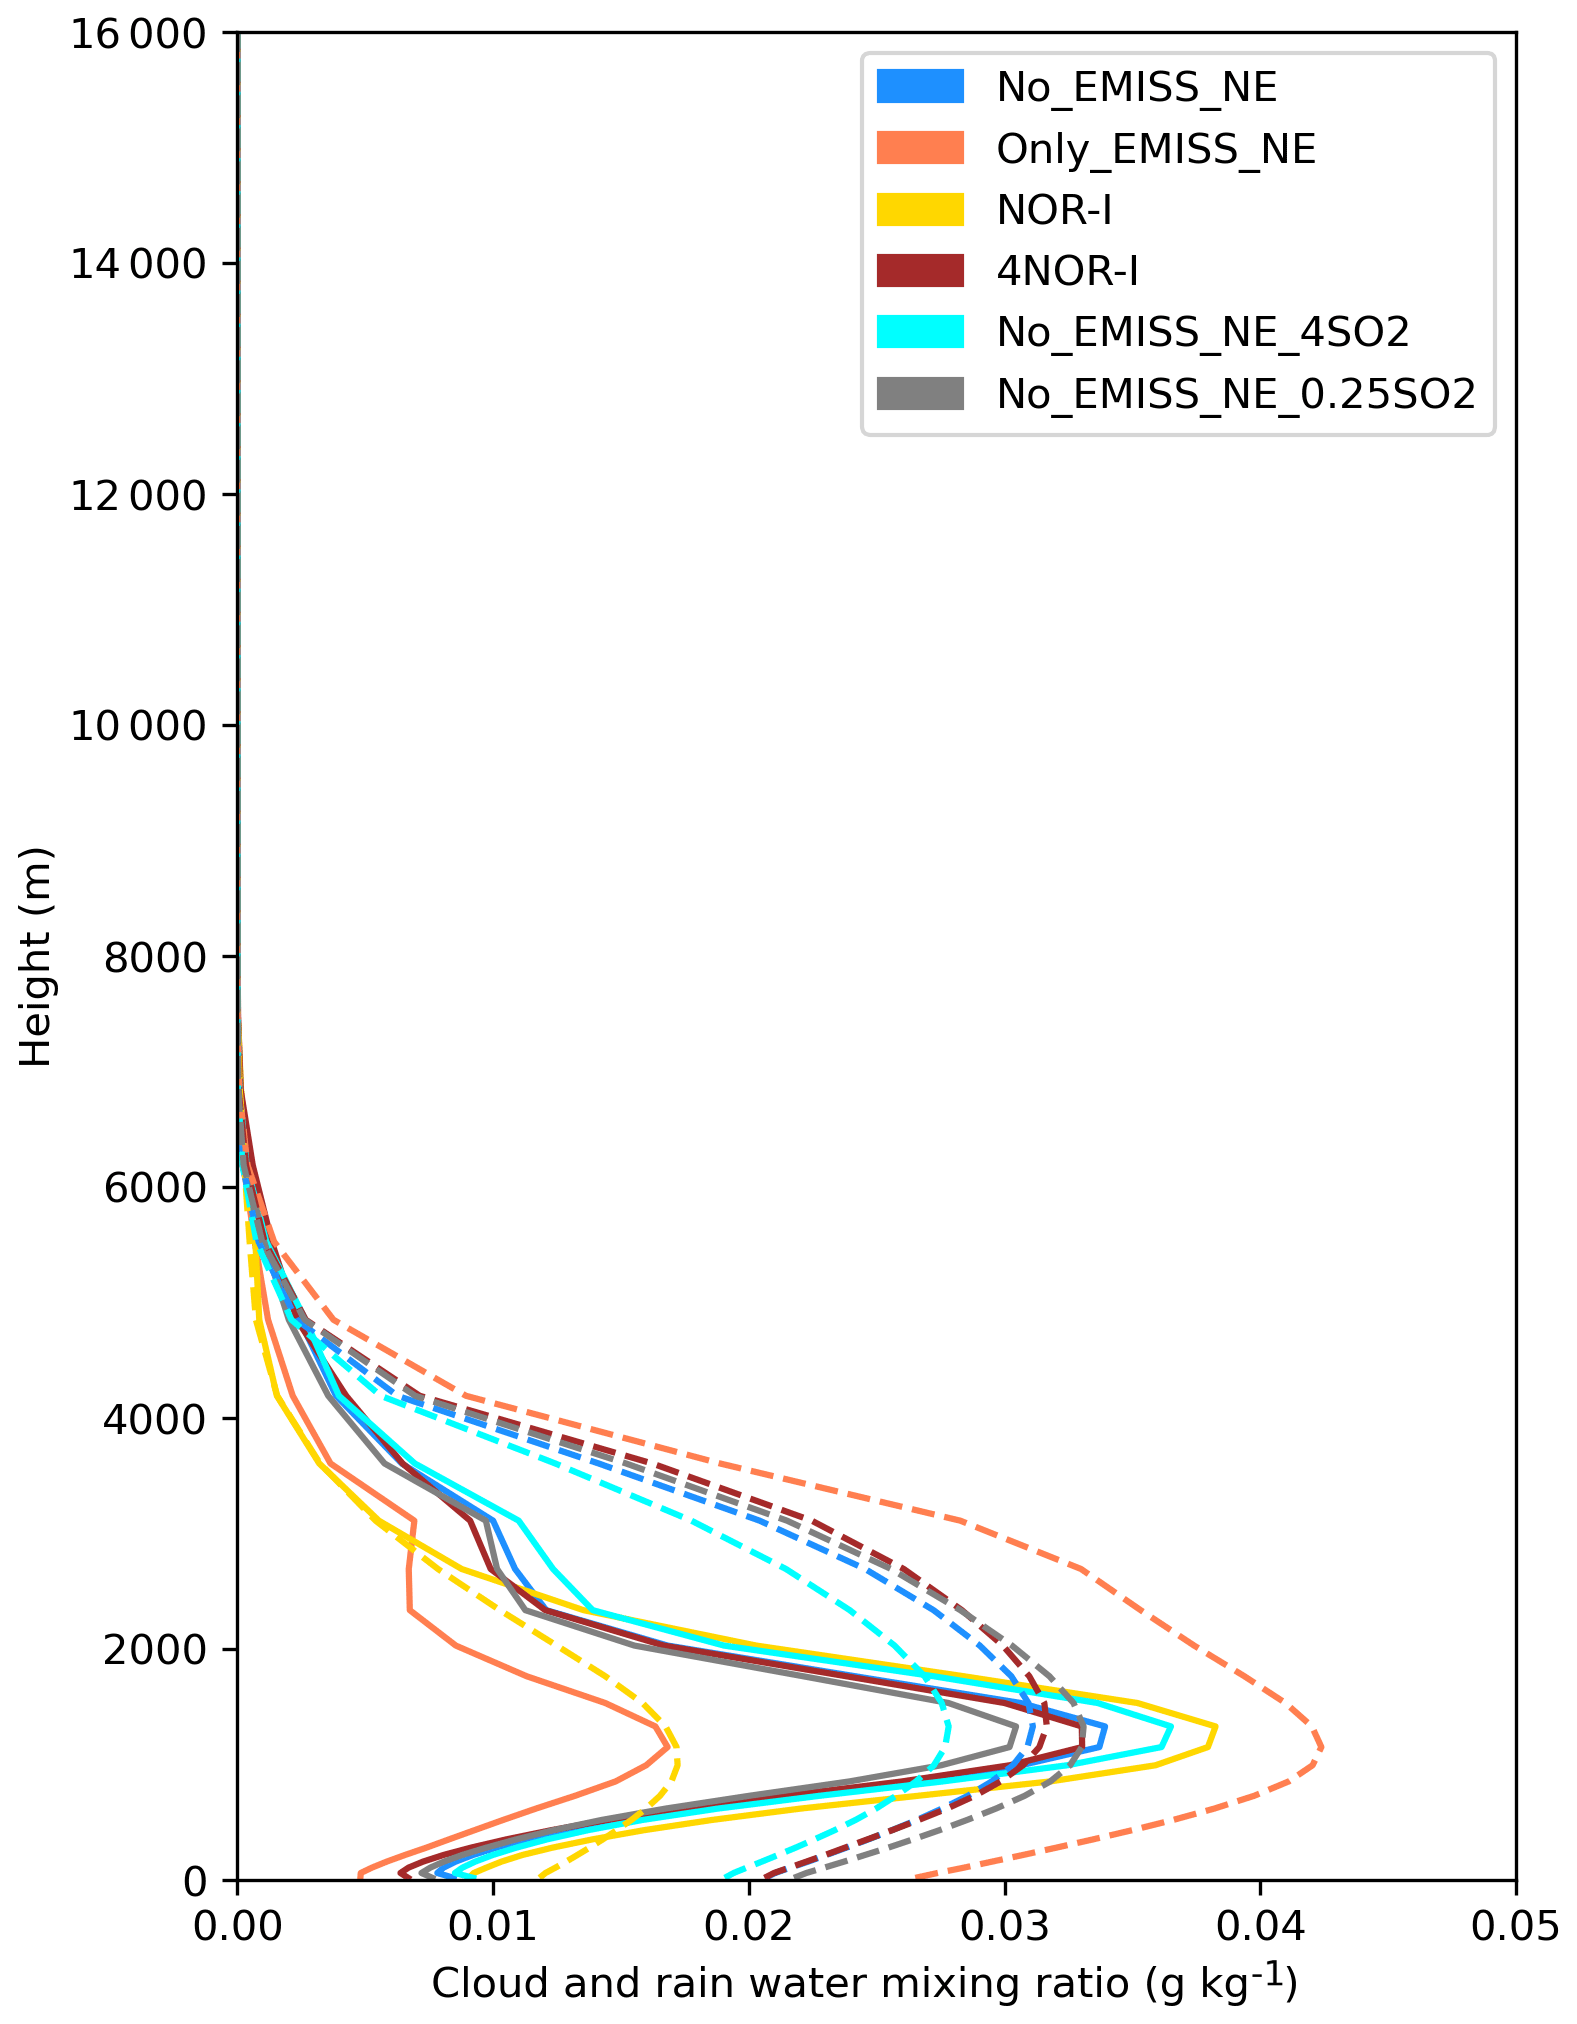
Figure 6NE India regional average vertical profiles of the cloud water mixing ratio (non-dashed) and rainwater mixing ratio (dashed) in different scenarios (g kg−1).
Moreover, the positive NE India regional average difference of the column-integrated cloud condensation nuclei (CCN) number (4.38×10¹⁰ m−2), cloud droplet number (4.42×10¹³ m−2) and cloud water (27.93 g m−2), estimated from No_EMISS_NE–Only_EMISS_NE, indicated that transported aerosols had a greater impact through the aerosol indirect effect (Zhang et al., 2010). The presence of larger aerosol amounts in the form of CCN affects the cloud lifetime by affecting the conversion from cloud water to rainwater, thus, to rainfall, thereby suppressing rainfall, also known as the second indirect effect (Shiogama et al., 2010; Cherian et al., 2017). The presence of a large amount of CCN facilitates condensation of water vapour on numerous CCN particles, producing numerous cloud droplets with smaller radii. This restricts small cloud droplets from growing in size due to the reduction in the interaction with other cloud droplets, which affects its conversion to a rain droplet, and thus to rainfall. Due to more aerosol mass over NE India (Sect. 3.1), NOR-I and No_EMISS_NE had significantly higher cloud water compared to Only_EMISS_NE, as seen in Fig. 6. Consequently, NOR-I and No_EMISS_NE had a significantly lower rainwater mixing ratio than Only_EMISS_NE. Thus, rainfall suppression due to the indirect effect was the highest in NOR-I, followed by No_EMISS_NE and Only_EMISS_NE. Hence, the combined effect of reduction in moisture, instability and rainfall formation contributed to the reduction in rainfall through indirect and total aerosol effects. This could be a possible key mechanism associated with the decreasing rainfall trend in the region. Reduction in moisture due to the direct effect of aerosols and evaporation of clouds by BC were found to be possible mechanisms by Barman and Gokhale (2022). However, this study shows that the contribution of direct and semi-direct effects was very small compared to the indirect effect. The indirect effect has been found to be the dominant aerosol effect in many studies (Wang et al., 2015; Liu et al., 2016) and has been found to suppress monsoon rainfall over India (Manoj et al., 2012). The aerosol indirect effect is mainly dictated by the warm clouds (Christensen et al., 2016). Thus, the higher cloud cover associated with NOR-I and No_EMISS_NE in the lower atmosphere, which affected SW radiation more in Sect. 3.2, was due to a greater amount of cloud water in the lower atmosphere.
Moreover, No_EMISS_NE and Only_EMISS_NE simulations were evaluated against the IMD rainfall dataset and NOR-I simulation to check whether the local or transported aerosols had greater control over the rainfall in NE India. No_EMISS_NE showed better regional average rainfall statistics than Only_EMISS_NE with higher IOA (0.48 vs. 0.47), lower RMSE (18.85 vs. 20.37 mm d−1) and lower ME (6.94 vs. 8.22 mm d−1) upon comparing with the IMD rainfall dataset. Also, the simulated rainfall of No_EMISS_NE showed a higher rainfall similarity with NOR-I than Only_EMISS_NE with higher IOA (0.65 vs. 0.63), lower RMSE (56.32 vs. 61.92 mm d−1) and lower ME (39.30 vs. 39.81 mm d−1). Hence, No_EMISS_NE showed more similarity with the baseline scenario as well as observed data and had greater control over the region's rainfall.
3.4 Role of local and transported BC
In Sect. 3.3, the direct effect showed to increase moisture over NE India through an increase in atmospheric instability, caused mainly by atmospheric heating of BC (Barman and Gokhale, 2022) Hence, to negate the effects of the indirect effect on atmospheric dynamics, scenarios in Table 1 containing only direct and semi-direct effects were used in this analysis. Moreover, NOR gave a much better performance with BC concentration estimation (Table S2) than when the indirect effect was included (NOR-I). The results from No_EMISS_NE, Only_EMISS_NE, No_NE_BCI and Only_NE_BCI scenarios were compared and related.
3.4.1 Radiative heating
The regional average vertical profiles of NOR, 2NOR, No_NE_BC, No_NE_2 × BC, Only_NE_BC and Only_NE_2 × BC can be seen from Fig. S11, in which the transported BC and local BC profiles resemble the No_EMISS_NE and Only_EMISS_NE PM10 profiles, respectively. IGP was the dominant source of transported BC (Fig. S12). In transported BC scenarios, BC was available up to a much higher atmospheric height, and profiles showed elevated concentrations at around 1500 m, indicating stronger BC transport at that height. In Only_NE_BC and Only_NE_2 × BC, BC was confined near the surface, which decreased continuously. The atmospheric heating rate (HR) was estimated as per Liou (1980).
where g is the acceleration due to gravity (9.81 m s−2); Cp is the specific heat capacity of air at constant pressure (1.005 kJ K−1 kg−1); ΔF is the atmospheric RF; and ΔP is the atmospheric pressure (300 hPa) difference between the surface and 3 km altitude, as most of the BC was present below this height. Moreover, in order to compare the effectiveness of heating by local and transported BC, two parameters, heating efficiency (HE) and heating slope (HS), were defined by Eqs. (5) and (6).
HE has units of , thus measuring the heating contributed by per unit concentration of BC below 3 km. HE was used to assess the effect of BC vertical distribution on atmospheric heating, while HS was used to assess the response of the atmospheric heating rate to BC concentration changes and has similar units as HE. CC has units of µg m−3.
Table 4NE India region average values of columnar BC concentration (µg m−3) and atmospheric heating parameters in different scenarios.
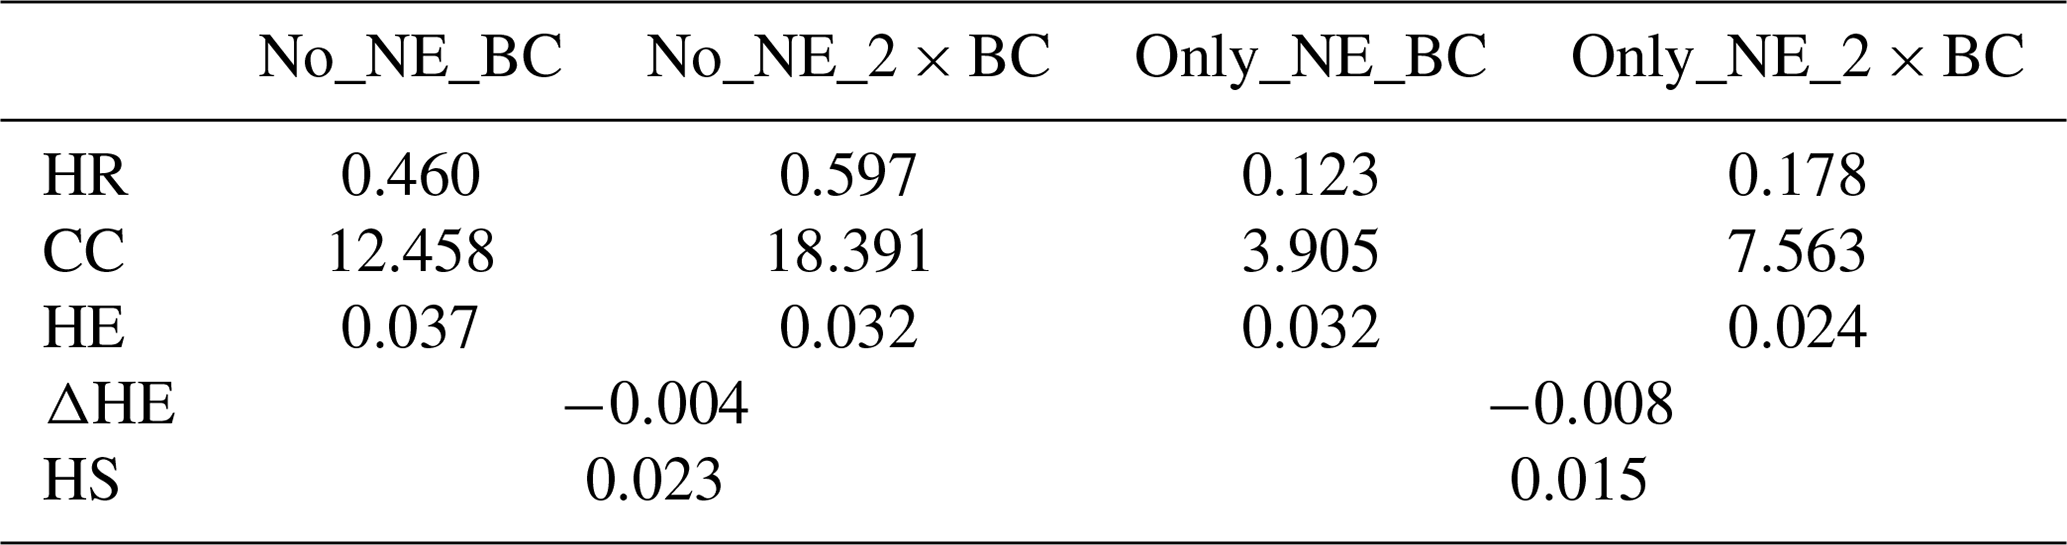
The quantitative values of the parameters are provided in Table 4. Only_NE_BC had a regional net average HR of 0.123 K d−1 compared to 0.460 K d−1 of No_NE_BC. This indicated a 3.73 times higher atmospheric heating rate by transported BC. An increase in local emissions from Only_NE_BC to Only_NE_2 × BC caused a small increase in the heating rate of 0.055 K d−1 compared to the increase of 0.137 K d−1 from No_NE_BC to No_NE_2 × BC. As per the definition, HE was inversely proportional to CC, and this was exactly followed in all regions across all scenarios (Figs. S13 and S14). However, HE was higher in the case of transported BC compared to local BC with values of 0.037 (No_NE_BC) vs. 0.032 (Only_NE_BC) and 0.032 (No_NE_2 × BC) vs. 0.024 (Only_NE_2 × BC), even if CC was higher in the case of transported BC. The reason might be that transported BC might have undergone a higher amount of chemical transformation due to a higher atmospheric time, leading to a higher lensing effect on the BC core, resulting in enhanced absorption (Liu et al., 2015). Also, it was observed that on increasing emissions, the decrease in HE was smaller in the case of transported BC (−0.004 ) than in local BC (−0.008 ). Hence, with the increase in BC emissions, HE decreased more when BC was more concentrated near the surface than in the atmosphere. HS indicated that atmospheric heating increased at a higher rate of 0.023 with increasing transported BC compared to 0.015 . Thus, the increase in transported BC emissions had more impact on atmospheric heating over NE India than when present near the surface with local emissions.
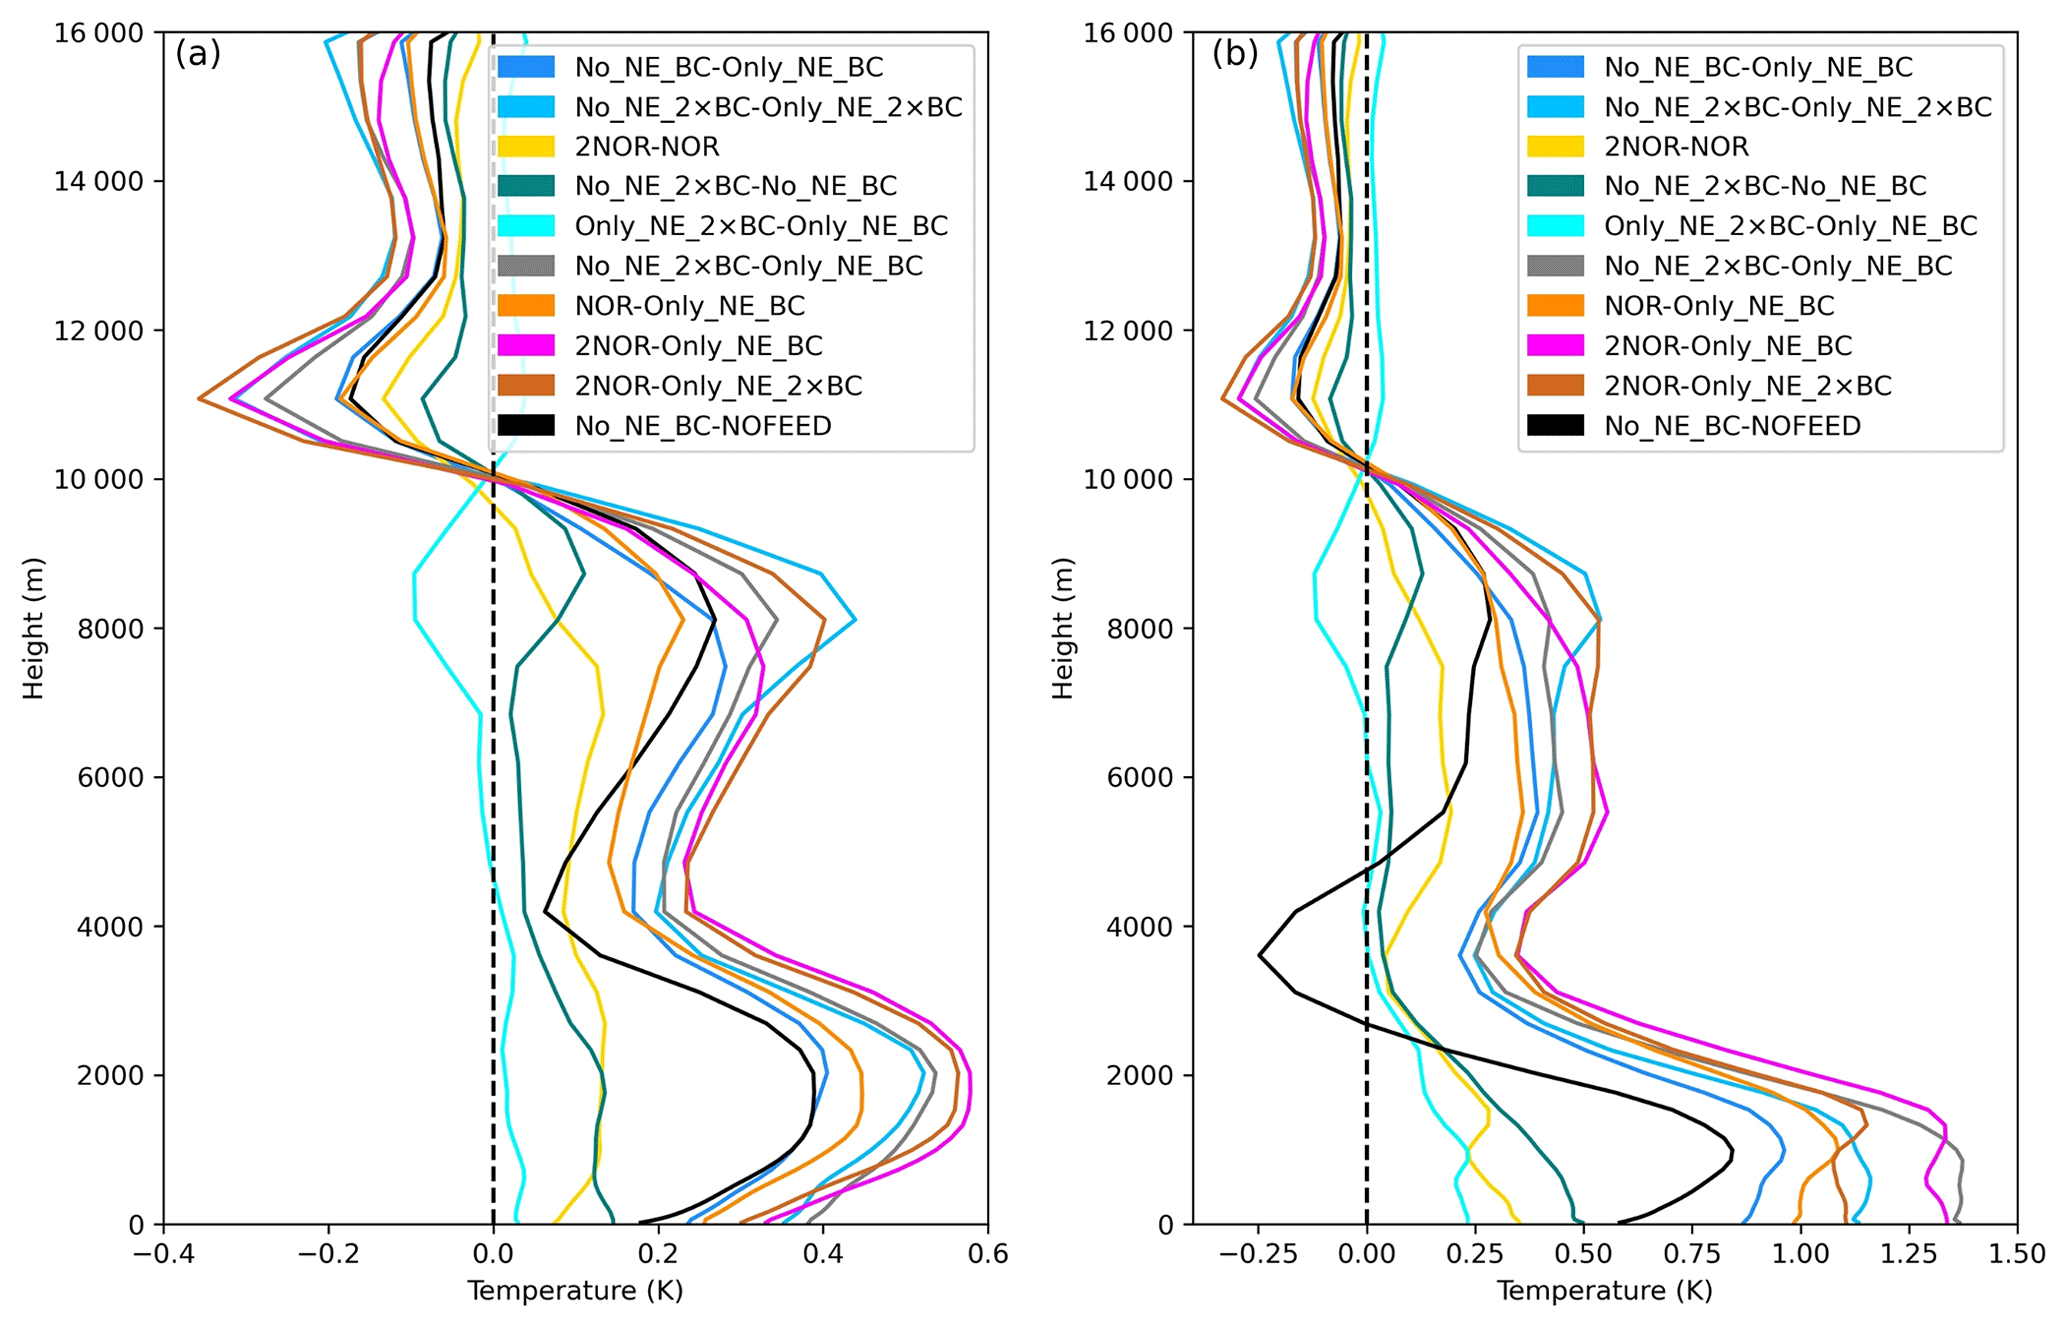
Figure 7Regionally averaged vertical profiles showing perturbations in (a) potential temperature (K) and (b) equivalent potential temperature (K).
3.4.2 Atmospheric stability and moisture
Barman and Gokhale (2022), as well as Soni et al. (2017), showed an increased influx of moisture into the region during the pre-monsoon due to BC. In order to compare and separate the effects of local and transported BC on atmospheric stability through temperature and moisture, potential temperature (PT) and EPT were estimated. PT estimates atmospheric stability based on temperature, while EPT accounts for both temperature and moisture and is a more realistic parameter. In most of the profiles in both parameters in Fig. 7a and b, positive perturbation was observed approximately below 10 km and negative above it, which indicated an increase in atmospheric instability and vice versa for an increase in atmospheric stability (Zhao et al., 2011). The positive perturbations below 10 km varied with height and were most profound in the profiles No_NE_BC–Only_NE_BC, No_NE_2 × BC–Only_NE_2 × BC and No_NE_2 × BC–Only_NE_BC, each of which was estimated from the difference between a transported BC scenario and local BC scenario. These profiles showed similarity with the corresponding profiles of NOR–Only_NE_BC, 2NOR–Only_NE_2 × BC and 2NOR–Only_NE_BC in both the parameters, indicating that they were closer to the normal atmospheric scenario. The positive perturbations were, however, comparatively smaller with 2NOR–NOR, No_NE_2 × BC–No_NE_BC and Only_NE_2 × BC–Only_NE_BC in both parameters, each pair being the same scenario with only a difference in emission rates. This shows that BC atmospheric distribution played an important role in instability. The Only_NE_2 × BC–Only_NE_BC profile not only showed a smaller increase in instability than the No_NE_2 × BC–No_NE_BC profile but also contributed to the smallest increase in instability in both parameters. Thus, transported BC and an increase in transported BC emissions led to higher atmospheric instability than local BC.
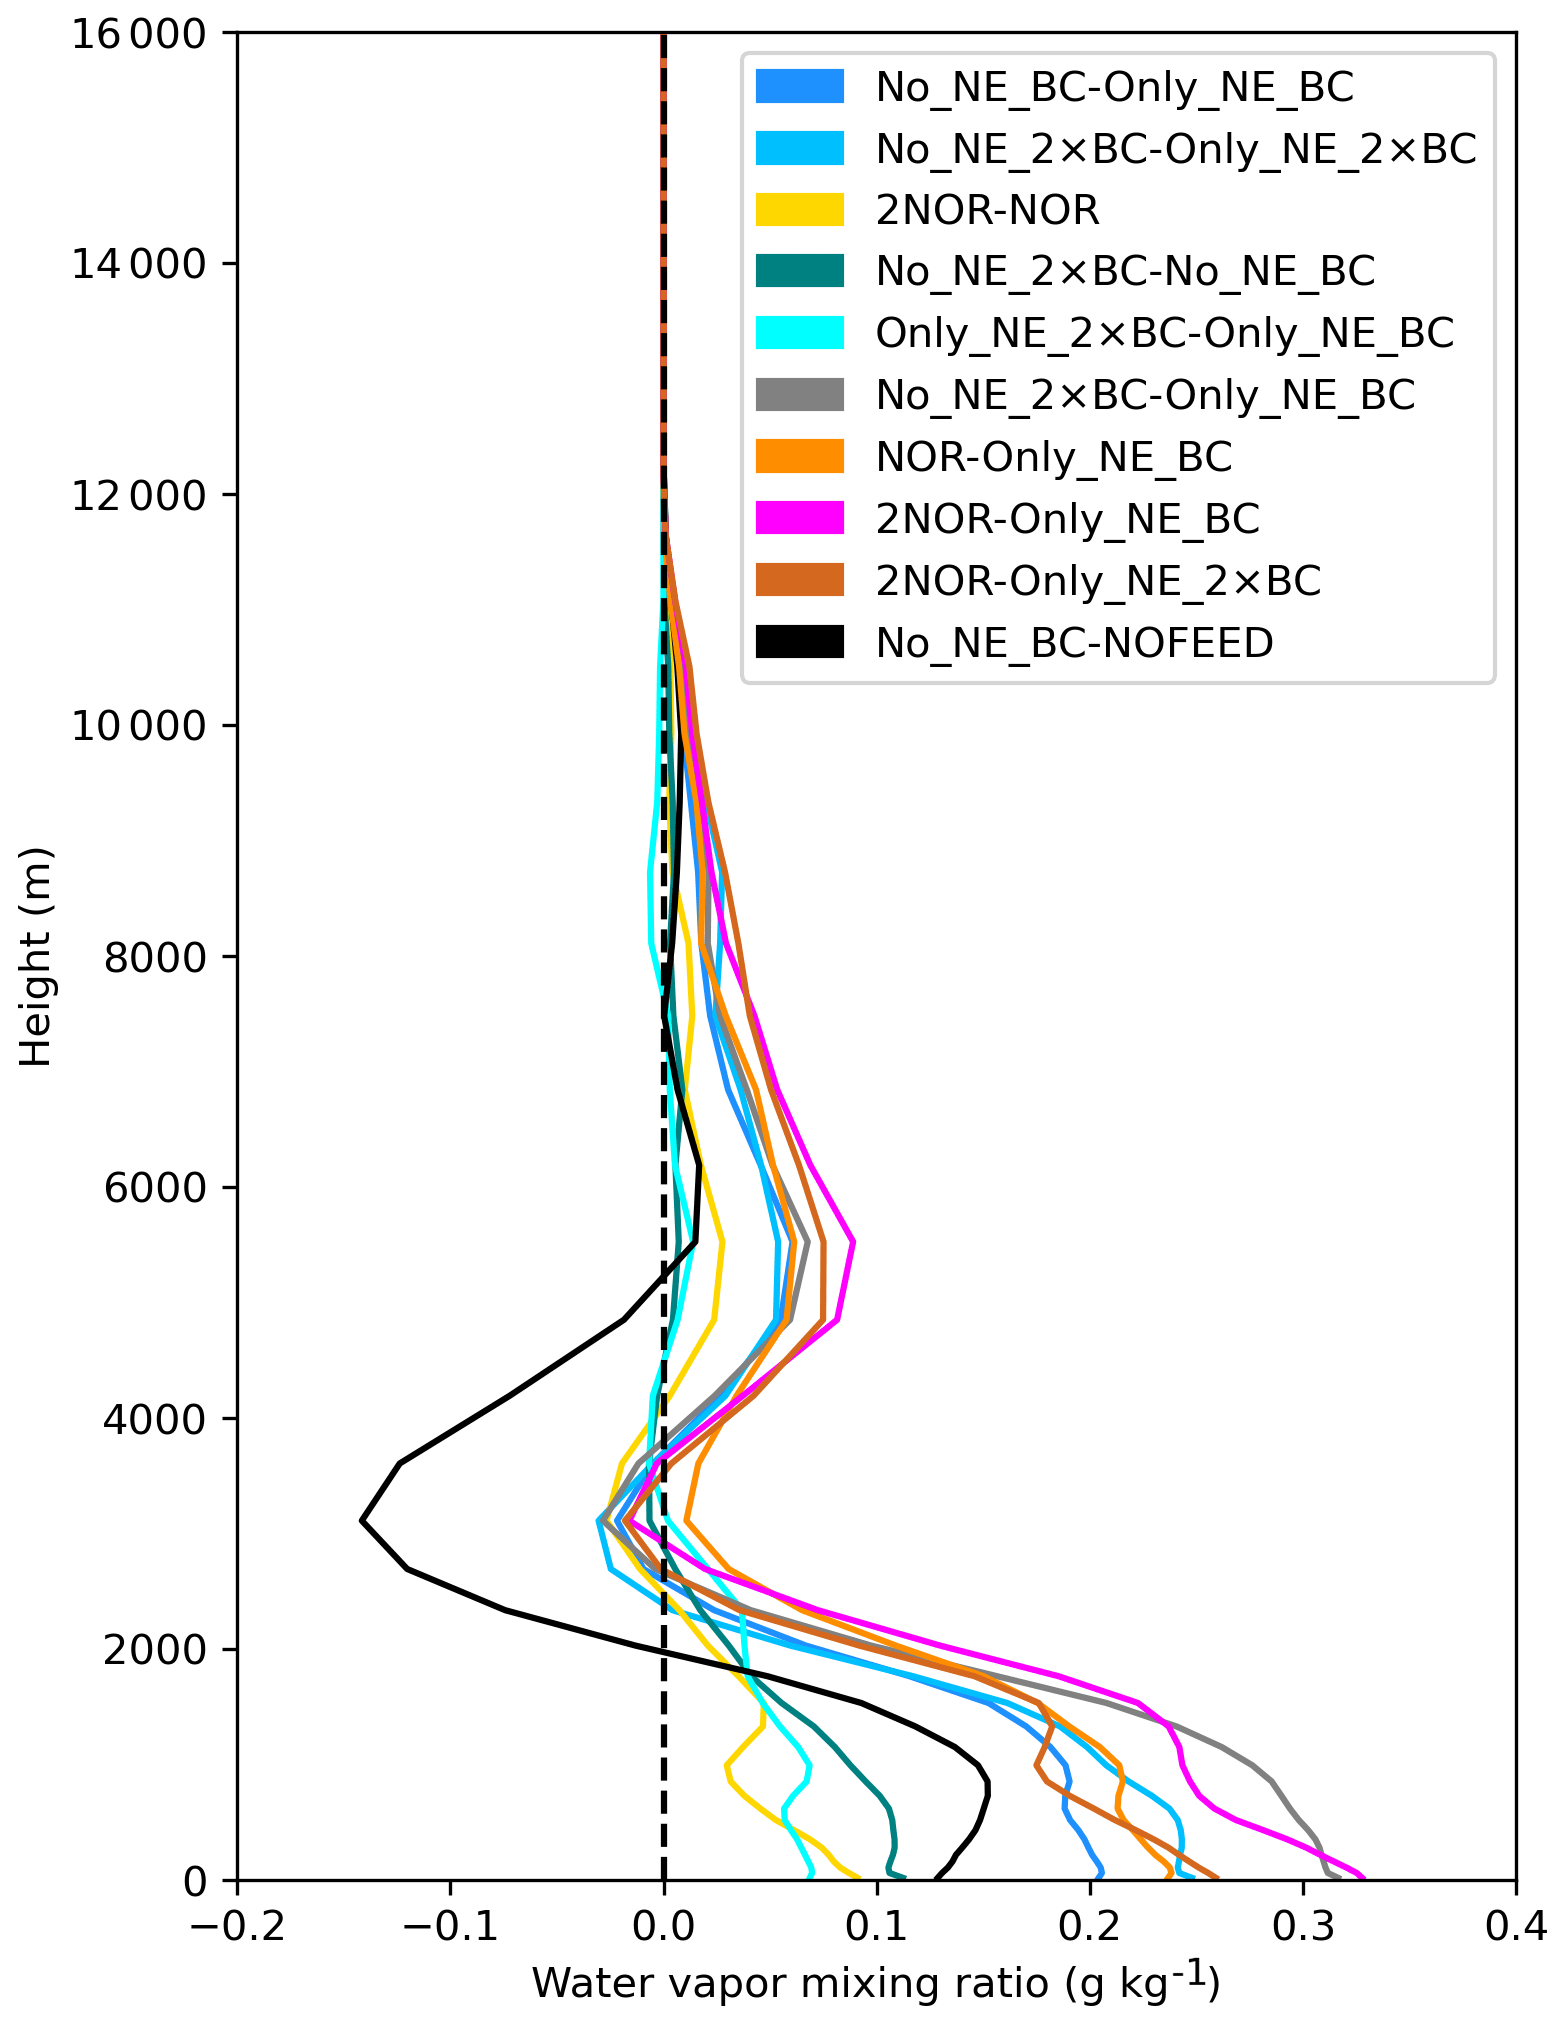
Figure 8Regionally averaged vertical profiles showing perturbations in water vapour mixing ratio (g kg−1).
Moreover, EPT profiles showed higher positive perturbations and hence higher instability compared to the corresponding PT profiles with values exceeding 1.25 K. The positive difference or additional instability between the corresponding profiles of Fig. 7a and b was due to moisture. The difference also indicated that moisture contributed even more to the instability than BC. The peaks for EPT existed closer to the surface due to most of the moisture also remaining near the surface, as shown in Fig. 8. However, there occurred a region of increased stability from the ground surface to the first peak of transported BC profiles at approximately 1000 m, indicated by increasing temperature with height. Thus, transported BC may also be responsible for air quality scenarios over NE India by creating a stable boundary layer. The close qualitative and quantitative similarity between No_NE_BC–NOFEED, No_NE_BC–Only_NE_BC and NOR–Only_NE_BC profiles in Fig. 7a showed that the aerosol radiative effect due to transported BC was intricately linked with the PT profile, and the positive perturbations in each of these profiles were also closely linked with BC. This was also seen in Fig. 7b, but since it also included the effect of moisture, larger differences were seen.
BC, whether transported or emitted locally, caused a positive perturbation in moisture at least below 2 km altitude, as seen in Fig. 8. The perturbation was much larger in profiles that had a combination of transported and local BC scenarios and which had higher transported BC emissions and followed a pattern similar to PT and EPT. This links BC, instability and moisture in the region; i.e. higher transported BC caused higher instability, which brought a higher amount of moisture, which would possibly again cause higher instability. It was the same for scenarios that included the indirect effect, as can be observed from the similarities of the No_NE_BCI–Only_NE_BCI (Fig. S15) and No_NE_BC–Only_NE_BC profiles in Fig. 8. Furthermore, the similarity of No_EMISS_NE–Only_EMISS_NE profiles with No_NE_BCI–Only_NE_BCI (Fig. S15) inferred that the direct radiative effect of transported BC was responsible for the moisture increase in Fig. 4. The higher moisture with transported BC scenarios was due to higher moisture flux caused by the transported BC scenarios over the Bay of Bengal compared to local BC and can be verified from Fig. 9. Quantitatively, No_NE_BC (33.95 kg m−2) and No_NE_2 × BC (34.15 kg m−2) had higher region average precipitable water vapour than Only_NE_BC (33.49 kg m−2) and Only_NE_2 × BC (33.64 kg m−2). Hence transported BC in Sect. 3.3 was primarily responsible for transporting moisture from the Bay of Bengal by affecting the atmospheric dynamics. The mechanism is similar to the “heat pump” model by Lau et al. (2006).
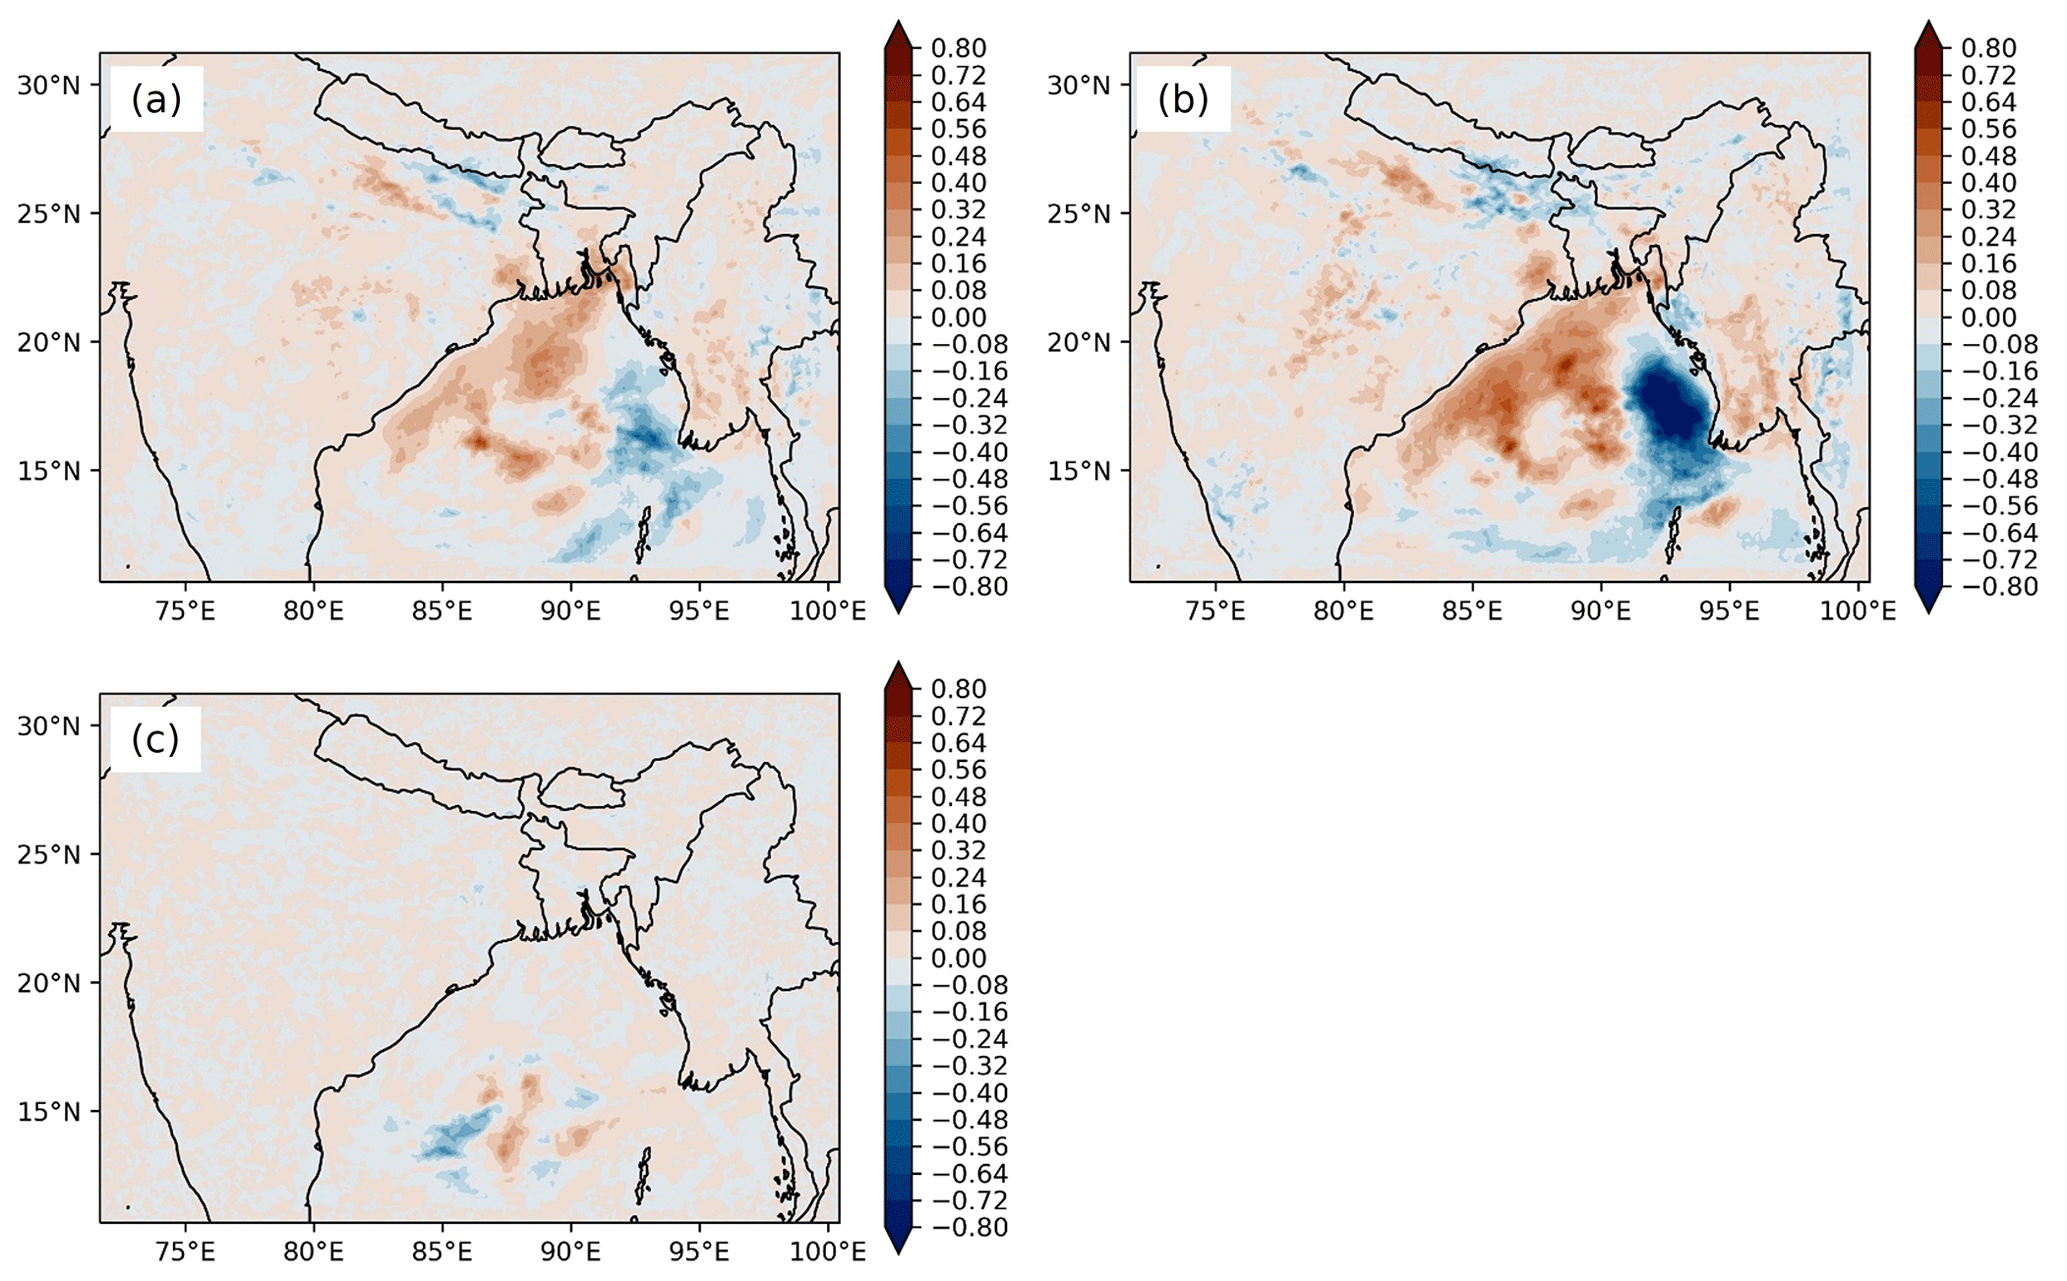
Figure 9Spatial distributions of change in moisture flux (g s−1 m−2) in (a) No_NE_BC–Only_NE_BC, (b) No_NE_2 × BC–Only_NE_BC and (c) Only_NE_2 × BC–Only_NE_BC near the surface.
3.5 Rainfall response to emissions
Similar to NOR-I–NOCHEM, No_BC_ABS–NOCHEM gave the rainfall change due to the total aerosol effect but without BC absorption. The higher negative rainfall change of −275.13 mm with NOR-I–NOCHEM compared to −266.78 mm with No_BC_ABS–NOCHEM showed BC absorption to reduce rainfall. The higher reduction with NOR-I–NOCHEM was mainly due to higher rainfall reduction in region 1, where the direct and semi-direct effect was maximum. This shows BC initially suppressed rainfall, even though moisture increased due to it. However, with the increase in BC emissions, rainfall increased, and the rainfall suppression due to the total aerosol effect reduced substantially to −64.44 mm with 4NOR-I–NOCHEM compared to −275.13 mm with NOR-I–NOCHEM, and similarly, rainfall due to the direct and semi-direct effect with 4NOR-I–NOFEED-I showed a positive rainfall change of 193.64 mm compared to −17.04 mm with NOR-I–NOFEED. Similarly, 4NOR-I–NOR-I gave a rainfall enhancement of 225.24 mm. Spatial distribution of change in rainfall is shown in Fig. 10a, which shows rainfall change primarily occurring over NE India and along the valley.
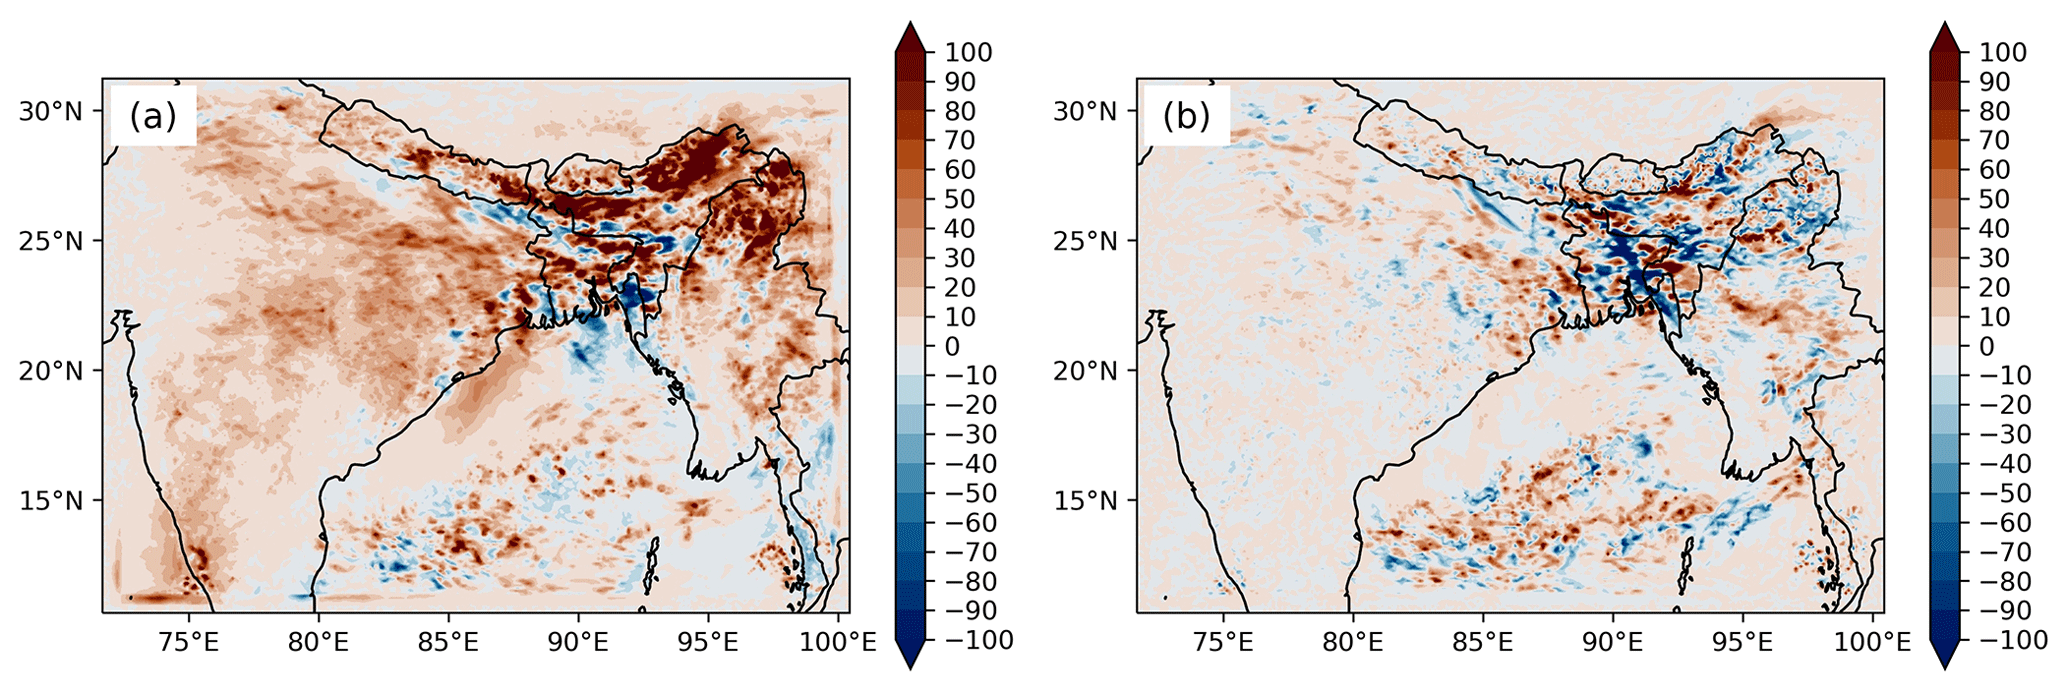
Figure 10Spatial distributions of change in rainfall (mm) in (a) 4NOR-I–NOR-I and (b) No_EMISS_NE_4SO2–No_EMISS_NE_0.25SO2.
Aged BC also contributes as CCN (Lambe et al., 2015). The enhancement in BC emission did increase the column average CCN concentration to 2252 m−3 (4NOR-I) from 2024 m−3 (NOR-I), but the increase was largely disproportionate to the 4 times BC emission increase. The enhancement over NE India can also be seen from the spatial distribution of column-integrated CCN in Fig. 11.
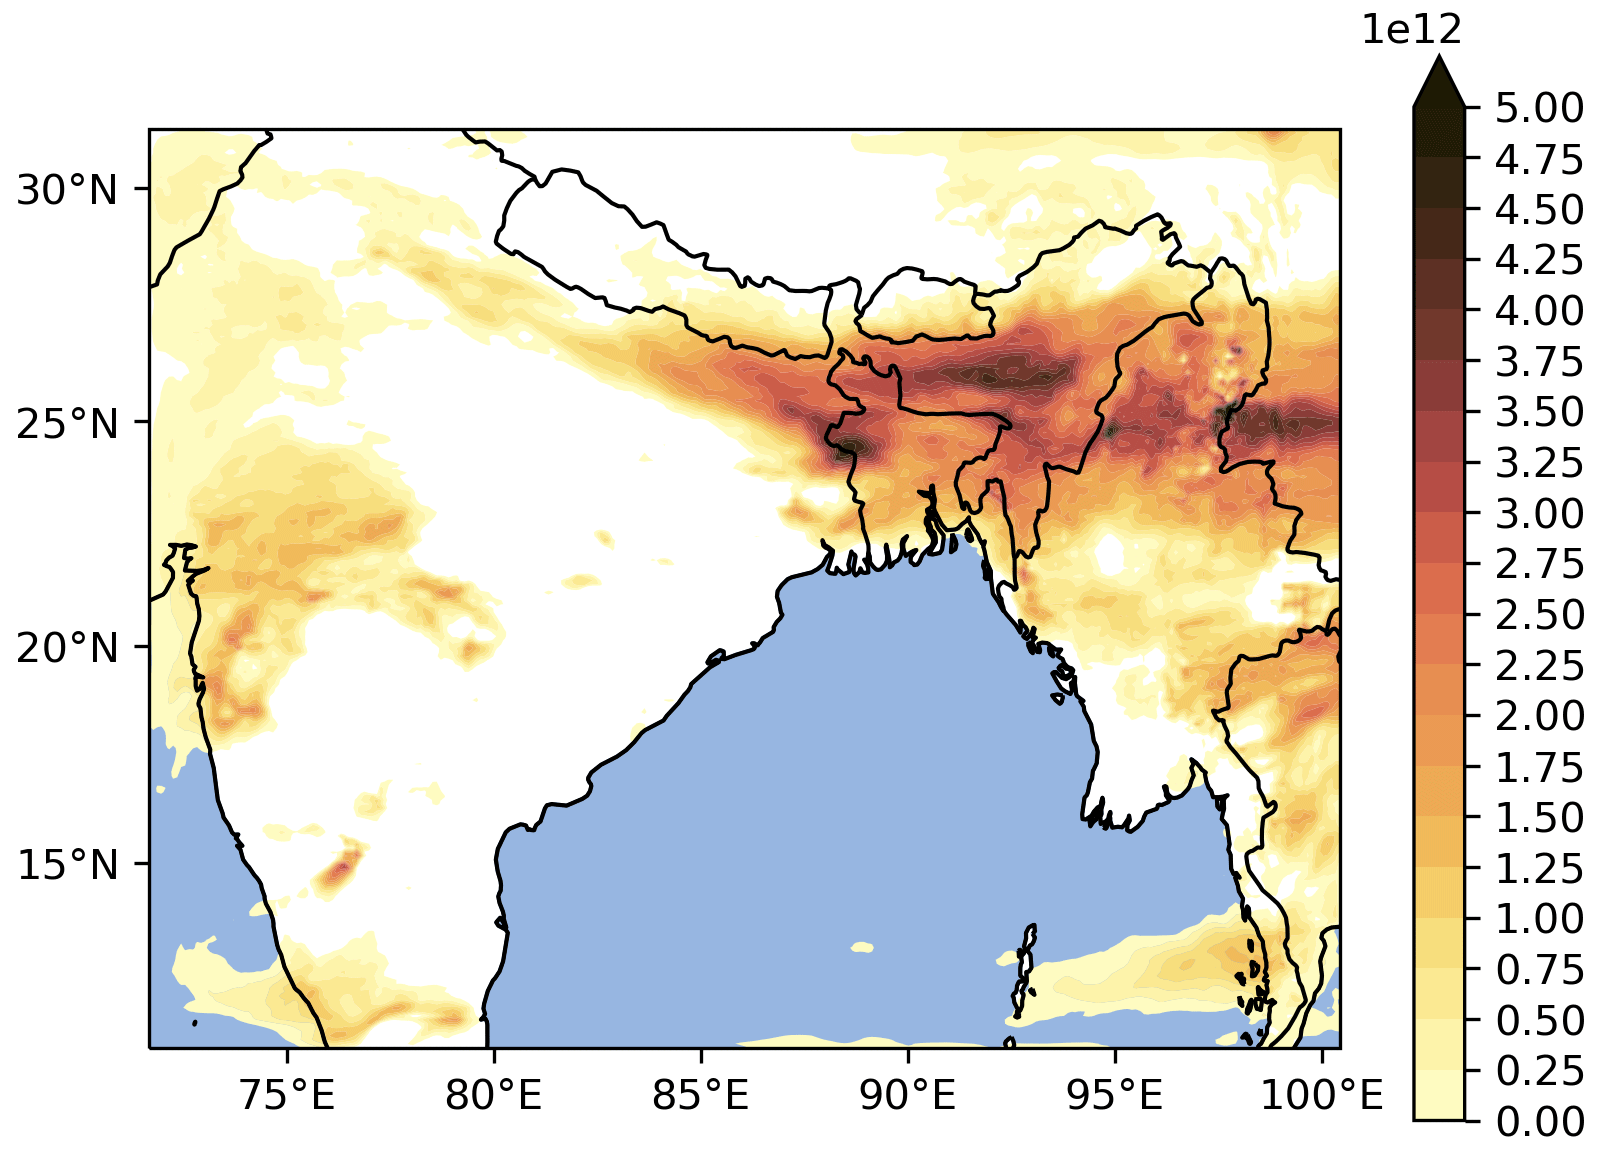
Figure 11Spatial distribution of the column-integrated CCN number (m−2), estimated from 4NOR-I–NOR-I.
Enhancement of the CCN number concentration generally leads to enhancement of the indirect aerosol effect (Yu et al., 2013) and is also seen later in the case of sulfate aerosol. However, in spite of the increase in CCN, the cloud water mixing ratio was lower in 4NOR-I than in NOR-I, as seen in Fig. 6, and 4NOR-I caused significantly more rainfall formation than NOR-I, as can be seen from the rainwater mixing ratio profiles. This may be related to the suppression of CCN activation due to BC, as observed over central India (Jayachandran et al., 2020). Also BC contributes marginally to the indirect effect (Kristjánsson, 2002). Thus, the increased moisture (Fig. S15) did not remain stored as cloud water, even though there was an increase in CCN, but it got converted to rainwater. The large increase in moisture, caused by the increase in atmospheric instability, possibly condensed on a relatively smaller number of CCN particles, promoting larger cloud droplets, which enhanced rainfall. Moreover, the ratio of the rainwater mixing ratio to rain droplet number concentration gave the amount of rain water per rain droplet or indirectly the rain droplet size. The vertical profile of this ratio is shown in Fig. 12, which shows higher values for 4NOR-I.
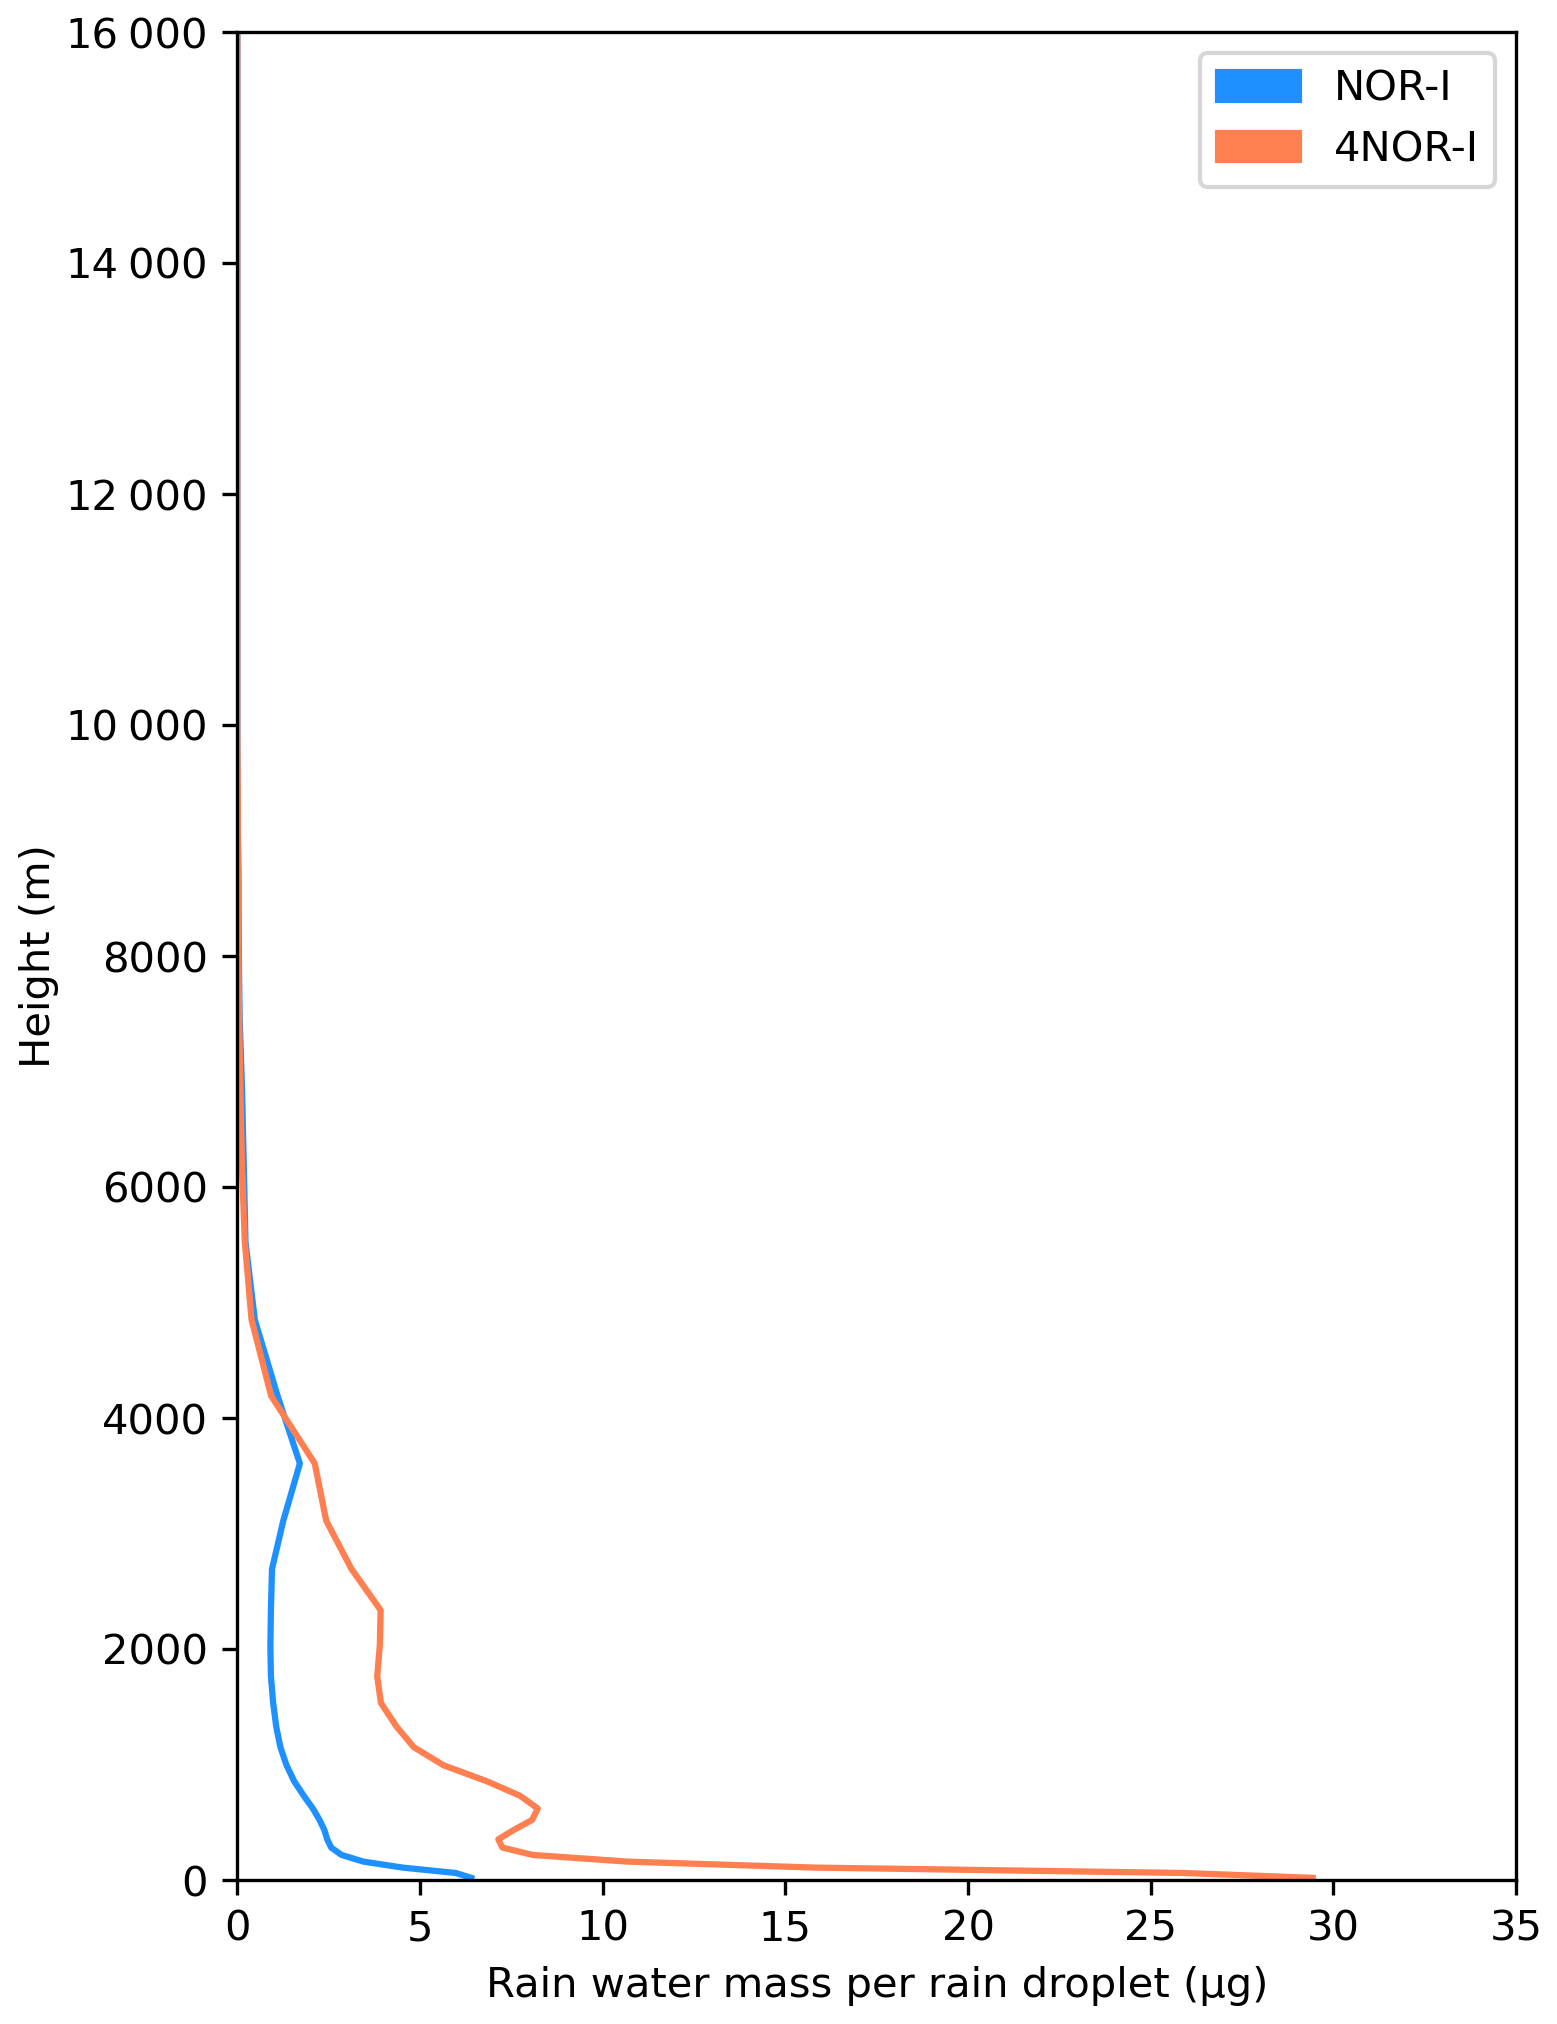
Collision is the primary mechanism of rain development in warm clouds (Lamb and Verlinde, 2011). Since rain droplets are formed from the gathering of cloud droplets, the higher value for 4NOR-I indicated larger rain droplet formation, possibly through better collisions among the cloud droplets, besides higher moisture availability. This indicated that the increase in BC emissions did not contribute to rainfall suppression through the indirect aerosol effect, though there was an increase in CCN concentration, but rather counteracted the suppression of rainfall due to the indirect effect of other aerosol species. The rainfall enhancement was due to an increase in moisture, contributed by the transported fraction of BC, as explained in Sect. 3.4.2. Moreover, rainfall suppression was also more due to transported aerosols, mainly contributed by the indirect effect (Table 3). Also, among the non-absorbing aerosols, sulfate aerosol is an important contributor to CCN and the indirect effect (Kristjánsson, 2002). Its concentration was found to be the highest among non-absorbing aerosols, and most of its mass over NE India was found to be transported (Sect. 3.1). Concentration profiles can be seen from Fig. S16. Hence, the response of rainfall over NE India was checked by increasing (No_EMISS_NE_4SO2) and decreasing (No_EMISS_NE_0.25SO2) SO2 emissions outside NE India and compared against the baseline transported scenario (No_EMISS_NE), since sulfate is mainly formed within the atmosphere by oxidation of SO2 (Wang et al., 2021). Similarly to the increase in BC emissions, No_EMISS_NE_4SO2 caused an increase in the column average CCN concentration to 3524 m−3 compared to 1753 m−3 in No_EMISS_NE, while No_EMISS_NE_0.25SO2 showed a decrease (1390 m−3). However, contrary to BC, an increase in SO2 emissions with No_EMISS_NE_4SO2 caused an increase in the cloud water mixing ratio compared to No_EMISS_NE, as seen in Fig. 6, while its decrease also caused a decrease. Thus, No_EMISS_NE_4SO2 and No_EMISS_NE_0.25SO2 had lower and higher rainwater mixing ratios, respectively, compared to No_EMISS_NE. Consequently, No_EMISS_NE_4SO2 had higher rainfall suppression and gave less rainfall (−22.23 mm) compared to No_EMISS_NE_0.25SO2. Spatial distribution is shown in Fig. 10b, which shows mainly negative change over the region. Thus, an increase in non-absorbing aerosol caused rainfall suppression through the indirect effect. The indirect effect was observed to be the dominant aerosol effect for suppressing rainfall. However, with an increase in BC, suppression of rainfall due to direct and semi-direct effects through surface processes (surface moisture flux, convection) and cloud evaporation as well as due to the indirect aerosol effect (atmospheric stability, surface moisture flux and cloud to rainwater conversion) becomes comparatively weaker mechanisms than the direct effect of radiative heating by BC, enhancing rainfall through the transport of moisture. However, the increase in transported SO2 emissions also caused further suppression of rainfall. Hence, an increase in transported aerosols of an absorbing aerosol (BC) and a non-absorbing aerosol (sulfate), both being a contributor to CCN, exerted different impacts to indirect effect parameters and thus to rainfall and hence most likely controls the enhancement and suppression of pre-monsoon rainfall over NE India, thus counteracting each other. However, since a decreasing rainfall trend has been observed, the impacts of the indirect aerosol effect could be dominant. Here, the response of only one non-absorbing aerosol (sulfate) was checked and possibly has contributions from other similar species also. Other non-absorbing aerosol species like nitrate also contribute to the indirect aerosol effect (Wang et al., 2010; Zaveri et al., 2021), which may contribute to rainfall suppression as sulfate.
Moreover, the percentage of the simulation time of different aerosol effects and BC emissions increased (inc) or suppressed (dec) rainfall under different rainfall intensities (low: 0–5, medium: 5–10, high: > 10 mm d−1; defined as per Raju et al., 2015), and the rainfall amount under those intensities was estimated. Regional average values are provided in Tables S6 and S7. All aerosol effects caused a higher decrease across all rainfall intensities, except the indirect effect, which indicated a higher increase in low-intensity rainfall (6.52 vs. −6.48 mm; 21.44 % vs. 20.58 %). High-intensity rain was primarily responsible for rainfall changes across all the scenarios and effects. The indirect effect decreased high-intensity rainfall duration (18.85 % vs. 12.38 %) and amount (−399.41 vs. 141.62 mm) and was primarily responsible for the rainfall suppression in the total aerosol effect (−411.34 mm). The total aerosol effect with enhanced BC emissions (4NOR-I–NOCHEM) showed a significantly higher increase (275.47 vs. 137.16 mm) as well as a significantly lower decrease (−337.23 vs. −411.34) in high-intensity rainfall compared to the total aerosol effect with baseline BC emissions (NOR-I–NOCHEM). Similar results in time and rainfall amount between BC increase and direct + semi-direct effects with BC-increase scenarios inferred that enhanced radiative effects due to BC increase were mainly responsible for higher high-intensity rainfall duration and rainfall amount, while the indirect aerosol effect was mainly involved in its suppression, possibly due to the increased atmospheric stability associated with it. Barman and Gokhale (2022) also showed similar results with BC emissions increase, but this study verifies the role of direct radiative effects of BC in it. Thus, BC increased rainfall over NE India but in the form of high-intensity rainfall. Hence, relative fractions of BC and the other aerosols contributing to the indirect effect possibly decide the amount of rainfall and its intensity over the region. However, the indirect effect also caused high-intensity rainfall but with a smaller amount than its suppression and may be involved in catastrophic flood events at local scales (Wang et al., 2022).
Transported aerosols, primarily from the IGP, were found to be responsible for the bulk of the aerosol mass (93.98 %) over NE India, while contributing 64.18 % of near-surface PM10 concentration, thus primarily responsible for air pollution as climatic impacts over the region during the pre-monsoon season. The climatic impacts, both with respect to RF as well as rainfall, were dominated by the indirect aerosol effect. The impacts of the indirect aerosol effects of transported aerosols were much higher in affecting radiation (−13.12 vs. −0.24 W m−2 at the surface, 7.30 vs. 0.97 W m−2 in the atmosphere) as well as suppressing rainfall (−49.11 vs. −16.04 mm) compared to local emissions. The greater surface dimming by transported aerosols caused a higher negative change in surface moisture flux ( vs. kg m−2 s−1) as well as higher-aerosol-mass-reduced cloud water to rainwater conversion, both of which contributed to higher rainfall suppression. Transported aerosols caused 4.42×10¹³ m−2 higher cloud droplets than local emissions. The atmospheric instability due to the direct + semi-direct effect and indirect effect of transported aerosols was found to be contradictory and caused an increase and decrease, respectively. The direct effect of transported aerosols, though it also caused a negative surface moisture flux over NE India ( kg m−2 s−1), increased moisture over NE India, increasing moisture flux over the Bay of Bengal. Further analysis showed that transported BC was more efficient in atmospheric heating over NE India, and together with the higher transported BC mass, an increase in its emissions caused higher atmospheric instability over the region, which brought more moisture from the Bay of Bengal. The increased moisture further contributed to higher instability. Hence, the rainfall suppression caused through the different atmospheric processes by direct, semi-direct and indirect effects was reduced and nullified with the increase in BC emissions, but the rainfall increase was mainly in the form of high-intensity rainfall. The increase in BC did not show a positive change in cloud water, though it contributed to CCN. The direct effect of BC thus overpowered the other rainfall-suppressing processes. The indirect aerosol effect and radiative heating were the main rainfall-controlling factors. Hence, changes in emissions of aerosols or chemical species contributing to these processes will possibly contribute to rainfall suppression and enhancement over NE India. Moreover, rainfall simulated with transported aerosols were found to be more similar to the IMD observation datasets as well as the baseline emission scenario, indicating its possible greater influence in a real-world scenario.
The study shows that the atmospheric transport of emissions from the IGP to NE India has a significant impact on NE India's rainfall during the pre-monsoon, and the impacts are even greater than the emissions within the NE India region.
Model outputs are available upon request.
The supplement related to this article is available online at: https://doi.org/10.5194/acp-23-6197-2023-supplement.
NB: conceptualisation, methodology, model simulation, visualisation, manuscript writing; SG: conceptualisation, methodology, supervision, manuscript review, editing.
The contact author has declared that neither of the authors has any competing interests.
The views expressed in this paper are those of the authors.
Publisher's note: Copernicus Publications remains neutral with regard to jurisdictional claims in published maps and institutional affiliations.
The simulations were performed on the Param-Ishan HPC of the Indian Institute of Technology Guwahati. The authors are also grateful to the Air and Noise Pollution Lab of the Civil Department IIT Guwahati for their support.
This paper was edited by Manabu Shiraiwa and reviewed by two anonymous referees.
Bagtasa, G., Cayetano, M. G., Yuan, C. S., Uchino, O., Sakai, T., Izumi, T., Morino, I., Nagai, T., Macatangay, R. C., and Velazco, V. A.: Long-range transport of aerosols from East and Southeast Asia to northern Philippines and its direct radiative forcing effect, Atmos. Environ., 218, 117007, https://doi.org/10.1016/j.atmosenv.2019.117007, 2019.
Barman, N. and Gokhale, S.: Urban black carbon - source apportionment, emissions and long-range transport over the Brahmaputra River Valley, Sci. Total Environ., 693, 1–14, https://doi.org/10.1016/j.scitotenv.2019.07.383, 2019.
Barman, N. and Gokhale, S.: Aerosol influence on the pre-monsoon rainfall mechanisms over North-East India: A WRF-Chem study, Atmos. Res., 268, 106002, https://doi.org/10.1016/j.atmosres.2021.106002, 2022.
Bauer, S. E. and Menon, S.: Aerosol direct, indirect, semidirect, and surface albedo effects from sector contributions based on the IPCC AR5 emissions for preindustrial and present-day conditions, J. Geophys. Res.-Atmos., 117, https://doi.org/10.1029/2011JD016816, 2012.
Bhat, M. A., Romshoo, S. A., and Beig, G.: Characteristics, source apportionment and long-range transport of black carbon at a high-altitude urban centre in the Kashmir valley, North-western Himalaya, Environ. Pollut., 305, 119295, https://doi.org/10.1016/j.envpol.2022.119295, 2022.
Bollasina, M. A., Ming, Y., and Ramaswamy, V.: Anthropogenic aerosols and the weakening of the south asian summer monsoon, Science, 334, 502–505, https://doi.org/10.1126/science.1204994, 2011.
Bonasoni, P., Laj, P., Marinoni, A., Sprenger, M., Angelini, F., Arduini, J., Bonafè, U., Calzolari, F., Colombo, T., Decesari, S., Di Biagio, C., di Sarra, A. G., Evangelisti, F., Duchi, R., Facchini, MC., Fuzzi, S., Gobbi, G. P., Maione, M., Panday, A., Roccato, F., Sellegri, K., Venzac, H., Verza, GP., Villani, P., Vuillermoz, E., and Cristofanelli, P.: Atmospheric Brown Clouds in the Himalayas: first two years of continuous observations at the Nepal Climate Observatory-Pyramid (5079 m), Atmos. Chem. Phys., 10, 7515–7531, https://doi.org/10.5194/acp-10-7515-2010, 2010.
Bond, T. C., Doherty, S. J., Fahey, D. W., Forster, P. M., Berntsen, T., Deangelo, B. J., Flanner, M. G., Ghan, S., Kärcher, B., Koch, D., Kinne, S., Kondo, Y., Quinn, P. K., Sarofim, M. C., Schultz, M. G., Schulz, M., Venkataraman, C., Zhang, H., Zhang, S., Bellouin, N., Guttikunda, S. K., Hopke, P. K., Jacobson, M. Z., Kaiser, J. W., Klimont, Z., Lohmann, U., Schwarz, J. P., Shindell, D., Storelvmo, T., Warren, S. G., and Zender, C. S.: Bounding the role of black carbon in the climate system: A scientific assessment, J. Geophys. Res.-Atmos., 118, 5380–5552, https://doi.org/10.1002/jgrd.50171, 2013.
Chatterjee, A., Adak, A., Singh, A. K., Srivastava, M. K., Ghosh, S. K., Tiwari, S., Devara, P. C. S., and Raha, S.: Aerosol chemistry over a high altitude station at northeastern Himalayas, India, PLoS One, 5, 6, https://doi.org/10.1371/journal.pone.0011122, 2010.
Chaudhury, A. S., Nikhil, V. A., and Gokhale, S.: Black carbon in different climatic seasons of the Brahmaputra River Valley of Northeast India – Field measurements at two different heights and analysis, Atmos. Pollut. Res., 13, 101327, https://doi.org/10.1016/j.apr.2022.101327, 2022.
Cherian, R., Quaas, J., Salzmann, M., and Tomassini, L.: Black carbon indirect radiative effects in a climate model, Tellus B, 69, 1–10, https://doi.org/10.1080/16000889.2017.1369342, 2017.
Christensen, M. W., Chen, Y. C., and Stephens, G. L.: Aerosol indirect effect dictated by liquid clouds, J. Geophys. Res., 121, 14636–14650, https://doi.org/10.1002/2016JD025245, 2016.
Dahutia, P., Pathak, B., and Bhuyan, P. K.: Aerosols characteristics, trends and their climatic implications over northeast india and adjoining South Asia, Int. J. Climatol., 38, 1234–1256, https://doi.org/10.1002/joc.5240, 2018.
Dahutia, P., Pathak, B., and Bhuyan, P. K.: Vertical distribution of aerosols and clouds over north-eastern South Asia: Aerosol-cloud interactions, Atmos. Environ., 215, 116882, https://doi.org/10.1016/j.atmosenv.2019.116882, 2019.
Emery, C., Tai, E., and Yarwood, G.: Enhanced Meteorological Modeling and Performance Evaluation for Two Texas Ozone Episodes, Env. Int. Corp., 235, 55–56, 2001.
Emmons, L. K., Walters, S., Hess, P. G., Lamarque, J.-F., Pfister, G. G., Fillmore, D., Granier, C., Guenther, A., Kinnison, D., Laepple, T., Orlando, J., Tie, X., Tyndall, G., Wiedinmyer, C., Baughcum, S. L., and Kloster, S.: Description and evaluation of the Model for Ozone and Related chemical Tracers, version 4 (MOZART-4), Geosci. Model Dev., 3, 43–67, https://doi.org/10.5194/gmd-3-43-2010, 2010.
Ghan, S. J., Liu, X., Easter, R. C., Zaveri, R., Rasch, P. J., Yoon, J. H., and Eaton, B.: Toward a minimal representation of aerosols in climate models: Comparative decomposition of aerosol direct, semidirect, and indirect radiative forcing, J. Climate, 25, 6461–6476, https://doi.org/10.1175/JCLI-D-11-00650.1, 2012.
Gogoi, M. M., Babu, S. S., Moorthy, K. K., Bhuyan, P. K., Pathak, B., Subba, T., Chutia, L., Kundu, S. S., Bharali, C., Borgohain, A., Guha, A., Kumar De, B., Singh, B., and Chin, M.: Radiative effects of absorbing aerosols over northeastern India: Observations and model simulations, J. Geophys. Res., 122, 1132–1157, https://doi.org/10.1002/2016JD025592, 2017.
Granier, C., Darras, S., Denier van der Gon, H., Doubalova, J., Elguindi, N., Galle, B., Gauss, M., Guevara, M., Jalakanen, J.-P., Kuenen, J., Liousse, C., Quack, B., Simpson, D., and Sinderlova, K.: The Copernicus Atmosphere Monitoring Service global and regional emissions (April 2019 version), HAL, https://doi.org/10.24380/d0bn-kx16, 2019.
Grell, G. A. and Freitas, S. R.: A scale and aerosol aware stochastic convective parameterization for weather and air quality modeling, Atmos. Chem. Phys., 14, 5233–5250, https://doi.org/10.5194/acp-14-5233-2014, 2014.
Grell, G. A., Peckham, S. E., Schmitz, R., McKeen, S. A., Frost, G., Skamarock, W. C., and Eder, B.: Fully coupled “online” chemistry within the WRF model, Atmos. Environ., 39, 6957–6975, https://doi.org/10.1016/j.atmosenv.2005.04.027, 2005.
Guenther, A., Karl, T., Harley, P., Wiedinmyer, C., Palmer, P. I., and Geron, C.: Estimates of global terrestrial isoprene emissions using MEGAN (Model of Emissions of Gases and Aerosols from Nature), Atmos. Chem. Phys., 6, 3181–3210, https://doi.org/10.5194/acp-6-3181-2006, 2006.
Guha, A., De, B. K., Dhar, P., Banik, T., Chakraborty, M., Roy, R., Choudhury, A., Gogoi, M. M., Babu, S. S., and Moorthy, K. K.: Seasonal Characteristics of Aerosol Black Carbon in Relation to Long Range Transport over Tripura in Northeast India, Aerosol Air Qual. Res., 15, 786–798, https://doi.org/10.4209/aaqr.2014.02.0029, 2015.
Habib, G., Venkataraman, C., Chiapello, I., Ramachandran, S., Boucher, O., and Shekar Reddy, M.: Seasonal and interannual variability in absorbing aerosols over India derived from TOMS: Relationship to regional meteorology and emissions, Atmos. Environ., 40, 1909–1921, https://doi.org/10.1016/j.atmosenv.2005.07.077, 2006.
Hersbach, H., Bell, B., Berrisford, P., Hirahara, S., Horányi, A., Muñoz-Sabater, J., Nicolas, J., Peubey, C., Radu, R., Schepers, D., Simmons, A., Soci, C., Abdalla, S., Abellan, X., Balsamo, G., Bechtold, P., Biavati, G., Bidlot, J., Bonavita, M., De Chiara, G., Dahlgren, P., Dee, D., Diamantakis, M., Dragani, R., Flemming, J., Forbes, R., Fuentes, M., Geer, A., Haimberger, L., Healy, S., Hogan, R. J., Hólm, E., Janisková, M., Keeley, S., Laloyaux, P., Lopez, P., Lupu, C., Radnoti, G., de Rosnay, P., Rozum, I., Vamborg, F., Villaume, S., and Thépaut, J. N.: The ERA5 global reanalysis, Q. J. Roy. Meteorol Soc., 146, 1999–2049, https://doi.org/10.1002/qj.3803, 2020.
Iacono, M. J., Delamere, J. S., Mlawer, E. J., Shephard, M. W., Clough, S. A., and Collins, W. D.: Radiative forcing by long-lived greenhouse gases: Calculations with the AER radiative transfer models, J. Geophys. Res.-Atmos., 113, D13103, https://doi.org/10.1029/2008JD009944, 2008.
Jayachandran, V. N., Suresh Babu, S. N., Vaishya, A., Gogoi, M. M., Nair, V. S., Satheesh, S. K., and Krishna Moorthy, K.: Altitude profiles of cloud condensation nuclei characteristics across the Indo-Gangetic Plain prior to the onset of the Indian summer monsoon, Atmos. Chem. Phys., 20, 561–576, https://doi.org/10.5194/acp-20-561-2020, 2020.
Kant, S., Panda, J., Rao, P., Sarangi, C., and Ghude, S. D.: Study of aerosol-cloud-precipitation-meteorology interaction during a distinct weather event over the Indian region using WRF-Chem, Atmos. Res., 247, 105144, https://doi.org/10.1016/j.atmosres.2020.105144, 2021.
Kedia, S., Cherian, R., Islam, S., Das, S. K., and Kaginalkar, A.: Regional simulation of aerosol radiative effects and their influence on rainfall over India using WRFChem model, Atmos. Res., 182, 232–242, https://doi.org/10.1016/j.atmosres.2016.07.008, 2016.
Kedia, S., Das, S. K., Islam, S., Hazra, A., and Kumar, N.: Aerosols impact on the convective and non-convective rain distribution over the Indian region: Results from WRF-Chem simulation, Atmos. Environ., 202, 64–74, https://doi.org/10.1016/j.atmosenv.2019.01.020, 2019.
Koch, D. and Del Genio, A. D.: Black carbon semi-direct effects on cloud cover: review and synthesis, Atmos. Chem. Phys., 10, 7685–7696, https://doi.org/10.5194/acp-10-7685-2010, 2010.
Krishnamohan, K. S., Modak, A., and Bala, G.: Effects of local and remote black carbon aerosols on summer monsoon precipitation over india, Environ. Res. Commun., 3, 8, https://doi.org/10.1088/2515-7620/AC18D1, 2021.
Kristjánsson, J. E.: Studies of the aerosol indirect effect from sulfate and black carbon aerosols, J. Geophys. Res.-Atmos., 107, 1–19, https://doi.org/10.1029/2001JD000887, 2002.
Kumar, M., Parmar, K. S., Kumar, D. B., Mhawish, A., Broday, D. M., Mall, R. K., and Banerjee, T.: Long-term aerosol climatology over Indo-Gangetic Plain: Trend, prediction and potential source fields, Atmos. Environ., 180, 37–50, https://doi.org/10.1016/j.atmosenv.2018.02.027, 2018.
Kundu, S. S., Borgohain, A., Barman, N., Devi, M., and Raju, P. L. N.: Spatial Variability and Radiative Impact of Aerosol along the Brahmaputra River Valley in India: Results from a Campaign, J. Environ. Prot., 09, 405–430, https://doi.org/10.4236/jep.2018.94026, 2018.
Lamarque, J.-F., Emmons, L. K., Hess, P. G., Kinnison, D. E., Tilmes, S., Vitt, F., Heald, C. L., Holland, E. A., Lauritzen, P. H., Neu, J., Orlando, J. J., Rasch, P. J., and Tyndall, G. K.: CAM-chem: description and evaluation of interactive atmospheric chemistry in the Community Earth System Model, Geosci. Model Dev., 5, 369–411, https://doi.org/10.5194/gmd-5-369-2012, 2012.
Lamb, D. and Verlinde, J.: Physics and Chemistry of clouds, Cambridge University Press, https://doi.org/10.1017/CBO9780511976377, 2011.
Lambe, A. T., Ahern, A. T., Wright, J. P., Croasdale, D. R., Davidovits, P., and Onasch, T. B.: Oxidative aging and cloud condensation nuclei activation of laboratory combustion soot, J. Aerosol Sci., 79, 31–39, https://doi.org/10.1016/j.jaerosci.2014.10.001, 2015.
Lau, K. M., Kim, M. K., and Kim, K. M.: Asian summer monsoon anomalies induced by aerosol direct forcing: The role of the Tibetan Plateau, Clim. Dynam., 26, 855–864, https://doi.org/10.1007/s00382-006-0114-z, 2006.
Lee, H. J., Jo, Y. J., Kim, S., Kim, D., Kim, J. M., Choi, D., Jo, H. Y., Bak, J., Park, S. Y., Jeon, W., and Kim, C. H.: Transboundary aerosol transport process and its impact on aerosol-radiation-cloud feedbacks in springtime over Northeast Asia, Sci. Rep.-UK, 12, 1–10, https://doi.org/10.1038/s41598-022-08854-1, 2022.
Liou, K. N.: An Introduction to Atmospheric Radiation, Academic Press, ISBN 9780080954592, 1980.
Liu, S., Aiken, A. C., Gorkowski, K., Dubey, M. K., Cappa, C. D., Williams, L. R., Herndon, S. C., Massoli, P., Fortner, E. C., Chhabra, P. S., Brooks, W. A., Onasch, T. B., Jayne, J. T., Worsnop, D. R., China, S., Sharma, N., Mazzoleni, C., Xu, L., Ng, N. L., Liu, D., Allan, J. D., Lee, J. D., Fleming, Z. L., Mohr, C., Zotter, P., Szidat, S., and Prévôt, A. S. H.: Enhanced light absorption by mixed source black and brown carbon particles in UK winter, Nat. Commun., 6, 8435, https://doi.org/10.1038/ncomms9435, 2015.
Liu, X. Y., Zhang, Y., Zhang, Q., and He, K. B.: Application of online-coupled WRF/Chem-MADRID in East Asia: Model evaluation and climatic effects of anthropogenic aerosols, Atmos. Environ., 124, 321–336, https://doi.org/10.1016/j.atmosenv.2015.03.052, 2016.
Lohmann, U. and Feichter, J.: Can the direct and semi-direct aerosol effect compete with the indirect effect on a global scale?, Geophys. Res. Lett., 28, 159–161, https://doi.org/10.1029/2000GL012051, 2001.
Manoj, M. G., Devara, P. C. S., Joseph, S., and Sahai, A. K.: Aerosol indirect effect during the aberrant Indian Summer Monsoon breaks of 2009, Atmos. Environ., 60, 153–163, https://doi.org/10.1016/j.atmosenv.2012.06.007, 2012.
Menon, S., Hansen, J., Nazarenko, L., and Luo, Y.: Climate effects of black carbon aerosols in China and India, Science, 297, 2250–2253, https://doi.org/10.1126/science.1075159, 2002.
Mitchell, J. M.: The Effect of Atmospheric Aerosols on Climate with Special Reference to Temperature near the Earth's Surface, https://doi.org/10.1175/1520-0450(1971)010<0703:teoaao>2.0.co;2, 1971.
Mondal, A., Lakshmi, V., and Hashemi, H.: Intercomparison of trend analysis of Multisatellite Monthly Precipitation Products and Gauge Measurements for River Basins of India, J. Hydrol., 565, 779–790, https://doi.org/10.1016/j.jhydrol.2018.08.083, 2018.
Morrison, H., Thompson, G., and Tatarskii, V.: Impact of cloud microphysics on the development of trailing stratiform precipitation in a simulated squall line: Comparison of one- and two-moment schemes, Mon. Weather Rev., 137, 991–1007, https://doi.org/10.1175/2008MWR2556.1, 2009.
Nair, V. S., Babu, S. S., Manoj, M. R., Moorthy, K. K., and Chin, M.: Direct radiative effects of aerosols over South Asia from observations and modeling, Clim. Dyn., 49, 1411–1428, https://doi.org/10.1007/s00382-016-3384-0, 2017.
Nakanishi, M. and Niino, H.: An improved Mellor–Yamada level-3 model: its numerical stability and application to a regional prediction of advection fog, Bound.-Lay. Meteorol., 119, 397–407, https://doi.org/10.1007/s10546-005-9030-8, 2006.
Nandan, R., Ratnam, M. V., Kiran, V. R., and Naik, D. N.: Aerosol-cloud interaction in water clouds observed using ground-based, in-situ, and satellite-based observations over an Indian continental region, Atmos. Res., 280, 106436, https://doi.org/10.1016/j.atmosres.2022.106436, 2022.
Nenes, A., Conant, W. C., and Seinfeld, J. H.: Black carbon radiative heating effects on cloud microphysics and implications for the aerosol indirect effect 2. Cloud microphysics, J. Geophys. Res.-Atmos., 107, AAC 24-1–AAC 24-11, https://doi.org/10.1029/2002jd002101, 2002.
Ojha, N., Naja, M., Singh, K. P., Sarangi, T., Kumar, R., Lal, S., Lawrence, M. G., Butler, T. M., and Chandola, H. C.: Variabilities in ozone at a semi-urban site in the Indo-Gangetic Plain region: Association with the meteorology and regional processes, J. Geophys. Res.-Atmos., 117, 1–19, https://doi.org/10.1029/2012JD017716, 2012.
Ojha, N., Sharma, A., Kumar, M., Girach, I., Ansari, T. U., Sharma, S. K., Singh, N., Pozzer, A., and Gunthe, S. S.: On the widespread enhancement in fine particulate matter across the Indo-Gangetic Plain towards winter, Sci. Rep.-UK, 10, 1–9, https://doi.org/10.1038/s41598-020-62710-8, 2020.
Pai, D. S., Sridhar, L., Rajeevan, M., Sreejith, O. P., Satbhai, N. S., and Mukhopadhyay, B.: Development of a new high spatial resolution (0.25∘ × 0.25∘) long period (1901–2010) daily gridded rainfall data set over India and its comparison with existing data sets over the region, Mausam, 65, 1–18, 2014.
Pathak, B., Kalita, G., Bhuyan, K., Bhuyan, P. K., and Moorthy, K. K.: Aerosol temporal characteristics and its impact on shortwave radiative forcing at a location in the northeast of India, J. Geophys. Res.-Atmos., 115, 1–14, https://doi.org/10.1029/2009JD013462, 2010.
Pathak, B., Subba, T., Dahutia, P., Bhuyan, P. K., Moorthy, K. K., Gogoi, M. M., Babu, S. S., Chutia, L., Ajay, P., Biswas, J., Bharali, C., Borgohain, A., Dhar, P., Guha, A., De, B. K., Banik, T., Chakraborty, M., Kundu, S. S., Sudhakar, S., and Singh, S. B.: Aerosol characteristics in north-east India using ARFINET spectral optical depth measurements, Atmos. Environ., 125, 461–473, https://doi.org/10.1016/j.atmosenv.2015.07.038, 2016.
Raju, A., Parekh, A., Chowdary, J. S., and Gnanaseelan, C.: Assessment of the Indian summer monsoon in the WRF regional climate model, Clim. Dynam., 44, 3077–3100, https://doi.org/10.1007/s00382-014-2295-1, 2015.
Ramanathan, V., Chung, C., Kim, D., Bettge, T., Buja, L., Kiehl, J. T., Washington, W. M., Fu, Q., Sikka, D. R., and Wild, M.: Atmospheric brown clouds: Impacts on South Asian climate and hydrological cycle, P. Natl. Acad. Sci. USA, 102, 5326–5333, https://doi.org/10.1073/pnas.0500656102, 2005.
Rana, A., Jia, S., and Sarkar, S.: Black carbon aerosol in India: A comprehensive review of current status and future prospects, Atmos. Res., 218, 207–230, https://doi.org/10.1016/j.atmosres.2018.12.002, 2019.
Rosenfeld, D.: Suppression of rain and snow by urban air pollution, Science, 287, 1793–1796, https://doi.org/10.1126/science.287.5459.1793, 2012.
Sarangi, C., Tripathi, S. N., Tripathi, S., and Barth, M. C.: Aerosol-cloud associations over gangetic basin during a typical monsoon depression event using WRF-Chem simulation, J. Geophys. Res., 120, 10974–10995, https://doi.org/10.1002/2015JD023634, 2015.
Sarkar, C., Roy, A., Chatterjee, A., Ghosh, S. K., and Raha, S.: Factors controlling the long-term (2009–2015) trend of PM 2.5 and black carbon aerosols at eastern Himalaya, India, Sci. Total Environ., 656, 280–296, https://doi.org/10.1016/j.scitotenv.2018.11.367, 2019.
Shiogama, H., Emori, S., Takahashi, K., Ogura, T. N., Nozawa, T., and Takemura, T.: Emission scenario dependency of precipitation on global warming in the MIROC3.2 model, J. Climate, 23, 2404–2417, https://doi.org/10.1175/2009JCLI3428.1, 2010.
Singh, S. and Gokhale, S.: Source apportionment and light absorption properties of black and brown carbon aerosols in the Brahmaputra River valley region, Urban Clim., 39, 100963, https://doi.org/10.1016/j.uclim.2021.100963, 2021.
Soni, P., Tripathi, S. N., and Srivastava, R.: Radiative effects of black carbon aerosols on Indian monsoon: a study using WRF-Chem model, Theor. Appl. Climatol., 132, 115–134, https://doi.org/10.1007/s00704-017-2057-1, 2017.
Talukdar, S., Venkat Ratnam, M., Ravikiran, V., and Chakraborty, R.: Influence of Black Carbon Aerosol on the Atmospheric Instability, J. Geophys. Res.-Atmos., 124, 5539–5554, https://doi.org/10.1029/2018JD029611, 2019.
Tewari, M., Chen, F., Wang, W., Dudhia, J., LeMone, M. A., Mitchell, K., Ek., M., Gayno, G., Weigel, J., and Cuenca, R. H.: Implementation and verification of the unified NOAH land surface model in the WRF model, 20th Conf. Weather Anal. Forecast. Conf. Numer. Weather Predict., 11–15, https://doi.org/10.1007/s11269-013-0452-7, 2004.
Tiwari, S., Kumar, R., Tunved, P., Singh, S., and Panicker, A. S.: Significant cooling effect on the surface due to soot particles over Brahmaputra River Valley region, India: An impact on regional climate, Sci. Total Environ., 562, 504–516, https://doi.org/10.1016/j.scitotenv.2016.03.157, 2016.
Tripathi, S. N., Dey, S., Tare, V., and Satheesh, S. K.: Aerosol black carbon radiative forcing at an industrial city in northern India, Geophys. Res. Lett., 32, 1–4, https://doi.org/10.1029/2005GL022515, 2005.
Twomey, S.: The influence of pollution on the shortwave albedo of clouds, J. Atmos. Sci., 1149–1152, https://doi.org/10.1175/1520-0469(1977)034<1149:TIOPOT>2.0.CO;2, 1977.
Wang, K., Zhang, Y., Yahya, K., Wu, S. Y., and Grell, G.: Implementation and initial application of new chemistry-aerosol options in WRF/Chem for simulating secondary organic aerosols and aerosol indirect effects for regional air quality, Atmos. Environ., 115, 716–732, https://doi.org/10.1016/j.atmosenv.2014.12.007, 2015.
Wang, K., Hattori, S., Lin, M., Ishino, S., Alexander, B., Kamezaki, K., Yoshida, N., and Kang, S.: Isotopic constraints on atmospheric sulfate formation pathways in the Mt. Everest region, southern Tibetan Plateau, Atmos. Chem. Phys., 21, 8357–8376, https://doi.org/10.5194/acp-21-8357-2021, 2021.
Wang, T., Li, S., Shen, Y., Deng, J., and Xie, M.: Investigations on direct and indirect effect of nitrate on temperature and precipitation in China using a regional climate chemistry modeling system, J. Geophys. Res.-Atmos., 115, 1–13, https://doi.org/10.1029/2009JD013264, 2010.
Wang, Y., Zheng, X., Dong, X., Xi, B., Wu, P., Logan, T., and Yung, Y. L.: Impacts of long-range transport of aerosols on marine-boundary-layer clouds in the eastern North Atlantic, Atmos. Chem. Phys., 20, 14741–14755, https://doi.org/10.5194/acp-20-14741-2020, 2020.
Wang, Z., Xue, L., Liu, J., Ding, K., Lou, S., Ding, A., Wang, J., and Huang, X.: Roles of Atmospheric Aerosols in Extreme Meteorological Events: a Systematic Review, Curr. Pollut. Reports, 8, 177–188, https://doi.org/10.1007/s40726-022-00216-9, 2022.
Wiedinmyer, C., Akagi, S. K., Yokelson, R. J., Emmons, L. K., Al-Saadi, J. A., Orlando, J. J., and Soja, A. J.: The Fire INventory from NCAR (FINN): a high resolution global model to estimate the emissions from open burning, Geosci. Model Dev., 4, 625–641, https://doi.org/10.5194/gmd-4-625-2011, 2011.
Yang, Q., W. I. Gustafson Jr., Fast, J. D., Wang, H., Easter, R. C., Morrison, H., Lee, Y.-N., Chapman, E. G., Spak, S. N., and Mena-Carrasco, M. A.: Assessing regional scale predictions of aerosols, marine stratocumulus, and their interactions during VOCALS-REx using WRF-Chem, Atmos. Chem. Phys., 11, 11951–11975, https://doi.org/10.5194/acp-11-11951-2011, 2011.
Yu, F., Ma, X., and Luo, G.: Anthropogenic contribution to cloud condensation nuclei and the first aerosol indirect climate effect, Environ. Res. Lett., 8, 2, https://doi.org/10.1088/1748-9326/8/2/024029, 2013.
Zaveri, R. A., Easter, R. C., Fast, J. D., and Peters, L. K.: Model for Simulating Aerosol Interactions and Chemistry (MOSAIC), J. Geophys. Res.-Atmos., 113, 1–29, https://doi.org/10.1029/2007JD008782, 2008.
Zaveri, R. A., Easter, R. C., Singh, B., Wang, H., Lu, Z., Tilmes, S., Emmons, L. K., Vitt, F., Zhang, R., Liu, X., Ghan, S. J., and Rasch, P. J.: Development and Evaluation of Chemistry-Aerosol-Climate Model CAM5-Chem-MAM7-MOSAIC: Global Atmospheric Distribution and Radiative Effects of Nitrate Aerosol, J. Adv. Model. Earth Syst., 13, 1–24, https://doi.org/10.1029/2020MS002346, 2021.
Zhang, Y., Wen, X. Y., and Jang, C. J.: Simulating chemistry-aerosol-cloud-radiation-climate feedbacks over the continental U.S. using the online-coupled Weather Research Forecasting Model with chemistry (WRF/Chem), Atmos. Environ., 44, 3568–3582, https://doi.org/10.1016/j.atmosenv.2010.05.056, 2010.
Zhao, C., Liu, X., Leung, L. R., Johnson, B., McFarlane, S. A., Gustafson Jr., W. I., Fast, J. D., and Easter, R.: The spatial distribution of mineral dust and its shortwave radiative forcing over North Africa: modeling sensitivities to dust emissions and aerosol size treatments, Atmos. Chem. Phys., 10, 8821–8838, https://doi.org/10.5194/acp-10-8821-2010, 2010.
Zhao, C., Liu, X., Ruby Leung, L., and Hagos, S.: Radiative impact of mineral dust on monsoon precipitation variability over West Africa, Atmos. Chem. Phys., 11, 1879–1893, https://doi.org/10.5194/acp-11-1879-2011, 2011.