the Creative Commons Attribution 4.0 License.
the Creative Commons Attribution 4.0 License.
 | 02 Jun 2023
Global sensitivities of reactive N and S gas and particle concentrations and deposition to precursor emissions reductions
Massimo Vieno
David S. Stevenson
Peter Wind
The reduction of fine particles (PM2.5) and reactive N (Nr) and S (Sr) species is a key objective for air pollution control policies because of their major adverse effects on human health, ecosystem diversity, and climate. The sensitivity of global and regional Nr, Sr, and PM2.5 to 20 % and 40 % individual and collective reductions in anthropogenic emissions of NH3, NOx, and SOx (with respect to a 2015 baseline) is investigated using the EMEP MSC-W (European Monitoring and Evaluation Programme Meteorological Synthesizing Centre – West) atmospheric chemistry transport model with WRF (Weather Research and Forecasting) meteorology. Regional comparisons reveal that the individual emissions reduction has multiple co-benefits and small disbenefits on different species, and those effects are highly geographically variable. A 40 % NH3 emission reduction decreases regional average NH3 concentrations by 47 %–49 % but only decreases NH by 18 % in Euro_Medi, 15 % in East Asia, 12 % in North America, and 4 % in South Asia. This order follows the regional ammonia richness. A disbenefit is the increased SO2 concentrations in these regions (10 %–16 % for 40 % reductions) because reduced NH3 levels decrease SO2 deposition through altering atmospheric acidity. A 40 % NOx emission reduction reduces NOx concentrations in East Asia by 45 %, Euro_Medi and North America by ∼ 38 %, and South Asia by 22 %, whilst the regional order is reversed for fine NO, which is related to enhanced O3 levels in East Asia (and also, but by less, in Euro_Medi) and decreased O3 levels in South Asia (and also, but by less, in North America). Consequently, the oxidation of NOx to NO and of SO2 to SO is enhanced in East Asia but decreased in South Asia, which causes a less effective decrease in NO and even an increase in SO in East Asia but quite the opposite in South Asia. For regional policy making, it is thus vital to reduce three precursors together to minimize such adverse effects. A 40 % SOx emission reduction is slightly more effective in reducing SO2 (42 %–45 %) than SO (34 %–38 %), whilst the disbenefit is that it yields a ∼ 12 % increase in total NH3 deposition in the four regions, which further threatens ecosystem diversity. This work also highlights important messages for policy makers concerning the mitigation of PM2.5. More emissions controls focusing on NH3 and NOx are necessary for regions with better air quality, such as northern Europe and eastern North America. In East Asia, the three individual reductions are equally effective, whilst in South Asia only SOx reduction is currently effective. The geographically varying non-one-to-one proportionality of chemical responses of Nr, Sr, and PM2.5 to emissions reductions revealed by this work show the importance of both prioritizing emissions strategies in different regions and combining several precursor reductions together to maximize the policy effectiveness.
- Article
(25224 KB) - Full-text XML
-
Supplement
(4533 KB) - BibTeX
- EndNote


Reactive N (Nr) and S (Sr) species are critical determinants of air quality. A substantial proportion of ambient PM2.5 (particulate matter with aerodynamic diameter ≤ 2.5 µm) is secondary inorganic aerosol (SIA) formed from chemical reactions of emissions of the precursor gases NH3, NOx (NO and NO2), and SOx (sulfur oxides, mainly SO2) (Behera et al., 2013; Weber et al., 2016; Vasilakos et al., 2018; Nenes et al., 2020). PM2.5 is consistently associated with elevated risk of all-cause mortality and other adverse health impacts (Hart et al., 2015; Chen et al., 2017; C. Chen et al., 2018; Karimi et al., 2019; Stieb et al., 2020). The gases NO2 and SO2 are also direct health pollutants. In addition, oxidized N (e.g. NOx, HNO3, and NO, collectively abbreviated as OXN) and reduced N (e.g. NH3 and NH, collectively abbreviated as RDN) species are powerful nutrients for plants and microorganisms, whose deposition leads to eutrophication and loss of ecosystem biodiversity (Erisman et al., 2005; Bergström and Jansson, 2006; Sun et al., 2017; Kharol et al., 2018). The severity of the adverse effects of N deposition is determined not only by the total quantity but also by its form. Many studies show different N deposition components have varying toxicity to different plants; dry deposition of NH3 is particularly deleterious, for example (Van Herk et al., 2003; Sheppard et al., 2011; Sutton et al., 2014, 2020; Pescott et al., 2015). Deposition of oxidized S (i.e. SO2 and SO, collectively abbreviated as OXS) also greatly influences precipitation acidity (Lu et al., 2010; Aas et al., 2019; McHale et al., 2021). These observations put greater emphasis on mitigation of certain deposition components.
The East Asia, South Asia, Euro_Medi (Europe and Mediterranean), and North America regions have high population density and high Nr and Sr pollution. Historically, Europe and North America were the dominant emissions regions, suffering severe air pollution until the late 20th century. As reductions in SOx and NOx emissions took effect in Europe and North America, emissions in East and South Asia increased dramatically due to rapid industrialization and dominated global Nr and Sr emissions by the early 21st century (Weber et al., 2016; NEC, 2019; Fowler et al., 2020), although China, in particular, is now implementing effective SOx and NOx emissions controls (Liu et al., 2016; Hoesly et al., 2018; Zheng et al., 2018; Meng et al., 2022). In contrast, a lack of action on NH3 emissions in most countries, coupled with the growth in agriculture to feed a rising global population, means that global NH3 emissions continue to grow (Heald et al., 2012; Fowler et al., 2015; Aksoyoglu et al., 2020). As a result, ambient Nr and Sr pollution remains a major health and environmental concern in most regions. The European Environmental Agency reported that 97 % of the urban population in the European Union in 2019 was exposed to annual mean concentrations of PM2.5 above the latest World Health Organization (WHO) air quality guideline of 5 µg m−3 (EEA, 2021; WHO, 2021), whilst the United States Environmental Protection Agency reported that for the period 2014–2016 only 10 % of its 429 monitoring sites had PM2.5 concentrations < 6.0 µg m−3 (USEPA, 2017). Combining satellite retrievals, chemistry model simulations, and ground level measurements, Ma et al. (2014) and Brauer et al. (2016) showed that in 2013 the majority of the East and South Asia populations lived in areas where annual mean PM2.5 concentrations exceeded the WHO Interim Target 1 of 35 µg m−3 (WHO, 2021). Furthermore, as mitigation of NOx emissions in recent years has been more effective than for NH3, deposition of RDN is now increasingly responsible for the exceedances of N critical loads for eutrophication in many regions (Jovan et al., 2012; X. Chen et al., 2018; Simpson et al., 2020a; Yi et al., 2021; Jonson et al., 2022).
Understanding the sensitivities of PM2.5, Nr, and Sr pollution to emissions reductions is complicated not only by the substantial regional heterogeneity in relative emissions but also by the substantial meteorological heterogeneity influencing the chemistry and deposition. This necessitates use of atmospheric chemistry transport models (ACTMs) designed to simulate the underlying physical–chemical processes linking emissions, dispersion, chemical reactions, and deposition of atmospheric components. Previous ACTM studies have provided insight into the complexities of the sensitivity of PM2.5 and its SIA components to changes in emissions in different regions that measurements cannot reveal. For example, using the GEOS-Chem model, Wang et al. (2013) showed that SIA concentrations in 2015 decreased in South China and the Sichuan Basin but increased in North China compared to their 2006 levels in response to −16 % SO2 and +16 % NOx emissions changes (no change in NH3 emissions) from 2006 to 2015 according to China's 12th 5-year plan, but if NH3 emissions increase by +16 % (based on their growth rate from 2006 to 2015), the SIA reduction due to SO2 reduction will be totally offset in all regions because of the elevated NH3NO3 formation, demonstrating the importance of NH3 control on China's SIA mitigation. Pommier et al. (2018) reported substantial projected growth in emissions in India between 2011 and 2050, amounting to 304 % for SOx, 287 % for NMVOCs (non-methane volatile organic compounds), 162 % for NOx, 100 % for primary PM2.5, and 60 % for CO and NH3, leading to increases in annual mean PM2.5 and O3 concentrations of 67 % and 13 %, respectively. In the UK, results from EMEP4UK model simulations for 2010 emissions and meteorology indicated that NH3 emissions reductions are the most effective single-component control (compared to individual reductions in NOx, SOx, and primary PM2.5) on area-weighted PM2.5, whilst weighting by population placed greater emphasis on reductions in emissions of primary PM2.5 (Vieno et al., 2016). Holt et al. (2015) used GEOS-Chem to investigate PM2.5 sensitivities in the United States to emissions reductions between two sets of scenarios representing a 2005 baseline (high emissions) and a 2012 analogue (low emissions). They found larger sensitivities of PM2.5 to SOx and NOx controls in the low emissions case, since lower NOx emissions in 2012 enhance the relative importance of aqueous-phase SO2 oxidation.
These studies analysed Nr and Sr responses to precursor emissions reductions in the early 2000s and in specific regions but do not provide a global view of sensitivities to the same reductions everywhere. Given the considerable emissions changes in global and regional NH3, NOx, and SOx in recent years (Hoesly et al., 2018; Kurokawa and Ohara, 2020), our understanding of the current chemical climate for Nr and Sr reactions on the global and regional scale and how it affects responses of PM2.5, Nr and Sr species to various emissions reductions should be updated. This is the motivation for the work presented here, which provides a global picture of the effectiveness of NH3, NOx, and SOx emissions reductions for mitigating both concentration and deposition of Nr and Sr pollutants. We used the EMEP MSC-W (European Monitoring and Evaluation Programme Meteorological Synthesizing Centre – West) ACTM to simulate the global domain based on global emissions and meteorology in 2015, which enables a regional comparison to be conducted with inherently consistent simulations. The focus here is on annual means, as these are the long-term metric within global and regional air quality standards. We first describe the model set-up and performance and the sensitivity experiments used to simulate responses of PM2.5, Nr, and Sr species to 20 % and 40 % reductions in gaseous precursor emissions (Sect. 2). Section 3 details the global and regional concentration and deposition changes in components of RDN, OXN, OXS, and PM2.5 between baseline and emissions reduction scenarios. Section 4 discusses key processes that determine the benefits and disbenefits of emissions reductions and how they vary geographically, as well as the implications of our findings for policy making.
2.1 Model set-up and performance
The EMEP MSC-W open-source atmospheric chemistry transport model (https://www.emep.int, last access: 8 August 2022) is a three-dimensional Eulerian model, widely used for both scientific research and policy development (Bergström et al., 2014; Jonson et al., 2017; Pommier et al., 2018; McFiggans et al., 2019; Karl et al., 2019; Pommier et al., 2020; Jonson et al., 2022). Version rv4.34 was used here. A detailed technical description of EMEP MSC-W rv4.0 is documented in Simpson et al. (2012). A series of overviews of model updates from version rv4.0 to rv4.34 is documented in annual EMEP status reports (Simpson et al., 2013; Tsyro et al., 2014; Simpson et al., 2015, 2016, 2017, 2018, 2019, 2020b). Meteorology for 2015 was derived from the Weather Research and Forecasting model (WRF, https://www.mmm.ucar.edu/models/wrf; https://github.com/wrf-model/WRF/releases/tag/v4.2.2, last access: 8 August 2022) version 4.2.2. The coupled EMEP–WRF system has been tested and applied to many regional and global studies (Vieno et al., 2010, 2014, 2016; Werner et al., 2018; Chang et al., 2020; Gu et al., 2021).
Detailed global EMEP–WRF configurations used in this work are presented in Y. Ge et al. (2021, 2022). In brief, the global domain has a horizontal resolution of 1∘ × 1∘ and 21 terrain-following vertical layers from the surface up to 100 hPa. The height of the lowest model layer is around 45 m. The model outputs of surface concentrations are adjusted to correspond to 3 m above ground level in order to provide concentrations at heights more typical of ambient measurements and human exposure (Simpson et al., 2012). The aerosol module is the EQuilibrium Simplified Aerosol Model V4 (EQSAM4clim), which parameterizes a full gas–liquid–solid partitioning scheme for semi-volatile and non-volatile mixtures. Details are described in Metzger et al. (2016, 2018). Dry deposition of gaseous species and aerosol components to the ground surface is simulated, utilizing deposition velocity as described in Simpson et al. (2012, 2020a). The parameterization of wet deposition incorporates both in-cloud and below-cloud scavenging of gases and particles (Berge and Jakobsen, 1998; Simpson et al., 2012).
The global model evaluation of Nr and Sr concentrations and wet deposition from this model configuration for 2010 and 2015 against measurements from 10 ambient monitoring networks is documented in Y. Ge et al. (2021) and demonstrates the model's capability for capturing the spatial and seasonal variations of NH3, NH, NO2, HNO3, NO, SO2, and SO in East Asia, South East Asia, Europe, and North America. For instance, the correlation coefficients between global model and measurement annual mean concentrations for most species in 2015 are ≥0.78 and for annual wet deposition of RDN and OXN are 0.78 and 0.63, respectively. This is in spite of inherent uncertainty in both model and measurements and differences in their spatial representativeness. Section S1 in the Supplement also gives a brief introduction of the model performance compared to measurements for RDN species, as an example.
2.2 Emissions and model experiments
Baseline emissions for 2015 were from the ECLIPSE V6 (Evaluating the Climate and Air Quality Impacts of Short-Lived Pollutants) inventory, available at https://previous.iiasa.ac.at/web/home/research/researchPrograms/air/ECLIPSEv6b.html (last access: 8 August 2022). Monthly emissions profiles derived from EDGAR (Emission Database for Global Atmospheric Research, v4.3.2 datasets, available at https://edgar.jrc.ec.europa.eu/dataset_temp_profile, last access: 31 May 2023) time series (Crippa et al., 2020) were applied to the ECLIPSE annual emissions of SO2, NO2, NH3, CO, CH4, NMVOC, primary PM2.5, and coarse particles. Detailed implementation procedures including the re-assignment of ECLIPSE emissions sectors to EMEP sectors and the calculation of temporal profiles at a given country for a given pollutant are described in Y. Ge et al. (2021).
A baseline simulation and a set of eight sensitivity experiments were conducted for emissions and meteorology for 2015. Limited by available computational resources and storage space and taking the achievability of real-world emissions controls into account, the model experiments applied 20 % and 40 % reductions to global anthropogenic emissions of NH3, NOx, and SOx from all sectors both individually and collectively (i.e. reductions applied to all three species simultaneously). All other emissions, including natural emissions such as dimethyl sulfide from oceans, lightning NOx,, and soil NOx, were left unchanged.
The sensitivity (Sensitivityi) of the concentration/deposition of a species i is calculated as the absolute difference between the value in baseline (Baselinei) and in an emission reduction scenario (Scenarioi). Taking NH3 concentration as an example
For the relative sensitivity (Relative Sensitivityi)
The sensitivities of different species are calculated for all emissions reduction scenarios. The PM2.5 sensitivities derived from individual reductions in emissions of NH3, NOx, or SOx are used to define the sensitivity regimes for different regions in Sect. 3.2. For each model grid, the regime is decided by the precursor that yields the greatest decrease in grid PM2.5 concentration: NH3 sensitive, NOx sensitive, or SOx sensitive.
2.3 Definition of world regions
We compared the sensitivities to the emissions reductions of PM2.5, Nr, and Sr species concentrations and depositions in the four world regions of East Asia, South Asia, Euro_Medi, and North America, defined in Fig. 1 (and listed in Table S1 in the Supplement). These are based on regions used by the Intergovernmental Panel on Climate Change and as rationalized in Iturbide et al. (2020). All four regions are densely populated and have high Nr and Sr pollution. Besides, due to limitations in the number of publicly available measurements, our model outputs are evaluated against measurements in East Asia, Europe, and North America, and therefore we have greater confidence in sensitivity results in these three regions. South Asia is chosen because of its extreme ammonia richness, as revealed by Ge et al. (2022), which makes it an interesting comparison with other regions.
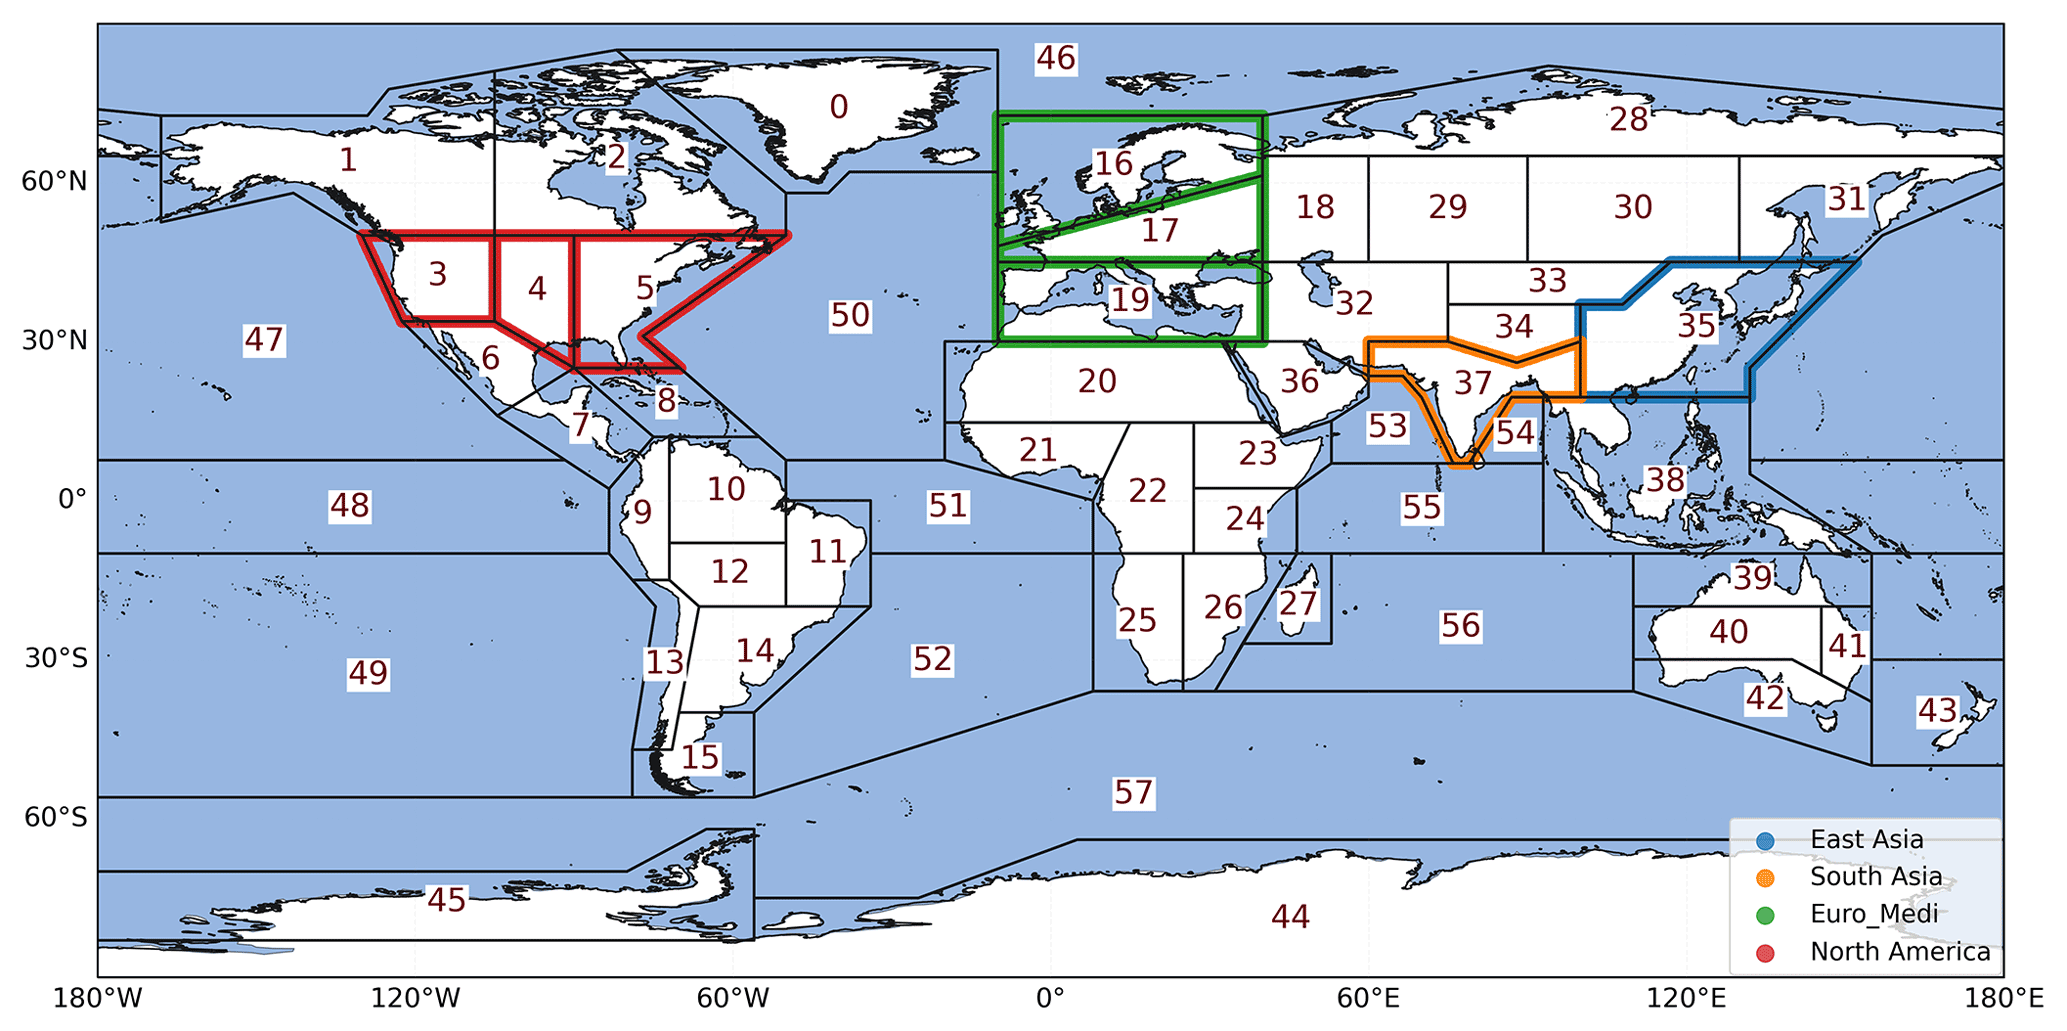
Figure 1The boundaries of the four world regions used in this study, which are based on the IPCC reference regions described in Iturbide et al. (2020).
3.1 Sensitivities of Nr and Sr gas and aerosol concentrations
The simulated global baseline 2015 annual mean surface concentrations of Nr and Sr have been discussed in detail in Ge et al. (2022). Here we analyse the sensitivities of the modelled surface concentrations to SIA precursor emissions reductions for RDN, OXN, and OXS components. Sensitivities differ according to consideration of primary or secondary components and show great geographical variation.
3.1.1 RDN
Figure 2 shows the spatial variations in the sensitivities of NH3 and NH annual mean surface concentrations to 20 % and 40 % emissions reductions in NH3, NOx, and SOx, individually and collectively. Regional average sensitivities in East Asia, South Asia, Euro_Medi, and North America are summarized in Fig. 3 and Table S2. Steeper gradients in Fig. 3 correspond to greater concentration changes (sensitivities).
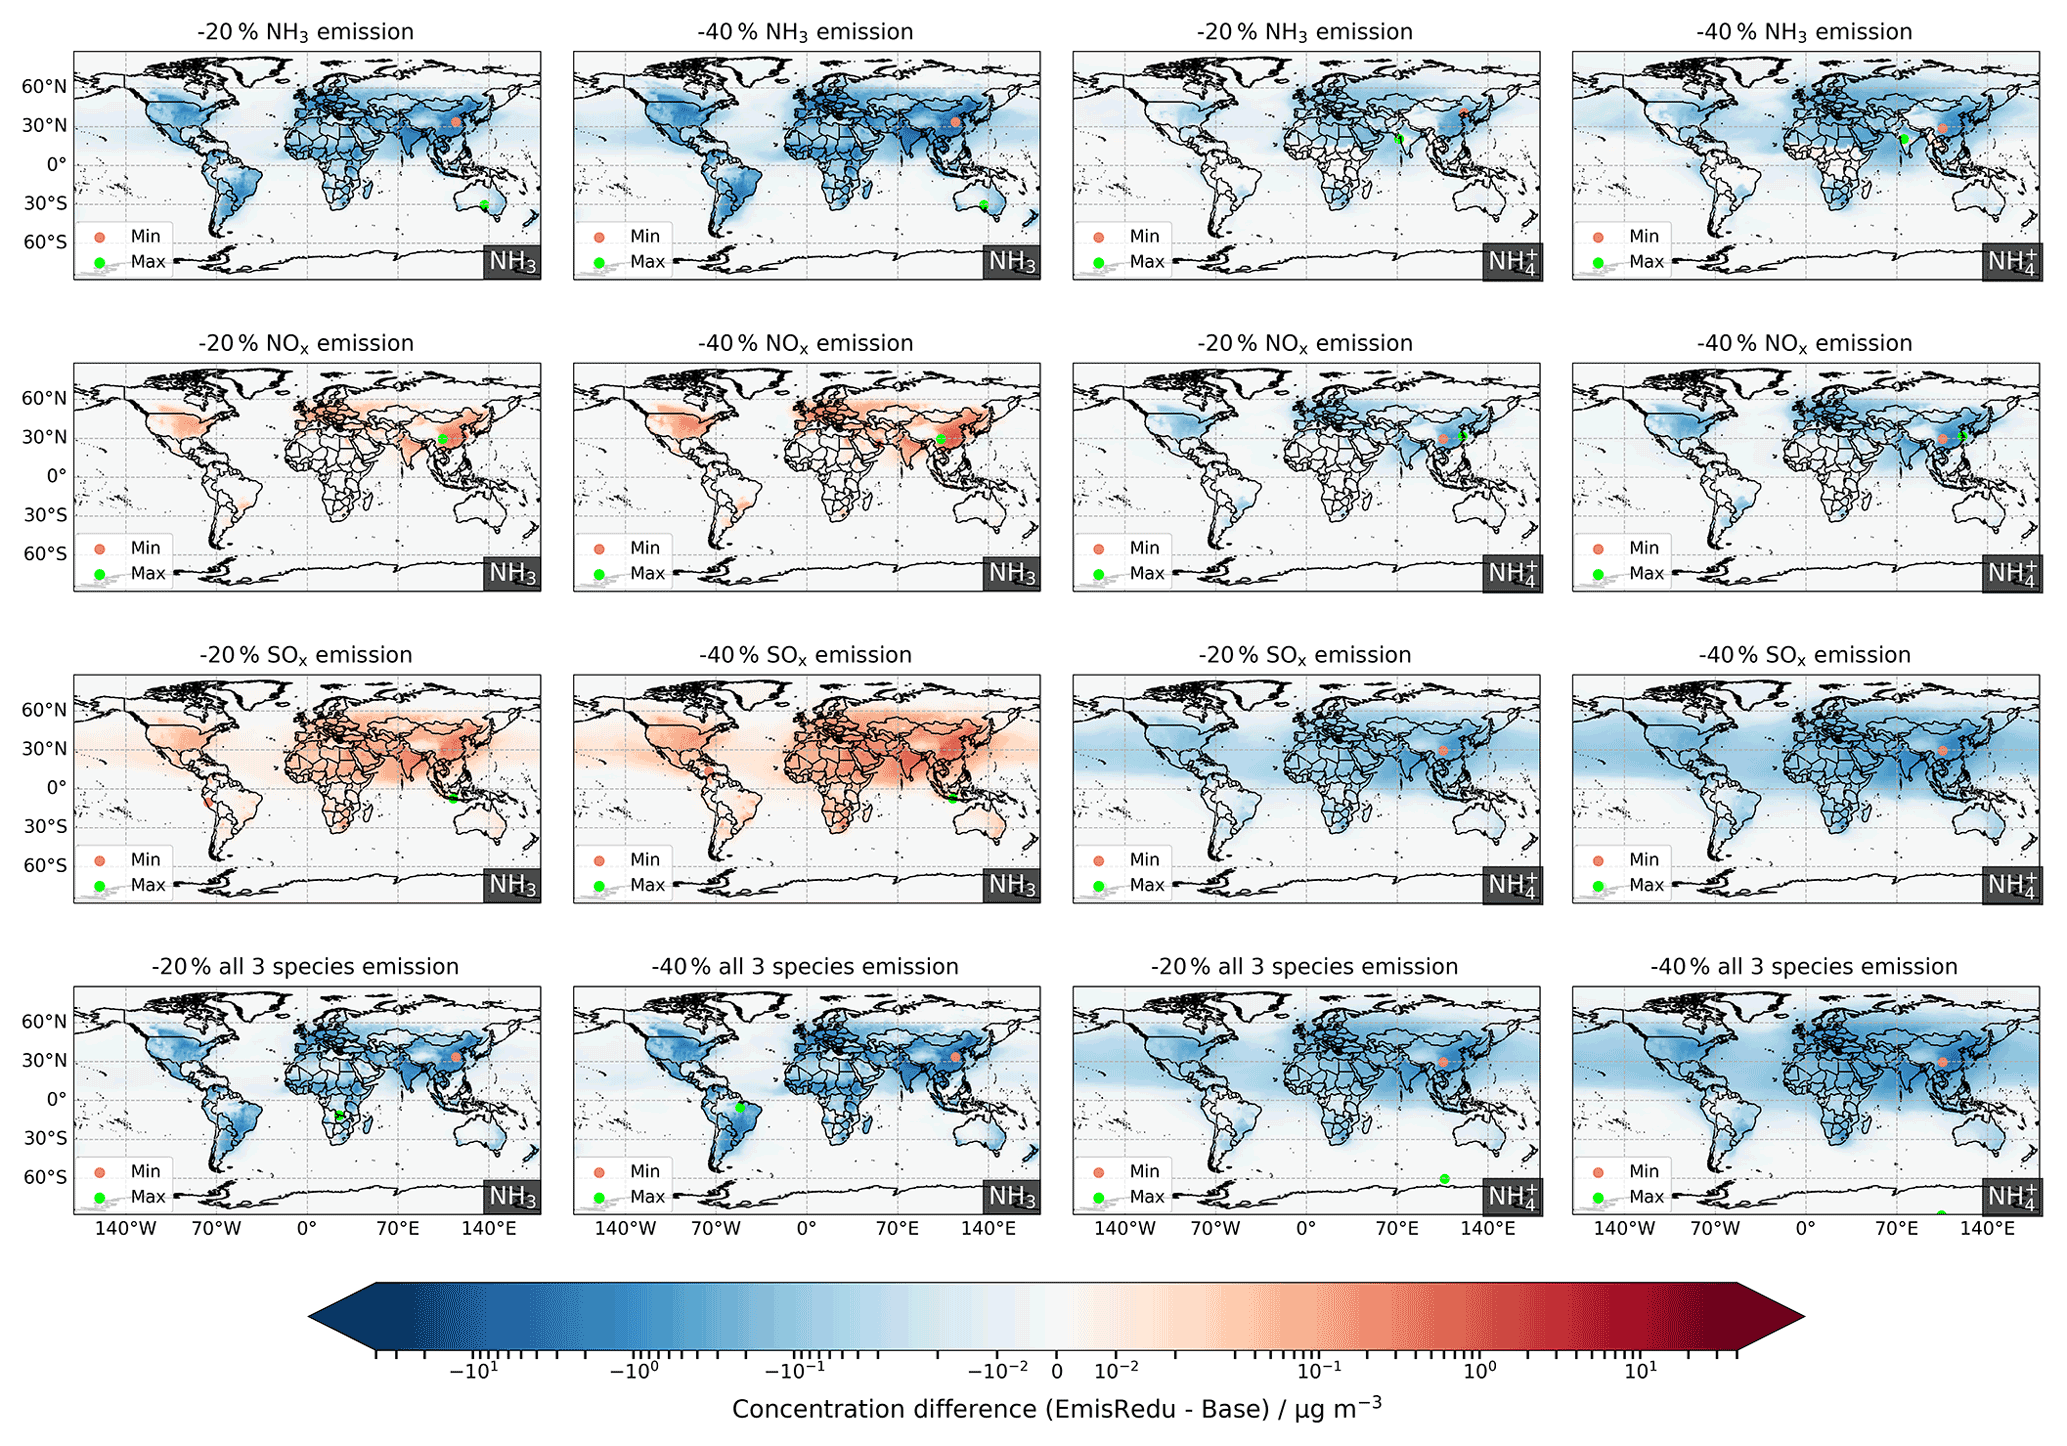
Figure 2Changes in NH3 and NH annual surface concentrations for 20 % and 40 % emissions reductions in NH3, NOx, and SOx, individually and collectively. Red and green dots in each map locate the minimum and maximum difference, respectively.
From these figures, it is clear that whilst reducing emissions of NH3 (and all three precursors together) decrease NH3 concentrations efficiently, reducing emissions of NOx or SOx lead to increases in NH3 concentrations, particularly over densely populated areas. The maximum reduction in model grid NH3 concentration across all scenarios reaches 16.6 µg m−3 (44 % change relative to baseline; expressed similarly hereafter) and occurs over East Asia in response to a 40 % reduction in NH3 emissions. The largest increase in NH3 concentration (1.51 µg m−3, 22 %) arises in South East Asia under the 40 % SOx emissions reduction scenario. Lower NOx and SOx emissions decrease the concentration of acidic species available to react with NH3 to form NH aerosol, so more of the emitted NH3 stays in the gas phase. Other studies have likewise shown that reductions in SO2 or NOx emissions are an important contributor to the growth in tropospheric NH3 concentrations globally and regionally (Saylor et al., 2015; Warner et al., 2017; Liu et al., 2018; Yu et al., 2018).
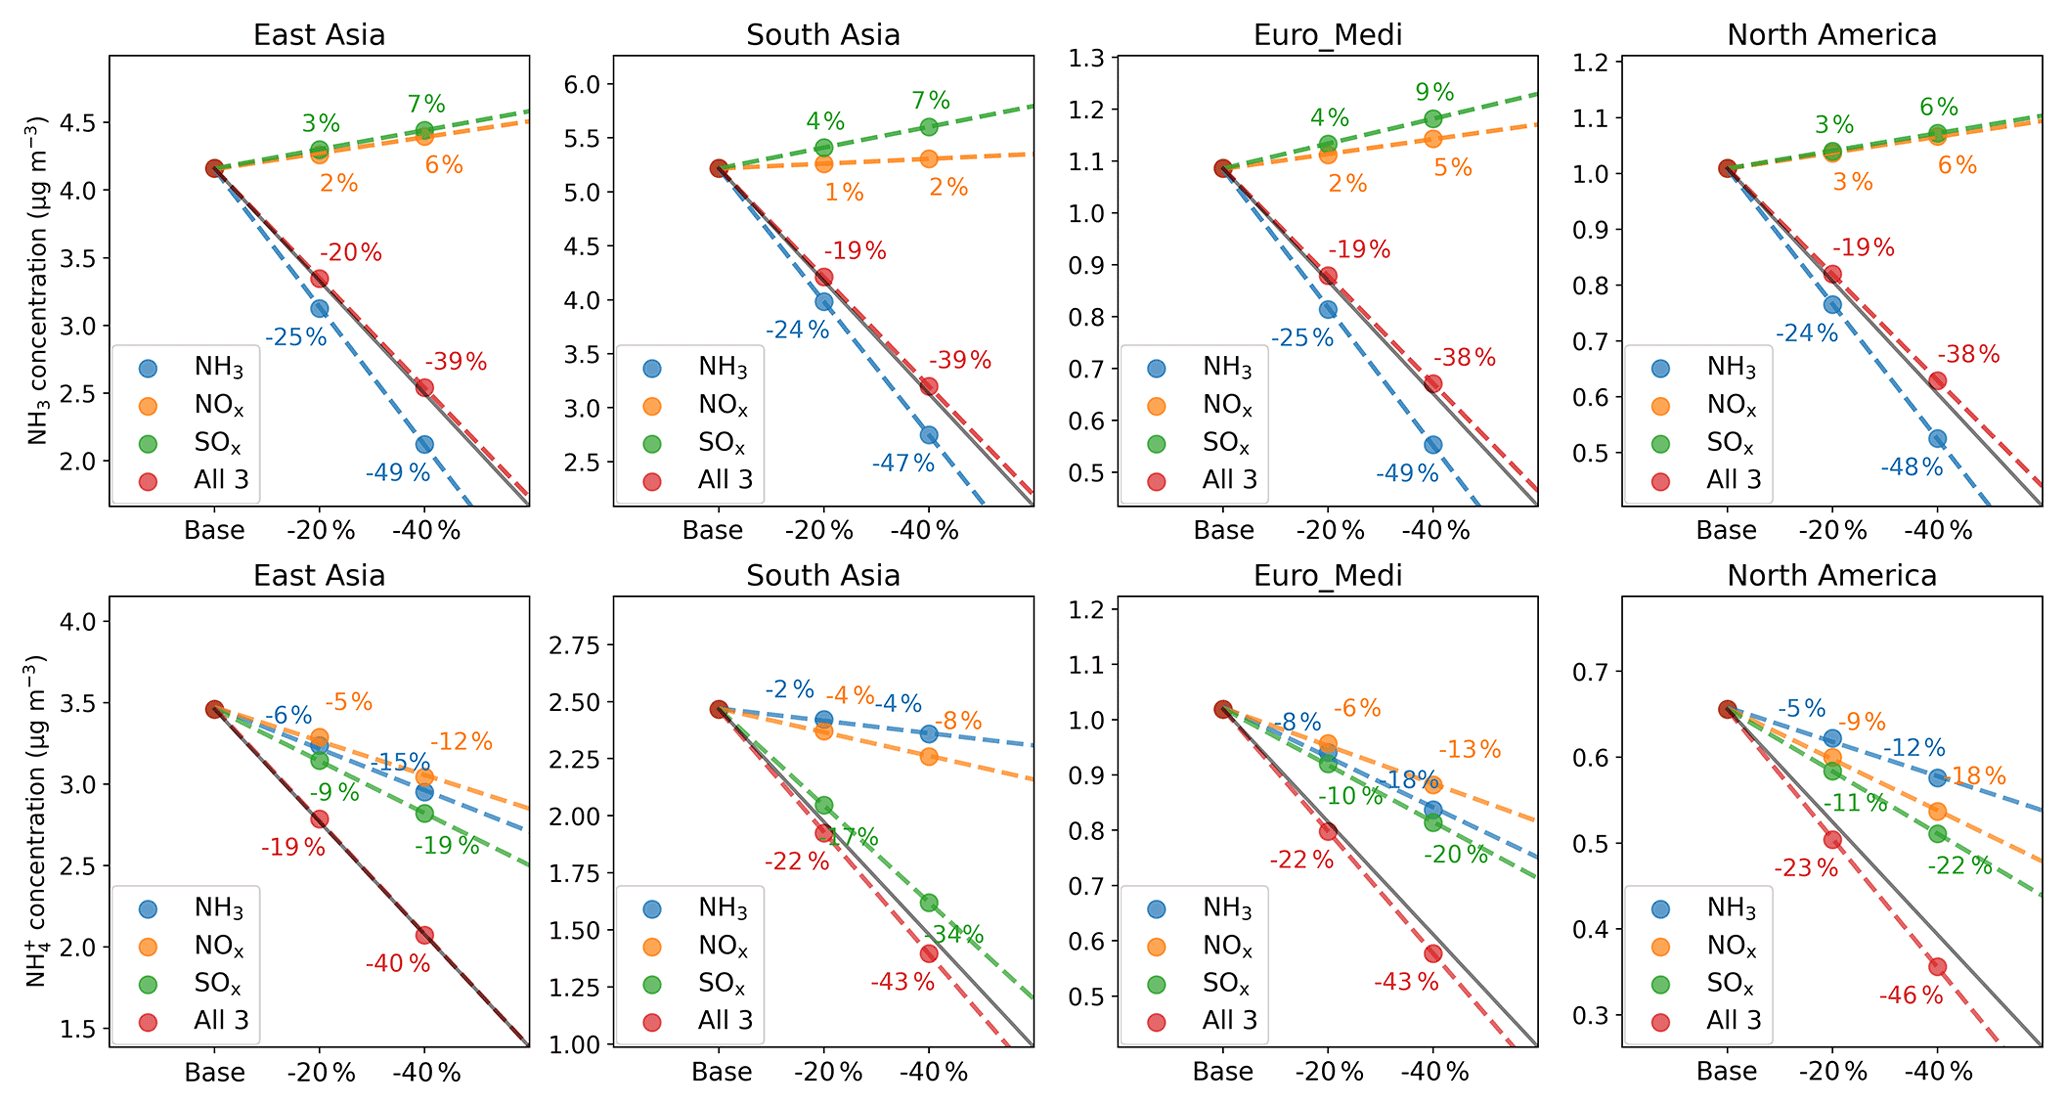
Figure 3The absolute and relative sensitivities of regionally averaged annual mean surface concentrations of NH3 (upper row) and NH (lower row) to 20 % and 40 % emissions reductions in NH3 (blue), NOx (orange), and SOx (green), individually and collectively (red), for the four regions defined in Fig. 1. The solid grey line in each panel illustrates the one-to-one relative response to emissions reductions, whilst the dashed coloured lines are the linear regressions through each set of three model simulations, and they illustrate the actual responses to emissions reductions of a given precursor. The numbers show the corresponding relative responses to each emissions reduction (with respect to baseline).
In East Asia and North America, NH3 concentrations increase similarly for either NOx or SOx reductions (Fig. 3), but in South Asia and Euro_Medi, NH3 concentrations increase more with SOx reductions than with NOx reductions, which reflects the larger contribution of (NH4)2SO4 than NH4NO3 to SIA in the latter two regions. However, the increase in NH3 concentrations is relatively small compared to the extent of NOx and SOx emissions reductions: 40 % reductions in emissions of NOx or SOx only increase NH3 concentrations in the four regions by 2 %–6 % or 6 %–9 %, respectively (Fig. 3, Table S2). The globally averaged increases in NH3 concentrations for 40 % reductions in NOx or SOx emissions are 3 % and 9 %, respectively. Nevertheless, the NH3 concentration decrease resulting from reductions in NH3 emissions is offset by simultaneous effects of NOx and SOx emissions reductions when all three precursors are reduced together, as the sensitivities of regional average NH3 concentrations to 40 % reductions in all three precursor emissions (38 %–39 % across the four regions) are smaller than their sensitivities to 40 % reductions in NH3 emissions on its own (47 %–49 %). It is also noteworthy that the sensitivities of regional average NH3 concentrations are essentially linear through 20 % and 40 % emissions reductions, irrespective of precursor, although the sensitivities are different between regions.
In contrast to NH3, concentrations of NH always decrease when an SIA precursor emission is reduced. Figure 2 shows that NH concentrations in the most densely populated continents (e.g. eastern China, India, Europe, eastern America) respond strongly to emissions reductions in each SIA precursor, whilst they only respond to SOx emissions reductions over oceans. This is related to the production of marine sulfate aerosol from dimethyl sulfide (DMS) and the lack of significant oceanic NOx emissions sources, which means only (NH4)2SO4 formation is important in marine SIA chemistry.
In addition, the impacts of NH3 and SOx emissions reductions on NH concentrations over North Africa are significantly greater than from NOx emissions reductions, indicating a dominance of (NH4)2SO4 within SIA in this region. This is consistent with the results reported by Ge et al. (2022). They showed that large areas in North Africa are characterized by the SO-rich chemical domain for SIA formation, which means that NH3 is predominantly taken up by SO, leaving no free NH3 to react with HNO3 to form NH4NO3. Given that emissions reductions in all three precursors individually lead to reductions in NH concentrations, it is not surprising that the greatest simulated NH reduction (5.87 µg m−3 (43 %) in East Asia) arises for the scenario with 40 % reductions in all three precursors collectively.
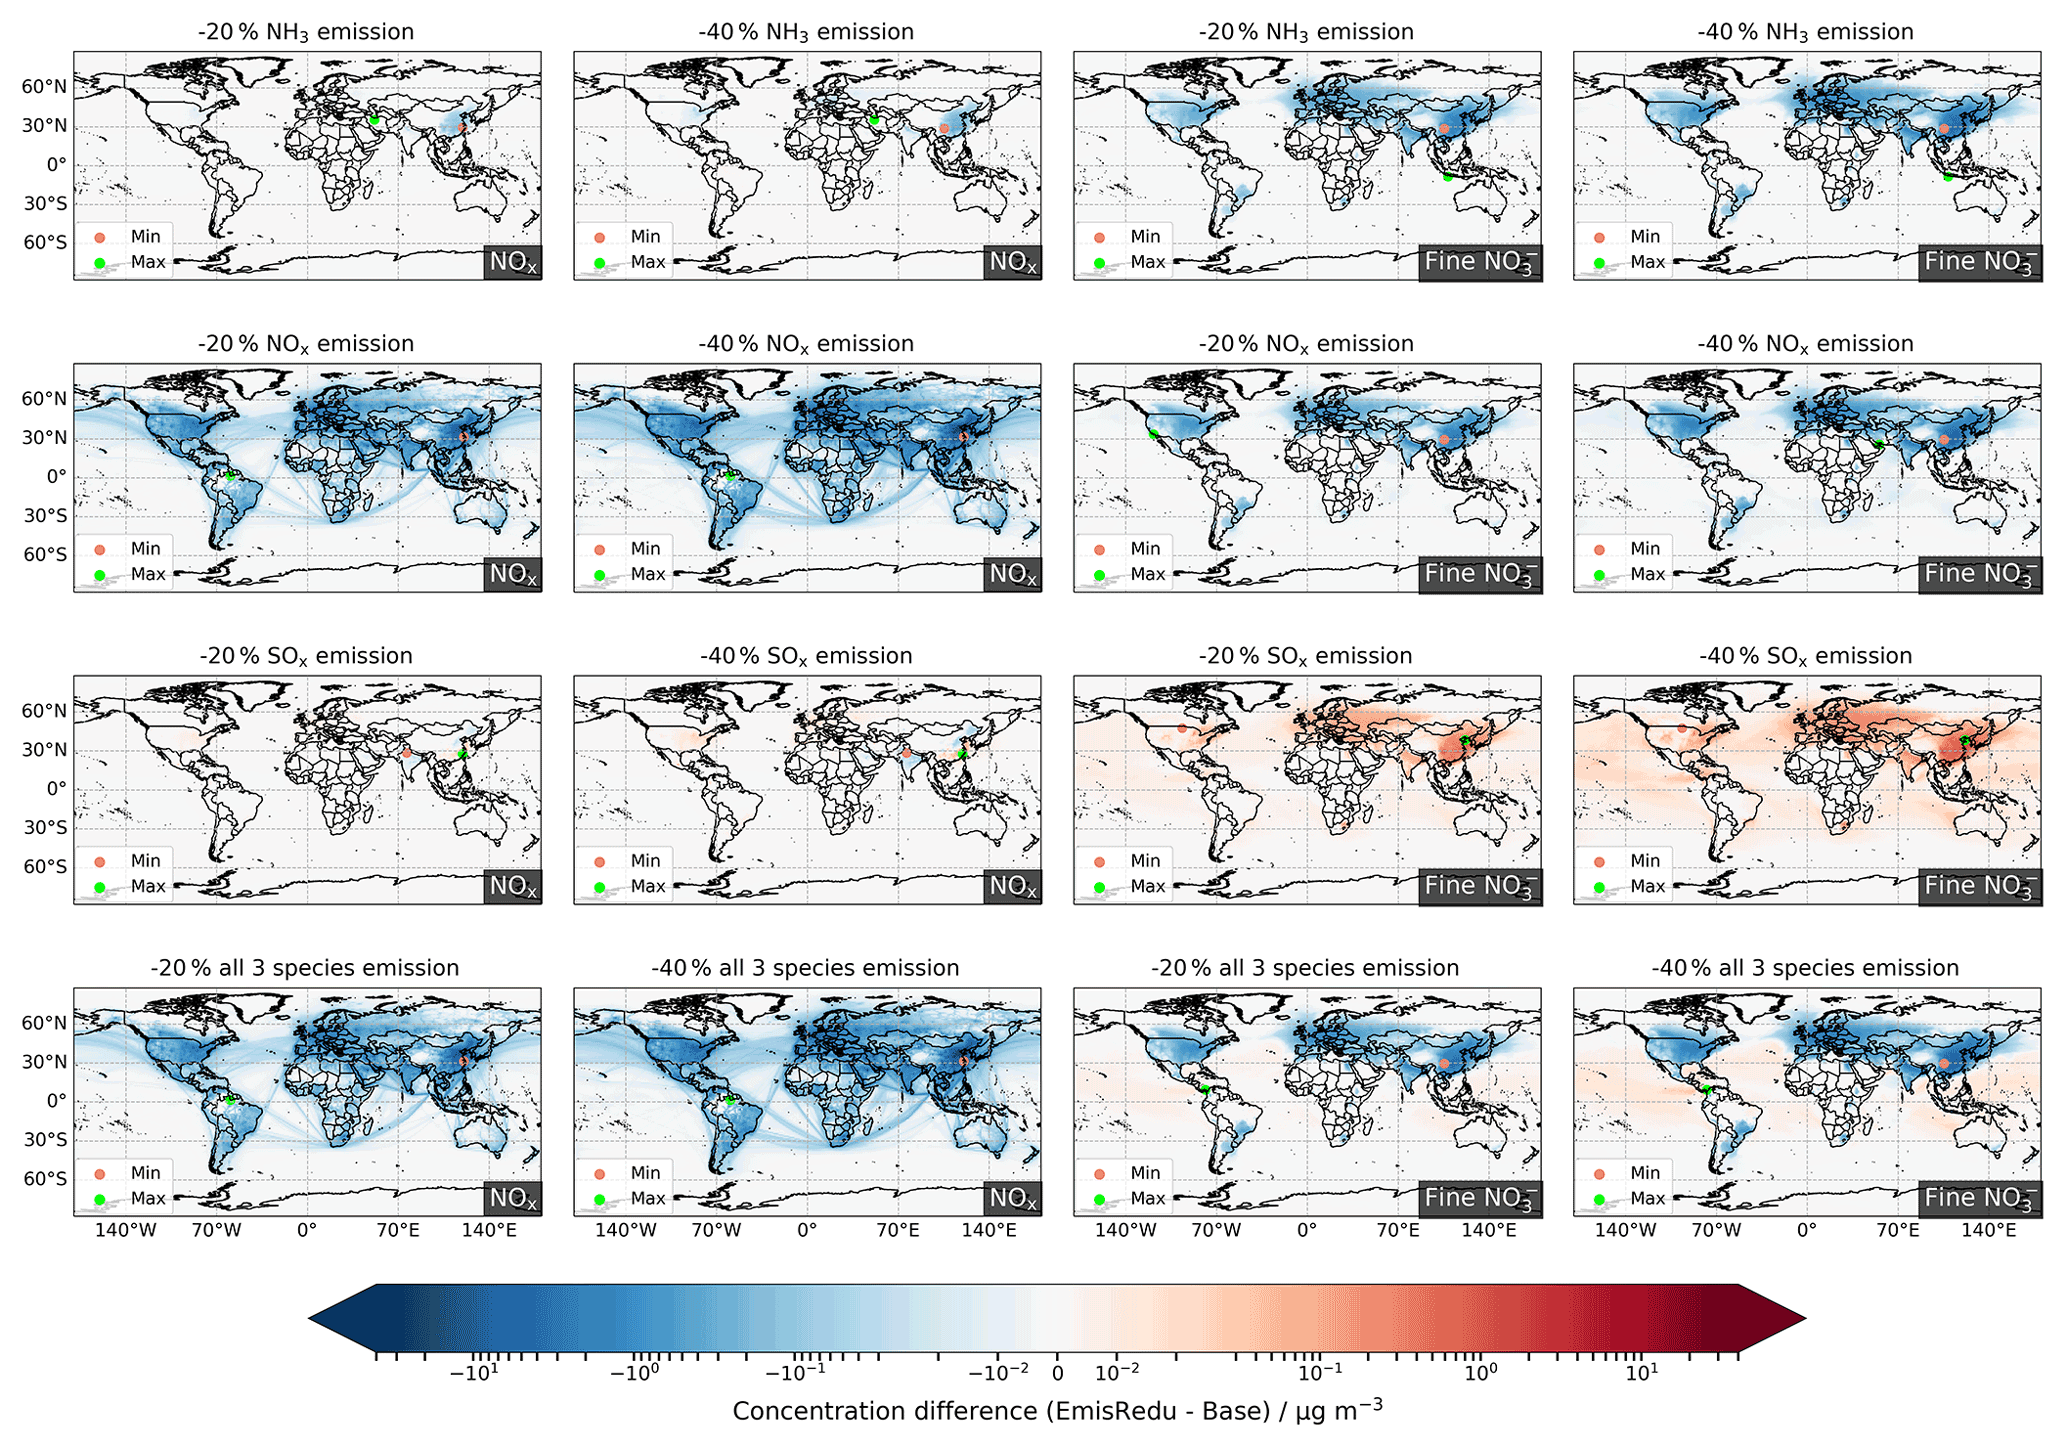
Figure 4Changes in NOx and fine NO annual surface concentrations for 20 % and 40 % emissions reductions in NH3, NOx, and SOx, individually and collectively. Red and green dots in each map locate the minimum and maximum difference, respectively.
Figure 3 also shows that NH sensitivities are essentially linear for emissions reductions up to 40 %, although responses again vary slightly with region. Among individual precursor reduction scenarios, regional average NH concentrations in East Asia and Euro_Medi are most sensitive to SOx emissions reductions and least sensitive to NOx reductions, while NH concentrations in North America are most sensitive to SOx reductions and least sensitive to NH3 reductions. In South Asia, NH is characterized by strong sensitivity to SOx emissions reductions but only relatively small sensitivities to NOx and NH3 emissions reductions. In the scenario of all three species reductions, all regions show relative sensitivities close to the one-to-one line. Another important observation from Fig. 3 is that reductions in NH (4 %–18 %) in response to a 40 % NH3 emissions reduction are much smaller than reductions of NH3 concentrations (47 %–49 %) in these regions, which reflects the fact that these regions are so ammonia rich that reducing NH3 emissions only has limited effects on NH concentrations.
3.1.2 OXN
Figure 4 shows the spatial variations in the sensitivities of NOx and fine nitrate annual mean surface concentrations to 20 % and 40 % emissions reductions in NH3, NOx, and SOx, individually and collectively. Regional average sensitivities in East Asia, South Asia, Euro_Medi, and North America are summarized in Fig. 5 and Table S3. Equivalent global maps and regional sensitivity plots for the responses of HNO3 and coarse nitrate to the same emissions reductions are presented in Figs. S2 and S3 and Table S3.
In contrast to surface NH3, whose concentrations are sensitive to reductions in emissions of each of NH3, NOx, and SOx, surface NOx concentrations only respond to NOx emissions reductions and have negligible sensitivity to NH3 and SOx emissions reductions. The 20 % and 40 % reductions in NOx emissions yield a global maximum of 25.6 µg m−3 (22 %) and 51.3 µg m−3 (44 %) reductions in surface NOx concentrations over East Asia. The globally averaged reductions in NOx concentrations for 20 % and 40 % reductions in NOx emissions are 15 % and 30 %, respectively (same values for simultaneous reductions in all three precursors), whereas the sensitivities for NH3 and SOx emissions reduction are all 0 % (Table S3).
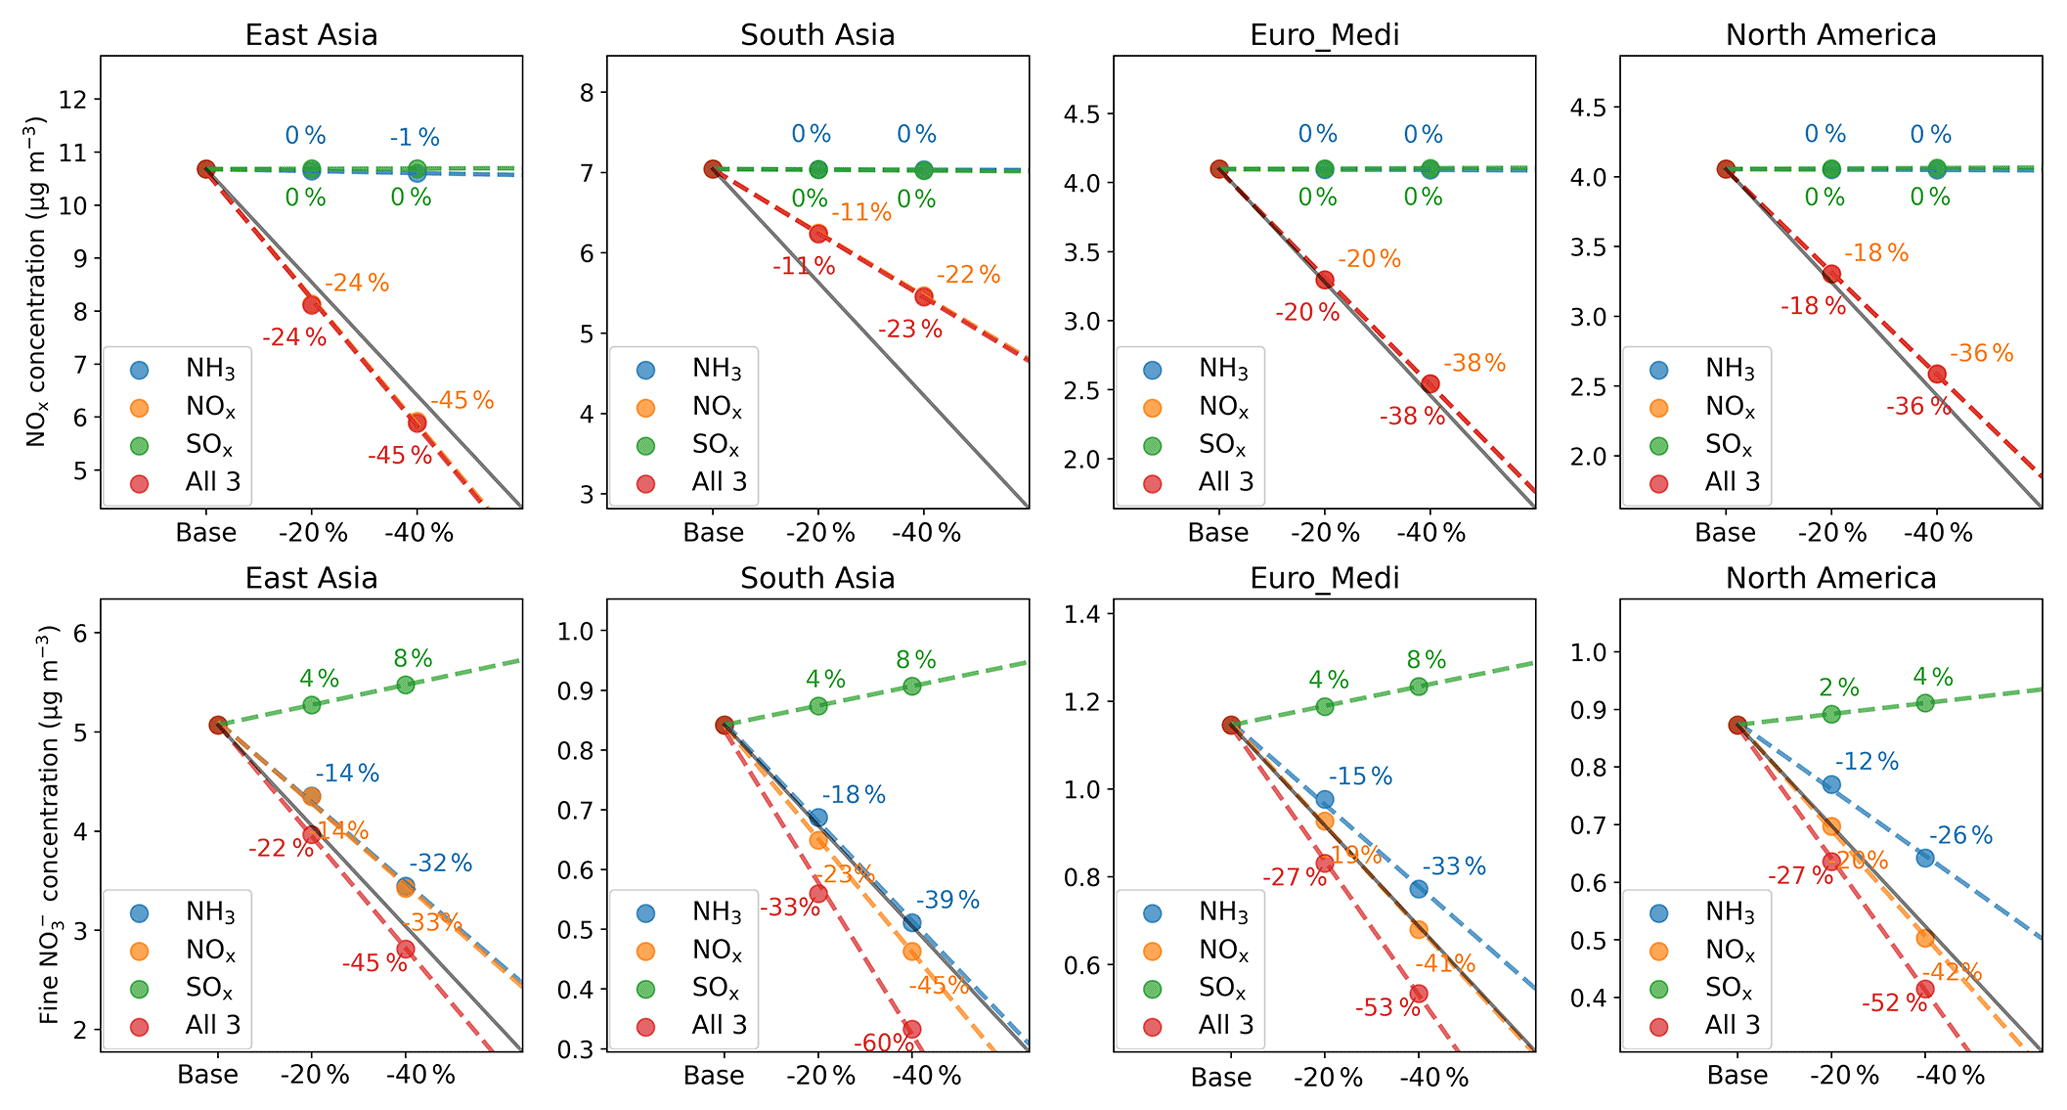
Figure 5The absolute and relative sensitivities of regionally averaged annual mean surface concentrations of NOx (upper row) and fine NO (lower row) to 20 % and 40 % emissions reductions in NH3 (blue), NOx (orange), and SOx (green), individually and collectively (red), for the four regions defined in Fig. 1. The solid grey line in each panel illustrates the one-to-one relative response to emissions reductions, whilst the dashed coloured lines are the linear regressions through each set of three model simulations, and they illustrate the actual responses to emissions reductions of a given precursor. The numbers show the corresponding relative responses to each emissions reduction (with respect to baseline).
Regionally (Fig. 5), East Asia shows the largest decreases in NOx concentrations (45 %) in response to 40 % NOx emissions reductions, followed by Euro_Medi and North America (36 %–38 %), and South Asia (23 %). These regional differences in sensitivities to NOx emissions are due to regional differences in oxidation chemistry climate. Figure S4 shows the changes in annual mean surface concentrations of O3 for the eight emissions reduction scenarios. Concentrations of O3 in eastern China, western and central Europe, and the north-eastern US increase as NOx emissions reduce, while O3 in the rest of the world decreases as NOx emissions reduce. In East Asia, the increased oxidant levels enhance NOx chemical removal and result in a greater than one-to-one relative decrease in NOx concentrations with NOx emissions reductions. Consequently, the decrease in fine nitrate in East Asia is offset by enhanced chemical production, which leads to a lower than one-to-one sensitivity (e.g. a 40 % reduction in NOx emissions gives a 33 % decrease in fine NO). In contrast, decreased oxidant levels in South Asia decrease the oxidation of NOx, which partially offsets the decrease in NOx concentrations induced by emissions reductions, causing a more efficient reduction in fine NO concentrations than in NOx in this region. The variation in regional atmospheric oxidizing capacity also alters the SO formation processes; discussions of this are presented in Sects. 3.1.3 and 4. The situation is more complex for Euro_Medi and North America, as these regions include both positive and negative changes in O3 concentrations with NOx emissions reductions (Fig. S4), and they are not as NOx rich as East Asia and South Asia. The effects of changes in oxidant levels on NOx and fine NO concentrations are therefore more localized and less apparent in regional averages. Clappier et al. (2021) reported this effect to be most distinct in the Po basin (Italy), western Germany, and the Netherlands in Europe, whilst for the United States, Tsimpidi et al. (2008) showed it only becomes pronounced in the north-east, both of which are consistent with our results.
For secondary OXN species, the sensitivities of HNO3 and fine and coarse NO to individual reductions in emissions of NH3, NOx, and SOx are closely associated with SIA formation chemistry. The principal observation from Fig. 4 is that concentrations of fine NO in all four regions decrease with reduced NH3 and NOx emissions but increase with reduced SOx emissions. This is because H2SO4 and HNO3 compete in their reactions with NH3, and (NH4)2SO4 is preferably formed over NH4NO3. Reductions in NH3 emissions cause the equilibrium between HNO3 and NH3 to shift away from NH4NO3 production and therefore free more HNO3 molecules. As a result, more HNO3 is available to produce coarse nitrate aerosol, leading to a decrease in fine NO but an increase in coarse NO concentrations (Fig. S2). Reductions in NOx emissions decrease HNO3 and fine and coarse NO concentrations globally. Although the increased oxidant levels that arise in some regions following NOx emissions reductions enhance the chemical formation of these secondary species (as discussed above), NOx emissions reductions of 20 % and 40 % are substantial enough to mean that the lower availability of NOx to form NO dominates the impact on NO concentrations compared with the enhancement in oxidizing capacity. Reduced SOx emissions leave more NH3 to equilibrate with HNO3 to form NH4NO3, leading to an increase in fine NO concentrations but a decrease in coarse NO concentrations, as the former takes more HNO3. It is notable that the increase in fine NO concentrations is relatively small compared to the extent of SOx emissions reductions. For example, the maximum increase in fine NO resulting from 40 % reductions in SOx emissions is 1.71 µg m−3 (16 %), in East Asia. The regional average increases in fine NO concentrations for 40 % SOx emissions reductions are 8 % in East Asia, South Asia, and Euro_Medi and 4 % in North America.
The differences in regional average sensitivities of HNO3 and fine and coarse NO are highlighted more clearly in Figs. 5 and S2. Fine NO in East Asia is equally sensitive to NOx and NH3 emissions reductions (33 % and 32 % decreases for 40 % NOx and NH3 emissions reductions, respectively), while it is more sensitive to NOx emissions reductions than to NH3 emissions reductions in South Asia (45 % and 39 %), Euro_Medi (41 % and 33 %), and North America (42 % and 26 %). In terms of absolute concentration changes, the reductions in fine NO over East Asia in response to 40 % NH3 and NOx emissions reductions (1.62–1.65 µg m−3) are more than 3 times larger than reductions in other regions (0.23–0.47 µg m−3). On the other hand, if NH3 emissions are reduced, then the increases in HNO3 and coarse NO concentrations in East Asia (15 % increases for 40 % NH3 reductions) are much larger than the increases in the other three regions (2 %–6 %). All these differences between East Asia and the other three regions reflect the larger abundance of NH4NO3 in SIA over East Asia. This is demonstrated in Fig. S8, which shows that the contribution of fine NO to PM2.5 in the baseline is greatest in East Asia (19 %, 5.21 µg m−3), followed by Euro_Medi (12 %, 1.22 µg m−3), North America (11 %, 0.86 µg m−3), and South Asia (3 %, 0.93 µg m−3). Detailed discussion on regional SIA composition is presented in Sect. 3.2.
3.1.3 OXS
Figure 6 shows the global variation in the sensitivities of SO2 and SO annual mean surface concentrations to 20 % and 40 % emissions reductions in NH3, NOx, and SOx, individually and collectively. Figure 7 and Table S4 summarize the sensitivities of the regionally averaged SO2 and SO concentrations to the emissions reductions for the four regional domains. Concentrations of SO2 increase in response to reduced NH3 emissions particularly over East Asia, South Asia, Europe, and North America. The largest increases in SO2 resulting from 20 % and 40 % NH3 emissions reductions are, respectively, in South East Asia (3.62 µg m−3, 9 %) and East Asia (8.11 µg m−3, 20 %) (Fig. 6). The response of secondary SO concentrations to NH3 emissions reductions varies substantially across the world. In north-eastern China and Europe, SO concentrations increase, whilst in southern China, India, and United States they decrease. However, the magnitudes of SO concentration changes are much smaller than for SO2. The maximum increases in SO concentrations (located in southern China) are only 0.37 µg m−3 (2 %) and 0.89 µg m−3 (5 %) for 20 % and 40 % NH3 emissions reductions, respectively. The maximum decreases in SO concentrations, in north-eastern China, are 0.62 µg m−3 (6 %) and 1.30 µg m−3 (12 %), respectively. Regionally averaged, East Asia exhibits the largest increase in SO2 for 40 % NH3 emissions reductions (16 %) (Fig. 7), followed by North America (14 %), South Asia (14 %), and Euro_Medi (10 %), whereas increases in regional average SO concentrations are only in the range of 0 %–2 %.
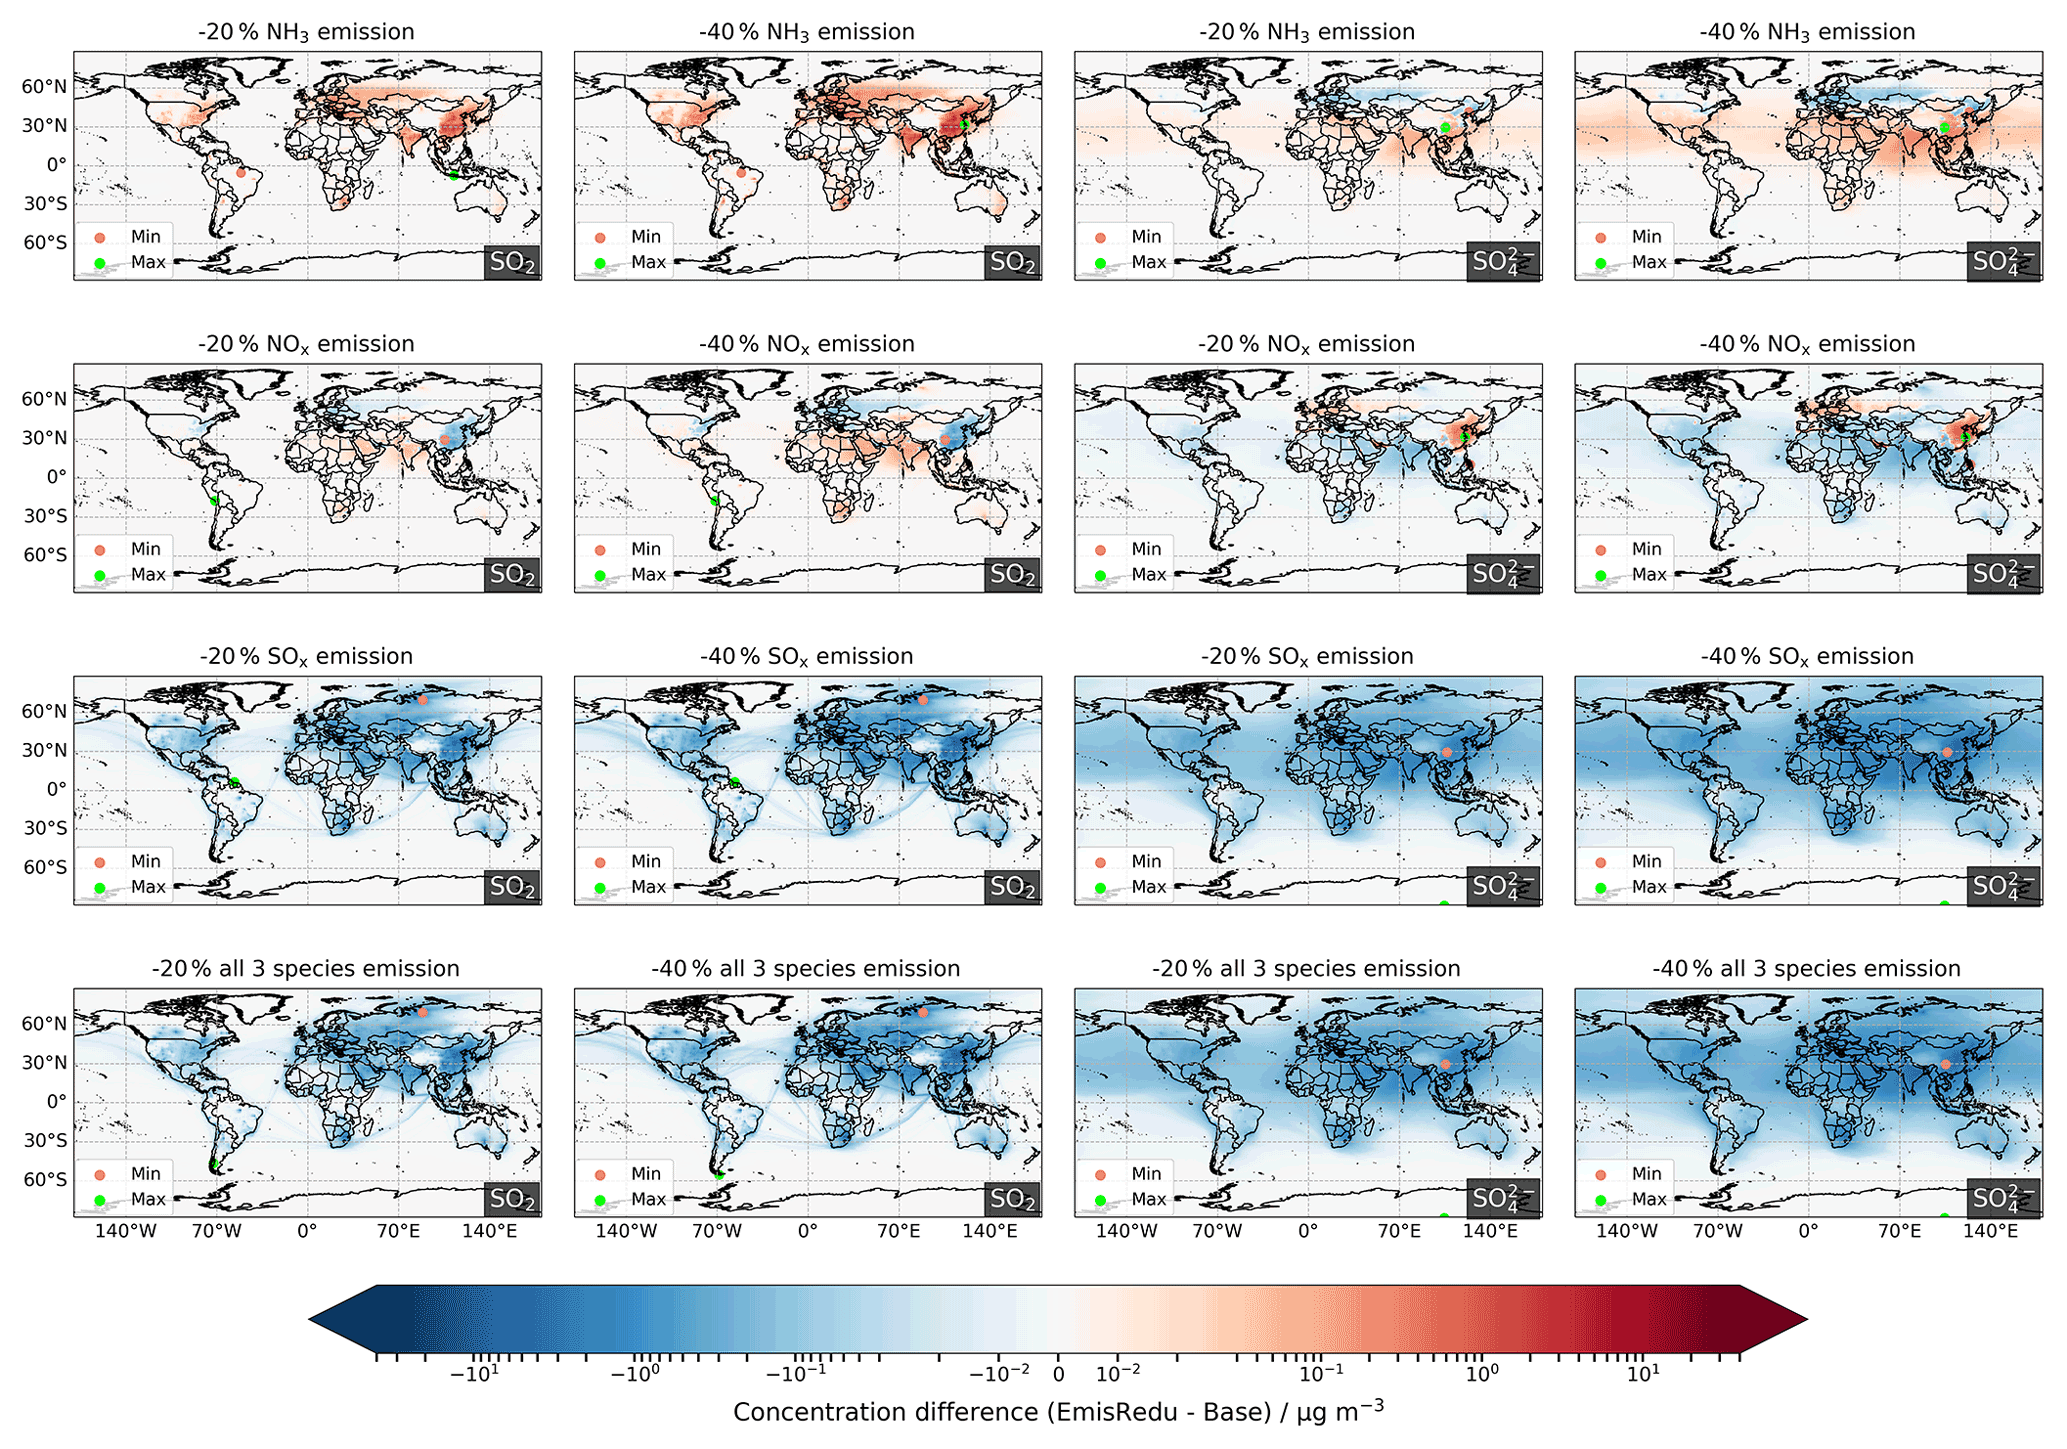
Figure 6Changes in SO2 and SO annual surface concentrations for 20 % and 40 % emissions reductions in NH3, NOx, and SOx, individually and collectively. Red and green dots in each map locate the minimum and maximum difference, respectively.
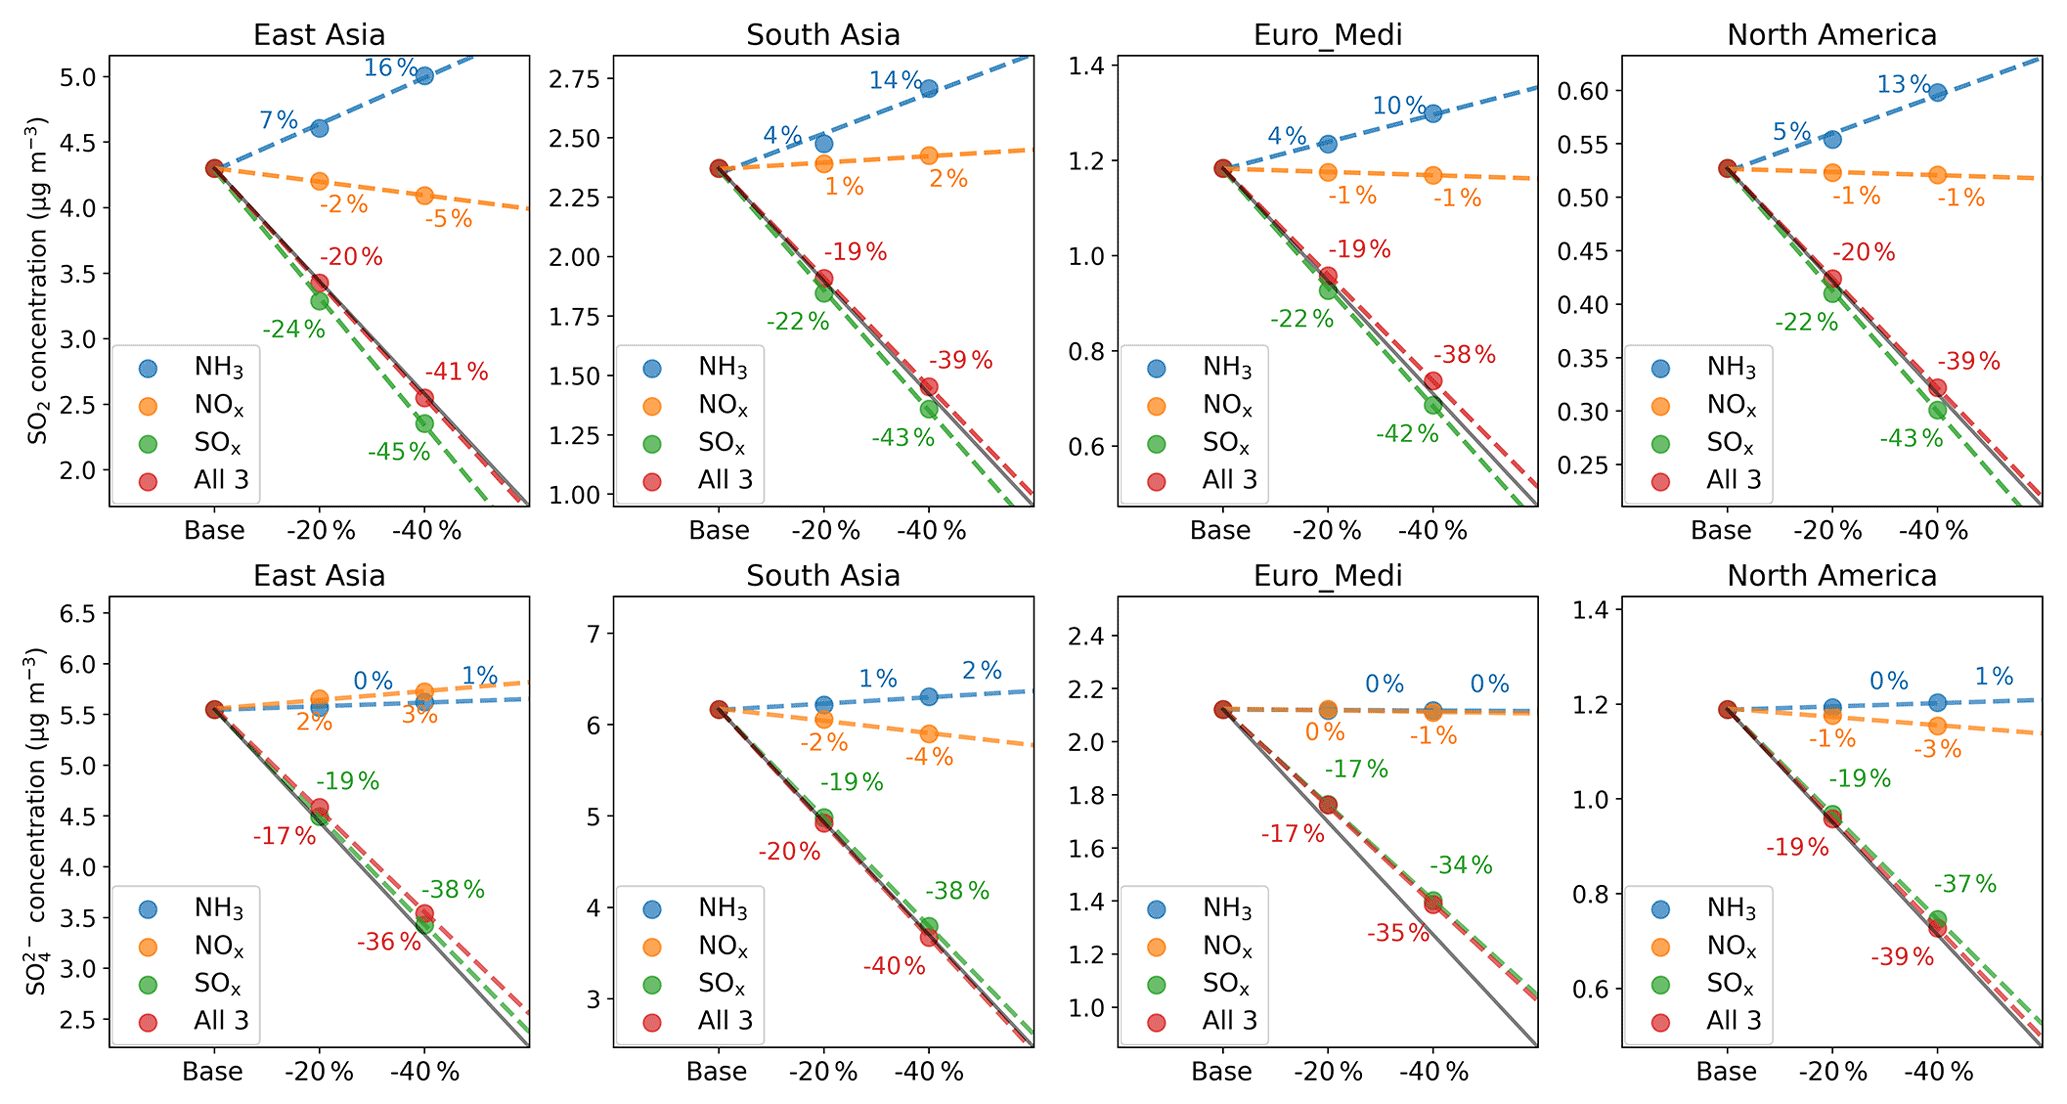
Figure 7The absolute and relative sensitivities of regionally averaged annual mean surface concentrations of SO2 (upper row) and SO (lower row) to 20 % and 40 % emissions reductions in NH3 (blue), NOx (orange), and SOx (green), individually and collectively (red), for the four regions defined in Fig. 1. The solid grey line in each panel illustrates the one-to-one relative response to emissions reductions, whilst the dashed coloured lines are the linear regressions through each set of three model simulations, and they illustrate the actual responses to emissions reductions of a given precursor. The numbers show the corresponding relative responses to each emissions reduction (with respect to baseline).
Figures S5 and 13 show the global variation in the sensitivities to precursor emissions reductions of total deposition of SO2 and of the wet and dry deposition of all OXS components, respectively. When NH3 emissions are reduced, SO2 total deposition decreases over all of East Asia, South Asia, Europe, and North America (Fig. S5); Fig. 13 shows that the decrease is driven by reduced SO2 dry deposition. Several studies have shown that the non-stomatal canopy uptake resistance of SO2 (the inverse of the SO2 dry deposition velocity) is positively correlated to the molar “acidity ratio” (Smith et al., 2000; Erisman et al., 2001; Fowler et al., 2009; Massad et al., 2010), a process that is included in the EMEP MSC-W model (Simpson et al., 2012). Reduced NH3 concentrations therefore increase the acidity ratio and hence decrease the rate of SO2 dry deposition and increase the SO2 surface concentrations in those regions where this effect is significant. The SO responses to NH3 emissions reductions are related to changes in atmospheric acidity as well. The aqueous-phase oxidation of SO2 by O3, which is one of the major pathways for SO production, is significantly pH dependent. In general, the oxidation rate decreases with decreased pH (Penkett et al., 1979; Maahs, 1983; Liang and Jacobson, 1999; Hattori et al., 2021), a process that is incorporated into the EMEP MSC-W model (Simpson et al., 2012). As pointed out by Ge et al. (2022), Europe and north-eastern China are much less ammonia rich than India, which means that 20 % and 40 % NH3 emissions reductions are substantial enough to decrease the pH in the former two regions, leading to decreases in SO production. However, given that SO2 levels increase and that there are still other effective oxidation pathways (e.g. OH, H2O2) which are independent of pH (McArdle and Hoffmann, 1983; Hoffmann, 1986; Seinfeld and Pandis, 2016), the decreases in SO concentrations in Europe and north-eastern China due to NH3 emissions reductions are very small anyway. In contrast, since India is so ammonia rich, even 40 % reductions in NH3 emissions do not significantly alter the pH in this region. As a result, SO concentrations in India increase slightly due to the higher availability of its precursor SO2.
The impacts of NOx emissions reductions on SO2 concentrations show inverse trends in different regions (Fig. 7), which reflects regional differences in atmospheric oxidation chemistry. The decreased SO2 concentrations (maximum reduction: 1.72 µg m−3, 6 %) in eastern China, Europe, and the north-eastern United States (Fig. 6) can be explained by the enhanced O3 concentrations in these regions arising from the reduced NO + O3 reaction in these high NOx regions (Fig. S4). As a result, SO2 is more readily oxidized to SO, leading to increased SO concentrations (maximum increase for 40 % NOx emissions reductions: 1.59 µg m−3 (10 %)) in these regions. This positive response of SO to NOx emissions reductions is also reported in regional studies (Botha et al., 1994; Li et al., 2006; Sheng et al., 2018; Fang et al., 2019; W. Ge et al., 2021). In contrast, India, north-eastern Africa, and southern Africa show increased SO2 (maximum increase: 0.29 µg m−3, 1 %) but decreased SO concentrations (maximum decrease: 0.73 µg m−3, 9 %) as NOx emissions reduce, which can be explained by the parallel decrease in O3 concentrations in these regions (Fig. S4). However, these concentration changes are very localized and, from a regional average perspective, are relatively small compared to the extent of emissions reductions applied. For example, in East Asia, the region with the largest response, there is only a 5 % decrease in regional average SO2 concentration (Fig. 7), and 3 % increase in SO concentration, for a 40 % reduction in NOx emissions. For other regions, the SO2 and SO regional average concentration changes are even smaller (from −4 % to 2 %). The global average sensitivities of SO2 and SO annual mean concentrations to 20 % and 40 % NOx emissions reductions are only in the range of 0 %–2 % (Table S4).
Under reductions of SOx emissions (and of all three precursors together), both SO2 and SO show almost one-to-one reductions, indicating that SOx emissions reductions are crucial for reducing both primary and secondary OXS pollutants and, in the case of reductions of all three precursors simultaneously, readily sufficient to dominate over any tendency for NH3 and NOx emissions reductions to increase OXS species concentrations. A 40 % reduction in SOx emissions leads to a maximum SO2 decrease of 39.8 µg m−3 (40 %) in northern Russia and a maximum SO decrease of 7.70 µg m−3 (39 %) in south-eastern China (Fig. 6). For the four regions, average SO2 concentrations decrease by 22 %–24 % and 42 %–45 %, and SO concentrations decrease by 17 %–19 % and 34 %–38 %, in response to 20 % and 40 % SOx emissions reductions, respectively (Fig. 7). For the 20 % and 40 % reductions in all three precursors together, regionally averaged SO2 decreases by 19 %–20 % and 38 %–41 %, respectively, and regionally averaged SO decreases by 17 %–20 % and 35 %–40 %, respectively.
3.2 Sensitivity of PM2.5 concentrations
Figure 8 shows the global distribution of the dominant sensitivity of PM2.5 towards a 40 % reduction in NH3, NOx, or SOx emissions individually. An annual mean PM2.5 concentration threshold of 5 µg m−3 has been applied in order to focus attention on more polluted areas where PM2.5 concentrations in the baseline simulation are above the latest WHO PM2.5 air quality guideline (AQG) (WHO, 2021). Section S2 and Fig. S7 in the Supplement present seasonal variations in global PM2.5 sensitivity regimes.
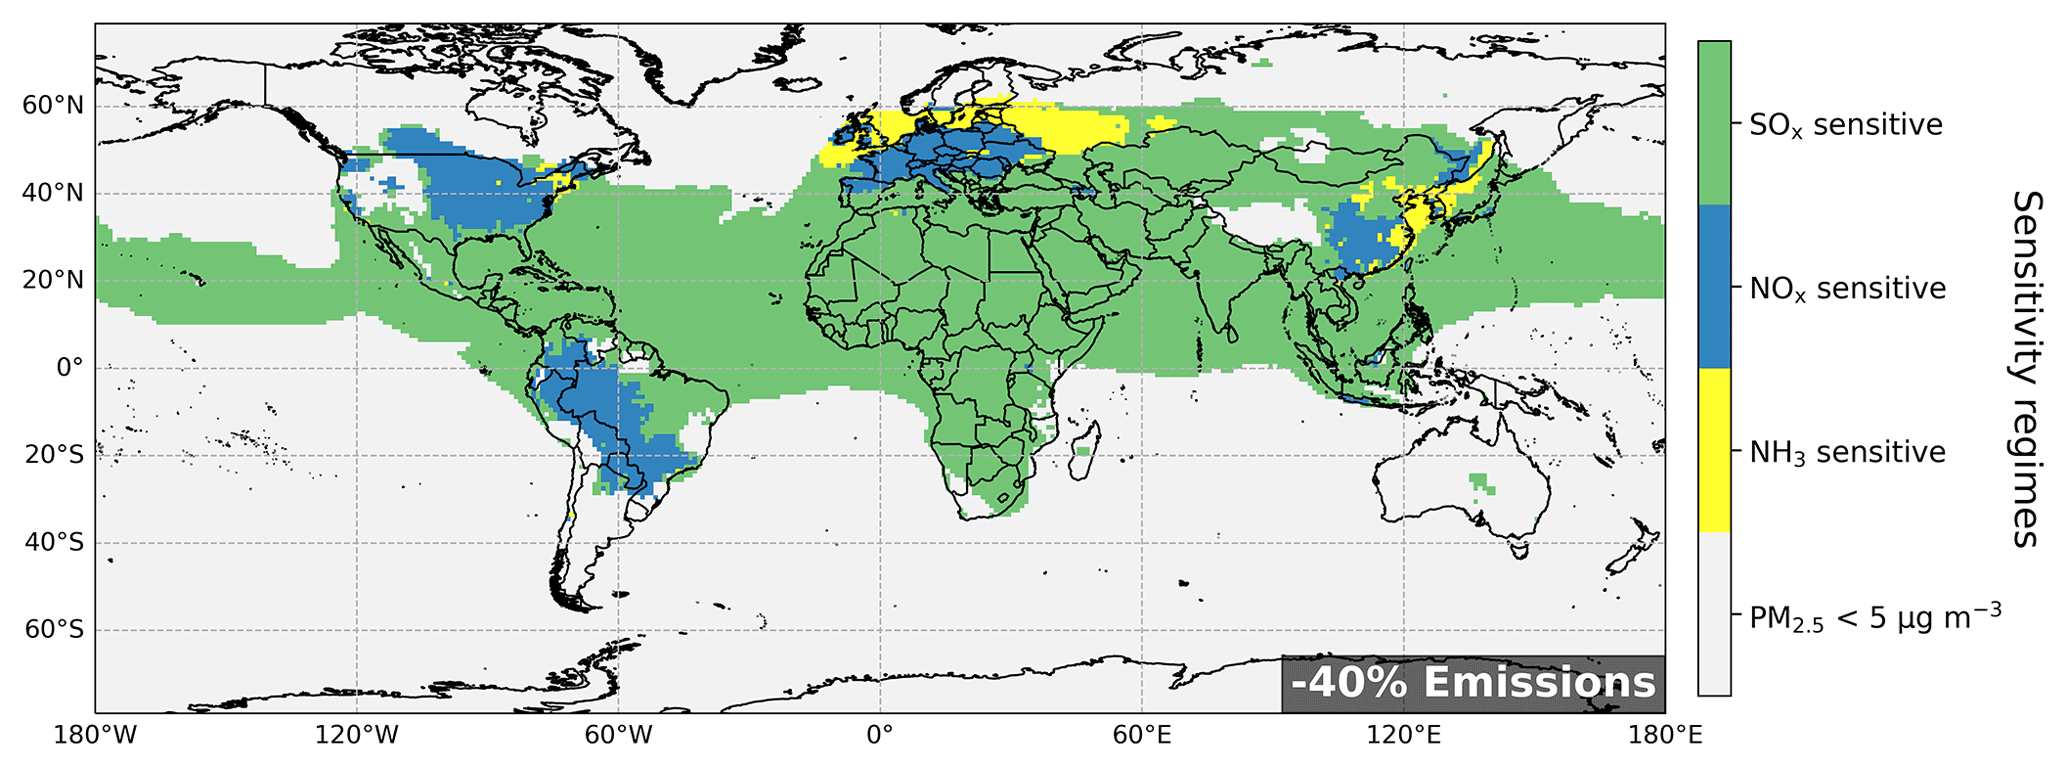
Figure 8Spatial variation in sensitivity regime of PM2.5 mitigation based on data from 40 % individual reductions in emissions of NH3, NOx, or SOx. The regime is defined according to the precursor that yields the greatest decreases in grid PM2.5 concentration: NH3 sensitive (yellow), NOx sensitive (blue), and SOx sensitive (green). Model grids with baseline annual mean PM2.5 concentrations < 5 µg m−3 are masked out.
The principal observation from Fig. 8 is that the sensitivity of PM2.5 to reductions in emissions of individual precursors is highly geographically variable. SOx-sensitive regimes are found in South East Asia, South Asia, Africa, and Central America. NOx-sensitive regimes are observed in south-eastern China, France, Germany, most eastern European countries, the central and eastern United States, and northern and central parts of South America. Only a few small regions are NH3 sensitive: these include eastern coastal areas around China, the UK and its surrounding seas, southern Scandinavia, and western Russia. The difference in PM2.5 sensitivity between northern Europe and the rest of Europe demonstrates that NH3 has become the limiting factor for SIA formation in northern Europe. This greater leverage of NH3 emissions on PM2.5 mitigation in this region is due to the effective emissions controls on all SIA precursor emissions here (see also Sect. 4 discussion) (Tørseth et al., 2012; AQEG, 2015; Vieno et al., 2016; Ciarelli et al., 2019; Theobald et al., 2019). In contrast, South Asia is so ammonia rich that reducing NH3 concentrations has little impact on PM2.5 (Ge et al., 2022). The situation in northern Europe exemplifies what to expect in terms of future policy making for the rest of the world. Furthermore, many marine areas are characterized as SOx sensitive but for a different reason than the SOx-sensitive regime in South Asia. In the marine areas, fine nitrate and ammonium aerosols are relatively small compared to sulfate aerosols; therefore, reductions in NOx and NH3 emissions hardly affect SIA formation. In fact, sulfate aerosol derived from oceanic emissions of DMS rather than from anthropogenic emissions is the major contributor to marine PM2.5 (Quinn and Bates, 2011; Hoffmann et al., 2016; Novak et al., 2022).
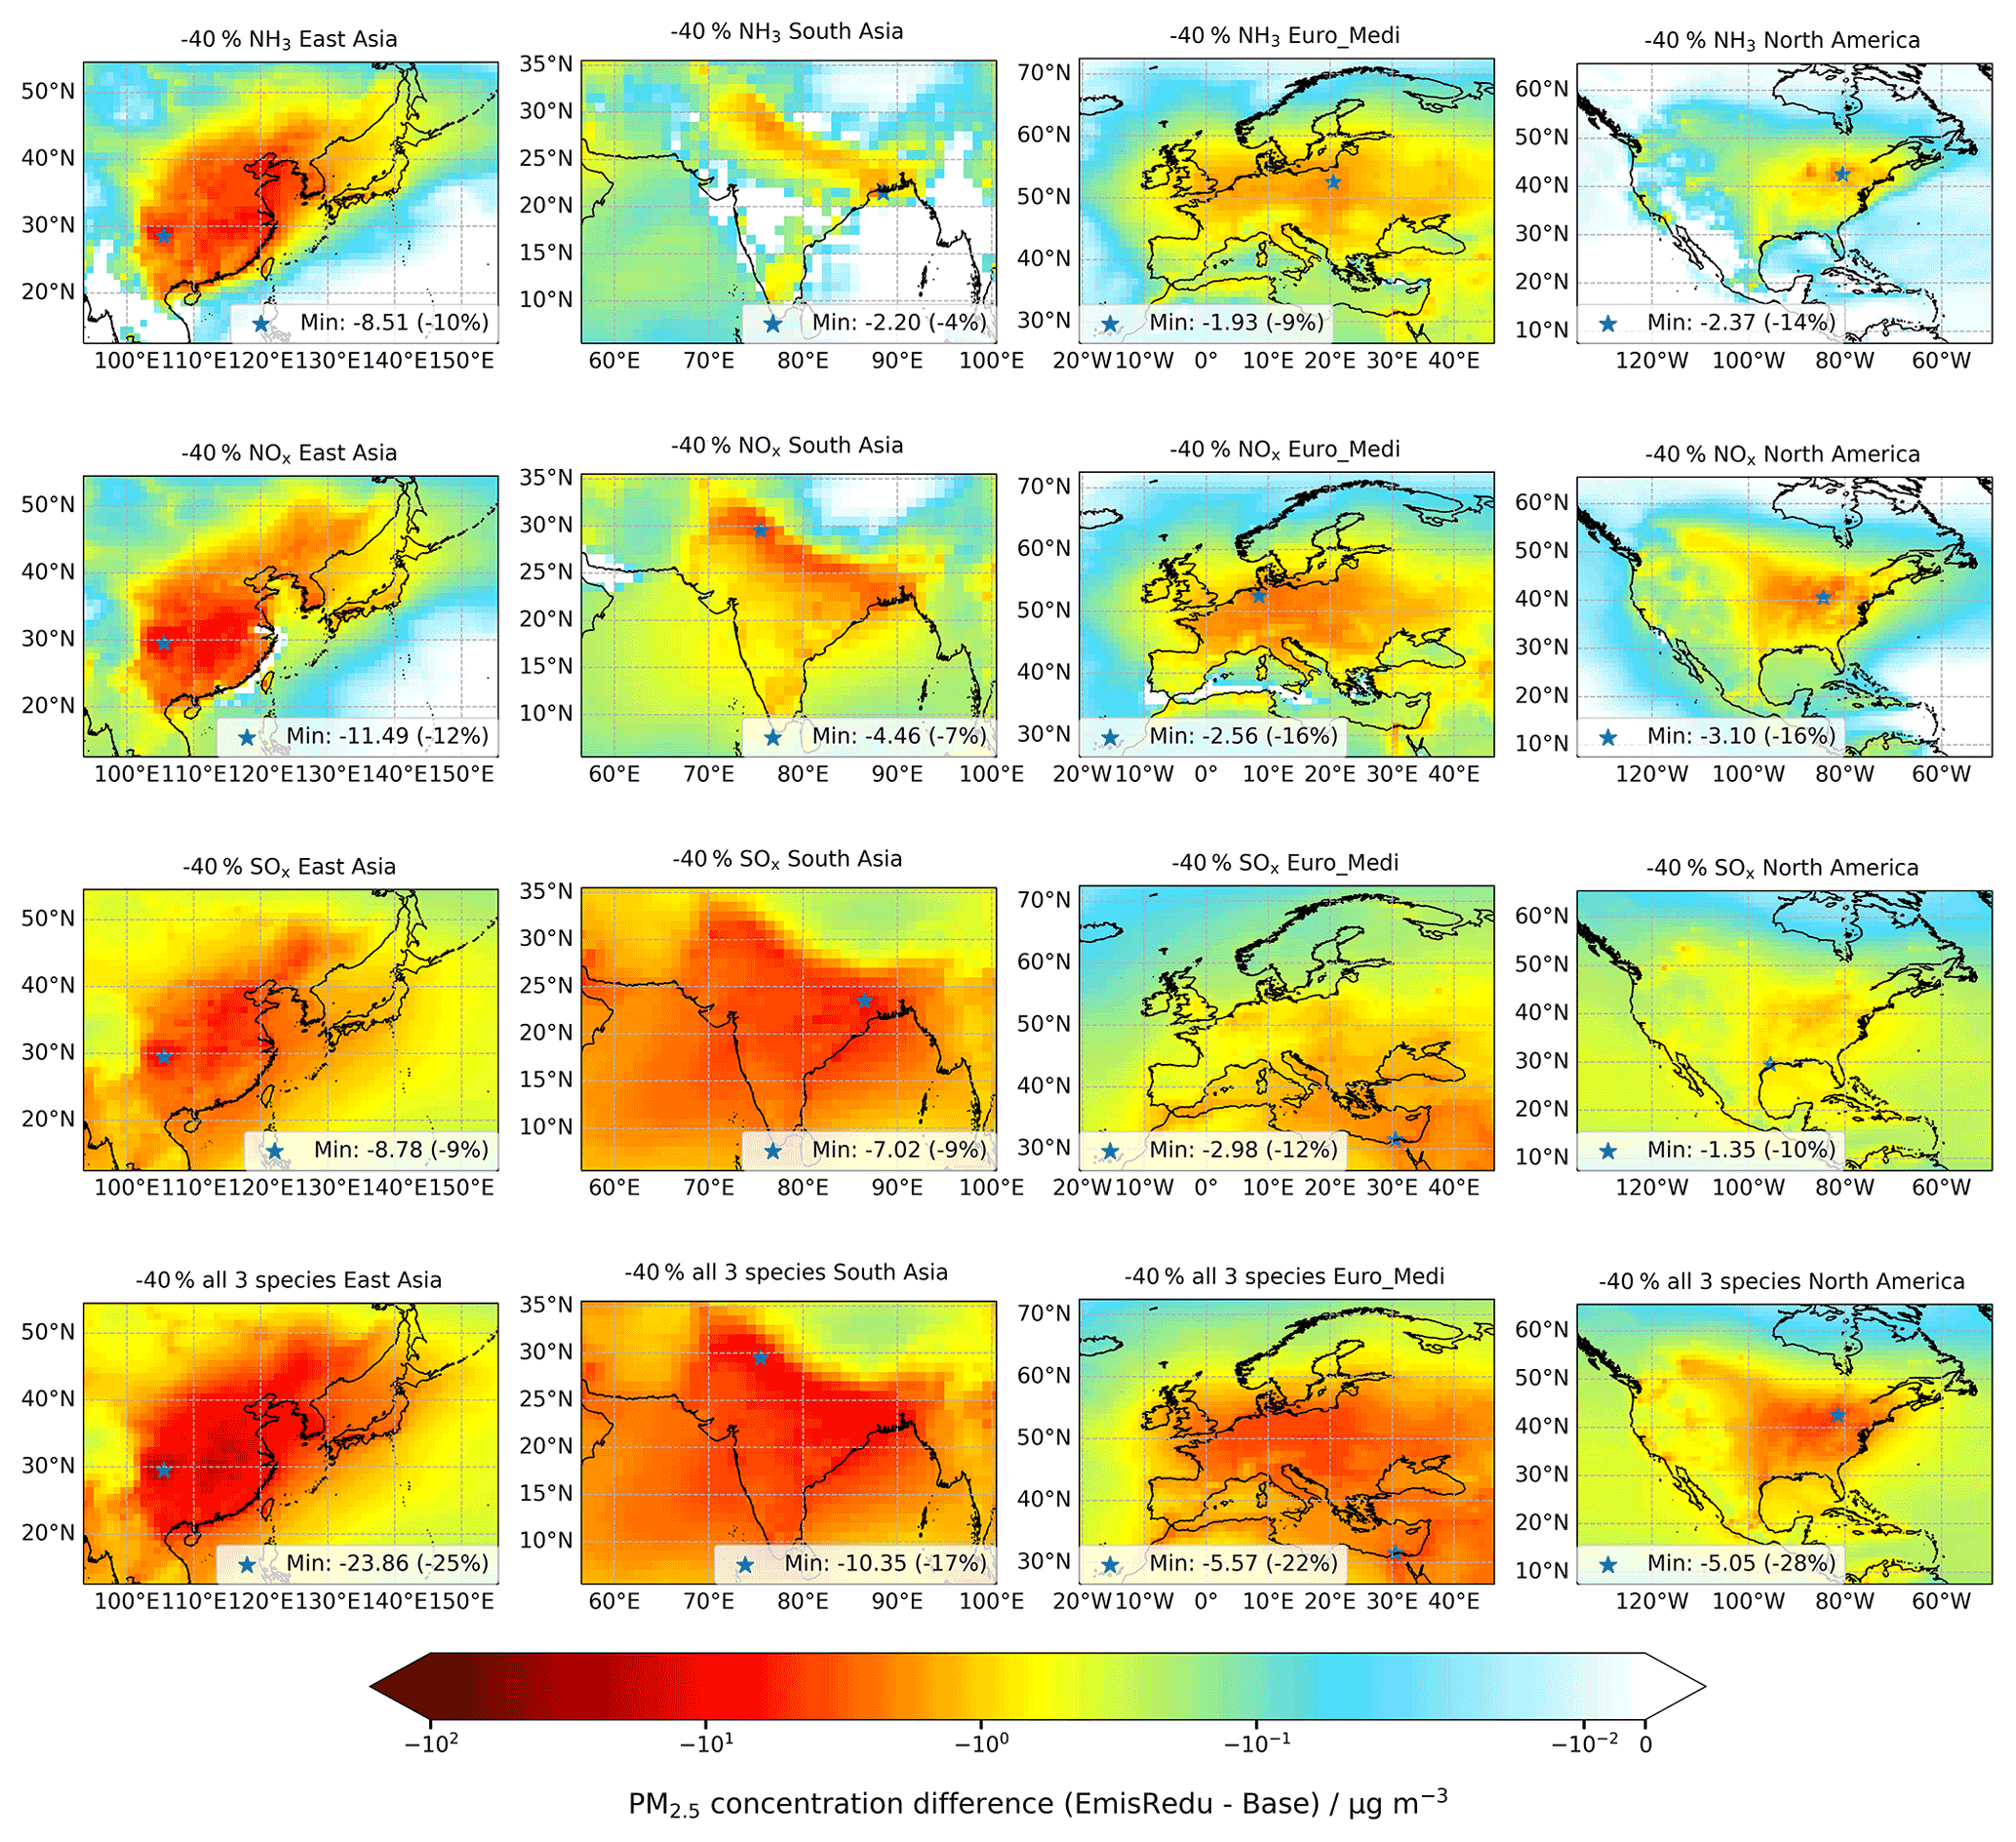
Figure 9Changes in PM2.5 annual mean surface concentrations for 40 % emissions reductions in NH3, NOx, and SOx, individually and collectively. The blue star in each map locates the minimum difference within each region.
Detailed examination of the magnitudes of the PM2.5 sensitivities in each location to each precursor (rather than just their ranking) reveals more complicated regional characteristics. Figure 9 shows the spatial variabilities in PM2.5 sensitivities to 40 % reductions in emissions of NH3, NOx, and SOx, individually and collectively, for the four world regions. The regionally averaged PM2.5 sensitivities are summarized in Fig. 10 and Table S5. PM2.5 concentrations in East Asia show comparable sensitivities to individual emissions reductions in NH3, NOx, and SOx, with the impacts of NH3 and NOx emissions reductions being more concentrated in continental areas than those for SOx emissions reductions (Fig. 9). A 40 % reduction in NOx emissions yields a maximum decrease in PM2.5 of 11.5 µg m−3 (12 %) over southern China, while 40 % reductions in NH3 and SOx yield slightly smaller maximum PM2.5 decreases of 8.51 µg m−3 (10 %) and 8.78 µg m−3 (9 %), respectively. The regional average sensitivities of PM2.5 concentrations in East Asia to 40 % reductions in individual precursors are ∼ 8 % (Fig. 10).
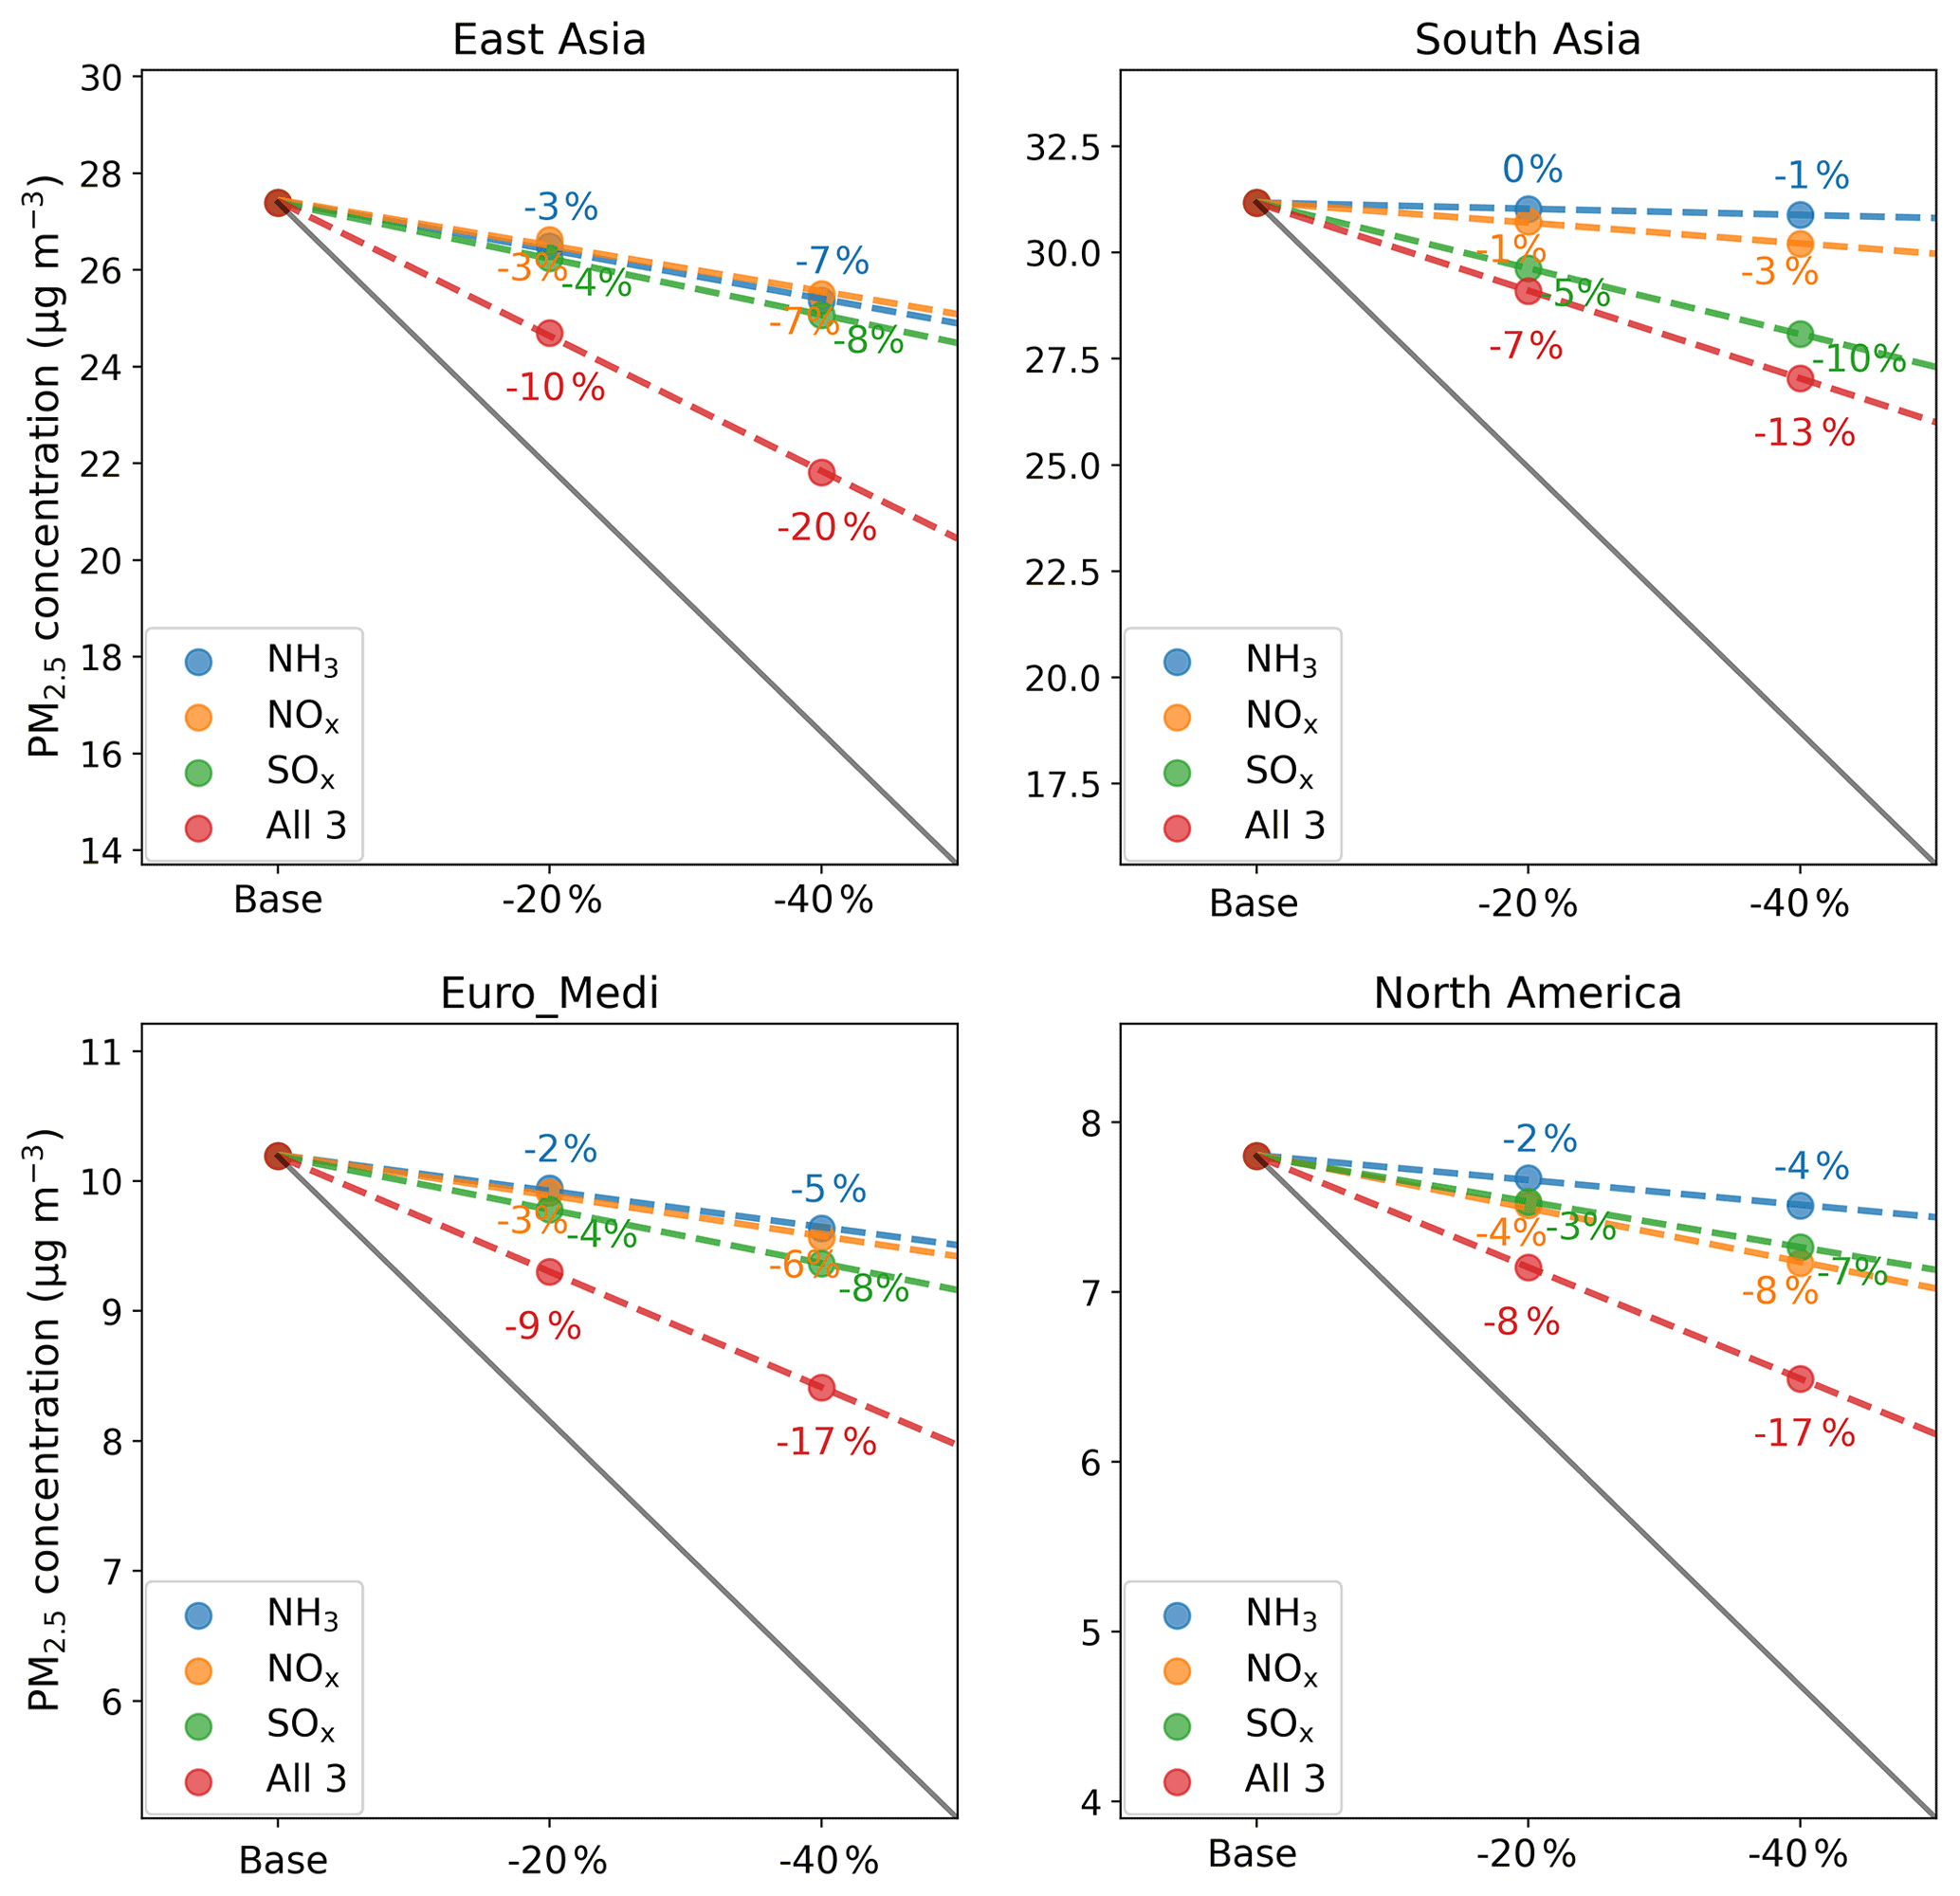
Figure 10The absolute and relative sensitivities of regionally averaged annual mean surface concentrations of PM2.5 to 20 % and 40 % emissions reductions in NH3 (blue), NOx (orange), and SOx (green), individually and collectively (red), for the four regions defined in Fig. 1. The solid grey line in each panel illustrates the one-to-one relative response to emissions reductions, whilst the dashed coloured lines are the linear regressions through each set of three model simulations, and they illustrate the actual responses to emissions reductions of a given precursor. The numbers show the corresponding relative responses to each emissions reduction (with respect to baseline).
In contrast, PM2.5 concentrations in South Asia only show significant responses to SOx emissions reductions, whilst NH3 emissions reductions have little effect, which is consistent with our previous finding that South Asia has the most ammonia-rich chemical climate for SIA formation (Ge et al., 2022). The dominant proportion of (NH4)2SO4 in SIA compared to NH4NO3 in South Asia (Fig. S8) also explains the small sensitivity of PM2.5 in this region to NOx emissions reductions. The maximum PM2.5 decrease (7.02 µg m−3, 9 %) for 40 % SOx emissions reductions is more than 3 times larger than the maximum PM2.5 decrease (2.20 µg m−3, 4 %) for 40 % NH3 emissions reductions. The decreases in regionally averaged PM2.5 concentrations in South Asia in response to 40 % reductions in emissions of individual precursors are in the order of 10 % for SOx, 3 % for NOx, and 1 % for NH3.
In the Euro_Medi region, PM2.5 sensitivities vary from north to south. Northern and central Europe are most sensitive to NH3 and NOx emissions reductions, for which the maximum decrease in PM2.5 is ∼ 2.6 µg m−3 (16 %) for 40 % reductions, while the Mediterranean is more sensitive to SOx emissions reductions, for which the maximum decrease in PM2.5 is 2.98 µg m−3 (12 %) for 40 % reductions. Regionally averaged, however, the PM2.5 concentrations in Euro_Medi show comparable sensitivities to the three precursors, with decreases in the range 5 %–8 % for 40 % emissions reductions in individual precursors.
Over North America, the eastern US shows larger sensitivities of PM2.5 to all emissions reduction scenarios than the western US, and reductions in NOx emissions yield larger decreases in PM2.5 than reductions in SOx and NH3 emissions. The maximum decrease in PM2.5 derived from 40 % reductions in NOx emissions is 3.10 µg m−3 (16 %); for 40 % reductions in NH3 and SOx emissions the maximum PM2.5 decreases are 2.37 µg m−3 (14 %) and 1.35 µg m−3 (10 %), respectively. The regional average sensitivities of PM2.5 concentrations in North America to 40 % reductions in emissions of individual precursors decreases in a slightly different order: NOx (8 %), SOx (7 %), and NH3 (4 %).
Figure 10 shows that 20 % emissions reductions in any precursor lead to decreases in regionally averaged PM2.5 concentrations, although the PM2.5 sensitivities vary substantially with precursor and region. Given the non-one-to-one chemical responses of SIA components to reductions in emissions in individual precursors discussed in Sect. 3.1, even 20 % reductions appear substantial enough to ensure that decreased SIA formation due to decreased precursor emissions dominates over any disbenefits to SIA formation from, for example, increases in oxidant levels induced by NOx emissions reductions. For instance, 20 % reductions in NOx emissions still cause a decrease of 0.77 µg m−3 (3 %) in regional average PM2.5 in East Asia, despite increasing regional average SO by 0.10 µg m−3 (2 %), because it decreases regional average NH and fine NO by greater amounts (0.17 µg m−3 (5 %) and 0.72 µg m−3 (14 %), respectively). Similarly, 20 % reductions in SOx emissions decrease regional average PM2.5 in East Asia by 1.15 µg m−3 (4 %) because the decreases in SO (1.06 µg m−3, 19 %) and NH (0.32 µg m−3, 9 %) caused by reduced (NH4)2SO4 formation are larger than the increase in fine NO (0.20 µg m−3, 4 %) due to elevated NH4NO3 formation. On the other hand, the mitigation of PM2.5 by reducing emissions of all three precursors together is impacted by these non-one-to-one chemical responses as well, which causes the net decrease in regional average PM2.5 derived from reductions in all three precursors to be smaller than the sum of individual PM2.5 decreases derived from reductions in emissions of precursors individually. For example, 40 % reductions in NH3, NOx, and SOx emissions individually decrease regional average PM2.5 in East Asia by 2.03 µg m−3 (7 %), 1.89 µg m−3 (7 %), and 2.33 µg m−3 (8 %), respectively (sum of the three: 6.25 µg m−3), while the decrease in regional average PM2.5 derived from 40 % reduction in all three precursors simultaneously is 5.59 µg m−3 (20 %).
The 40 % reduction in emissions of all three species yields a maximum decrease in PM2.5 of 23.9 µg m−3 (25 %) over East Asia, followed by 10.4 µg m−3 (17 %) in South Asia, 5.57 µg m−3 (22 %) in Euro_Medi, and 5.05 µg m−3 (28 %) in North America. The regional average sensitivity of PM2.5 concentrations to 20 % and 40 % reductions in emissions of all three species decreases in the order of East Asia (10 % and 20 % for 20 % and 40 % reductions, respectively), Euro_Medi (9 % and 17 %), North America (8 % and 17 %), and South Asia (7 % and 13 %). This trend is related to differences in the contribution of SIA to PM2.5 in the different regions. Figure S8 shows the mass contributions of individual PM2.5 components to the regional average concentration of PM2.5 in the baseline and the 40 % emissions reductions scenarios. SIA components in the baseline account for over half of PM2.5 in East Asia (52 %), followed by Euro_Medi (42 %), North America (35 %), and South Asia (31 %), which explains why reductions in emissions of all three SIA precursors are most efficient for the mitigation of PM2.5 in East Asia but least efficient in South Asia. In fact, primary PM2.5 is the largest contributor to PM2.5 in South Asia, so reducing these emissions will be the most efficient way of abating PM2.5 pollution in this region. It is noteworthy that in the scenario of 40 % reductions in all three species, SIA is still the largest contributor to PM2.5 in East Asia, while primary PM2.5 and Rest (mainly secondary organic aerosol) become the dominant contributors in other regions. Even with 40 % reductions in all three SIA precursors, none of the four regions has its regional average PM2.5 concentration decreased to below 5 µg m−3. Euro_Medi (8.4 µg m−3 after 40 % reductions) and North America (6.5 µg m−3) are the closest, whilst East Asia (21.8 µg m−3) and South Asia (27.0 µg m−3) are still far away from achieving the latest WHO AQG for PM2.5. Therefore, reductions in emissions of primary PM2.5 and in VOCs are also required to achieve further PM2.5 reductions in all regions or even greater reductions in SIA precursors than simulated here.
3.3 Sensitivity of Nr and Sr deposition
The impacts of reductions in emissions of NH3, NOx, and SOx on total amounts of N and S deposition are straightforward because these must match the emissions mass changes in N and S. However, the relative amounts and spatial pattern of the individual components of N and S deposition are impacted.
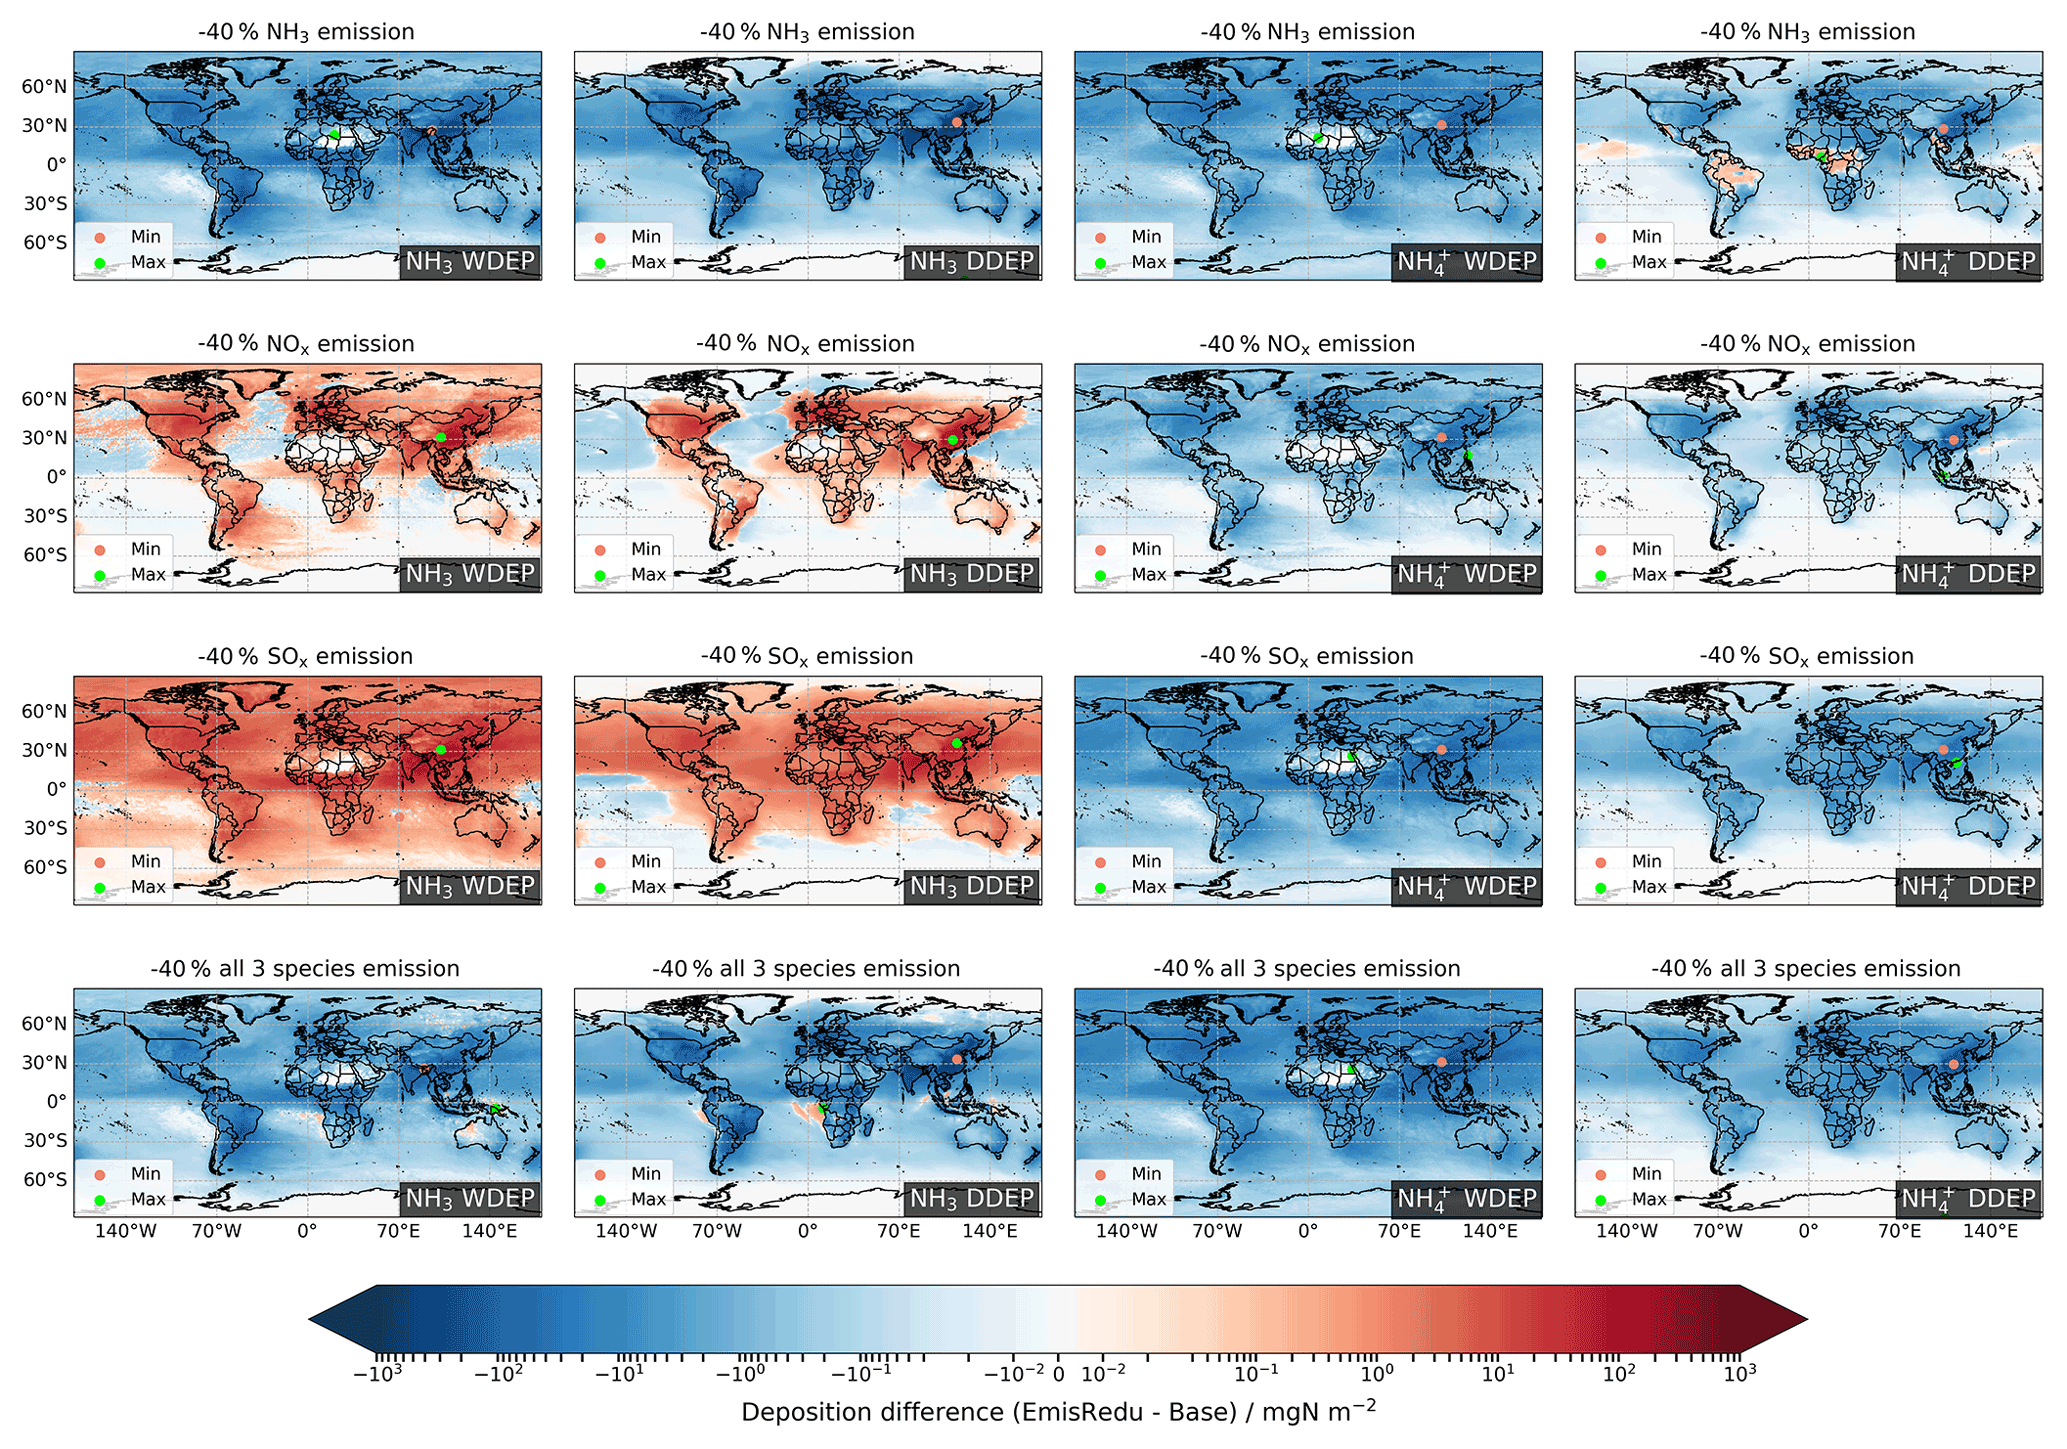
Figure 11Changes in wet (WDEP) and dry deposition (DDEP) of NH3 and NH for 40 % emissions reductions in NH3, NOx, and SOx, individually and collectively. Red and green dots in each map locate the minimum and maximum difference, respectively.
Figure 11 shows the spatial variations in the sensitivities of the wet and dry deposition of the RDN components NH3 and NH to 40 % reductions in global emissions of NH3, NOx, and SOx, individually and collectively. Figure 12 shows similar for deposition of the OXN components NOx, HNO3, TNO (total NO, the sum of fine and coarse NO), and Rest (the sum of other oxidized species). Both wet and dry deposition of NH3 show negative responses to emissions reductions in NH3 and all three precursors together but positive responses to emissions reductions in NOx and SOx, which is consistent with the responses of surface NH3 concentrations to these emissions reductions (Sect. 3.1.1). This is because reduced NOx and SOx emissions lead to decreased concentrations of acidic species in the atmosphere, resulting in more NH3 remaining in the gas phase and greater NH3 deposition over continents. In contrast, global NH wet and dry deposition decreases in all emissions reduction scenarios, which is also in line with the decreased NH concentrations in all scenarios.
The changes in deposition of the OXN components to emissions reductions are more complicated (Fig. 12). The two species with the largest variation in deposition across the emissions reduction scenarios are HNO3 and TNO, which is due to their large contributions to total OXN deposition in most world regions (Ge et al., 2022). For reductions in emissions of NOx and all three species, all OXN deposition components show clear decreasing trends due to the strong reduction in their precursor emissions.
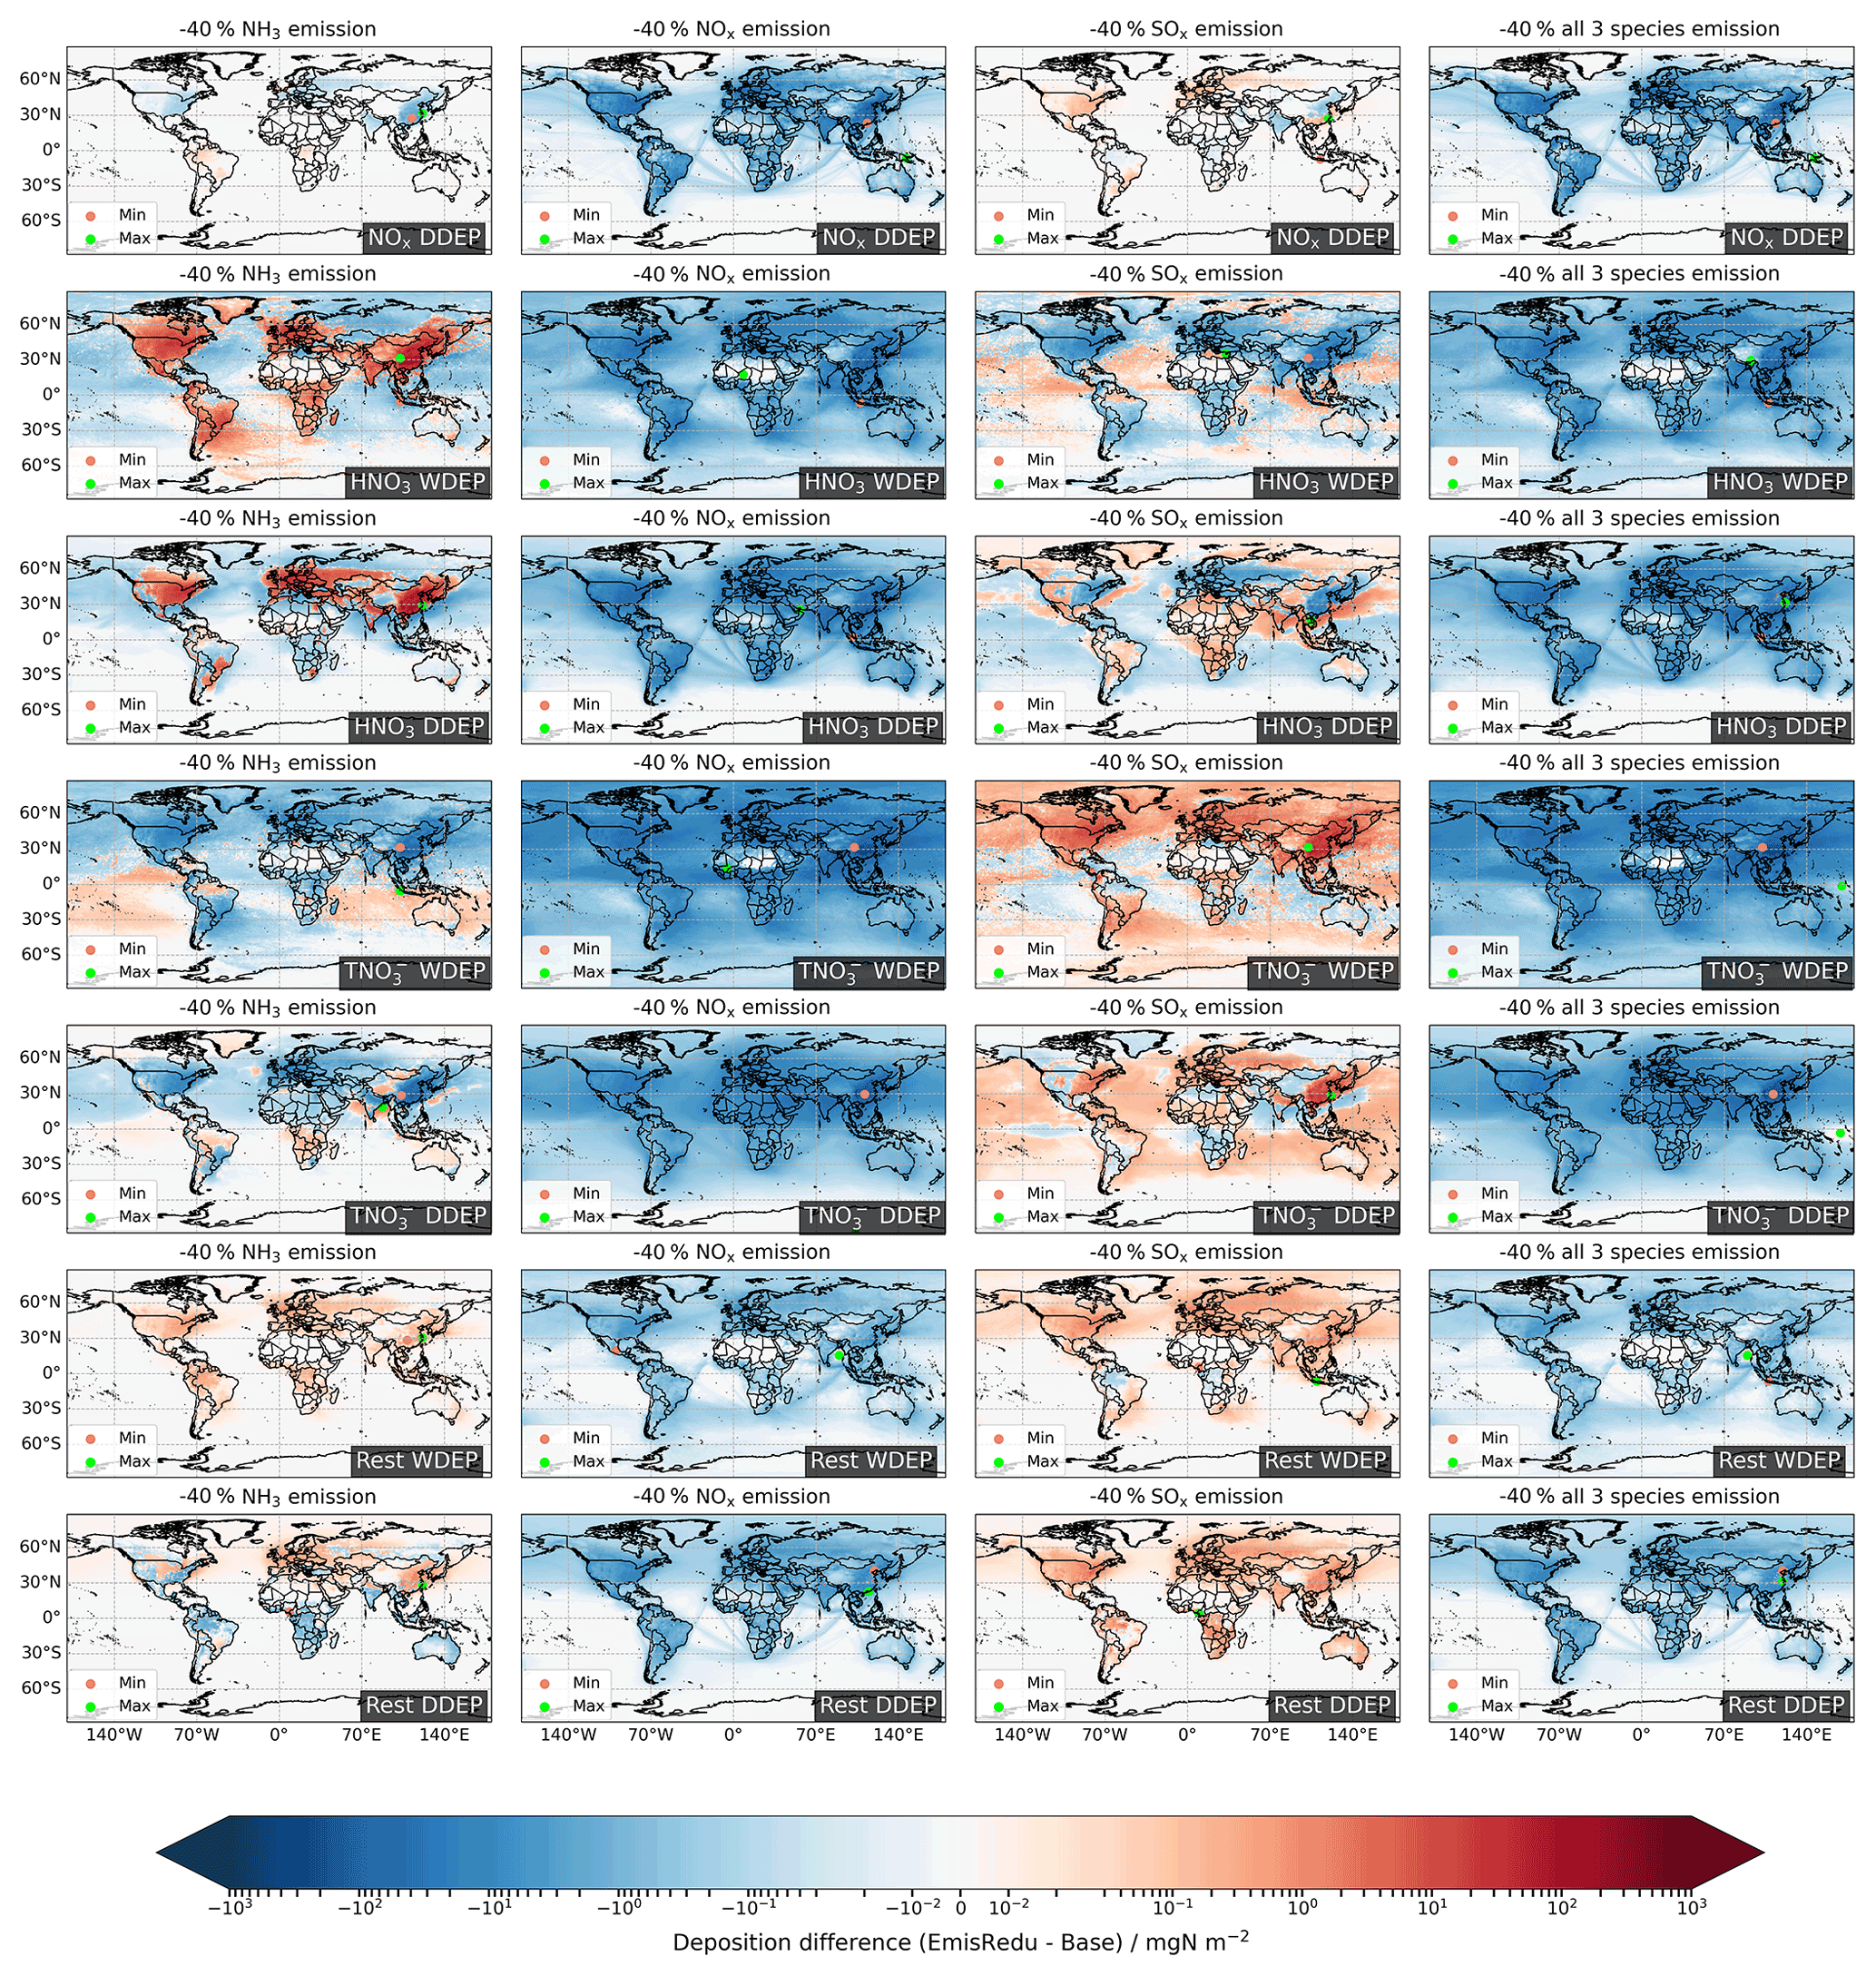
Figure 12Changes in wet (WDEP) and dry deposition (DDEP) of NOx, HNO3, TNO (fine + coarse NO), and Rest OXN species for 40 % emissions reductions in NH3, NOx, and SOx, individually and collectively. Red and green dots in each map locate the minimum and maximum difference, respectively.
In response to NH3 emissions reductions, Fig. 12 shows that HNO3 wet and dry deposition increases in eastern China, northern India, Europe, and eastern North America, whereas the wet and dry deposition of TNO decreases in these regions. Further examination of fine and coarse NO deposition differences in Fig. S9 shows that the decrease in TNO deposition is driven by the decrease in fine NO wet and dry deposition, while coarse NO wet and dry deposition in the four regions actually increases. The reduction in NH3 emissions decreases NH4NO3 formation and therefore liberates more HNO3; as a result, more OXN deposits in the form of HNO3 rather than NO in these regions. In contrast, impacts of SOx emissions reductions on HNO3 and TNO deposition are the opposite of impacts of NH3 emissions reductions. As discussed in Sect. 3.1.2, decreased SO concentrations promote the formation of NH4NO3, which results in decreased wet and dry deposition of HNO3 and consequently increased TNO deposition (driven by increased fine NO deposition, Fig. S9) in eastern China, northern India, Europe, and eastern North America.
Compared to HNO3 and TNO, the responses of NOx and Rest OXN deposition to reductions in NH3 and SOx emissions are considerably smaller. For instance, the maximum increases in HNO3 wet and dry deposition in response to 40 % NH3 emissions reductions are 328 mgN m−2 (85 %) and 248 mgN m−2 (48 %), respectively, whereas the maximum increases in Rest OXN wet and dry deposition are only 1.35 mgN m−2 (4 %) and 1.64 mgN m−2 (4 %), respectively. Also, in the 40 % NH3 emissions reduction scenario, the maximum decreases in TNO wet and dry deposition are 359 mgN m−2 (25 %) and 175 mgN m−2 (28 %), respectively, whereas the maximum decreases in NOx dry deposition are only 4.22 mgN m−2 (1 %).
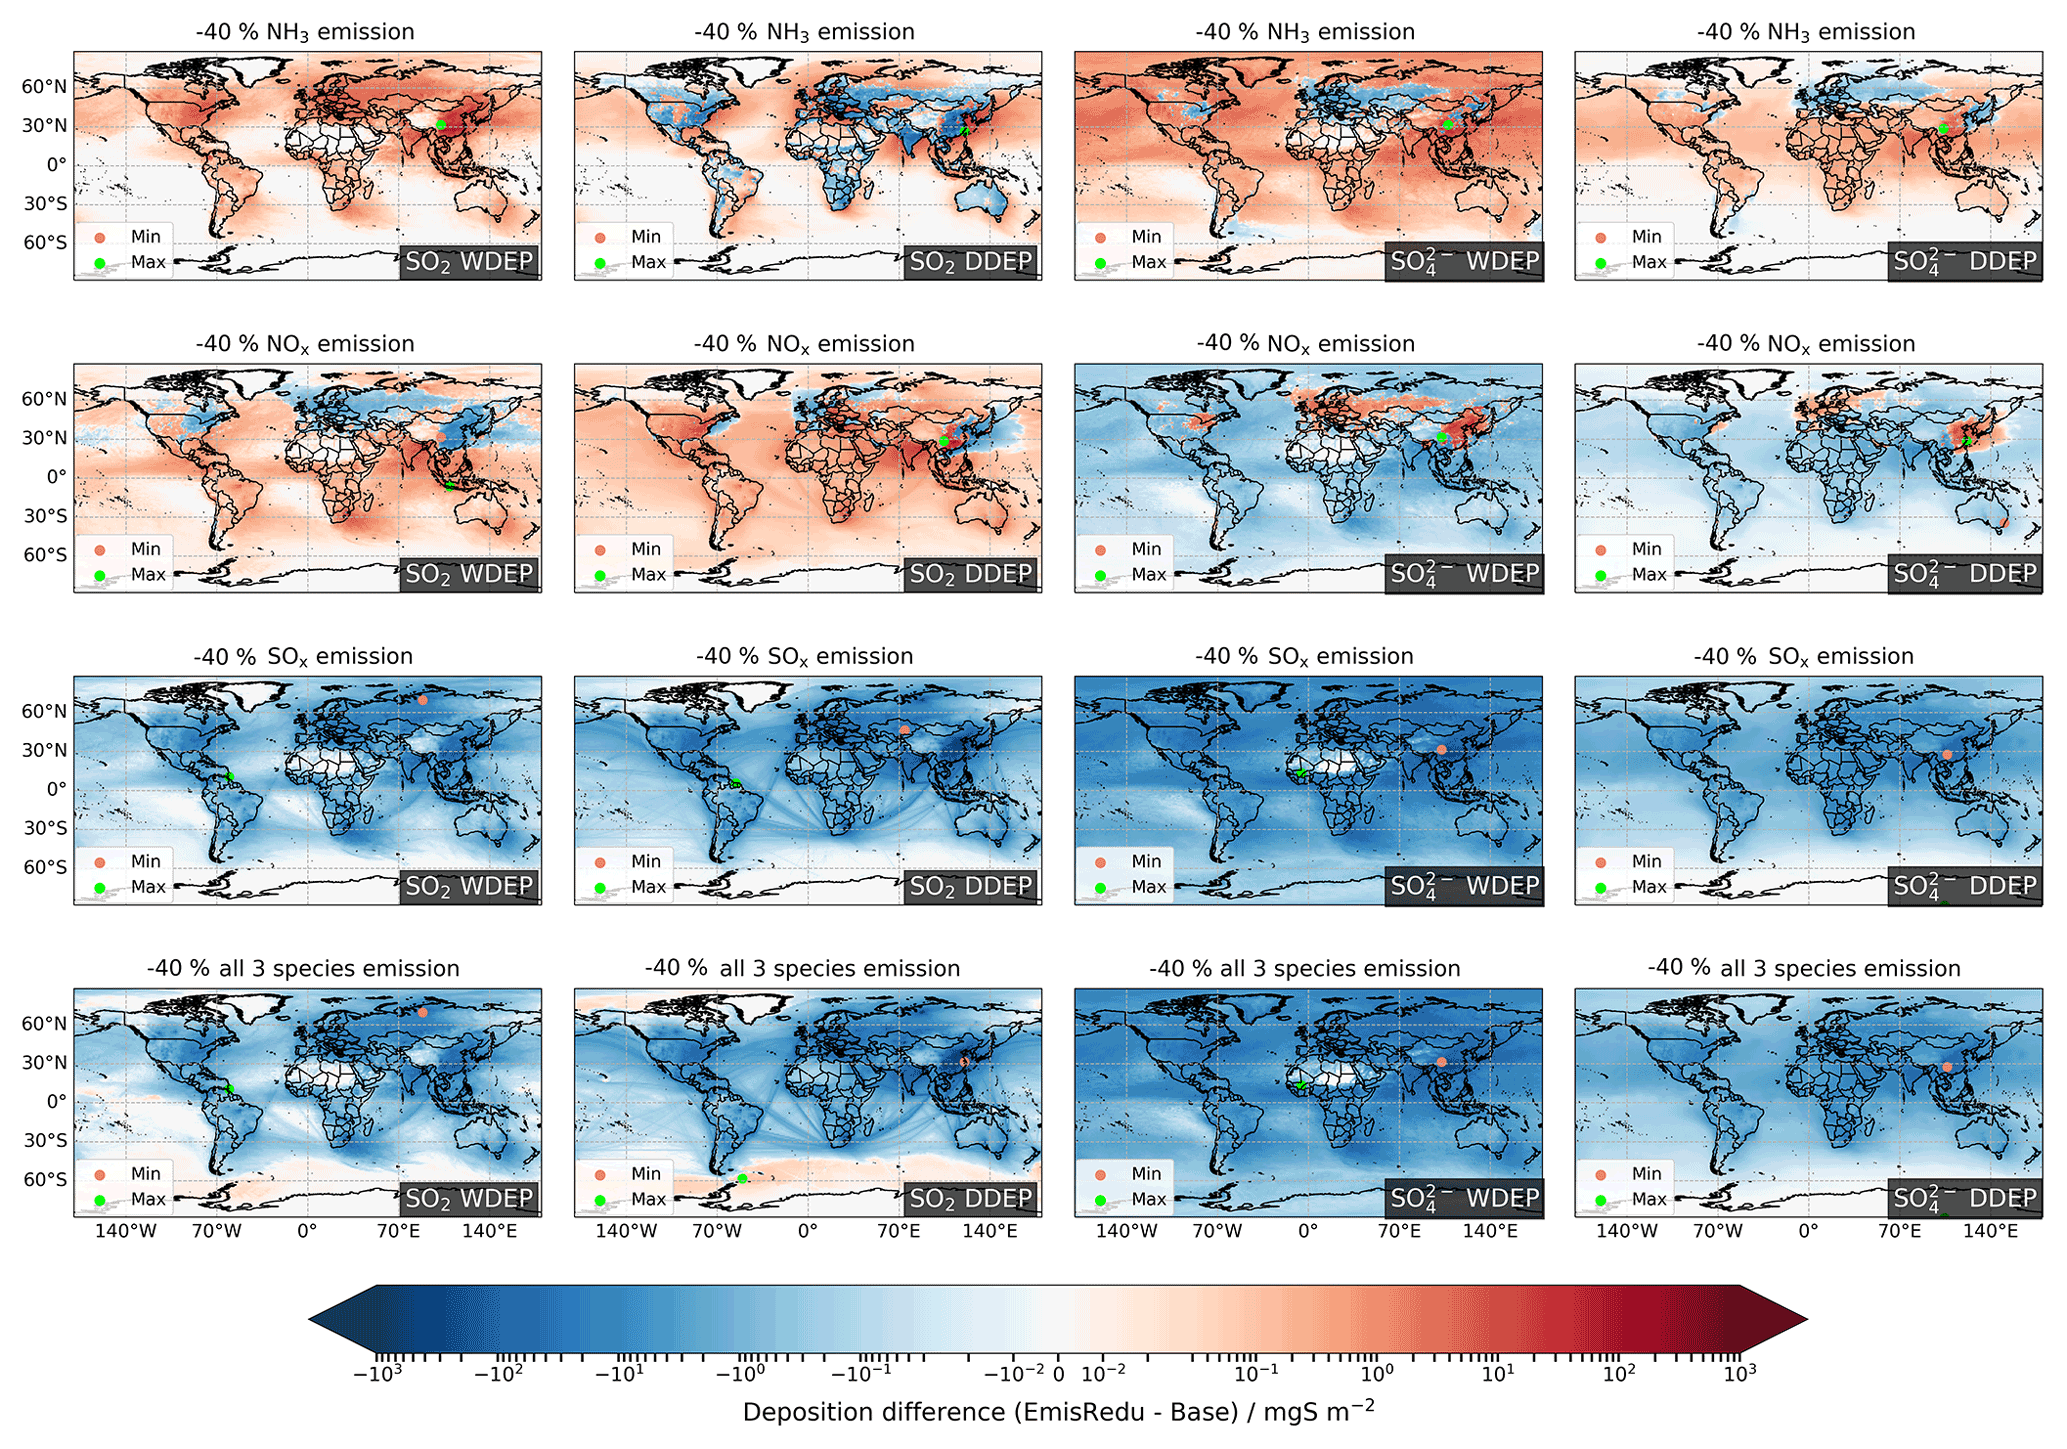
Figure 13Changes in wet (WDEP) and dry deposition (DDEP) of SO2 and SO for 40 % emissions reductions in NH3, NOx, and SOx, individually and collectively. Red and green dots in each map locate the minimum and maximum difference, respectively.
The spatial variations in the sensitivities of SO2 and SO wet and dry deposition to the precursor emissions reductions are shown in Fig. 13. Increased SO2 wet deposition is observed globally in response to NH3 emissions reductions, whilst SO2 dry deposition decreases over the continents but increases over the oceans. The non-stomatal canopy resistance of SO2 is positively correlated to the molar acidity ratio aSN (Smith et al., 2000; Erisman et al., 2001; Fowler et al., 2009; Massad et al., 2010; Simpson et al., 2012). Reductions in NH3 emissions increase the aSN, which therefore increases the canopy resistance of SO2 and decreases SO2 dry deposition over the continents. The 40 % reduction in NH3 emissions yields a global maximum increase in SO2 wet deposition of 131 mgS m−2 (44 %) and a maximum decrease in SO2 dry deposition of 600 mgS m−2 (24 %). The overall effect of increased SO2 wet deposition and decreased SO2 dry deposition is a decreased SO2 total deposition over populated continents (where NH3 emissions are high) and increased SO2 total deposition over oceans (Fig. S5). The maximum decrease of SO2 total deposition located in southern China is 586 mgS m−2 (18 %) for 40 % NH3 reduction.
The sensitivity of total deposition of SO to NH3 emissions reductions (Fig. S6) follows the trend in the sensitivity of SO concentrations (Sect. 3.1.3). The responses of wet and dry deposition of SO to NH3 emissions reductions are similar (Fig. 13). In general, decreased wet and dry SO deposition appears over Europe, north-eastern China, and the north-eastern US, while increased wet and dry deposition occurs in the rest of the world. As also for their concentration sensitivities, the magnitudes of the SO deposition responses are much smaller than for SO2. For 40 % NH3 emissions reduction, the maximum decrease of SO total deposition is 42 mgS m−2 (9 %), which is an order of magnitude smaller than that of SO2 total deposition.
For NOx emissions reductions, both wet and dry deposition of SO2 generally show decreases in eastern China, Europe, and the north-eastern US but increases in the rest of the world, which is contrary to the responses of SO wet and dry deposition. This is related to enhanced chemical conversion of SO2 to SO due to increased atmospheric oxidizing capacity over eastern China, Europe, and the north-eastern US (details in Sect. 3.1.3). The maximum decrease in SO2 wet and dry deposition in response to 40 % reductions in NOx emissions is ∼ 65 mgS m−2, while the maximum increase in SO wet and dry deposition is ∼ 50 mgS m−2.
For reductions in SOx and in all three precursors collectively, decreased wet and dry deposition of SO2 and SO is observed globally, and the 40 % reductions in these two scenarios yield similar global maximum decreases in SO2 deposition (wet: ∼ 937 mgS m−2, 41 %; dry: ∼ 1338 mgS m−2, 43 %) and SO deposition (wet: ∼ 828 mgS m−2, 38 %; dry: ∼ 150 mgS m−2, 39 %).
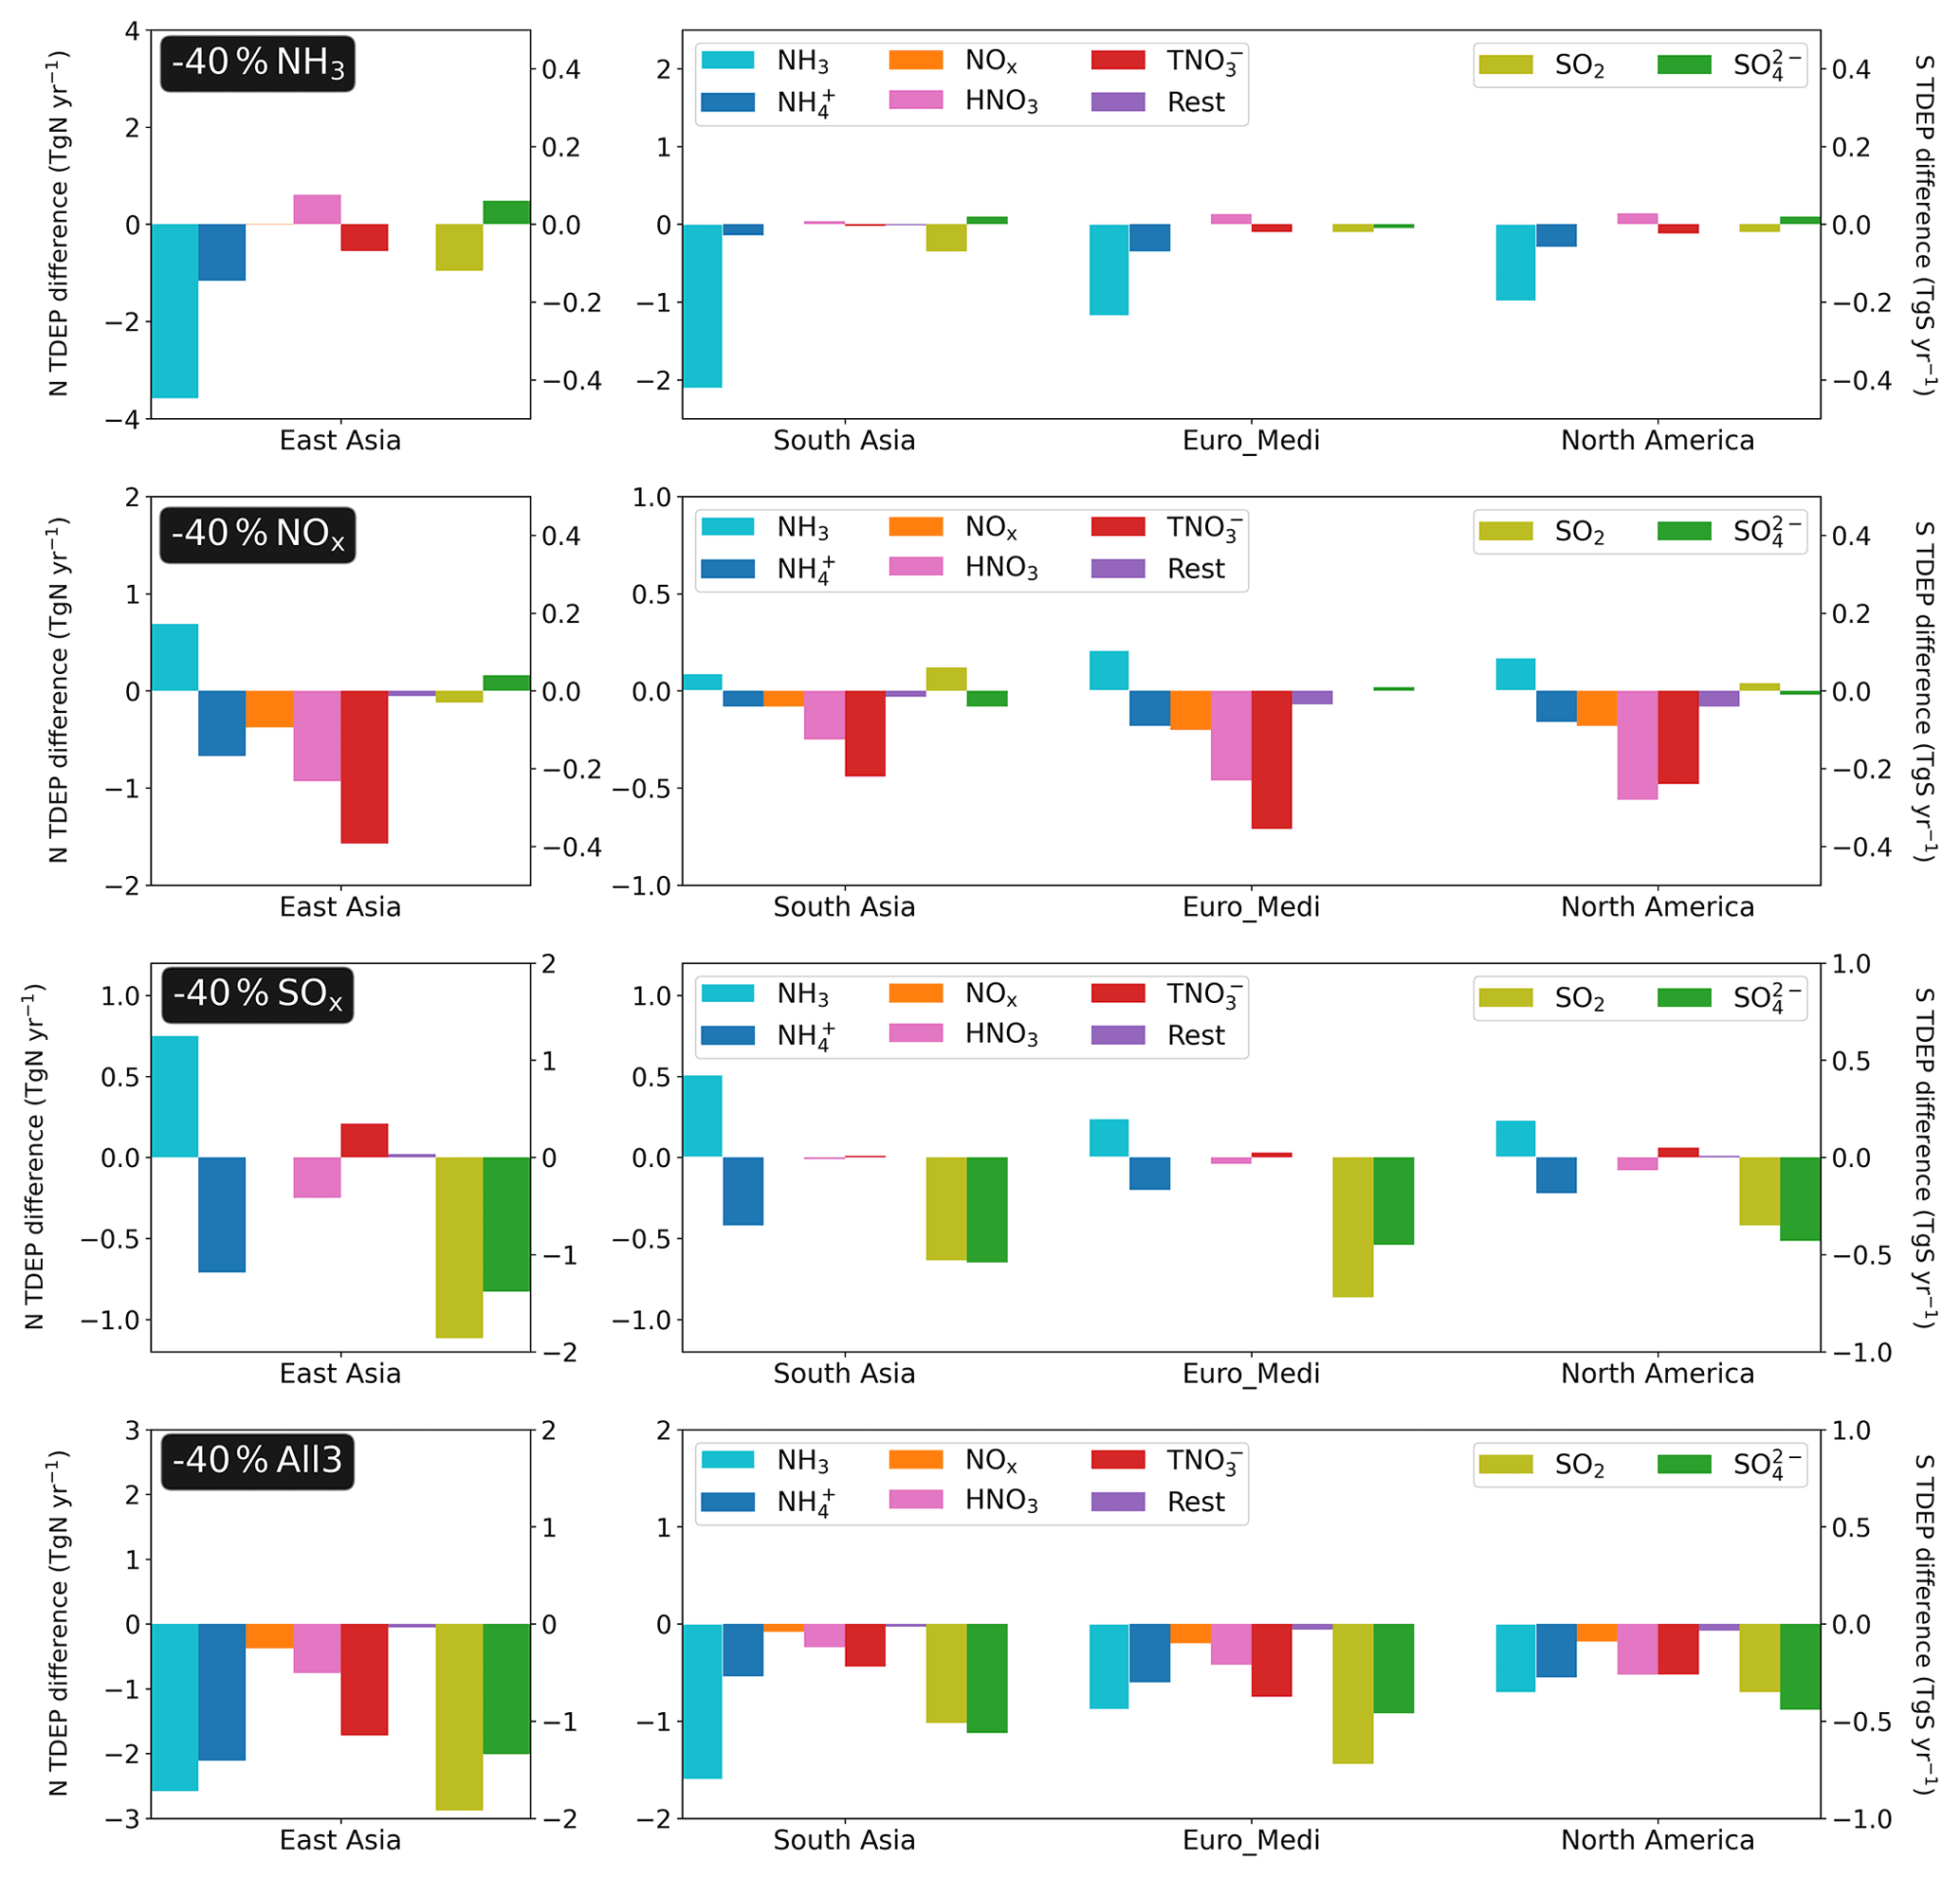
Figure 14The absolute sensitivities (emission reduction – baseline) of regional total deposition (wet and dry) of NH3, NH, NOx, HNO3, TNO (fine and coarse NO), SO2, and SO to 40 % emissions reductions in NH3 (top row), NOx (second row), and SOx (third row), individually and collectively (bottom row), for the four regions defined in Fig. 1. The left-hand y axis in each panel is for RDN and OXN species, while the right-hand y axis is for OXS species.
Figure 14 shows the differences of regional total deposition of individual species between baseline and the 40 % emissions reduction scenarios. The regional total RDN, OXN, and OXS deposition and the contributions of individual components are listed in Tables S6 and S7. As expected, the responses of regional total RDN, OXN, and OXS deposition are essentially linear through 20 % and 40 % reductions in their corresponding precursor and largely insensitive to reductions in the other precursors, although there are slight differences between regions. For example, 20 % and 40 % reductions in NH3 emissions, respectively, yield 20 %–21 % and 39 %–41 % decreases in total deposition of RDN in the four regions, whilst having no effect on regional total OXN and OXS deposition. The contributions of different deposition components do, however, vary with emission changes, and the different lifetimes of the deposition components contribute to the small variabilities in responses of total RDN, OXN, and OXS deposition to emissions reductions via differences in the transport through the regional boundaries.
A 40 % reduction in NH3 emissions produces a decrease of 3.58 TgN yr−1 (51 % of regional total deposition of the same species in baseline; similarly, hereinafter) in NH3 total deposition and 1.16 TgN yr−1 (24 %) in NH total deposition over East Asia (Fig. 14), which causes the contribution of NH3 to RDN deposition to decrease from 59 % (baseline) to 47 % (after 40 % NH3 reduction). In other regions, reductions in NH3 emissions also decrease NH3 deposition more effectively than NH deposition. Also in East Asia, a 40 % NH3 emissions reduction increases HNO3 deposition by 0.61 TgN yr−1 (20 %) and SO deposition by 0.06 TgS yr−1 (2 %) but decreases TNO deposition by 0.55 TgN yr−1 (14 %) and SO2 deposition by 0.12 TgS yr−1 (3 %). As a result, the contribution of HNO3 deposition to total OXN deposition increases from 30 % to 37 %, corresponding to a decrease in TNO contribution from 54 % to 47 %, whereas changes in contributions of SO2 and SO to OXS deposition are very small (Table S7). In other world regions, such changes in total deposition of HNO3, TNO, SO2, and SO derived from NH3 emissions reductions are similar but of a smaller magnitude.
For 40 % NOx emissions reductions, TNO deposition shows the largest decrease in East Asia (1.57 TgN yr−1, 35 %), South Asia (0.44 TgN yr−1, 26 %), and Euro_Medi (0.71 TgN yr−1, 37 %), whilst HNO3 deposition shows the largest decrease in North America (0.56 TgN yr−1, 40 %). In contrast, the sensitivities of NOx dry deposition to NOx emissions reductions are very small. The contributions of individual OXN deposition components remain fairly constant in all regions. Furthermore, East Asia, Euro_Medi, and North America show a 5 % increase in the contribution of NH3 deposition to total RDN deposition and a corresponding 5 % decrease in NH contribution for 40 % NOx emissions reductions, which reflects a small shifting of gas–aerosol partitioning for RDN as well. This kind of change in RDN deposition contribution is 2 % for South Asia. The impacts of NOx emissions reductions on OXS deposition compositions are very small.
The 40 % reductions in SOx emissions yield 3.24 TgS yr−1 (39 %), 1.07 TgS yr−1 (38 %), 1.17 TgS yr−1 (33 %), and 0.78 (37 %) TgS yr−1 decreases in OXS deposition over East Asia, South Asia, Euro_Medi, and North America, respectively. SOx emissions reductions cause larger decreases in SO2 deposition than in SO deposition in East Asia and Euro_Medi, while SO2 and SO deposition in South Asia and North America show similar sensitivities. This is associated with slightly greater proportions of SO2 (56 %–58 %) to OXS deposition in the former regions than in the latter regions, and these proportions are not affected by SOx emissions reductions (Table S7). NH3 and NH deposition is moderately sensitive to SOx emissions reductions in the four regions. An increase of 0.75 TgN yr−1 (11 %) in NH3 total deposition and a decrease of 0.71 TgN yr−1 (14 %) in NH total deposition for 40 % reductions in SOx emissions is observed over East Asia. For South Asia, Euro_Medi, and North America, the increases in NH3 total deposition due to 40 % SOx reductions are 0.51 TgN yr−1 (12 %), 0.25 TgN yr−1 (11 %), and 0.23 TgN yr−1 (12 %), respectively. This is because reduced SOx emissions lead to reductions in (NH4)2SO4 formation, which then cause increased NH3 but decreased NH concentrations. Another side effect of SOx emissions reductions in East Asia is a slight decrease in HNO3 deposition (0.25 TgN yr−1, 10 %) and an equivalent increase in TNO deposition (0.21 TgN yr−1, 5 %). The equivalent deposition changes are considerably smaller in the other three regions, which again indicates a larger amount of NH4NO3 pollution in East Asia than other regions.
For collective reductions in emissions of all precursors, the changes in deposition of each species reflect net effects of individual reductions in emissions of NH3, NOx, and SOx. For instance, Fig. 14 shows that the decrease in NH3 deposition in East Asia derived from 40 % reduction in emissions of all three species (2.58 TgN yr−1, 36 %) is smaller than that from individual NH3 emissions reductions (3.58 TgN yr−1, 51 %) due to the compensating effects of simultaneous NOx and SOx emissions reductions in the former scenario. In contrast, the decrease in NH deposition in East Asia for 40 % emissions reductions in all three species (2.11 TgN yr−1, 43 %) is almost double that from individual NH3 emissions reduction scenarios (1.16 TgN yr−1, 24 %). The variations in chemical forms of RDN, OXN, and OXS deposition affect where they deposit as well, since Nr and Sr species have different lifetimes, and a shorter lifetime causes a more localized deposition. Many studies show that NH3 and HNO3 have shorter lifetimes than NH and NO (Xu and Penner, 2012; Hauglustaine et al., 2014; Bian et al., 2017; Ge et al., 2022). The abatement of total N (TN = RDN + OXN) and S deposition within a certain region is partially offset by this more localized deposition pattern, especially in South Asia and Euro_Medi. The 40 % reductions in all three species emissions yield a 34 % (2.93 TgN yr−1) decrease in regional TN deposition in South Asia and a 34 % (1.18 TgS yr−1) decrease in regional OXS deposition in Euro_Medi, which means that less Nr and Sr pollution is transported outside these regions and more is deposited locally.
4.1 Model uncertainty
This study uses global model simulations for eight emissions reduction scenarios to investigate the geographical variation in the sensitivities of Nr, Sr, and PM2.5 to emissions reductions in inorganic precursor gases. Although the EMEP MSC-W ACTM is state of the art and widely used in scientific research and policy development, the analyses presented in this study are based on data from a single modelling system, and their accuracy is therefore subject to any uncertainties in the EMEP MSC-W ACTM's specific parameterization of atmospheric processes, as well as uncertainties in the chosen emission inventory and meteorology input. However, the evaluation of surface concentrations and wet deposition of Nr and Sr species from this model configuration for the same year against global measurements from 10 monitoring networks (Y. Ge et al., 2021) has demonstrated the model's capability to capture the overall spatial variations in annual concentrations of NH3, NH, NO2, HNO3, fine NO, SO2, and SO and their wet deposition in East Asia, South East Asia, Europe, and North America. No nationally compiled data for these species are publicly available in Oceania, South Asia, Africa, and Latin America, which inhibits model evaluation in these regions. Similarly, the lack of dry deposition comparison is due to the lack of measurements.
Y. Ge et al. (2021) also evaluate model outputs derived from two global emission inventories and find large localized discrepancies in NH3, NO2, and SO2 emissions in certain world regions between the two inventories. The impact of these discrepancies on modelled concentrations varies with regard to primary or secondary species and differs regionally. Meanwhile, Y. Ge et al. (2021) indicate that the model shows generally better linear correlations with measurement networks in South East Asia ( = 0.73 over seven species), Europe ( = 0.67 over seven species), and North America ( = 0.63 over 7 species) than in China ( = 0.35 over 5 species), which implies potential discrepancies among different measurements or regional emissions rather than systematic issues with the model parameterization. The uncertainties in both model and measurement constrain the extent to which the agreement between model and measurement can be used to evaluate a model's performance. The values of statistical metrics for this EMEP–WRF system are at least as good as other global modelling studies (Bian et al., 2017; Hauglustaine et al., 2014). As already indicated, a detailed discussion of model and measurement uncertainties is presented in Y. Ge et al. (2021).
Additionally, the sensitivities of global and regional Nr, Sr, and PM2.5 to various emissions reductions can only be investigated through modelling experiments, and since most model uncertainties will be similar across a set of simulations with the same model configuration, the modelled changes in concentrations between baseline and an emissions reduction scenario should be robust. Nevertheless, considering the fundamental uncertainties in emissions and model parameterizations, all numbers reported in this work should be considered as having underlying uncertainty, albeit that the latest available global emissions inventory and model version were used to minimize the impacts of these uncertainties.
4.2 Regional co-benefits and disbenefits of single-precursor emissions controls
The Results section shows that the reduction in emissions of one individual precursor has multiple co-benefits and sometimes small disbenefits on mitigating Nr, Sr, and PM2.5 pollution, and these effects are geographically variable. In this work, our discussion focuses on East Asia, South Asia, Euro_Medi, and North America on account of both the thoroughly evaluated model results and the high population density plus high Nr and Sr pollution in these regions. The comparison of regional responses to emissions reductions reveals differences in regional oxidation regime, SIA chemistry, and deposition pattern, which are important processes to consider when designing emissions control policies, since transitory increases in PM2.5 and some Nr and Sr pollutants could occur as emissions reduction measures are gradually applied.
Globally, reductions in NH3 emissions are effective at reducing NH3 concentrations and its wet and dry deposition but considerably less effective at reducing NH. This is because most world regions are in an ammonia-rich chemical domain, in which reducing NH3 emissions only has limited effects on mitigating SIA formation (Ge et al., 2022). Other co-benefits of NH3 emissions reductions include reductions in fine NO surface concentrations and deposition in East Asia, South Asia, Euro_Medi, and North America because of reduced NH4NO3 formation. A notable disbenefit is the increased SO2 surface concentration and human exposure in these regions, which is caused by reduced SO2 dry deposition. The dry deposition velocity of SO2 is negatively correlated with the molar acidity ratio aSN, which is a model parameterization derived from long-term deposition measurements (Erisman et al., 2001; Simpson et al., 2012). Reduced NH3 emissions therefore increase the acidity, leading to decreased SO2 dry deposition.
Similarly, whilst reducing NOx emissions is of course an effective way of decreasing global concentrations and deposition of OXN species, the degree to which different OXN species are decreased varies across regions. A 40 % reduction in NOx emissions decreases NOx and fine NO surface concentrations in East Asia by 45 % and 33 %, respectively, whereas in South Asia this measure has a greater effect on fine NO (45 % decrease) than on NOx (22 % decrease). In Euro_Medi and North America, the 40 % NOx emissions reductions produce similar decreases in regional average NOx (36 %–38 %) and fine NO (41 %–42 %) concentrations. These varying regional responses are consequent to different regional NOx oxidation regime and SIA chemistry. The NOx emissions reductions decrease NOx surface concentrations, which increases O3 concentrations in the high NOx areas of eastern China and western and central Europe and therefore increases the atmospheric oxidizing capacity in these regions. As a result, more SO2 is oxidized to SO, which leads to decreased SO2 concentrations and deposition and, consequently, increased SO concentrations and deposition in these areas. The enhanced SO production can partially (or even totally) offset the mass reduction in PM2.5 caused by reduced NH4NO3 formation when reductions in NOx emissions are not sufficiently high. The increased oxidant levels will also enhance HNO3 and NO production in these regions, but this effect does not compensate for the reduction in HNO3 and NO concentrations due to the reductions in their precursors (at least for 20 % and 40 % NOx reductions), so the net effect is globally decreased HNO3 and NO. Consequently, reduced HNO3 and NO levels caused by NOx emissions reductions lead to less NH4NO3 formation, which then results in globally increased NH3 concentration and deposition and decreased NH concentration and deposition. In contrast, decreased O3 concentrations in South Asia and North America in response to NOx emissions reductions result in less chemical conversion of SO2 to SO, which then causes increased SO2 and decreased SO concentrations and deposition. Clappier et al. (2021) and Thunis et al. (2021) showed that the increased atmospheric oxidizing capacity induced by reductions in NOx emissions is the reason for increased PM2.5 levels in the Po basin (Italy), especially during wintertime, with increased nitrate, sulfate, and secondary organic aerosol (SOA) concentrations all being closely related to increased O3 levels. Balamurugan et al. (2022) reported that reductions in SIA were much smaller than NO2 emissions reductions during COVID lockdown in Germany, which is because the increased oxidant levels (OH, NO3, and O3) enhanced the formation of sulfate and nighttime nitrate, which then partially offset the lockdown-induced PM2.5 decreases. Fu et al. (2020) noted that the increased oxidation of NOx to HNO3 due to increased O3 levels makes winter haze NO in the North China Plain (NCP) almost insensitive to 30 % reductions in emissions of NOx, while Le et al. (2020) also revealed an unexpected PM exacerbation caused by unfavourable meteorological conditions and intensified SIA formation due to elevated O3 levels induced by NOx emissions reductions during COVID lockdown in China.
The greatest effect of SOx emissions reductions is the direct decrease in global concentrations and deposition of SO2 and SO, which then induces changes in gas–aerosol partitioning of NH3-NH and HNO3-NO. As discussed above, the reduction in (NH4)2SO4 formation frees more gaseous NH3 and promotes NH4NO3 formation, leading to increased concentrations and deposition of NH3 and fine NO in all world regions. Considering that one SO takes up two NH3 molecules under ammonia-rich conditions, but NO only takes one, the net effect of SOx emissions reductions still causes globally decreased NH concentrations and deposition. Liu et al. (2018) noted a significant increase in annual NH3 concentrations caused by rapid SO2 emissions reductions in the NCP. In addition, the shifting of RDN from aerosol-phase NH to gaseous NH3 in response to reduced SOx emissions also means that RDN pollution becomes more localized because NH3 has a much shorter lifetime (1.6 d) than NH (8.9 d), as it deposits more quickly to land rather than being transported to other regions (Ge et al., 2022). Utilizing combined measurements and modelling, Leung et al. (2020) found that the reduction in wintertime PM2.5 in the NCP is buffered by enhanced NH4NO3 formation due to decreased SO concentration, liberating free NH3, and increased oxidant levels, promoting HNO3 production, despite SO2 and NOx emissions reductions in China. However, it is important to note that (NH4)2SO4 has greater molecular mass than NH4NO3 and hence has larger leverage on PM2.5 mass concentration, which ensures that the reductions in PM2.5 mass concentrations derived from reduced (NH4)2SO4 are less readily offset by increases in NH4NO3 concentrations. This also means that relative changes in the SO component cause greater mass changes with respect to PM2.5 air quality objectives (which must be expressed as mass concentration) than do the same relative changes in the NO component. The relative changes in the SIA components of PM2.5 expressed as molar concentrations would be different.
Additionally, it is noteworthy that changes in SOx emissions have some subtle effects on NOx concentrations as well. According to Fig. 4, small increases in NOx concentrations are observed in southern China, western Europe, and the eastern US, while India and north-eastern China show decreased NOx levels in response to SOx emissions reductions. These impacts can be attributed to the role of SO in the hydrolysis of N2O5 (which can undergo photolysis and produce NO2). Many measurement studies, both laboratory and based on ambient samples, have revealed varying rates with different dependencies for this reaction, such as the relative humidity, available aerosol surface area, the size and composition of the aerosol particles, and the ratio of sulfate to organic matter (Bertram et al., 2009; Bertram and Thornton, 2009; Chang et al., 2011; Wagner et al., 2013; McDuffie et al., 2018). The parameterization used in the EMEP MSC-W model, based on the work of Riemer et al. (2003), incorporates SO concentrations (via the parameter of aerosol surface area and reaction probability) into the calculation of the hydrolysis rate of N2O5 (Simpson et al., 2012). Consequently, reductions in SOx emissions affect SO levels, which in turn affect N2O5 and NOx levels. While the changes in NOx concentrations are small when viewed at a regional average level (0 %–1 %, as depicted in Fig. 5), they may be significant in very local areas in the regions mentioned above. This part of the chemistry is one of the most uncertain aspects of the atmospheric science field. As a result, more laboratory and ambient measurement studies are needed to improve and test this type of model parametrization.
4.3 PM2.5 sensitivities
This study highlights important messages for policy makers with respect to regional PM2.5 mitigation. The most effective emissions control for decreasing regional average PM2.5 concentrations, via an individual component, differs between world regions, as follows.
More emissions controls focusing on NH3 and NOx are necessary for regions with better air quality, such as Europe and North America, to decrease the annual PM2.5 concentrations below the latest WHO guideline of 5 µg m−3 (WHO, 2021). More specifically, PM2.5 sensitivities in Euro_Medi are complex and vary from the north to south. The UK and Scandinavia are more sensitive to NH3 emissions reductions, central Europe is more sensitive to NOx, while the Mediterranean region is more sensitive to SOx, which is consistent with conclusions from other European studies (Megaritis et al., 2013; Vieno et al., 2016; Aksoyoglu et al., 2020; Jiang et al., 2020; Clappier et al., 2021). From a perspective of Europe-wide policy making, it is important to reduce NH3 and NOx emissions together and/or go for stronger reductions to minimize adverse effects caused by enhanced oxidation efficiency. In North America, the most effective measure to decrease annual mean PM2.5 is reducing NOx emissions. Similar conclusions are reported by other studies. Liao et al. (2008) reported that the reduction in NOx emissions was most effective for decreasing 24 h mean PM2.5 levels for five cities in the US, while Kelly et al. (2021) reported that reducing NOx emissions was more effective for reducing PM2.5 concentrations in the eastern US than SO2, NH3, and VOC emissions reductions in both January and July. Tsimpidi et al. (2007, 2008) showed that NOx emissions reductions were the most effective measure for controlling PM2.5 in the eastern US in summer due to the combined effects of lower atmospheric oxidant levels and smaller precursor emissions. Unfortunately, no conclusion on annual mean PM2.5 sensitivities was drawn from these studies.
PM2.5 in South Asia is most sensitive to SOx emissions reductions and least sensitive to NH3 emissions reductions, which is because South Asia is extremely ammonia rich (Ge et al., 2022), so reducing NH3 has little impact on mitigating SIA. In this study, 40 % reductions in SOx and NH3 emissions, respectively, produce 10 % and 1 % decreases in the South Asia regional average PM2.5. Pozzer et al. (2017) also showed that NH3 emissions control has negligible impacts on PM2.5 levels in South Asia, with a 50 % reduction in NH3 emissions only reducing annual mean PM2.5 by 2 %. Given the continuing strong growth of SO2 emissions in India now and in future projections (Sadavarte and Venkataraman, 2014; Hoesly et al., 2018; Aas et al., 2019; Szopa et al., 2021), it is anticipated that PM2.5 levels in this region will continue to rise.
For East Asia, although considerable emissions reductions in SO2 have been taking place in China, and to a lesser extent reductions in NOx (Liu et al., 2016; Hoesly et al., 2018; Zheng et al., 2018), continuous efforts need to be put into reducing not only SO2 and NOx but also NH3, as reductions in the three precursors are equally effective for mitigating PM2.5. Studies focusing on East Asia also highlight the importance of NH3 emissions control for reducing annual PM2.5 pollution, especially in central and eastern China (Wang et al., 2011; Pozzer et al., 2017; Cheng et al., 2021). In addition, due to the high proportion of SIA in PM2.5 in East Asia, reducing all three precursors together also produces the greatest reduction in regional average PM2.5 compared to South Asia, Europe, and North America. Another benefit of collective emissions reductions is that it minimizes the adverse side effects from individual reductions, since these disbenefits can cause transitory increases in PM2.5 and deposition of certain Nr and Sr species when emission reduction measures are gradually applied.
In short, considering the evolution of the chemical state of the atmosphere in Europe and North America since the industrial revolution, the measures to combat PM2.5 pollution in the two regions may be a good reference for countries in East and South Asia.
4.4 Non-one-to-one linearity
Analyses of both 20 % and 40 % emissions reductions reveal different kinds of linearity and non-linearity. There is considerable non-linearity in the sense of a lack of one-to-one proportionality between an emission reduction and a species concentration or deposition change. Precursor emissions reductions sometimes even increases other pollutant concentrations. This is consequent on interactions in SIA formation, atmospheric oxidizing capacity, and N and S deposition, as discussed earlier, and is highly geographically variable. Such non-one-to-one proportionality may be more significant in a certain area during a certain season due to the inter-annual variability in local meteorology and emissions profiles. However, whilst the sensitivity of an annual quantity of a pollutant to emissions reductions is subject to seasonality, we are confident that the broad conclusions of this study will hold, and from a global and regional policymaking perspective, it is more practical to develop policies of reductions in emissions from different sectors and countries on an annual level. Studies focusing on non-proportional responses of European PM2.5 to emissions reductions showed that significant seasonality only occurs in a few specific areas (Thunis et al., 2015, 2021; Clappier et al., 2021).
On the other hand, a linearity in response to emissions reductions is apparent via the observation that the responses of PM2.5, Nr, and Sr annual concentrations and deposition components remain essentially proportional to the precursor emissions reductions (20 % and 40 %) for a given precursor in a given region, albeit that the magnitude of the slope varies substantially with different precursors and regions. Even if the net concentration changes of one species (e.g. PM2.5) induced by reductions in emissions of all three precursors are smaller (or greater) than the sum of changes from reductions in individual precursors due to different chemical interactions as discussed earlier, these net changes still follow a very similar gradient when emissions reductions in all three precursors change from 20 % to 40 %. However, where the gradient in the response is not one-to-one, the linearity in the response that is observed up to the 40 % emissions reductions simulated here clearly cannot continue to extrapolate linearly all the way to 100 % emissions reductions. The gradient of the response must be flatter or steeper (depending on atmospheric component) at the beginning or end of the span from 0 to 100 % emissions reduction. For instance, 20 % and 40 % reductions in NH3 emissions give 24 % and 48 % decreases in global annual mean NH3 concentrations, respectively (i.e. gradients exceeding one to one), whereas these emissions reductions only produce 6 % and 14 % decreases in global NH concentrations, respectively (i.e. gradients less than one to one). When NH3 emissions are completely switched off, both NH3 and NH concentrations will be zero, so the NH3 concentration sensitivity must become smaller, and the NH concentration sensitivity must become larger as NH3 emissions reductions approach 100 %. Additional serial sensitivity experiments are required to acquire the full spectrum of NH3 and NH (and all other species) sensitivities. It is therefore important for policy makers in different regions to know the emissions reductions required to obtain the mitigation responses needed for specific air quality targets.
4.5 Implications and limitations
The parameterization of atmospheric processes in ACTMs is in continuous interplay with the experimental evidence. The responses of Nr and Sr species to emissions reductions in NH3, NOx, and SOx as discussed in previous sections reveal several complex processes incorporated into the EMEP MSC-W model. The extent to which these parameterized processes accurately represent the reality of the atmosphere calls for more experimental evidence (field and/or laboratory measurements).
For instance, the synergistic interaction between NH3 and SO2 dry deposition to leaf surfaces is well known and has been termed “co-deposition”. The idea is that the existence of both NH3 and SO2 acts to reduce the canopy resistances and increase the dry deposition rate for both gases (Sutton et al., 1994; Fowler et al., 2001; Nemitz et al., 2004; Fowler et al., 2009; Massad et al., 2010). This co-deposition effect is incorporated into the EMEP MSC-W model, making use of empirical parameters derived from European field measurements (Erisman et al., 2001) which may not be completely applicable to other world regions (e.g. South America). In addition, for regional variations in atmospheric oxidizing capacity caused by NOx emissions reductions, there are several studies reporting measurement evidence in East Asia, Europe, and North America, while no such measurements are found in South Asia. Long-term standardized measurements for both surface concentrations and wet and dry deposition with a sufficient amount of sampling sites in each geographical region are required for corroborating globally modelled results. The quantitative results reported in this study can serve as a reference for future modelling and measurement studies, albeit firmer field evidence worldwide is required to develop a reliable and robust chemistry and deposition scheme for global models.
Finally, it is also important to remember that reductions in anthropogenic emissions of SIA precursors will have many co-benefits on forest health, ecosystem biodiversity, and climate, not just in populated areas but elsewhere. For instance, NH3 has become a major air pollution driver of lichen distributions in many European forests in recent years. In Scotland, Sutton et al. (2009) showed how lichens were gradually eradicated in areas near a poultry farm which is a large emitter of NH3. Similarly, van Herk (2001) reported that increased ambient NH3 concentrations in the Netherlands appear to be the primary cause of the disappearance of acidophytic lichen species (i.e. species that prefer naturally acidic bark) over the last decade. Moreover, although the effects on the availability of nutrients in terrestrial and aquatic ecosystems are broadly assumed to be decided by total N inputs, Sutton et al. (2020) placed a stronger emphasis on the form in which the N was deposited. In their experiments, dry deposition of NH3 showed a larger toxicity than wet deposition of NH and NO. In this case, policy makers should be more cautious about emissions controls with side effects of increased NH3 dry deposition. Meanwhile, since most NH3 is emitted via volatilization, a warmer atmosphere will promote its global emissions (Johnson et al., 2008; Sutton et al., 2013; Riddick et al., 2018). NH3 emission controls thus need to include both direct reductions and indirect measures to abate climate warming as well.
The sensitivities of global and regional annual mean surface concentrations and deposition of gaseous and particle Nr and Sr to 20 % and 40 % reductions in anthropogenic emissions of NH3, NOx, and SOx, both individually and collectively, has been investigated using the EMEP MSC-W model coupled with WRF meteorology for 2015. East Asia, South Asia, Euro_Medi, and North America are selected for regional discussions because of their high population densities and Nr and Sr pollution, and because the model outputs are evaluated and agree reasonably well with measurements in most of these areas. The comparison in regional responses reveals that the emissions reduction in one precursor has multiple co-benefits and sometimes small disbenefits on mitigating Nr, Sr, and PM2.5 pollution, and these effects are highly geographically variable.
Whilst reductions in NH3 emissions are effective for decreasing annual NH3 concentrations and deposition, they are considerably less effective at decreasing NH. This is because all densely populated continents are ammonia rich, so reducing NH3 emissions only has limited effects on mitigating SIA formation. A 40 % reduction in NH3 emissions decreases regional average NH3 concentrations in the four regions by 47 %–49 %, while NH concentrations decrease in the order of Euro_Medi (18 %), East Asia (15 %), North America (12 %), and South Asia (4 %), the order of increasing regional ammonia richness. A notable disbenefit is increased SO2 concentrations because reduced NH3 levels affect the pH-dependent SO2 dry deposition. A 40 % reduction in NH3 emissions increases SO2 concentrations in East Asia by 16 %, in South Asia and North America by 14 %, and in Euro_Medi by 10 %.
Large regional differences are observed in NOx emissions reduction scenarios. In East Asia, NOx concentrations are very effectively decreased (by 45 %) with 40 % NOx emissions reductions, but they are less effectively decreased in Euro_Medi (38 %) and North America (36 %), and to the least extent in South Asia (22 %). By contrast, the regional sensitivities of fine NO are reversed: South Asia shows the largest decrease (45 %), whilst East Asia shows the smallest decrease (33 %). This phenomenon is related to different regional oxidation regimes and SIA chemistry. NOx emissions reductions increase O3 levels in East Asia (and also, but by less, in Euro_Medi) but decrease O3 levels in South Asia (and also, but by less, in North America), which causes an enhanced NOx and SOx oxidation in former regions but a decreased one in latter regions. Consequently, increased SO and SO2 concentrations appear in East Asia and South Asia, respectively.
Reductions in SOx emissions have globally consistent impacts on SO2 and SO concentrations. A 40 % reduction in SOx emissions decreases SO2 and SO concentrations in the four regions by 42 %–45 % and 34 %–38 %, respectively, while the disbenefit is that decreased (NH4)2SO4 formation yields ∼ 12 % growth in NH3 total deposition.
This work also highlights important messages for policy makers concerning the mitigation of PM2.5. More emissions controls focusing on NH3 and NOx are necessary for regions with better air quality, such as Europe and North America. In Euro_Medi, PM2.5 sensitivities vary from the north to south, with NH3 reductions being more effective for the UK and Scandinavia, NOx for central Europe, and SOx for the Mediterranean. In South Asia, PM2.5 is most sensitive to SOx and least sensitive to NH3, which is consistent with the fact that South Asia is so ammonia rich that reducing NH3 hardly has any impacts. Given the continuing strong growth of SO2 emissions in India now and in future projections, it is anticipated that PM2.5 levels in this region will continue to rise. In East Asia, although considerable emissions reductions in SO2 have been taking place in China, and to a lesser extent reductions in NOx also, continuing efforts need to be put into reducing not only SO2 and NOx but also NH3, as reductions in the three precursors are equally effective for mitigating PM2.5.
This work reveals some geographically varying and non-one-to-one proportionality of chemical responses of Nr, Sr, and PM2.5 to emissions reductions. It is thus important not only to prioritize different emission controls in different regions but also to reduce several emissions together in order to minimize the potential disbenefits.
As described and referenced in Sect. 2 of this paper, this study used two open-source global models: the European Monitoring and Evaluation Programme Meteorological Synthesizing Centre – West atmospheric chemistry transport model (version 4.34, source code available at https://doi.org/10.5281/Zenodo.3647990; EMEP MSC-W, 2020) and the Weather Research and Forecasting meteorological model (WRF, version 3.9.1.1, https://www.wrf-model.org, last access: 8 August 2022; Skamarock et al., 2008). The model outputs presented in the figures and tables in this paper and the corresponding Python scripts are available at https://doi.org/10.5281/Zenodo.7082661 (Ge, 2022).
The supplement related to this article is available online at: https://doi.org/10.5194/acp-23-6083-2023-supplement.
MRH, DS, and MV conceptualized and supervised the study. MV and PW contributed to model development and set-up and provided modelling support. MV provided computing resources. YG contributed to the study design and undertook all model simulations, formal data analyses, visualization of the results, and data curation, with discussion and refinement by all authors. The original draft of the paper was written by YG, with contributions and editing by MRH. All authors provided review comments and approval of the final version.
The contact author has declared that none of the authors has any competing interests.
Publisher's note: Copernicus Publications remains neutral with regard to jurisdictional claims in published maps and institutional affiliations.
Yao Ge gratefully acknowledges studentship funding from the University of Edinburgh and its School of Chemistry. This work was in part supported by the European Monitoring and Evaluation Programme under the United Nations Economic Commission for Europe Convention on Long-range Transboundary Air Pollution.
This research has been supported by the UK Natural Environment Research Council (grant nos. NE/R016429/1 and NE/R000131/1); the Department for Environment, Food and Rural Affairs, UK Government contract (Research & Development Support for National Air Pollution Control Strategies (ECM: 62041) 2021 to 2024); the UK Research and Innovation Natural Environment Research Council as part of the NC-International programme (NE/X006247/1); and the University of Edinburgh (PhD studentship).
This paper was edited by Aijun Ding and reviewed by three anonymous referees.
Aas, W., Mortier, A., Bowersox, V., Cherian, R., Faluvegi, G., Fagerli, H., Hand, J., Klimont, Z., Galy-Lacaux, C., Lehmann, C. M. B., Myhre, C. L., Myhre, G., Olivié, D., Sato, K., Quaas, J., Rao, P. S. P., Schulz, M., Shindell, D., Skeie, R. B., Stein, A., Takemura, T., Tsyro, S., Vet, R., and Xu, X.: Global and regional trends of atmospheric sulfur, Sci. Rep., 9, 953, https://doi.org/10.1038/s41598-018-37304-0, 2019.
Aksoyoglu, S., Jiang, J., Ciarelli, G., Baltensperger, U., and Prévôt, A. S. H.: Role of ammonia in European air quality with changing land and ship emissions between 1990 and 2030, Atmos. Chem. Phys., 20, 15665–15680, https://doi.org/10.5194/acp-20-15665-2020, 2020.
AQEG: Mitigation of United Kingdom PM2.5 Concentrations, Air Quality Expert Group, UK Department for Environment, Food and Rural Affairs, London, PB13837, https://uk-air.defra.gov.uk/assets/documents/reports/cat11/1508060903_DEF-PB14161_Mitigation_of_UK_PM25.pdf (last access: 31 May 2023), 2015.
Balamurugan, V., Chen, J., Qu, Z., Bi, X., and Keutsch, F. N.: Secondary PM2.5 decreases significantly less than NO2 emission reductions during COVID lockdown in Germany, Atmos. Chem. Phys., 22, 7105–7129, https://doi.org/10.5194/acp-22-7105-2022, 2022.
Behera, S. N., Sharma, M., Aneja, V. P., and Balasubramanian, R.: Ammonia in the atmosphere: a review on emission sources, atmospheric chemistry and deposition on terrestrial bodies, Environ. Sci. Pollut. Res., 20, 8092–8131, https://doi.org/10.1007/s11356-013-2051-9, 2013.
Berge, E. and Jakobsen, H. A.: A regional scale multilayer model for the calculation of long-term transport and deposition of air pollution in Europe, Tellus B, 50, 205–223, https://doi.org/10.3402/tellusb.v50i3.16097, 1998.
Bergström, A.-K. and Jansson, M.: Atmospheric nitrogen deposition has caused nitrogen enrichment and eutrophication of lakes in the northern hemisphere, Glob. Change Biol., 12, 635–643, https://doi.org/10.1111/j.1365-2486.2006.01129.x, 2006.
Bergström, R., Hallquist, M., Simpson, D., Wildt, J., and Mentel, T. F.: Biotic stress: a significant contributor to organic aerosol in Europe?, Atmos. Chem. Phys., 14, 13643–13660, https://doi.org/10.5194/acp-14-13643-2014, 2014.
Bertram, T. H. and Thornton, J. A.: Toward a general parameterization of N2O5 reactivity on aqueous particles: the competing effects of particle liquid water, nitrate and chloride, Atmos. Chem. Phys., 9, 8351–8363, https://doi.org/10.5194/acp-9-8351-2009, 2009.
Bertram, T. H., Thornton, J. A., Riedel, T. P., Middlebrook, A. M., Bahreini, R., Bates, T. S., Quinn, P. K., and Coffman, D. J.: Direct observations of N2O5 reactivity on ambient aerosol particles, Geophys. Res. Lett., 36, L19803, https://doi.org/10.1029/2009GL040248, 2009.
Bian, H., Chin, M., Hauglustaine, D. A., Schulz, M., Myhre, G., Bauer, S. E., Lund, M. T., Karydis, V. A., Kucsera, T. L., Pan, X., Pozzer, A., Skeie, R. B., Steenrod, S. D., Sudo, K., Tsigaridis, K., Tsimpidi, A. P., and Tsyro, S. G.: Investigation of global particulate nitrate from the AeroCom phase III experiment, Atmos. Chem. Phys., 17, 12911–12940, https://doi.org/10.5194/acp-17-12911-2017, 2017.
Botha, C. F., Hahn, J., Pienaar, J. J., and Van Eldik, R.: Kinetics and mechanism of the oxidation of sulfur(IV) by ozone in aqueous solutions, Atmos. Environ., 28, 3207–3212, https://doi.org/10.1016/1352-2310(94)00174-J, 1994.
Brauer, M., Freedman, G., Frostad, J., van Donkelaar, A., Martin, R. V., Dentener, F., Dingenen, R. v., Estep, K., Amini, H., Apte, J. S., Balakrishnan, K., Barregard, L., Broday, D., Feigin, V., Ghosh, S., Hopke, P. K., Knibbs, L. D., Kokubo, Y., Liu, Y., Ma, S., Morawska, L., Sangrador, J. L. T., Shaddick, G., Anderson, H. R., Vos, T., Forouzanfar, M. H., Burnett, R. T., and Cohen, A.: Ambient Air Pollution Exposure Estimation for the Global Burden of Disease 2013, Environ. Sci. Technol., 50, 79–88, https://doi.org/10.1021/acs.est.5b03709, 2016.
Chang, M., Cao, J., Ma, M., Liu, Y., Liu, Y., Chen, W., Fan, Q., Liao, W., Jia, S., and Wang, X.: Dry deposition of reactive nitrogen to different ecosystems across eastern China: A comparison of three community models, Sci. Total Environ., 720, 137548, https://doi.org/10.1016/j.scitotenv.2020.137548, 2020.
Chang, W. L., Bhave, P. V., Brown, S. S., Riemer, N., Stutz, J., and Dabdub, D.: Heterogeneous Atmospheric Chemistry, Ambient Measurements, and Model Calculations of N2O5: A Review, Aerosol Sci. Tech., 45, 665–695, https://doi.org/10.1080/02786826.2010.551672, 2011.
Chen, C., Zhu, P., Lan, L., Zhou, L., Liu, R., Sun, Q., Ban, J., Wang, W., Xu, D., and Li, T.: Short-term exposures to PM2.5 and cause-specific mortality of cardiovascular health in China, Environ. Res., 161, 188–194, https://doi.org/10.1016/j.envres.2017.10.046, 2018a.
Chen, L., Shi, M., Gao, S., Li, S., Mao, J., Zhang, H., Sun, Y., Bai, Z., and Wang, Z.: Assessment of population exposure to PM2.5 for mortality in China and its public health benefit based on BenMAP, Environ. Pollut., 221, 311–317, https://doi.org/10.1016/j.envpol.2016.11.080, 2017.
Chen, X., Wang, Y.-h., Ye, C., Zhou, W., Cai, Z.-c., Yang, H., and Han, X.: Atmospheric Nitrogen Deposition Associated with the Eutrophication of Taihu Lake, J. Chem., 2018, 4017107, https://doi.org/10.1155/2018/4017107, 2018b.
Cheng, L., Ye, Z., Cheng, S., and Guo, X.: Agricultural ammonia emissions and its impact on PM2.5 concentrations in the Beijing–Tianjin–Hebei region from 2000 to 2018, Environ. Pollut., 291, 118162, https://doi.org/10.1016/j.envpol.2021.118162, 2021.
Ciarelli, G., Theobald, M. R., Vivanco, M. G., Beekmann, M., Aas, W., Andersson, C., Bergström, R., Manders-Groot, A., Couvidat, F., Mircea, M., Tsyro, S., Fagerli, H., Mar, K., Raffort, V., Roustan, Y., Pay, M.-T., Schaap, M., Kranenburg, R., Adani, M., Briganti, G., Cappelletti, A., D'Isidoro, M., Cuvelier, C., Cholakian, A., Bessagnet, B., Wind, P., and Colette, A.: Trends of inorganic and organic aerosols and precursor gases in Europe: insights from the EURODELTA multi-model experiment over the 1990–2010 period, Geosci. Model Dev., 12, 4923–4954, https://doi.org/10.5194/gmd-12-4923-2019, 2019.
Clappier, A., Thunis, P., Beekmann, M., Putaud, J. P., and de Meij, A.: Impact of SOx, NOx and NH3 emission reductions on PM2.5 concentrations across Europe: Hints for future measure development, Environ. Int., 156, 106699, https://doi.org/10.1016/j.envint.2021.106699, 2021.
Crippa, M., Solazzo, E., Huang, G., Guizzardi, D., Koffi, E., Muntean, M., Schieberle, C., Friedrich, R., and Janssens-Maenhout, G.: High resolution temporal profiles in the Emissions Database for Global Atmospheric Research, Sci. Data, 7, 121, https://doi.org/10.1038/s41597-020-0462-2, 2020.
EEA: Air quality in Europe – 2021 report, EEA Report No. 15/2021, European Environment Agency, Publications Office of the European Union, https://www.eea.europa.eu/publications/air-quality-in-europe-2021/ (last access: 7 August 2022), 2021.
EMEP MSC-W: metno/emep-ctm: OpenSource rv4.34 (202001) (rv4_34), Zenodo [code], https://doi.org/10.5281/zenodo.3647990, 2020.
Erisman, J. W., Hensen, A., Fowler, D., Flechard, C. R., Grüner, A., Spindler, G., Duyzer, J. H., Weststrate, H., Römer, F., Vonk, A. W., and Jaarsveld, H. V.: Dry Deposition Monitoring in Europe, Water Air Soil Poll., 1, 17–27, https://doi.org/10.1023/A:1013105727252, 2001.
Erisman, J. W., Domburg, N., de Vries, W., Kros, H., de Haan, B., and Sanders, K.: The Dutch N-cascade in the European perspective, Scie. China Ser. C, 48, 827–842, https://doi.org/10.1007/BF03187122, 2005.
Fang, Y., Ye, C., Wang, J., Wu, Y., Hu, M., Lin, W., Xu, F., and Zhu, T.: Relative humidity and O3 concentration as two prerequisites for sulfate formation, Atmos. Chem. Phys., 19, 12295–12307, https://doi.org/10.5194/acp-19-12295-2019, 2019.
Fowler, D., Sutton, M. A., Flechard, C., Cape, J. N., Storeton-West, R., Coyle, M., and Smith, R. I.: The Control of SO2 Dry Deposition on to Natural Surfaces by NH3 and its Effects on Regional Deposition, Water Air Soil Poll., 1, 39–48, https://doi.org/10.1023/A:1013161912231, 2001.
Fowler, D., Pilegaard, K., Sutton, M. A., Ambus, P., Raivonen, M., Duyzer, J., Simpson, D., Fagerli, H., Fuzzi, S., Schjoerring, J. K., Granier, C., Neftel, A., Isaksen, I. S. A., Laj, P., Maione, M., Monks, P. S., Burkhardt, J., Daemmgen, U., Neirynck, J., Personne, E., Wichink-Kruit, R., Butterbach-Bahl, K., Flechard, C., Tuovinen, J. P., Coyle, M., Gerosa, G., Loubet, B., Altimir, N., Gruenhage, L., Ammann, C., Cieslik, S., Paoletti, E., Mikkelsen, T. N., Ro-Poulsen, H., Cellier, P., Cape, J. N., Horváth, L., Loreto, F., Niinemets, Ü., Palmer, P. I., Rinne, J., Misztal, P., Nemitz, E., Nilsson, D., Pryor, S., Gallagher, M. W., Vesala, T., Skiba, U., Brüggemann, N., Zechmeister-Boltenstern, S., Williams, J., O'Dowd, C., Facchini, M. C., de Leeuw, G., Flossman, A., Chaumerliac, N., and Erisman, J. W.: Atmospheric composition change: Ecosystems–Atmosphere interactions, Atmos. Environ., 43, 5193–5267, https://doi.org/10.1016/j.atmosenv.2009.07.068, 2009.
Fowler, D., Steadman, C. E., Stevenson, D., Coyle, M., Rees, R. M., Skiba, U. M., Sutton, M. A., Cape, J. N., Dore, A. J., Vieno, M., Simpson, D., Zaehle, S., Stocker, B. D., Rinaldi, M., Facchini, M. C., Flechard, C. R., Nemitz, E., Twigg, M., Erisman, J. W., Butterbach-Bahl, K., and Galloway, J. N.: Effects of global change during the 21st century on the nitrogen cycle, Atmos. Chem. Phys., 15, 13849–13893, https://doi.org/10.5194/acp-15-13849-2015, 2015.
Fowler, D., Brimblecombe, P., Burrows, J., Heal, M. R., Grennfelt, P., Stevenson, D. S., Jowett, A., Nemitz, E., Coyle, M., Liu, X., Chang, Y., Fuller, G. W., Sutton, M. A., Klimont, Z., Unsworth, M. H., and Vieno, M.: A chronology of global air quality, Philos. T. Roy. Soc. A, 378, 20190314, https://doi.org/10.1098/rsta.2019.0314, 2020.
Fu, X., Wang, T., Gao, J., Wang, P., Liu, Y., Wang, S., Zhao, B., and Xue, L.: Persistent Heavy Winter Nitrate Pollution Driven by Increased Photochemical Oxidants in Northern China, Environ. Sci. Technol., 54, 3881–3889, https://doi.org/10.1021/acs.est.9b07248, 2020.
Ge, W., Liu, J., Yi, K., Xu, J., Zhang, Y., Hu, X., Ma, J., Wang, X., Wan, Y., Hu, J., Zhang, Z., Wang, X., and Tao, S.: Influence of atmospheric in-cloud aqueous-phase chemistry on the global simulation of SO2 in CESM2, Atmos. Chem. Phys., 21, 16093–16120, https://doi.org/10.5194/acp-21-16093-2021, 2021.
Ge, Y.: Dataset for global sensitivities of reactive N and S gas and particle concentrations and deposition to precursor emissions reductions, Zenodo [data set], https://doi.org/10.5281/zenodo.7082661, 2022.
Ge, Y., Heal, M. R., Stevenson, D. S., Wind, P., and Vieno, M.: Evaluation of global EMEP MSC-W (rv4.34) WRF (v3.9.1.1) model surface concentrations and wet deposition of reactive N and S with measurements, Geosci. Model Dev., 14, 7021–7046, https://doi.org/10.5194/gmd-14-7021-2021, 2021.
Ge, Y., Vieno, M., Stevenson, D. S., Wind, P., and Heal, M. R.: A new assessment of global and regional budgets, fluxes, and lifetimes of atmospheric reactive N and S gases and aerosols, Atmos. Chem. Phys., 22, 8343–8368, https://doi.org/10.5194/acp-22-8343-2022, 2022.
Gu, B., Zhang, L., Van Dingenen, R., Vieno, M., Van Grinsven, H. J. M., Zhang, X., Zhang, S., Chen, Y., Wang, S., Ren, C., Rao, S., Holland, M., Winiwarter, W., Chen, D., Xu, J., and Sutton, M. A.: Abating ammonia is more cost-effective than nitrogen oxides for mitigating PM2.5 air pollution, Science, 374, 758–762, https://doi.org/10.1126/science.abf8623, 2021.
Hart, J. E., Liao, X., Hong, B., Puett, R. C., Yanosky, J. D., Suh, H., Kioumourtzoglou, M.-A., Spiegelman, D., and Laden, F.: The association of long-term exposure to PM2.5 on all-cause mortality in the Nurses' Health Study and the impact of measurement-error correction, Environ. Health, 14, 38, https://doi.org/10.1186/s12940-015-0027-6, 2015.
Hattori, S., Iizuka, Y., Alexander, B., Ishino, S., Fujita, K., Zhai, S., Sherwen, T., Oshima, N., Uemura, R., Yamada, A., Suzuki, N., Matoba, S., Tsuruta, A., Savarino, J., and Yoshida, N.: Isotopic evidence for acidity-driven enhancement of sulfate formation after SO2 emission control, Sci. Adv., 7, eabd4610, https://doi.org/10.1126/sciadv.abd4610, 2021.
Hauglustaine, D. A., Balkanski, Y., and Schulz, M.: A global model simulation of present and future nitrate aerosols and their direct radiative forcing of climate, Atmos. Chem. Phys., 14, 11031–11063, https://doi.org/10.5194/acp-14-11031-2014, 2014.
Heald, C. L., Collett Jr., J. L., Lee, T., Benedict, K. B., Schwandner, F. M., Li, Y., Clarisse, L., Hurtmans, D. R., Van Damme, M., Clerbaux, C., Coheur, P.-F., Philip, S., Martin, R. V., and Pye, H. O. T.: Atmospheric ammonia and particulate inorganic nitrogen over the United States, Atmos. Chem. Phys., 12, 10295–10312, https://doi.org/10.5194/acp-12-10295-2012, 2012.
Hoesly, R. M., Smith, S. J., Feng, L., Klimont, Z., Janssens-Maenhout, G., Pitkanen, T., Seibert, J. J., Vu, L., Andres, R. J., Bolt, R. M., Bond, T. C., Dawidowski, L., Kholod, N., Kurokawa, J.-I., Li, M., Liu, L., Lu, Z., Moura, M. C. P., O'Rourke, P. R., and Zhang, Q.: Historical (1750–2014) anthropogenic emissions of reactive gases and aerosols from the Community Emissions Data System (CEDS), Geosci. Model Dev., 11, 369–408, https://doi.org/10.5194/gmd-11-369-2018, 2018.
Hoffmann, E. H., Tilgner, A., Schrödner, R., Bräuer, P., Wolke, R., and Herrmann, H.: An advanced modeling study on the impacts and atmospheric implications of multiphase dimethyl sulfide chemistry, P. Natl. Acad. Sci. USA, 113, 11776, https://doi.org/10.1073/pnas.1606320113, 2016.
Hoffmann, M. R.: On the kinetics and mechanism of oxidation of aquated sulfur dioxide by ozone, Atmos. Environ., 20, 1145–1154, https://doi.org/10.1016/0004-6981(86)90147-2, 1986.
Holt, J., Selin, N. E., and Solomon, S.: Changes in Inorganic Fine Particulate Matter Sensitivities to Precursors Due to Large-Scale US Emissions Reductions, Environ. Sci. Technol., 49, 4834–4841, https://doi.org/10.1021/acs.est.5b00008, 2015.
Iturbide, M., Gutiérrez, J. M., Alves, L. M., Bedia, J., Cerezo-Mota, R., Cimadevilla, E., Cofiño, A. S., Di Luca, A., Faria, S. H., Gorodetskaya, I. V., Hauser, M., Herrera, S., Hennessy, K., Hewitt, H. T., Jones, R. G., Krakovska, S., Manzanas, R., Martínez-Castro, D., Narisma, G. T., Nurhati, I. S., Pinto, I., Seneviratne, S. I., van den Hurk, B., and Vera, C. S.: An update of IPCC climate reference regions for subcontinental analysis of climate model data: definition and aggregated datasets, Earth Syst. Sci. Data, 12, 2959–2970, https://doi.org/10.5194/essd-12-2959-2020, 2020.
Jiang, J., Aksoyoglu, S., Ciarelli, G., Baltensperger, U., and Prévôt, A. S. H.: Changes in ozone and PM2.5 in Europe during the period of 1990–2030: Role of reductions in land and ship emissions, Sci. Total Environ., 741, 140467, https://doi.org/10.1016/j.scitotenv.2020.140467, 2020.
Johnson, M. T., Liss, P. S., Bell, T. G., Lesworth, T. J., Baker, A. R., Hind, A. J., Jickells, T. D., Biswas, K. F., Woodward, E. M. S., and Gibb, S. W.: Field observations of the ocean-atmosphere exchange of ammonia: Fundamental importance of temperature as revealed by a comparison of high and low latitudes, Global Biogeochem. Cy., 22, GB1019, https://doi.org/10.1029/2007GB003039, 2008.
Jonson, J. E., Borken-Kleefeld, J., Simpson, D., Nyíri, A., Posch, M., and Heyes, C.: Impact of excess NOx emissions from diesel cars on air quality, public health and eutrophication in Europe, Environ. Res. Lett., 12, 094017, https://doi.org/10.1088/1748-9326/aa8850, 2017.
Jonson, J. E., Fagerli, H., Scheuschner, T., and Tsyro, S.: Modelling changes in secondary inorganic aerosol formation and nitrogen deposition in Europe from 2005 to 2030, Atmos. Chem. Phys., 22, 1311–1331, https://doi.org/10.5194/acp-22-1311-2022, 2022.
Jovan, S., Riddell, J., Padgett, P. E., and Nash Iii, T. H.: Eutrophic lichens respond to multiple forms of N: implications for critical levels and critical loads research, Ecol. Appl., 22, 1910–1922, https://doi.org/10.1890/11-2075.1, 2012.
Karimi, A., Shirmardi, M., Hadei, M., Birgani, Y. T., Neisi, A., Takdastan, A., and Goudarzi, G.: Concentrations and health effects of short- and long-term exposure to PM2.5, NO2, and O3 in ambient air of Ahvaz city, Iran (2014–2017), Ecotox. Environ. Safe., 180, 542–548, https://doi.org/10.1016/j.ecoenv.2019.05.026, 2019.
Karl, M., Jonson, J. E., Uppstu, A., Aulinger, A., Prank, M., Sofiev, M., Jalkanen, J.-P., Johansson, L., Quante, M., and Matthias, V.: Effects of ship emissions on air quality in the Baltic Sea region simulated with three different chemistry transport models, Atmos. Chem. Phys., 19, 7019–7053, https://doi.org/10.5194/acp-19-7019-2019, 2019.
Kelly, J. T., Jang, C., Zhu, Y., Long, S., Xing, J., Wang, S., Murphy, B. N., and Pye, H. O. T.: Predicting the Nonlinear Response of PM2.5 and Ozone to Precursor Emission Changes with a Response Surface Model, Atmosphere, 12, 1044, https://doi.org/10.3390/atmos12081044, 2021.
Kharol, S. K., Shephard, M. W., McLinden, C. A., Zhang, L., Sioris, C. E., O'Brien, J. M., Vet, R., Cady-Pereira, K. E., Hare, E., Siemons, J., and Krotkov, N. A.: Dry Deposition of Reactive Nitrogen From Satellite Observations of Ammonia and Nitrogen Dioxide Over North America, Geophys. Res. Lett., 45, 1157–1166, https://doi.org/10.1002/2017GL075832, 2018.
Kurokawa, J. and Ohara, T.: Long-term historical trends in air pollutant emissions in Asia: Regional Emission inventory in ASia (REAS) version 3, Atmos. Chem. Phys., 20, 12761–12793, https://doi.org/10.5194/acp-20-12761-2020, 2020.
Le, T., Wang, Y., Liu, L., Yang, J., Yung, Y. L., Li, G., and Seinfeld, J. H.: Unexpected air pollution with marked emission reductions during the COVID-19 outbreak in China, Science, 369, 702–706, https://doi.org/10.1126/science.abb7431, 2020.
Leung, D. M., Shi, H., Zhao, B., Wang, J., Ding, E. M., Gu, Y., Zheng, H., Chen, G., Liou, K.-N., Wang, S., Fast, J. D., Zheng, G., Jiang, J., Li, X., and Jiang, J. H.: Wintertime Particulate Matter Decrease Buffered by Unfavorable Chemical Processes Despite Emissions Reductions in China, Geophys. Res. Lett., 47, e2020GL087721, https://doi.org/10.1029/2020GL087721, 2020.
Li, L., Chen, Z. M., Zhang, Y. H., Zhu, T., Li, J. L., and Ding, J.: Kinetics and mechanism of heterogeneous oxidation of sulfur dioxide by ozone on surface of calcium carbonate, Atmos. Chem. Phys., 6, 2453–2464, https://doi.org/10.5194/acp-6-2453-2006, 2006.
Liang, J. and Jacobson, M. Z.: A study of sulfur dioxide oxidation pathways over a range of liquid water contents, pH values, and temperatures, J. Geophys. Res.-Atmos., 104, 13749–13769, https://doi.org/10.1029/1999JD900097, 1999.
Liao, K.-J., Tagaris, E., Napelenok, S. L., Manomaiphiboon, K., Woo, J.-H., Amar, P., He, S., and Russell, A. G.: Current and Future Linked Responses of Ozone and PM2.5 to Emission Controls, Environ. Sci. Technol., 42, 4670–4675, https://doi.org/10.1021/es7028685, 2008.
Liu, F., Zhang, Q., van der A, R. J., Zheng, B., Tong, D., Yan, L., Zheng, Y., and He, K.: Recent reduction in NOx emissions over China: synthesis of satellite observations and emission inventories, Environ. Res. Lett., 11, 114002, https://doi.org/10.1088/1748-9326/11/11/114002, 2016.
Liu, M., Huang, X., Song, Y., Xu, T., Wang, S., Wu, Z., Hu, M., Zhang, L., Zhang, Q., Pan, Y., Liu, X., and Zhu, T.: Rapid SO2 emission reductions significantly increase tropospheric ammonia concentrations over the North China Plain, Atmos. Chem. Phys., 18, 17933–17943, https://doi.org/10.5194/acp-18-17933-2018, 2018.
Lu, Z., Streets, D. G., Zhang, Q., Wang, S., Carmichael, G. R., Cheng, Y. F., Wei, C., Chin, M., Diehl, T., and Tan, Q.: Sulfur dioxide emissions in China and sulfur trends in East Asia since 2000, Atmos. Chem. Phys., 10, 6311–6331, https://doi.org/10.5194/acp-10-6311-2010, 2010.
Ma, Z., Hu, X., Huang, L., Bi, J., and Liu, Y.: Estimating Ground-Level PM2.5 in China Using Satellite Remote Sensing, Environ. Sci. Technol., 48, 7436–7444, https://doi.org/10.1021/es5009399, 2014.
Maahs, H. G.: Kinetics and mechanism of the oxidation of S(IV) by ozone in aqueous solution with particular reference to SO2 conversion in nonurban tropospheric clouds, J. Geophys. Res.-Oceans, 88, 10721–10732, https://doi.org/10.1029/JC088iC15p10721, 1983.
Massad, R.-S., Nemitz, E., and Sutton, M. A.: Review and parameterisation of bi-directional ammonia exchange between vegetation and the atmosphere, Atmos. Chem. Phys., 10, 10359–10386, https://doi.org/10.5194/acp-10-10359-2010, 2010.
McArdle, J. V. and Hoffmann, M. R.: Kinetics and mechanism of the oxidation of aquated sulfur dioxide by hydrogen peroxide at low pH, J. Phys. Chem., 87, 5425–5429, https://doi.org/10.1021/j150644a024, 1983.
McDuffie, E. E., Fibiger, D. L., Dubé, W. P., Lopez-Hilfiker, F., Lee, B. H., Thornton, J. A., Shah, V., Jaeglé, L., Guo, H., Weber, R. J., Michael Reeves, J., Weinheimer, A. J., Schroder, J. C., Campuzano-Jost, P., Jimenez, J. L., Dibb, J. E., Veres, P., Ebben, C., Sparks, T. L., Wooldridge, P. J., Cohen, R. C., Hornbrook, R. S., Apel, E. C., Campos, T., Hall, S. R., Ullmann, K., and Brown, S. S.: Heterogeneous N2O5 Uptake During Winter: Aircraft Measurements During the 2015 WINTER Campaign and Critical Evaluation of Current Parameterizations, J. Geophys. Res.-Atmos., 123, 4345–4372, https://doi.org/10.1002/2018JD028336, 2018.
McFiggans, G., Mentel, T. F., Wildt, J., Pullinen, I., Kang, S., Kleist, E., Schmitt, S., Springer, M., Tillmann, R., Wu, C., Zhao, D., Hallquist, M., Faxon, C., Le Breton, M., Hallquist, Å. M., Simpson, D., Bergström, R., Jenkin, M. E., Ehn, M., Thornton, J. A., Alfarra, M. R., Bannan, T. J., Percival, C. J., Priestley, M., Topping, D., and Kiendler-Scharr, A.: Secondary organic aerosol reduced by mixture of atmospheric vapours, Nature, 565, 587–593, https://doi.org/10.1038/s41586-018-0871-y, 2019.
McHale, M. R., Ludtke, A. S., Wetherbee, G. A., Burns, D. A., Nilles, M. A., and Finkelstein, J. S.: Trends in precipitation chemistry across the U.S. 1985–2017: Quantifying the benefits from 30 years of Clean Air Act amendment regulation, Atmos. Environ., 247, 118219, https://doi.org/10.1016/j.atmosenv.2021.118219, 2021.
Megaritis, A. G., Fountoukis, C., Charalampidis, P. E., Pilinis, C., and Pandis, S. N.: Response of fine particulate matter concentrations to changes of emissions and temperature in Europe, Atmos. Chem. Phys., 13, 3423–3443, https://doi.org/10.5194/acp-13-3423-2013, 2013.
Meng, F., Zhang, Y., Kang, J., Heal, M. R., Reis, S., Wang, M., Liu, L., Wang, K., Yu, S., Li, P., Wei, J., Hou, Y., Zhang, Y., Liu, X., Cui, Z., Xu, W., and Zhang, F.: Trends in secondary inorganic aerosol pollution in China and its responses to emission controls of precursors in wintertime, Atmos. Chem. Phys., 22, 6291–6308, https://doi.org/10.5194/acp-22-6291-2022, 2022.
Metzger, S., Steil, B., Abdelkader, M., Klingmüller, K., Xu, L., Penner, J. E., Fountoukis, C., Nenes, A., and Lelieveld, J.: Aerosol water parameterisation: a single parameter framework, Atmos. Chem. Phys., 16, 7213–7237, https://doi.org/10.5194/acp-16-7213-2016, 2016.
Metzger, S., Abdelkader, M., Steil, B., and Klingmüller, K.: Aerosol water parameterization: long-term evaluation and importance for climate studies, Atmos. Chem. Phys., 18, 16747–16774, https://doi.org/10.5194/acp-18-16747-2018, 2018.
NEC: National Emission Ceilings (NEC) Directive reporting status, Briefing no. 2/2019, PDF TH-AM-19-003-EN-N, https://www.eea.europa.eu/themes/air/air-pollution-sources-1/national-emission-ceilings/nec-directive-reporting-status-2019 (last access: 7 August 2022), 2019.
Nemitz, E., Sutton, M. A., Wyers, G. P., and Jongejan, P. A. C.: Gas-particle interactions above a Dutch heathland: I. Surface exchange fluxes of NH3, SO2, HNO3 and HCl, Atmos. Chem. Phys., 4, 989–1005, https://doi.org/10.5194/acp-4-989-2004, 2004.
Nenes, A., Pandis, S. N., Weber, R. J., and Russell, A.: Aerosol pH and liquid water content determine when particulate matter is sensitive to ammonia and nitrate availability, Atmos. Chem. Phys., 20, 3249–3258, https://doi.org/10.5194/acp-20-3249-2020, 2020.
Novak, G. A., Kilgour, D. B., Jernigan, C. M., Vermeuel, M. P., and Bertram, T. H.: Oceanic emissions of dimethyl sulfide and methanethiol and their contribution to sulfur dioxide production in the marine atmosphere, Atmos. Chem. Phys., 22, 6309–6325, https://doi.org/10.5194/acp-22-6309-2022, 2022.
Penkett, S. A., Jones, B. M. R., Brich, K. A., and Eggleton, A. E. J.: The importance of atmospheric ozone and hydrogen peroxide in oxidising sulphur dioxide in cloud and rainwater, Atmos. Environ., 13, 123–137, https://doi.org/10.1016/0004-6981(79)90251-8, 1979.
Pescott, O. L., Simkin, J. M., August, T. A., Randle, Z., Dore, A. J., and Botham, M. S.: Air pollution and its effects on lichens, bryophytes, and lichen-feeding Lepidoptera: review and evidence from biological records, Biol. J. Linn. Soc., 115, 611–635, https://doi.org/10.1111/bij.12541, 2015.
Pommier, M., Fagerli, H., Gauss, M., Simpson, D., Sharma, S., Sinha, V., Ghude, S. D., Landgren, O., Nyiri, A., and Wind, P.: Impact of regional climate change and future emission scenarios on surface O3 and PM2.5 over India, Atmos. Chem. Phys., 18, 103–127, https://doi.org/10.5194/acp-18-103-2018, 2018.
Pommier, M., Fagerli, H., Schulz, M., Valdebenito, A., Kranenburg, R., and Schaap, M.: Prediction of source contributions to urban background PM10 concentrations in European cities: a case study for an episode in December 2016 using EMEP/MSC-W rv4.15 and LOTOS-EUROS v2.0 – Part 1: The country contributions, Geosci. Model Dev., 13, 1787–1807, https://doi.org/10.5194/gmd-13-1787-2020, 2020.
Pozzer, A., Tsimpidi, A. P., Karydis, V. A., de Meij, A., and Lelieveld, J.: Impact of agricultural emission reductions on fine-particulate matter and public health, Atmos. Chem. Phys., 17, 12813–12826, https://doi.org/10.5194/acp-17-12813-2017, 2017.
Quinn, P. K. and Bates, T. S.: The case against climate regulation via oceanic phytoplankton sulphur emissions, Nature, 480, 51–56, https://doi.org/10.1038/nature10580, 2011.
Riemer, N., Vogel, H., Vogel, B., Schell, B., Ackermann, I., Kessler, C., and Hass, H.: Impact of the heterogeneous hydrolysis of N2O5 on chemistry and nitrate aerosol formation in the lower troposphere under photosmog conditions, J. Geophys. Res.-Atmos., 108, 4144, https://doi.org/10.1029/2002JD002436, 2003.
Riddick, S. N., Dragosits, U., Blackall, T. D., Tomlinson, S. J., Daunt, F., Wanless, S., Hallsworth, S., Braban, C. F., Tang, Y. S., and Sutton, M. A.: Global assessment of the effect of climate change on ammonia emissions from seabirds, Atmos. Enviro., 184, 212–223, https://doi.org/10.1016/j.atmosenv.2018.04.038, 2018.
Sadavarte, P. and Venkataraman, C.: Trends in multi-pollutant emissions from a technology-linked inventory for India: I. Industry and transport sectors, Atmos. Enviro., 99, 353–364, https://doi.org/10.1016/j.atmosenv.2014.09.081, 2014.
Saylor, R., Myles, L., Sibble, D., Caldwell, J., and Xing, J.: Recent trends in gas-phase ammonia and PM2.5 ammonium in the Southeast United States, J. Air Waste Manage., 65, 347–357, https://doi.org/10.1080/10962247.2014.992554, 2015.
Seinfeld, J. H. and Pandis, S. N.: Atmospheric chemistry and physics: from air pollution to climate change, John Wiley & Sons, ISBN 978-1-118-94740-1, 2016.
Sheng, F., Jingjing, L., Yu, C., Fu-Ming, T., Xuemei, D., and Jing-yao, L.: Theoretical study of the oxidation reactions of sulfurous acid/sulfite with ozone to produce sulfuric acid/sulfate with atmospheric implications, RSC Adv., 8, 7988–7996, https://doi.org/10.1039/C8RA00411K, 2018.
Sheppard, L. J., Leith, I. D., Mizunuma, T., Neil Cape, J., Crossley, A., Leeson, S., Sutton, M. A., van Dijk, N., and Fowler, D.: Dry deposition of ammonia gas drives species change faster than wet deposition of ammonium ions: evidence from a long-term field manipulation, Glob. Change Biol., 17, 3589–3607, https://doi.org/10.1111/j.1365-2486.2011.02478.x, 2011.
Simpson, D., Benedictow, A., Berge, H., Bergström, R., Emberson, L. D., Fagerli, H., Flechard, C. R., Hayman, G. D., Gauss, M., Jonson, J. E., Jenkin, M. E., Nyíri, A., Richter, C., Semeena, V. S., Tsyro, S., Tuovinen, J.-P., Valdebenito, Á., and Wind, P.: The EMEP MSC-W chemical transport model – technical description, Atmos. Chem. Phys., 12, 7825–7865, https://doi.org/10.5194/acp-12-7825-2012, 2012.
Simpson, D., Schulz, M., Semeena, V. S., Tsyro, S., Valdebenito, A., Wind, P., and Steensen, B. M.: EMEP model development and performance changes, in: EMEP Status Report 1/2013, Norwegian Meteorological Institute, Oslo, Norway, 45–57, https://emep.int/publ/reports/2013/EMEP_status_report_1_2013.pdf (last access: 31 May 2023), 2013.
Simpson, D., Tsyro, S., and Wind, P.: Updates to the EMEP/MSC-W model, in: EMEP Status Report 1/2015, Norwegian Meteorological Institute, Oslo, Norway, 129–136, https://emep.int/publ/reports/2015/EMEP_Status_Report_1_2015.pdf (last access: 31 May 2023), 2015.
Simpson, D., Nyiìri, A. G., Tsyro, S., Valdebenito, Á., and Wind, P.: Updates to the EMEP/MSC-W model, 2015–2016, in: EMEP Status Report 1/2016, Norwegian Meteorological Institute, Oslo, Norway, 131–138, https://emep.int/publ/reports/2016/EMEP_Status_Report_1_2016.pdf (last access: 31 May 2023), 2016.
Simpson, D., Bergström, R., Imhof, H., and Wind, P.: Updates to the EMEP/MSC-W model 2016–2017, in: EMEP Status Report 1/2017, Norwegian Meteorological Institute, Oslo, Norway, 115–122, https://emep.int/publ/reports/2017/EMEP_Status_Report_1_2017.pdf (last access: 31 May 2023), 2017.
Simpson, D., Wind, P., Bergström, R., Gauss, M., Tsyro, S., and Valdebenito, Á.: Updates to the EMEP MSC-W model 2017–2018, in: EMEP Status Report 1/2018, Norwegian Meteorological Institute, Oslo, Norway, 107–115, https://emep.int/publ/reports/2018/EMEP_Status_Report_1_2018.pdf (last access: 31 May 2023), 2018.
Simpson, D., Bergström, R., Tsyro, S., and Wind, P.: Updates to the EMEP/MSC-W model 2018–2019, in: EMEP Status Report 1/2019, Norwegian Meteorological Institute, Oslo, Norway, 143–152, https://emep.int/publ/reports/2019/EMEP_Status_Report_1_2019.pdf (last access: 31 May 2023), 2019.
Simpson, D., Bergström, R., Tsyro, S., and Wind, P.: Updates to the EMEP MSC-W model 2019–2020, in: EMEP Status Report 1/2020, Norwegian Meteorological Institute, Oslo, Norway, 153–163, https://emep.int/publ/reports/2020/EMEP_Status_Report_1_2020.pdf (last access: 31 May 2023), 2020a.
Simpson, D., Bergström, R., Briolat, A., Imhof, H., Johansson, J., Priestley, M., and Valdebenito, A.: GenChem v1.0 – a chemical pre-processing and testing system for atmospheric modelling, Geosci. Model Dev., 13, 6447–6465, https://doi.org/10.5194/gmd-13-6447-2020, 2020b.
Skamarock, W. C., Klemp, J. B., Dudhia, J., Gill, D. O., Barker, D., Duda, M. G., Huang, X. Y., Wang, W., and Powers, J. G.: A Description of the Advanced Research WRF Version 3 (No. NCAR/TN-475+STR), University Corporation for Atmospheric Research, https://doi.org/10.5065/D68S4MVH, 2008.
Smith, R. I., Fowler, D., Sutton, M. A., Flechard, C., and Coyle, M.: Regional estimation of pollutant gas dry deposition in the UK: model description, sensitivity analyses and outputs, Atmos. Environ., 34, 3757–3777, https://doi.org/10.1016/S1352-2310(99)00517-8, 2000.
Stieb, D. M., Evans, G. J., To, T. M., Brook, J. R., and Burnett, R. T.: An ecological analysis of long-term exposure to PM2.5 and incidence of COVID-19 in Canadian health regions, Environ. Res., 191, 110052, https://doi.org/10.1016/j.envres.2020.110052, 2020.
Sun, J., Fu, J. S., Lynch, J. A., Huang, K., and Gao, Y.: Climate-driven exceedance of total (wet + dry) nitrogen (N) + sulfur (S) deposition to forest soil over the conterminous U.S, Earth's Future, 5, 560–576, https://doi.org/10.1002/2017EF000588, 2017.
Sutton, M. A., Reis, S., Baker, S. M. H., Wolseley, P. A., Leith, I. D., van Dijk, N., Tang, Y. S., James, P. W., Theobald, M. R., and Whitfield, C.: Estimation of the Ammonia Critical Level for Epiphytic Lichens Based on Observations at Farm, Landscape and National Scales, Atmospheric Ammonia, 6, 71–86, https://doi.org/10.1007/978-1-4020-9121-6_6, 2009.
Sutton, M. A., Asman, W. A. H., and Schøring, J. K.: Dry deposition of reduced nitrogen, Tellus B, 46, 255–273, https://doi.org/10.3402/tellusb.v46i4.15796, 1994.
Sutton, M. A., Reis, S., Riddick, S. N., Dragosits, U., Nemitz, E., Theobald, M. R., Tang, Y. S., Braban, C. F., Vieno, M., Dore, A. J., Mitchell, R. F., Wanless, S., Daunt, F., Fowler, D., Blackall, T. D., Milford, C., Flechard, C. R., Loubet, B., Massad, R., Cellier, P., Personne, E., Coheur, P. F., Clarisse, L., Van Damme, M., Ngadi, Y., Clerbaux, C., Skjøth, C. A., Geels, C., Hertel, O., Wichink Kruit, R. J., Pinder, R. W., Bash, J. O., Walker, J. T., Simpson, D., Horváth, L., Misselbrook, T. H., Bleeker, A., Dentener, F., and de Vries, W.: Towards a climate-dependent paradigm of ammonia emission and deposition, Philos. T. Roy. Soc. B, 368, 20130166, https://doi.org/10.1098/rstb.2013.0166, 2013.
Sutton, M. A., Mason, K. E., Sheppard, L. J., Sverdrup, H., Haeuber, R., and Hicks, W. K.: Nitrogen Deposition, Critical Loads and Biodiversity, Springer, Dordrecht, 535 pp., ISBN 978-94-007-7939-6, 2014.
Sutton, M. A., van Dijk, N., Levy, P. E., Jones, M. R., Leith, I. D., Sheppard, L. J., Leeson, S., Sim Tang, Y., Stephens, A., Braban, C. F., Dragosits, U., Howard, C. M., Vieno, M., Fowler, D., Corbett, P., Naikoo, M. I., Munzi, S., Ellis, C. J., Chatterjee, S., Steadman, C. E., Móring, A., and Wolseley, P. A.: Alkaline air: changing perspectives on nitrogen and air pollution in an ammonia-rich world, Philos. T. Roy. Soc. A, 378, 20190315, https://doi.org/10.1098/rsta.2019.0315, 2020.
Szopa, S., Naik, V., Adhikary, B., Artaxo, P., Berntsen, T., Collins, W. D., Fuzzi, S., Gallardo, L., Kiendler-Scharr, A., Klimont, Z., Liao, H., Unger, N., and Zanis, P.: Short-Lived Climate Forcers, in: Climate Change 2021: The Physical Science Basis, Contribution of Working Group I to the Sixth Assessment Report of the Intergovernmental Panel on Climate Change, Cambridge University Press, Cambridge, United Kingdom and New York, NY, USA, 817–922, https://doi.org/10.1017/9781009157896.008, 2021.
Theobald, M. R., Vivanco, M. G., Aas, W., Andersson, C., Ciarelli, G., Couvidat, F., Cuvelier, K., Manders, A., Mircea, M., Pay, M.-T., Tsyro, S., Adani, M., Bergström, R., Bessagnet, B., Briganti, G., Cappelletti, A., D'Isidoro, M., Fagerli, H., Mar, K., Otero, N., Raffort, V., Roustan, Y., Schaap, M., Wind, P., and Colette, A.: An evaluation of European nitrogen and sulfur wet deposition and their trends estimated by six chemistry transport models for the period 1990–2010, Atmos. Chem. Phys., 19, 379–405, https://doi.org/10.5194/acp-19-379-2019, 2019.
Thunis, P., Clappier, A., Pisoni, E., and Degraeuwe, B.: Quantification of non-linearities as a function of time averaging in regional air quality modeling applications, Atmos. Environ., 103, 263–275, https://doi.org/10.1016/j.atmosenv.2014.12.057, 2015.
Thunis, P., Clappier, A., Beekmann, M., Putaud, J. P., Cuvelier, C., Madrazo, J., and de Meij, A.: Non-linear response of PM2.5 to changes in NOx and NH3 emissions in the Po basin (Italy): consequences for air quality plans, Atmos. Chem. Phys., 21, 9309–9327, https://doi.org/10.5194/acp-21-9309-2021, 2021.
Tørseth, K., Aas, W., Breivik, K., Fjæraa, A. M., Fiebig, M., Hjellbrekke, A. G., Lund Myhre, C., Solberg, S., and Yttri, K. E.: Introduction to the European Monitoring and Evaluation Programme (EMEP) and observed atmospheric composition change during 1972–2009, Atmos. Chem. Phys., 12, 5447–5481, https://doi.org/10.5194/acp-12-5447-2012, 2012.
Tsimpidi, A. P., Karydis, V. A., and Pandis, S. N.: Response of Inorganic Fine Particulate Matter to Emission Changes of Sulfur Dioxide and Ammonia: The Eastern United States as a Case Study, J. Air Waste Manage., 57, 1489–1498, https://doi.org/10.3155/1047-3289.57.12.1489, 2007.
Tsimpidi, A. P., Karydis, V. A., and Pandis, S. N.: Response of Fine Particulate Matter to Emission Changes of Oxides of Nitrogen and Anthropogenic Volatile Organic Compounds in the Eastern United States, J. Air Waste Manage., 58, 1463–1473, https://doi.org/10.3155/1047-3289.58.11.1463, 2008.
Tsyro, S., Karl, M., Simpson, D., Valdebenito, A. L., and Wind, P.: Updates to the EMEP/MSC-W model, in EMEP Status Report 1/2014, Norwegian Meteorological Institute, Oslo, Norway, 143–146, https://emep.int/publ/reports/2014/EMEP_Status_Report_1_2014.pdf (last access: 31 May 2023), 2014.
USEPA: Report on the Environment: Particulate Matter Concentrations, United States Environmental Protection Agency, https://cfpub.epa.gov/roe/indicator.cfm?i=9 (last access: 7 August 2022), 2017.
van Herk, C. M.: Bark pH and susceptibility to toxic air pollutants as independent causes of changes in epiphytic lichen composition in space and time, Lichenologist, 33, 419–442, https://doi.org/10.1006/lich.2001.0337, 2001.
Van Herk, C. M., Mathijssen-Spiekman, E. A. M., and de Zwart, D.: Long distance nitrogen air pollution effects on lichens in Europe, Lichenologist, 35, 347–359, https://doi.org/10.1016/S0024-2829(03)00036-7, 2003.
Vasilakos, P., Russell, A., Weber, R., and Nenes, A.: Understanding nitrate formation in a world with less sulfate, Atmos. Chem. Phys., 18, 12765–12775, https://doi.org/10.5194/acp-18-12765-2018, 2018.
Vieno, M., Dore, A. J., Stevenson, D. S., Doherty, R., Heal, M. R., Reis, S., Hallsworth, S., Tarrason, L., Wind, P., Fowler, D., Simpson, D., and Sutton, M. A.: Modelling surface ozone during the 2003 heat-wave in the UK, Atmos. Chem. Phys., 10, 7963–7978, https://doi.org/10.5194/acp-10-7963-2010, 2010.
Vieno, M., Heal, M. R., Hallsworth, S., Famulari, D., Doherty, R. M., Dore, A. J., Tang, Y. S., Braban, C. F., Leaver, D., Sutton, M. A., and Reis, S.: The role of long-range transport and domestic emissions in determining atmospheric secondary inorganic particle concentrations across the UK, Atmos. Chem. Phys., 14, 8435–8447, https://doi.org/10.5194/acp-14-8435-2014, 2014.
Vieno, M., Heal, M. R., Williams, M. L., Carnell, E. J., Nemitz, E., Stedman, J. R., and Reis, S.: The sensitivities of emissions reductions for the mitigation of UK PM2.5, Atmos. Chem. Phys., 16, 265–276, https://doi.org/10.5194/acp-16-265-2016, 2016.
Wagner, N. L., Riedel, T. P., Young, C. J., Bahreini, R., Brock, C. A., Dubé, W. P., Kim, S., Middlebrook, A. M., Öztürk, F., Roberts, J. M., Russo, R., Sive, B., Swarthout, R., Thornton, J. A., VandenBoer, T. C., Zhou, Y., and Brown, S. S.: N2O5 uptake coefficients and nocturnal NO2 removal rates determined from ambient wintertime measurements, J. Geophys. Res.-Atmos., 118, 9331–9350, https://doi.org/10.1002/jgrd.50653, 2013.
Wang, S., Xing, J., Jang, C., Zhu, Y., Fu, J. S., and Hao, J.: Impact Assessment of Ammonia Emissions on Inorganic Aerosols in East China Using Response Surface Modeling Technique, Environ. Sci. Technol., 45, 9293–9300, https://doi.org/10.1021/es2022347, 2011.
Wang, Y., Zhang, Q. Q., He, K., Zhang, Q., and Chai, L.: Sulfate-nitrate-ammonium aerosols over China: response to 2000–2015 emission changes of sulfur dioxide, nitrogen oxides, and ammonia, Atmos. Chem. Phys., 13, 2635–2652, https://doi.org/10.5194/acp-13-2635-2013, 2013.
Warner, J. X., Dickerson, R. R., Wei, Z., Strow, L. L., Wang, Y., and Liang, Q.: Increased atmospheric ammonia over the world's major agricultural areas detected from space, Geophys. Res. Lett., 44, 2875–2884, https://doi.org/10.1002/2016GL072305, 2017.
Weber, R. J., Guo, H., Russell, A. G., and Nenes, A.: High aerosol acidity despite declining atmospheric sulfate concentrations over the past 15 years, Nat. Geosci., 9, 282–285, https://doi.org/10.1038/ngeo2665, 2016.
Werner, M., Kryza, M., and Wind, P.: High resolution application of the EMEP MSC-W model over Eastern Europe – Analysis of the EMEP4PL results, Atmos. Res., 212, 6–22, https://doi.org/10.1016/j.atmosres.2018.04.025, 2018.
WHO: World Health Organization global air quality guidelines: particulate matter (PM2.5 and PM10), ozone, nitrogen dioxide, sulfur dioxide and carbon monoxide, World Health Organization, Geneva, 74–78, ISBN 9789240034228, 2021.
Xu, L. and Penner, J. E.: Global simulations of nitrate and ammonium aerosols and their radiative effects, Atmos. Chem. Phys., 12, 9479–9504, https://doi.org/10.5194/acp-12-9479-2012, 2012.
Yi, W., Shen, J., Liu, G., Wang, J., Yu, L., Li, Y., Reis, S., and Wu, J.: High NH3 deposition in the environs of a commercial fattening pig farm in central south China, Environ. Res. Lett., 16, 125007, https://doi.org/10.1088/1748-9326/ac3603, 2021.
Yu, F., Nair, A. A., and Luo, G.: Long-Term Trend of Gaseous Ammonia Over the United States: Modeling and Comparison With Observations, J. Geophys. Res.-Atmos., 123, 8315–8325, https://doi.org/10.1029/2018JD028412, 2018.
Zheng, B., Tong, D., Li, M., Liu, F., Hong, C., Geng, G., Li, H., Li, X., Peng, L., Qi, J., Yan, L., Zhang, Y., Zhao, H., Zheng, Y., He, K., and Zhang, Q.: Trends in China's anthropogenic emissions since 2010 as the consequence of clean air actions, Atmos. Chem. Phys., 18, 14095–14111, https://doi.org/10.5194/acp-18-14095-2018, 2018.