the Creative Commons Attribution 4.0 License.
the Creative Commons Attribution 4.0 License.
Influence of the previous North Atlantic Oscillation (NAO) on the spring dust aerosols over North China
Yan Li
Falei Xu
Juan Feng
Mengying Du
Wenjun Song
Chao Li
Wenjing Zhao
The North Atlantic Oscillation (NAO) has been confirmed to be closely related to the weather and climate in many regions of the Northern Hemisphere; however, its effect and mechanism upon the formation of dust events (DEs) in China have rarely been discussed. By using the station observation dataset and multi-reanalysis datasets, it is found that the spring dust aerosols (DAs) in North China (30–40∘ N, 105–120∘ E), a non-dust source region, show high values with a strong interannual variability, and the spring DAs in North China are significantly correlated with the previous winter's NAO. According to the nine spring DEs affected significantly by the negative phase of the preceding winter's NAO in North China during 1980–2020, it is shown that before the outbreak of DEs, due to the transient eddy momentum (heat) convergence (divergence) over the DA source regions, the zonal wind speed increases in the upper-level troposphere, strengthening the zonal wind in the middle–lower levels through momentum downward transmission. Simultaneously, there is transient eddy momentum (heat) divergence (convergence) around the Ural Mountains, which is favorable for the establishment and maintenance of the Ural ridge, as well as the development of the air temperature and vorticity advections. The combined effects of temperature and vorticity advections result in the Siberian Highs and Mongolian cyclone to be established, strengthen, and move southward near the surface, guiding the cold air from high latitudes southward, and is favorable for the uplift and transmission of DAs to North China downstream. Simultaneously, the changes in upstream transient eddy flux transport can cause both energy and mass divergence in North China, resulting in diminishing winds during DEs, which would facilitate the maintenance of dust aerosols here and promote the outbreak of DEs. This study reveals the impact of transient eddy flux transport on the dusty weather anomalies modulated by the NAO negative signal in North China, which deepens the understanding of the formation mechanism of DEs in China.
- Article
(22302 KB) - Full-text XML
- BibTeX
- EndNote
Airborne dust aerosols (DAs), which play a significant role in the evolution of the atmospheric system, have an important influence on human society, ecosystems, and biochemical cycles. In particular, the radiative forcing of DAs is comparable to that of clouds on a regional scale and has a key impact on the local weather and climate (Kaufman et al., 2002; J. P. Huang et al., 2014; Yang et al., 2017). Recently, the influence of DAs on the weather and climate has attracted widespread attention from researchers, and the direct, indirect, and semi-direct feedback responses between them have been confirmed by scientific studies. For direct processes, DAs can impact the weather and climate by scattering (absorbing) radiation to cool (heat) the atmosphere (Sokolik and Toon, 1996; Zhang et al., 2019); via indirect influences, DAs can change the albedo of ice and snow surfaces by altering the characteristics of cloud condensation nuclei and ice nuclei (Ackerman et al., 2000; Sassen et al., 2003); and in the semi-direct effects, DAs can increase cloud droplet evaporation and reduce cloud water pathways by heating the clouds (Huang et al., 2006). The DAs of worldwide annual emissions in the range of 1000–2150 Tg are lifted up by the surface wind (Zender et al., 2004), with only approximately 30 % of these resettling in the dust aerosol (DA) source regions, while the other 70 % is transported to downstream areas thousands of kilometers away, causing changes in the local weather and climate (Duce et al., 1980; Huang et al., 2015).
One of the most serious natural catastrophes in East Asia is dusty weather. Studying the climatological features, variations, and influencing factors of DAs is crucial to both understand and predict DA variation patterns (Feng et al., 2020; Yao et al., 2021). An extensive analysis of meteorological and climatic factors associated with the occurrence of global dust events (DEs) has been conducted using ground-based observations (e.g., Ji and Fan, 2019; Liu et al., 2020), satellite remote sensing (e.g., Chiapello et al., 2005; Han et al., 2022), and numerical simulations (e.g., Ginoux et al., 2004; Chen et al., 2017). It is concluded that the variations in DA concentration and transport are related to many factors, including atmospheric circulation (Huang et al., 2021), surface wind (Liu et al., 2004; Wang et al., 2018), cyclone frequency (Yu et al., 2019), Asian monsoon (Wilcox et al., 2020), and the North Atlantic Oscillation (NAO) (Mao et al., 2011; Feng et al., 2019; J. P. Li et al., 2019). The deserts in northern and western China and Mongolia are the most important areas affecting China (primarily Badain Juran and Taklamakan), and the DAs in the above source areas contribute 70 % of the dust emissions in East Asia (Zhang et al., 2003; Che et al., 2019). Therefore, it is of great significance to explore the characteristics and causes of DAs.
Recently, DEs seem to be frequent in China, seriously endangering human health, hindering socioeconomic development, and causing widespread concern among the scientific community and the public. For example, from 14–16 March 2021, a large-scale DE occurred in northern China (Yin et al., 2021), resulting in more than 3.8×10⁶ km2 being affected, with the maximum hourly average concentration of PM10 surpassing 8000 µm m−3 and a drop in visibility to less than 0.5 km in Beijing (Zhang et al., 2022). In China, strong DEs can transport DAs to Japan, Korea, and even across the Pacific Ocean to the North American coast, reflecting the fact that regional DEs in China can evolve into a hemispheric and even global-scale phenomenon (Kurosaki and Mikami, 2003; Lee and Sohn, 2009). According to previous studies, spring is the most active time for the occurrence of DEs in China, accounting for over 80 % of all DEs yearly (Liu et al., 2004). Therefore, for its practical and scientific value and relevance it is important to investigate the formation mechanism of DEs in China, especially in spring.
In the Northern Hemisphere (NH), the NAO is a seesaw mode of center pressure variation (Walker, 1924) near the Azores and Iceland and is the most important low-frequency dipole pattern during boreal winter. The NAO has crucial effects on temperature (e.g., Hurrell, 1995; Yu et al., 2016), precipitation (e.g., Hartley and Keables, 1998; Giannini et al., 2000), and storm tracks (e.g., Lau and Nath, 1991; Jin et al., 2006) in the North Atlantic and its surrounding areas. However, its signal can also be used as a mediator waveguide through the midlatitude westerly wind belts, capturing the downstream propagating Rossby wave train and thus extending its effect to the weather and climate of the Eurasian continent, as well as the entire NH (e.g., Watanabe, 2004; Lin and Wu, 2011; Zhang et al., 2021). China is located downstream of the NAO-connected circulation system, and its weather (e.g., Wang and Shi, 2001; Liu and Yin, 2001; Zuo et al., 2015) and climate (e.g., Liu et al., 2018; M. Y. Li et al., 2021; Yao et al., 2022) are impacted by variations in different phases and intensities of the NAO.
Meanwhile, it has been shown that the NAO also has a crucial influence on the process of DEs in China. For example, Tang et al. (2005) noted that the frequency of spring DEs in northern China was significantly influenced by fluctuations in the NAO intensity. In addition, Zhao et al. (2012) discovered an obvious negative correlation between the winter NAO intensity and the late spring and summer DEs in northwestern China. The above studies mainly analyzed the association between the NAO and the DEs in China from the perspective of seasonal-scale climate. However, the influence of weather-scale meteorological elements on DEs is also important (Wang et al., 2009; An et al., 2018). As mentioned previously, the large-scale climate variability model of the NAO can capture the Rossby wave train propagating downstream, which in turn has a crucial effect on the weather-scale elements. As one of the two fundamental fluctuations in the atmosphere, transient eddies are widely used in studies to diagnose Rossby wave trains (Trenberth, 1986) and can provide a perspective of mechanism exploration in abnormal variations in atmospheric circulation (Li et al., 2022b). It has been noted that transient eddies have a sustained impact on the development of atmospheric systems such as the Siberian Highs (SHs) and the North Pacific low (Holopainen and Oort, 1981; Holopainen et al., 1982). The forcing impact of transient eddies on the mean airflow can enhance anticyclonic circulation, which in turn may trigger large-scale severe low-temperature occurrences (Y. Li et al., 2019a). In addition, Li et al. (2022b) showed that transient eddy played a significant role in the formation of abnormal atmospheric circulation of DEs by focusing on the spring DEs in south Xinjiang, China, during 1980–2018.
It is essential to continue the deep study of the synoptic mechanism of DE formation through the aspect of the NAO. On the one hand, with the recent huge energy consumption and astounding economic development in East Asia, the eastern part of China has suffered from escalating air pollution problems (Zhang et al., 2012; Zhao et al., 2016). With the occurrence of DEs, DAs are one of the most crucial elements affecting air quality in East Asia (X. Huang et al., 2014; Nie et al., 2015). Previous studies have provided some analysis and initial progress on the relationship between the NAO and the DEs in northern China, mainly DA source areas such as northwestern China (Tang et al., 2005; Zhao et al., 2012). However, such studies are limited to the eastern part of China, which is not a DA source area but is severely affected by DEs. On the other hand, previous studies of the NAO on the DEs in China have mainly been analyzed on the seasonal scale to provide a large-scale climatic background for the occurrence of DEs in China, but it is not clear how the NAO affects the DEs in China at the synoptic scale, and the role of transient eddies in the anomalous circulation of the atmosphere in DEs under the modulation of the NAO is uncertain.
From the above points of view, we investigated three main scientific questions in this paper. (1) Does the NAO affect the area with high values of DAs in eastern China? What are the characteristics of the impact? (2) What are the synoptic causes of the formation of DEs influenced by the NAO? (3) How can we explain the mechanism of the formation of synoptic system anomalies by transient eddies under NAO modulation? To address the above issues, by using the station observation dataset and the multi-reanalysis datasets from 1980–2020, this paper investigated the long-term changes in the spring DAs in China to examine the characteristics of the impact of NAO on the DAs in eastern China and to explore the atmospheric circulation mechanism affecting DEs considering transient eddy flux transport under the influence of the NAO. The remaining work is organized as follows. Section 2 describes the datasets and methods employed in this paper. Section 3.1, 3.2, and 3.3 cover the selection of the DA study area and its link with the NAO, the process of abnormal atmospheric circulation during DEs, and the impacts of the transport features of transient eddy fluxes accompanying synoptic system anomalies, respectively. Section 4 contains the conclusions and discussions.
2.1 Datasets
The China National Meteorological Center (CNMC) provides the daily DE occurrence dataset over mainland China, which contains three types of DEs (dust storm, blowing dust, and floating dust). When DAs are transported with visibility less than 1 km, it is considered a dust storm, whereas floating dust with visibility less than 10 km is caused by DAs from upwind source regions, and blowing dust is defined similarly to floating dust, with the difference that the DAs are emitted from local source areas. Several previous studies have confirmed the validity of the dataset (Kang et al., 2016; Wang et al., 2018).
Datasets of daily and monthly DA concentrations under the Modern-Era Retrospective Analysis for Research and Applications, version 2 (MERRA-2), were derived from the Global Modeling and Assimilation Office (GMAO) of the National Aeronautics and Space Administration (NASA) (Gelaro et al., 2017). Its foundation is built on the assimilation of multiple satellite systems (AVHRR, MISR, MODIS) and AERONET (Aerosol Robotic Network) ground-based observations, and the correctness and reliability are considered to be better than those obtained from the assimilation of individual satellites. The most significant benefit of the MERRA-2 dataset is the spatiotemporal coherence, which cannot be surpassed by station-based or individual satellite datasets and which allows for rigorous statistical analysis of the spatiotemporal patterns (Gelaro et al., 2017). The dust column mass density is used to represent the atmospheric DA concentration from the MERRA-2 product during 1980–2020 (horizontal resolution: 0.625∘ × 0.5∘) in this paper. Yao et al. (2021) used the MERRA-2 dataset to analyze the monthly mean DAs in China and found that the result was consistent with the previous conclusions obtained using different DA datasets (Che et al., 2019; Liu et al., 2020), demonstrating the feasibility and applicability of the MERRA-2 dataset for assessing the DAs in China.
The sea surface temperature (SST) dataset was obtained from the Extended Reconstructed Sea Surface Temperature, version 5 (ERSST-5), from the National Oceanic and Atmospheric Administration (NOAA) over the period 1980–2020 (horizontal resolution: 2.0∘ × 2.0∘) (Huang et al., 2017a). The atmospheric reanalysis dataset, including the wind field, geopotential height field, sea level pressure field, temperature field, and vertical velocity field, obtained from the European Center for Medium-Range Weather Forecasts (ECMWF) is the fifth-generation reanalysis global atmosphere (ERA5) dataset over the period 1980–2020 (horizontal resolution: 0.25∘ × 0.25∘). Compared to its predecessor, ERA-Interim, ERA5 has a modified data assimilation system and improved physical model to achieve reanalysis data information with improved quality (Hersbach et al., 2020). In this paper, unless otherwise specified, the boreal winter season is referred to as December–January–February (DJF), and the spring season is March–April–May (MAM).
2.2 Methods
The NAO index (NAOI) was chosen to indicate the NAO activities. The NAOI describes the large-scale circulation characteristics of the NAO well (Li and Wang, 2003) and is defined by the following equation:
In the above equation, P represents the monthly mean sea level pressure averaged from 80∘ W to 30∘ E, is the standardized value of P, and the subscript indicates the latitude. The selection criteria for the NAO abnormal years are based on the NAOI index averaged over the winter months; the index is then normalized, and the years with a NAOI exceeding 0.5 SD (standard deviations) are recorded as NAO anomalous years.
According to the operational criteria of the CNMC, DE occurrences are defined as when the number of sites with DEs is more than of the total amount in the selected region. According to the variations in DAs and to assure the feasibility of DE sample number, we defined a DE as being when any of three types of DEs occur. Although the DEs last for a short period of time, even only 1 d, the abnormal atmospheric circulation that affects the DEs will exist over a long period before and after the day of the outbreak of a DE (Li et al., 2022). Therefore, to investigate the abnormal atmospheric signals during DEs, the timescale was separated into the following parts: “Day −n”, “Day 0”, and “Day +n”, which indicate the date prior to, the date of, and the lag after the day of the DE outbreak, respectively. To probe obvious signals in DEs, we extended the number of days of the DE cycle to 6 d, i.e., before the DE outbreak to Day −3 and after the DE outbreak to Day +2.
To analyze the features of transient eddy flux transport during DEs based on atmospheric variables, the method of physical decomposition was used in this work (Qian, 2012). Any atmospheric elements F, such as u, v, and T, can be decomposed into two parts according to the above decomposition principle: the temporal mean part and the transient eddy part F′. represents the state in which the radiation from the subsurface at a fixed point in the atmosphere is in equilibrium with the daily and annual cycles of solar radiation, while F′ is a deviation from the balanced state as follows:
In this paper, the transient eddy flux transport is denoted by [] and [], representing the momentum and heat of transient eddy transport, respectively. Within the range of longitude that we choose, the zonal means are represented in the variables by square brackets (i.e.,[ ]).
3.1 Selection of the dust aerosol study area and association with the NAO
The concentration of spring DAs and their standard deviation distributions in China are shown in Fig. 1. The large concentration values of DAs are mostly situated in source regions such as Xinjiang and Inner Mongolia. In addition, the DA concentrations in the non-dust source areas, north of the Yangtze River (30–40∘ N, 105–120∘ E), also show high values (Fig. 1a). Moreover, the standard deviation of DAs in this region is also characterized as a large value, indicating that DAs have strong annual variability and are easily influenced by dust disasters (Fig. 1b). Therefore, the area spanning 30–40∘ N, 105–120∘ E is selected as the study region to explore the variability in DAs and the possible formation causes of DEs, which in the analysis that follows is referred to as North China.
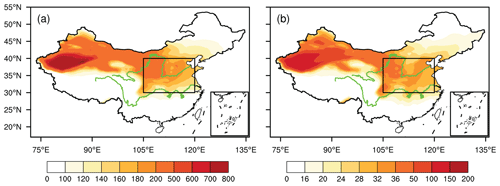
Figure 1(a) Spatial distribution of the climatological spring dust column mass density and (b) dust column mass density standard deviation (unit: mg m−2). The black box indicates North China.
To explore the possible links affecting the spring DAs in North China, the correlation coefficients between the regional average DAs and the geopotential height field are illustrated in the previous and contemporaneous periods (Fig. 2). The pattern of the MAM DAs and the DJF, JFM (January–March), FMA (February–April), and MAM geopotential height fields all show significant north–south reversal in the North Atlantic, i.e., negative in the Azores and positive in Iceland, which indicates typical characteristics of the NAO negative phase. This dipole structure can be observed in the lower, middle, and upper troposphere, denoting that there is an important connection between the spring DAs in North China and the previous NAO variations. Furthermore, significant correlation coefficients can be found between the spring DAs in North China and the NAOI in previous DJF, JFM, and FMA events, and the correlation coefficients are −0.39, −0.40, −0.40, and −0.28, respectively. Simultaneously, as illustrated in Fig. 3, March, April, and May, corresponding to the spring months, show substantial standard deviations, suggesting that the DAs in North China vary dramatically in these 3 months, while the monthly average standard deviations of the NAOI present the highest values in December, January, and February, corresponding to the winter. Therefore, the effect of the NAO in boreal winter on the later spring DAs in North China and the synoptic formation mechanism of the impact should be analyzed and explored. Considering the significant negative effect of the NAO on the DAs in North China, the main focus in the subsequent analysis is on the negative phase of the NAO.
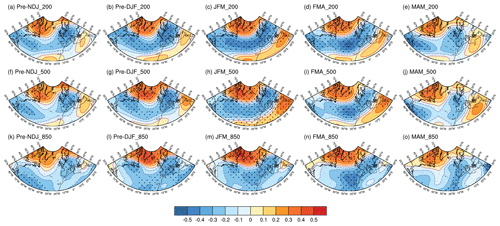
Figure 2(a–e) Correlations of the spring dust column mass density in North China with geopotential height anomalies at 200 hPa during the previous and simultaneous seasons. Panels (f)–(j) and (k)–(o) are like (a)–(e) but for the correlations with geopotential height anomalies at 500 and 850 hPa, respectively. Dotted blue, solid magenta, and solid red lines indicate negative, zero, and positive contour values, respectively. The contour intervals are 0.1. The dotted black areas are significant at the 90 % confidence level.

Figure 3The monthly standard deviation of (a) the dust column mass density in North China and (b) the NAOI. The unit in (a) is milligrams per square meter (mg m−2).
According to the analysis, the NAOI in boreal winter and late spring DAs in North China have a substantial negative link. How does the boreal winter NAO affect the late spring DAs in North China? There is an obvious correlation between the boreal winter NAOI and both contemporaneous and late North Atlantic SST anomalies (SSTAs), as well as a triple-pole model of “−, +, −” (Fig. 4a to b). Previous studies have noted that on seasonal and annual scales, the triple pole of SST is the primary mode of North Atlantic SST variation, and its variability is closely correlated with the changes in the NAO (Wu et al., 2009). The NAO can modify SST by influencing changes in sea surface wind speed and hence latent heat fluxes in the North Atlantic (Cayan et al., 1992). Simultaneously, the triple-pole SST mode generates atmospheric circulation similar to the NAO, suggesting a positive feedback between them, which has been verified in both observational data analysis (Czaja and Frankignoul, 2002) and ocean–atmosphere coupled model simulations (Watanabe and Kimoto, 2000). These findings show that the SST has a “capacitor effect” on the NAO negative signal, which prolongs the influence of the NAO signal over the surrounding and downstream areas. Moreover, through the correlation distribution between the boreal winter NAOI and both contemporaneous and late North Atlantic SSTAs corresponding to the selected NAO negative-phase years (1979, 1981, 1984, 1985, 1986, 1995, 1997, 2000, 2002, 2003, 2005, 2009, 2010, and 2012), it can be found that the North Atlantic SSTA from boreal winter to late spring is manifested as a “−, +, −” triple-pole pattern (Fig. 4c to d), which further verifies that the early NAO negative signal can be stored in the North Atlantic SST and has an influence on the subsequent weather and climate over the surrounding and downstream regions.
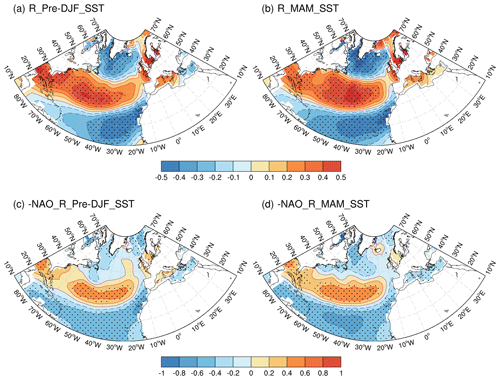
Figure 4Correlations of the boreal winter NAOI with the (a) simultaneous and (b) following spring SSTA. Panels (c)–(d) are like (a)–(b) but during the negative NAO phases (1979, 1981, 1984, 1985, 1986, 1995, 1997, 2000, 2002, 2003, 2005, 2009, 2010, and 2012). Dotted blue, solid magenta, and solid red lines indicate negative, zero, and positive values, respectively. The contour intervals are 0.1 in (a)–(b) and 0.2 in (c)–(d). The dotted black areas are significant at the 95 % confidence level.
3.2 Atmospheric circulation evolution during DEs
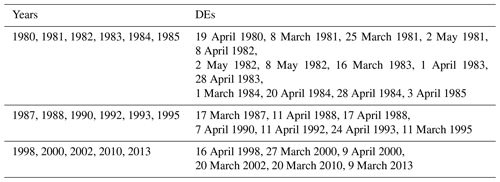
In this paper, we select 27 spring DEs in North China during the period of 1980–2020 based on the selection criteria, which are distributed over 17 years (Table 1). It is found that there are shifts in the NAO from a positive to negative phase preceding all the DEs, highlighting the significant influence of the NAO negative phase on the occurrence of DEs. Among these, the nine DEs (19 April 1980, 8 April 1982, 2 May 1982, 8 May 1982, 3 April 1985, 17 March 1987, 16 April 1998, 20 March 2010, and 9 March 2013) are striking based on the preliminary unusually strong winter NAO negative signal compared to that before the rest of the DEs. At the climate scale, the NAO intensity values in boreal winter of the nine DEs are all less than −0.5 SD, which corresponds to the NAO negative-phase years (Fig. 5a). Further analysis on the weather scale indicates that the number of days with NAO negative phase (the value of NAOI less than −0.5) is above 35 d in the 3 months of boreal winter in the nine DEs (Fig. 5b). Furthermore, the NAO negative phase is longer and more intense during these nine DEs, while the NAO negative-phase days in the remaining DEs are below 35 d (figure not shown). Therefore, to avoid information filtering caused by too many study cases and to reflect the statistical significance for studying the modulation effect of the NAO negative signal on the DEs in North China to the maximum extent, we chose these nine DEs with the strongest influence of the NAO negative signal to study the evolution characteristics and synoptic causes of DEs in North China.

Figure 5(a) The standardized interannual variability of the previous winter's NAOI of the years in which these DEs occurred. (b) The number of days when the value of the previous winter's NAOI is less than −0.5 of the years in which these DEs occurred.
From the abnormal field of the spatial distribution of DA concentration synthesized by the selected DEs (Fig. 6), it can be found that before the outbreak of DEs, the positive anomalies of DA concentrations appear in the source regions (Xinjiang and Mongolia), and on Day −1, the positive anomalous field gradually expands and develops into a positive anomaly belt with maximum values of 180 mg m−2. At this time, the DA concentrations on the north side of North China already show obvious positive anomalies, providing sufficient source contributions for the next outbreak of DEs. On Day 0, the overall DA concentration anomaly value exceeds 180 mg m−2 in North China, indicating that large-scale DEs have broken out. After the outbreak of DEs, the positive DA concentration anomalies in North China decrease rapidly, and the impact of DAs from Xinjiang and Mongolia on North China gradually weakens. Before the outbreak of DEs, the DA concentrations in Mongolia and Xinjiang, which are the primary source areas of DAs in East Asia (Zhang et al., 2003), gradually increase. In the growth process of DA concentrations, DAs are gradually transported eastward to North China. Therefore, the outbreak of DEs in North China is mainly caused by the rapid increase in DA concentrations and their eastward transmission from Xinjiang and Mongolia.
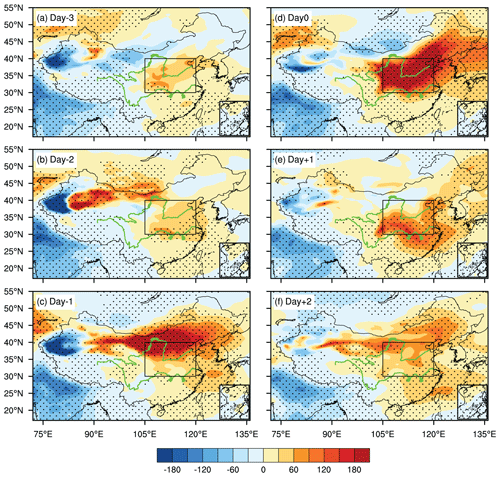
Figure 6Spatial distribution of the dust column mass density anomalies in East Asia from Day −3 to Day +2 during DEs (unit: mg m−2). The dotted black areas are significant at the 95 % confidence level.
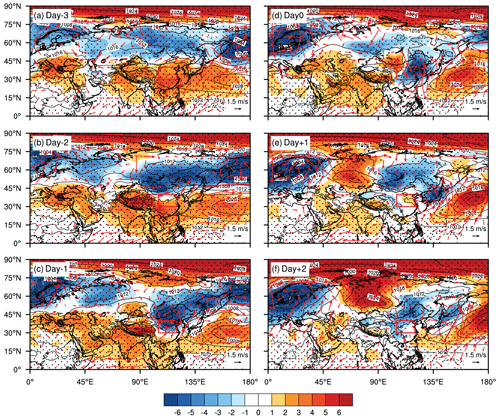
The evolution of the 200 hPa atmospheric circulation during DEs is illustrated in Fig. 7, representing features of the wind field in high levels of the troposphere. On Day −3, there are large-scale anomalous positive zonal winds in the Siberian area, with positive zonal wind anomalies of +9 m s−1. From Day −2 to Day −1, the positive zonal wind anomalies move southward, controlling the upstream area of North China (35–50∘ N, 70–110∘ E), as well as the dust source areas of Xinjiang and Mongolia. The zonal wind anomalies over the area of North China are in a “+, −, +” triple-pole pattern from the Equator to 60∘ N, indicating that the boreal winter NAO negative signal can propagate to East Asia, resulting in changes in the East Asian subtropical jet stream (EASJS) and polar-front jet stream (PFJS) in late spring. In earlier investigations, similar findings were noted (Shao and Zhang, 2012). There are also remarkable features of the EASJS along 30∘ N, with two centers: the west center is in northern Africa, with a central intensity of 40 m s−1, and the east center is situated in the western Pacific south of Japan, with a central intensity of 50 m s−1. As a result of its long distance from the DA source regions in East Asia and North China, the western center of the EASJS has a very limited impact on these regions. From Day −3 to Day −1, the eastern center of the EASJS moves eastward, which leads to diminishing zonal winds at 200 hPa in North China, and the negative anomaly center is lower than −9 m s−1. From Day 0 to Day +2, the eastern center of the EASJS stops moving eastward and recedes slightly westward, and the zonal winds over North China change to −6 m s−1. Under the impact of the jet stream, there are anomalous positive zonal winds and negative zonal winds controlling the dust source areas of Xinjiang and Mongolia, and North China. Through the effect of vertical circulation, abnormal winds at high altitudes can influence middle- and low-altitude winds through momentum compensation and momentum downward transmission (Li and Liu, 2015; Wu et al., 2016). Therefore, this may lead to the generation of windy weather near the DA source areas and the maintaining of the DA concentration in North China, both of which contribute to the occurrence of DEs in North China.
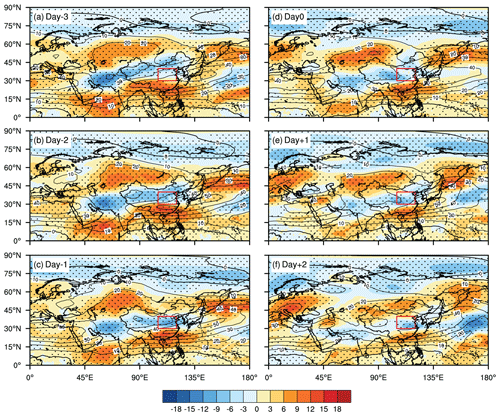
Figure 7Spatial distribution of the 200 hPa winds (contour; unit: m s−1) and their anomalies (shades; unit: m s−1) from Day −3 to Day +2 during DEs. The dotted black areas are significant at the 95 % confidence level.
To further determine the impact of the upper-level wind speed on the middle–lower wind speed, the vertical pressure–latitude distribution of the mean zonal winds and the vertical winds are calculated over the DA source areas and North China (Fig. 8). As shown in Fig. 8a to f, before the outbreak of DEs, due to the downward momentum of the zonal winds at high altitudes above the DA source areas, the enhancement of the wind speed in the middle–lower levels is evident (Wu et al., 2016), resulting in the generation of strong surface winds to meet the dynamic conditions for the uplift of local DAs. After the outbreak of DEs, the average zonal winds in the high levels and the downward momentum effect weaken in DA source areas. Compared with the mean zonal winds in the troposphere over North China (Fig. 8g to l), from Day −3 to Day −1, corresponding to the weakening of the zonal winds in the high levels, the zonal wind speed in the middle–lower levels decreases due to momentum compensation for the zonal winds in the high levels (Li and Liu, 2015), which is conducive to the maintenance of DA concentration that is transported before the DE outbreak, as well as in preparation for the subsequent DE outbreak in North China. After the DE outbreak, the zonal winds at high altitudes on the north side of North China strengthen due to the increase in zonal winds in the middle–lower levels, and the DA concentration begins to decrease under the effect of strong winds near the surface. It is also noted that during the whole evolution of DEs, the south side of North China is dominated by southerly winds, which have a certain blocking effect on the northward airflow carrying DAs and are favorable for maintaining the DA concentration in North China.
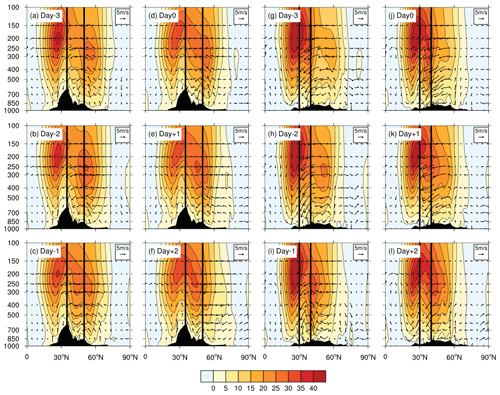
Figure 8(a–f) Pressure–latitude section of zonal wind [u] (shaded; unit: m s−1) and vertical wind (arrow; (v, w), w expands 100 times; unit: m s−1) averaged over 70–110∘ E from Day −3 to Day +2 during DEs. The area surrounded by the black line is the range of the source regions of DA. Panels (g)–(l) are like (a)–(f) but averaged over 105–120∘ E.
In the evolution of the atmospheric circulation of DEs at 500 hPa (Fig. 9a to c), the trough–ridge situation is characterized by two troughs and one ridge throughout the middle–high latitudes of the Eurasian continent from Day −3 to Day −1. The two troughs are located in the Black Sea (30–60∘ N, 20–50∘ E) and the eastern part of Russia (30–60∘ N, 105–130∘ E), and the ridge is situated in the Ural Mountains (25–45∘ N, 60–80∘ E). The western and eastern troughs both show negative variations before the outbreak of DEs, with maximum values of −4 dagpm and −10 dagpm, respectively, while the Ural ridge (UR) manifests as a gradual enhancement with maximum values of +6 dagpm. From Day 0 to Day +2, the intensities of the trough and ridge all gradually weaken (Fig. 9d to f). Before the outbreak of DEs, on account of the strengthening advancement of the trough–ridge situation, the middle–high latitudes are dominated by the strong meridional circulation, the transport of northern cold air increases, and the southward invasion of the cold air enhances the local surface wind speed, leading to the uplift of DAs in the DA source areas. After the outbreak of DEs, due to the changes in the trough–ridge situation and the weakening of the UR, the cold air transport weakens. It should be noted that the UR during DEs is much less than a blocking high based on the intensity, as well as the duration. The UR is established on Day −1 and disappears basically on Day +1, which is also consistent with the feature that the maximum duration of DEs does not exceed 2 d (Li et al., 2022b).
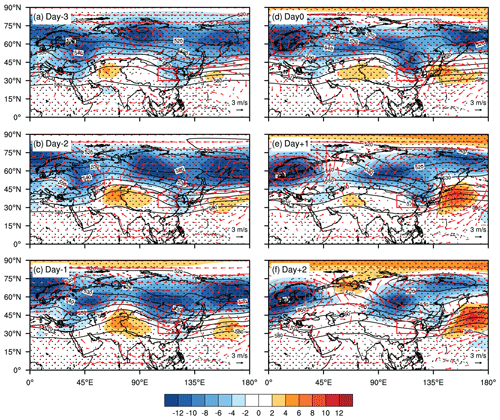
Figure 9The spatial distribution of 500 hPa geopotential height (contour; unit: dagpm) overlays its anomalies (shades; unit: dagpm) and 850 hPa wind anomalies (arrows; unit: m s−1) from Day −3 to Day +2 during DEs. The dotted black areas and red arrow areas are significant at the 95 % confidence level.
There is also a corresponding signal during DEs in the sea level pressure field (Fig. 10). On Day −3, North China is controlled by an anticyclonic system dominated by sinking airflow. Therefore, poor precipitation conditions lead to the weak wet deposition of DAs during transport (Kutiel and Furman, 2003). Meanwhile, the SH starts to appear in the upstream areas of North China. On Day −2, the intensity of the SH is enhanced, with maximum values of +6 hPa, and moves toward North China, while the intensity of the anticyclonic system dominant in North China slightly weakens, and its position does not change significantly. In Mongolia, the Mongolian cyclone (MC) starts to develop, accompanied by strong winds and vertical upward flows induced by the MC, which is conducive to the dynamic circumstances for the development of uplift of DAs. On Day −1, the location and intensity of the SH both change little, while the intensity of the anticyclonic system controlling North China weakens and even tends to disappear, and the intensity of the MC increases and moves slightly southward. On Day 0, the SH moves eastward to the territory of Mongolia, and the MC moves southeastward, which is conducive to the transport of DAs from Mongolia to North China. From Day +1 to Day +2, the intensities of both the SH and MC start to weaken, and the impact on North China begins to lessen. In summary, under the negative phase of the NAO, before the outbreak of DEs, due to the establishment, strengthening, and southward movement of the SH and MC, there is a wide range of northerly winds and the outbreak of cold air to the south, which is advantageous for the uplift and transmission of DAs to North China. Simultaneously, North China is controlled by an anticyclonic system, leading to local weather, mainly sunny conditions and weak winds, which is also favorable for the transport of DAs to North China. After the outbreak of DEs, both the SH and MC start to weaken, indicating that the uplift of DAs in the DA source areas and the dust transmission activities to North China start to weaken.
From the above atmospheric circulation characteristics, under the NAO negative phase, the crucial synoptic systems leading to DE occurrences in North China are the abnormal winds by the anomalies of the upper-level EASJS, the UR, the SH, and the MC near the surface. In addition, transient eddies are crucial for the abnormal evolution of atmospheric circulation. The mechanism of the formation of these synoptic system anomalies from the view of transient eddies is investigated to reveal the mechanism of the synoptic cause for the DEs in North China under the modulation of the NAO negative phase.
3.3 Transient eddy flux transport characteristics during DEs
Transient eddy fluctuations contribute to the maintenance of the atmospheric energy balance through energy transport, and the energy transport process causes the divergence and convergence of energy and mass between different regions, thus forming new regions of forcing within the atmosphere (Y. Li et al., 2019a). Transient eddy flux transport can enhance the positive pressure component of the mean airflow and compensate for ground friction, which has a significant effect on the maintenance of atmospheric circulation. For example, transient eddy momentum transport is associated with the development of blocking highs, and momentum transport contributes differently during each period of its development (Y. Li et al., 2019a). DE occurrences are inevitably accompanied by tropospheric circulation anomalies, and transient eddy flux transport plays a significant role in the process of atmospheric circulation. Therefore, the possible mechanism of transient eddy momentum and heat transport during DEs, under the NAO negative phase, is further analyzed and explored.
The “+” (“−”) sign of [] implies the poleward (equatorward) transport of transient eddy momentum, and the “+” (“−”) sign of [u′] represents the positive (negative) anomaly of the zonal winds. Analyzing the transport features of transient eddy momentum within the active range of the UR during DEs (Fig. 11a to f), it is found that a pattern of “positive south and negative north” appears with poleward or equatorward momentum transport, respectively, near 30 and 40∘ N at approximately 200–500 hPa on Day −3, while a [] convergence center exists within the area of the UR. On Day −2, the feature of [] in the Urals region changes from convergence to divergence, and on Day −1, the “negative south and positive north” pattern of transient eddy momentum reaches the highest value during DEs, with maximum values of −24 and +30 m2 s−2, respectively. After the outbreak of DEs, the intensity of the [] center in the Urals region rapidly decreases, with no longer obvious [] transport. For the zonal wind anomalies [u′] (Fig. 11g to l), before the outbreak of DEs, in the Urals region there is a “negative south and positive north” mode, which is mainly controlled by negative [u′], with maximum values of −12 m s−1, corresponding to the divergence of []. From Day 0 to Day +1, the UR region gradually becomes dominated by the “+” signal of [u′]. On Day +2, as there is unobvious [] within the region of the UR, the intensity of [u′] weakens rapidly. An investigation of the transient eddy momentum transport characteristics and the changes in the zonal wind anomalies during DEs shows that there is an obvious divergence center of the transient eddy momentum within the range of UR before the outbreak of DEs, corresponding to zonal wind weakening and the establishment of meridional circulation. Therefore, transient eddy momentum transport has an indirect influence on the establishment and advancement of the UR (Li et al., 2022b). To obtain a better understanding of the role of transient eddy momentum on anomalies of the wind field during DEs, the [] characteristics of the DA source areas are further analyzed (Fig. 12a to f). The transient eddy momentum pattern of “positive south and negative north” in the DA source areas is gradually displayed at 200–500 hPa from Day −3 to Day −1, with maximum values of +36 and −36 m2 s−2, respectively. After the outbreak of DEs, the source areas of DAs are mainly controlled by the weak [] negative center, with unobvious transient eddy momentum. For the zonal wind anomalies [u′] (Fig. 12g to l), before the outbreak of DEs, the DA source regions gradually become dominated by positive [u′], with maximum values of +10 m s−1 on account of the convergence of transient eddy momentum, facilitating the uplift of DAs. After the outbreak of DEs, [u′] still predominantly increases, indicating that there are more complex reasons for the zonal wind changes than the transport of transient eddy momentum, which deserves in-depth analysis later.
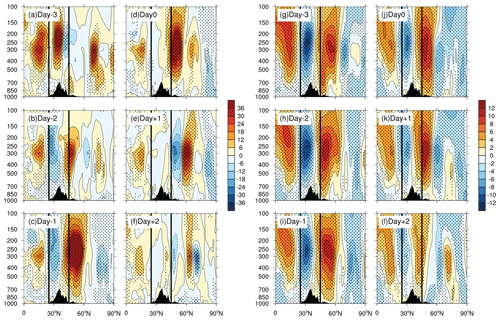
Figure 11Pressure–latitude section of (a–f) the mean transient momentum [] (unit: m2 s−2) and (g–l) zonal wind anomalies [u′] (unit: m s−1) averaged over 60–80∘ E from Day −3 to Day +2 during DEs. The area surrounded by the black line is the range of the UR. The dotted black areas are significant at the 95 % confidence level.
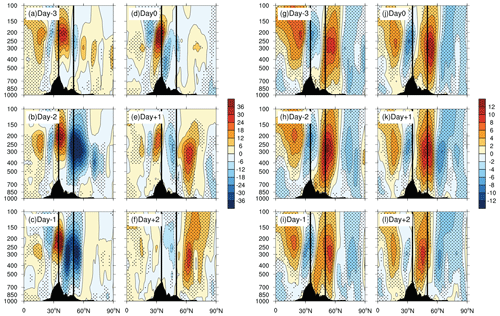
Figure 12Pressure–latitude section of (a–f) the mean transient momentum [] (unit: m2 s−2) and (g–l) zonal wind anomalies [u′] (unit: m s−1) averaged over 70–110∘ E from Day −3 to Day +2 during DEs. The area surrounded by the black line is the range of the source regions of DA. The dotted black areas are significant at the 95 % confidence level.
Atmospheric circulation also heavily depends on transient eddy heat transport (Y. Li et al., 2019a; Li et al., 2022b). Similar to the features of transient eddy momentum transport, the “+” (“−”) sign of [] describes the poleward (equatorward) transport of transient eddy heat, and the “+” (“−”) sign of [T′] implies an increase (decrease) in temperature. In the analysis of the [] characteristics within the range of UR during DEs (Fig. 13a to f), it is found that the convergence of transient eddy heat is dominant at 200–500 hPa on Day −3, with maximum values of +12 and −6 m s−1 K. During the subsequent Day −2 to Day −1, the UR area is dominated by a strong positive [] center, which also exhibits the convergence features of transient eddy heat. There are unobvious features of [] in the developmental range of the UR from Day 0 to Day +2. In the analysis of the temperature anomalies [T′] (Fig. 13g to l), it is shown that before the outbreak of DEs, the area with a developed UR is in the convergence region of transient eddy heat, and [T′] becomes more visible when the transient eddy heat transport increases, showing a “negative south and positive north” pattern below 300 hPa. The temperature gradient is weakened here by the thermal wind formula (, where and T demonstrate the thermal wind, gas constant, and temperature, respectively), and the thermal wind will be weakened due to the decline in the temperature gradient. When the thermal wind is weakened, the zonal winds are also weakened, which facilitates the establishment of meridional circulation and the development of a blocking situation (Y. Li et al., 2019a). After the outbreak of DEs, [T′] decreases due to the weakening of the transient eddy heat transport. From Day 0 to Day +1, the negative [T′] anomaly center appears north of the UR, and the negative [T′] center gradually moves southward, which corresponds to the increase in the temperature gradient here and is not favorable for the development of the UR. The transient eddy heat transport also has an impact on the wind field for the source regions of DAs (Fig. 14a to c). Before the outbreak of DEs, the [] over the DA source areas gradually evolves to be dominated by the convergence above 300 hPa, while the divergence of [] is dominated below 300 hPa. The strongest [] convergence and divergence characteristics are both reached on Day −1. After the outbreak of DEs (Fig. 14d to f), the DA source regions are controlled by a positive [] center, with the convergence of [] on Day 0. From Day +1 to Day +2, there are unobvious [] features over the source areas of DAs. Analysis of the temperature anomalies [T′] (Fig. 14g to l) reveals that below 300 hPa in the DA source regions before the outbreak of DEs, the transient eddy heat transport weakens with time due to the “positive south and negative north” mode of [T′], with maximum values of +2 and −2 K, respectively. The temperature gradient is enhanced, and the development of thermal wind leads to the enhancement of zonal winds. In addition, the zonal winds in the middle–lower levels are enhanced by the enhanced thermal wind, and the downward momentum of zonal winds in the high levels further enhances the zonal winds in the middle–lower levels, which is conducive to the uplift of DAs. In addition, the convergence of [] is not favorable for the development of the zonal winds above 300 hPa according to the thermal wind formula, which hinders the downward momentum of the zonal winds in the high levels in the DA source areas. Transient momentum transport has a greater effect on the variability in zonal winds at high levels than transient eddy heat transport (Solomon, 1997).
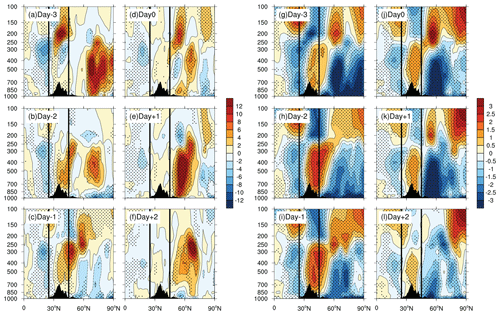
Figure 13Pressure–latitude section of (a–f) the mean transient heat [] (unit: m s−1 K) and (g–l) temperature anomalies [T′] (unit: K) averaged over 60–80∘ E from Day −3 to Day +2 during DEs. The area surrounded by the black line is the range of the UR. The dotted black areas are significant at the 95 % confidence level.
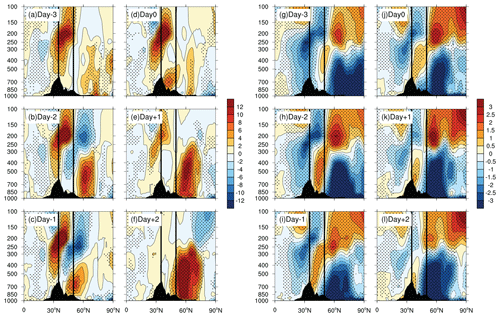
Figure 14Pressure–latitude section of (a–f) the mean transient heat [] (unit: m s−1 K) and (g–l) temperature anomalies [T′] (unit: K) averaged over 70–110∘ E from Day −3 to Day +2 during DEs. The area surrounded by the black line is the range of the source regions of DA. The dotted black areas are significant at the 95 % confidence level.
The transient eddy flux transport characteristics during DEs show that the changes in [] and [] in the DA source regions and the active range of the UR cause both energy and mass divergence in North China, leading to diminishing zonal winds at high levels over North China during DEs. Meanwhile, the zonal winds in the middle–lower levels weaken through vertical circulation due to the diminishing zonal winds at high levels, accompanied by southerly airflow on the south side of North China, facilitating the maintenance of DA concentrations.
Results of the previous analysis of the transient eddy flux transport characteristics indicate that the evolution of the UR may be explained by the divergence of transient eddy momentum and the convergence of transient eddy heat by the thermal wind formula. By using the equation for the quasi-geostrophic potential, this mechanism can also be verified (Lackmann, 2012) as follows:
where and Vg denote the Coriolis parameter, geopotential height, and geopotential wind, respectively, and and denote the static stability and the geostrophic relative vorticity, respectively. The first and second terms on the right-hand side of the equal sign of Eq. (3) have the following equivalence after simplification:
On the trough–ridge lines, since the vorticity advection in Eq. (4) is zero and the height of the isobaric surface has no change, it only moves the ridges and does not change the strength of the ridges. The temperature advection in Eq. (5) mainly acts on the trough–ridge lines, which affects the development of the trough–ridge intensity but has no influence on its movement. In this study, we mainly consider the change in trough–ridge intensity during DEs by noting the effect of temperature advection. Temperature advection generally decreases with height, so it is sufficient to discuss only the signs of positive and negative temperature advection here. Analysis of transient eddy heat transport characteristics reveal that the transport of transient eddy heat in the UR region before the outbreak of DEs will lead to uneven temperature distribution, which in turn leads to the development of warm advection. The analysis of the quasi-geostrophic potential theory shows that the development of warm advection in this region is beneficial to the development of the UR and to the establishment of a temperature ridge. After the outbreak of DEs, the temperature advection starts to weaken, as [] no longer changes within the area of UR, and thus, the intensity of UR also starts to weaken.
Meanwhile, the active development of temperature advection and vorticity advection due to transient eddy heat transport and the enhancement of UR, based on the Ω equation in the quasi-geostrophic theory (Lackmann, 2012), can also explain abnormal evolutions of the SH, as well as the MC near the surface during DEs, as follows:
where and Vg denote the Coriolis parameter, vertical velocity, geopotential height, and geopotential wind, respectively, and and denote the static stability, vertical velocity, and geostrophic relative vorticity, respectively. After simplification, the first and second terms in Eq. (6) to the right of the equal sign are equivalent to the following:
According to Eqs. (7) and (8), the relationship between the vertical velocity and vorticity advection and between the vertical velocity and temperature advection can be obtained, respectively. When the positive (negative) vorticity advection increases with height, the degree of counterclockwise (clockwise) rotation increases there, and the divergence (convergence) increases with height under the Coriolis force, which will produce the rising (sinking) motion. As the vorticity advection generally increases with height, it is sufficient to discuss only the signs of positive and negative vorticity advection here. In short, it is expressed as warm (cold) advection corresponding to the rising (sinking) motion. Before the outbreak of DEs, the northwest winds in front of the UR are strengthened along with the enhancement of the ridge, and the northwest winds correspond to the development of negative vorticity advection and cold advection. According to the quasi-geostrophic theory, a sinking motion will be generated in front of the UR, which corresponds to pressurization at the surface and will promote the establishment, strengthening, and southward movement of the SH. Similarly, the Mongolian region is located in front of the trough at this time, controlled by the southwest winds. Corresponding to the development of positive vorticity advection and warm advection here, an upward motion will be generated in Mongolia, corresponding to depressurization at the surface, which will promote the establishment, enhancement, and southward movement of MC there. After the outbreak of DEs, both the SH and MC start to weaken by reversal impacts of the temperature and vorticity advections due to the weakening of the trough–ridge situation at a deeper level due to the change in transient eddy transport conditions.
As a significant extra-equatorial mode of low-frequency atmospheric variability with a periodic signal on the seasonal scale in the NH and a dominant mode of seasonal to annual winter semi-annual variability, the NAO has an influence on the DEs in East Asia, with significant regional characteristics. The spring DA concentration in North China, a non-dust source region, exhibits high values and strong annual variability. In this study, it is found that the boreal winter NAO negative signal has a significant effect on the DEs in late spring in North China. Modulated by the NAO negative signal, the tropospheric weather situation shows obvious anomalies, and the evolution mechanism can be revealed from the perspective of transient eddy transport. We use the NAOI provided by the Climate Prediction Center, which has been used in many studies (Zuo et al., 2015; M. Y. Li et al., 2021; Yao et al., 2022), for correlation analysis with the NAOI used in this work and find a good agreement with a correlation coefficient of 0.83 (figure not shown). This point indicates that the result would not be affected by the choice of NAOI.
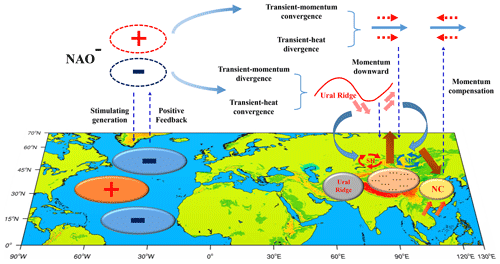
Figure 15A schematic diagram of the main synoptic system anomalies and the role of transient eddy fluxes during DEs.
The boreal winter NAO negative signal through the “capacitor effect” of the North Atlantic prolongs its atmospheric signal and influences the late spring DEs in North China. Under the modulation impact of the upstream NAO negative signal, before the outbreak of DEs, the zonal winds at 200 hPa above the DA source regions gradually increase, and the increased zonal winds in the high levels transport the momentum to the zonal winds in the middle–lower levels through the vertical circulation, which is favorable for the uplift of DAs in the DA source areas. Meanwhile, the zonal wind in the high levels is dominated by negative anomalies over North China, which has a counter effect on the zonal winds in the middle–lower levels by vertical circulation and facilitates the maintenance of DA concentrations in North China. At 500 hPa, the trough–ridge situation is obvious on the Eurasian continent, the transport of northern cold air increases, and the southward invasion of the cold air enhances the local surface wind speed in the DA source areas, leading to the uplift of DAs. Near the surface, the SH and MC are established, enhanced, and move southward, providing the northerly airflow in front of the DA source regions, guiding the cold air at high latitudes southward, and acting favorably to the uplift and transmission of DAs to downstream North China. Simultaneously, the south side of North China is dominated by southerly winds, which have a blocking effect on the northerly airflow carrying DAs, facilitating the maintenance of DA concentrations in North China. After the outbreak of DEs, both favorable atmospheric circulations weaken gradually, and the DAs also start to decrease in North China.
Transient eddies have an important effect on the synoptic evolution of DEs through the modulation of the NAO negative signal. In advance of the outbreak of DEs, the transient eddy momentum at 300–500 hPa above the DA source region is dominated by convergence, and thus, the zonal winds are enhanced. Meanwhile, the characteristics of transient eddy heat over the source areas of DAs are mainly divergence, and the temperature anomalies are in a “positive south and negative north” pattern, resulting in the enhancement of the temperature gradient and the zonal winds. Therefore, the zonal winds over the DA source regions were increased by both the downward momentum and thermal wind, which are favorable for the uplift of DAs. Within the area of UR, the transient eddy momentum (heat) diverges (converges). The divergence of transient eddy momentum will lead to the weakening of zonal winds, while the decrease in zonal winds and the reduction in temperature gradients are both favored by the convergence of transient eddy heat. The establishment and growth of the meridional circulation are significantly influenced by both, which is conducive to the development of the UR. The changes in upstream transient eddy flux transport cause both energy and mass divergence in North China, resulting in diminishing zonal winds during DEs, facilitating the maintenance of DA concentration. After the outbreak of DEs, the transient eddy flux transport characteristics in both the Ural region and the source areas of DAs gradually weaken, and the effect on the zonal winds within these regions is also reduced.
In this study, we examine how the late spring DEs in North China are impacted by the boreal winter NAO negative signal and the corresponding synoptic mechanism from the view of transient eddy flux transport on the weather scale by selecting nine DEs from 1980 to 2020. Our focus is different from previous analyses of the NAO and the DEs in China on the seasonal climate scale (Tang et al., 2005; Zhao et al., 2012). The findings demonstrate that the boreal winter NAO negative signal can store its signal in the North Atlantic as a triple-pole structure of “−, +, −”, which is then released in late spring and affects the anomaly of atmospheric circulation in the troposphere by transient eddy flux transport, as well as the zonal winds over the DA source regions and North China. The thermal wind principle and the quasi-geostrophic theory can both explain this mechanism. According to changes in the temperature gradient, the thermal wind principle directly explains variations in the wind fields by the convergence and divergence of the thermal and momentum transient eddy flux during DEs. The quasi-geostrophic theory can illustrate the abnormal formation mechanism of synoptic systems in the whole troposphere during DEs. To be more precise, the influence of the NAO negative signal in transient eddy fluxes causes temperature and vorticity advection to develop; therefore, both middle–upper-level systems (the UR) and surface systems (the SH and MC) strengthen, which can be explained by the height tendency equation and Ω equation, respectively. The development of the above synoptic systems is favorable for the uplift of DAs in the DA source areas and the transmission process to North China. Meanwhile, the southward airflow on the south side of North China is favorable for maintaining the stable high value of DA concentration for 1–2 d. The results are illustrated in Fig. 15, which displays the main synoptic systems and transient eddy flux transport characteristics during DEs against the background of the NAO negative phase. The result is helpful for a thorough comprehension of the mechanism underlying the formation of DEs in eastern China and can serve as a point of reference for the seasonal forecasting of DEs (Hong et al., 2019).
In addition to transient eddies, stationary eddies are also crucial in the development of atmospheric circulation, and the energy transport of stationary eddies differs from that of transient eddies and has been applied to the analysis of atmospheric circulation processes such as the UR (Y. Li et al., 2019b). To further advance our knowledge of dust hazards at the regional scale in China, the impacts of various forms of energy transport on the synoptic systems of DEs in China will be concurrently considered in future work. Globally, the majority of DAs are found in arid and semi-arid areas, and the most widespread and longest-lasting source regions of DAs are located in the NH, forming a dust belt starting from the west coast of northern Africa and extending through the Arabian Peninsula and central and southern Asia to eastern China (Washington et al., 2003; Ginoux et al., 2012). In this study, the contribution of DA source regions in East Asia to the DEs in North China is mainly considered, but insufficient consideration is given to other DA source regions. In further studies, more study methods, such as numerical simulations, should be applied to fully explore the role of DA transport from the NH source areas of DAs to China and to elucidate the details of the development of DEs in China. In addition, the DEs in China are also impacted by other factors that are related to the NAO, such as the El Niño–Southern Oscillation (ENSO; J. Li et al., 2021; Yang et al., 2022). Previous research has demonstrated that central Pacific El Niño events can stimulate the negative phase of the NAO by transmitting the Pacific signal to the north Atlantic through a “subtropical bridge” mechanism, while this association is insignificant for eastern Pacific El Niño events (Graf and Zanchettin, 2012). Zhang et al. (2015) also discovered that the north Atlantic jet stream strengthens and the NAO exhibits a positive phase during central Pacific La Niña events, whereas the north Atlantic jet stream weakens and the NAO exhibits a negative phase during eastern Pacific La Niña events. In the context of global warming, the SSTA of the tropical Pacific mainly exhibits a cold tongue mode, and the positive phase of the cold tongue mode can easily stimulate central Pacific El Niño events (Li et al., 2017). However, it is not clear how the connection between the NAO and ENSO will evolve under global warming. Therefore, it is worthwhile to continue researching the synergistic effect of the NAO and ENSO on the DEs in China. Furthermore, NAO is closely related to dust activities in many regions, except for China. For example, Moulin et al. (1997) and Ginoux et al. (2004) both indicated a strong correlation between NAO and dust activity in North Africa using a satellite dataset and dust transport models, respectively. Banerjee et al. (2021) and Li et al. (2022a) emphasized the important role of NAO in the dust activities of South Asia and Central Asia. Hence, future studies are needed to explore the relationship between the dust activities in other regions and NAO.
The MERRA-2 dust aerosol concentrations dataset can be downloaded from NASA Goddard Earth Sciences Data and Information Services Center at https://doi.org/10.5067/KLICLTZ8EM9D and https://doi.org/10.5067/FH9A0MLJPC7N (Global Modeling and Assimilation Office, 2015a, b). The ERSST-5 dataset can be downloaded from the NOAA Physical Science Division at https://doi.org/10.7289/V5T72FNM (Huang et al., 2017b). The ERA5 dataset can be obtained from the ECMWF at https://doi.org/10.24381/cds.bd0915c6 (Hersbach et al., 2023). Our results can be made available upon request.
YL, FX, and JF conceptualized and designed the research. FX synthesized and analyzed the dataset. YL, FX, and JF produced the figures. CL and WJZ contributed to the MERRA-2 dataset retrieval. All the authors including MD and WS discussed the results and wrote the paper.
The contact author has declared that none of the authors has any competing interests.
Publisher’s note: Copernicus Publications remains neutral with regard to jurisdictional claims in published maps and institutional affiliations.
This research has been supported by the National Key Research and Development Program of China (2019YFA0606801), the National Natural Science Foundation of China (42222501 and 41975079), and the Natural Science Foundation of Gansu Province (21JR7RA497 and 21JR7RA495). This research has been supported by the Supercomputing Center of Lanzhou University.
This research has been supported by the National Key Research and Development Program of China (grant no. 2019YFA0606801), the National Natural Science Foundation of China (grant nos. 42222501 and 41975079), and the Natural Science Foundation of Gansu Province (grant nos. 21JR7RA497 and 21JR7RA495).
This paper was edited by Suvarna Fadnavis and reviewed by three anonymous referees.
Ackerman, A. S., Toon, O. B., Stevens, D. E., Heymsfield, A. J., Ramanathan, V., and Welton, E. J.: Reduction of tropical cloudiness by soot, Science, 288, 1042–1047, https://doi.org/10.1126/science.288.5468.1042, 2000.
An, L. C., Che, H. Z., Xue, M., Zhang, T. H., Wang, H., Wang, Y. Q., Zhou, C. H., Zhao, H. J., Gui, K., Zheng, Y., Sun, T. Z., Liang, Y. X., Sun, E. W., Zhang, H. D., and Zhang, X. Y.: Temporal and spatial variations in sand and dust storm events in East Asia from 2007 to 2016: Relationships with surface conditions and climate change, Sci. Total Environ., 633, 452–462, https://doi.org/10.1016/j.scitotenv.2018.03.068, 2018.
Banerjee, P., Satheesh, S. K., and Krishna Moorthy, K.: Is the Atlantic Ocean driving the recent variability in South Asian dust?, Atmos. Chem. Phys., 21, 17665–17685, https://doi.org/10.5194/acp-21-17665-2021, 2021.
Cayan, D. R.: Latent and Sensible Heat Flux Anomalies over the Northern Oceans: The Connection to Monthly Atmospheric Circulation, J. Climate, 5, 354–369, https://doi.org/10.1175/1520-0442(1992)005<0354:Lashfa>2.0.Co;2, 1992.
Che, H., Gui, K., Xia, X., Wang, Y., Holben, B. N., Goloub, P., Cuevas-Agulló, E., Wang, H., Zheng, Y., Zhao, H., and Zhang, X.: Large contribution of meteorological factors to inter-decadal changes in regional aerosol optical depth, Atmos. Chem. Phys., 19, 10497–10523, https://doi.org/10.5194/acp-19-10497-2019, 2019.
Chen, S., Huang, J., Kang, L., Wang, H., Ma, X., He, Y., Yuan, T., Yang, B., Huang, Z., and Zhang, G.: Emission, transport, and radiative effects of mineral dust from the Taklimakan and Gobi deserts: comparison of measurements and model results, Atmos. Chem. Phys., 17, 2401–2421, https://doi.org/10.5194/acp-17-2401-2017, 2017.
Chiapello, I., Moulin, C., and Prospero, J. M.: Understanding the long-term variability of African dust transport across the Atlantic as recorded in both Barbados surface concentrations and large-scale Total Ozone Mapping Spectrometer (TOMS) optical thickness, J. Geophys. Res.-Atmos., 110, D18S10, https://doi.org/10.1029/2004jd005132, 2005.
Czaja, A. and Frankignoul, C.: Observed Impact of Atlantic SST Anomalies on the North Atlantic Oscillation, J. Climate, 15, 606–623, https://doi.org/10.1175/1520-0442(2002)015<0606:Oioasa>2.0.Co;2, 2002.
Duce, R. A., Unni, C. K., Ray, B. J., Prospero, J. M., and Merrill, J. T.: Long-Range Atmospheric Transport of Soil Dust from Asia to the Tropical North Pacific: Temporal Variability, Science, 209, 1522–1524, https://doi.org/10.1126/science.209.4464.1522, 1980.
Feng, J., Li, J., Liao, H., and Zhu, J.: Simulated coordinated impacts of the previous autumn North Atlantic Oscillation (NAO) and winter El Niño on winter aerosol concentrations over eastern China, Atmos. Chem. Phys., 19, 10787–10800, https://doi.org/10.5194/acp-19-10787-2019, 2019.
Feng, J., Zhu, J., Li, J., and Liao, H.: Aerosol concentrations variability over China: two distinct leading modes, Atmos. Chem. Phys., 20, 9883–9893, https://doi.org/10.5194/acp-20-9883-2020, 2020.
Gelaro, R., McCarty, W., Suarez, M. J., Todling, R., Molod, A., Takacs, L., Randles, C. A., Darmenov, A., Bosilovich, M. G., Reichle, R., Wargan, K., Coy, L., Cullather, R., Draper, C., Akella, S., Buchard, V., Conaty, A., da Silva, A. M., Gu, W., Kim, G. K., Koster, R., Lucchesi, R., Merkova, D., Nielsen, J. E., Partyka, G., Pawson, S., Putman, W., Rienecker, M., Schubert, S. D., Sienkiewicz, M., and Zhao, B.: The Modern-Era Retrospective Analysis for Research and Applications, Version 2 (MERRA-2), J. Climate, 30, 5419–5454, https://doi.org/10.1175/jcli-d-16-0758.1, 2017.
Giannini, A., Kushnir, Y., and Cane, M. A.: Interannual variability of Caribbean rainfall, ENSO, and the Atlantic Ocean, J. Climate, 13, 297–311, https://doi.org/10.1175/1520-0442(2000)013<0297:Ivocre>2.0.Co;2, 2000.
Ginoux, P., Prospero, J. M., Torres, O., and Chin, M.: Long-term simulation of global dust distribution with the GOCART model: correlation with North Atlantic Oscillation, Environ. Modell. Softw., 19, 113–128, https://doi.org/10.1016/s1364-8152(03)00114-2, 2004.
Ginoux, P., Prospero, J. M., Gill, T. E., Hsu, N. C., and Zhao, M.: Global-scale attribution of anthropogenic and natural dust sources and their emission rates based on MODIS Deep Blue aerosol products, Rev. Geophys., 50, RG3005, https://doi.org/10.1029/2012rg000388, 2012.
Global Modeling and Assimilation Office (GMAO): MERRA-2 tavg1_2d_aer_Nx: 2d,1-Hourly, Time-averaged, Single-Level, Assimilation, Aerosol Diagnostics V5.12.4, Greenbelt, MD, USA, Goddard Earth Sciences Data and Information Services Center (GES DISC) [data set], https://doi.org/10.5067/KLICLTZ8EM9D, 2015a.
Global Modeling and Assimilation Office (GMAO): MERRA-2 tavgM_2d_aer_Nx: 2d, Monthly mean, Time-averaged, Single-Level, Assimilation, Aerosol Diagnostics V5.12.4, Greenbelt, MD, USA, Goddard Earth Sciences Data and Information Services Center (GES DISC) [data set], https://doi.org/10.5067/FH9A0MLJPC7N, 2015b.
Graf, H.-F. and Zanchettin, D.: Central Pacific El Niño, the “subtropical bridge,” and Eurasian climate, J. Geophys. Res.-Atmos., 117, D01102, https://doi.org/10.1029/2011JD016493, 2012.
Han, Y., Wang, T. H., Tang, J. Y., Wang, C. Y., Jian, B. D., Huang, Z. W., and Huang, J. P.: New insights into the Asian dust cycle derived from CALIPSO lidar measurements, Remote Sens. Environ., 272, 112906, https://doi.org/10.1016/j.rse.2022.112906, 2022.
Hartley, S. and Keables, M. J.: Synoptic associations of winter climate and snowfall variability in New England, USA, 1950–1992, Int. J. Climatol., 18, 281–298, https://doi.org/10.1002/(sici)1097-0088(19980315)18:3<281::Aid-joc245>3.0.Co;2-f, 1998.
Hersbach, H., Bell, B., Berrisford, P., Hirahara, S., Horanyi, A., Munoz-Sabater, J., Nicolas, J., Peubey, C., Radu, R., Schepers, D., Simmons, A., Soci, C., Abdalla, S., Abellan, X., Balsamo, G., Bechtold, P., Biavati, G., Bidlot, J., Bonavita, M., De Chiara, G., Dahlgren, P., Dee, D., Diamantakis, M., Dragani, R., Flemming, J., Forbes, R., Fuentes, M., Geer, A., Haimberger, L., Healy, S., Hogan, R. J., Holm, E., Janiskova, M., Keeley, S., Laloyaux, P., Lopez, P., Lupu, C., Radnoti, G., de Rosnay, P., Rozum, I., Vamborg, F., Villaume, S., and Thepaut, J.-N.: The ERA5 global reanalysis, Q. J. Roy. Meteor. Soc., 146, 1999–2049, https://doi.org/10.1002/qj.3803, 2020.
Hersbach, H., Bell, B., Berrisford, P., Biavati, G., Horányi, A., Muñoz Sabater, J., Nicolas, J., Peubey, C., Radu, R., Rozum, I., Schepers, D., Simmons, A., Soci, C., Dee, D., Thépaut, J.-N.: ERA5 hourly data on pressure levels from 1940 to present, Copernicus Climate Change Service (C3S) Climate Data Store (CDS) [data set], https://doi.org/10.24381/cds.bd0915c6, 2023.
Holopainen, E. O. and Oort, A. H.: On the Role of Large-Scale Transient Eddies in the Maintenance of the Vorticity and Enstrophy of the Time-Mean Atmospheric Flow, J. Atmos. Sci., 38, 270–280, https://doi.org/10.1175/1520-0469(1981)038<0270:Otrols>2.0.Co;2, 1981.
Holopainen, E. O., Rontu, L., and Lau, N. C.: The Effect of Large-Scale Transient Eddies on the Time-Mean Flow in the Atmosphere, J. Atmos. Sci., 39, 1972–1984, https://doi.org/10.1175/1520-0469(1982)039<1972:Teolst>2.0.Co;2, 1982.
Hong, S. K., Ryoo, S. B., Kim, J., and Lee, S. S.: Prediction of Asian Dust Days over Northern China Using the KMA-ADAM2 Model, Weather Forecast., 34, 1777–1787, https://doi.org/10.1175/waf-d-19-0008.1, 2019.
Huang, B. Y., Thorne, P. W., Banzon, V. F., Boyer, T., Chepurin, G., Lawrimore, J. H., Menne, M. J., Smith, T. M., Vose, R. S., and Zhang, H. M.: Extended Reconstructed Sea Surface Temperature, Version 5 (ERSSTv5): Upgrades, Validations, and Intercomparisons, J. Climate, 30, 8179–8205, https://doi.org/10.1175/jcli-d-16-0836.1, 2017a.
Huang, B. Y., Thorne, P. W., Banzon, V. F., Boyer, T., Chepurin, G., Lawrimore, J. H., Menne, M. J., Smith, T. M., Vose, R. S., and Zhang, H. M.: NOAA Extended Reconstructed Sea Surface Temperature (ERSST), Version 5, NOAA National Centers for Environmental Information [data set], https://doi.org/10.7289/V5T72FNM, 2017b.
Huang, J. P., Lin, B., Minnis, P., Wang, T. H., Wang, X., Hu, Y. X., Yi, Y. H., and Ayers, J. K.: Satellite-based assessment of possible dust aerosols semi-direct effect on cloud water path over East Asia, Geophys. Res. Lett., 33, L19802, https://doi.org/10.1029/2006gl026561, 2006.
Huang, J. P., Wang, T. H., Wang, W. C., Li, Z. Q., and Yan, H. R.: Climate effects of dust aerosols over East Asian arid and semiarid regions, J. Geophys. Res.-Atmos., 119, 11398–11416, https://doi.org/10.1002/2014jd021796, 2014.
Huang, J. P., Liu, J. J., Chen, B., and Nasiri, S. L.: Detection of anthropogenic dust using CALIPSO lidar measurements, Atmos. Chem. Phys., 15, 11653–11665, https://doi.org/10.5194/acp-15-11653-2015, 2015.
Huang, X., Song, Y., Zhao, C., Li, M. M., Zhu, T., Zhang, Q., and Zhang, X. Y.: Pathways of sulfate enhancement by natural and anthropogenic mineral aerosols in China, J. Geophys. Res.-Atmos., 119, 14165–14179, https://doi.org/10.1002/2014jd022301, 2014.
Huang, Y. H., Liu, X. D., Yin, Z. Y., and An, Z. S.: Global Impact of ENSO on Dust Activities with Emphasis on the Key Region from the Arabian Peninsula to Central Asia, J. Geophys. Res.-Atmos., 126, e2020JD034068, https://doi.org/10.1029/2020jd034068, 2021.
Hurrell, J. W.: Decadal Trends in the North Atlantic Oscillation: Regional Temperatures and Precipitation, Science, 269, 676–679, https://doi.org/10.1126/science.269.5224.676, 1995.
Ji, L. Q. and Fan, K.: Climate prediction of dust weather frequency over northern China based on sea-ice cover and vegetation variability, Clim. Dynam., 53, 687–705, https://doi.org/10.1007/s00382-018-04608-w, 2019.
Jin, F. F., Pan, L. L., and Watanabe, M.: Dynamics of synoptic eddy and low-frequency flow interaction. Part I: A linear closure, J. Atmos. Sci., 63, 1677–1694, https://doi.org/10.1175/jas3715.1, 2006.
Kang, L. T., Huang, J. P., Chen, S. Y., and Wang, X.: Long-term trends of dust events over Tibetan Plateau during 1961-2010, Atmos. Environ., 125, 188–198, https://doi.org/10.1016/j.atmosenv.2015.10.085, 2016.
Kaufman, Y. J., Tanre, D., and Boucher, O.: A satellite view of aerosols in the climate system, Nature, 419, 215–223, https://doi.org/10.1038/nature01091, 2002.
Kurosaki, Y. and Mikami, M.: Recent frequent dust events and their relation to surface wind in East Asia, Geophys. Res. Lett., 30, 1736, https://doi.org/10.1029/2003gl017261, 2003.
Kutiel, H. and Furman, H.: Dust storms in the Middle East: Sources of origin and their temporal characteristics, Indoor Built Environ., 12, 419–426, https://doi.org/10.1177/1420326x03037110, 2003.
Lackmann, G.: Midlatitude Synoptic Meteorology: Dynamics, Analysis, and Forecasting, American Meteorological Society Publications, Boston, America, 41–55, ISBN9781878220103, 2012.
Lau, N. C. and Nath, M. J.: Variability of the Baroclinic and Barotropic Transient Eddy Forcing Associated with Monthly Changes in the Midlatitude Storm Tracks, J. Atmos. Sci., 48, 2589–2613, https://doi.org/10.1175/1520-0469(1991)048<2589:Votbab>2.0.Co;2, 1991.
Lee, E. H. and Sohn, B. J.: Examining the impact of wind and surface vegetation on the Asian dust occurrence over three classified source regions, J. Geophys. Res.-Atmos., 114, D06205, https://doi.org/10.1029/2008jd010687, 2009.
Li, J., Garshick, E., Huang, S. D., and Koutrakis, P.: Impacts of El Nino-Southern Oscillation on surface dust levels across the world during 1982-2019, Sci. Total Environ., 769, 144566, https://doi.org/10.1016/j.scitotenv.2020.144566, 2021.
Li, J. P. and Wang, J. X. L.: A new North Atlantic Oscillation index and its variability, Adv. Atmos. Sci., 20, 661–676, https://doi.org/10.1007/BF02915394, 2003.
Li, J. P., Zheng, F., Sun, C., Feng, J., and Wang, J.: Pathways of Influence of the Northern Hemisphere Mid-high Latitudes on East Asian Climate: A Review, Adv. Atmos. Sci., 36, 902–921, https://doi.org/10.1007/s00376-019-8236-5, 2019.
Li, M. Y., Yao, Y., Simmonds, I., Luo, D., Zhong, L., and Pei, L.: Linkages between the atmospheric transmission originating from the North Atlantic Oscillation and persistent winter haze over Beijing, Atmos. Chem. Phys., 21, 18573–18588, https://doi.org/10.5194/acp-21-18573-2021, 2021.
Li, X. and Liu, X. D.: Relation of Spring Dust-Storm Activities in Northern China and Changes of Upper Westerlies, Plateau. Meteorology, 34, 1292–1300, 2015 (in Chinese).
Li, Y., Li, J. P., Zhang, W. J., Chen, Q. L., Feng, J., Zheng, F., Wang, W., and Zhou, X.: Impacts of the Tropical Pacific Cold Tongue Mode on ENSO Diversity Under Global Warming, J. Geophys. Res.-Oceans, 122, 8524–8542, https://doi.org/10.1002/2017jc013052, 2017.
Li, Y., Zhang, J. Y., Lu, Y., Zhu, J. L., and Feng, J.: Characteristics of Transient Eddy Fluxes during Blocking Highs Associated with Two Cold Events in China, Atmosphere, 10, 235, https://doi.org/10.3390/atmos10050235, 2019a.
Li, Y., Lu, Y., and Wang, C. H.: Characteristics of thermal and momentum transport during the lifetime of Ural blocking highs, Int. J. Climatol., 40, 77–93, https://doi.org/10.1002/joc.6195, 2019b.
Li, Y., Song, Y. G., Kaskaoutis, D. G., Zhang, X. X., Chen, X. L., Shukurov, N., and Orozbaev, R.: Atmospheric dust dynamics over Central Asia: A perspective view from loess deposits, Gondwana Res., 109, 150–165, https://doi.org/10.1016/j.gr.2022.04.019, 2022a.
Li, Y., Hu, X. L., Wang, X., and Ji, M. X.: Impact of transient eddy fluxes on the dust storm event: Cases study in South Xinjiang, China, Atmos. Res., 269, 106054, https://doi.org/10.1016/j.atmosres.2022.106054, 2022b.
Lin, H. and Wu, Z. W.: Contribution of the Autumn Tibetan Plateau Snow Cover to Seasonal Prediction of North American Winter Temperature, J. Climate, 24, 2801–2813, https://doi.org/10.1175/2010jcli3889.1, 2011.
Liu, J., Wu, D. Y., Liu, G. J., Mao, R., Chen, S. Y., Ji, M. X., Fu, P. Q., Sun, Y. L., Pan, X. L., Jin, H. C., Zhou, Y. B., and Wang, X.: Impact of Arctic amplification on declining spring dust events in East Asia, Clim. Dynam., 54, 1913–1935, https://doi.org/10.1007/s00382-019-05094-4, 2020.
Liu, X. D. and Yin, Z. Y.: Spatial and temporal variation of summer precipitation over the eastern Tibetan Plateau and the North Atlantic oscillation, J. Climate, 14, 2896–2909, https://doi.org/10.1175/1520-0442(2001)014<2896:Satvos>2.0.Co;2, 2001.
Liu, X. D., Yin, Z. Y., Zhang, X. Y., and Yang, X. C.: Analyses of the spring dust storm frequency of northern China in relation to antecedent and concurrent wind, precipitation, vegetation, and soil moisture conditions, J. Geophys. Res.-Atmos., 109, D16210, https://doi.org/10.1029/2004jd004615, 2004.
Liu, Y., Zhang, J., Zhou, P., Lin, T., Hong, J., Shi, L., Yao, F., Wu, J., Guo, H., and de Leeuw, G.: Satellite-based estimate of the variability of warm cloud properties associated with aerosol and meteorological conditions, Atmos. Chem. Phys., 18, 18187–18202, https://doi.org/10.5194/acp-18-18187-2018, 2018.
Mao, R., Ho, C. H., Shao, Y., Gong, D. Y., and Kim, J.: Influence of Arctic Oscillation on dust activity over northeast Asia, Atmos. Environ., 45, 326–337, https://doi.org/10.1016/j.atmosenv.2010.10.020, 2011.
Moulin, C., Lambert, C. E., Dulac, F., and Dayan, U.: Control of atmospheric export of dust from North Africa by the North Atlantic oscillation, Nature, 387, 691–694, https://doi.org/10.1038/42679, 1997.
Nie, W., Ding, A. J., Wang, T., Kerminen, V. M., George, C., Xue, L. K., Wang, W. X., Zhang, Q. Z., Petaja, T., Qi, X. M., Gao, X. M., Wang, X. F., Yang, X. Q., Fu, C. B., and Kulmala, M.: Polluted dust promotes new particle formation and growth, Sci. Rep., 4, 6634, https://doi.org/10.1038/srep08949, 2015.
Qian, W. H.: Physical decomposition principle of regional-scale atmospheric transient anomaly, J. Geophys., 55, 1439–1448, https://doi.org/10.6038/j.issn.0001-5733.2012.05.002, 2012 (in Chinese).
Sassen, K., DeMott, P. J., Prospero, J. M., and Poellot, M. R.: Saharan dust storms and indirect aerosol effects on clouds: CRYSTAL-FACE results, Geophys. Res. Lett., 30, 1633, https://doi.org/10.1029/2003GL017371, 2003.
Shao, T. H. and Zhang, Y. C.: Influence of Winter North Atlantic Oscillation on Spring Precipitation in China, Plateau. Meteorology, 31, 1225–1233, 2012 (in Chinese).
Sokolik, I. N. and Toon, O. B.: Direct radiative forcing by anthropogenic airborne mineral aerosols, Nature, 381, 681–683, https://doi.org/10.1038/381681a0, 1996.
Solomon, A. B.: An observational study of the spatial and temporal scales of transient eddy sensible heat fluxes, J. Climate, 10, 508–520, https://doi.org/10.1175/1520-0442(1997)010<0508:Aosots>2.0.Co;2, 1997.
Tang, H. Y., Zhai, P. M., and Chang, Y. K.: SVD Analysis between Northern Hemisphere 500 hPa Heights and Spring Duststorms over Northern China, J. Dersert. Res., 25, 570–576, https://doi.org/10.3321/j.issn:1000-694X.2005.04.020, 2005 (in Chinese).
Trenberth, K. E.: An assessment of the impact of transient eddies on the zonal flow during a blocking episode using localized Eliassen-Palm flux diagnostics, J. Atmos. Sci., 43, 2070–2087, https://doi.org/10.1175/1520-0469(1986)043<2070:Aaotio>2.0.Co;2, 1986.
Walker, G. T.: Correlations in seasonal variations of weather IX, Indian Meteor. Dept., 24, 275–332, 1924.
Wang, X., Liu, J., Che, H. Z., Ji, F., and Liu, J. J.: Spatial and temporal evolution of natural and anthropogenic dust events over northern China, Sci. Rep., 8, 2141, https://doi.org/10.1038/s41598-018-20382-5, 2018.
Wang, X. M., Zhai, P. M., and Wang, C. C.: Variations in extratropical cyclone activity in northern East Asia, Adv. Atmos. Sci., 26, 471–479, https://doi.org/10.1007/s00376-009-0471-8, 2009.
Wang, Y. B. and Shi, N.: Relation of North Atlantic Oscillation Anomaly to China Climate during 1951–1995, Trans. Atmos. Sci., 24, 315–322, https://doi.org/10.3969/j.issn.1674-7097.2001.03.003, 2001 (in Chinese).
Wang, Z. Q., Yang, S., Lau, N. C., and Duan, A. M.: Teleconnection between Summer NAO and East China Rainfall Variations: A Bridge Effect of the Tibetan Plateau, J. Climate, 31, 6433–6444, https://doi.org/10.1175/jcli-d-17-0413.1, 2018.
Washington, R., Todd, M., Middleton, N. J., and Goudie, A. S.: Dust-storm source areas determined by the total ozone monitoring spectrometer and surface observations, Ann. Assoc. Am. Geogr., 93, 297–313, https://doi.org/10.1111/1467-8306.9302003, 2003.
Watanabe, M.: Asian jet waveguide and a downstream extension of the North Atlantic Oscillation, J. Climate, 17, 4674–4691, https://doi.org/10.1175/jcli-3228.1, 2004.
Watanabe, M. and Kimoto, M.: Atmosphere-ocean thermal coupling in the North Atlantic: A positive feedback, Q. J. Roy. Meteor. Soc., 126, 3343–3369, https://doi.org/10.1002/qj.49712657017, 2000.
Wilcox, L. J., Liu, Z., Samset, B. H., Hawkins, E., Lund, M. T., Nordling, K., Undorf, S., Bollasina, M., Ekman, A. M. L., Krishnan, S., Merikanto, J., and Turner, A. G.: Accelerated increases in global and Asian summer monsoon precipitation from future aerosol reductions, Atmos. Chem. Phys., 20, 11955–11977, https://doi.org/10.5194/acp-20-11955-2020, 2020.
Wu, J., Kurosaki, Y., Shinoda, M., and Kai, K. J.: Regional Characteristics of Recent Dust Occurrence and Its Controlling Factors in East Asia, Sola, 12, 187–191, https://doi.org/10.2151/sola.2016-038, 2016.
Wu, Z. W., Wang, B., Li, J. P., and Jin, F. F.: An empirical seasonal prediction model of the east Asian summer monsoon using ENSO and NAO, J. Geophys. Res.-Atmos., 114, D18120, https://doi.org/10.1029/2009jd011733, 2009.
Yang, Y., Russell, L. M., Lou, S. J., Liao, H., Guo, J. P., Liu, Y., Singh, B., and Ghan, S. J.: Dust-wind interactions can intensify aerosol pollution over eastern China, Nat. Commun., 8, 15333, https://doi.org/10.1038/ncomms15333, 2017.
Yang, Y., Zeng, L., Wang, H., Wang, P., and Liao, H.: Dust pollution in China affected by different spatial and temporal types of El Niño, Atmos. Chem. Phys., 22, 14489–14502, https://doi.org/10.5194/acp-22-14489-2022, 2022.
Yao, W. R., Gui, K., Wang, Y. Q., Che, H. Z., and Zhang, X. Y.: Identifying the dominant local factors of 2000–2019 changes in dust loading over East Asia, Sci. Total Environ., 777, 146064, https://doi.org/10.1016/j.scitotenv.2021.146064, 2021.
Yao, Y., Zhang, W. Q., Luo, D. H., Zhong, L. H., and Pei, L.: Seasonal Cumulative Effect of Ural Blocking Episodes on the Frequent Cold events in China during the Early Winter of 2020/21, Adv. Atmos. Sci., 39, 609–624, https://doi.org/10.1007/s00376-021-1100-4, 2022.
Yin, Z. C., Wan, Y., Zhang, Y. J., and Wang, H. J.: Why super sandstorm 2021 in North China?, Natl. Sci. Rev., 9, nwab165, https://doi.org/10.1093/nsr/nwab165, 2021.
Yu, B., Lin, H., Wu, Z. W., and Merryfield, W. J.: Relationship between North American winter temperature and large-scale atmospheric circulation anomalies and its decadal variation, Environ. Res. Lett., 11, 074001, https://doi.org/10.1088/1748-9326/11/7/074001, 2016.
Yu, X. C., Wang, Z. L., Zhang, H., and Zhao, S. Y.: Impacts of different types and intensities of El Niño events on winter aerosols over China, Sci. Total Environ., 655, 766–780, https://doi.org/10.1016/j.scitotenv.2018.11.090, 2019.
Zender, C. S., Miller, R. L., and Tegen, I.: Quantifying mineral dust mass budgets:Terminology, constraints, and current estimates, Eos, Transactions American Geophysical Union, 85, 509–512, https://doi.org/10.1029/2004EO480002, 2004.
Zhang, C. X., Liu, C., Hu, Q. H., Cai, Z. N., Su, W. J., Xia, C. Z., Zhu, Y. Z., Wang, S. W., and Liu, J. G.: Satellite UV-Vis spectroscopy: implications for air quality trends and their driving forces in China during 2005–2017, Light-Sci. Appl., 8, 100, https://doi.org/10.1038/s41377-019-0210-6, 2019.
Zhang, L., Zhang, H. S., Li, Q. H., Cai, X. H., and Song, Y.: Vertical dispersion mechanism of long-range transported dust in Beijing: Effects of atmospheric turbulence, Atmos. Res., 269, 106033, https://doi.org/10.1016/j.atmosres.2022.106033, 2022.
Zhang, P., Wu, Z. W., and Jin, R.: How can the winter North Atlantic Oscillation influence the early summer precipitation in Northeast Asia: effect of the Arctic sea ice, Clim. Dynam., 56, 1989–2005, https://doi.org/10.1007/s00382-020-05570-2, 2021.
Zhang, W. J., Wang, L., Xiang, B. Q., Qi, L., and He, J. H.: Impacts of two types of La Nina on the NAO during boreal winter, Clim. Dynam., 44, 1351–1366, https://doi.org/10.1007/s00382-014-2155-z, 2015.
Zhang, X. Y., Gong, S. L., Zhao, T. L., Arimoto, R., Wang, Y. Q., and Zhou, Z. J.: Sources of Asian dust and role of climate change versus desertification in Asian dust emission, Geophys. Res. Lett., 30, 2272, https://doi.org/10.1029/2003gl018206, 2003.
Zhang, X. Y., Wang, Y. Q., Niu, T., Zhang, X. C., Gong, S. L., Zhang, Y. M., and Sun, J. Y.: Atmospheric aerosol compositions in China: spatial/temporal variability, chemical signature, regional haze distribution and comparisons with global aerosols, Atmos. Chem. Phys., 12, 779–799, https://doi.org/10.5194/acp-12-779-2012, 2012.
Zhao, S., Li, J. P., and Sun, C.: Decadal variability in the occurrence of wintertime haze in central eastern China tied to the Pacific Decadal Oscillation, Sci. Rep., 6, 27424, https://doi.org/10.1038/srep27424, 2016.
Zhao, Y., Li, H. J., and He, Q.: Variation of dust strom days in Tarim Basin and its relation with North Atlantic Oscillation, J. Dersert. Res., 32, 1082–1088, 2012 (in Chinese).
Zuo, J. Q., Ren, H. L., and Li, W. J.: Contrasting Impacts of the Arctic Oscillation on Surface Air Temperature Anomalies in Southern China between Early and Middle-to-Late Winter, J. Climate, 28, 4015–4026, https://doi.org/10.1175/jcli-d-14-00687.1, 2015.


