the Creative Commons Attribution 4.0 License.
the Creative Commons Attribution 4.0 License.
 | 22 May 2023
A seasonal analysis of aerosol NO3− sources and NOx oxidation pathways in the Southern Ocean marine boundary layer
Jessica M. Burger
Emily Joyce
Meredith G. Hastings
Kurt A. M. Spence
Katye E. Altieri
Nitrogen oxides, collectively referred to as NOx (NO + NO2), are an important component of atmospheric chemistry involved in the production and destruction of various oxidants that contribute to the oxidative capacity of the troposphere. The primary sink for NOx is atmospheric nitrate, which has an influence on climate and the biogeochemical cycling of reactive nitrogen. NOx sources and NOx-to-NO formation pathways remain poorly constrained in the remote marine boundary layer of the Southern Ocean, particularly outside of the more frequently sampled summer months. This study presents seasonally resolved measurements of the isotopic composition (δ15N, δ18O, and Δ17O) of atmospheric nitrate in coarse-mode (> 1 µm) aerosols, collected between South Africa and the sea ice edge in summer, winter, and spring. Similar latitudinal trends in δ15N–NO were observed in summer and spring, suggesting similar NOx sources. Based on δ15N–NO, the main NOx sources were likely a combination of lightning, biomass burning, and/or soil emissions at the low latitudes, as well as oceanic alkyl nitrates and snowpack emissions from continental Antarctica or the sea ice at the mid-latitudes and high latitudes, respectively. Snowpack emissions associated with photolysis were derived from both the Antarctic snowpack and snow on sea ice. A combination of natural NOx sources, likely transported from the lower-latitude Atlantic, contribute to the background-level NO observed in winter, with the potential for a stratospheric NO source evidenced by one sample of Antarctic origin. Greater values of δ18O–NO in spring and winter compared to summer suggest an increased influence of oxidation pathways that incorporate oxygen atoms from O3 into the end product NO (i.e. N2O5, DMS, and halogen oxides (XO)). Significant linear relationships between δ18O and Δ17O suggest isotopic mixing between H2O(v) and O3 in winter and isotopic mixing between H2O(v) and O3/XO in spring. The onset of sunlight in spring, coupled with large sea ice extent, can activate chlorine chemistry with the potential to increase peroxy radical concentrations, contributing to oxidant chemistry in the marine boundary layer. As a result, isotopic mixing with an additional third end-member (atmospheric O2) occurs in spring.
- Article
(4654 KB) - Full-text XML
-
Supplement
(1095 KB) - BibTeX
- EndNote


The atmosphere of the Southern Ocean is geographically remote from major anthropogenic influences. Although there is evidence of microplastics and at times long-range transport of anthropogenic pollution (Jacobi et al., 2000; Obbard, 2018), the Southern Ocean marine boundary layer (MBL) is one of the few regions dominated by natural sources, and as such at times it can serve as a proxy for the pre-industrial atmosphere. The pre-industrial atmosphere is used as a baseline for comparing the magnitude of anthropogenic impacts on climate (e.g. Haywood and Boucher, 2000; Hamilton et al., 2014; Schmale et al., 2019).
Nitrogen oxides (NOx = NO + NO2) are an important part of biogeochemical cycling and influence the oxidative capacity of the troposphere as they are involved in the production and destruction of ozone and hydroxyl radicals (Lawrence and Crutzen, 1999; Finlayson-Pitts and Pitts, 2000). The primary sink for NOx is atmospheric nitrate (NO), which impacts both air quality and climate by influencing particulate matter load and Earth's radiative heat budget (IPCC, 2013; Park and Kim, 2005).
The logistical difficulties of measurement campaigns to the remote Southern Ocean, particularly in winter, have resulted in a lack of observational data from this region, including data on NOx sources and sinks (Paton-Walsh et al., 2022). Consequently, the seasonality of NOx cycling remains poorly constrained in the Southern Ocean MBL. Globally, fossil fuel combustion is the primary NOx source (van der A et al., 2008), far exceeding natural emissions like biomass burning (Finlayson-Pitts and Pitts, 2000), soil processes (Davidson and Kingerlee, 1997), and lightning (Schumann and Huntrieser, 2007). However, regional budgets of NOx sources can have a variety of anthropogenic and natural contributors. In the summertime Southern Ocean MBL, natural NOx sources are the main contributors to atmospheric NO formation (Morin et al., 2009; Burger et al., 2022a). Along the South African coastline, these natural NOx sources include a combination of lightning, biomass burning, and soil emissions (Morin et al., 2009). In coastal Antarctica, or near the marginal ice zone, NOx emitted from snow cover serves as the main precursor to atmospheric NO (Savarino et al., 2007; Morin et al., 2009; Shi et al., 2021; Burger et al., 2022a). Over the mid-latitude region of the Southern Ocean, sea surface emissions of a group of nitrogen gases referred to as alkyl nitrates (RONO2) have recently been proposed as a NOx source leading to NO formation in the MBL (Fisher et al., 2018; Burger et al., 2022a). During winter, NOx sources to the Antarctic troposphere primarily include long-range-transported peroxyacetyl nitrate (PAN) and stratospheric inputs (Savarino et al., 2007; Lee et al., 2014; Walters et al., 2019). To our knowledge, however, there are no observational data regarding NOx sources from the Southern Ocean MBL during winter and few observations in spring.
In addition to there being multiple NOx sources across the Southern Ocean MBL, several different oxidation pathways can be responsible for NOx-to-NO conversion, varying with chemistry and time of day (Savarino et al., 2007). Once emitted, NO is rapidly oxidized by ozone (O3) (Reaction R1), peroxy radicals (RO2 or HO2) (Reaction R2), and/or halogen oxides (XO, where X = Br, Cl, or I) (Reaction R3) to NO2.
Under sunlit conditions, NO2 is readily photolysed to regenerate NO and O3 (Reaction R4). The recycling of NOx between NO and NO2 happens much faster than NOx oxidation to NO during the day (Michalski et al., 2003). On a global scale, NO is primarily oxidized to NO2 by O3, followed by HO2 and RO2, while NO-to-NO2 oxidation via XO is relatively minor (Alexander et al., 2020).
During summer in the Southern Ocean MBL, NO2 is subsequently oxidized primarily by hydroxyl radicals (OH) to form HNO3 (Reaction R5).
In winter, under dark conditions, when the photolytic production of OH stops, NO2 is oxidized primarily by O3 to form nitrate radicals (NO3) (Reaction R6). NO3 can then react with NO2 to form dinitrogen pentoxide (N2O5) followed by hydrolysis on a wet particle surface to form HNO3 (Reactions R7–R8).
Alternatively, HNO3 can be formed by the reaction of NO3 with hydrocarbons (HC) (e.g. dimethylsulfide, DMS) (Reaction R9).
Lastly, halogen chemistry may result in NO formation via the production and subsequent hydrolysis of halogen nitrates (Reactions R10–R11), as has been suggested for coastal Antarctica in summer (Baugitte et al., 2012).
The nitrogen (N) and oxygen (O) isotopic composition of atmospheric NO provides information regarding NOx sources and NO formation pathways (i.e. NO oxidation to NO2 and NO2 oxidation to NO). This technique has been applied in polluted (Elliot et al., 2007; Zong et al., 2017), open-ocean (Hastings et al., 2003; Altieri et al., 2013; Kamezaki et al., 2019; Burger et al., 2022a), and polar environments (Walters et al., 2019). Stable isotope ratios are reported as the ratio of the heavy to light isotopologues of a sample relative to the constant isotopic ratio of a reference standard using delta (δ) notation in units of “per mil” (‰) following Eq. (1):
where R represents the ratio of 15N 14N, 18O 16O, or 17O 16O in the sample and in the reference standard, respectively. The reference for O is Vienna Standard Mean Ocean Water (VSMOW), and for N it is atmospheric N2 (Bölhke et al., 2003).
The N isotopic composition of atmospheric NO (δ15N–NO) largely reflects the δ15N of different precursor NOx emissions (e.g. Elliott et al., 2019, and references therein) but can be influenced by isotopic fractionation during NOx cycling and NOx-to-NO conversion (Walters and Michalski 2015; Walters et al., 2016; Li et al., 2021). δ15N–NO is therefore useful for constraining NOx sources. For example, biomass burning may produce NOx with a δ15N range of −7 ‰ to 12 ‰ (Fibiger and Hastings, 2016), while soils lead to NOx emissions with relatively low δ15N signatures (−44.2 ‰ to −14.0 ‰; Miller et al., 2018). More relevant to the remote Southern Ocean is lightning NOx, which has a δ15N signature of approximately 0 ‰ (Hoering, 1957). This is distinct from the snowpack NOx source, which typically has a very low δ15N signature (Berhanu et al., 2014, 2015) on the order of −50 ‰ to −20 ‰ (Wagenbach et al., 1998; Winton et al., 2020), depending on the degree of snowpack NO 15N enrichment (Shi et al., 2018). Savarino et al. (2007) derived an Antarctic stratospheric NOx source signature of 19 ± 3 ‰. Additionally, Burger et al. (2022a) estimated the δ15N signature of NOx produced by surface ocean RONO2 emissions over the mid-latitude Southern Ocean to be −21.8 ± 7.6 ‰.
The O isotopic composition of atmospheric NO (δ18O–NO and Δ17O–NO) reflects the oxidants responsible for NO formation, as atmospheric oxidants have distinct O isotope signatures (Michalski et al., 2012). δ18O–NO and Δ17O–NO are thus useful for identifying pathways of NO production (Michalski et al., 2003; Hastings et al., 2003; Alexander et al., 2020). O3 possesses a distinctively large 17O excess as a result of non-mass-dependent isotope fractionation. This 17O excess is expressed as Δ17O = δ17O − 0.52 × δ18O (Berhanu et al., 2012). Non-mass-dependent fractionation occurs in the troposphere and is thought to originate from asymmetric molecules of excited ozone (O) that lose excess energy via stabilization to the product O3 (Heidenreich and Thiemens, 1986; Ireland et al., 2020). As a result, O3 possesses a uniquely high terminal Δ17O = 39.2 ± 2 ‰ (Vicars and Savarino, 2014) that can be transferred to NO during oxidation reactions between NOx and O3 (Thiemens, 2006; Savarino et al., 2008; Michalski and Bhattacharya, 2009) or NOx and other oxidants like XO where the oxygen atom originated from O3 (Savarino et al., 2016). Δ17O–NO therefore can serve as a proxy for the influence of O3 and/or XO during NO formation (Berhanu et al., 2012).
O3 also has a uniquely high terminal δ18O = 126.3 ± 11.9 ‰ (Vicars and Savarino, 2014) compared to other oxidants that have a Δ17O of 0 ‰ and much lower δ18O signatures (Michalski et al., 2003, 2012). For example, atmospheric O2 has a δ18O of 23.9 ‰, and the δ18O values of OH and H2O are negative (Michalski et al., 2012). As such, a higher δ18O or Δ17O for atmospheric NO reflects the increased influence of O3 and/or XO on NO formation, while a lower δ18O or Δ17O occurs when there is an increased contribution from other oxidants (Hastings et al., 2003; Fang et al., 2011; Altieri et al., 2013). Oxidation by peroxy radicals would also result in a lower δ18O and Δ17O for atmospheric nitrate because the O atom in peroxy radicals derives from atmospheric O2.
Antarctic tropospheric oxidation chemistry has been well characterized using Δ17O at coastal (Savarino et al., 2007; Ishino et al., 2017) and interior Antarctic sites (Frey et al., 2009; Savarino et al., 2016; Walters et al., 2019). A distinct seasonal cycle in Δ17O–NO is generally observed whereby a higher relative contribution from O3 oxidation and/or stratospheric input occurs during winter, and more HOx + ROx oxidation occurs during summer. The Atlantic Southern Ocean is less constrained in terms of oxidation chemistry, with some evidence that the atmospheric oxidant budget is poorly understood in unpolluted low-NOx environments (Hosaynali Beygi et al., 2011).
This study presents the first seasonally resolved dataset of coarse-mode (> 1 µm) atmospheric NO concentration and isotopic composition from the Atlantic Southern Ocean MBL. Using air mass back trajectories and observed aerosol δ15N–NO, δ18O–NO, and Δ17O–NO between Cape Town, South Africa, and the marginal ice zone, this work aims to identify how the main sources and formation pathways of NO vary over the remote Southern Ocean from winter through spring and summer.
2.1 Sample collection
Samples were collected on board the research vessel (R/V) SA Agulhas II during three voyages to and from the marginal ice zone in summer (7 to 21 December 2018 and 27 February to 15 March 2019), winter (19 July to 12 August 2019), and spring (13 October to 19 November 2019) (Fig. 1). The summer samples presented here are the same as those in Burger et al. (2022a). The winter and spring samples were collected and analysed as in Burger et al. (2022a), with any methodological modifications noted below. Briefly, all voyages departed from Cape Town (33.9∘ S, 18.4∘ E) and sailed southward along the Good Hope transect (0∘ E) until reaching Penguin Bukta (71.4∘ S, 2.5∘ W) in summer and the northern extent of the sea ice in winter (approximately 58.1∘ S) and spring (approximately 59.3∘ S). The ship then returned to Cape Town, sailing north via the Good Hope transect, with a deviation to South Georgia in the summer. In spring an additional ice edge transect was conducted during which the ship sailed from 0 to approximately 22∘ E and back before returning to Cape Town.
Size-segregated aerosols were collected on the ninth floor above the bridge (approximately 20 m above sea level), using a high-volume air sampler (HV-AS; Tisch Environmental). Air was pumped at an average flow rate of 1.3 m3 min−1 through a five-stage cascade impactor (TE-235; Tisch Environmental), loaded with pre-combusted (400 ∘C for 4 h) glass fibre filters. Given that aerosol nitrate in the MBL is predominantly present in the coarse mode (> 1 µm), only filter stages 1 through 4 were analysed. The aerodynamical diameters of particles captured by filter stages 1, 2, 3, and 4 are > 7, 3 to 7, 1.5 to 3, and 1 to 1.5 µm, respectively.
A sector collector was used to restrict HV-AS activity to avoid contamination of the filters with ship stack emissions (Campbell Scientific Africa). The HV-AS only operated if the winds were blowing at an angle less than 120∘ or greater than 240∘ from the bow of the ship during winter and less than 75∘ or greater than 190∘ from the bow of the ship during spring. These criteria were altered based on the dominant wind direction during each voyage to ensure sufficient sample collection while avoiding contamination. In addition to wind direction, the wind speed had to exceed 0 m s−1 for 10 min for the HV-AS to begin sampling. Filters were removed from the cascade impactor inside a laminar-flow cabinet (Air Science), placed in individual zip-sealed bags and stored at −20 ∘C until analysis.
An attempt was made to ensure that there was at least 24 h of in-sector sampling before removing filters from the cascade impactor to ensure atmospheric NO concentrations were sufficient for isotope analysis (Sect. 2.2.2). However, this was not always possible as on occasion filters had to be removed early due to unusual ship manoeuvres that could have resulted in sample contamination by ship stack emissions if left unattended. Sampling duration ranged from 19 to 30 h in winter and 7 to 41 h in spring (Table S1 in the Supplement).
During each voyage, a field blank was collected by fitting the cascade impactor with a set of filters and loading the HV-AS in the same manner that atmospheric samples were deployed. The cascade impactor was then immediately removed without turning on the HV-AS pump. The field blanks were removed from the cascade impactor and stored in the same manner as the atmospheric samples. All chemical analysis performed on samples was performed on the field blanks to assess any possible contamination during filter deployment or laboratory procedures.
2.2 Sample analysis
Once back on land, filters were extracted using ultra-clean deionized water (DI; 18 MΩ) under a laminar-flow cabinet (Air Science). The extraction ratio was approximately 30 to 100 cm2 of filter in 30 mL of DI. Extracts were immediately sonicated for 1 h and then stored at 4 ∘C for at least 12 h. Thereafter, extracts were filtered (0.2 µm) using an acid-washed syringe into clean 30 mL high-density polyethylene (HDPE) bottles and stored at −20 ∘C until analysis (Burger et al., 2022a).
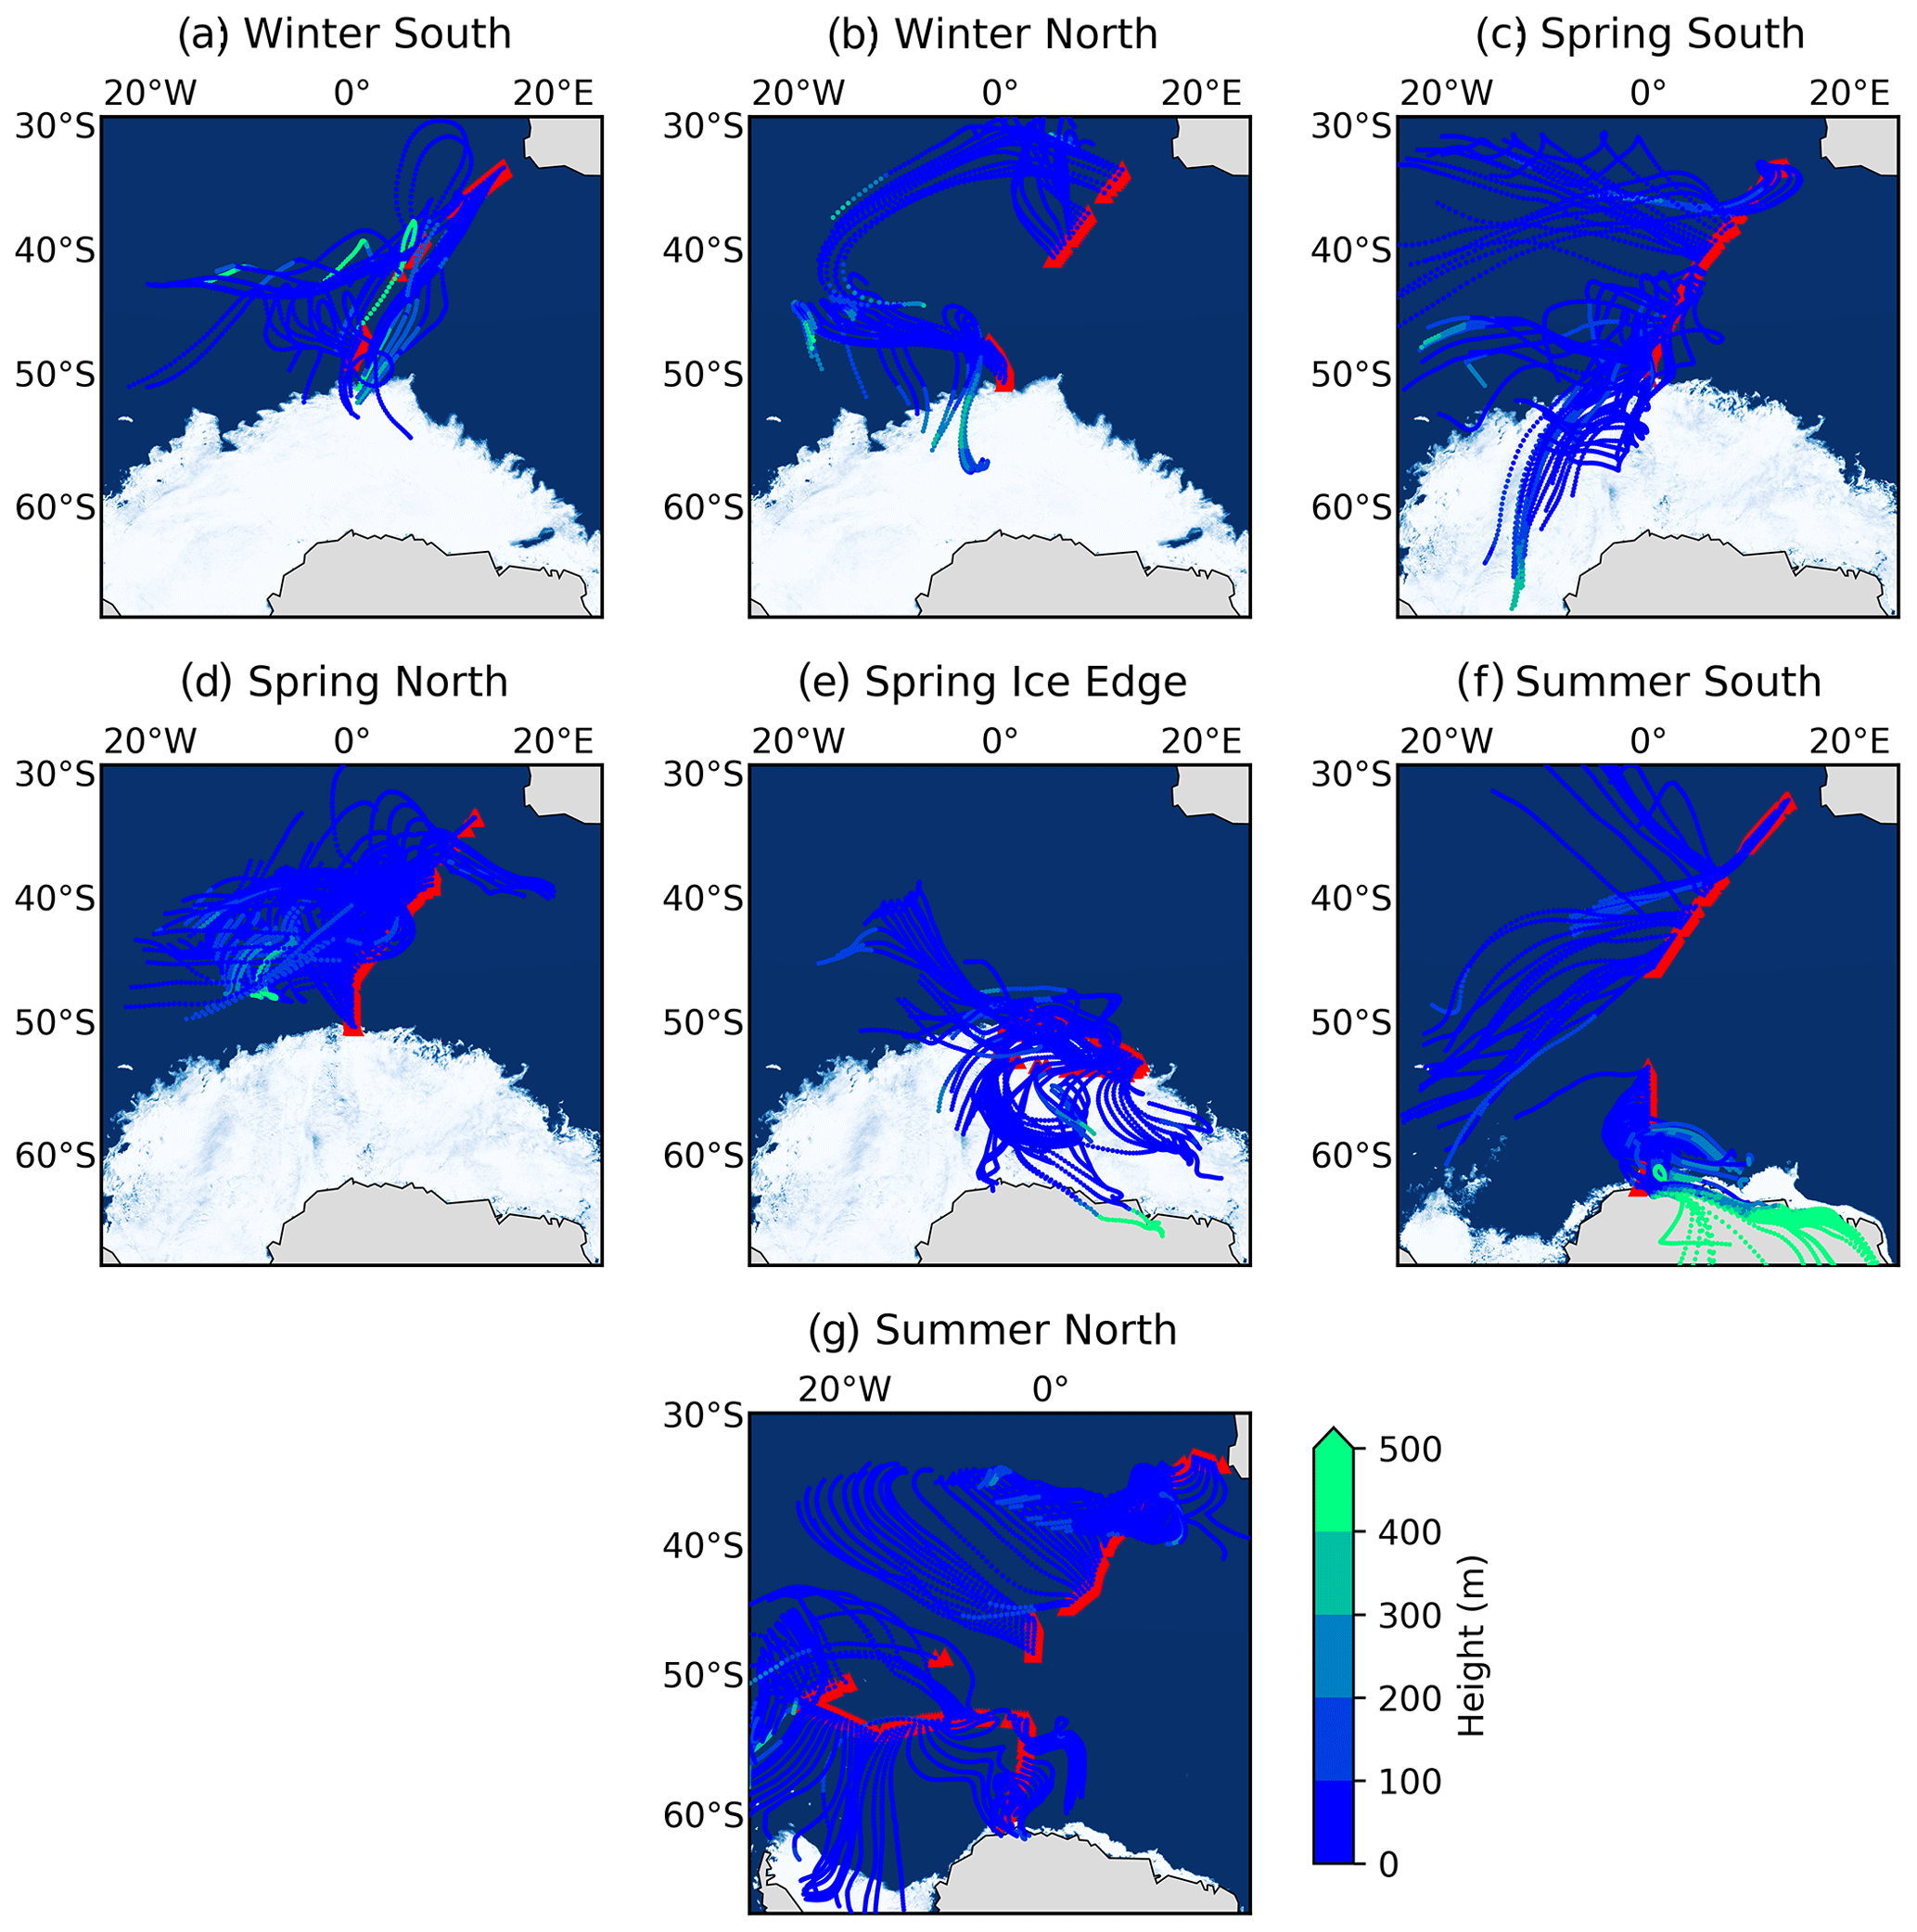
Figure 1The 72 h air mass back trajectories (AMBTs) computed for each hour of every filter deployment made in winter (19 July to 12 August 2019) on both the southbound (a: “Winter South”) and northbound (b: “Winter North”) voyages; in spring (13 October to 19 November 2019) on the southbound voyage (c: “Spring South”), northbound voyage (d: “Spring North”), and ice edge transect (e: “Spring Ice Edge”); and in summer (7 to 21 December 2018 and 27 February to 15 March 2019) on the southbound (f: “Summer South”) and northbound (g: “Summer North”) voyages. Red triangles indicate the ship's cruise track during each filter deployment. The AMBTs are coloured by height (m) (blue-to-green colour bar).
2.2.1 NO concentration analysis
[NO] was determined using a Thermo Scientific Dionex Aquion ion chromatography (IC) system equipped with an autosampler. The anion IC contained an AG22 RFIC 4 × 50 mm guard column and AG22 RFIC 4 × 250 mm analytical column. A six-point standard curve was run on each day of analysis (Dionex Seven Anion-II Standard), and an R2 value > 0.999 was required for sample analysis to proceed. Final NO concentrations were corrected by subtracting the field blanks, which represented on average 32 % and 59 % of the [NO] in winter and spring, respectively. Where the field blank had a [NO] greater than that of the sample, the sample [NO] was assumed to be zero. Samples were measured for [NO] only once to preserve sample volume for isotopic analysis (Sect. 2.2.2), motivated by the small difference between repeated sample measurements from the summertime dataset (SDp = 0.3 µmol L−1). Only samples with concentrations greater than 1 µmol L−1 where able to be measured for isotopic composition.
2.2.2 Isotopic analysis
The isotopic composition of atmospheric NO (δ15N, δ18O, and Δ17O–NO) was measured using the denitrifier method (Sigman et al., 2001; Casciotti et al., 2002; Kaiser et al., 2007). In brief, a natural strain of denitrifying bacteria, Pseudomonas aureofaciens, that lack the terminal nitrous oxide (N2O) reductase enzyme were used to convert aqueous NO quantitatively to N2O gas. The product N2O was analysed by gas-chromatograph isotope ratio mass spectrometry (IRMS) (Thermo-Scientific Delta V Plus) for simultaneous isotopic determination of 15N 14N and 18O 16O (Sigman et al., 2001; Casciotti et al., 2002). The 15N 14N of samples was corrected for the contribution of 17O to the peak at mass 45 using Δ17O determined for each sample, with values ranging from 21.7 ‰ to 44.4 ‰. International reference materials (Table S2) IAEA-N3 and USGS34 were used to normalize isotopic values to air (δ15N), and IAEA-N3, USGS34, and USGS35 were used to normalize to VSMOW (δ18O) scales. The pooled standard deviation of sample replicates and duplicates for δ15N was 0.19 ‰ (n = 16), and for δ18O it was 0.27 ‰ (n = 16). The pooled standard deviations of sample references IAEA-N3, USGS34, and USGS35 for δ15N and for δ18O are reported for each winter and spring in Table S3.
For winter and spring samples, Δ17O–NO was characterized by using a separate 50 nmol aliquot to convert NO to N2O, thermally decomposing the N2O to N2 and O2 in a gold furnace at 770 ∘C and analysing the isotopic composition of O2 for determination of 18O 16O and 17O 16O (Kaiser et al., 2007; Fibiger et al., 2013). The product O2 was referenced to USGS34 and USGS35, and a mix of USGS34 and USGS35 was also quantified within runs serving as a quality control check. The pooled standard deviations for Δ17O were 0.84 ‰ (n = 21), 0.90 ‰ (n = 21), and 0.61 ‰ (n = 18) for USGS34, USGS35, and the mix, respectively. The pooled standard deviation of sample replicates and duplicates was 0.63 ‰ in winter and 0.31 ‰ in spring.
It is important to note that given the low [NO] of the field blanks (< 1.5 µM), no isotopic analysis could be performed on the blank filters, and therefore the blank was not subtracted from the isotope results. However, we note that there was no relationship found between the blank percent contribution and δ15N–NO or δ18O–NO for spring and winter. This indicates that the measured signal is not driven by the blank contribution.
2.2.3 Seawater sampling and NO concentration analysis
Seawater samples were collected in triplicate every 2 h from the ship's underway system (position at depth approximately 5 m) for the analysis of surface ocean nitrite concentrations ([NO]). Seawater samples for NO determination were immediately frozen at −20 ∘C and stored in dark conditions until analysis. [NO] was analysed using the colorimetric method of Strickland and Parsons (1972) and Parsons et al. (1984) with a Thermo Scientific Genesys 30 visible spectrophotometer (detection limit of 0.05 µmol L−1). The majority of seawater [NO] analysis was conducted while at sea.
2.3 Air mass back trajectory analysis
Air mass back trajectories (AMBTs) were computed for each hour in which the HV-AS was operational for at least 45 min of that hour. Given that the ship was moving, a different date, time, and starting location were used to compute each AMBT. An altitude of 20 m was chosen to match the height of the HV-AS above sea level, and 72 h AMBTs were computed to account for the lifetime of NO in the atmosphere. Model estimates of the atmospheric lifetime of NO range from approximately 3 to 5 d (Lu et al., 2021). AMBTs become increasingly uncertain the further back in time they are used (Sinclair et al., 2013), particularly in the remote Southern Hemisphere. To minimize this uncertainty, the shortest possible AMBTs are generated while still accounting for the lifetime of NO (i.e. 72 h). Daily 120 h AMBTs computed for the duration of each voyage were additionally computed (see Fig. S1 in the Supplement) to confirm that even when utilizing the maximum estimate for NO atmospheric lifetime, no continental influence from southern Africa is expected. All AMBTs were computed with NOAA's Hybrid Single-Particle Lagrangian Integrated Trajectory (HYSPLIT) model (Stein et al., 2015; Rolph et al., 2017) using NCEP Global Data Assimilation System (GDAS) output, which can be accessed at https://www.ready.noaa.gov/index.php (last access: 3 May 2023) (NOAA Air Resources Laboratory, Silver Spring, Maryland).
AMBTs indicate that no samples experienced any continental influence from South Africa (Fig. 1), such that no direct anthropogenic emission sources are considered. The 72 h AMBTs confirm that the Atlantic sector of the Southern Ocean was a dominant source region for most samples collected throughout all seasons. Air masses experienced very little interaction with sea ice in winter (Fig. 1a and b), while extensive interaction with sea ice was experienced by air masses sampled in spring, particularly at the high latitudes during the southbound leg (Fig. 1c) and ice edge transect (Fig. 1e). In summer, some high-latitude air masses traversed coastal Antarctica before being sampled, particularly on the southbound leg (Fig. 1f), while some interaction with sea ice was also experienced by high-latitude air masses on both legs (Fig. 1f and g). The potential for sea ice influence is supported by the relatively low height (< 100 m) of AMBTs (Fig. 1). As a result, air masses originated from a mixture of source regions ranging from the open ocean to sea ice to Antarctic continental ice. The remoteness of all the locations from which air masses originated motivates the investigation of natural NOx sources below.
3.1 Seasonal variation in atmospheric NO concentrations
In winter, atmospheric [NO] was very low across the Atlantic Southern Ocean, ranging from 1.4 to 22.3 ng m−3 (Fig. 2a, blue diamonds). A single outlier exists with a relatively high [NO] equivalent to 222.9 ng m−3 in winter, although it is comparable to summertime [NO] (Fig. 2a, orange circles). In winter only 6 of 12 filter sample deployments contained enough NO for isotope analyses to proceed. Filter deployments containing no NO or sample concentrations < 1 µmol L−1 were excluded from Fig. 2a. In spring, atmospheric [NO] ranged from 3.3 to 74.4 ng m−3. Higher [NO] was observed at the lower latitudes and at the higher latitudes, while lower [NO] was observed in the mid-latitude Atlantic Southern Ocean (Fig. 2a, green squares). During summer atmospheric [NO] was higher than winter and spring, ranging from 19.9 to 264.0 ng m−3. In contrast to winter and spring, a distinct latitudinal trend was observed in summer whereby the [NO] decreased with increasing latitude (Fig. 2a, orange circles) (Burger et al., 2022a).
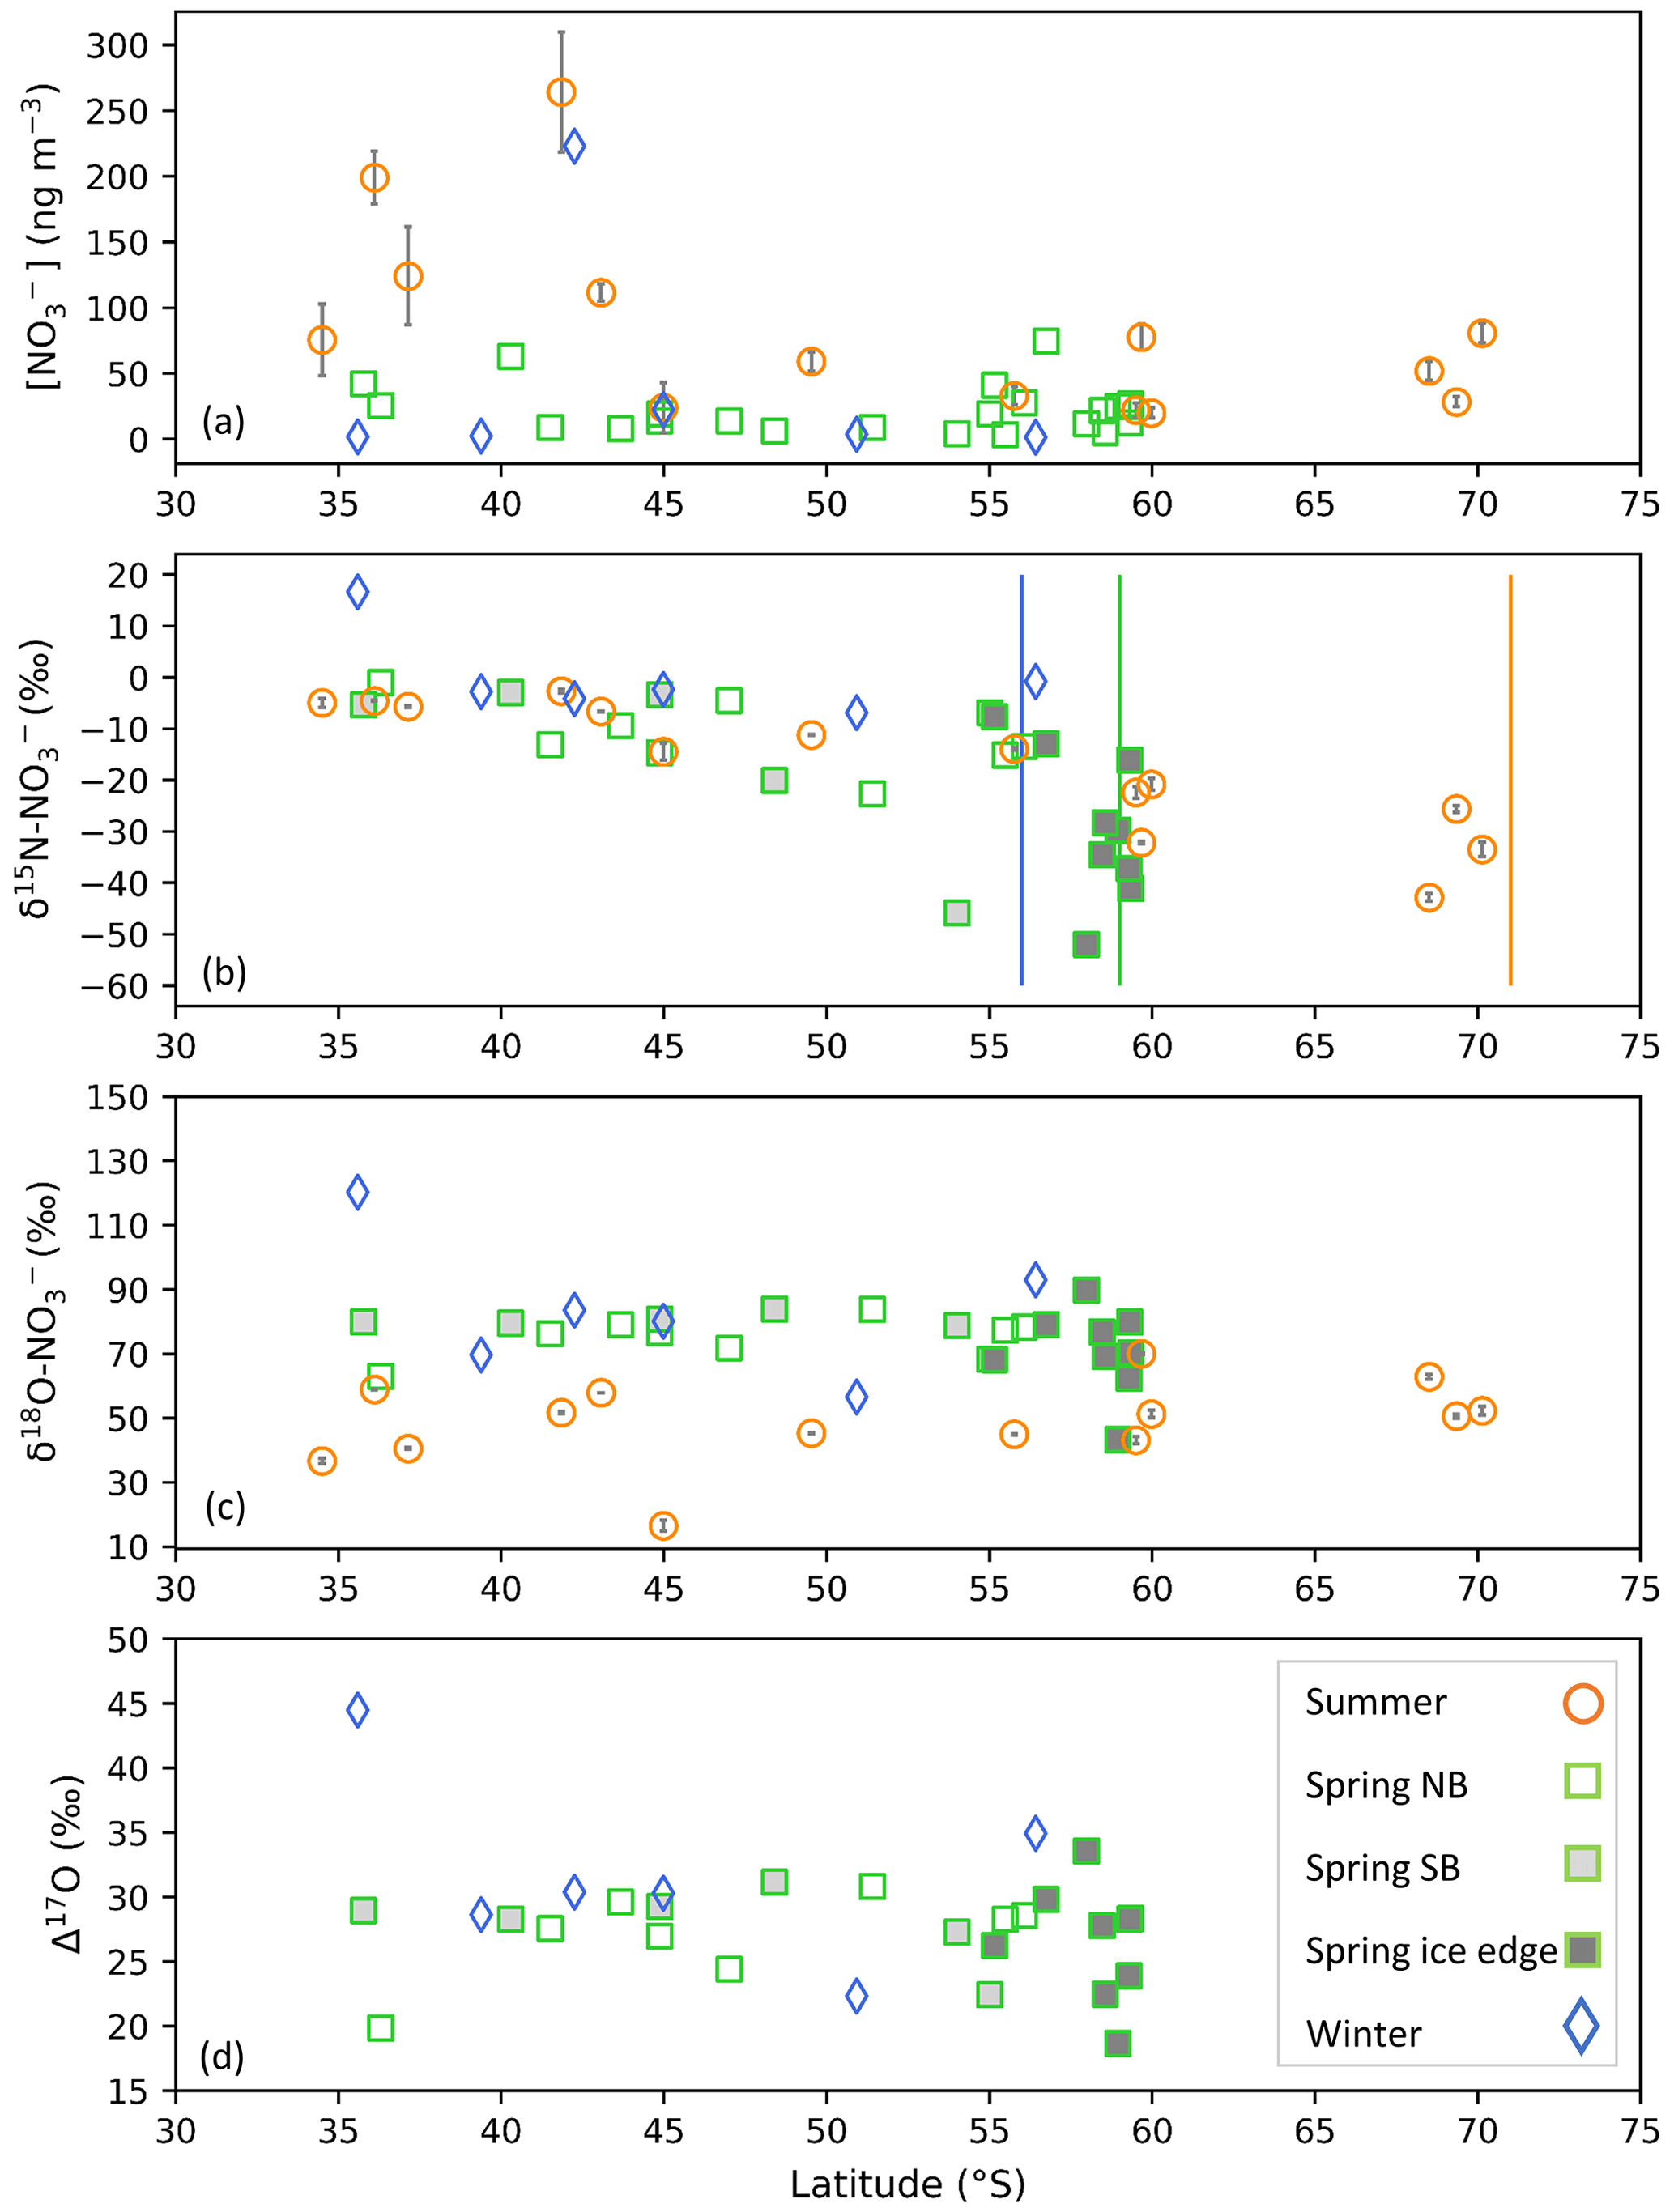
Figure 2The average coarse-mode (> 1 µm) atmospheric nitrate concentration [NO] (ng m−3) (a), weighted average δ15N of atmospheric nitrate (δ15N–NO (‰ vs. N2)) (b), δ18O of atmospheric nitrate (δ18O–NO (‰ vs. VSMOW)) (c), and Δ17O of atmospheric nitrate (Δ17O–NO (‰)) (d) as a function of latitude (∘ S). Winter, spring, and summer are denoted by blue diamonds, green squares, and orange circles, respectively. For the summer data, where error bars (±1 SD) are not visible, the standard deviation is smaller than the size of the marker. Spring data are separated into northbound (NB), southbound (SB), and ice edge legs by clear, light-grey, and dark-grey fills, respectively for panels (b)–(d). Vertical lines indicate the approximate location of the sea ice edge in summer (orange), winter (blue), and spring (green), identified visually using satellite-derived sea ice concentration obtained from passive microwave sensors of AMSR2 (Advanced Microwave Scanning Radiometer 2; Spreen et al., 2008).
The seasonal cycle in atmospheric [NO] that we observe, i.e. lowest concentrations in winter, higher in spring, and highest in summer, is similar to previous observations for the region. Atmospheric [NO] ranging from tens of nanogrammes per cubic metre to approximately 100 ng m−3 have been observed for the Southern Ocean MBL during late spring (Morin et al., 2009; Shi et al., 2021), and observations from coastal Antarctic sites in the Atlantic sector showed elevated [NO] (∼ 20 to 70 ng m−3) in late spring and early summer (Wagenbach et al., 1998; Wolff et al., 2008). Seasonal studies at coastal and inland Antarctic sites observed the lowest [NO] during winter (Wagenbach et al., 1998; Savarino et al., 2007; Wolff et al., 2008; Ishino et al., 2017; Walters et al., 2019).
The seasonality in atmospheric [NO] is largely driven by the seasonality in sunlight availability. Maximum atmospheric [NO] observed in late spring/early summer in coastal Antarctica was attributed to reactive N released from the post-depositional processing/recycling of snow NO (Savarino et al., 2007). After NO is deposited to the snowpack, it can be photochemically reduced to NOx and (re)emitted to the overlying atmosphere (Jones et al., 2000, 2001). During winter, extended periods of darkness lead to reduced photochemical activity above the snow, resulting in background-level [NO] (Lee et al., 2014). Over the open ocean, increased UV radiation in spring and summer compared to winter may lead to greater NO production from the photolytically derived oceanic RONO2 source (Fisher et al., 2018). Ground-based studies in Antarctica demonstrate that UV radiation is highest in spring and early summer, when stratospheric O3 concentrations are at a minimum, and the noon solar zenith angle is low (Aun et al., 2020; Lakkala et al., 2020). This, in addition to greater lightning NOx production during spring and summer at the lower southern latitudes (< 40∘ S) (Nesbitt et al., 2000), likely explains why higher [NO] is observed in spring and summer as compared to winter.
3.2 Seasonal variation in NOx sources
While [NO] provides valuable information regarding the seasonal and spatial variation in the quantity of tropospheric NO present, the N isotopic composition serves as a useful tool for identifying NOx sources that lead to aerosol NO formation. Here, we present and interpret the mass-weighted, coarse-mode average δ15N–NO, computed for each filter deployment. In remote environments where O3 concentrations largely exceed NOx concentrations, as is the case for the remote Southern Ocean, NOx isotopic exchange occurs at a much slower rate than the Leighton cycle reactions. Therefore, little to no equilibrium isotope fractionation is expressed, and the δ15N of NO is assumed to reflect the δ15N of the NOx source (Walters et al., 2016).
3.2.1 Evidence for stratospheric NO
There was one unusually high δ15N–NO value equivalent to 16.6 ‰ for the first filter deployment of the southbound leg in winter (Fig. 2b). Despite an elevated δ15N signature, its [NO] (1.7 ng m−3) was consistent with that of most wintertime samples. The δ15N–NO of this wintertime sample is similar to the δ15N of stratospherically sourced NO, estimated to be 19 ± 3 ‰ (Savarino et al., 2007). Stratospheric input is additionally supported by the air mass history of this sample, which indicates that air originated from as far south as the sea ice edge for the duration of the sample deployment (Fig. 1a). Near the sea ice edge, some AMBTs originate from greater heights (>400 m) and descend towards the sampling location (< 100 m) (Fig. S2). Coastal Antarctic studies suggest that the deposition of polar stratospheric clouds (PSCs) during winter results in stratospheric NO inputs to the Antarctic troposphere (Wagenbach et al., 1998; Savarino et al., 2007). Winter, when this sample was collected, is the only time of year when Antarctic temperatures are expected to be cold enough (< 195 K) for PSC formation (von Savigny et al., 2005; Wang et al., 2008).
Furthermore, this sample is unique in that it has a relatively high δ18O–NO and Δ17O–NO, 120.2 ‰ and 44.5 ‰, respectively. Tropospheric oxidation typically produces Δ17O–NO values ranging from 17.3 ‰ to 42.7 ‰ (Morin et al., 2011; Ishino et al., 2017; Walters et al., 2019). Stratospherically sourced Δ17O–NO is elevated in comparison to tropospheric Δ17O–NO because stratospheric O3 has a greater isotope anomaly than tropospheric O3, and/or dominance of the N2O5 and ClONO2 pathways allows for greater transfer of the anomaly to NO via O3 (Savarino et al., 2007; McCabe et al., 2007). High Δ17O–NO values (> ∼ 40 ‰) observed in winter are often attributed to contributions by stratospheric denitrification (Savarino et al., 2007; McCabe et al., 2007; Frey et al., 2009; Walters et al., 2019). The combination of elevated Δ17O–NO, Δ18O–NO, and δ15N–NO is consistent with a stratospheric NO source for this sample. Given the evidence that this sample likely does not reflect tropospheric oxidation chemistry, it is left out of the analysis below.
3.2.2 Transported NOx
Previous modelling studies suggest that tropospheric transport of NOx emitted in the mid-latitudes to low latitudes (i.e. soil, lightning, thermal decomposition of PAN, and fossil fuel combustion), contributes to the Antarctic NO budget in winter (Lee et al., 2014). PAN decomposition has previously been suggested as a NOx source to coastal Antarctica during winter and early spring (Savarino et al., 2007; Jones et al., 2011). However, transported NOx results in minimal NO, regarded as background-level concentrations ( ng m−3; Savoie et al., 1993; Lee et al., 2014), consistent with most of our winter observations (Fig. 2a, blue diamonds). During winter, δ15N–NO was relatively invariant across the Atlantic Southern Ocean (Fig. 2b, blue diamonds), with an average of −3.4 ± 2.1 ‰ (n = 5). This is consistent with a lack of snowpack NOx emissions at the high latitudes during July/August due to weak or absent solar radiation (Shi et al., 2022), as well as minimal influence from oceanic RONO2. Furthermore, air mass back trajectory analyses indicate that sea ice had a very minor influence on the winter samples (Fig. 1a and b).
Albeit outside of the winter months, previous studies report an average δ15N–NO for the low-latitude Atlantic Ocean (between 45∘ S and 45∘ N) on the order of −3 ‰ to −4 ‰ (Baker et al., 2007; Morin et al., 2009), attributed to a combination of natural NOx sources including lightning, biomass burning, and soil emissions (Morin et al., 2009). This is also similar to the spring observations, where higher values of δ15N–NO were observed at the lower latitudes (−3.2 ± 1.8 ‰, n = 3), i.e. equatorward of 40∘ S. As such, the winter samples and low-latitude spring samples could be representative of a combination of natural NOx sources emitted further north and transported to the mid- to low-latitude Atlantic Southern Ocean.
Not all winter samples isotopically indicative of the transported background NOx source had low [NO]. One unusually high [NO] value (222.9 ng m−3) was observed at the lower latitudes (Fig. 2a, blue diamonds). Due to the similarity in isotopic composition among winter samples, we can assume that despite a higher [NO], this sample also originated from a combination of natural NOx sources transported from the lower latitudes. Furthermore a [NO] on the order of 200 ng m−3 is consistent with summertime [NO] observations (Fig. 2a, orange circles), when natural NOx sources dominated (see Sect. 3.2.3). Our results thus confirm that, like in summer, natural NOx sources can at times lead to relatively high [NO], even in winter, when background conditions are typically experienced.
In addition, the winter dataset presented here clearly highlights the utility of the isotopes in distinguishing NOx sources. The initial winter sample had a low concentration indicative of the background conditions; however, the triple-stable-isotopic composition of the sample confirms that it originated from the stratosphere (see Sect. 3.2.1). In contrast, the anomalously high [NO] sample observed in winter was not consistent with minimal background NOx emissions; however its δ15N confirmed that this was in fact the most likely source.
3.2.3 Snowpack photolysis and oceanic NOx sources
Springtime δ15N–NO ranged from −52.0 ‰ to −1.1 ‰, and samples with the lowest δ15N–NO were observed at the high latitudes (Fig. 2b, green squares). The range in δ15N–NO observed for spring is consistent with late-spring/early-summer (November to December) observations from the Indian Ocean sector of the Southern Ocean (Shi et al., 2021) and summer (December and March) observations from the Atlantic sector (Burger et al., 2022a). Springtime δ15N–NO is also consistent with long-term records of δ15N–NO measured in coastal Antarctica (Wagenbach et al., 1998) and on the East Antarctic Plateau (Winton et al., 2020) for the same season. Given the similarity in δ15N–NO between spring and summer, we expect the dominant NOx sources to be the same.
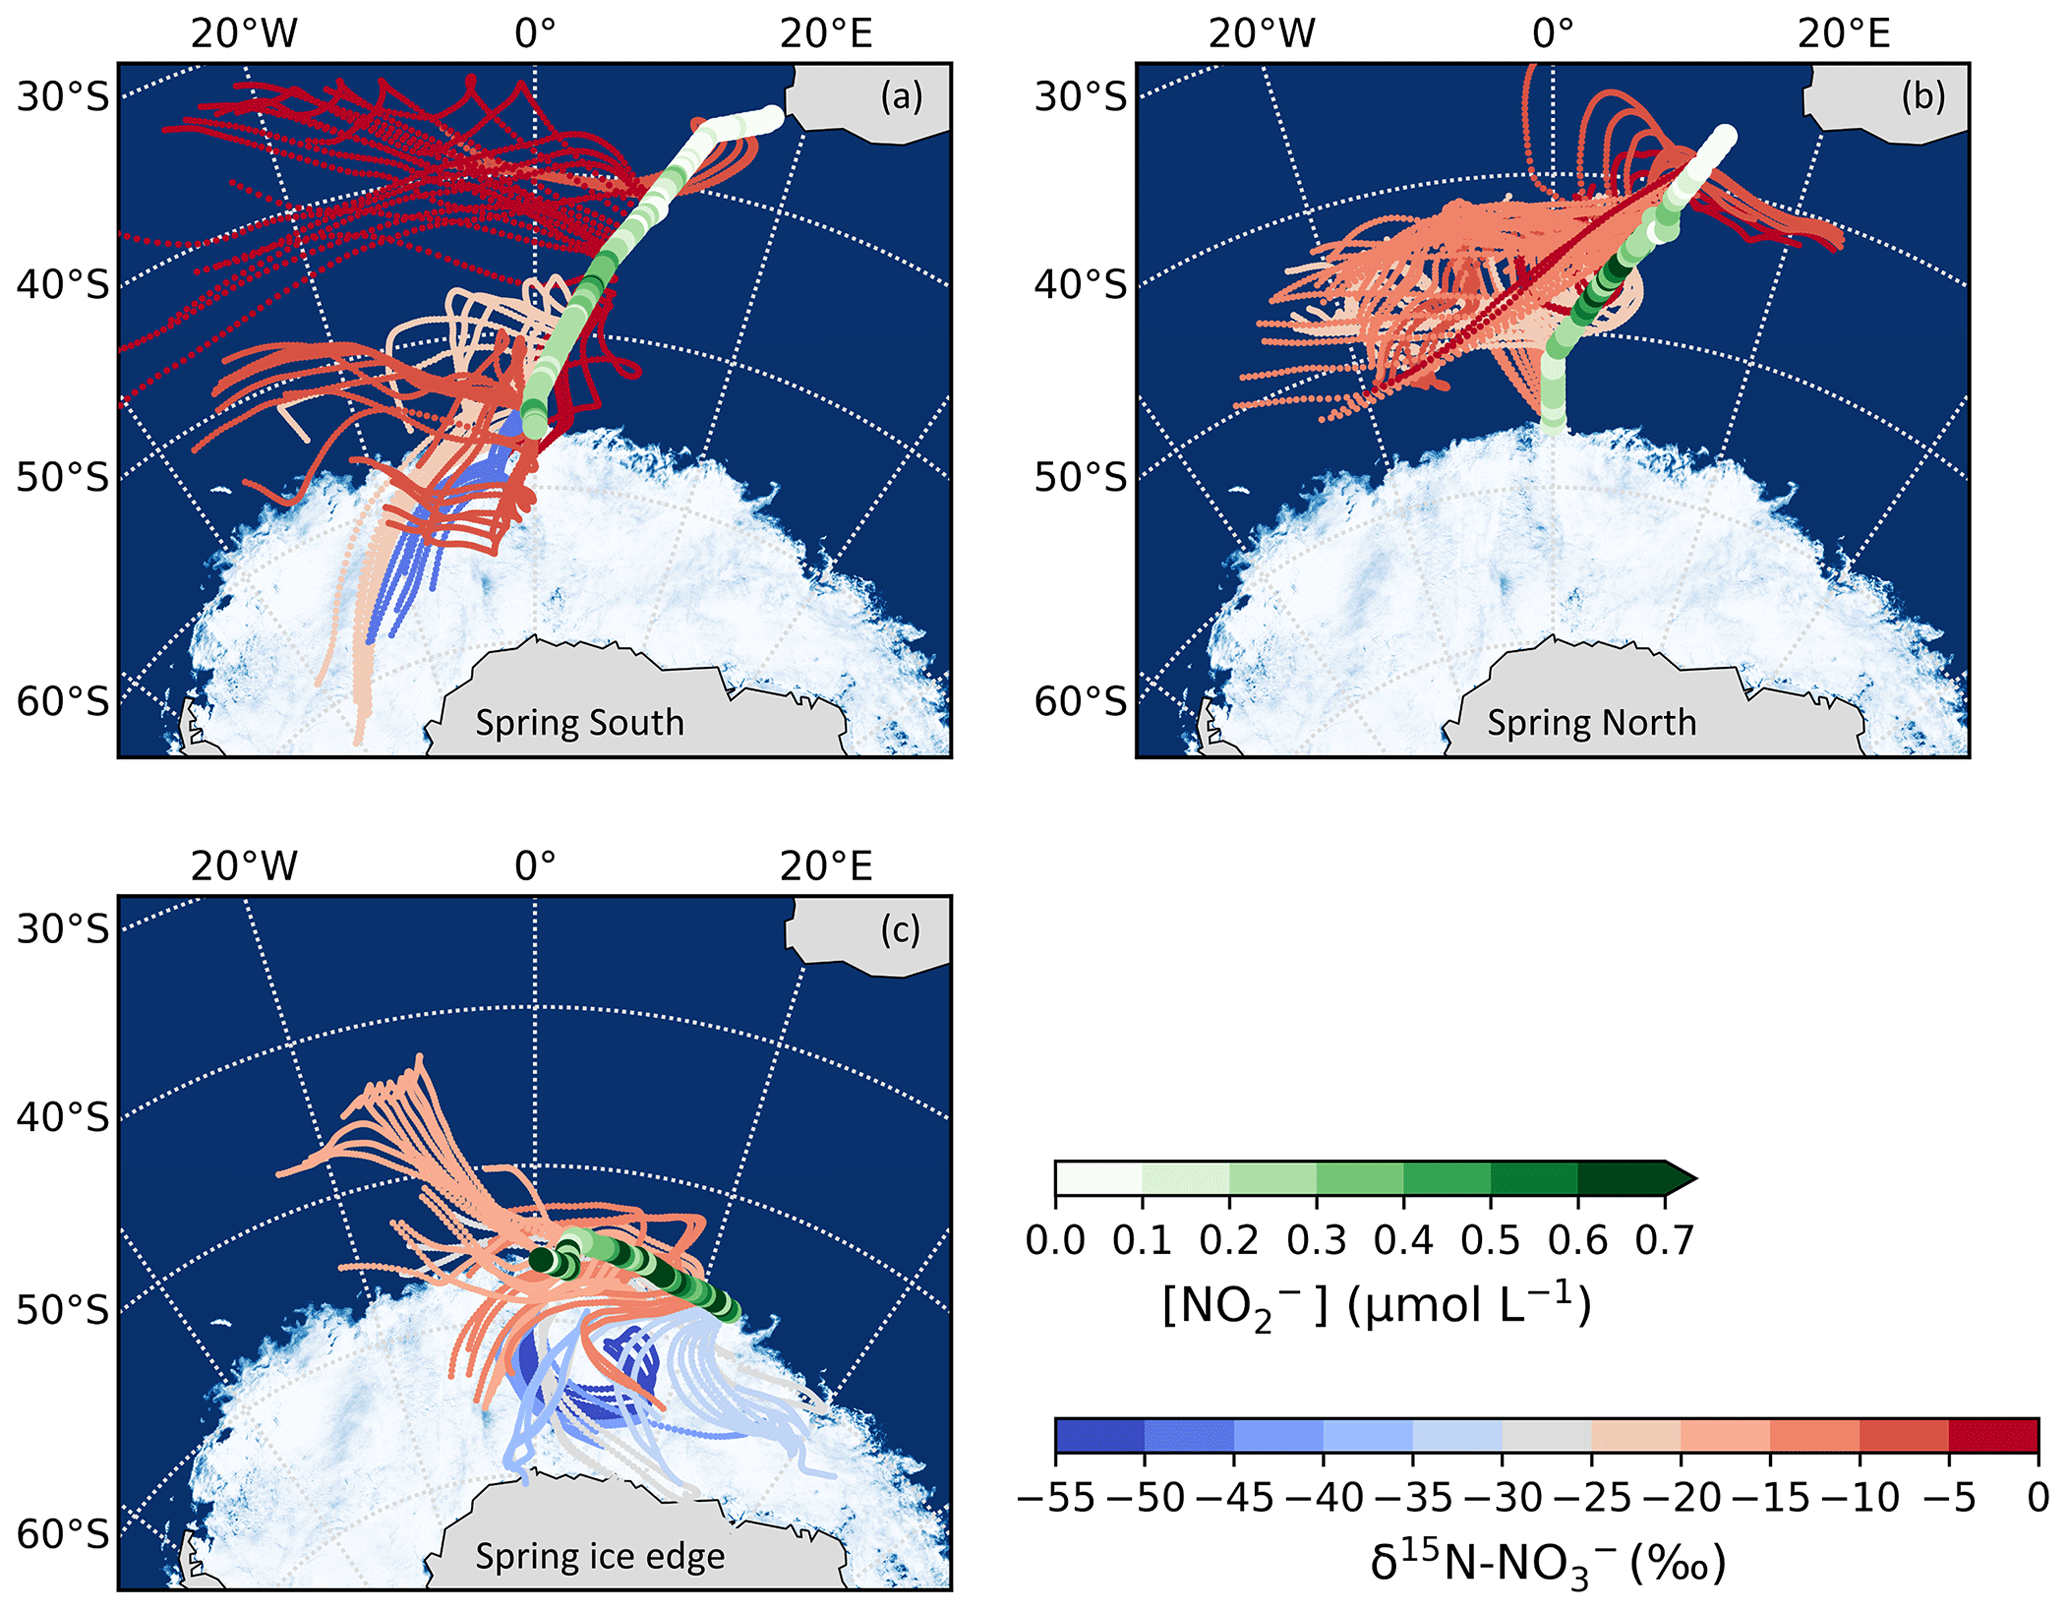
Figure 3The 72 h AMBTs computed for each hour of the spring cruise during (a) the southbound leg (“Spring South”), (b) the northbound leg (“Spring North”), and (c) the ice edge transect (“Spring ice edge”) when the HV-AS was running for more than 45 min of the hour. AMBTs are colour-coded by the weighted average δ15N–NO, represented by the blue-to-red colour bar. Overlaid are the surface ocean nitrite concentrations ([NO]), represented by the green colour bar. The white area represents the location of the sea ice determined using satellite-derived sea ice concentration data obtained from the passive microwave sensors of AMSR2 (Advanced Microwave Scanning Radiometer 2; Spreen et al., 2008).
During spring, air mass back trajectories indicate substantial sea ice influence at the high latitudes during the southbound leg and during the ice edge transect (Fig. 3a and c). There is a large isotope effect associated with snow NO photolysis during summer in the Antarctic (Berhanu et al., 2014, 2015; Frey et al., 2009; Erbland et al., 2013), resulting in the emission of low δ15N–NOx (∼ −48 ‰) to the overlying atmosphere (Savarino et al., 2007; Morin et al., 2009; Shi et al., 2018; Walters et al., 2019). The low δ15N–NO samples from the high latitudes (minimum −52.0 ‰) are clearly influenced by sea ice (Figs. 2b and 3a, c), but the air masses do not cross the Antarctic continent. This suggests that the low δ15N–NOx likely comes from snow nitrate photolysis from the snow on sea ice before a net loss of NO from the snowpack leads to any large 15N enrichment in the snow and subsequently the atmosphere (Shi et al., 2018). We conclude that NOx as a result of photolysis of snow nitrate on sea ice can explain the relatively low δ15N–NO observed in samples collected at the high latitudes on the spring southbound leg and during the ice edge transect (Fig. 2b, filled grey squares).
Higher δ15N–NO values (−22.7 ‰ to −1.0 ‰) were observed during spring for the northbound leg (Fig. 2b, open squares; Fig. 3b). The δ15N of atmospheric NO that originates from snowpack emissions depends on the δ15N of the local snowpack NOx source. 15N enrichment in the snow due to preferential loss of 14N during photolysis can eventually lead to increased δ15N–NOx and ultimately higher values of atmospheric δ15N–NO (Shi et al., 2018). However, the air mass histories of the samples indicate no contact with surrounding sea ice (i.e. Fig. 3b), suggesting that any influence from snowpack NOx emissions was limited. These samples originated from over the mid-latitude region of the Southern Ocean, where detectable sea surface nitrite was present (Fig. 3b). The NO which originates from nitrite in seawater is thought to limit sea surface RONO2 production. As a result, elevated nitrite concentrations are required for RONO2 production to occur in seawater (Dahl and Saltzman 2008; Dahl et al., 2012). Oceanic RONO2 has been long proposed as an important primary NO source to the Antarctic (Jones et al., 1991). Recent studies have used modelling and isotopic approaches to investigate the relative importance of oceanic RONO2 compared to other sources of NO in the Southern Ocean MBL, particularly in summer (Fisher et al., 2018; Burger et al., 2022a). However, limited co-occurring ocean atmosphere measurements are available to constrain the seasonality of the RONO2 source. While δ15N–RONO2 has yet to be directly quantified, it was recently estimated to have an average δ15N signature of ‰ in the summertime Southern Ocean (Burger et al.,2022a) and −27.8 ‰ in the eastern equatorial Pacific (Joyce et al., 2022). Consistent with this relatively isotopically light oceanic RONO2 source are observations of relatively low aerosol δ15N–NO from the mid-latitude Southern Ocean (Burger et al., 2022a) and eastern equatorial Pacific (Kamezaki et al., 2019; Joyce et al., 2022), on the order of −15 ‰ to −7 ‰.
Trends in δ15N–NO by air mass origin were most evident in the ice edge transect, during which lower (higher) δ15N–NO values were observed for samples with greater sea ice (oceanic) influence (Fig. 3c). The photolysis imprint on the NO stable isotope signal in the marine boundary layer above the sea ice is clearly observed and speaks to the importance of snow-covered sea ice as a NOx source in the region during spring as well as summer. The increased importance of oceanic RONO2 emissions as the air mass origin migrates from sea-ice-covered to open-ocean zones is also evidenced by the increase in δ15N–NO observed for air masses originating predominantly from over the ocean (Fig. 3c).
Isotopically, there is little evidence of RONO2 emissions contributing to aerosol NO in the winter samples. Reduced levels of UV radiation and minimal daylight hours (Fig. S3) in winter likely hinder the contribution of the oceanic NOx source to NO loading compared to spring/summer, despite detectable sea surface nitrite concentrations in winter (Fig. S4). Additionally, photolysis in spring/summer serves to produce OH, which is the primary oxidant for converting RONO2-derived NOx to NO in the MBL (Fisher et al., 2018).
Some studies suggest that the photolysis of particulate NO (p-NO) associated with sea-salt aerosols in the MBL can serve as an important NOx source (Zhou et al., 2003; Ye et al., 2016; Reed et al., 2017). However, the importance of this NOx formation pathway remains unclear, with large variability in reported rates between studies (Ye et al., 2016; Reed et al., 2017; Kasibhatla et al., 2018; Romer et al., 2018). To our knowledge, there are no observations of p-NO photolysis from the Southern Ocean MBL, and the implications of this process on the isotopic composition of NO in the MBL have yet to be assessed. We know that NO photolysis in snow is associated with a large fractionation, leading to the emission of isotopically light NOx, while the remaining NO pool becomes enriched in 15N (e.g. Frey et al., 2009; Berhanu et al., 2014, 2015; Shi et al., 2018). Thus, if the p-NO we measured were affected by photolysis we would have expected to observe much higher or even positive values of δ15N–NO during spring and summer. Another scenario is that the p-NO we measured resulted from the oxidation of NOx released by prior p-NO photolysis. In this case, we would have expected to observe much lower δ15N–NO values over the open ocean, on par with those observed over the ice. Since neither of the above scenarios matches the observations, the potential influence of aerosol NO photolysis as a significant NOx source to the region during our study is unlikely.
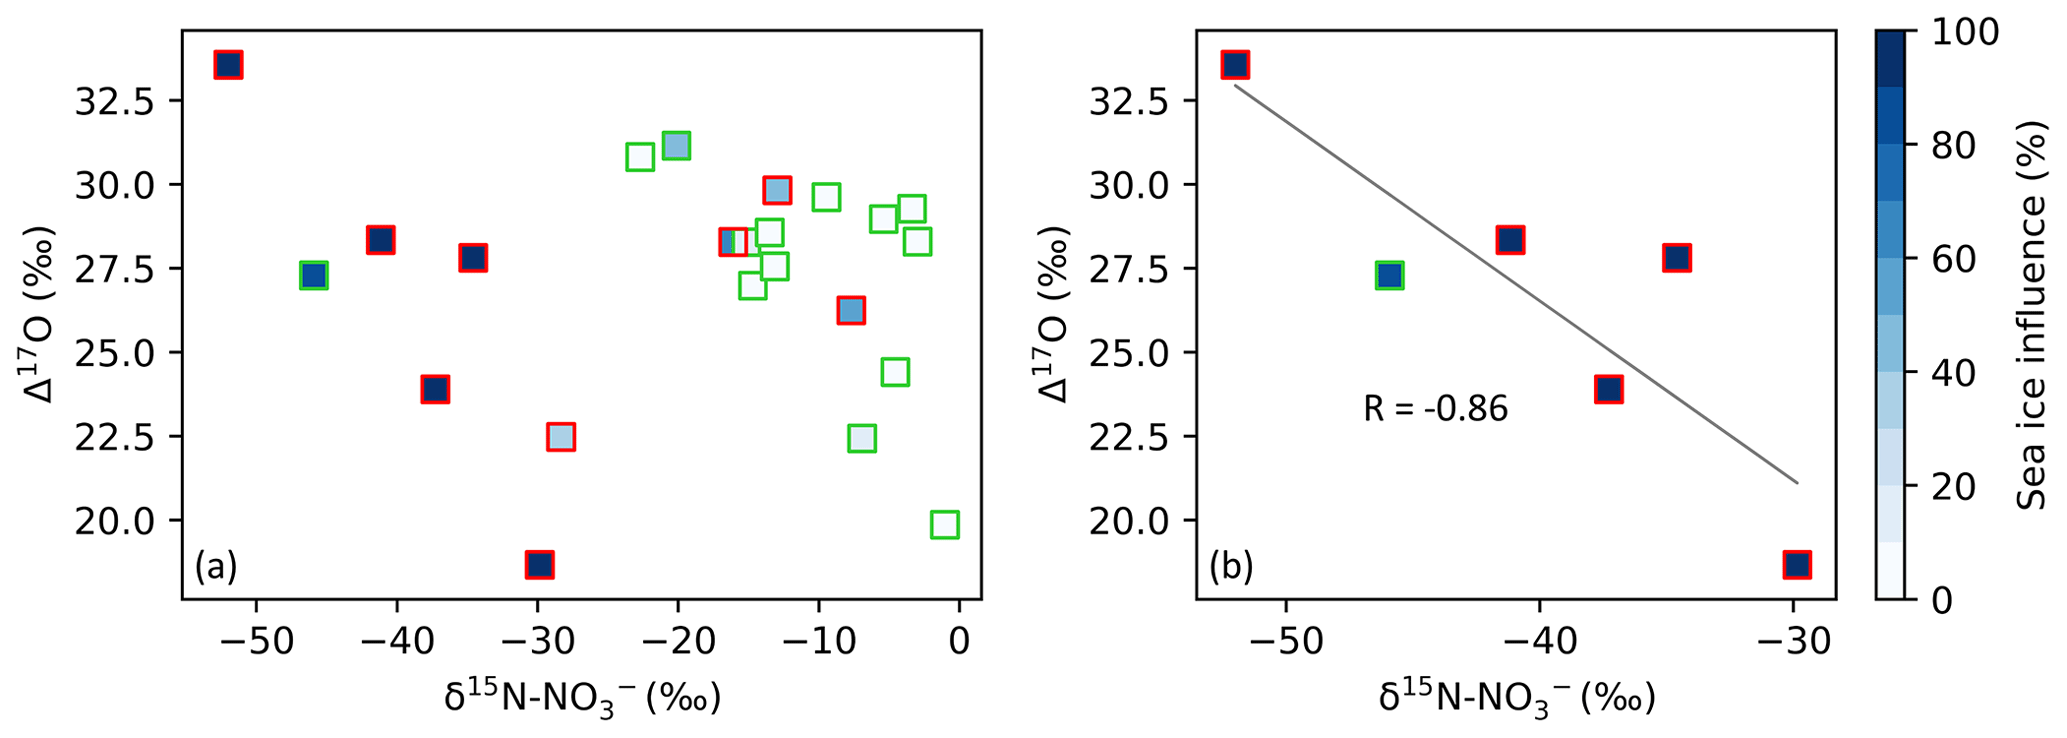
Figure 4The relationship between Δ17O–NO and δ15N–NO in spring (square symbols). In both panels, samples collected along the ice edge are denoted by the red edge colour, with all other samples collected on the north- and southbound legs of the voyage denoted by the green edge colour. The colour bar (blues) indicates the percentage of sea influence experienced by each filter sample as determined using AMBTs. In panel (a), all spring samples are included. In panel (b), only samples that experienced a sea ice influence > 75 % are included. A straight line (grey) is fitted to the data in panel (b). Note the difference in x-axis scale between panels.
Additionally, a strong anti-correlation (r = −0.86) is observed between δ15N–NO and Δ17O–NO for samples collected in spring which experience a sea ice influence greater than 75 % (Fig. 4), determined based on air mass history. A similar relationship was observed at Dome C during summer (Erbland et al., 2013; Savarino et al., 2016). Previous studies found that the production of enhanced Δ17O–NO in polar regions is linked to the intensity of NOx emissions from the snowpack (Morin et al., 2012; Savarino et al., 2016). The correlation between Δ17O–NO and δ15N–NO could arise from an increased contribution of HONO photolysis to total OH production, which is co-emitted with NOx from the snowpack (Grannas et al., 2007; Legrand et al., 2014) and induces a greater 17O excess in OH compared to the OH production pathway: O(1D) + H2O (Savarino et al., 2016). It could also arise from the coupling of snowpack emissions with reactive halogen chemistry as suggested by Morin et al. (2012). The relationship between Δ17O and δ15N presented here for the spring samples with air mass histories that indicate extensive influence from snow-covered sea ice suggests that snowpack emissions may lead to enhanced Δ17O transfer to NO.
3.3 Seasonal variation in oxidation
As mentioned in Sect. 1, the oxidation of NO and NO2 can be determined using the oxygen isotopic composition of aerosol NO. Here, we present and interpret the mass-weighted, coarse-mode average δ18O–NO and Δ17O–NO, computed for each filter deployment.
During NO and NO2 oxidation, the oxygen atoms of the responsible oxidants are incorporated into the NO product. The transferrable terminal oxygen atom of O3 possesses an elevated Δ17O–NO(O3term) and δ18O(O3term) (39.3 ± 2 ‰ and 126.3 ± 11.9 ‰, respectively) (Vicars and Savarino, 2014) compared to other oxidants (e.g. OH and peroxy radicals, RO2 or HO2) which possess a Δ17O–NO ≈ 0 ‰ (Michalski et al., 2012). The δ18O of OH is negative, while the δ18O of RO2 or HO2 stems from that of atmospheric O2, which is also low (23.9 ‰; Barkan and Luz 2005). These differences allow us to qualitatively assess NO and NO2 oxidation chemistry involving contributions by various oxidants. Similar to previous work conducted in the Southern Ocean MBL and in Antarctica (Walters et al., 2019; Shi et al., 2021), we make the assumption that oxidant δ18O values are known and directly represented in the NO.
The relatively low δ18O–NO values observed in summer (< 70 ‰; Fig. 2c) are consistent with NO2 oxidation via OH (Burger et al., 2022a). During summer, unusually low δ18O–NO values were also observed, equating to less than the minimum expected for the OH oxidation pathway (< ∼ 46 ‰; Burger et al., 2022a). This was attributed to an increased contribution by HO2 or RO2 during NO oxidation to NO2 (as opposed to O3), which would decrease the δ18O of the product NO. Increased abundance of RO2 in the MBL was attributed to RONO2 photolysis, hypothesized to occur over the mid-latitude Southern Ocean (Fisher et al., 2018; Burger et al., 2022a), and/or the presence of sea ice, which can lead to enhanced peroxy radical production (Brough et al., 2019).
Interestingly, despite NOx sources being the same in spring and summer (Sect. 3.2), the δ18O–NO data suggest that the NO formation pathways differ (Fig. 2c). Higher average δ18O–NO values were observed in spring compared to summer (Fig. 2c). Higher δ18O–NO values in spring compared to summer may originate from NOx oxidation by XO. In the Antarctic boundary layer, enhanced levels of BrO occur in spring over sea-ice-covered areas (Theys et al., 2011). The production of inorganic bromine has been proposed to be related to frost flowers on thin sea ice (Kaleschke et al., 2004) and blowing of saline snow on sea ice (Yang et al., 2010). Significant interaction with sea ice cover was experienced in spring, particularly at the ice edge transect, which could have promoted NO formation via the BrO pathway, resulting in increased values of δ18O–NO.
The oxygen isotopic composition of NO in winter and spring was comparable as indicated by both δ18O (Fig. 2c) and Δ17O (Fig. 2d). The δ18O–NO ranged from 56.5 ‰ to 92.9 ‰ in winter (Fig. 2c, blue diamonds; excluding the initial sample of stratospheric origin) and from 43.3 ‰ to 89.8 ‰ in spring (Fig. 2c, green squares). The Δ17O–NO ranged from 22.3 ‰ to 35 ‰ in winter (Fig. 2d, blue diamonds; excluding the initial sample of stratospheric origin) and from 18.7 ‰ to 33.6 ‰ in spring (Fig. 2d, green squares). Interestingly, there is more variability in the δ18O and Δ17O for the ice edge transect (Fig. 2c and d, dark shaded squares) than the north- and southbound transects. The overlap in δ18O and Δ17O in winter and spring suggests that similar pathways lead to NO formation in both seasons, i.e. oxidation pathways that result in an increased influence of O3 during oxidation (i.e. N2O5, DMS, XO).
Table 1A summary of the oxygen isotope ratios (δ18O and Δ17O) for the end-member oxidants and/or oxidant sources (O3, OH, HO2 or RO2, and H2O) utilized in Sect. 3.3.
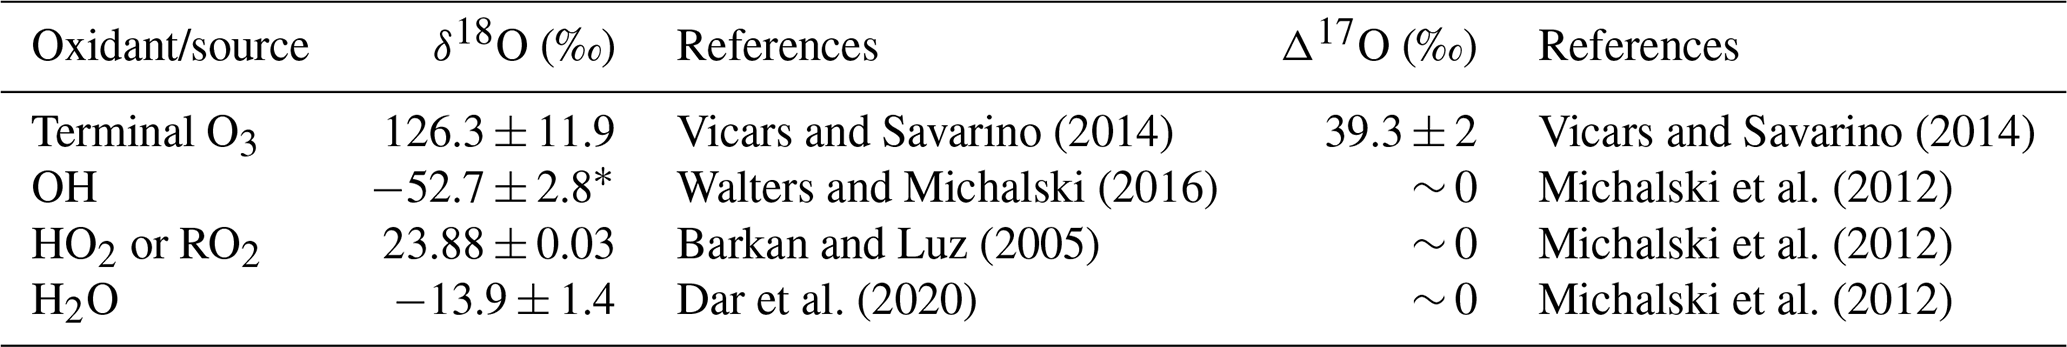
∗ The average δ18O–OH was calculated from the equilibrium fractionation between OH and H2O(v) (Walters and Michalski, 2016) using the observed atmospheric temperature range for winter and spring and the average δ18O–H2O (Dar et al., 2020).
A significant linear relationship was observed between δ18O–NO and Δ17O–NO in both winter and spring (Fig. S5). This suggests isotopic mixing between two major oxidants (e.g. Fibiger et al., 2013; Shi et al., 2021). As such, the highest end-member is representative of tropospheric O3 and/or XO with a δ18O of ∼ 114 ‰ to 138 ‰ and a Δ17O of ∼ 39 ‰. There are multiple options for the second oxidant with a Δ17O = 0 ‰, e.g. water vapour (H2O(v)), OH, and O2. Here, we use the δ18O–H2O(v) from the average of observations along a similar cruise transect from the Indian sector of the Southern Ocean (Dar et al., 2020). The average δ18O–H2O(v) determined between ∼ 33 and ∼ 60∘ S (−13.9 ± 1.4 ‰) was used for the winter samples given that AMBTs indicate that most air masses originated within this latitudinal band, where there is minimal variation in δ18O–H2O(v) (Dar et al., 2020). In spring, the zone of air mass origin for our samples extends further south to ∼ 70∘ S. As shown by Dar et al. (2020), δ18O–H2O(v) declines significantly between ∼ 60 and ∼ 70∘ S. To account for this lowering in δ18O–H2O(v), which could influence higher-latitude samples, an additional H2O(v) end-member equivalent to the minimum observed by Dar at al. (2020) (−27.5 ‰) was included for spring. The δ18O–OH was calculated from the equilibrium fractionation between OH and H2O(v) (Walters and Michalski, 2016) using the observed atmospheric temperature range for winter and spring. The δ18O–OH determined for winter ranges from −56.2 ‰ to −49.5 ‰ (average = −52.8 ‰), and for spring it ranges from −54.5 ‰ to −50.5 ‰ (average = −52.5 ‰). Therefore, a value of −53 ‰ was used for both seasons. The atmospheric δ18O–O2 is well constrained at 23.9 ‰ (Barkan and Luz, 2005). The δ18O and Δ17O values assumed for all oxidants or oxygen sources outlined above are summarized in Table 1. Mixing lines for the three oxidant pairs (OH and O3, H2O(v) and O3, and O2 and O3) are indicated by the grey, orange, and red lines, respectively, in Fig. 5.

Figure 5Winter and spring δ18O–NO vs. Δ17O–NO are plotted in panels (a) and (b), respectively. A straight line (black) is fitted to the data in each panel. In both panels the grey line represents the OH-and-O3 mixing line, the orange line represents the H2O(v)-and-O3 mixing line, and the red line represents the O2-and-O3 mixing line. In panel (b), an additional H2O(v)-and-O3 mixing line is included (also in orange) to account for potentially lower values of δ18O–H2O(v) (∼ −27.5 ‰) at 60 to 70∘ S.
To determine the lower end-member in each season, i.e. the second major oxidant in addition to ozone and/or XO, a straight line was fitted to the data in δ18O–Δ17O space, and the x intercept at a Δ17O = 0 ‰ was determined. The x intercept in winter is ∼ −16 ‰. During winter, the linear relationship observed (Fig. 5a) is similar to what has been seen in the Indian Ocean MBL and in coastal East Antarctica, where the x intercept was −11 ± 8 ‰ (Shi et al., 2021) and −15 ± 6 ‰ (Shi et al., 2022), respectively. The oxygen isotopic composition of the lower end-member in our winter data is most similar to that of H2O(v). This is consistent with the average δ18O–H2O(v) (= −13.9 ± 1.4 ‰) observed between approximately 33 and 60∘ S (Dar et al., 2020). Therefore, a mixing line between H2O(v) and O3 is the best fit to the winter observations (Fig. 5a, solid orange line). If we exclude an equilibrium isotope fractionation between OH and H2O(v) (Michalski et al., 2012) such that δ18O–OH is similar to the δ18O of H2O(v), then the lower end-member likely results from the OH oxidation pathway.
By contrast, observations made in spring are best represented by mixing between three major oxidants: H2O(v), O3, and O2. The x intercept in spring is ∼ −4 ‰, making it more difficult to identify one low δ18O end-member. The oxidant source with the closest oxygen isotope composition is again H2O(v), indicating the prevalence of the OH pathway (when δ18O–OH ∼ δ18O–H2O(v)); however the x intercept is greater in spring compared to winter, suggesting that the lower end-member has a higher δ18O. H2O(v) data from the region suggest that we would not expect to see a δ18O > −10 ‰; therefore an increase in H2O(v) δ18O from winter to spring can be ruled out. A more likely explanation is that the springtime lower end-member consists of some combination of H2O(v) and an additional higher δ18O oxidant that is less abundant in winter. The higher δ18O oxidant is likely atmospheric O2 (δ18O = 23.9 ‰, Δ17O = 0 ‰ vs. VSMOW; Barkan and Luz, 2005). This is consistent with the spread in the springtime observations, which are bound by the decreased H2O(v)-and-O3 mixing line to accommodate the influence of lower δ18O–H2O(v) at the high latitudes (Fig. 5b, orange line) and the atmospheric O2-and-O3 mixing line (Fig. 5b, red line).
The influence of atmospheric O2 during spring likely results from the increased role of RO2 (and/or HO2) in NOx cycling. This may be linked to increased RO2 production over the mid-latitude Southern Ocean, derived from RONO2 photolysis in the MBL (Burger et al., 2022a). There is also evidence that sea ice can lead to enhanced peroxy radical production (Brough et al., 2019), resulting in the potential for increased RO2 and HO2 concentrations to be observed in air masses that traverse the sea ice zone before being sampled. δ18O–NO is greater in winter and spring compared to summer (Fig. 2c), highlighting the increased control of O3 on the oxygen isotopic composition of NO in winter and spring. Consistent with increased O3 influence are seasonally resolved observations of O3 concentration ([O3]) in coastal Antarctica (Ishino et al., 2017; Shi et al., 2022) and Cape Grim, Tasmania (Derwent et al., 2016), the latter being more representative of the MBL. In all cases, maximum [O3] is observed in winter, and minimum [O3] is observed throughout summer. In spring, [O3] concentrations are noticeably reduced compared to the winter, but slightly elevated compared to summer. Higher δ18O–NO values in spring may also originate from NOx oxidation by XO, for example BrO, as discussed above.
Seasonally resolved observations of atmospheric NO across the Atlantic Southern Ocean MBL suggest that natural NOx sources dominate throughout the year. Similar NO sources are available to the MBL in both spring and summer, highlighting the importance of oceanic RONO2 emissions in seasons other than the more frequently sampled summer months in the Southern Ocean. Although further research is required to improve our mechanistic and isotopic understanding of oceanic RONO2 formation, fluxes, and conversion to aerosol NO, this work contributes to our growing understanding of how the surface ocean influences the atmospheric reactive N cycle and oxidation chemistry of the MBL (Altieri et al., 2021; Burger et al., 2022a; Joyce et al., 2022).
Furthermore, the large-sea-ice-extent characteristic of spring highlights the importance of snow-covered sea ice as a NOx source, in addition to the well-documented summer source from snow-covered continental ice (Jones et al., 2001; Walters et al., 2019; Winton et al., 2020). Currently no measurements of δ15N–NO from snowpack on sea ice exist for Antarctica, which is an important measurement gap that should be addressed in future studies. The presence of sea ice may also play a role in the formation of peroxy radicals through its influence on chlorine chemistry when sunlight is available (Brough et al., 2019). Peroxy radicals (RO2), H2O(v), and O3 serve as the dominant atmospheric oxidants during spring, responsible for aerosol NO formation. In contrast, a lack of sunlight and sea ice influence is experienced during winter, and mixing between two end-members, H2O(v) and O3, best explains the oxygen isotopic composition of the NO that is formed. Similar to coastal Antarctic sites, reduced daylight hours and/or increased O3 abundance in the winter and spring MBL lead to greater O3 influence on NO formation compared to the summer, when OH oxidation chemistry dominates.
Winter is characterized by very low [NO] concentrations with δ15N signatures that reflect background conditions similar to that of the low-latitude Atlantic Ocean (Morin et al., 2009). Interestingly, despite being collected off the coast of South Africa, the N and O isotopic composition of NO measured for the first wintertime sample reflects a stratospheric NO source signal. This is also supported by AMBTs that originate near Antarctica, where stratospheric denitrification is reported to occur (Savarino et al., 2007).
Our observations highlight the potential power of N and O isotopes of nitrate in distinguishing between the various natural NOx sources that result in NO formation and constraining formation pathways of aerosol NO. In order to improve the utility of the N and O isotopes in the polar atmosphere, more measurements of the isotopic composition of the regional sources, e.g. snow on sea ice, and regional processes, e.g. OH from HONO and sea ice oxidant emissions, are needed. Even though it is complex, the utility of the N isotopes in distinguishing between the various natural NOx sources that result in NO formation in the MBL of the Atlantic Southern Ocean, especially in the less frequently sampled seasons of winter and spring, is evident. Furthermore, the O isotopes were able to help constrain formation pathways of aerosol NO seasonally. This is especially important in the Atlantic Southern Ocean, where oxidation chemistry is poorly constrained (Hosaynali Beygi et al., 2011). The contribution of sea ice to oxidant production when sunlight returns in spring is also highlighted by the O isotopes. As such, these data may be useful to modelling efforts attempting to characterize N cycling between the surface ocean and lower atmosphere and may help improve atmospheric oxidant budgets that are less understood in unpolluted low-NOx environments.
Datasets for this research are available at https://doi.org/10.5281/zenodo.7142722 (Burger et al., 2022b).
The supplement related to this article is available online at: https://doi.org/10.5194/acp-23-5605-2023-supplement.
KEA designed the study and sampling campaign, acquired funding, and supervised the research. KEA and MGH provided financial and laboratory resources and assisted in data validation. EJ performed laboratory analysis of samples at Brown University. KAMS and JMB conducted the sampling at sea, and JMB performed laboratory analysis at the University of Cape Town. JMB analysed the data and prepared the manuscript with contributions from all co-authors. KEA, MGH, and EJ assisted with reviewing and editing the manuscript.
At least one of the (co-)authors is a member of the editorial board of Atmospheric Chemistry and Physics. The peer-review process was guided by an independent editor, and the authors also have no other competing interests to declare.
Publisher’s note: Copernicus Publications remains neutral with regard to jurisdictional claims in published maps and institutional affiliations.
We thank the captain and crew of the R/V SA Agulhas II for their support at sea and the Marine Biogeochemistry Laboratory in the Oceanography Department at the University of Cape Town for their assistance in the field and in the laboratory. We thank Ruby Ho for analytical support. We thank Riesna Audh, Raquel Flynn, Shantelle Smith, Eleonora Puccinelli, Sina Wallschuss, Eesaa Harris, and Sive Xokashe for nitrite concentration measurements and Sarah Fawcett and Raquel Flynn for quality-controlling the nitrite concentration data. We thank the South African Weather Service (SAWS) for atmospheric temperature, sea level pressure, and relative humidity data during all three voyages. This project has received funding from the European Union's Horizon 2020 research and innovation programme under grant agreement no. 101003826 via the CRiceS (Climate Relevant interactions and feedbacks: the key role of sea ice and Snow in the polar and global climate system) project.
This research has been supported by the South African National Research Foundation through a Competitive Support for Rated Researchers Grant to Katye E. Altieri (grant no. 111716) and a South African National Antarctic Programme postgraduate fellowship to Jessica M. Burger and a grant to Katye E. Altieri (grant no. 110732). This research was further supported by the University of Cape Town through a University Research Council launching grant and VC Future Leaders 2030 grant awarded to Katye E. Altieri. Additional support was provided by the National Research Foundation through a doctoral scholarship to Jessica M. Burger (grant no. 138813) as well as by the European Union's Horizon 2020 research and innovation programme (grant no. 101003826) via the CRiceS project. This work was partially supported by the NSF (award no. 1851343) via the North Pacific Atmosphere project grant awarded to Meredith G. Hastings.
This paper was edited by Eliza Harris and reviewed by two anonymous referees.
Alexander, B., Sherwen, T., Holmes, C. D., Fisher, J. A., Chen, Q., Evans, M. J., and Kasibhatla, P.: Global inorganic nitrate production mechanisms: comparison of a global model with nitrate isotope observations, Atmos. Chem. Phys., 20, 3859–3877, https://doi.org/10.5194/acp-20-3859-2020, 2020.
Altieri, K. E., Hastings, M. G., Gobel, A. R., Peters, A. J., and Sigman, D. M.: Isotopic composition of rainwater nitrate at Bermuda: the influence of air mass source and chemistry in the marine boundary layer, J. Geophys. Res.-Atmos., 118, 11304–11316, https://doi.org/10.1002/jgrd.50829, 2013.
Altieri, K. E., Fawcett, S. E., and Hastings, M. G.: Reactive Nitrogen Cycling in the Atmosphere and Ocean, Annu. Rev. Earth Pl. Sc., 49, 513–540, https://doi.org/10.1146/annurev-earth-083120-052147, 2021.
Aun, M., Lakkala, K., Sanchez, R., Asmi, E., Nollas, F., Meinander, O., Sogacheva, L., De Bock, V., Arola, A., de Leeuw, G., Aaltonen, V., Bolsée, D., Cizkova, K., Mangold, A., Metelka, L., Jakobson, E., Svendby, T., Gillotay, D., and Van Opstal, B.: Solar UV radiation measurements in Marambio, Antarctica, during years 2017–2019, Atmos. Chem. Phys., 20, 6037–6054, https://doi.org/10.5194/acp-20-6037-2020, 2020.
Baker, A. R., Weston, K., Kelly, S. D., Voss, M., Streu, P., and Cape, J. N.: Dry and wet deposition of nutrients from the tropical Atlantic atmosphere: links to primary productivity and nitrogen fixation, Deep Sea Res. Pt. I, 54, 1704–1720, https://doi.org/10.1016/j.dsr.2007.07.001, 2007.
Barkan, E., and Luz, B.: High precision measurements of 17O 16O and 18O 16O ratios in H2O, Rapid Commun. Mass Spectrom., 19, 3737–3742, https://doi.org/10.1002/rcm.2250, 2005.
Bauguitte, S. J.-B., Bloss, W. J., Evans, M. J., Salmon, R. A., Anderson, P. S., Jones, A. E., Lee, J. D., Saiz-Lopez, A., Roscoe, H. K., Wolff, E. W., and Plane, J. M. C.: Summertime NOx measurements during the CHABLIS campaign: can source and sink estimates unravel observed diurnal cycles?, Atmos. Chem. Phys., 12, 989–1002, https://doi.org/10.5194/acp-12-989-2012, 2012.
Berhanu, T. A., Savarino, J., Bhattacharya, S. K., and Vicars, W. C.: 17O excess transfer during the NO2 + O3 → NO3 + O2 reaction, J. Chem. Phys., 136, 1–9, https://doi.org/10.1063/1.3666852, 2012.
Berhanu, T. A., Meusinger, C., Erbland, J., Jost, R., Bhattacharya, S. K., Johnson, M. S., and Savarino, J.: Laboratory study of nitrate photolysis in Antarctic snow. II. Isotopic effects and wavelength dependence, J. Chem. Phys., 140, 244306, https://doi.org/10.1063/1.4882899, 2014.
Berhanu, T. A., Savarino, J., Erbland, J., Vicars, W. C., Preunkert, S., Martins, J. F., and Johnson, M. S.: Isotopic effects of nitrate photochemistry in snow: a field study at Dome C, Antarctica, Atmos. Chem. Phys., 15, 11243–11256, https://doi.org/10.5194/acp-15-11243-2015, 2015.
Bölhke, J. K., Mroczkowski, S. J., and Coplen, T. B.: Oxygen isotopes in nitrate: new reference materials for 18O : 17O : 16O measurements and observations on nitrate-water equilibrium, Rapid Commun. Mass Sp., 17, 1835–1846, https://doi.org/10.1002/rcm.1123, 2003.
Brough, N., Jones, A. E., and Griffiths, P. T.: Influence of sea ice derived halogens on atmospheric HOx as observed in Springtime coastal Antarctica, Geophys. Res. Lett., 46, 10168–10176, https://doi.org/10.1029/2019GL083825, 2019.
Burger, J. M., Granger, J., Joyce, E., Hastings, M. G., Spence, K. A. M., and Altieri, K. E.: The importance of alkyl nitrates and sea ice emissions to atmospheric NOx sources and cycling in the summertime Southern Ocean marine boundary layer, Atmos. Chem. Phys., 22, 1081–1096, https://doi.org/10.5194/acp-22-1081-2022, 2022a.
Burger, J. M., Joyce, E., Hastings, M. G., Spence, K. A. M., and Altieri, K. E.: A seasonal analysis of aerosol NO sources and NOx oxidation pathways in the Southern Ocean marine boundary layer, Zenodo [data set], https://doi.org/10.5281/zenodo.7142722, 2022b.
Casciotti, K. L., Sigman, D. M., Hastings, M. G., Böhlke, J. K., and Hilkert, A.: Measurement of the oxygen isotopic composition of nitrate in seawater and freshwater using the denitrifier method, Anal. Chem., 74, 4905–4912, https://doi.org/10.1021/ac020113w, 2002.
Dahl, E. E. and Saltzman, S. E.: Alkyl nitrate photochemical production rates in North Pacific seawater, Mar. Chem., 112, 137–141, https://doi.org/10.1016/j.marchem.2008.10.002, 2008.
Dahl, E. E., Heiss, E. M., and Murawski, K.: The effects of dissolved organic matter on alkyl nitrate production during GOMECC and laboratory studies, Mar. Chem., 142, 11–17, https://doi.org/10.1016/j.marchem.2012.08.001, 2012.
Dar, S. S., Ghosh, P., Swaraj, A., and Kumar, A.: Craig–Gordon model validation using stable isotope ratios in water vapor over the Southern Ocean, Atmos. Chem. Phys., 20, 11435–11449, https://doi.org/10.5194/acp-20-11435-2020, 2020.
Davidson, E. A. and Kingerlee, W.: A global inventory of nitric oxide emissions from soils, Nutr. Cycl. Agroecosys., 48, 37–50, https://doi.org/10.1023/A:1009738715891, 1997.
Derwent, R. G., Parrish, D. D., Galbally, I. E., Stevenson, D. S., Doherty, R. M., Young, P. J., and Shallcross, D. E.: Interhemispheric differences in seasonal cycles of tropospheric ozone in the marine boundary layer: Observation-model comparisons, J. Geophys. Res.-Atmos., 121, 11075–11085, https://doi.org/10.1002/2016JD024836, 2016.
Elliott, E. M., Kendall, C., Wankel, S. D., Burns, S. A., Boyer, E. W., Harlin, K., Bain, D. J., and Butler, T. J.: Nitrogen isotopes as indicators of NOx source contributions to atmospheric nitrate deposition across the Midwestern and Northeastern United States, Environ. Sci. Technol., 41, 7661–7667, https://doi.org/10.1021/es070898t, 2007.
Elliot, E. M., Yu, Z., Cole, A. S., and Coughlin, J. G.: Isotopic advances in understanding reactive nitrogen deposition and atmospheric processing, Sci. Total Environ., 662, 393–403, https://doi.org/10.1016/j.scitotenv.2018.12.177, 2019.
Erbland, J., Vicars, W. C., Savarino, J., Morin, S., Frey, M. M., Frosini, D., Vince, E., and Martins, J. M. F.: Air–snow transfer of nitrate on the East Antarctic Plateau – Part 1: Isotopic evidence for a photolytically driven dynamic equilibrium in summer, Atmos. Chem. Phys., 13, 6403–6419, https://doi.org/10.5194/acp-13-6403-2013, 2013.
Fang, Y. T., Koba, K., Wang, X. M., Wen, D. Z., Li, J., Takebayashi, Y., Liu, X. Y., and Yoh, M.: Anthropogenic imprints on nitrogen and oxygen isotopic composition of precipitation nitrate in a nitrogen-polluted city in southern China, Atmos. Chem. Phys., 11, 1313–1325, https://doi.org/10.5194/acp-11-1313-2011, 2011.
Fibiger, D. L., and Hastings, M. G.: First Measurements of the Nitrogen Isotopic Composition of NOx from Biomass Burning, Environ. Sci. Technol., 50, 11569–11574, https://doi.org/10.1021/acs.est.6b03510, 2016.
Fibiger, D. L., Hastings, M. G., Dibb, J. E., and Huey, L. G.: The preservation of atmospheric nitrate in snow at Summit, Greenland, Geophys. Res. Lett., 40, 3484–3489, https://doi.org/10.1002/grl.50659, 2013.
Finlayson-Pitts, B. J. and Pitts, J. N.: Chemistry of the upper and lower troposphere, Academic Press, San Diego, California, https://doi.org/10.1016/B978-0-12-257060-5.X5000-X, 2000.
Fisher, J. A., Atlas, E. L., Barletta, B., Meinardi, S., Blake, D. R., Thompson, C. R., Ryerson, T. B., Peischl, J., Tzompa-Sosa, Z. A., and Murray, L. T.: Methyl, ethyl and propyl nitrates: global distribution and impacts on reactive nitrogen in remote marine environments, J. Geophys. Res.-Atmos., 123, 12412–12429, https://doi.org/10.1029/2018JD029046, 2018.
Frey, M. M., Savarino, J., Morin, S., Erbland, J., and Martins, J. M. F.: Photolysis imprint in the nitrate stable isotope signal in snow and atmosphere of East Antarctica and implications for reactive nitrogen cycling, Atmos. Chem. Phys., 9, 8681–8696, https://doi.org/10.5194/acp-9-8681-2009, 2009.
Grannas, A. M., Jones, A. E., Dibb, J., Ammann, M., Anastasio, C., Beine, H. J., Bergin, M., Bottenheim, J., Boxe, C. S., Carver, G., Chen, G., Crawford, J. H., Dominé, F., Frey, M. M., Guzmán, M. I., Heard, D. E., Helmig, D., Hoffmann, M. R., Honrath, R. E., Huey, L. G., Hutterli, M., Jacobi, H. W., Klán, P., Lefer, B., McConnell, J., Plane, J., Sander, R., Savarino, J., Shepson, P. B., Simpson, W. R., Sodeau, J. R., von Glasow, R., Weller, R., Wolff, E. W., and Zhu, T.: An overview of snow photochemistry: evidence, mechanisms and impacts, Atmos. Chem. Phys., 7, 4329–4373, https://doi.org/10.5194/acp-7-4329-2007, 2007.
Hamilton, D. S., Lee, L. A., Pringle, K. J., Reddington, C. L., Spracklen, D. V., and Carslaw, K. S.: Occurrence of pristine aerosol environments on a polluted planet, P. Natl. Acad. Sci. USA, 111, 18466–18471, https://doi.org/10.1073/pnas.1415440111, 2014.
Hastings, M. G., Sigman, D. M., and Lipschultz, F.: Isotopic evidence for source changes of nitrate in rain at Bermuda, J. Geophys. Res., 108, 4790, https://doi.org/10.1029/2003JD003789, 2003.
Haywood, J. and Boucher, O.: Estimates of the direct and indirect radiative forcing due to tropospheric aerosols: a review, Rev. Geophys., 38, 513–543, https://doi.org/10.1029/1999RG000078, 2000.
Heidenreich, J. E. III. and Thiemens, M. H.: A non-mass-dependent oxygen isotope effect in the production of ozone from molecular oxygen: the role of symmetry in isotope chemistry, J. Chem. Phys., 84, 2129–2136, https://doi.org/10.1063/1.450373, 1986.
Hoering, T.: The isotopic composition of the ammonia and the nitrate ion in rain, Geochim. Cosmochim. Ac., 12, 97–102, https://doi.org/10.1016/0016-7037(57)90021-2, 1957.
Hosaynali Beygi, Z., Fischer, H., Harder, H. D., Martinez, M., Sander, R., Williams, J., Brookes, D. M., Monks, P. S., and Lelieveld, J.: Oxidation photochemistry in the Southern Atlantic boundary layer: unexpected deviations of photochemical steady state, Atmos. Chem. Phys., 11, 8497–8513, https://doi.org/10.5194/acp-11-8497-2011, 2011.
IPCC: Boucher, O., Randall, D., Artaxo, P., Bretherton, C., Feingold, G., Forster, P., Kerminen, V.-M., Kondo, Y., Liao, H., Lohmann, U., Rasch, P., Satheesh, S. K., Sherwood, S., Stevens, B., and Zhang, X. Y.: Clouds and Aerosols, in: Climate Change 2013: The Physical Science Basis. Contribution of Working Group I to the Fifth Assessment Report of the Intergovernmental Panel on Climate Change, edited by: Stocker, T. F., Qin, D., Plattner, G.-K., Tignor, M., Allen, S. K., Boschung, J, Nauels, A., Xia, Y., Bex, V., and Midgley, P. M., Cambridge University Press, Cambridge, United Kingdom and New York, NY, USA, ISBN 9781107661820, 2013.
Ireland, T. R., Avila, J., Greenwood, R. C., Hicks, L. J., and Bridges, J. C.: Oxygen Isotopes and Sampling of the Solar System, Space Sci. Rev., 216, 1–60, https://doi.org/10.1007/s11214-020-0645-3, 2020.
Ishino, S., Hattori, S., Savarino, J., Jourdain, B., Preunkert, S., Legrand, M., Caillon, N., Barbero, A., Kuribayashi, K., and Yoshida, N.: Seasonal variations of triple oxygen isotopic compositions of atmospheric sulfate, nitrate, and ozone at Dumont d'Urville, coastal Antarctica, Atmos. Chem. Phys., 17, 3713–3727, https://doi.org/10.5194/acp-17-3713-2017, 2017.
Jacobi, H.-W., Weller, R., Jones, A. E., Anderson, P. S., and Schrems, O.: Peroxyaccetyl nitrate (PAN) concentrations in the Antarctic troposphere measured during the photochemical experiment at Neumayer (PEAN'99), Atmos. Environ., 34, 5235–5247, https://doi.org/10.1016/S1352-2310(00)00190-4, 2000.
Jones, A. E., Weller, R., Minikin, A., Wolff, E. W., Sturges, W. T., McIntyre, H. P., Leonard, S. R., Schrems, O., and Bauguitte, S.: Oxidized nitrogen chemistry and speciation in the Antarctic troposphere, J. Geophys. Res., 104, 21355–21366, https://doi.org/10.1029/1999JD900362, 1999.
Jones, A. E., Weller, R., Wolff, E. W., and Jacobi, H.-W.: Speciation and rate of photochemical NO and NO2 production in Antarctic snow, Geophys. Res. Lett., 27, 345–348, https://doi.org/10.1029/1999GL010885, 2000.
Jones, A. E., Weller, R., Anderson, P. S., Jacobi, H.-W., Wolff, E. W., Schrems, O., and Miller, H.: Measurements of NOx emissions from the Antarctic snowpack, Geophys. Res. Lett., 28, 1499–1502, https://doi.org/10.1029/2000GL011956, 2001.
Jones, A. E., Wolff, E. W., Ames, D., Bauguitte, S. J.-B., Clemitshaw, K. C., Fleming, Z., Mills, G. P., Saiz-Lopez, A., Salmon, R. A., Sturges, W. T., and Worton, D. R.: The multi-seasonal NOy budget in coastal Antarctica and its link with surface snow and ice core nitrate: results from the CHABLIS campaign, Atmos. Chem. Phys., 11, 9271–9285, https://doi.org/10.5194/acp-11-9271-2011, 2011.
Joyce, E. E., Balint, S. J., and Hastings, M. G.: Isotopic evidence that alkyl nitrates are important to aerosol nitrate formation in the equatorial Pacific, Geophys. Res. Lett., 49, 1–10, https://doi.org/10.1029/2022GL099960, 2022.
Kaiser, J., Hastings, M. G., Houlton, B. Z., Rockmann, T., and Sigman, D. M.: Triple Oxygen Isotope Analysis of Nitrate Using the Denitrifier Method and Thermal Decomposition of N2O, Anal. Chem., 79, 599–607, https://doi.org/10.1021/ac061022s, 2007.
Kaleschke, L., Richter, A., Burrows, J., Afe, O., Heygster, G., Notholt, J., Rankin, A. M., Roscoe, H. K., Hollwedel, J., Wagner, T., and Jacobi, H.-W.: Frost flowers on sea ice as a source of sea salt and their influence on tropospheric halogen chemistry, Geophys. Res. Lett., 31, L16114, https://doi.org/10.1029/2004GL020655, 2004.
Kamezaki, K., Hattori, S., Iwamoto, Y., Ishino, S., Furutani, H., Miki, Y., Uematsu, M., Miura, K., and Yoshida, N.: Tracing the sources and formation pathways of atmospheric particulate nitrate over the Pacific Ocean using stable isotopes, Atmos. Environ., 209, 152–166, https://doi.org/10.1016/j.atmosenv.2019.04.026, 2019.
Kasibhatla, P., Sherwen, T., Evans, M. J., Carpenter, L. J., Reed, C., Alexander, B., Chen, Q., Sulprizio, M. P., Lee, J. D., Read, K. A., Bloss, W., Crilley, L. R., Keene, W. C., Pszenny, A. A. P., and Hodzic, A.: Global impact of nitrate photolysis in sea-salt aerosol on NOx, OH, and O3 in the marine boundary layer, Atmos. Chem. Phys., 18, 11185–11203, https://doi.org/10.5194/acp-18-11185-2018, 2018.
Lakkala, K., Aun, M., Sanchez, R., Bernhard, G., Asmi, E., Meinander, O., Nollas, F., Hülsen, G., Karppinen, T., Aaltonen, V., Arola, A., and de Leeuw, G.: New continuous total ozone, UV, VIS and PAR measurements at Marambio, 64∘ S, Antarctica, Earth Syst. Sci. Data, 12, 947–960, https://doi.org/10.5194/essd-12-947-2020, 2020.
Lawrence, M. G., and Crutzen, P. J.: Influence of NOx emissions from ships on tropospheric photochemistry and climate, Nature, 402, 167–170, https://doi.org/10.1038/46013, 1999.
Lee, H.-M., Henze, D. K., Alexander, B., and Murray, L. T.: Investigating the sensitivity of surface-level nitrate seasonality in Antarctica to primary sources using a global model, Atmos. Environ., 89, 757–767, https://doi.org/10.1016/j.atmosenv.2014.03.003, 2014.
Legrand, M., Preunkert, S., Frey, M., Bartels-Rausch, Th., Kukui, A., King, M. D., Savarino, J., Kerbrat, M., and Jourdain, B.: Large mixing ratios of atmospheric nitrous acid (HONO) at Concordia (East Antarctic Plateau) in summer: a strong source from surface snow?, Atmos. Chem. Phys., 14, 9963–9976, https://doi.org/10.5194/acp-14-9963-2014, 2014.
Li, J., Davy, P., Harvey, M., Katzman, T., Mitchell, T., and Michalski, G.: Nitrogen isotopes in nitrate aerosols collected in the remote marine boundary layer: Implications for nitrogen isotopic fractionations among atmospheric reactive nitrogen species, Atmos. Environ., 245, 1–10, https://doi.org/10.1016/j.atmosenv.2020.118028, 2021.
Lu, Z., Liu, X., Zaveri, R. A., Easter, R. C., Tilmes, S., Emmons, L. K., Vitt, F., Singh, B., Wang, H., Zhang, R., and Rasch, P. J.: Radiative Forcing of Nitrate Aerosols From 1975 to 2010 as Simulated by MOSAIC Module in CESM2-MAM4, J. Geophys. Res.-Atmos., 126, e2021JD034809, https://doi.org/10.1029/2021JD034809, 2021.
McCabe, J. R., Thiemens, M. H., and Savarino, J.: A record of ozone variability in South Pole Antarctic snow: Role of nitrate oxygen isotopes, J. Geophys. Res., 112, D12303, https://doi.org/10.1029/2006JD007822, 2007.
Michalski, G., and Bhattacharya, S. K.: The role of symmetry in the mass independent isotope effect in ozone, P. Natl. Acad. Sci. USA, 106, 5493–5496, https://doi.org/10.1073/pnas.0812755106, 2009.
Michalski, G., Scott, Z., Kabiling, M., and Thiemens, M. H.: First measurments and modeling of Δ17O in atmospheric nitrate, Geophys. Res. Lett., 30, 1870, https://doi.org/10.1029/2003GL017015, 2003.
Michalski, G., Bhattacharya, S. K., and Mase, D. F.: Oxygen isotope dynamics of atmospheric nitrate and its precursor molecules, in: Handbook of environmental isotope geochemistry. Advances in Isotope Geochemistry, edited by: Baskaran, M., Springer, Berlin, Heidelberg, 613–635, https://doi.org/10.1007/978-3-642-10637-8_30, 2012.
Miller, D. J., Chai, J., Guo, F., Dell, C. J., Karsten, H., and Hastings, M. G: Isotopic Composition of In Situ Soil NOx Emissions in Manure-Fertilized Cropland, Geophys. Res. Lett., 45, 12058–12066, https://doi.org/10.1029/2018GL079619, 2018.
Morin, S., Savarino, J., Frey, M. M., Domine, F., Jacobi, H. W., Kaleschke, L., and Martins, J. M.: Comprehensive isotopic composition of atmospheric nitrate in the Atlantic Ocean boundary layer from 65∘ S to 79∘ N, J. Geophys. Res., 114, D05303, https://doi.org/10.1029/2008JD010696, 2009.
Morin, S., Sander, R., and Savarino, J.: Simulation of the diurnal variations of the oxygen isotope anomaly (Δ17O) of reactive atmospheric species, Atmos. Chem. Phys., 11, 3653–3671, https://doi.org/10.5194/acp-11-3653-2011, 2011.
Morin, S., Erbland, J., Savarino, J., Domine, F., Bock, J., Friess, U., Jacobi, H.-W., Sihler, H., and Martins, J. M. F.: An isotopic view on the connection between photolytic emissions of NOx from the Arctic snowpack and its oxidation by reactive halogens, J. Geophys. Res., 117, D00R08, https://doi.org/10.1029/2011JD016618, 2012.
Nesbitt, S. W., Zhang, R., and Orville, R. E.: Seasonal and global NOx production by lightning estimated from the Optical Transient Detector (OTD), Tellus B, 52, 1206–1215, https://doi.org/10.3402/tellusb.v52i5.17098, 2000.
Obbard, R. W.: Microplastics in Polar Regions: The role of long range transport, Curr. Opin. Environ. Sci., 1, 24–29, https://doi.org/10.1016/j.coesh.2017.10.004, 2018.
Park, S. S. and Kim, Y. J.: Source contributions to fine particulate matter in an urban atmosphere, Chemosphere, 59, 217–226, https://doi.org/10.1016/j.chemosphere.2004.11.001, 2005.
Parsons, T. R., Maita, Y., and Lalli, C. M.: A Manual of Chemical and Biological Methods for Seawater Analysis Pergamon, Pergamon Press, Oxford, 7–9, https://doi.org/10.25607/OBP-1830, 1984.
Paton-Walsh, C., Emmerson, K. M., Garland, R. M., Keywood, M., Hoelzemann, J. J., Huneeus, N., Buchholz, R. R., Humphries, R. S., Altieri, K., Schmale, J., Wilson, S. R., Labuschagne, C., Kalisa, E., Fisher, J. A., Deutscher, N. M., van Zyl, P. G., Beukes, J. P., Joubert, W., Martin, L., Mkololo, T., Barbosa, C., Anrade, M. de F., Schofield, R., Mallet, M. D., Harvey, M. J., Formenti, P., Piketh, S. J., and Olivares, G.: Key challenges for tropospheric chemistry in the Southern Hemisphere, Elem. Sci. Anth., 10, 1–35, https://doi.org/10.1525/elementa.2021.00050, 2022.
Reed, C., Evans, M. J., Crilley, L. R., Bloss, W. J., Sherwen, T., Read, K. A., Lee, J. D., and Carpenter, L. J.: Evidence for renoxification in the tropical marine boundary layer, Atmos. Chem. Phys., 17, 4081–4092, https://doi.org/10.5194/acp-17-4081-2017, 2017.
Rolph, G., Stein, A., and Stunder, B.: Real-time environmental applications and display system: READY, Environ. Model. Softw., 95, 210–228, https://doi.org/10.1016/j.envsoft.2017.06.025, 2017.
Romer, P. S., Wooldridge, P. J., Crounse, J. D., Kim, M. J., Wennberg, P. O., Dibb, J. E., Scheuer, E., Blake, D. R., Meinardi, S., Brosius, A. L., Thames, A. B., Miller, D. O., Brune, W. H., Hall, S. R., Ryerson, T. B., and Cohen, R. C.: Constraints on Aerosol Nitrate Photolysis as a Potential Source of HONO and NOx, Environ. Sci. Technol., 52, 13738–13746, https://doi.org/10.1021/acs.est.8b03861, 2018.
Savarino, J., Kaiser, J., Morin, S., Sigman, D. M., and Thiemens, M. H.: Nitrogen and oxygen isotopic constraints on the origin of atmospheric nitrate in coastal Antarctica, Atmos. Chem. Phys., 7, 1925–1945, https://doi.org/10.5194/acp-7-1925-2007, 2007.
Savarino, J., Bhattacharya, S. K., Morin, S., Baroni, M., and Doussin, J.-F.: The NO+O3 Reaction: A Triple Oxygen Isotope Perspective on the Reaction Dynamics and Atmospheric Implications for the Transfer of the Ozone Isotope Anomaly, J. Chem. Phys., 128, 194303, https://doi.org/10.1063/1.2917581, 2008.
Savarino, J., Vicars, W. C., Legrand, M., Preunkert, S., Jourdain, B., Frey, M. M., Kukui, A., Caillon, N., and Gil Roca, J.: Oxygen isotope mass balance of atmospheric nitrate at Dome C, East Antarctica, during the OPALE campaign, Atmos. Chem. Phys., 16, 2659–2673, https://doi.org/10.5194/acp-16-2659-2016, 2016.
Savoie, D. L., Prospero, J. M., Larsen, R. J., Haung, F., Izaguirre, M. A., Haung, T., Snowdon, T. H., Custals, L., and Sanderson, C. G.: Nitrogen and Sulphur Species in Antarctic Aerosols at Mawson, Palmer Station, and Marsh (King George Island), J. Atmos. Chem., 17, 95–122, https://doi.org/10.1007/BF00702821, 1993.
Schmale, J., Baccarini, A., Thurnherr, I., Henning, S., Efraim, A., Regayre, L., Bolas, C., Hartmann, M., Welti, A., Lehtipalo, K., Aemisegger, F., Tatzelt, C., Landwehr, S., Modini, R. L., Tummon, F., Johnson, J. S., Harris, N., Schnaiter, M., Toffoli, A., Derkani. M., Bukowiecki, N., Stratmann, F., Dommen, J., Baltensperger, U., Wernli, H., Rosenfeld, D., Gysel-Beer, M., and Carslaw, K. S.: Overview of the Antarctic Circumnavigation Expedition: study of preindustrial-like aerosols and their climate effects (ACE-SPACE), B. Am. Meteorol. Soc., 100, 2260–2283, 2019.
Schumann, U. and Huntrieser, H.: The global lightning-induced nitrogen oxides source, Atmos. Chem. Phys., 7, 3823–3907, https://doi.org/10.5194/acp-7-3823-2007, 2007.
Shi, G., Buffen, A. M., Ma, H., Hu, Z., Sun, B., Li, C., Yu, J., Ma, T., An, C., Jiang, S., Li, Y., and Hastings, M. G.: Distinguishing summertime atmospheric production of nitrate across the East Antarctic ice sheet, Geochim. Cosmochim. Ac., 231, 1–14, https://doi.org/10.1016/j.gca.2018.03.025, 2018.
Shi, G., Ma, H., Zhu, Z., Hu, A., Chen, Z., Jiang, Su., An, C., Yu, J., Ma, T., Li, Y., Sun, B., and Hastings, M. G.: Using stable isotopes to distinguish atmospheric nitrate production and its contribution to the surface ocean across hemispheres, Earth Planet. Sc. Lett., 564, 116914, https://doi.org/10.1016/j.epsl.2021.116914, 2021.
Shi, G., Li, C., Li, Y., Chen, Z., Ging, M., Ma, H., Jiang, S., An, C., Guo, J., Sun, B., and Hastings, M. Q.: Isotopic constraints on sources, production, and phase partitioning for nitrate in the atmosphere and snowfall in coastal East Antarctica, Earth Planet. Sc. Lett., 578, 1–12, https://doi.org/10.1016/j.epsl.2021.117300, 2022.
Sigman, D. M., Casciotti, K. L., Andreani, M., Barford, C., Galanter, M., and Böhlke, J. K.: A bacterial method for the nitrogen isotopic analysis of nitrate in seawater and freshwater, Anal. Chem., 73, 4145–4153, https://doi.org/10.1021/ac010088e, 2001.
Sinclair, K. E., Bertler, N. A. N., Trompetter, W. J., and Baisden, W. T.: Seasonality of airmass pathways to coastal Antarctica: ramifications for interpreting high-resolution ice core records, J. Climate, 26, 2065–2076, https://doi.org/10.1175/JCLI-D-12-00167.1, 2013.
Spreen, G., Kaleschke, L., and Heygster, G.: Sea ice remote sensing using AMSR-E 89-GHz channels, J. Geophys. Res., 113, C02S03, https://doi.org/10.1029/2005JC003384, 2008.
Stein, A. F., Draxler, R. R, Rolph, G. D., Stunder, B. J. B., Cohen, M. D., and Ngan, F.: NOAA's HYSPLIT atmospheric transport and dispersion modeling system, B. Am. Meteorol. Soc., 96, 2059–2077, https://doi.org/10.1175/BAMS-D-14-00110.1, 2015.
Strickland, J. D. H. and Parsons, T. R.: A practical handbook of seawater analysis, 2nd Edn., B. Fish. Res. Board Can., 167, 77–80, https://doi.org/10.25607/OBP-1791, 1972.
Theys, N., Van Roozendael, M., Hendrick, F., Yang, X., De Smedt, I., Richter, A., Begoin, M., Errera, Q., Johnston, P. V., Kreher, K., and De Mazière, M.: Global observations of tropospheric BrO columns using GOME-2 satellite data, Atmos. Chem. Phys., 11, 1791–1811, https://doi.org/10.5194/acp-11-1791-2011, 2011.
Thiemens, M. H.: History and Applications of Mass-Independent Isotope Effects, Annu. Rev. Earth Planet. Sci., 34, 217–262, https://doi.org/10.1146/annurev.earth.34.031405.125026, 2006.
van der A, R. J., Eskes, H. J., Boersma, K. F., van Noije, T. P., Van Roozendael, M., De Smedt, I., Peters, D. H. M. U., and Meijer, E. W.: Trends, seasonal variability and dominant NOx source derived from a ten year record of NO2 measured from space, J. Geophys. Res., 113, D04302, https://doi.org/10.1029/2007JD009021, 2008.
Vicars, W. C. and Savarino, J.: Quantitative constraints on the 17O-excess (Δ17O) signature of surface ozone: Ambient measurements from 50∘ N to 50∘ S using the nitrite-coated filter technique, Geochim. Cosmochim. Ac., 135, 270–287, https://doi.org/10.1016/j.gca.2014.03.023, 2014.
von Savigny, C., Ulasi, E. P., Eichmann, K.-U., Bovensmann, H., and Burrows, J. P.: Detection and mapping of polar stratospheric clouds using limb scattering observations, Atmos. Chem. Phys., 5, 3071–3079, https://doi.org/10.5194/acp-5-3071-2005, 2005.
Wagenbach, D., Legrand, M., Fischer, H., Pichlmayer, F., and Wolff, E.W.: Atmospheric near-surface nitrate at coastal Antarctic sites, J. Geophys. Res., 103, 11007–11020, https://doi.org/10.1029/97JD03364, 1998.
Walters, W. W. and Michalski, G.: Theoretical calculation of oxygen equilibrium isotope fractionation factors involving various NOy molecules, OH, and H2O and its implications for isotope variations in atmospheric nitrate, Geochim. Cosmochim. Ac., 191, 89–101, https://doi.org/10.1016/j.gca.2016.06.039, 2016.
Walters, W. W., Simonini, D. S., and Michalski, G.: Nitrogen isotope exchange between NO and NO2 and its implications for δ15N variations in tropospheric NOx and atmospheric nitrate, Geophys. Res. Lett., 43, 440–448, https://doi.org/10.1002/2015GL066438, 2016.
Walters, W. W., Michalski, G., Bohlke, J. K., Alexander, B., Savarino, J., and Thiemens, M. H.: Assessing the seasonal dynamic of nitrate and sulfate aerosols at the South Pole utilizing stable isotopes, J. Geophys. Res.-Atmos., 124, 8161–8177, https://doi.org/10.1029/2019JD030517, 2019.
Wang, Z., Stephens, G., Deshler, T., Trepre, C., Parish, T., Vane, D., Winker, D., Liu, D., and Adhikari, L.: Association of Antarctic polar stratospheric cloud formation on tropospheric cloud systems, Geophys. Res. Lett., 35, L13806, https://doi.org/10.1029/2008GL034209, 2008.
Winton, V. H. L., Ming, A., Caillon, N., Hauge, L., Jones, A. E., Savarino, J., Yang, X., and Frey, M. M.: Deposition, recycling, and archival of nitrate stable isotopes between the air–snow interface: comparison between Dronning Maud Land and Dome C, Antarctica, Atmos. Chem. Phys., 20, 5861–5885, https://doi.org/10.5194/acp-20-5861-2020, 2020.
Wolff, E. W., Jones, A. E., Bauguitte, S. J.-B., and Salmon, R. A.: The interpretation of spikes and trends in concentration of nitrate in polar ice cores, based on evidence from snow and atmospheric measurements, Atmos. Chem. Phys., 8, 5627–5634, https://doi.org/10.5194/acp-8-5627-2008, 2008.
Yang, X., Pyle, J. A., Cox, R. A., Theys, N., and Van Roozendael, M.: Snow-sourced bromine and its implications for polar tropospheric ozone, Atmos. Chem. Phys., 10, 7763–7773, https://doi.org/10.5194/acp-10-7763-2010, 2010.
Ye, C., Zhou, X., Pu, D., Stutz, J., Festa, J., Spolaor, M., Tsai, C., Cantrell, C., Mauldin III, R. L., Campos, T., Weinheimer, A., Hornbrook, R. S., Apel, E. C., Guenther, A., Kaser, L., Yuan, B., Karl, T., Haggerty, J., Hall, S., Ullmann, K., Smith, J. N., Ortega, J., and Christoph, K.: Rapid cycling of reactive nitrogen in the marine boundary layer, Nature, 532, 489–491, https://doi.org/10.1038/nature17195, 2016.
Zhou, X., Gao, H., He, Y., Huang, G., Bertman, S. B., Civerolo, K., and Schwab, J.: Nitric acid photolysis on surfaces in low-NOx environments: Significant atmospheric implications, Geophys. Res. Lett., 23, 2217, https://doi.org/10.1029/2003GL018620, 2003.
Zong, Z., Wang, X., Tian, C., Chen, Y., Fang, Y., Zhang, F., Li, C., Sun, J., Li, J., and Zhang, G.: First assessment of NOx sources at a regional background site in North China using isotopic analysis linked with modeling, Environ. Sci. Technol., 51, 5923–5931, https://doi.org/10.1021/acs.est.6b06316, 2017.