the Creative Commons Attribution 4.0 License.
the Creative Commons Attribution 4.0 License.
 | 13 Jan 2023
Quantifying daily NOx and CO2 emissions from Wuhan using satellite observations from TROPOMI and OCO-2
K. Folkert Boersma
Henk Eskes
Cuihong Chen
Haotian Zheng
Xingying Zhang
Quantification and control of NOx and CO2 emissions are essential across the world to limit adverse climate change and improve air quality. We present a new top-down method, an improved superposition column model to estimate day-to-day NOx and CO2 emissions from the large city of Wuhan, China, located in a polluted background. The latest released version 2.3.1 TROPOMI (TROPOspheric Monitoring Instrument) NO2 columns and version 10r of the Orbiting Carbon Observatory-2 (OCO-2)-observed CO2 mixing ratio are employed. We quantified daily NOx and CO2 emissions from Wuhan between September 2019 and October 2020 with an uncertainty of 31 % and 43 %, compared to 39 % and 49 % with the earlier v1.3 TROPOMI data, respectively. Our estimated NOx and CO2 emissions are verified against bottom-up inventories with minor deviations (<3 % for the 2019 mean, ranging from −20 % to 48 % on a daily basis). Based on the estimated CO2 emissions, we also predicted daily CO2 column mixing ratio enhancements, which match well with OCO-2 observations (<5 % bias, within ±0.3 ppm). We capture the day-to-day variation of NOx and CO2 emissions from Wuhan in 2019–2020, which does not reveal a substantial “weekend reduction” but does show a clear “holiday reduction” in the NOx and CO2 emissions. Our method also quantifies the abrupt decrease and slow NOx and CO2 emissions rebound due to the Wuhan lockdown in early 2020. This work demonstrates the improved superposition model to be a promising new tool for the quantification of city NOx and CO2 emissions, allowing policymakers to gain real-time information on spatial–temporal emission patterns and the effectiveness of carbon and nitrogen regulation in urban environments.
- Article
(5905 KB) - Full-text XML
-
Supplement
(2272 KB) - BibTeX
- EndNote


Fossil fuel combustion by power plants, industrial activities, transportation and residential energy use sectors leads to the emission of nitrogen oxides () as well as carbon dioxide (CO2). Traditional bottom-up NOx and CO2 emission estimates have a time lag of several years because it takes time to access and compile accurate information on energy consumption and emission factors (Lamsal et al., 2011; F. Liu et al., 2020).
For decades, satellites have been continuously providing information on NO2 distributions and trends with good quality, and satellite data are widely used to quantify NOx emissions and changes (Lamsal et al., 2010; Visser et al., 2019; Zhang et al., 2020, 2021). Based on satellite-retrieved NO2 data, previous studies quantified long-term mean (monthly, yearly or multi-yearly) NOx emissions on global and regional scales (Lamsal et al., 2011; Visser et al., 2019). Beirle et al. (2011) analyzed plumes of satellite NO2 columns downwind of strong sources averaged for each wind direction and then inferred NOx emissions from isolated significant point sources and megacities. Inspired by this idea, Lorente et al. (2019) analyzed the increase of NO2 along with the wind over the extensive pollution source of Paris. The buildup of NO2 over the city observed from space, in combination with wind speed and direction information, allows us to obtain day-by-day (sub)urban NOx emission estimates and lifetimes as long as the city is under a clear sky and winds are relatively constant in time. This approach does not need burdensome inverse modeling computations and opens possibilities for rapid and direct monitoring of NOx emissions from space.
In contrast to NOx, it is challenging to infer accurate localized anthropogenic CO2 emissions from satellite CO2 retrievals. One reason is that the background CO2 concentration is orders of magnitude higher than the enhancement caused by anthropogenic emissions, reflecting the long atmospheric lifetime of CO2 (Reuter et al., 2014, 2019). Another reason is that the spatial and temporal coverage of current CO2 sensors is too sparse to allow for substantial averaging of noisy signals by revisiting of scenes, precluding detailed CO2 emission estimation (Zheng et al., 2020a; F. Liu et al., 2020). Using satellite NO2 measurements to estimate anthropogenic NOx emissions as the basis to infer anthropogenic CO2 emission has been proposed in several studies (Reuter et al., 2019; F. Liu et al., 2020; Berezin et al., 2013; Zheng et al., 2020a). However, to our knowledge, there is no method that estimates day-to-day top-down CO2 emission estimation on a (sub-)city scale.
Here we revisit the method of Lorente et al. (2019) to improve our understanding of its potential and limitations and extend it to estimate city-scale daily NOx and CO2 emissions. We present an improved superposition model that considers the buildup of pollution over a source area as in Lorente et al. (2019), as well as the decay of NO2 downwind of the source, but now also accounts for changes in the background NO2 pollution along the wind direction. The background NO2 pollution was considered to remain constant by Lorente et al. (2019) for Paris, which is not surrounded by significant surface sources of NOx pollution. Here we apply our improved method to a highly polluted urban area, the megacity of Wuhan in the Hubei Province of China, which, other than the relatively isolated city of Paris, is located in a polluted background with many surrounding surface pollution sources that potentially interfere with the buildup and decay of the NO2 plume from Wuhan. Using this improved superposition model, together with bottom-up information on the emission ratio, we infer NOx and CO2 emissions on a day-by-day basis over a full year from September 2019 to August 2020 and analyze the variation in emissions and NOx chemical lifetime from day to day. Of particular interest are the reductions and subsequent rebound of NOx and CO2 emissions associated with the COVID-19 lockdown measures in Wuhan, which have been reported in other studies and serve here as a useful check of the robustness of our method.
2.1 Satellite data
In this study, we use the newly released level-2, version 2.3.1 of the S-5P TROPOMI (TROPOspheric Monitoring Instrument) data (TROPOMI-v2.3.1) between September 2019 and August 2020. The S-5P (Sentinel-5 Precursor) satellite was launched in October 2017, and the TROPOMI on board provides tropospheric NO2 columns with an unprecedented horizontal resolution of up to 5.5 km × 3.5 km (as of 6 August 2019) and high signal-to-noise ratio (Griffin et al., 2019; van Geffen et al., 2020). The v2.3.1 dataset is provided by S5P-PAL (S5P Science and Technology Product Algorithm Laboratory) (Eskes et al., 2021). It is dedicated to supporting the research on the impact of the COVID lockdown on air quality. Improved (residual) cloud pressures correct the low bias of v1.x data compared to Ozone Monitoring Instrument (OMI) and ground-based measurements over east China (Wang et al., 2020; M. Liu et al., 2020). In addition, improved treatment for the surface albedo increases the columns for cloud-free scenes (van Geffen et al., 2022). Overall, compared to the earlier version, this dataset has 10–40 % higher tropospheric NO2 columns over polluted scenes due to the improved cloud retrieval and other algorithm updates (van Geffen et al., 2022; Riess et al., 2022). Over Wuhan, we find an average increase (compared to the v1.3 data, from now on referred to as TROPOMI-v1.3) in tropospheric NO2 column density of about 25 %. Still, there are also differences between the two versions in terms of spatial and temporal distribution (Fig. S1 in the Supplement). According to Fig. S1, the increase in v2.3.1 is much stronger over the polluted area (city center) and in the polluted period (9 September and 3 October 2019). Since the v1.x TROPOMI data are widely used in previous studies (e.g., Bauwens et al., 2020; Ding et al., 2020; Zhang et al., 2021), we also compared the estimated NOx lifetime and emissions from the TROPOMI-v2.3.1 data and the TROPOMI-v1.3 data, which will be discussed in Sect. 3.1. For the record, when estimating the NOx emissions and lifetime over Wuhan, we scaled up the TROPOMI-v1.3 NO2 columns by a factor of 1.6 to correct for the known −40 % bias in TROPOMI NO2 data as reported by M. Liu et al. (2020).
We sampled the TROPOMI NO2 columns into 0.05∘ latitude × 0.05∘ longitude grid cells ( km2). To ensure good data quality, we filtered out the data with cloud radiance fractions greater than 0.5 (geometric cloud fraction less than 0.2) and obtained 81 clear-sky days with full TROPOMI NO2 coverage over the Wuhan region in 1 full year.
The column-averaged dry-air mole fraction of CO2 (XCO2) data provided by the Orbiting Carbon Observatory-2 (OCO-2) is also employed to verify Wuhan's derived CO2 emission inventory. We use version 10r of the bias-corrected XCO2 product (Gunson and Eldering, 2020). The v10r OCO-2 XCO2 product has high accuracy, with a single sounding precision of ∼0.8 ppm over land and ∼0.5 ppm over water and root-mean-square biases of 0.5–0.7 ppm over both land and water (O'Dell et al., 2021).
2.2 Bottom-up emission information
Bottom-up NOx and CO2 emission inventories are used to provide the first guess of the NOx emission spatial pattern (for NOx, in the Supplement, Sect. S1 and Fig. S2) and to verify the top-down emissions. We use the Air Benefit and Attainment and Cost Assessment System Emission Inventory (ABACAS) (Zhao et al., 2013, 2018; Zheng et al., 2019) to provide NOx and CO2 emissions for the year 2019. The Multi-resolution Emission Inventory (MEIC) (Li et al., 2017) NOx emissions for 2017 are also employed.
2.3 Other input data
Besides the satellite data and bottom-up emission inventories, a set of other parameters is input into our improved superposition model. They include the hydroxyl radical (OH) concentration, the loss rate (k) of NOx in the atmosphere, the ratio and the wind field. We use version 12.1 of the GEOS-Chem model with a horizontal resolution of ( km2) to provide the a priori guesses for chemical parameters relevant to daytime NOx. The wind field is from ERA5 (ECMWF Reanalysis v5), the fifth-generation ECMWF (European Centre for Medium-Range Weather Forecasts) atmospheric reanalysis of the global climate (Hersbach et al., 2020). Detailed information on these data can be found in Sect. S2. Considering that the wind field strongly influences the distribution of NO2 column patterns, and thus on the NOx emission estimation, we filter the TROPOMI NO2 data based on the wind fields. After excluding the days with fluctuating wind direction (if the wind direction changes more than 45∘ in the hours before the TROPOMI overpass) within the study domain, we finally obtained 50 d out of the ensemble of 81 valid satellite days between 1 September 2019 and 31 August 2020 to estimate NOx and CO2 emissions from Wuhan. The fraction of useful days is comparable to what Lorente et al. (2019) obtained for Paris, which is 27 d in 5 months.
2.4 NO2 pattern fits: estimation of lifetime and emission
To ensure that the whole area of Wuhan is included, we determine our study domain as a circular region centered at 114∘ E, 30.7∘ N, with a diameter of ∼186 km. It includes the whole area of Wuhan and the small city of Ezhou to the east of Wuhan, the southwest part of Huanggang and the east part of Xiaogan (Fig. S4, red circle). We also do a sensitivity test to narrow the study area down to within the Third Ring Road of Wuhan to check the robustness of our model to the area size of the study domain (Fig. S4, the blue circle). For each day, we converted the two-dimensional NO2 column map over the domain to a one-dimensional line density along the wind direction (Sect. S3) (Beirle et al., 2011; Lorente et al., 2019). NOx emissions and lifetimes can be estimated by fitting the NO2 line density over the domain.
Lorente et al. (2019) presented a superposition column model based on a simple column model (Jacob, 1999) to simulate NO2 line density over Paris. They considered the buildup of NO2 caused by spatially varying NOx emissions from each cell and used the NO2 line density value at the upwind end of the city to represent the background value, which they assumed to be constant over the city. This appears plausible if the background value were to mostly represent free-tropospheric NO2, which has a longer lifetime than NO2 in the oxidizing polluted boundary layer and varies smoothly according to models. Our method to simulate the NO2 line density over the city is also based on the column model (Jacob, 1999) but differs from that of Lorente et al. (2019) in considering the background NO2 value. Each cell along the wind direction is treated separately as a column model. Since the satellite has an overpass time of around 13:30 LT (local time), NOx is removed in the atmosphere dominantly through the first-order reaction with OH. NOx emissions from the current cell contribute to the total line density through the buildup of NO2 density within the cell and exponential decay of NO2 downwind of the cell (Eq. 1). It does not contribute to the upwind cells (Eq. 2).
where Ni represents the NO2 line density (molec. cm−1) contributed from Ei in cell i; L is the length of each cell, i.e. 600 000 cm; k is the loss rate (s−1) of NOx at 13:00 LT ; and u denotes the NO2-density-weighted mean wind speed in units of centimeters per second (cm s−1) within the planetary boundary layer. We add up the contributions from each cell and the background value to model the overall NO2 line density:
Here, b represents the starting background value, equivalent to the mean NO2 line density within the 5 (for summer, spring and autumn) or 10 (for winter) cells upwind of x=0. α denotes the linear change of background value with distance along the wind and represents the chemical decay of background NO2 flowing into the polluted boundary layer over the city.
We fit the terms that drive N(x) (i.e., Ei, k and α) with the fixed L, u and from external data, via a least-squares minimization to the TROPOMI observed line density NTROPOMI(x). For each day, we run the model 20 times, randomly choosing OH concentration within the ±20 % interval of the GEOS-Chem-simulated OH concentration. The set of parameters Ei, k and α that best explain the observations over the city is the answer we are seeking. The parameter that describes the decay of upwind NO2 over the city, the α value, is determined by the difference of NO2 line density between the end and start point of the study domain, , and we allow it to change between ±α in the fitting procedure. For the 50 d on average, the α value is molec. cm−2. The α value being negative reflects the decay of upwind NO2 pollution along the wind.
The assumption of a linearly decreasing NO2 background is relevant under conditions when the city is in a polluted background. It accounts for decay of upwind NO2 pollution arriving at the city when transported over and downwind of the city. In reality, upwind NO2 pollution mixes in with the freshly emitted NOx and is then subject to chemical decay (with non-linearities due to turbulent mixing and spatial heterogeneity in emissions). We acknowledge that our linear decrease of background NO2 pollution is a severe simplification. Still, as shown in Fig. 1, compared to fitting results with a constant background value, we obtain a better correlation (up to 25 %) and lower bias (nearly 50 % lower) between fitted and observed NO2 line densities when fitting with a linearly changing background value.
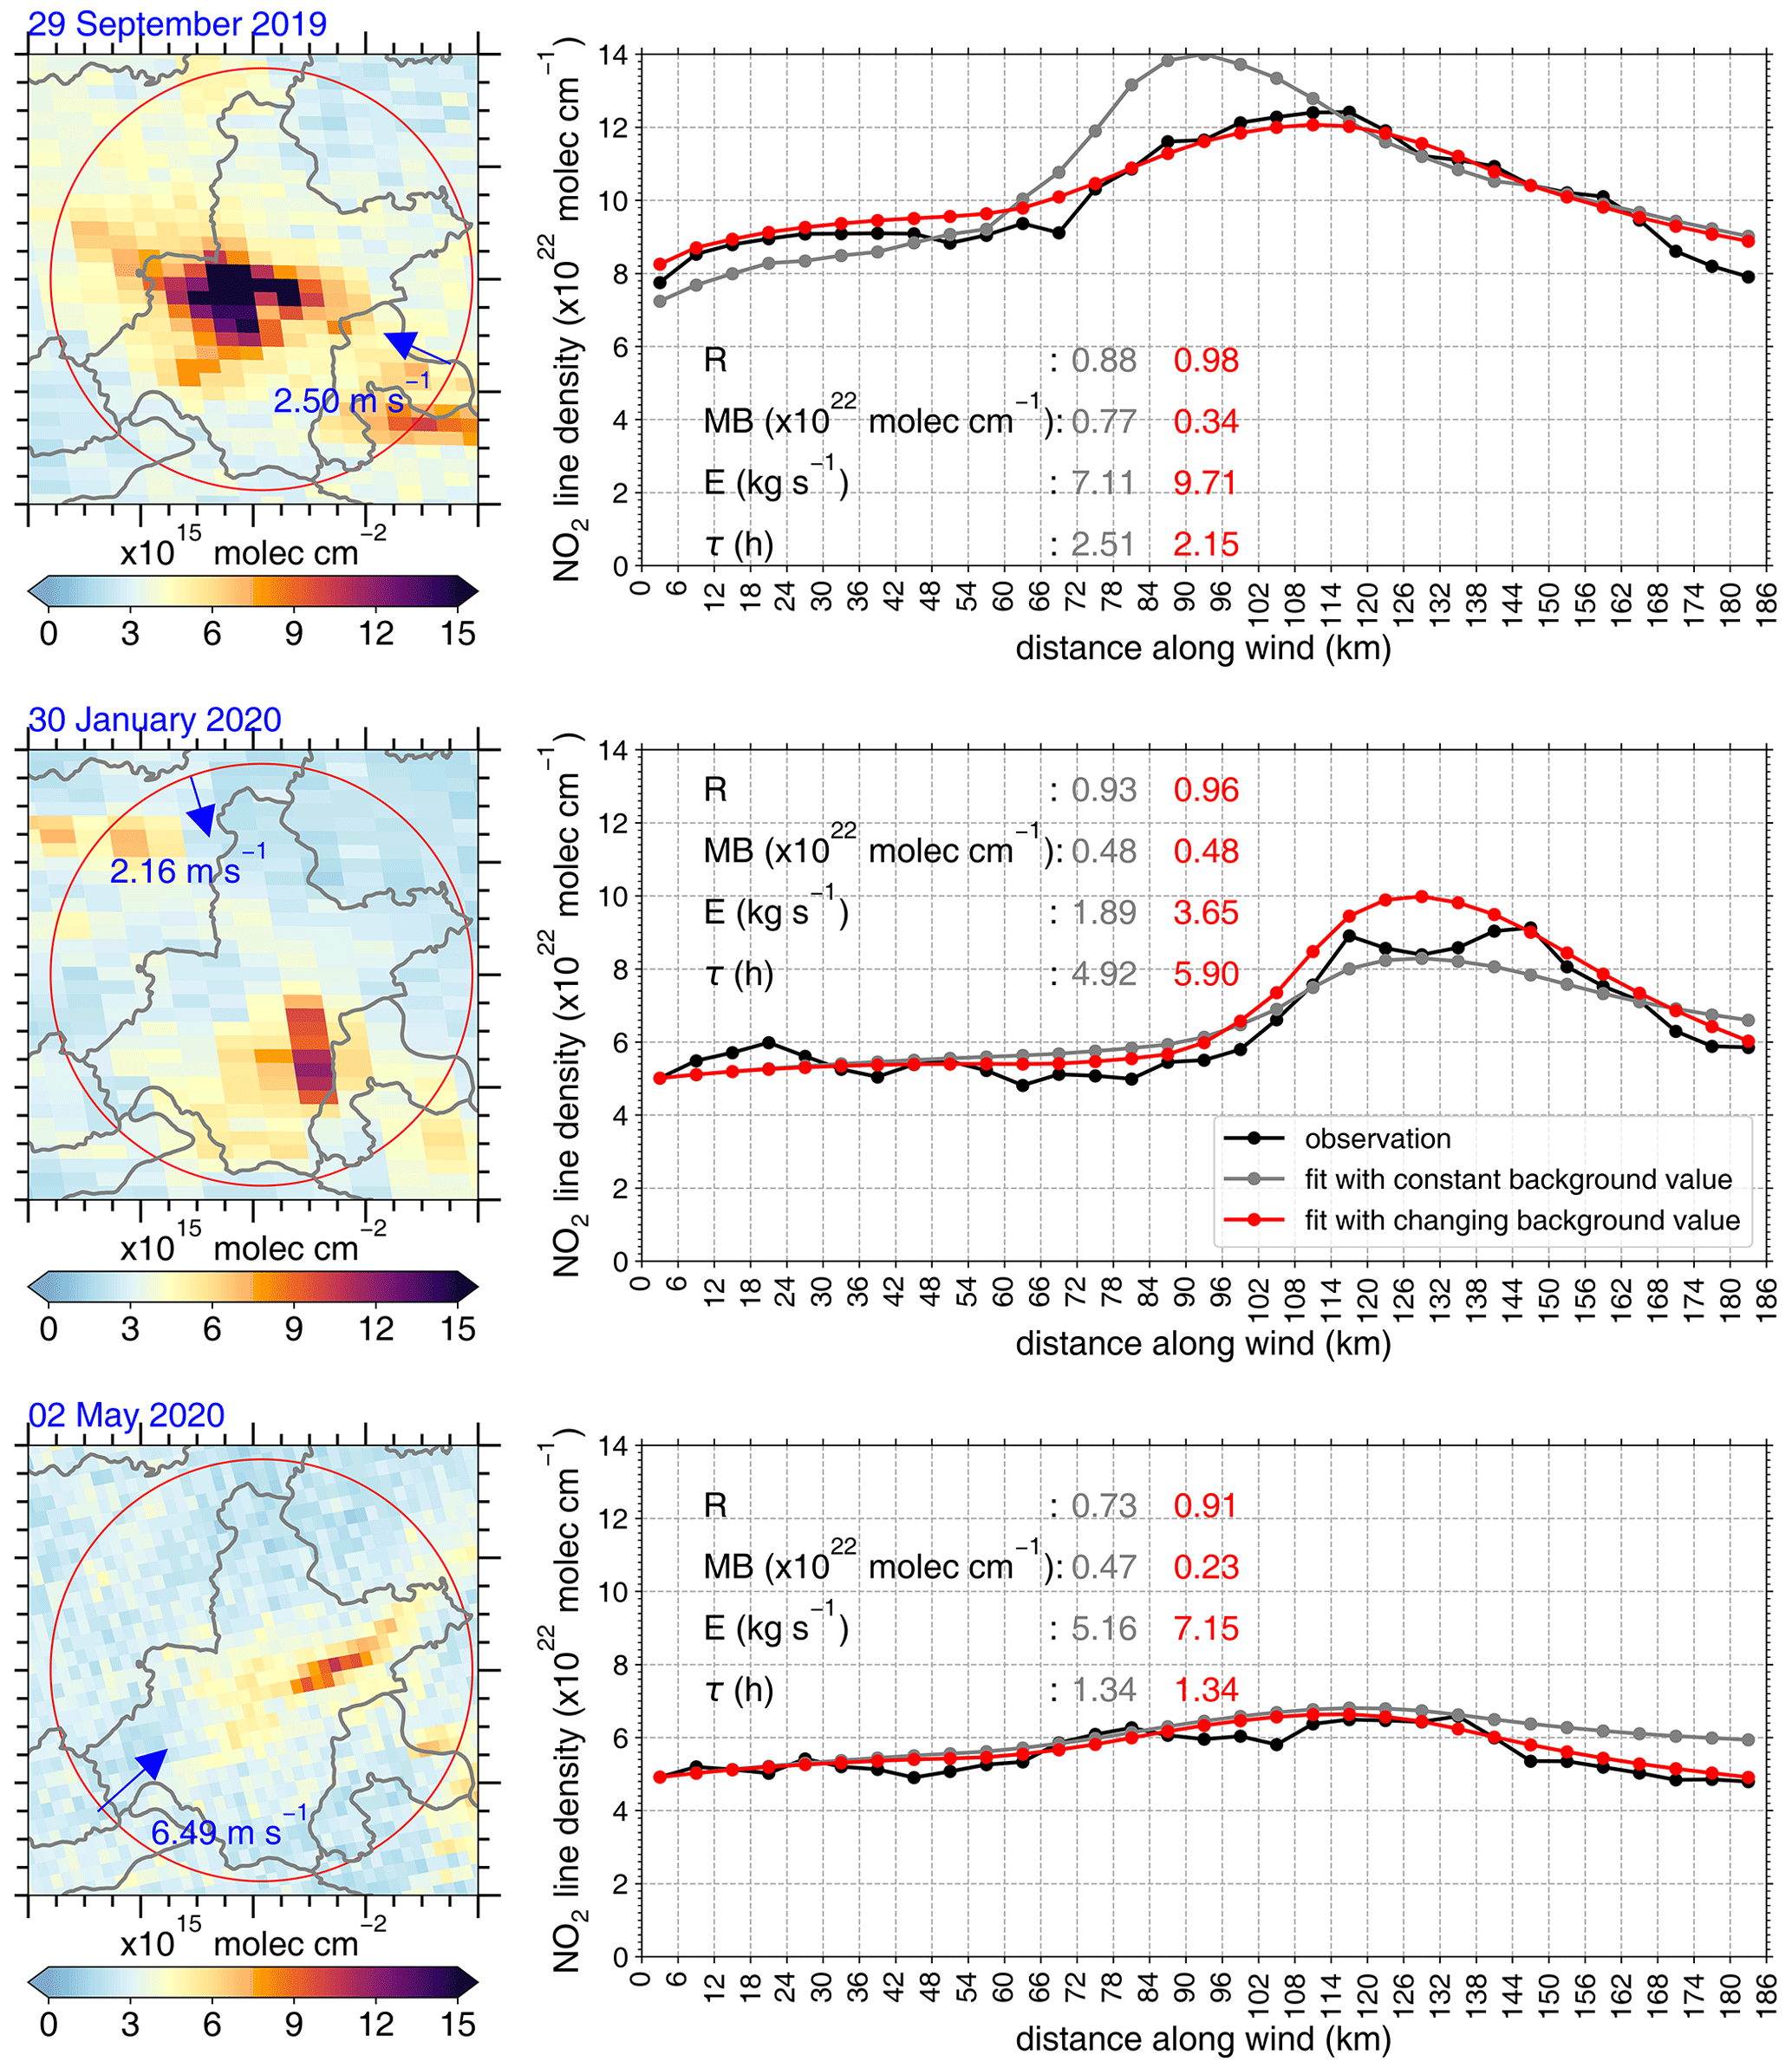
Figure 1Tropospheric NO2 columns over Wuhan on 29 September 2019, 30 January 2020 and 2 May 2020 (left panels, from top to bottom); the red circle inside each map defines the study domain. The corresponding NO2 line densities along wind within the study domain are given in the right panel. For each day, the correlation coefficient (R) between the observed (black line) and fitted (grey and red lines) NO2 line density is given. The fitted mean bias (MB), NOx emissions (E) and NOx lifetime (τ) are also displayed.
2.5 CO2 emission estimation
City-scale CO2 emissions are estimated through Eq. (4):
The anthropogenic emission ratio is provided by the ABACAS inventory and amounts to ∼591 g CO2 per g NOx emitted from our study domain for the year 2019. In 2020, emissions from the transport sector had substantially decreased due to the lockdown measurements (Huang et al., 2021; Zheng et al., 2020b). The more substantial decrease in transport NOx emissions relative to declines from other sectors is predicted to have led to an increase in the emission ratio, for this ratio is lowest in the transport sector (Zheng et al., 2020b). The monthly emission ratio for Wuhan was calculated based on recent reports on sectoral NOx emissions in 2020 from Hubei Province (Zheng et al., 2021a). We further calculated the daily emission ratio based on the monthly, daily, and diurnal variations of CO2 and NOx emissions (Fig. S5). The final daily emission ratio for the study period displayed in Table S1 in the Supplement indeed shows increases in the emission ratio of up to 20 % during the lockdown period in 2020 due to the reduced contribution from the transport sector.
2.6 Uncertainty in NOx and CO2 emission estimation
Uncertainties in quantifying NOx and CO2 emissions contain the systematic error in the TROPOMI NO2 retrieval, bias in the assumed a priori OH concentration, ratio, emission ratio, uncertainties in wind fields and the area of the study domain. The v2.3.1 NO2 column dataset corrected the low bias in TROPOMI (v1.x) tropospheric NO2 column over eastern China by 15 %–100 % (van Geffen et al., 2022), but there remains an uncertainty of %. The chemical transport models (CTMs) have difficulty simulating accurate OH concentration, but for >90 % of the days, our fitted OH concentrations fall in the ±20 % range around GEOS-Chem simulation, so the uncertainty in OH concentration is likely on the order of ±20 %. The difference between the model-simulated and observed ratio is less than 10 %, so we give an uncertainty in ratio of ±10 %. Uncertainty in the emission ratio comes from the errors in sectoral NOx and CO2 emissions, and we calculated that the corresponding uncertainty is ±30 %. We use the NO2-column-weighted mean instead of the arithmetic mean value to get the boundary layer mean wind speed to minimize the error in the wind field, but there may remain ±20 % uncertainty in the ERA5 reanalysis data. We ran a test by randomly choosing parameter values within their uncertainty ranges 20 times to predict an ensemble of NOx and CO2 emission outcomes. Then the ratio of the standard deviation to the mean value of the 20 emission outcomes is regarded as the uncertainty on NOx and CO2 emission caused by uncertainties in the corresponding parameters, which are displayed in Table S2. The uncertainty caused by the domain size is determined by narrowing down our study domain to the Wuhan city center (see Sect. S4 and Fig. S6). The results demonstrate that when the study domain is narrowed down to 84 km diameter, as expected, it turns out to be structurally different from that with the 186 km diameter domain. This is because the mean OH concentration is lower in the city center, leading to longer fitted NOx lifetime. However, the change in fitted NOx lifetime and NOx emission is within ±15 %. So, we apply a 15 % uncertainty in NOx emissions and lifetime estimation caused by the area size of the study domain. Finally, considering that all these parameters are independent of each other, we use the root-mean-square sum of the contributions to represent the overall uncertainty estimation, which we quantify for NOx emission on a single day at ∼31 % and for CO2 emission at ∼43 %.
3.1 NOx lifetimes and emissions
We display the estimated NOx lifetime and NOx emissions for each clear-sky day during the study period in Table S1. The estimated planetary boundary layer mean OH concentration over the region for each day is presented in Fig. 2. For 90 % of the days, our model-fitted OH concentrations fall into the intervals of 0.8–1.2 times the GEOS-Chem model values. There are only 5 d on which we had to impose a change in OH concentrations of more than 30 % relative to the GEOS-Chem simulation to obtain realistic fitting results.

Figure 2Daily boundary layer mean OH concentration over our study domain. The OH concentration estimated from our improved superposition column model is given with the red line. The grey shade represents 0.8–1.2 times the GEOS-Chem-simulated OH concentration, and the grey line represents CMAQ model simulation results.
We estimate that the seasonal mean noontime NOx lifetime over Wuhan and adjacent region is 4.8±0.8 h for winter, 2.8±1.3 h for spring, 1.4±0.3 h for summer and 1.9±0.5 h for autumn. The results are lower than those calculated from the GEOS-Chem simulation by Shah et al. (2020), with ∼6 h in summer and >20 h in winter. This is because they calculated the 24 h mean NOx lifetime, while the loss rate of NOx is much higher around noon. NOx lifetime for Wuhan is also shorter than for Paris (Lorente et al., 2019), especially during winter, reflecting the higher radiation levels and temperature in Wuhan than in Paris. It should be noted that Liu et al. (2016) fitted a NOx lifetime of 2.6 h for Wuhan in the warm season (May to September) for the 2005–2013 mean, and our result for 2019–2020 is 1.7±0.4 h. One reason is that they calculated NOx lifetime based on a long-term mean NO2 distribution and the coarser resolution of OMI data, both of which lead to spatial smoothing of NO2 gradients and thus longer apparent NOx lifetimes (Qu, 2020). Another explanation is the increasing ozone concentrations in China in recent years (Li et al., 2020) promote OH formation and thereby NOx loss reactions, which shorten NOx lifetime (Zara et al., 2021).
The estimated NOx lifetime and emissions from the two TROPOMI datasets for the whole study period are presented in Fig. S7. On average, the TROPOMI-v1.3 data result in 13 % lower NOx emissions from Wuhan than the TROPOMI-v2.3.1 data. NOx lifetime estimated from TROPOMI-v1.3 data is 5 % shorter than that from TROPOMI-v2.3.1, which may be attributed to the fact that the TROPOMI-v2.3.1 data have a higher gradient between the city center and the background. Uncertainties in NOx emissions and lifetime estimation are 33 % higher in the TROPOMI-v1.3 data (39 %) for the higher uncertainty in the NO2 column data (here we use 30 %).
We further verified the estimated NOx emissions from the two TROPOMI datasets in 2019 with the bottom-up emission inventories. We obtained 14 d (including 9 weekdays, 3 weekend days, and 2 holiday days) between September and November 2019 for the top-down NOx emission estimation and compared them with those from the ABACAS (2019) and MEIC (2017) inventories. Overall, as presented in Fig. 3a, compared to the bottom-up emission inventories, TROPOMI-v1.3-2019 NOx emissions are 21 % and 23 % lower than ABACAS-2019 and MEIC-2017, respectively. On the other hand, TROPOMI-v2.3.1-2019 NOx emissions are comparable to those from ABACAS-2019 (2 % difference) and ∼5 % lower than MEIC-2017. That NOx emissions estimated from TROPOMI-v2.3.1 in 2019 are lower than MEIC-2017 likely reflects the fact that NOx emissions decreased in 2019 relative to 2017 in response to Chinese emission controls. According to the Wuhan Bureau of Statistics, NOx emissions reduced by 6 % between 2017 and 2019 (Wuhan Bureau of Statistics, 2019; Bauwens et al., 2020), close to the difference between TROPOMI-v2.3.1-2019 and MEIC-2017. Through the comparison with the bottom-up emissions, we find that the TROPOMI-v2.3.1 NO2 data generate more reliable NOx emissions from Wuhan in 2019 than the v1.3 data, even when the low bias in TROPOMI-v1.3 data is corrected by a factor of 1.6.

Figure 3Daily noontime (a) NOx and (b) CO2 emissions in Wuhan estimated from TROPOMI (red and blue bars; the error bars represent the uncertainty in the emission estimations) and the bottom-up emission inventories ABACAS (black bars) for the year 2019 and MEIC (silver bars) for the year 2017. The dark- and light-grey shades represent weekends and holidays, respectively. The mean levels of each dataset are given as dashed lines with corresponding colors.
Unlike the bottom-up inventories, our daily TROPOMI NOx emissions do not indicate the existence of a so-called “weekend reduction effect” but do point out a distinct “holiday reduction effect” in Wuhan NOx emissions. The bottom-up inventories suggest that weekend NOx emissions are 30 % reduced relative to weekdays. The TROPOMI-v2.3.1 estimation shows reductions in weekend NOx emission of <3 %, while on the 2 d (1 and 3 October) of the National Holiday, NOx emissions are 8 % lower than the workday mean. Surface NO2 and O3 observations from Beijing do not show a weekend effect (Zhao et al., 2019; Hua et al., 2021) either. Our TROPOMI top-down NOx emissions show a similar spatial pattern as in the ABACAS and MEIC (Fig. S2), with the highest emissions located in the city center of Wuhan. However, the TROPOMI NOx emission pattern appears more smeared out than from ABACAS due to the strong dependence of the bottom-up spatial distribution on population density, the difference in spatial resolution and the decrease in NOx emissions in early 2020, mainly occurring in the high-emission region.
3.2 CO2 emissions and XCO2 enhancements
We estimate noontime top-down (technically representing a merger of top-down and bottom-up information, but we define it as top-down for simplicity) CO2 emissions from Wuhan between September and November 2019 to be 6.32±2.74 s−1 (the errors represent the uncertainty of the emission estimation), comparable to ABACAS-2019, of 6.40±2.78 t s−1 (Fig. 3b). Based on the estimated daily CO2 emissions, we further use the superposition column model to simulate daily XCO2 enhancements and evaluate them with OCO-2 observations. We successfully obtained 2 d between May 2018 (start time of TROPOMI-v2.3.1 NO2 product) and December 2021 with simultaneous (both overpass at around 13:00–13:30 LT), co-located TROPOMI NO2 and OCO-2 CO2 observations over Wuhan on 15 September 2018 and 13 April 2020. We inferred total top-down CO2 emissions from Wuhan based on our TROPOMI-inferred NOx emissions and the ABACAS-predicted emission ratios on 15 September 2018 and 13 April 2020 to be 7.92±3.44 and 4.44±1.93 t s−1, respectively. Then they are used to predict the XCO2 enhancements with the superposition column model. To compare with the sparse distributed OCO-2 observations, we apply the superposition model on the CO2 line density with a width of 1 km, while a width of 186 km is used for NO2. The column model does not take the diffusion of NO2 or CO2 into account, but it can be assumed that all diffusion is encapsulated within the domain for a line density covering a cross-section as wide as 186 km. However, when the line density is only 1 km wide, the diffusion will move some CO2 out of this line, and this will influence the CO2 enhancement prediction. We will discuss this influence further below.
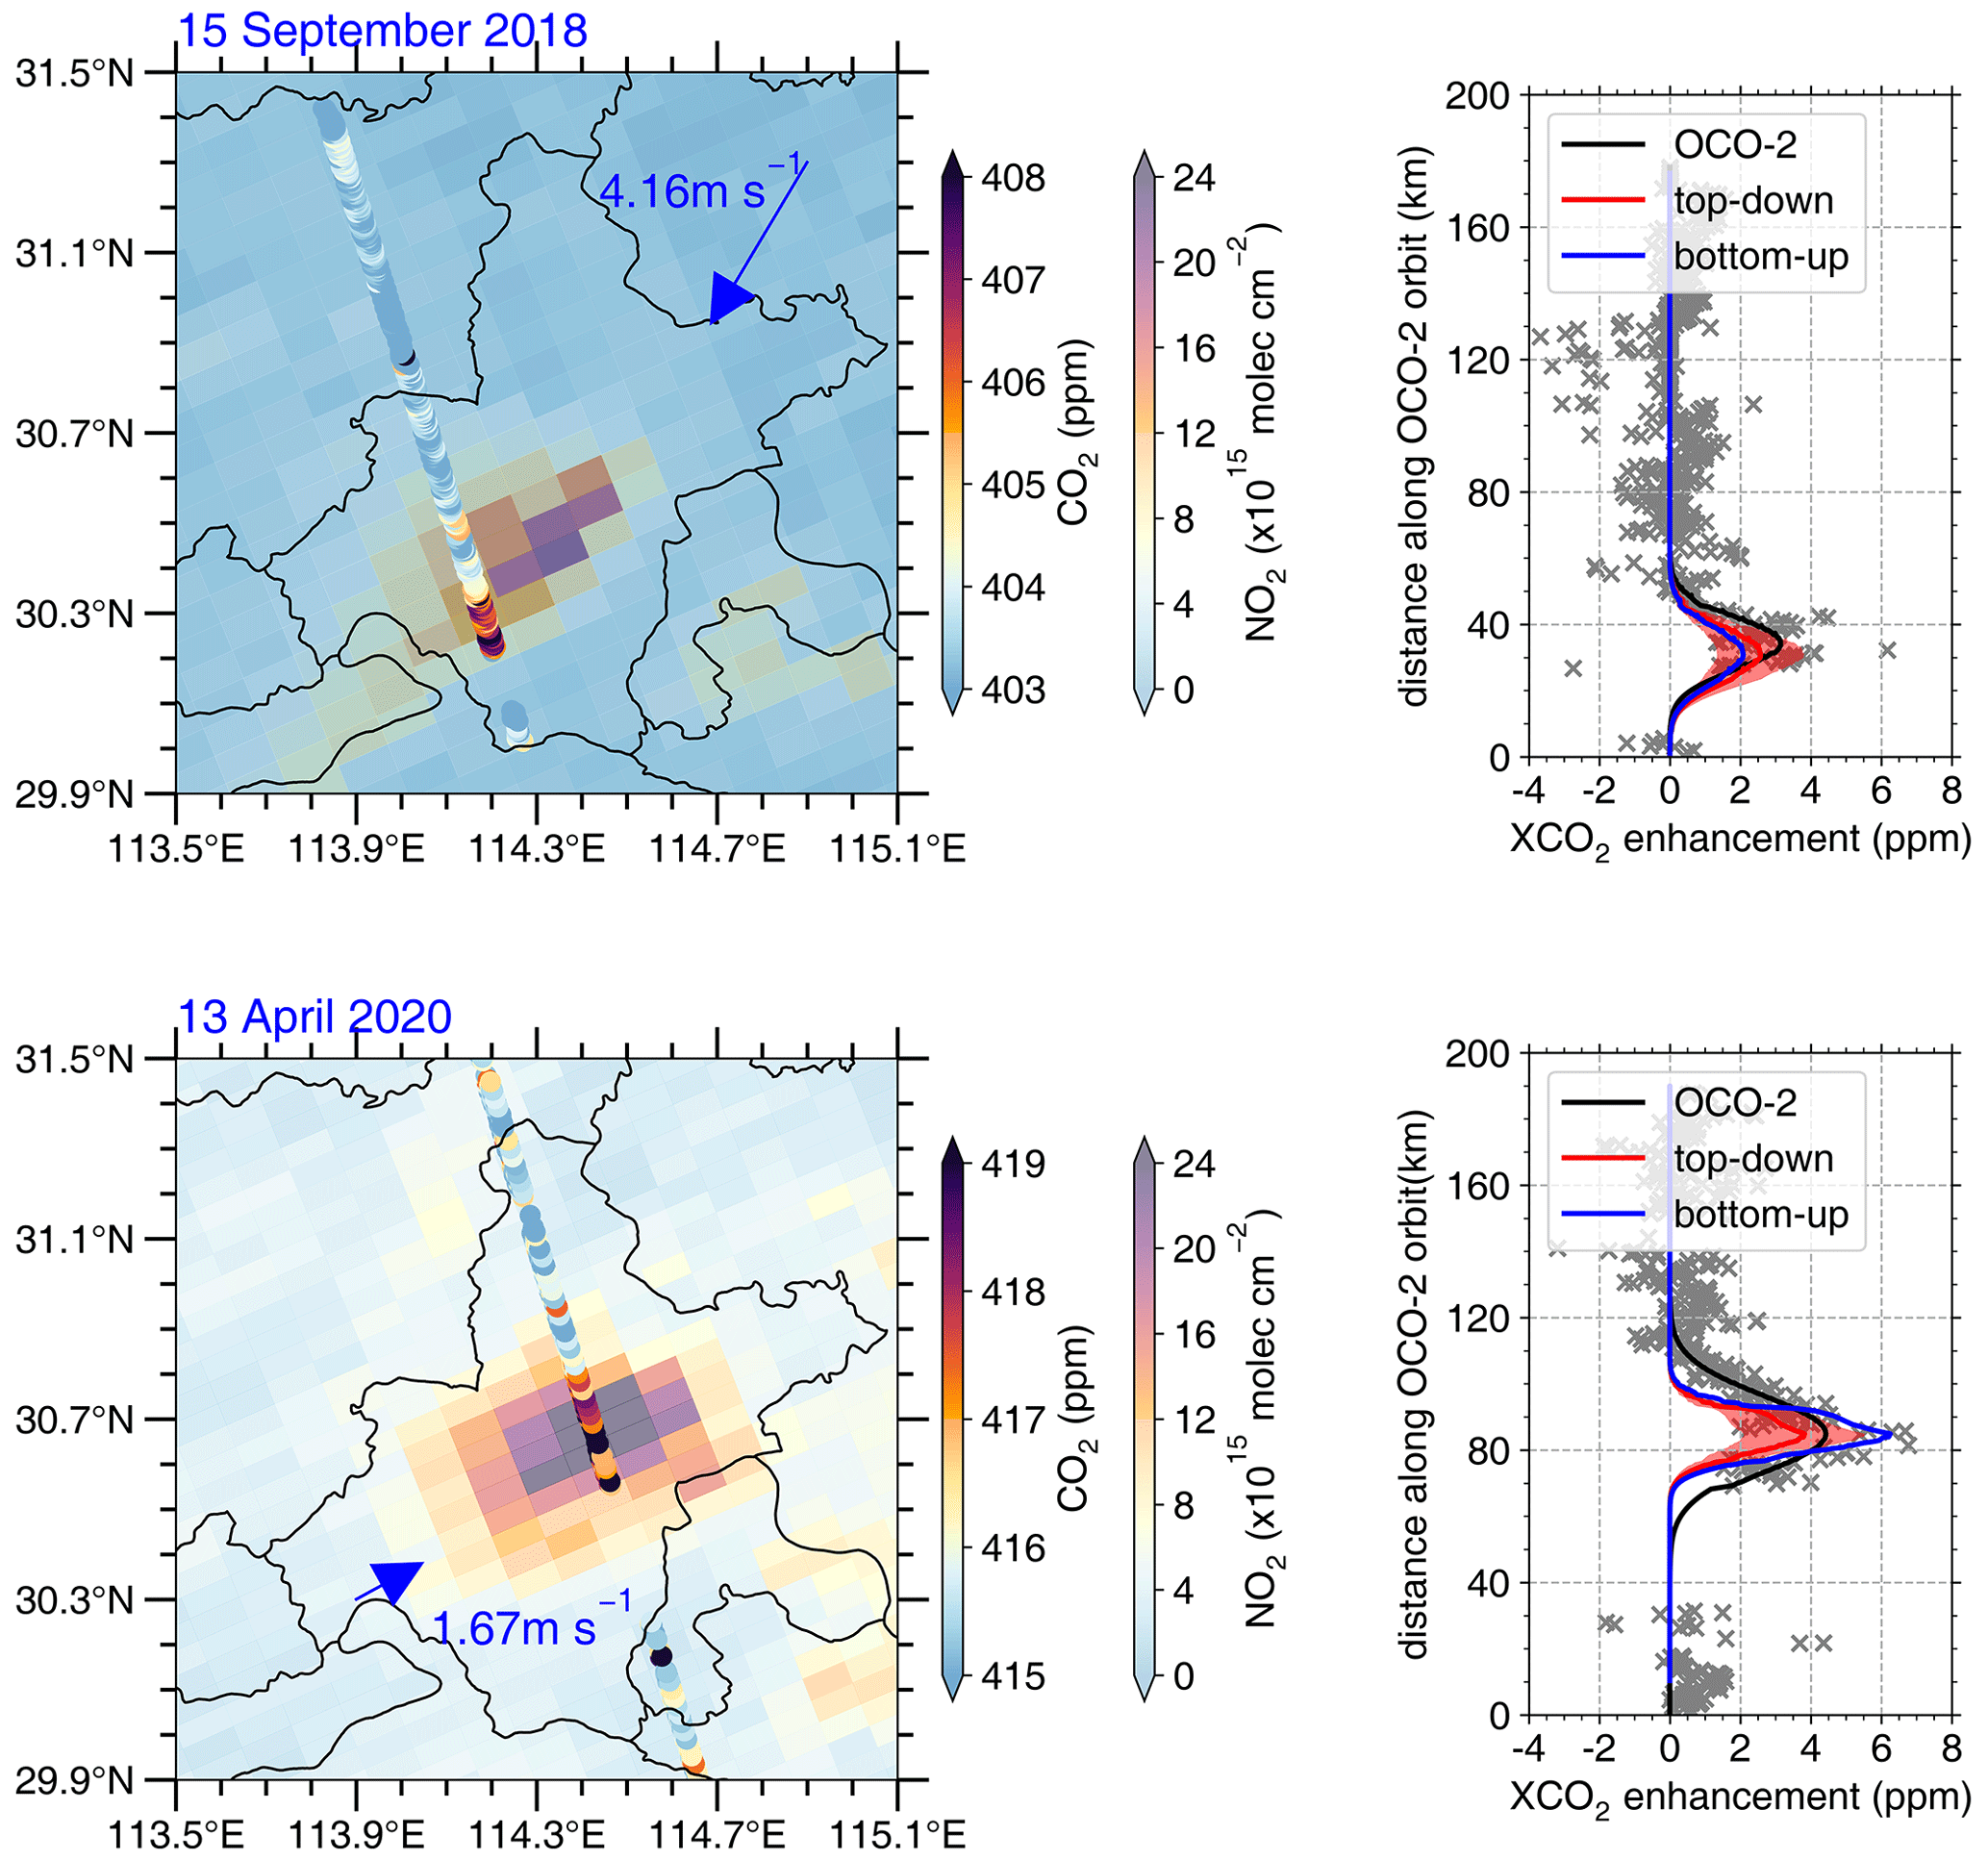
Figure 4Simultaneous, co-located TROPOMI NO2 and OCO-2 CO2 observations over Wuhan (the left panel) on 15 September 2018 (top panels) and 13 April 2020 (bottom panels), the wind speed and direction on each day are shown. The dry-air mole fraction of CO2 (XCO2) enhancements along the OCO-2 orbit are given for the corresponding day (the right panel). The grey crosses and black lines represent the OCO-2 observation. The blue lines denote XCO2 enhancement predicted with bottom-up emissions, and the red lines (shading represents the uncertainty interval) denote that predicted with top-down CO2 emission, estimated in this study.
Neglecting chemical production and loss of CO2 in the atmosphere, the superposition column model of CO2 (Eq. 5) is simpler than that of NOx:
where is CO2 density in units of grams per square meter (g m−2), denotes our estimated CO2 emission (g s−1), and u and L are the wind speed (m s−1) and length of grid cell (6000 m). Then (g m−2) is converted to the dry-air column mixing ratio XCO2 (ppm) for comparison with the OCO-2 observation (Zheng et al., 2020a):
in which Mair and are air and CO2 molar mass of air and CO2 (g mol−1), g is the gravitational acceleration (9.8 m s−2), and p (Pa) and w (kg m−2) are surface pressure and total column water vapor, respectively.
We calculate the XCO2 enhancement due to the top-down CO2 emissions on 15 September 2018 and 13 April 2020 and compare these with the enhancements observed by OCO-2. As shown in the right panels of Fig. 4, the superposition model captures the spatial pattern of observed XCO2 along the OCO-2 orbit on both days. The predicted amplitudes of the XCO2 enhancements are also comparable to those in the OCO-2 observation with a small bias (less than 5 % for both days). For comparison, we also use the 2019 bottom-up CO2 emissions to predict the XCO2 enhancement on the 2 d (blue lines in Fig. 4, the right panel). XCO2 enhancements predicted by bottom-up CO2 emissions deviate more from the OCO-2 observed enhancements than those predicted by the top-down CO2 emissions. On 13 April 2020 in particular, the bottom-up enhancement differs by +41 %, while the top-down enhancement differs only within ±5 % compared to the observed XCO2 enhancement. At the beginning of Wuhan's reopening, CO2 emission from the city (our top-down estimation) is expected to be far lower than the pre-lockdown level (bottom-up estimation).
We see that the predicted XCO2 enhancements on 13 April 2020, both from the bottom-up and top-down emissions, are much “narrower” compared to the OCO-2 observation. On this day, the OCO-2 orbit passes over the city center, and the diffusion plays an important role, which is neglected in the column model. In contrast, on 15 September 2018, the OCO-2 orbit passed downwind of the city center, and the widths of the predicted and observed XCO2 enhancements are more comparable. For comparison, we also ran a Gaussian plume model to simulate the XCO2 enhancement (Sect. S5 and Fig. S8). On 13 April 2020, the result from Gaussian model agrees better with the OCO-2 observation, and on 15 September 2018, results from the two models (Gaussian model and the superposition column model) are close to each other and match well with the observation.
We also display XCO2 enhancement line densities along the wind direction with uncertainty on both days (Fig. 5). The line density shows a substantial increase of XCO2 along the wind direction over the region with strong CO2 emissions (Fig. 5a and b, the inset maps). Where lines cross the OCO-2 orbit, the observed XCO2 enhancement (as box plots in Fig. 5a and b) is shown, and its values agree with the predicted XCO2 lines within ±0.3 ppm. It is remarkable that the XCO2 enhancement is lower on 15 September 2018 than on 13 April 2020, despite CO2 emission on 15 September 2018 being nearly 65 % higher than those on 13 April 2020. The main reason for this is the lower wind speed on 13 April 2020, which accumulates pollutants over the city, and the fact that the OCO-2 ground track passed over the city center of Wuhan on this day. On 15 September 2018, higher wind speeds and the OCO-2 track being situated over the outskirts of the city imply that a lower enhancement of CO2 is observed.
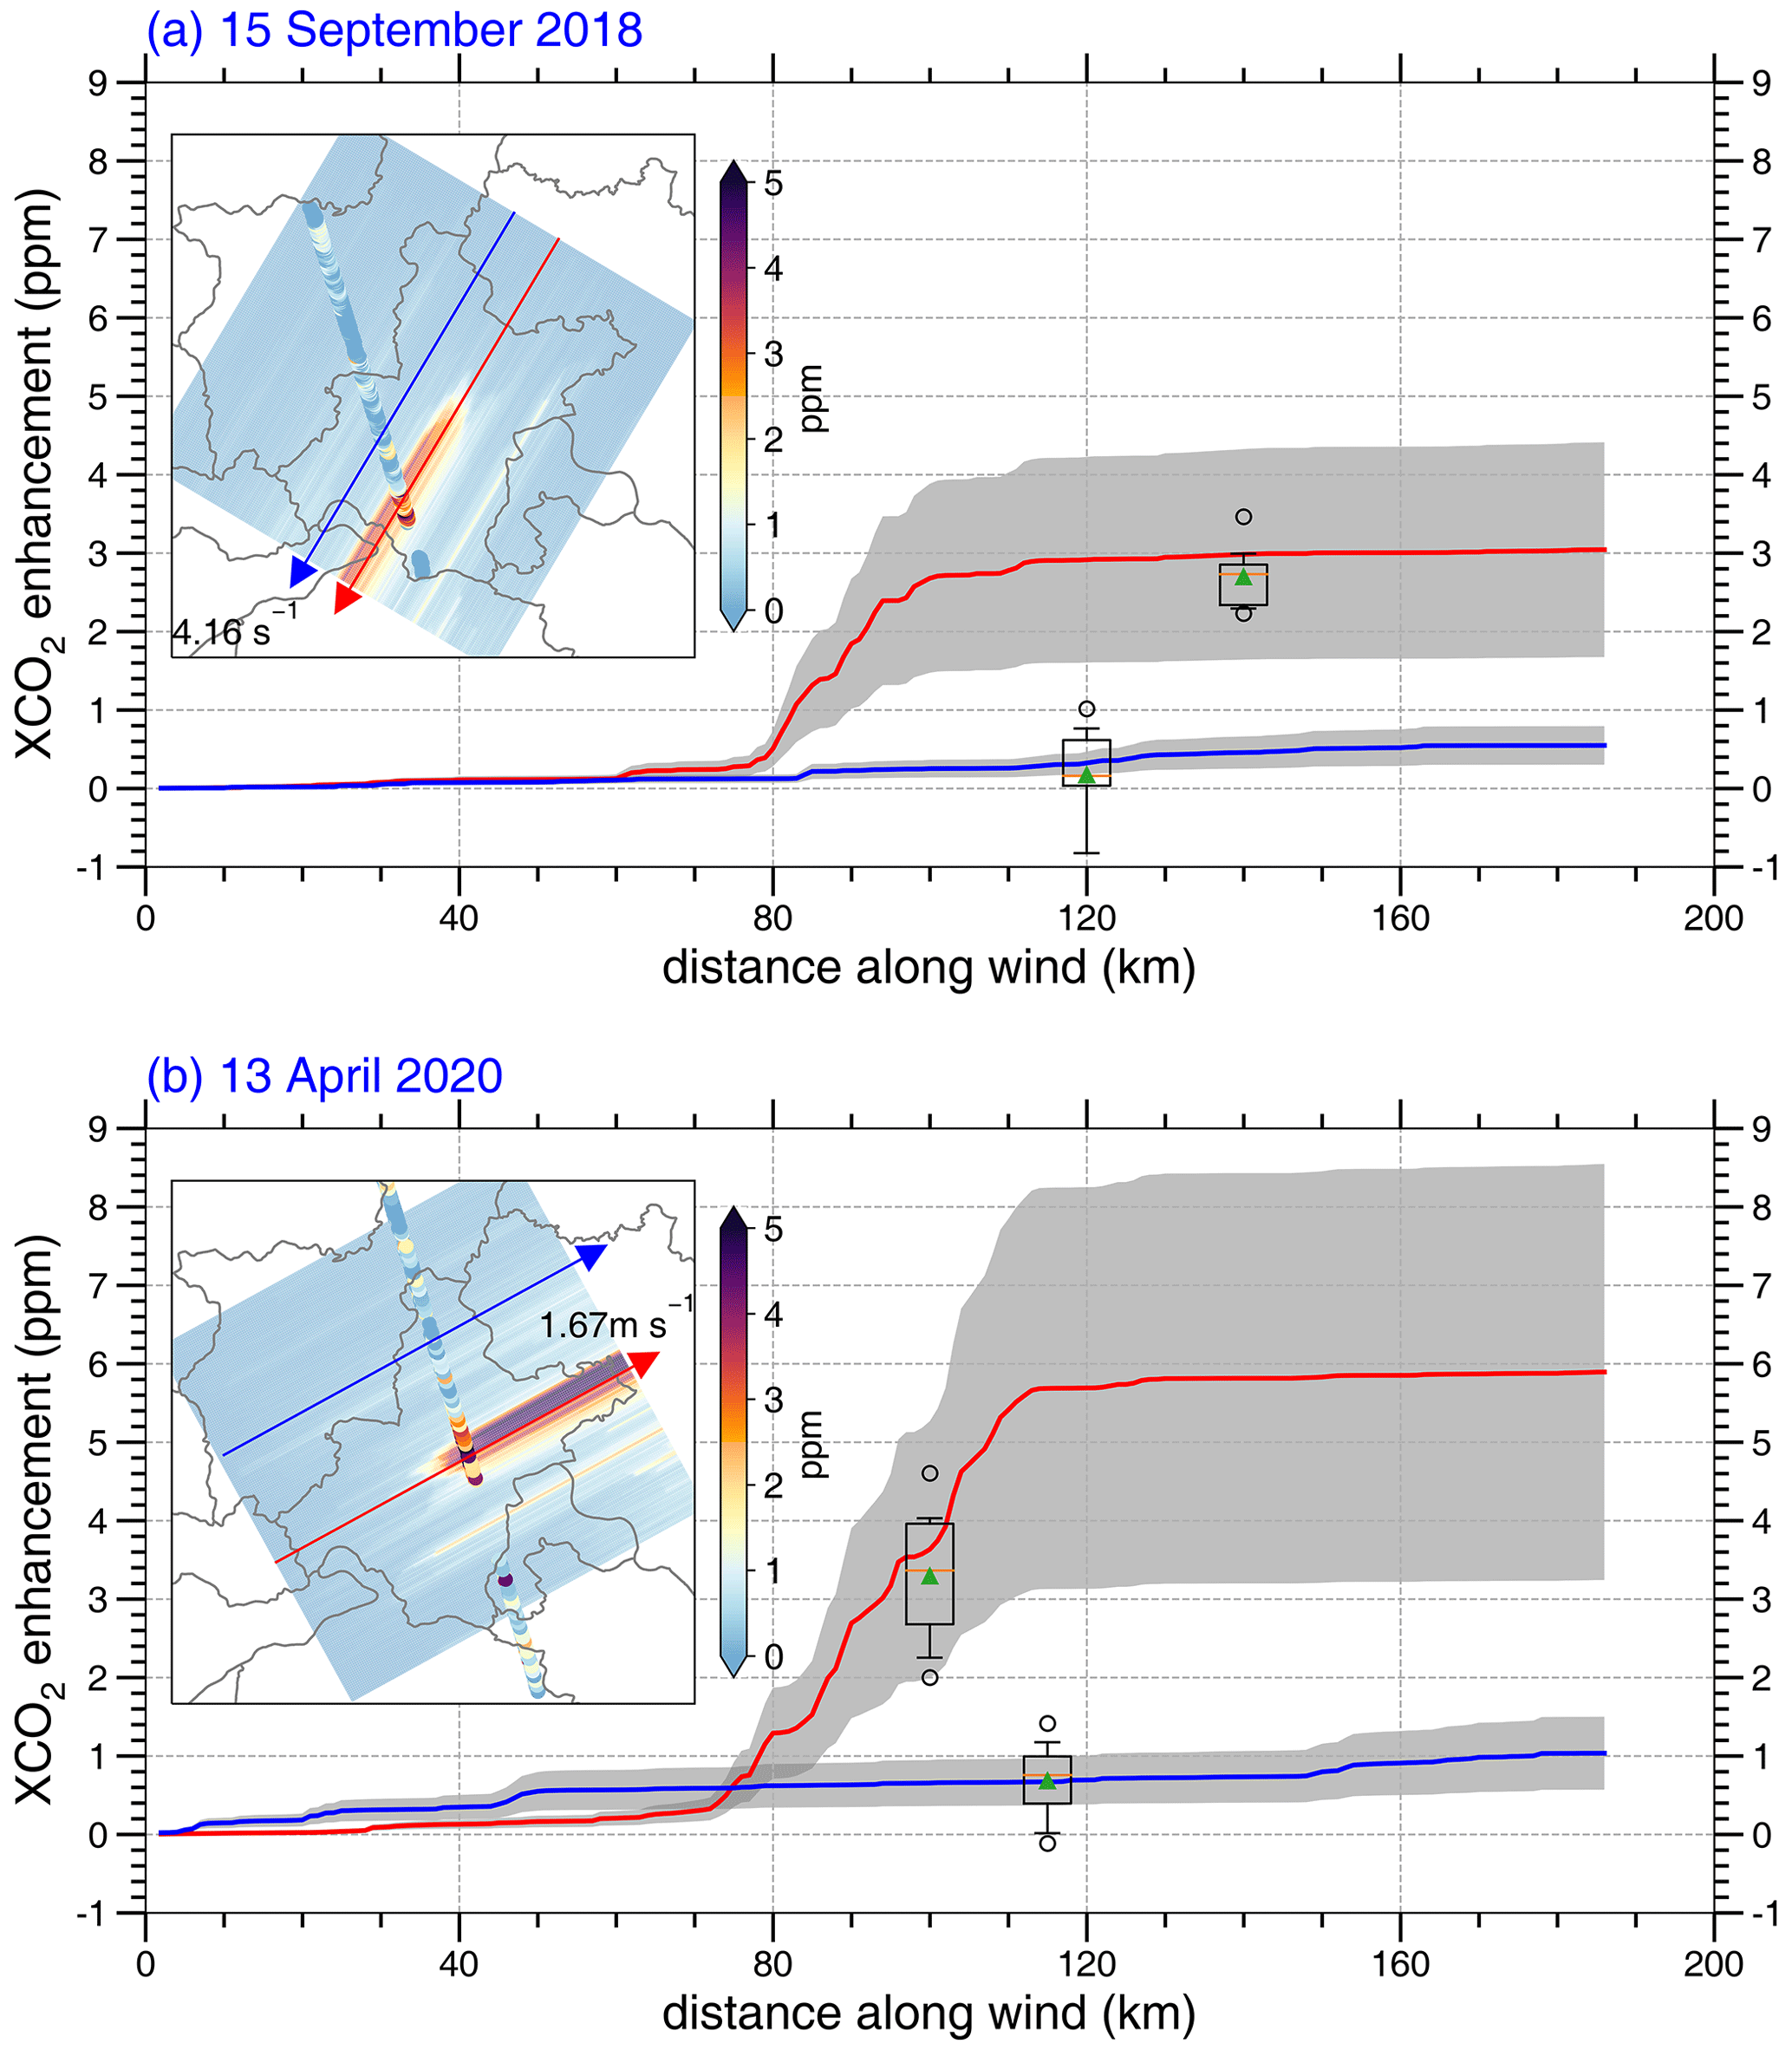
Figure 5Two presentative predicted XCO2 enhancement lines (red and blue) with uncertainty (grey shades) on (a) 15 September 2018 and (b) 13 April 2020. When the XCO2 enhancement lines pass through the OCO-2 orbit, the observed XCO2 enhancements are shown with box plots. The mean values are shown as green triangles, and the outliers beyond the 5 %–95 % interval are shown as circles. The predicted XCO2 enhancement line density maps overlaid with OCO-2 observed XCO2 enhancement on each day are shown inside, with the position of the presentative lines and the wind direction.
We use an “indirect” method to estimate daily city anthropogenic CO2 emissions and then predict XCO2 enhancements, which may induce uncertainties from the NOx emission estimation, the assumption of emission ratio and the model to predict XCO2 enhancements. Despite all these uncertainties, we still generate daily Wuhan CO2 emissions and XCO2 enhancements that agree well with the bottom-up inventory and OCO-2 observation, respectively.
3.3 Variation of NOx and CO2 emissions in Wuhan from September 2019 to August 2020
Figure 6 displays the day-to-day variation of NOx and CO2 emissions in Wuhan between September 2019 and August 2020. Before the pandemic of COVID-19, NOx emissions stayed at a stable level of 11.53±1.08 kg s−1, and CO2 stayed at 6.32±0.66 t s−1 (the errors denote the standard deviation), as indicated by the dashed red lines. From January 2020 onwards, strict lockdown measurements were implemented to combat the COVID-19 pandemic, which led to lower industry production and less traffic on the road and a sharp drop in NOx and CO2 emissions (Ding et al., 2020; Zhang et al., 2020, 2021; Zheng et al., 2021b; Feng et al., 2020). Our method closely captures the timing and magnitude of these well-known sharp reductions in emissions.

Figure 6The 50 d (a) NOx and (b) CO2 emissions in Wuhan estimated from TROPOMI between 1 September 2019 and 31 August 2020. The error bars denote the uncertainty in emission estimations, and the weekends, holidays and lockdown period are shaded with dark-grey, light-grey and green colors, respectively. The mean pre-lockdown emission levels are given as dashed red lines.
Wuhan NOx emissions on 30 January 2020 were 3.65±1.59 kg s−1, nearly 70 % lower than pre-lockdown levels, and decreased further and came to the lowest level in early February 2020, in accordance with Feng et al. (2020), who estimated similar reductions based on surface NO2 observations. The day with our lowest NOx emission from Wuhan of 2.55±1.11 kg s−1, only ∼22 % of the normal level, was 5 February. CO2 emissions have a similar temporal pattern to NOx emissions, but the reduction relative to pre-lockdown level is smaller. The lowest CO2 emission is at ∼27 % of the pre-lockdown level (also on 5 February 2020), and the mean emission rate during the lockdown period (23 January to 8 April 2020) is 60 % lower than pre-lockdown level, while it is 67 % for NOx. That CO2 emission reductions are more modest than NOx reductions reflects the fact that the transportation sector had the strongest reductions during the lockdown, but since this sector also has the lowest ratios, the relative reduction in CO2 remains somewhat smaller than in NOx emissions. This finding is similar to that of Zheng et al. (2020b), who estimated the NOx and CO2 emission variations for the whole China.
From early February 2020 onwards, emissions increased slowly throughout the lockdown period. Wuhan NOx emissions intensity in February 2020 was no more than 4.20 kg s−1, some 60 % below the pre-lockdown level. Feng et al. (2020) estimated 61 % lower NOx emission from Wuhan in February 2020 than in January based on surface NOx observations. Zheng et al. (2021a) reported a ∼50 % lower NOx emission from Hubei Province in February 2020 than the annual mean level estimated from a bottom-up approach.
Although Wuhan reopened on 9 April, the NOx and CO2 emissions did not see significant increases up until mid-May 2020. A perceptible increase in NOx emission is seen during late May, climbing to >7.50 kg s−1 (NOx) and >4.5 t s−1 (CO2) and leveling off thereafter. In August 2020, Wuhan NOx emissions were still some 25 % lower than the pre-lockdown level. Although the bottom-up estimation by Zheng et al. (2021a) suggested that NOx emissions from the Hubei Province were similar in May–August 2020 to those in 2019, surface and satellite observations over Wuhan show 15 %–20 % lower NO2 concentrations in May–August 2020 compared to 2019 (Figs. S9 and S10), consistent with our estimation of NOx emissions. Z. Liu et al. (2020) reported 4.8 % higher CO2 emissions for the whole of China in August 2020 compared to August 2019. For the city of Wuhan, however, we calculate here some 20 % lower CO2 emissions in August 2020 compared to the pre-lockdown level. Wuhan experienced a much more strict and longer period of lockdown than other regions of China, and therefore a slower rebound of NOx and CO2 emissions should be expected.
As we have stated above, to ensure the performance of the model, we must filter out the days when the cloud fraction is greater than 0.2 and the days when the wind direction shows substantial spatial or temporal variation within the study domain. Finally, we obtain 50 out of the 365 d with reliable NOx and CO2 emissions estimation. However, these 50 d cover at least 2 d for each month (except for December 2019). For 2019, it includes 9 workdays, 3 weekend days, and 2 holiday days, which are enough to investigate the weekend reduction effect and holiday reduction effect in NOx emissions. It also covers 12 d across the lockdown period and 24 d after that, allowing us to monitor the large reduction and recovery of NOx and CO2 emissions from Wuhan due to the COVID lockdown. Therefore, these 50 d provide useful information to investigate the temporal emission patterns of NOx and CO2 from Wuhan and help to monitor the effectiveness of emission reductions in large urban centers.
In this study, we introduced an improved superposition column model to estimate daily NOx and CO2 emissions from a Chinese megacity of Wuhan based on the latest released version 2.3.1 of TROPOMI NO2 column data and OCO-2 XCO2 observation. Our estimated daily NOx and CO2 emissions agree well with bottom-up emissions with a small bias of <3 %. Predicted XCO2 enhancements based on our CO2 emissions estimates are proved to be in good agreement (within ±5 %) with OCO-2 observations over Wuhan. Compared to previous studies, our work shows that satellite measurements can provide detailed information on sub-city-scale NOx and CO2 emissions on a daily basis. We achieved the day-to-day variation of NOx and CO2 emissions from Wuhan between September 2019 and August 2020. We pointed out that the weekend reduction effect is small, but a holiday reduction effect in Wuhan NOx and CO2 emissions can be clearly detected. We also captured the abrupt decrease in NOx and CO2 emissions as the lockdown for COVID began on 23 January 2020 and the slow rebound as Wuhan reopened on 9 April 2020. Daily updates of city-scale NOx and CO2 emissions provide policymakers with emission and policy control data on NOx and CO2 emission control in urban environments.
In the future, following the launch of the Carbon Dioxide Monitoring mission (CO2M) (Sierk et al., 2021), our improved superposition column method may be explored further to constrain city-scale CO2 and NOx emissions to assess the effectiveness of emission control measures. CO2M provides simultaneous and co-located CO2 and NO2 observations with a wider swath than OCO-2, providing better opportunities to verify and improve CO2 and NOx emissions from space.
The S-5P TROPOMI v2.3.1 NO2 column data are available from https://data-portal.s5p-pal.com/cat-doc (ESA, 2023). The ERA5 data can be found at https://cds.climate.copernicus.eu/cdsapp#!/dataset/reanalysis-era5-pressure-levels?tab=overview (CDS, 2023). The OCO-2 v10r XCO2 data can be downloaded from https://doi.org/10.5067/E4E140XDMPO2 (Gunson and Eldering, 2020). The GEOS-Chem model-simulated data are available on request (zhangqq@cma.gov.cn).
The supplement related to this article is available online at: https://doi.org/10.5194/acp-23-551-2023-supplement.
QZ and KFB designed the research. QZ performed the data analysis, model development and result validation. BZ and HZ provided the ABACAS-EI NOx and CO2 emission inventories. HE provided the 2.3.1 version of the TROPOMI tropospheric NO2 product. CC provided MEIC NOx emissions and performed the CMAQ simulations. XZ provided helpful discussions. QZ and KFB wrote the paper.
The contact author has declared that none of the authors has any competing interests.
Publisher's note: Copernicus Publications remains neutral with regard to jurisdictional claims in published maps and institutional affiliations.
This work is funded by the National Key Research and Development Program Earth Observation and Navigation Key Project (grant no. 2017YFB0504001), the National Natural Science Foundation of China (grant no. 41805098) and the China Scholarship Council (grant no. 202005330023). Improvements in TROPOMI NO2 data (v2.3.1) have received support from the KNMI MSO NO2NEXT project.
This research has been supported by the National Key Research and Development Program Earth Observation and Navigation Key Project (grant no. 2017YFB0504001), the National Natural Science Foundation of China (grant no. 41805098) and the China Scholarship Council (grant no. 202005330023).
This paper was edited by Michel Van Roozendael and reviewed by two anonymous referees.
Bauwens, M., Compernolle, S., Stavrakou, T., Muller, J. F., van Gent, J., Eskes, H., Levelt, P. F., van der, A. R., Veefkind, J. P., Vlietinck, J., Yu, H., and Zehner, C.: Impact of coronavirus outbreak on NO2 pollution assessed using TROPOMI and OMI observations, Geophys. Res. Lett., 47, e2020GL087978, https://doi.org/10.1029/2020GL087978, 2020.
Beirle, S., Boersma, K. F., Platt, U., Lawrence, M. G., and Wagner, T.: Megacity emissions and lifetimes of nitrogen oxides probed from space, Science, 333, 1737–1739, https://doi.org/10.1126/science.1207824, 2011.
Berezin, E. V., Konovalov, I. B., Ciais, P., Richter, A., Tao, S., Janssens-Maenhout, G., Beekmann, M., and Schulze, E. D.: Multiannual changes of CO2 emissions in China: indirect estimates derived from satellite measurements of tropospheric NO2 columns, Atmos. Chem. Phys., 13, 9415–9438, https://doi.org/10.5194/acp-13-9415-2013, 2013.
CDS: ERA5 hourly data on pressure levels from 1959 to present, CDS [data set], https://cds.climate.copernicus.eu/cdsapp#!/dataset/reanalysis-era5-pressure-levels?tab=overview, last access: 11 January 2023.
Ding, J., van der A, R. J., Eskes, H. J., Mijling, B., Stavrakou, T., Geffen, J. H. G. M., and Veefkind, J. P.: NOx Emissions Reduction and Rebound in China Due to the COVID-19 Crisis, Geophys. Res. Lett., 47, e2020GL089912, https://doi.org/10.1029/2020gl089912, 2020.
ESA: S5P-PAL Product Search, https://data-portal.s5p-pal.com/cat-doc, last access: 11 January 2023.
Eskes, H., Van Geffen, J., Sneep, M., Veefkind, J. P., Niemeijer, S., and Zehner, C.: S5P Nitrogen Dioxide v02.03.01 intermediate reprocessing on the S5P-PAL system: Readme file, http://data-portal.s5p-pal.com/product-docs/no2/PAL_reprocessing_NO2_NO2_v02.03.01_20211215.pdf (last access: 11 January 2023), 2021.
Feng, S., Jiang, F., Wang, H., Wang, H., Ju, W., Shen, Y., Zheng, Y., Wu, Z., and Ding, A.: NOx Emission Changes Over China During the COVID-19 Epidemic Inferred From Surface NO2 Observations, Geophys. Res. Lett., 47, e2020GL090080, https://doi.org/10.1029/2020GL090080, 2020.
Griffin, D., McLinden, C. A., Boersma, F., Bourassa, A., Dammers, E., Degenstein, D., Eskes, H., Fehr, L., Fioletov, V., Hayden, K., Kharol, S. K., Li, S. M., Makar, P., Martin, R. V., Mihele, C., Mittermeier, R. L., Krotkov, N., Sneep, M., Lamsal, L. N., Ter Linden, M., van Geffen, J., Veefkind, P., Wolde, M., and Zhao, X.: High resolution mapping of nitrogen dioxide with TROPOMI: First results and validation over the Canadian oil sands, Geophys. Res. Lett., 46, 1049–1060, https://doi.org/10.1029/2018GL081095, 2019.
Gunson, M. and Eldering, A.: OCO-2 Level 2 bias-corrected XCO2 and other select fields from the full-physics retrieval aggregated as daily files, Retrospective processing V10r, Greenbelt, MD, USA, Goddard Earth Sciences Data and Information Services Center (GES DISC) [data set], https://doi.org/10.5067/E4E140XDMPO2, 2020.
Hersbach, H., Bell, B., Berrisford, P., Hirahara, S., Horányi, A., Muñoz-Sabater, J., Nicolas, J., Peubey, C., Radu, R., Schepers, D., Simmons, A., Soci, C., Abdalla, S., Abellan, X., Balsamo, G., Bechtold, P., Biavati, G., Bidlot, J., Bonavita, M., Chiara, G., Dahlgren, P., Dee, D., Diamantakis, M., Dragani, R., Flemming, J., Forbes, R., Fuentes, M., Geer, A., Haimberger, L., Healy, S., Hogan, R. J., Hólm, E., Janisková, M., Keeley, S., Laloyaux, P., Lopez, P., Lupu, C., Radnoti, G., Rosnay, P., Rozum, I., Vamborg, F., Villaume, S., and Thépaut, J. N.: The ERA5 global reanalysis, Q. J. Roy. Meteorol. Soc., 146, 1999–2049, https://doi.org/10.1002/qj.3803, 2020.
Hua, J., Zhang, Y., de Foy, B., Mei, X., Shang, J., and Feng, C.: Competing PM2.5 and NO2 holiday effects in the Beijing area vary locally due to differences in residential coal burning and traffic patterns, Sci. Total. Environ., 750, 141575, https://doi.org/10.1016/j.scitotenv.2020.141575, 2021.
Huang, X., Ding, A., Gao, J., Zheng, B., Zhou, D., Qi, X., Tang, R., Wang, J., Ren, C., Nie, W., Chi, X., Xu, Z., Chen, L., Li, Y., Che, F., Pang, N., Wang, H., Tong, D., Qin, W., Cheng, W., Liu, W., Fu, Q., Liu, B., Chai, F., Davis, S. J., Zhang, Q., and He, K.: Enhanced secondary pollution offset reduction of primary emissions during COVID-19 lockdown in China, Natl. Sci. Rev., 8, nwaa137, https://doi.org/10.1093/nsr/nwaa137, 2021.
Jacob, D.: Introduction to Atmospheric Chemistry, Princeton Univ. Press, ISBN 9780691001852, 1999.
Lamsal, L. N., Martin, R. V., van Donkelaar, A., Celarier, E. A., Bucsela, E. J., Boersma, K. F., Dirksen, R., Luo, C., and Wang, Y.: Indirect validation of tropospheric nitrogen dioxide retrieved from the OMI satellite instrument: Insight into the seasonal variation of nitrogen oxides at northern midlatitudes, J. Geophys. Res., 115, D05302, https://doi.org/10.1029/2009jd013351, 2010.
Lamsal, L. N., Martin, R. V., Padmanabhan, A., van Donkelaar, A., Zhang, Q., Sioris, C. E., Chance, K., Kurosu, T. P., and Newchurch, M. J.: Application of satellite observations for timely updates to global anthropogenic NOx emission inventories, Geophys. Res. Lett., 38, L05810, https://doi.org/10.1029/2010gl046476, 2011.
Li, K., Jacob, D. J., Shen, L., Lu, X., De Smedt, I., and Liao, H.: Increases in surface ozone pollution in China from 2013 to 2019: anthropogenic and meteorological influences, Atmos. Chem. Phys., 20, 11423–11433, https://doi.org/10.5194/acp-20-11423-2020, 2020.
Li, M., Zhang, Q., Kurokawa, J.-i., Woo, J.-H., He, K., Lu, Z., Ohara, T., Song, Y., Streets, D. G., Carmichael, G. R., Cheng, Y., Hong, C., Huo, H., Jiang, X., Kang, S., Liu, F., Su, H., and Zheng, B.: MIX: a mosaic Asian anthropogenic emission inventory under the international collaboration framework of the MICS-Asia and HTAP, Atmos. Chem. Phys., 17, 935–963, https://doi.org/10.5194/acp-17-935-2017, 2017.
Liu, F., Beirle, S., Zhang, Q., Dörner, S., He, K., and Wagner, T.: NOx lifetimes and emissions of cities and power plants in polluted background estimated by satellite observations, Atmos. Chem. Phys., 16, 5283–5298, https://doi.org/10.5194/acp-16-5283-2016, 2016.
Liu, F., Duncan, B. N., Krotkov, N. A., Lamsal, L. N., Beirle, S., Griffin, D., McLinden, C. A., Goldberg, D. L., and Lu, Z.: A methodology to constrain carbon dioxide emissions from coal-fired power plants using satellite observations of co-emitted nitrogen dioxide, Atmos. Chem. Phys., 20, 99–116, https://doi.org/10.5194/acp-20-99-2020, 2020.
Liu, M., Lin, J., Kong, H., Boersma, K. F., Eskes, H., Kanaya, Y., He, Q., Tian, X., Qin, K., Xie, P., Spurr, R., Ni, R., Yan, Y., Weng, H., and Wang, J.: A new TROPOMI product for tropospheric NOx columns over East Asia with explicit aerosol corrections, Atmos. Meas. Tech., 13, 4247–4259, https://doi.org/10.5194/amt-13-4247-2020, 2020.
Liu, Z., Ciais, P., Deng, Z., Davis, S. J., Zheng, B., Wang, Y., Cui, D., Zhu, B., Dou, X., Ke, P., Sun, T., Guo, R., Zhong, H., Boucher, O., Breon, F. M., Lu, C., Guo, R., Xue, J., Boucher, E., Tanaka, K., and Chevallier, F.: Carbon Monitor, a near-real-time daily dataset of global CO2 emission from fossil fuel and cement production, Sci. Data, 7, 392, https://doi.org/10.1038/s41597-020-00708-7, 2020.
Lorente, A., Boersma, K. F., Eskes, H. J., Veefkind, J. P., van Geffen, J., de Zeeuw, M. B., Denier van der Gon, H. A. C., Beirle, S., and Krol, M. C.: Quantification of nitrogen oxides emissions from build-up of pollution over Paris with TROPOMI, Sci. Rep., 9, 20033, https://doi.org/10.1038/s41598-019-56428-5, 2019.
O'Dell, C., Eldering, A., Gunson , M., Crisp, D., Fisher, B., Kiel, M., Kuai, L., Laughner, J., Merrelli, A., Nelson, R., Osterman, G., Payne, V., Rosenberg, R., Taylor, T., Wennberg, P., Kulawik, S., Lindqvist, H., Miller, S., and Nassar, R.: Improvements in XCO2 accuracy from OCO-2 with the latest ACOS v10 product, in: EGU General Assembly 2021, online, 19–30 April 2021, EGU21-10484, 2021.
Qu, H.: Summertime ozone pollution over China: observations and simulations, Dissertation for the degree of Doctor of Philosophy, School of Earth and Atmospheric Science, Georfia Institute of Technology, https://smartech.gatech.edu/bitstream/handle/1853/64572/QU-DISSERTATION-2020.pdf?sequence=1 (last access: 11 January 2023), 2020.
Reuter, M., Buchwitz, M., Hilboll, A., Richter, A., Schneising, O., Hilker, M., Heymann, J., Bovensmann, H., and Burrows, J. P.: Decreasing emissions of NOx relative to CO2 in East Asia inferred from satellite observations, Nat. Geosci., 7, 792–795, https://doi.org/10.1038/ngeo2257, 2014.
Reuter, M., Buchwitz, M., Schneising, O., Krautwurst, S., O'Dell, C. W., Richter, A., Bovensmann, H., and Burrows, J. P.: Towards monitoring localized CO2 emissions from space: co-located regional CO2 and NO2 enhancements observed by the OCO-2 and S5P satellites, Atmos. Chem. Phys., 19, 9371–9383, https://doi.org/10.5194/acp-19-9371-2019, 2019.
Riess, T. C. V. W., Boersma, K. F., van Vliet, J., Peters, W., Sneep, M., Eskes, H., and van Geffen, J.: Improved monitoring of shipping NO2 with TROPOMI: decreasing NOx emissions in European seas during the COVID-19 pandemic, Atmos. Meas. Tech., 15, 1415–1438, https://doi.org/10.5194/amt-15-1415-2022, 2022.
Shah, V., Jacob, D. J., Li, K., Silvern, R. F., Zhai, S., Liu, M., Lin, J., and Zhang, Q.: Effect of changing NOx lifetime on the seasonality and long-term trends of satellite-observed tropospheric NO2 columns over China, Atmos. Chem. and Phys., 20, 1483–1495, https://doi.org/10.5194/acp-20-1483-2020, 2020.
Sierk, B., Fernandez, V., Bézy, J. L., Meijer, Y., Durand, Y., Bazalgette Courrèges-Lacoste, G., Pachot, C., Löscher, A., Nett, H., Minoglou, K., Boucher, L., Windpassinger, R., Pasquet, A., Serre, D., te Hennepe, F., Sodnik, Z., Cugny, B., and Karafolas, N.: The Copernicus CO2M mission for monitoring anthropogenic carbon dioxide emissions from space, in: International Conference on Space Optics – ICSO 2021, 11 June 2021, Online, https://doi.org/10.1117/12.2599613, 2021.
Wuhan Bureau of Statistics.: Statistical Bulletin on domestic economic and social development of Wuhan (2018), http://tjj.wuhan.gov.cn/tjfw/tjgb/202001/t20200115_841065.shtml (last access: 19 May 2022), 2019.
van Geffen, J., Boersma, K. F., Eskes, H., Sneep, M., ter Linden, M., Zara, M., and Veefkind, J. P.: S5P TROPOMI NO2 slant column retrieval: method, stability, uncertainties and comparisons with OMI, Atmos. Meas. Tech., 13, 1315–1335, https://doi.org/10.5194/amt-13-1315-2020, 2020.
van Geffen, J., Eskes, H., Compernolle, S., Pinardi, G., Verhoelst, T., Lambert, J.-C., Sneep, M., ter Linden, M., Ludewig, A., Boersma, K. F., and Veefkind, J. P.: Sentinel-5P TROPOMI NO2 retrieval: impact of version v2.2 improvements and comparisons with OMI and ground-based data, Atmos. Meas. Tech., 15, 2037–2060, https://doi.org/10.5194/amt-15-2037-2022, 2022.
Visser, A. J., Boersma, K. F., Ganzeveld, L. N., and Krol, M. C.: European NOx emissions in WRF-Chem derived from OMI: impacts on summertime surface ozone, Atmos. Chem. Phys., 19, 11821–11841, https://doi.org/10.5194/acp-19-11821-2019, 2019.
Wang, C., Wang, T., Wang, P., and Rakitin, V.: Comparison and Validation of TROPOMI and OMI NO2 Observations over China, Atmosphere, 11, 636, https://doi.org/10.3390/atmos11060636, 2020.
Zara, M., Boersma, K. F., Eskes, H., Denier van der Gon, H., Vilà-Guerau de Arellano, J., Krol, M., van der Swaluw, E., Schuch, W., and Velders, G. J. M.: Reductions in nitrogen oxides over the Netherlands between 2005 and 2018 observed from space and on the ground: Decreasing emissions and increasing O3 indicate changing NOx chemistry, Atmos. Environ. X, 9, 100104, https://doi.org/10.1016/j.aeaoa.2021.100104, 2021.
Zhang, Q., Pan, Y., He, Y., Walters, W. W., Ni, Q., Liu, X., Xu, G., Shao, J., and Jiang, C.: Substantial nitrogen oxides emission reduction from China due to COVID-19 and its impact on surface ozone and aerosol pollution, Sci. Total. Environ., 753, 142238, https://doi.org/10.1016/j.scitotenv.2020.142238, 2021.
Zhang, R., Zhang, Y., Lin, H., Feng, X., Fu, T.-M., and Wang, Y.: NOx Emission Reduction and Recovery during COVID-19 in East China, Atmosphere, 11, 433, https://doi.org/10.3390/atmos11040433, 2020.
Zhao, B., Wang, S. X., Liu, H., Xu, J. Y., Fu, K., Klimont, Z., Hao, J. M., He, K. B., Cofala, J., and Amann, M.: NOx emissions in China: historical trends and future perspectives, Atmos. Chem. Phys., 13, 9869–9897, https://doi.org/10.5194/acp-13-9869-2013, 2013.
Zhao, B., Zheng, H., Wang, S., Smith, K. R., Lu, X., Aunan, K., Gu, Y., Wang, Y., Ding, D., Xing, J., Fu, X., Yang, X., Liou, K. N., and Hao, J.: Change in household fuels dominates the decrease in PM2.5 exposure and premature mortality in China in 2005–2015, P. Natl. Acad. Sci. USA, 115, 12401–12406, https://doi.org/10.1073/pnas.1812955115, 2018.
Zhao, X., Zhou, W., and Han, L.: Human activities and urban air pollution in Chinese mega city: An insight of ozone weekend effect in Beijing, Phys. Chem. Earth, 110, 109–116, https://doi.org/10.1016/j.pce.2018.11.005, 2019.
Zheng, B., Chevallier, F., Ciais, P., Broquet, G., Wang, Y., Lian, J., and Zhao, Y.: Observing carbon dioxide emissions over China's cities and industrial areas with the Orbiting Carbon Observatory-2, Atmos. Chem. Phys., 20, 8501–8510, https://doi.org/10.5194/acp-20-8501-2020, 2020a.
Zheng, B., Geng, G., Ciais, P., Davis, S. J., Martin, R. V., Meng, J., Wu, N., Chevallier, F., Broquet, G., Boersma, F., van der A, R. J., Lin, J., Guan, D., Lei, Y., He, K., and Zhang, Q.: Satelite-based estimats of decline and rebound in China's CO2 emissions during COVID-19 pandemic, Sci. Adv., 6, eabd4998, https://doi.org/10.1126/sciadv.abd4998, 2020b.
Zheng, B., Zhang, Q., Geng, G., Shi, Q., Lei, Y., and He, K.: Changes in China's anthropogenic emissions during the COVID-19 pandemic, figshare [data set], https://doi.org/10.6084/m9.figshare.c.5214920.v2, 2021a.
Zheng, B., Zhang, Q., Geng, G., Chen, C., Shi, Q., Cui, M., Lei, Y., and He, K.: Changes in China's anthropogenic emissions and air quality during the COVID-19 pandemic in 2020, Earth Syst. Sci. Data, 13, 2895–2907, https://doi.org/10.5194/essd-13-2895-2021, 2021b.
Zheng, H., Zhao, B., Wang, S., Wang, T., Ding, D., Chang, X., Liu, K., Xing, J., Dong, Z., Aunan, K., Liu, T., Wu, X., Zhang, S., and Wu, Y.: Transition in source contributions of PM2.5 exposure and associated premature mortality in China during 2005–2015, Environ. Int., 132, 105111, https://doi.org/10.1016/j.envint.2019.105111, 2019.