the Creative Commons Attribution 4.0 License.
the Creative Commons Attribution 4.0 License.
 | 17 May 2023
Comparison of dust optical depth from multi-sensor products and MONARCH (Multiscale Online Non-hydrostatic AtmospheRe CHemistry) dust reanalysis over North Africa, the Middle East, and Europe
Michail Mytilinaios
Sara Basart
Sergio Ciamprone
Juan Cuesta
Claudio Dema
Enza Di Tomaso
Paola Formenti
Antonis Gkikas
Oriol Jorba
Ralph Kahn
Carlos Pérez García-Pando
Serena Trippetta
Lucia Mona
Aerosol reanalysis datasets are model-based, observationally constrained, continuous 3D aerosol fields with a relatively high temporal frequency that can be used to assess aerosol variations and trends, climate effects, and impacts on socioeconomic sectors, such as health. Here we compare and assess the recently published MONARCH (Multiscale Online Non-hydrostatic AtmospheRe CHemistry) high-resolution regional desert dust reanalysis over northern Africa, the Middle East, and Europe (NAMEE) with a combination of ground-based observations and space-based dust retrievals and products. In particular, we compare the total and coarse dust optical depth (DOD) from the new reanalysis with DOD products derived from MODIS (MODerate resolution Imaging Spectroradiometer), MISR (Multi-angle Imaging SpectroRadiometer), and IASI (Infrared Atmospheric Sounding Interferometer) spaceborne instruments. Despite the larger uncertainties, satellite-based datasets provide a better geographical coverage than ground-based observations, and the use of different retrievals and products allows at least partially overcoming some single-product weaknesses in the comparison. Nevertheless, limitations and uncertainties due to the type of sensor, its operating principle, its sensitivity, its temporal and spatial resolution, and the methodology for retrieving or further deriving dust products are factors that bias the reanalysis assessment. We, therefore, also use ground-based DOD observations provided by 238 stations of the AERONET (AErosol RObotic NETwork) located within the NAMEE region as a reference evaluation dataset. In particular, prior to the reanalysis assessment, the satellite datasets were evaluated against AERONET, showing moderate underestimations in the vicinities of dust sources and downwind regions, whereas small or significant overestimations, depending on the dataset, can be found in the remote regions. Taking these results into consideration, the MONARCH reanalysis assessment shows that total and coarse-DOD simulations are consistent with satellite- and ground-based data, qualitatively capturing the major dust sources in the area in addition to the dust transport patterns. Moreover, the MONARCH reanalysis reproduces the seasonal dust cycle, identifying the increased dust activity that occurred in the NAMEE region during spring and summer. The quantitative comparison between the MONARCH reanalysis DOD and satellite multi-sensor products shows that the reanalysis tends to slightly overestimate the desert dust that is emitted from the source regions and underestimate the transported dust over the outflow regions, implying that the model's removal of dust particles from the atmosphere, through deposition processes, is too effective. More specifically, small positive biases are found over the Sahara desert (0.04) and negative biases over the Atlantic Ocean and the Arabian Sea (−0.04), which constitute the main pathways of the long-range dust transport. Considering the DOD values recorded on average there, such discrepancies can be considered low, as the low relative bias in the Sahara desert (< 50 %) and over the adjacent maritime regions (< 100 %) certifies. Similarly, over areas with intense dust activity, the linear correlation coefficient between the MONARCH reanalysis simulations and the ensemble of the satellite products is significantly high for both total and coarse DOD, reaching 0.8 over the Middle East, the Atlantic Ocean, and the Arabian Sea and exceeding it over the African continent. Moreover, the low relative biases and high correlations are associated with regions for which large numbers of observations are available, thus allowing for robust reanalysis assessment.
- Article
(28266 KB) - Full-text XML
-
Supplement
(4432 KB) - BibTeX
- EndNote


Atmospheric desert dust is one of the major contributors to global aerosol loading and is the dominant component of atmospheric aerosols over large areas of Earth (Zender et al., 2004; Goudie and Middleton, 2006), with the Sahara desert as the main contributor to the aerosol budget at global scale (Middleton and Goudie, 2001; Prospero et al., 2002; Ginoux et al., 2012a). Mineral dust particles, suspended in the atmosphere from arid and semi-arid regions, can remain aloft for periods ranging from several days to about a week, depending on their size (Prospero, 1999). Huge amounts of dust can be transported over great distances under favorable meteorological conditions, affecting regions hundreds to thousands of kilometers away (Mona et al., 2006; Papayannis et al., 2008, 2014; Flaounas et al., 2015; Gkikas et al., 2015; Ramaswamy et al., 2017; Yu et al., 2021).
The impact of atmospheric dust on the environment, human and animal health, and economies represents a major scientific and societal issue (UNCCD, 2022). Dust aerosols can interact with solar and thermal radiation and with clouds, affecting radiative forcing and precipitation formation and thus influencing Earth's weather and climate (Levin et al., 1996; Tegen et al., 1996; Myhre and Stordal, 2001; Slingo et al., 2006; Lambert et al., 2013; Myhre et al., 2013; Nabat et al., 2015; Karydis et al., 2017; Gkikas et al., 2018, 2019). Once the dust is deposited, either by wet or dry deposition, it impacts both aquatic and terrestrial ecological systems through their biogeochemistry; e.g., dust contains micronutrients that can act as a fertilizer which increases primary productivity in the Amazon rainforest (Okin et al., 2004; Jickells et al., 2005; Painter et al., 2007; Bristow et al., 2010; Lekunberri et al., 2010; Yu et al., 2015). For countries in and downwind of arid regions, airborne sand and dust pose a significant threat to human and animal health (Gyan et al., 2005; Griffin, 2007; Kanatani et al., 2010; Mallone et al., 2011; Cadelis et al., 2014; Pérez García-Pando et al., 2014; Querol et al., 2019; WHO, 2021) and to various socioeconomic sectors, such as aviation, ground transportation, agriculture, infrastructure, solar energy, and other industries (Goossens and Van Kerschaever, 1999; Sivakumar, 2005; Stefanski and Sivakumar, 2009; Mani and Pillai, 2010; Jiang et al., 2011; Weinzierl et al., 2012; Lekas et al., 2014; Costa et al., 2016; Al-Hemoud et al., 2017; Middleton, 2017; Kosmopoulos et al., 2018; Miri and Middleton, 2022; Monteiro et al., 2022). It is therefore of great societal and scientific interest to better understand atmospheric dust processes, predict dust events, and prevent or mitigate their unwanted impacts where possible.
A key parameter for tracking airborne aerosols (including mineral dust) from satellite platforms and ground-based remote sensing networks is aerosol optical depth (AOD). AOD is a quantitative measure of the attenuation of light as it is transmitted through the atmosphere, due to scattering and absorption by aerosols. As a result, AOD is proportional to the total number of aerosol particles suspended in the atmosphere, providing important information about their concentration and variability. AOD spectral dependence is related to the column-effective size distribution. Accordingly, coarse AOD is the fraction of the total AOD associated with coarse aerosol particles (approximate radius larger than 0.5 µm) in the atmosphere, and it is dominated by natural aerosols (e.g., sea salt and mineral dust; Carslaw et al., 2010). AOD wavelength dependence is related to particle size, which has implications for climate, as the direct radiative forcing induced by atmospheric aerosols depends strongly on the particle size. Accordingly, studies suggest that fine dust generally produces cooling, whereas coarse dust tends to produce warming (Tegen and Lacis, 1996; Miller et al., 2006; Mahowald et al., 2014; Kok et al., 2017), although there remains significant uncertainty in mineral dust properties and therefore their impact on climate projections (Myhre et al., 2013; see Fig. 8.17).
Over the last 2 decades, satellite- and ground-based sensors have made systematic aerosol observations on a global scale, facilitating the integrated study of atmospheric aerosols and combining various measurement techniques and data analysis methods. Moreover, technological advancements nowadays allow for more detailed aerosol characterization, such as the estimation of mineral dust particle contributions to measured optical properties, providing an improved depiction of the atmospheric dust distribution globally (Kaufman et al., 2005; Liu et al., 2008, 2018; Giles et al., 2012; Peyridieu et al., 2013; Kahn and Gaitley, 2015; Gkikas et al., 2013, 2016; Marinou et al., 2017; Proestakis et al., 2018). Nevertheless, there are limitations regarding the spatiotemporal coverage of aerosol observations and aerosol typing. Ground-based measurements may provide a high sampling frequency (e.g., one or more measurements per hour); however, they are limited to over land surfaces and provide very limited spatial coverage. Furthermore, the distribution of surface stations is not in itself ideal for studying the highly varying desert dust concentrations, and the regions most affected by sand and dust storms are generally not well supported by research infrastructure and networks (Benedetti et al., 2018). On the other hand, polar-orbiting satellite sampling capabilities above both land and sea are also limited, due to the lower temporal resolution, as they obtain global coverage, at best, every 1 to 2 d (e.g., MODIS). For both surface- and space-based aerosol remote sensing, the measurement possibility is affected by weather conditions (e.g., clouds and snow), and instruments that observe reflected or transmitted solar radiation (e.g., MODIS, MISR, and AERONET sun photometers) cannot obtain measurements during the nighttime. Additionally, there is no single “best” aerosol satellite product globally, and some large differences are observed when comparing products from different sensors and algorithms (Sogacheva et al., 2020).
To fill these gaps and overcome sparse coverage, low temporal resolution, and partial information provided by measurements, model simulations can be combined with observations within a data assimilation framework to estimate the optimal initial conditions for forecast models (analyses) and for the production of reanalysis datasets (i.e., complete and consistent reconstructions of the atmosphere). Aerosol reanalysis datasets can accurately represent the spatial and temporal distribution of airborne dust over an extended period of time (Inness et al., 2013, 2019; Cuevas et al., 2015; Lynch et al., 2016; Gelaro et al., 2017; Yumimoto et al., 2017), thereby reducing the estimated errors in numerical model simulations due to imperfect model dynamics, in addition to uncertainties in the initial conditions and forcing fields, by means of assimilated observational constraint. A novel regional reanalysis of desert dust aerosol over the domain of northern Africa, the Middle East, and Europe (NAMEE) has been released recently by the Barcelona Supercomputing Center (BSC; Di Tomaso et al., 2021) for the period 2007–2016. The reanalysis was obtained using the Multiscale Online Non-hydrostatic AtmospheRe CHemistry (MONARCH) aerosol–chemical weather system and by assimilating a satellite AOD dataset that specifically constrains the dust component. The MONARCH dust reanalysis aims to provide reliable dust information at a high temporal and spatial resolution, both near the surface and at upper levels. The reanalysis dataset consists of three-dimensional (3D) and two-dimensional (2D) variables covering a wide range of dust-related atmospheric parameters, including optical and microphysical dust properties, along with dust deposition and solar radiation variables. Di Tomaso et al. (2022) describe the MONARCH reanalysis setup in addition to the data assimilation diagnostics and provide a first basic evaluation of the reanalysis.
Here, we present a comprehensive assessment of the MONARCH reanalysis total and coarse-mode dust optical depth (i.e., DOD and coarse DOD, respectively) at 550 nm against satellite-based mineral dust products retrieved or derived from different sensors (i.e., MODIS, MISR, and IASI), along with ground-based AERONET (AErosol RObotic NETwork) AOD measurements. DOD is the model diagnostic variable directly constrained by observations through data assimilation and is, therefore, the primary focus of the MONARCH reanalysis assessment. The validation of variables that are not directly constrained by observations such as the vertical extinction profile will be the subject of a companion study. Instead of using a single-DOD reference dataset, we combine different DOD products that together provide better coverage of the MONARCH's spatiotemporal domain. An additional advantage of using different observational reference datasets is the ability to perform cross-validation of the MONARCH reanalysis performance, based on the results obtained from each dataset. The total and coarse-DOD products of the reference datasets were obtained following different retrieval techniques and assumptions, as the limitations of each dust characterization technique introduce uncertainties into the DOD retrievals. Nevertheless, by collating the comparison results obtained from different datasets, we can identify biases caused by retrieval uncertainties and consider them in the final reanalysis assessment. To further investigate the reliability of the satellite-based DOD datasets, we also evaluated all products using an independent observational dataset (i.e., AERONET) as reference.
The following sections describe the assessment process and the results obtained. In Sect. 2, we present the main characteristics of the datasets used for the assessment of the MONARCH reanalysis DOD, along with a description of the applied methodology. In Sect. 3, the validation of the satellite data using AERONET ground-based measurements is presented. Results from the MONARCH reanalysis assessment procedure are presented in Sect. 4, whereas in Sect. 5 the main findings and conclusions are summarized.
The dust-related observational datasets selected for the MONARCH dust regional reanalysis assessment include remote sensing products from ground-based networks (i.e., AERONET) and satellite sensors (i.e., MODIS, MIRS, and IASI). The selection of these remote-sensing-derived dust products considers the following requirements: (i) the observational datasets should have sufficient temporal and geographical coverage over the MONARCH reanalysis dataset (i.e., NAMEE region and the period 2007–2016), (ii) the datasets must be consolidated in order to assure good quality data and to assess the associated errors, (iii) the datasets must be homogeneous (i.e., no changes in the algorithm's version or calibration of the instrument for the whole spatiotemporal domain) and harmonized (e.g., ground-based observations must be from international networks that implement a harmonized quality assurance and quality control procedure), and, last, (iv) the dust speciation is essential for the MONARCH reanalysis assessment. The latter means that the aerosol observational products not should be related to the total AOD but specifically to its dust component, which are obtained through advanced products or through consolidated dust-filtering algorithms. Finally, in the assessment, it is important to consider that the observational and reanalysis datasets are usually available at different spatial and temporal resolutions, which implies that they must be colocated in terms of space and time before their comparison. Details about the dust AOD characterization and the spatiotemporal colocation methodology followed for every dataset are given in the next subsections.
2.1 MONARCH dust regional reanalysis
The MONARCH dust regional reanalysis represents state-of-the-art desert dust information over a domain covering the most prominent dust source areas in northern Africa and the Middle East. This dataset has recently been released by the Barcelona Supercomputing Center (BSC) for a 10-year period, spanning 2007 to 2016, over a spatial domain extending from 0 to 70∘ N latitude and from 30∘ W to 70∘ E longitude. An extensive description of the MONARCH reanalysis setup and dataset can be found in Di Tomaso et al. (2022). Here we summarize the main characteristics that are relevant for this study. The MONARCH reanalysis geographical domain includes some of the world's main dust sources like the Sahara in northern Africa, the Arabian Desert in the Middle East, and the arid regions of western Asia (Fig. 1), with the former emitting 50 % of the total dust burden in the atmosphere (Ginoux et al., 2012b). It also includes maritime regions such as the Arabian Sea, the Mediterranean Sea, and the northeastern Atlantic Ocean, over which long-range dust transport frequently takes place. A list of desert and arid regions, representing the major dust sources of the NAMEE region, is denoted by capital letters in Fig. 1. Figure 1 also shows the 10 subregions into which the MONARCH reanalysis domain is divided for evaluation purposes.
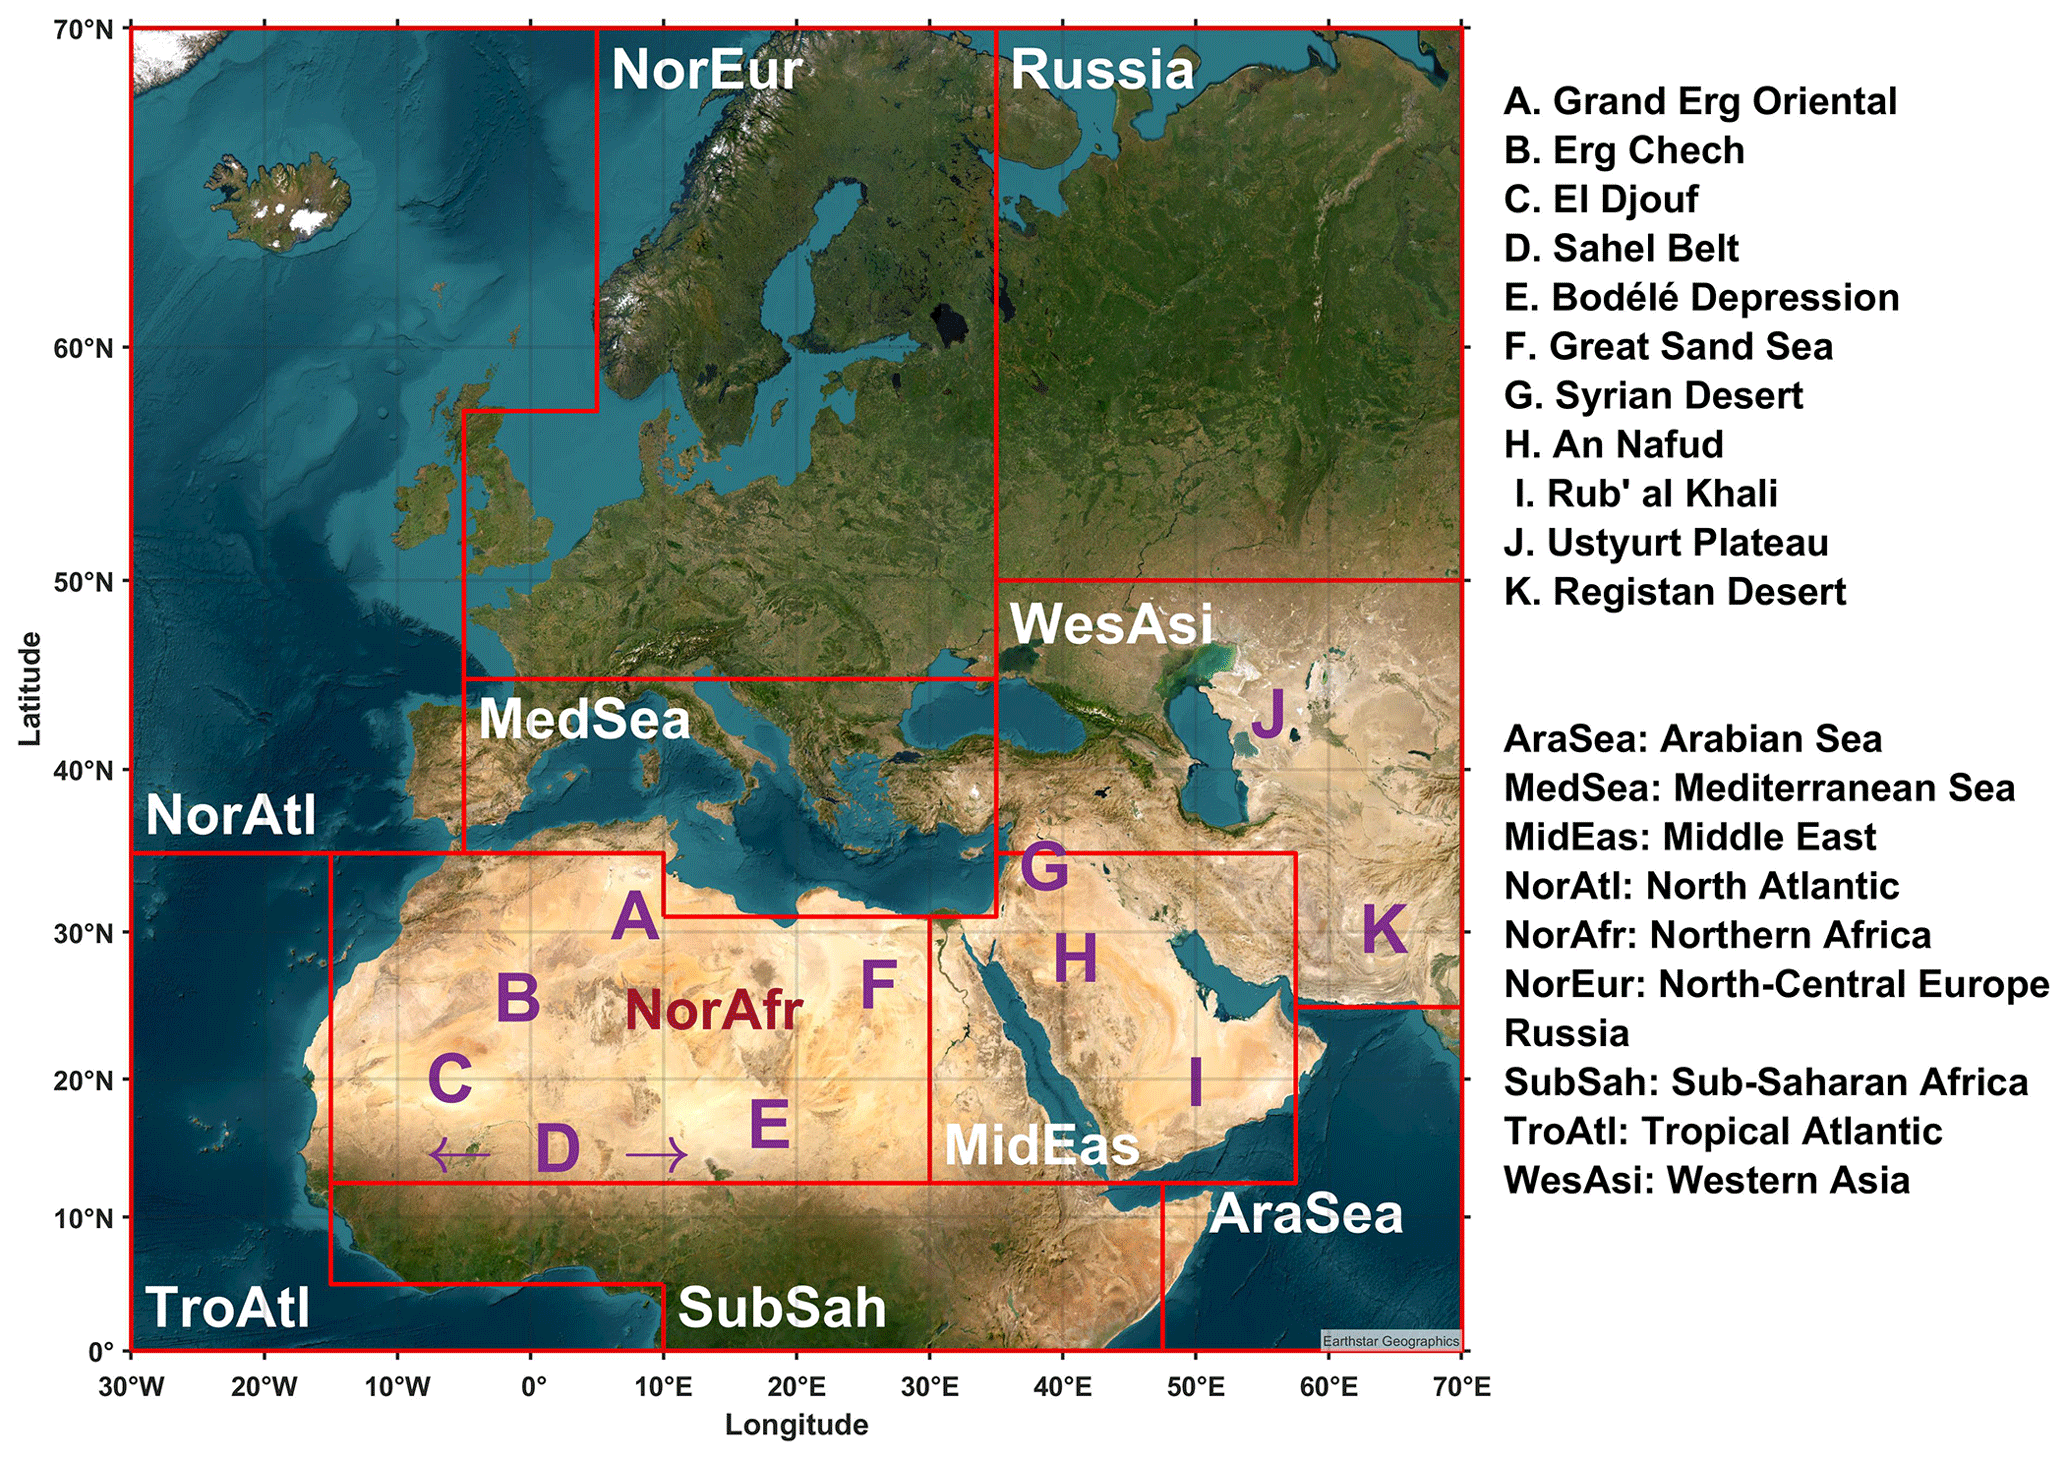
Figure 1MONARCH reanalysis geographical domain (base map source: Esri, Earthstar Geographics, and CNES/Airbus DS). The domain is divided into 10 subregions. Capital letters in purple mark the major deserts in northern Africa, the Middle East, and western Asia.
MONARCH reanalysis novelty includes its unprecedented spatial and temporal resolution, in addition to the assimilation of an innovative DOD dataset covering all cloud-free and snow-free land surfaces, including areas particularly relevant for dust applications, such as very bright reflective surfaces. Reanalysis fields are available at a 3-hourly time step (starting every day at 03:00 UTC) and at a horizontal resolution of 0.1∘ latitude × 0.1∘ longitude in a rotated grid (∼ 10 km × 10 km at the Equator). The reanalysis has been obtained using the MONARCH model (Pérez et al., 2011; Klose et al., 2021) and satellite coarse-mode DOD at 550 nm, derived from the MODerate resolution Imaging Spectroradiometer (MODIS) instrument operating aboard NASA's Aqua satellite. More specifically, the dataset assimilated in the MONARCH reanalysis consists of gridded coarse-DOD retrievals over land surfaces, including desert areas, derived from the MODIS Deep Blue aerosol products (Collection 6, Level 2; Hsu et al., 2004), according to the retrieval procedure described in Ginoux et al. (2010, 2012a) and Pu and Ginoux (2016). Data assimilation was performed by means of a local ensemble transform Kalman filter data assimilation scheme with a four-dimensional extension (Hunt et al., 2007; Miyoshi and Yamane, 2007; Schutgens et al., 2010; Di Tomaso et al., 2017; Tsikerdekis et al., 2021; Escribano et al., 2022).
The MONARCH reanalysis dataset consists of upper-air profile variables such as dust mass concentration and an extinction coefficient at 550 nm, surface fields such as accumulated dust dry and wet deposition and mass surface concentration, and total column fields like instantaneous total column dust load, DOD, and coarse DOD at 550 nm. The reanalysis has been produced by estimating the model uncertainty from the realizations of the dust fields in a 12-member ensemble, where each ensemble member was generated using different meteorological initial and boundary conditions and dust emission schemes, along with additional perturbations in the model emission parameters. For each variable of the reanalysis, a number of ensemble statistics is available, namely the arithmetic mean, standard deviation, median, and maximum of the ensemble members. In the present paper, we exclusively assess the reanalysis ensemble mean, as it is a more representative value than the median for describing the ensemble and considers all the members of the ensemble without excluding the outliers.
MONARCH follows a sectional approach for atmospheric dust, i.e., the size distribution is decomposed into eight size bins corresponding to different dust particle ranges, with the particle radius ranging from 0.1 µm (fine particles) to 10 µm (coarse particles). The MONARCH reanalysis DOD is produced considering all eight model size bins, whereas the coarse-mode DOD includes the five coarser size bins from 0.6 to 10 µm in dust particle radius. For simplicity, hereafter, we refer to the MONARCH reanalysis DOD as MONARCH DOD.
2.2 MODIS-based dust product: MIDAS
The MODIS total and coarse DOD used in this study is based on the recently developed ModIs Dust AeroSol (MIDAS) dataset (Gkikas et al., 2020, 2021). MIDAS combines quality-filtered AOD from MODIS Dark Target (over land and ocean) and Deep Blue (over land) products (NASA's Aqua satellite, Collection 6.1, Level 2; Sayer et al., 2014) at swath level, along with DOD : AOD ratios provided by the Modern-Era Retrospective analysis for Research and Applications, version 2 (MERRA-2), reanalysis (Gelaro et al., 2017) to calculate the contribution of mineral dust particles to the overall AOD on the MODIS native grid. MIDAS coarse-mode DOD is also derived using the MERRA-2 DOD fraction, and considers only particles with radius larger than 0.5 µm. MIDAS provides columnar daily total and coarse DOD (at 550 nm) over all cloud-free and snow-free land and ocean surfaces at a fine spatial resolution (0.1∘ × 0.1∘) over a 15-year period (2003–2017).
The uncertainty in the MIDAS DOD dataset was estimated by taking into account the uncertainties in the MODIS AOD and MERRA-2 DOD : AOD ratio (Gkikas et al., 2021), which in turn were calculated by using the AERONET AOD (Giles et al., 2019) and LIVAS (LIdar climatology of Vertical Aerosol Structure; Amiridis et al., 2015; Marinou et al., 2017) dust fraction, respectively, as a reference. According to the uncertainty analysis performed, MIDAS uncertainties scale with DOD value (Gkikas et al., 2021; see Fig. 8); however, in terms of relative uncertainty, the MIDAS DOD product is highly reliable over dust-rich regions (∼33 % annual average in the regions with strongest DODs) and becomes more uncertain in areas where dust loading is infrequent. Although the MIDAS coarse-DOD product is still under testing, it was used in this study after being evaluated against ground-based AERONET coarse-DOD observations (Sect. 3).
Prior to the comparison, the MONARCH and MIDAS datasets were colocated in space and in time. First, MONARCH was regridded through bilinear interpolation, using the MIDAS grid as a reference. Regarding the temporal colocation, thanks to the wide MODIS swath (∼ 2330 km), MIDAS provides near-global DOD retrievals every 1 to 2 d; consequently, MONARCH 3-hourly time steps had to be averaged around Aqua's overpass time. Aqua follows a sun-synchronous, near-polar orbit, crossing the Equator once during daytime at ∼ 13:30 local time (LT), and hence, the MONARCH DOD was temporally averaged around that time using the two nearest MONARCH time slots.
2.3 MISR dust product
The Multi-angle Imaging SpectroRadiometer (MISR) is an imaging instrument which has provided aerosol observations on a global scale since 2000 (Diner et al., 1998). The MISR instrument consists of nine cameras observing at nine different view angles (between −70.5 and 70.5∘) and in four different wavelengths (446.4, 557.5, 671.7, and 866.4 nm). Apart from the AOD retrievals in the four spectral bands, the variations between the reflectance acquired from a very large range of scattering angles can provide information about aerosol microphysical properties such as particle size, shape, and single-scattering albedo by considering the appropriate particle optical models (Kahn et al., 1998, 2001; Kahn and Gaitley, 2015). In particular, MISR's sensitivity to the characteristics of the aerosol-scattering-phase function enables it to distinguish between the non-spherical and spherical particles, making it possible to separate mineral dust aerosols from other aerosol components (Kahn et al., 1997). Thus, the AOD fraction of the non-spherical particles, consisting of randomly oriented non-spherical grains or ellipsoids, can be considered equivalent to the DOD with relative certainty, especially over surfaces of dark water (Kalashnikova and Kahn, 2006). Many studies show that MISR's sensitivity to DOD depends on the surface type, and like nearly all passive satellite aerosol remote sensing, MISR retrievals are less reliable over bright surfaces (Kahn et al., 2010). Specifically, MISR retrievals over land tend to underestimate DOD in dust-rich areas and have greater uncertainties compared to MISR for DOD over water; therefore, for the MONARCH DOD comparison, we exclusively used dark water retrievals, which are exceedingly sensitive to aerosol non-sphericity (Guo et al., 2013; Kalashnikova et al., 2013). In particular, we used the daily dark water non-spherical AOD retrieval (at 557.5 nm) provided by the MISR Level 3 Component Global Aerosol Product (MIL3DAE; version F15_0031) dataset, on a 0.5∘ × 0.5∘ spatial grid during the period 2000–2016.
However, we should note here that the dark-water-retrieval sensitivity to particle non-sphericity decreases when the total AOD is below about 0.1 and when the non-spherical component contributes less than 15 %–20 % to the total AOD (Kalashnikova and Kahn, 2006; Pierce et al., 2010; Kalashnikova et al., 2013). As a result, non-spherical particles are sometimes retrieved over remote oceans, even where they are unlikely to be present, overestimating non-spherical AOD fraction, probably due to the presence of unscreened cirrus or other naturally occurring non-spherical aerosols (Pierce et al., 2010; Kalashnikova et al., 2013; Kahn and Gaitley, 2015). On the other hand, the dark water non-spherical AOD retrieval performs quite well in regions of dust transport, where the AOD values are significant and the non-spherical component is dominant. As previous studies have shown (Kalashnikova and Kahn, 2006, 2008), this is especially true over the tropical Atlantic, where desert dust is the dominant aerosol component, accounting for 40 %–70 % of the total AOD (Guo et al., 2013).
The spatial colocation between the two datasets was obtained by regridding the MONARCH DOD, using the coarser MISR Level 3 product grid as a reference. For the temporal colocation, we followed a similar methodology to the case of MIDAS. MISR, on board NASA's Terra satellite, crosses the Equator on the descending node at about 10:30 LT, and the MONARCH DOD was temporally averaged around the MISR overpass time using the two nearest MONARCH time slots. MISR has only one-quarter to one-third of the spatial sampling of MODIS due to its relatively narrow swath width (∼ 380 km), resulting in global coverage every 7–9 d at mid- to low latitudes, compared to every 1–2 d by MODIS. So, sampling must be taken into consideration when comparing datasets averaged over longer timescales.
2.4 IASI dust product: AEROIASI
The Infrared Atmospheric Sounding Interferometer (IASI) instrument is in orbit on board EUMETSAT's MetOp satellite, providing temperature and water vapor profiles of the troposphere and lower stratosphere at vertical and horizontal resolutions of 1 and 12 km, respectively. IASI measurements in the infrared part of the electromagnetic spectrum enable observations in both daytime and nighttime conditions. Thanks to its wide swath (2200 km), IASI provides global coverage twice a day, crossing the Equator on the descending node at approximately 09:30 and 21:30 LT. Desert dust profiles can be derived from individual thermal infrared spectra measured by IASI for most cloud-free IASI pixels, both over land and ocean, following the method called AEROIASI, developed by Cuesta et al. (2015). Information on the vertical distribution of dust is mainly provided by their broadband radiative effect, which includes the aerosol thermal emission that depends on the vertical profile of temperature at each altitude. Unlike most IASI dust products (e.g., Clarisse et al., 2019), the AEROIASI dataset provides both vertical and column-integrated dust extinction information. More specifically, AEROIASI products include twice-daily 3D distributions of the dust extinction coefficient, although the present study only uses dust horizontal distributions derived in terms of DOD.
First, the AEROIASI algorithm uses as input a priori dust microphysical properties (e.g., a dust number concentration profile in addition to its size distribution and complex refractive index) and meteorological variables (temperature profiles, surface temperatures, and H2O profiles) to simulate thermal infrared radiance spectra, which are then compared to those measured by IASI. In order to fit IASI observations and to minimize the spectral residuals, the method iteratively adjusts the radiative transfer inputs, namely the dust profile and surface temperature, using Tikhonov–Philips-type regularization, until reaching good agreement for different atmospheric and surface conditions. The a priori dust profile used in every pixel (the same profile for all pixels and all seasons) is a first guess of the dust vertical distribution obtained from an average of the dust extinction vertical profiles over the Sahara desert, retrieved from CALIPSO/CALIOP (Cloud-Aerosol Lidar and Infrared Pathfinder Satellite Observations/Cloud-Aerosol Lidar with Orthogonal Polarization) satellite observations (Winker et al., 2009). Once the IASI spectra are fitted, a series of quality checks is performed to screen out cloudy measurements and aberrant retrievals, even though subvisible cirrus clouds (with AOD below ∼ 0.02) may be difficult to screen out. Then, the final outputs of AEROIASI are calculated for each unscreened pixel, providing a vertical profile of the dust extinction coefficient at 10 µm and the associated DOD by vertical integration of the extinction profile. Using thermal infrared measurements, AEROIASI retrievals are mostly sensitive to coarse aerosols. In fact, the contribution of finer dust particles (with radii less than ∼1 µm) to total AOD at 10 µm is expected to be less than ∼10 % (Pierangelo et al., 2005); consequently, the AEROIASI product considered here is the coarse-mode DOD at 10 µm. The AEROIASI retrieval offers different sensitivities over land and the ocean. Normally, there is more sensitivity over land, as the surface temperature deviates more from that of the atmosphere above, compared to the case over the ocean. However, the surface emissivity over land is less well known and might induce local biases. Moreover, comparisons conducted between AEROIASI and AERONET coarse-AOD retrievals showed distinct discrepancies between the two datasets in many sites over and downwind of the Sahara desert (Cuesta et al., 2020) and AEROIASI overestimations far away from the desert dust sources (Cuesta et al., 2015). The biases in both cases reach or even exceed 0.1 in absolute value. Additionally, the use of non-zero a priori values for dust abundance (equivalent to an AOD at 10 µm of ∼ 0.03) is expected to induce positive biases in situations with very low dust abundances and low sensitivities, as encountered for the relatively lower surface temperatures of midlatitudes, compared to those near the tropics. Developments for future versions of the product will aim at screening out these low-sensitivity situations.
In this study, we used coarse DOD over the period 2008–2016, provided by the AEROIASI Version 3 dataset, which was retrieved from MetOp-A/IASI data (IASI-A; Level 3), whose mission was completed in November 2021. The horizontal resolution of the AEROIASI dataset is 1∘ × 1∘. The DOD at 10 µm was obtained by vertically integrating the extinction coefficient, and then it was spectrally converted from 10 µm to 550 nm, using a conversion factor of 1.70 derived with a Mie code. The derived AEROIASI coarse DOD (at 550 nm) considers coarse dust particles larger than 0.6 µm in radius. The spatial colocation between the two datasets was achieved by regridding MONARCH coarse DOD through bilinear interpolation using the coarser AEROIASI grid as a reference. Finally, MONARCH was linearly interpolated in terms of time over the exact date–time of the IASI retrievals, as provided by the AEROIASI dataset.
2.5 AERONET dust-filtered products
High-quality aerosol optical properties are provided by the ground-based photometer network of AERONET (Holben et al., 1998; O'Neill et al., 2003; Giles et al., 2019). These instruments rely on the extinction measurements of the direct and scattered solar radiation at several nominal wavelengths (between 340 and 1020 nm). In addition, direct-sun AOD processing includes the Spectral Deconvolution Algorithm (SDA) described in O'Neill et al. (2003). This algorithm yields submicron (fine) and supermicron (coarse) AOD at a standard wavelength of 500 nm from which the fraction of fine-mode to total AOD can be computed. The algorithm fundamentally depends on the assumption that the coarse-mode Ångström exponent and its derivative are close to zero. AERONET provides a long-term and continuous database of aerosol optical, microphysical, and radiative properties and is the best currently available on a global basis for aerosol research and characterization, validation of satellite retrievals, and evaluation of aerosol models.
In this study, we used AERONET Version 3 quality-assured data (i.e., Level 2.0) as a reference dataset (Giles et al., 2019). Since AOD includes contributions from different types of particles, a dust filter method was applied to identify AOD observations in which dust is the dominant aerosol type. AERONET dust-filtered AOD (i.e., DOD) is based on direct-sun AOD retrievals between 440 and 870 nm. Although direct sun does not yield AOD at 550 nm, this variable is calculated from the AOD at 440, 675, and 870 nm and the Ångström exponent at 440–870 nm (AE), using Ångström's law. Then AE is used as a filter because it is inversely related to the average aerosol size. Lower AE values (< 1) indicate the significant presence of coarse-mode particles (e.g., mineral dust and sea salt), whereas higher AE values (> 1) imply a large abundance of fine particles (e.g., biomass burning and urban aerosols; Papagiannopoulos et al., 2018). Here we follow the discrimination method of Basart et al. (2009), where DOD = AOD when AE < 0.75, and all data with AE > 1.2 are considered free of dust, i.e., DOD = 0. These two definitions can introduce uncertainties and, in particular, a potential over- and underestimation of the total dust contribution, respectively. Other studies have used lower discrimination thresholds (e.g., AE < 0.6) in an effort to obtain pure mineral dust conditions (e.g., Di Tomaso et al., 2022) but thereby exclude more AOD observations in long-range transport regions. Finally, a mixed aerosol type is assumed when 0.75 ≤ AE ≤ 1.2, and since we cannot precisely estimate the contribution of dust to it, these cases are not used for evaluation purposes in this study.
Regarding AERONET coarse AOD, it was retrieved based on the SDA, which yields fine- and coarse-mode AOD at 500 nm, assuming a particle radius of 0.6 µm as the inflection point in the volume size distribution. The coarse-mode AOD is dominated by maritime/oceanic aerosols and desert dust, whereas other natural sources, such as wildfires, can also produce coarse-mode aerosols. Sea salt is usually associated with low AOD (< 0.03) and mainly affects coastal stations, and therefore, inland high coarse-AOD values are assumed to be mineral dust, although significantly high AOD values could be associated with biomass burning particles because they are more absorbent than dust (Dubovik et al., 2002). Moreover, any disparity between the wavelength difference of 550 and 500 nm is negligible, as coarse mineral dust is wavelength independent in the visible range (Eck et al., 1999). Therefore, coarse AOD from AERONET SDA will be used as the corresponding AERONET coarse DOD.
Both AERONET dust-filtered retrievals (total and coarse DOD) are dominated by mineral dust; however, small-sized particles (anthropogenic aerosols, biomass burning, etc.) are always present, especially far away from the sources, whereas sea salt particles can contaminate our retrievals mainly at AERONET stations close to the coast (Basart et al., 2009). Moreover, AERONET particle properties retrieved from sky scan measurements (e.g., coarse AOD) can be contaminated by the reflectance of the various surface types, such as snow, ice, or even some desert surfaces (Sinyuk et al., 2007). Consequently, an overestimate of the AERONET total and coarse DOD is expected.
All the AERONET stations that were located within the MONARCH reanalysis geographical domain and which were operating during the reanalysis period were considered, excluding the stations that are at high altitudes (> 2 km above sea level). Overall, total and coarse-DOD retrievals from 238 stations were used for the present analysis. The two datasets were spatially colocated by interpolating MONARCH over each AERONET station. Regarding the temporal colocation, AERONET data are acquired at 15 min intervals on average; therefore, all AERONET measurements within ± 90 min of the MONARCH reanalysis outputs have been averaged for the comparison on a 3-hourly basis. Figure 4u shows the location of the AERONET sites with at least 30 temporally colocated pairs available (224 in total).
The descriptions of the MIDAS, MISR, AEROIASI, and AERONET dust products above summarized the features and the uncertainties in the total and coarse-DOD products which depend upon the instruments' capabilities, the limitations of the retrieval techniques, and the validity of the assumptions made in order to separate mineral dust aerosols from other aerosol components. All four observational datasets have their advantages and disadvantages and can thus be complementary to each other in order to overcome the limitations regarding the quality of the dust retrievals and the spatiotemporal coverage. MIDAS provides total and coarse-DOD observations both over land and sea with the finest spatial resolution (0.1∘ × 0.1∘). MISR provides the most physically robust separation of DOD by discriminating the dust aerosols based on the actual retrieved particle shape information. AEROIASI has the most frequent sampling, covering the Earth twice a day, and it is the only dataset to provide nighttime measurements. AERONET ground-based measurements provide the finest temporal resolution (∼ 15 min), giving the possibility of assessing the MONARCH reanalysis at its original 3-hourly timescale. Moreover, the signal-to-noise ratio for the AERONET direct-sun measurements is high, and the surrounding surface reflectance makes no significant contribution to the signal in most cases. This renders AERONET AOD the best available source for surface-based particle property retrieval results; therefore, in this study, the AERONET dust-filtered retrievals were used not only to assess the MONARCH reanalysis outputs but also to validate the quality of the satellite-based dust products (see Sect. 3).
2.6 Evaluation strategy
The evaluation metrics that were used to quantify the level of agreement between the MONARCH reanalysis simulations and the observations are the mean bias (MB), the root mean square error (RMSE), the fractional gross error (FGE), and the correlation coefficient (CC), the definitions of which are given in Appendix A.
The intercomparison of total and coarse DOD was conducted over two different temporal scales (annual and seasonal) and over two different spatial scales (grid point and regional). All the statistical indicators (Table A1 in Appendix A) were computed on an annual scale, considering all the different MONARCH and satellite dataset colocated pairs for the period 2007–2016 of the reanalysis, and on a seasonal scale, where the colocated data of a certain season were compared throughout the years according to the following classifications: boreal winter (December–January–February is DJF), boreal spring (March–April–May is MAM), boreal summer (June–July–August is JJA), and boreal autumn (September–October–November is SON). The seasonal subdivision of the datasets allows for the assessment of the MONARCH reanalysis performance in reproducing the annual cycle and the seasonal patterns of the total and coarse DOD. The aforementioned temporal aggregations were generated for each grid point of the reanalysis–satellite colocated data and for each individual AERONET station.
Moreover, the evaluation statistics were produced at a regional scale in order to assess the MONARCH reanalysis over regions with distinct characteristics. The study's geographical domain has been divided into 10 specific subregions (Fig. 1), where the scores were computed considering all the reanalysis and satellite-based dust product pairs contained in each one of them, giving the opportunity to identify any dependencies between the different MONARCH and satellite datasets and the features of each region. The 10 subregions are mainly classified into the following three groups: (i) continental regions that contain the mineral dust sources, where high DOD is observed throughout the year in northern Africa, the Middle East, and western Asia (hereafter NorAfr, MidEas, and WesAsi, respectively); (ii) remote regions of rare dust events, suitable for the MONARCH reanalysis evaluation under conditions of very low DOD in the North Atlantic, north-central Europe, and Russia (hereafter NorAtl, NorEur, and Russia); (iii) maritime and continental regions located downwind of the dust sources, which contain the main dust transport pathways of the tropical Atlantic, Mediterranean Sea, Arabian Sea, and sub-Saharan Africa (hereafter TroAtl, MedSea, AraSea, and SubSah). The latter are subject to seasonal DOD variation. Furthermore, the borders between the regions are defined so that every region consists mainly of one surface type (i.e., land or sea). This rough approximation can improve the interpretation of the regional results, considering that the surface type is associated with the retrieval algorithms used to derive AOD from the satellite observations.
Last, a multi-sensor aggregation comparison at a regional scale, based on the considered satellite-based DOD datasets (i.e., MIDAS, MISR, and AEROIASI) is applied to obtain an overall assessment of the MONARCH reanalysis. We excluded AERONET from the multi-sensor aggregation because the representativeness of the computed regional metrics remains questionable due to the uneven distribution of stations in the various subregions, both quantitatively and spatially (Fig. 2). For example, a large number of network sites sufficiently covers the Mediterranean region and north-central Europe, whereas only one station corresponds to the Arabian Sea, which is additionally located at the edge of the subregion.
The regional evaluation metrics of each satellite dataset were averaged to one final value weighted by the number of the MONARCH reanalysis and satellite-based dust product pairs that each dataset contributes within each subregion. Even though we consider the contributions of all the available colocated pairs, it is noted that the different sampling frequencies (temporal resolution) and overpass times for a given location of the satellites considered in the study complement each other, together providing higher temporal coverage. The weighted mean of the statistical indicators was computed at annual and seasonal scale for every subregion, according to the equations shown in Table A2.
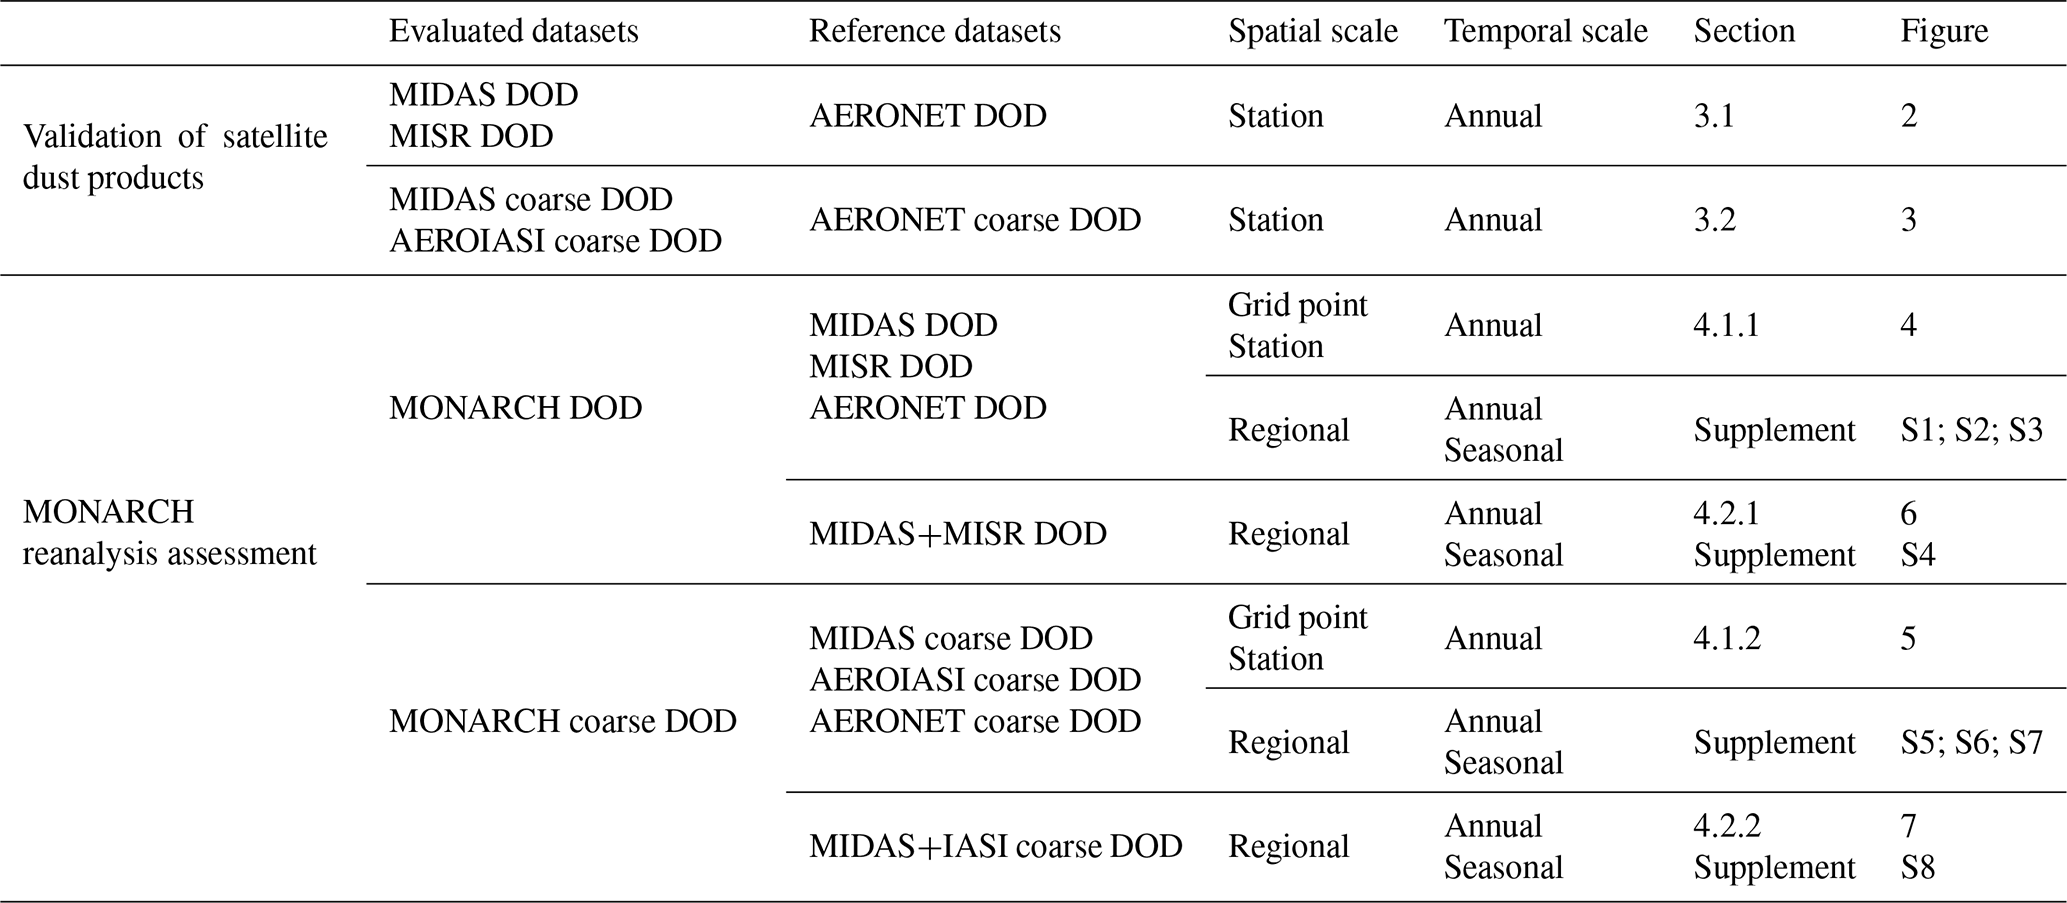
The next two sections present the results of the MONARCH reanalysis assessment and the validation of the satellite datasets using ground-based measurements. An overview of the datasets evaluated and the datasets used as reference, of the spatial and temporal scales at which the evaluation was performed, and of the figures that depict the results is outlined in Table 1 to help the reader navigate between the following sections.
A robust reanalysis assessment requires the observational data to be reliable and consistent across the study spatial domain, regardless of the surface type and the intensity of dust activity. The uncertainties that satellite data can present under certain conditions, as described earlier in Sect. 2, are likely to skew the results of the MONARCH reanalysis assessment. In order to identify the main performance skill of the satellite-derived dust data, in this section we perform a quality check based on comparisons with ground-based AERONET observations. AERONET data have already been used as a gold standard for validating most satellite AOD products. Although MIDAS, MISR, and AEROIASI have been evaluated using dust-related AERONET retrievals in independent analysis (Gkikas et al., 2021; Kahn and Gaitley, 2015; Kalashnikova and Kahn, 2006; Cuesta et al., 2015, 2020), we here seek to assess the performance of the different satellite-based dust products in a common framework (spatial and temporal) for later comparison with the MONARCH reanalysis.
The comparison between satellite-based dust products and AERONET is performed for each station individually using colocated satellite and ground-based measurements. Each satellite dataset was spatially averaged over the AERONET sites, and the AERONET time series were temporally averaged centered on the satellite overpass time at the site. The criteria of spatiotemporal coincidence are ±2 h for AERONET, ±1∘ latitude and longitude for AEROIASI, ±0.5∘ for MISR, and ±0.2∘ for MIDAS, according to the spatial resolution of each satellite dataset used. The time series that emerged from the colocation were then compared to each other, using the metrics defined in Table A1. In addition, DOD time series retrieved from MIDAS and MISR (hereafter MIDAS+MISR), in addition to coarse-DOD retrievals from MIDAS and AEROIASI (hereafter MIDAS+IASI), were combined at station level and then compared to AERONET, with the aim of investigating if an aggregated satellite multi-sensor product could statistically mitigate the weaknesses of each sensor and the biased values they introduce into the individual products.
3.1 MIDAS and MISR DOD compared to AERONET
Figure 2 shows the DOD comparison of the satellite MIDAS (Fig. 2; first column), MISR (Fig. 2; second column), and MIDAS+MISR (Fig. 2; third column) dust products with AERONET observations. Overall, as expected, all annual DOD values (Fig. 2a–f) show a marked south-to-north gradient with DODs maxima (above 0.36) in the Sahel (Fig. 1; “D”) and the Middle East (latitudes < 30∘ N) and DOD minima in continental Europe and Russia (under 0.05). The CC between MIDAS and MISR against AERONET (Fig. 2p–q) is very high at all stations affected by dust regularly (CC > 0.8), whereas it drops below 0.4 at sites where the presence of dust is less frequent, reaching even negative values, down to −0.4, at a few coastal stations in northern Europe.
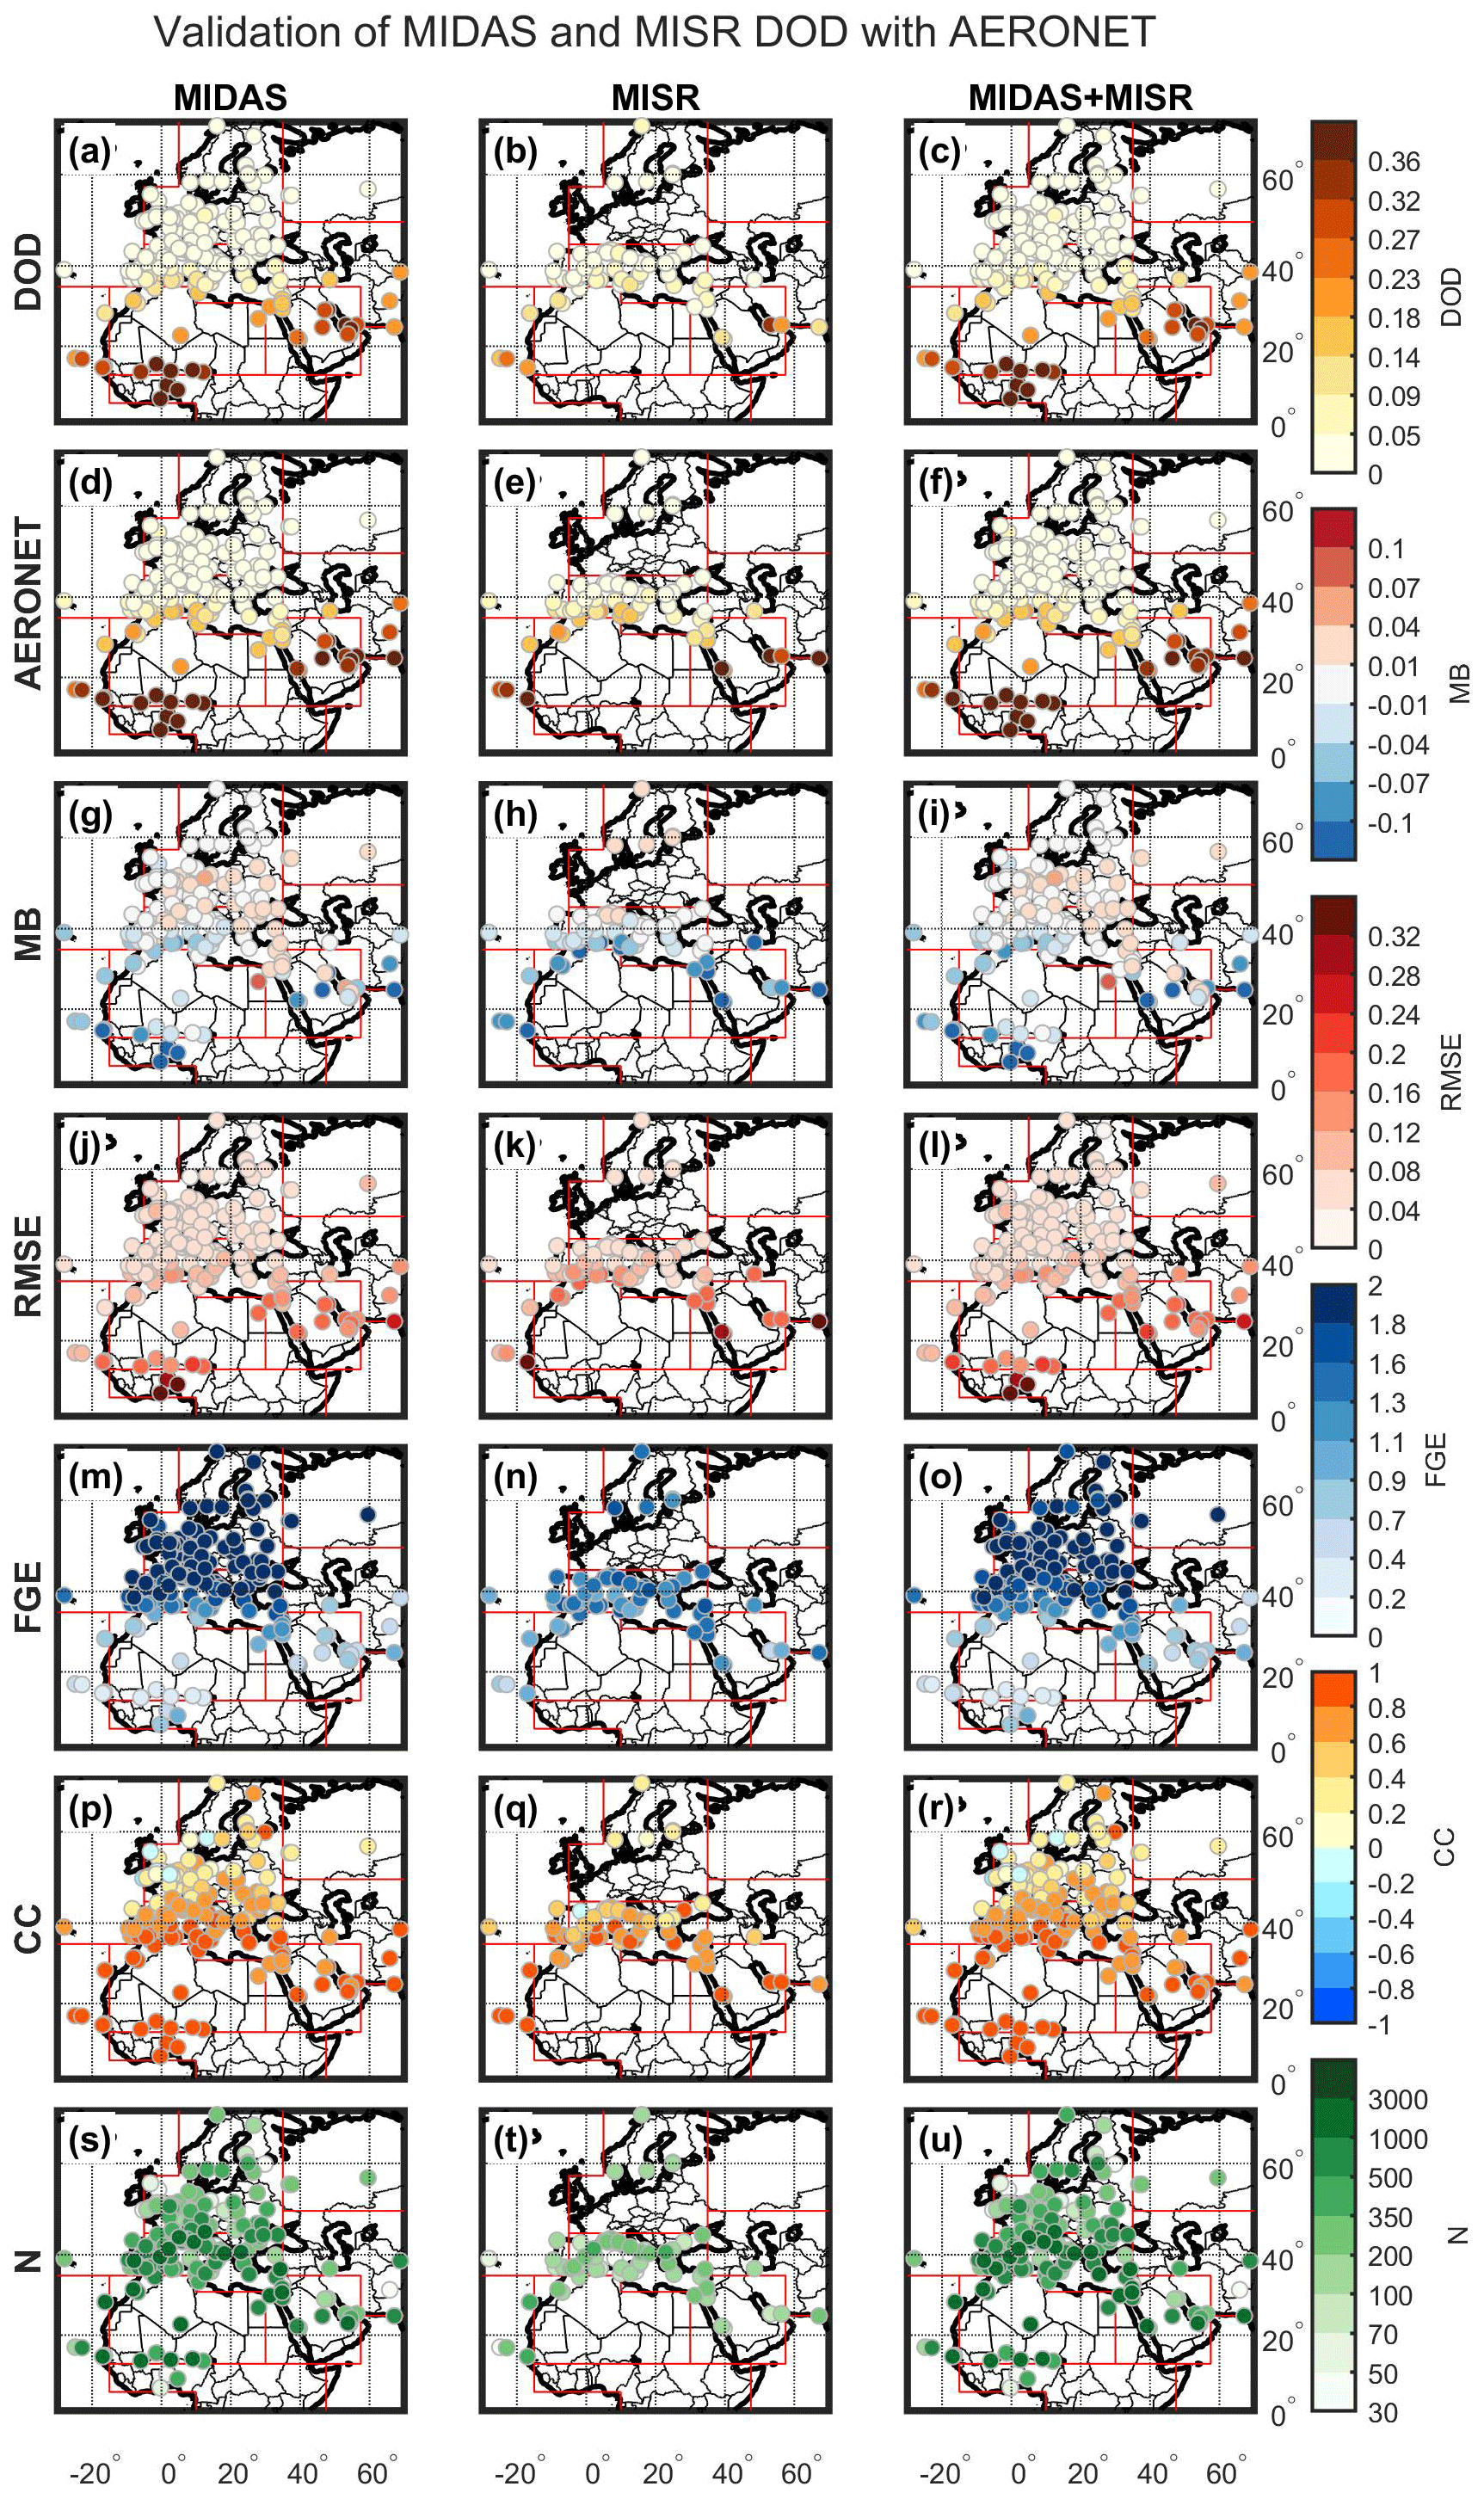
Figure 2DOD comparison of MIDAS (first column), MISR (second column), and MIDAS+MISR (third column) against AERONET for the period 2007–2016. The metrics MB, RMSE, FGE, and CC (Table A1) were computed at station level. The obtained scores are presented here only for sites with N≥30 colocated pairs. The red frames in the background delimit the subregions defined in Fig. 1.
The DOD comparison of MIDAS and MISR against AERONET shows underestimations (MB < 0) at most sites situated close to or around the dust sources in northern Africa and the Middle East and slight overestimations in Europe (MB up to 0.04). In particular, the largest MIDAS underestimations (MB < −0.1) are recorded at stations located along the dust outflow from the Sahara desert to the Gulf of Guinea and the Atlantic Ocean, which is in agreement with Gkikas et al. (2021) and Wei et al. (2019), in addition to some stations on the Arabian Peninsula and in western Asia on the coastline of the Arabian Sea (Fig. 2g). As in the case of MB, MIDAS presents maximum RMSE near to the coasts of the Gulf of Guinea (> 0.32; Fig. 2j); however, RMSE is relatively low (< 0.24) along the Sahelian belt and across the Arabian Peninsula, considering the high DOD values (> 0.32) observed there by both AERONET and MIDAS. This also applies to MIDAS FGE, which remains low (< 0.7) in regions of high dust activity (Fig. 2m).
MISR MB shows an overall underestimation at the majority of the AERONET sites, which exceeds −0.07 in the surroundings of the dust sources. The largest underestimations can be found along the northern Africa coastline and in the Red Sea, where MB < −0.1 (Fig. 2h). In the Mediterranean Sea and continental Europe, MISR shows smaller differences against AERONET, which is associated with the lower DODs in these long-range transport regions (annual DOD mean of up to 0.09 for MISR and AERONET), with RMSE up to 0.08 (Fig. 2k), MB ranges between −0.04 and 0.04, and FGE achieving maximum values (up to 2; Fig. 2n).
Last, the combination of MIDAS and MISR DOD at station level into a single time series (i.e., MIDAS+MISR) compared to AERONET does not show major deviations with respect to the independent MIDAS and MISR datasets, and at most sites, they are identical to MIDAS scores. This is due to the fact that MISR contributes to less than 40 % of the 238 available sites, and that is only at coastal stations. Moreover, the impact of each sensor to the final product is determined by the number of measurements available at each station (Fig. 2s–t), where in most sites, MIDAS exceeds the MISR sampling in number N of observations due to its higher temporal resolution.
3.2 MIDAS and AEROIASI coarse DOD compared to AERONET
The coarse-DOD comparison with MIDAS and AEROIASI against AERONET (Fig. 3) shows different results. As expected, overall annual coarse-DOD values (Fig. 3a–f) show a marked south-to-north gradient with DOD maxima in the Arabian Peninsula (> 0.23 for both sensors) and in the Sahel (> 0.27 for MIDAS and no more than 0.23 for AEROIASI) and DOD minima in continental Europe and Russia (< 0.05 for MIDAS but no less than 0.09 for AEROIASI). The MIDAS CC map shows a very clear correlation (CC > 0.8) with AERONET coarse DOD over all of the dust source regions and the Mediterranean Sea, and a fairly high correlation (CC > 0.6) at most sites in north-central Europe (Fig. 3p). On the other hand, AEROIASI CC ranges between 0.4 and 0.8 at AERONET sites located up to 40∘ N, whereas no correlation (CC ∼ 0) or even negative correlation was computed at all sites across north-central Europe and Russia (Fig. 3q), showing significant weakness in reproducing the temporal evolution of coarse DOD in those regions. Similar tendencies are found for RMSE (Fig. 3j–k) and FGE (Fig. 3m–n) between the two satellite-derived dust products; however, AEROIASI provides relatively greater errors compared to MIDAS, at almost all AERONET stations, and for both metrics, which is something that affects the multi-sensor product as well, especially in northern latitudes (Fig. 3l and o).
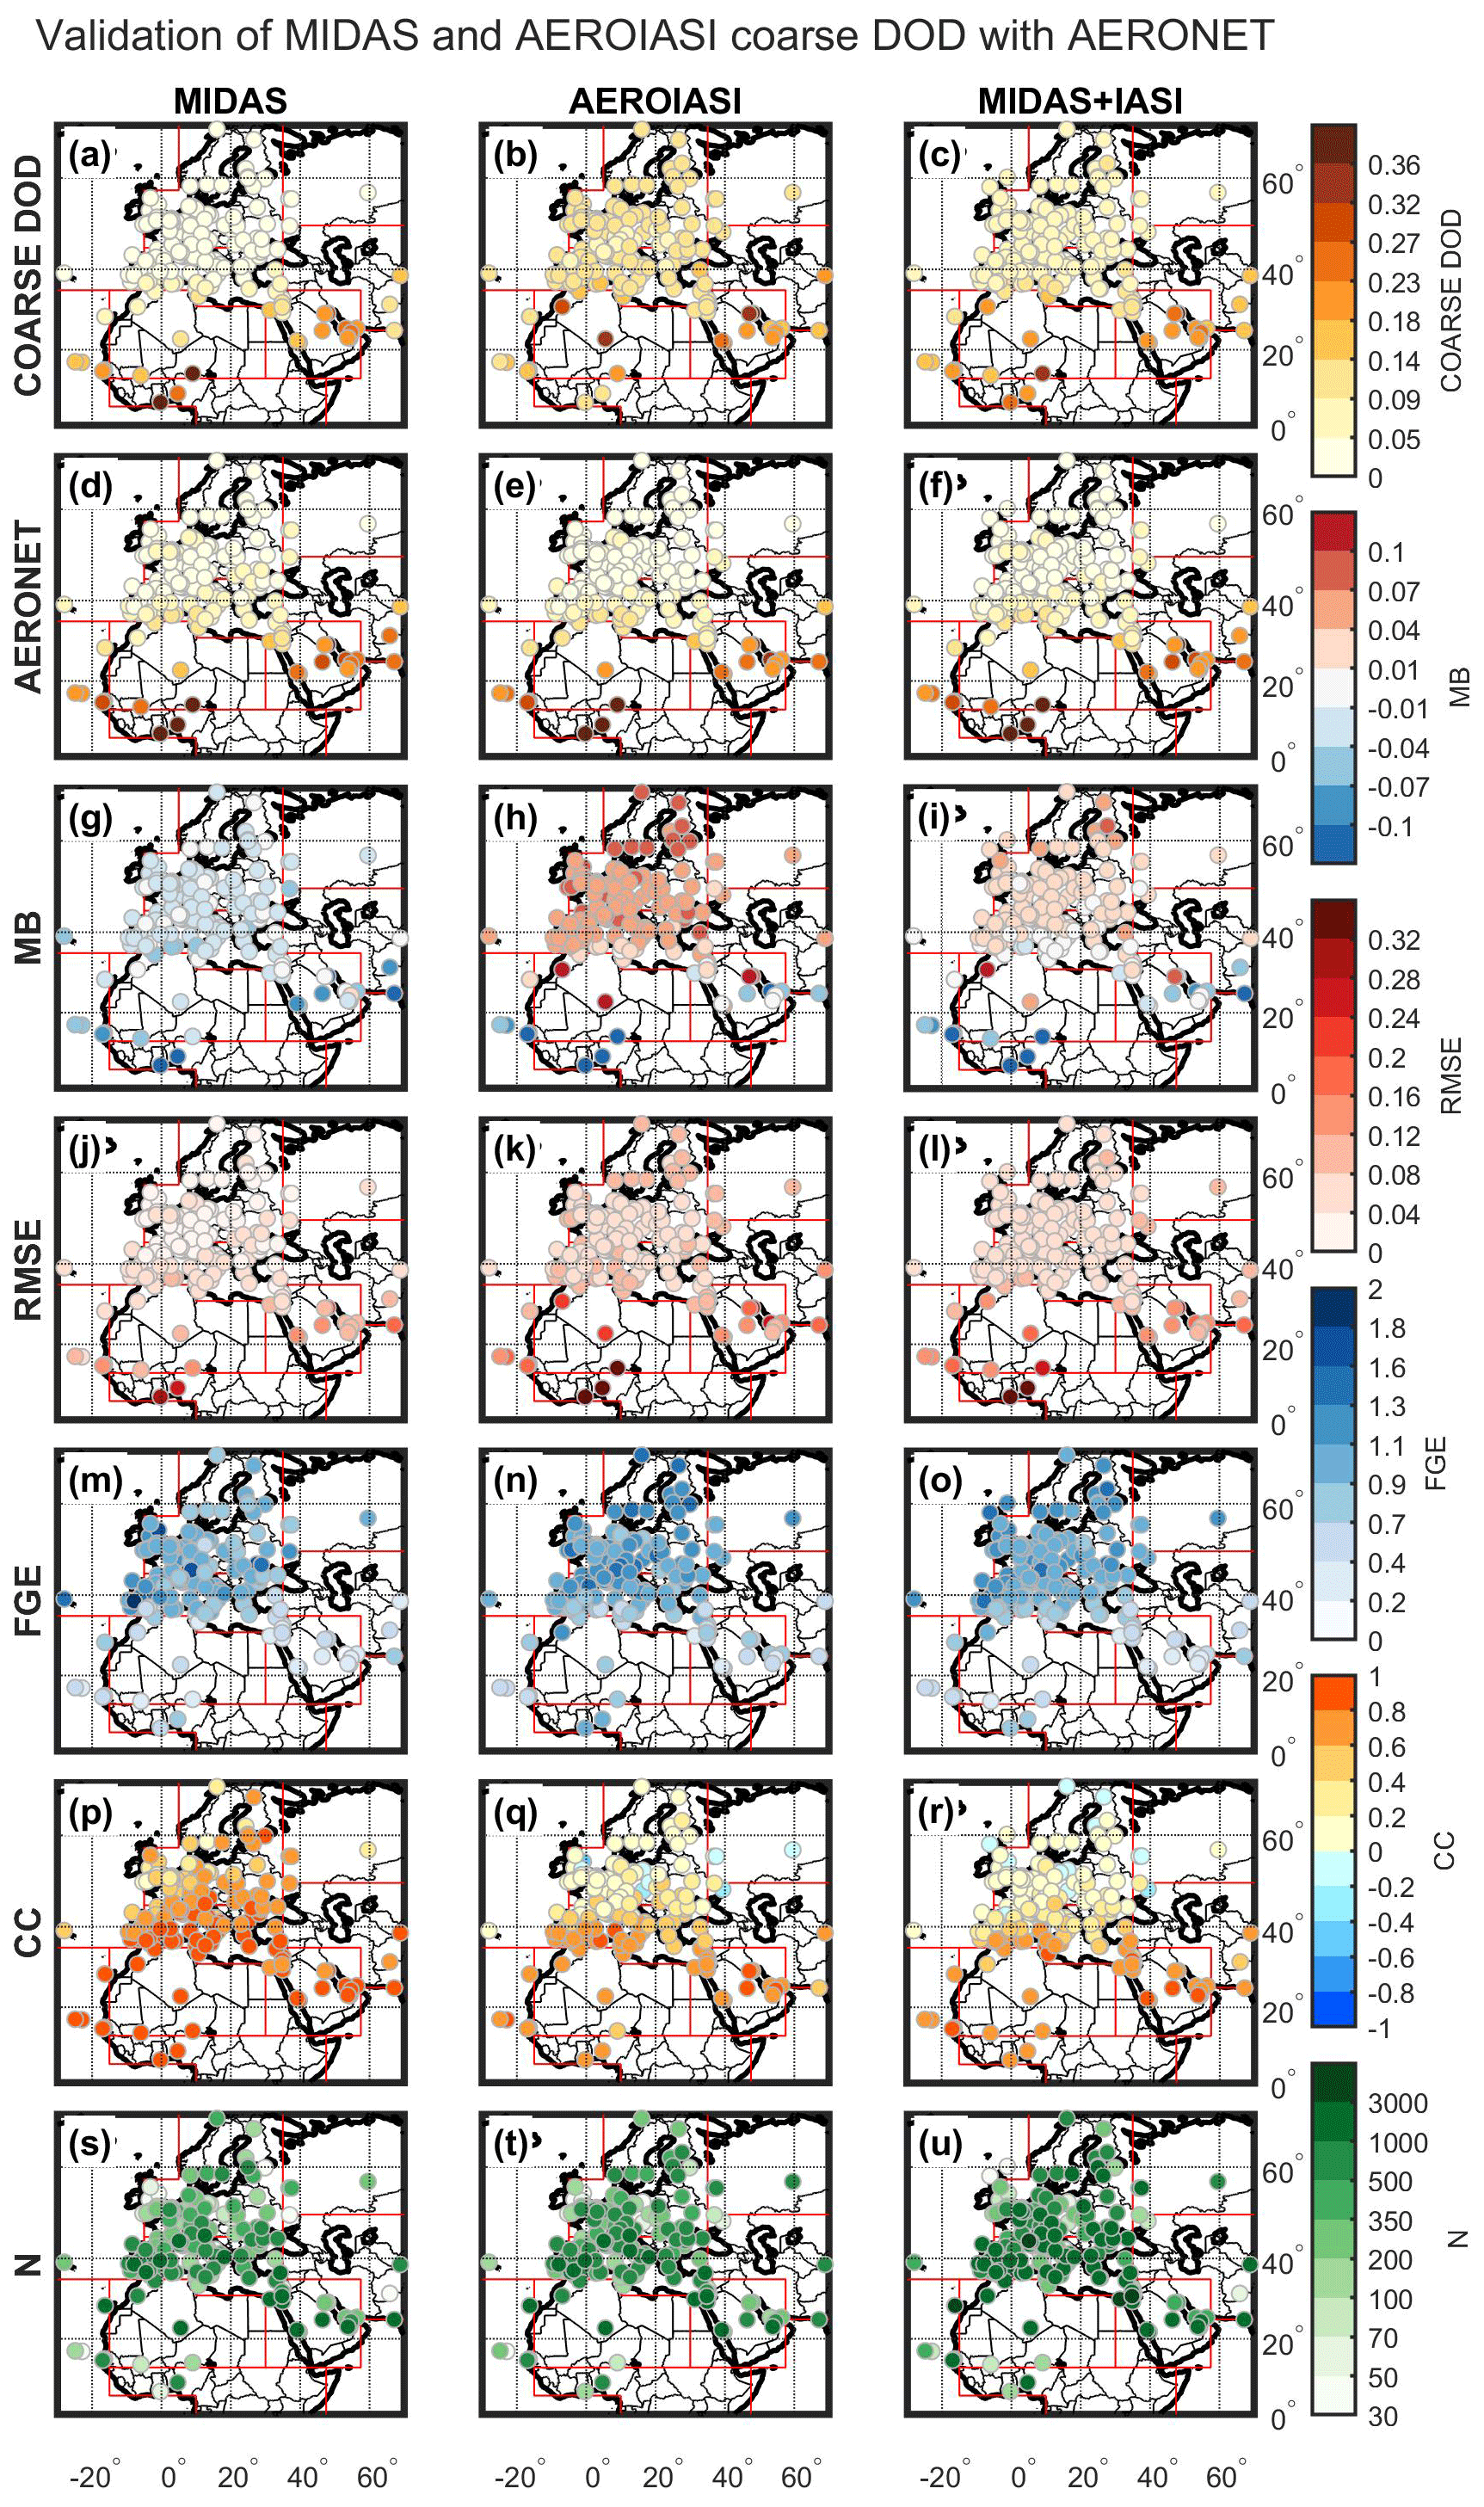
Figure 3Coarse-DOD comparison of MIDAS (first column), AEROIASI (second column), and MIDAS+IASI (third column) against AERONET for the period 2007–2016. The metrics MB, RMSE, FGE, and CC (Table A1) were computed at station level. The obtained scores are presented here only for sites with N≥30 colocated pairs. The red frames in the background delimit the subregions defined in Fig. 1.
Overall, MIDAS underestimates the coarse DOD compared to AERONET (MB ranges from 0.01 in Europe to less than −0.1 in the Sahel; Fig. 3g), whereas AEROIASI shows overestimations (MB > 0.04) almost everywhere, except for the Sahel, Gulf of Guinea, Capo Verde, and the Persian Gulf (MB < −0.04; Fig. 3h). The results of MIDAS coarse DOD in Europe (with MB < 0; Fig. 3g), with respect to MIDAS total DOD results (with MB > 0; Fig. 2g), emphasizes the fact that the size distribution of MIDAS is skewed toward finer fractions. This is directly connected to the use of the MERRA-2 reanalysis fine- coarse-DOD ratio for the MIDAS total and coarse-DOD estimations (see Sect. 2.2). As pointed out by Buchard et al. (2017), MERRA-2 shows a larger contribution of dust fine fractions to the total dust budget. Regarding AEROIASI, MB results (Fig. 3h) are consistent with the findings of previous studies, namely that MB ranges from −0.1 to 0.1 over the Sahara desert (Cuesta et al., 2020) and that an overestimation of coarse DOD reaches 0.1 far from the desert dust sources (Cuesta et al., 2015). Positive biases encountered north of 40∘ N are most likely linked to the use of non-zero a priori values for the retrieval. When the abundance of dust and the product sensitivity too are low (as frequently expected north of 40∘ N), then the Tikhonov–Philips inversion used by AEROIASI tends to provide the a priori value which is clearly visible in terms of long-term averages (as in the case of Fig. 3).
The MIDAS+IASI product was derived from the aggregation of the two datasets (Fig. 3c) to which they contribute equally at stations located at lower latitudes, whereas AEROIASI's impact is bigger at sites in north-central Europe and Russia, owing to the higher number of IASI measurements available in those regions (Fig. 3s–u). MIDAS+IASI CC (Fig. 3r) provides a low correlation (CC < 0.2) at all AERONET stations in continental Europe (latitudes > 45∘ N). MIDAS+IASI shows a strong underestimation (MB < −0.1) in the southwest of the Sahara desert and on the coast of Pakistan, whereas an overestimation is observed in Morocco (MB > 0.1) and Europe (MB up to 0.07 in northern latitudes; Fig. 3i). These overestimates in Europe are directly associated with the strong overestimations of AEROIASI (Fig. 3h). MIDAS+IASI is in good agreement with coarse-DOD AERONET along the northern coast of Africa and the Red Sea and in most sites across the Mediterranean Sea (−0.01 < MB < 0.01). As a result, the MIDAS+IASI coarse-DOD product is more reliable over dust-rich regions and becomes more uncertain in regions of sporadic dust events, although, overall, its performance is poorer than the MIDAS-only coarse DOD.
In this section, the assessment of total DOD and coarse-DOD products of the MONARCH reanalysis for 2007–2016 is analyzed. First, MONARCH is compared with each observational-based dust dataset (i.e., AERONET, MIDAS, MISR, and AEROIASI) at station level in the case of AERONET and at grid cell level, considering the individual grids for each satellite dataset. Then, the comparison was made at a regional scale by generalizing the results based on the 10 subregions shown in Fig. 1. The regional scores were computed at two different temporal scales as well, namely annual and seasonal. Finally, an overall assessment is attempted through the aggregation of the regional results that were obtained by the evaluation against the satellite datasets.
4.1 Independent dataset analysis
4.1.1 MONARCH DOD compared to MIDAS, MISR, and AERONET
Starting with the MONARCH DOD assessment, Fig. 4 shows the results of the comparison with DOD products retrieved from the space-based and ground-based observations. At first glance, MONARCH seems to capture the DOD spatial distribution obtained by the all three observational datasets (i.e., MIDAS, MISR, and AERONET), reproducing the major dust hotspots and the dust transport pathways in the area (Fig. 4a–c). More specifically, MONARCH DOD exceeds 0.27 over all the dust sources listed in Fig. 1, with values exceeding 0.36 over the western Sahara desert, the Bodélé Depression (Fig. 1; “E”), the Sahel, and the Arabian Peninsula (Fig. 4a and c). Moreover, a pronounced dust plume is simulated to stretch across the tropical Atlantic Ocean. The magnitude and latitudinal extent are greatest over the western African coastline, with the maximum DOD up to 0.32 and gradually decreasing westward towards the central tropical Atlantic, as expected for a dust plume that originates in Africa. Similarly, moderate dust transport is simulated over the adjacent regions of the Mediterranean and the Arabian Sea, with maximum DOD values up to 0.18 and 0.23, respectively, which are closer to the dust sources (Fig. 4a–b).

Figure 4Spatial distribution of the total DOD simulated by the MONARCH reanalysis (a–c) and colocated with observations by MIDAS (d), MISR (e), and AERONET (f), along with the respective statistic parameters, including MB (g–i), RMSE (j–l), FGE (m–o), and CC (p–r). The number N gives the total number of pairs colocated during the study period of 2007–2016 at grid (s, t) and station level (u).
The comparison between MONARCH and MIDAS shows a strong correlation over the entire domain, with CC maxima (> 0.8) found throughout the Sahara desert, the Sahel belt, the Middle East and the tropical Atlantic, and partially over the Arabian Sea, the Mediterranean Sea, and even in the North Atlantic (Fig. 4p). The correlation between MONARCH and MISR DOD (Fig. 4q) is higher (CC > 0.6) around the dust source areas but is poorer over the North Atlantic, reaching 0 or negative values, presumably associated with MISR's limited sampling compared to MIDAS (Fig. 4s–t). MONARCH DOD is highly correlated with AERONET observations over sites affected by medium-range dust transport, whereas the CC diminishes (< 0.4) towards the northern latitudes of the study region, especially close to coastal areas (Fig. 4r), where the number of observations used for the comparison is < 250 (Fig. 4u). Furthermore, RMSE (Fig. 4j–l) and FGE (Fig. 4m–o) spatial distributions are similar in the comparison of MONARCH DOD with MIDAS, MISR, and AERONET, showing maximum RMSE values (> 0.24) and minimum FGE values (∼ 0) in the regions more affected by the presence of mineral dust with high DOD (> 0.18 on annual average), in addition to minimum RMSE values (∼ 0) and maximum FGE values (∼ 2) in the long-range transport regions (annual DOD < 0.05).
Overall, the MONARCH reanalysis tends to underestimate DOD, except in desert dust source regions, where the reanalysis and the observational datasets show some discrepancies. The comparison with MIDAS reveals a strong MB discontinuity from land to sea and especially from the dust sources to the adjacent maritime regions (Fig. 4g). In particular, the MONARCH reanalysis shows overall overestimations in northern Africa, the Arabian Peninsula, and parts of Kazakhstan, Uzbekistan, and Turkmenistan, with larger overestimation (MB > 0.1) in the dust sources of Algeria, over the Sahel, the Bodélé Depression, and the Ustyurt Plateau (Fig. 1; “A”, “B”, “D”, “E”, and “J”) and underestimation (MB < 0) in the Persian Gulf and arid regions of Iran and Afghanistan (Fig. 1; “K”). Regarding the comparison with AERONET (Fig. 4i), the MONARCH reanalysis presents an overall underestimation, with MB < −0.1 in western part of the Sahel and near the coast of the Gulf of Guinea, except in the downwind sites of the Bodélé Depression and over the Great Sand Sea (Fig. 1; “F”), where maximum overestimations (MB > 0.1) are observed. Over continental Europe and Russia, near-zero MB is observed compared to both datasets because of the relatively lower DOD by MIDAS and AERONET and simulated DOD by MONARCH in those regions. Over the maritime regions, the comparison with MIDAS, MISR, and AERONET shows similar results. The MONARCH reanalysis strongly underestimates the dust transport towards the Gulf of Guinea and in Cabo Verde (MB < −0.1), whereas it moderately underestimates (down to −0.07) and overestimates (up to 0.04) over the tropical Atlantic and the central and eastern Mediterranean Sea, respectively. Particularly over the North Atlantic and the Arabian Sea, the comparison of MONARCH with MISR shows higher RMSE values (up to 0.16; Fig. 4k) and larger underestimations (−0.04 < MB < −0.07; Fig. 4h) compared to MIDAS (−0.01 < MB < −0.04; Fig. 4g) because of the relatively higher DOD recorded by MISR in these regions (Fig. 4e). This difference between MISR and MIDAS DOD can be traced to the difference between MISR and MODIS total AOD, as in previous studies, MISR AOD was found to be generally larger than MODIS AOD over water (Guo et al., 2013; Abdou et al., 2005; Kahn et al., 2010).
The comparison of MONARCH DOD with each observational dataset was made at regional level as well, based on the 10 subregions shown in Fig. 1. The statistical parameters were computed at a regional scale and at two different temporal scales, annual and seasonal, and are presented in the Supplement. In particular, the regional results of the MONARCH comparison against MIDAS, MISR, and AERONET are shown in Figs. S1, S2, and S3 in the Supplement, respectively. The seasonal and regional DOD patterns show good agreement between MONARCH and MIDAS (Fig. S1), identifying MAM and JJA as the seasons of maximum dust emissions from the sources (DOD > 0.3 in NorAfr and MidEas). In MAM, the meteorological conditions favor the transport of dust from the southern parts of the Sahara (e.g., Bodélé Depression) to the Sahel (DOD ∼ 0.3 in SubSah; Kaly et al., 2015) and from the northern Sahara sources and the Syrian Desert (Fig. 1; “G”) towards the Mediterranean (Solomos et al., 2018). In JJA, dust plumes are directed from the Sahara and the Middle East towards the Atlantic and the Arabian Sea, respectively. This dust transport seasonality is also confirmed by the seasonal values of MONARCH and MISR over the maritime regions (Fig. S2), which are fully covered by MISR dark water retrievals. On the other hand, the low sensitivity of MISR non-spherical AOD over the remote regions (NorAtl, NorEur, and Russia) is evident here, leading to overestimated annual and seasonal MISR DOD values (annual DOD > 0.05), higher biases (annual MB < −0.05; RMSE > 0.09), and lower CC (< 0.21) with MONARCH. Last, the regional means obtained from the MONARCH versus AERONET comparison (Fig. S3) should be used with caution because the subregions are not evenly represented by AERONET stations in terms of the amount and spatial distribution (see Fig. 2; third column). The best coverage is found in MedSea and NorEur, in MidEas there are fewer stations, but these are well distributed, whereas in NorAfr the majority of the stations are located at the edges of the Sahara. The DOD seasonality is again identified over the dust emission and transport regions; however, huge biases between the two datasets, like those obtained in SubSah during DJF (MB = −0.45; RMSE = 0.62) can be attributed to mesoscale processes like haboobs (Roberts and Knippertz, 2012) that can affect ground-based measurements (i.e., AERONET) but remain undetected by the model or even by satellites due to the coarser spatiotemporal resolution. Here we should note that, over dust-rich regions, the regional AERONET DOD is significantly larger than the corresponding satellite-derived DOD because the method used to retrieve AERONET DOD excludes cases of mixed aerosol types (see Sect. 2.5), which increases the contribution of pure dust events to the sample, and this eventually increases the mean AERONET DOD.
4.1.2 MONARCH coarse DOD compared to MIDAS, AEROIASI, and AERONET
Repeating the same process, the MONARCH coarse DOD is compared against MIDAS, AEROIASI, and AERONET (Fig. 5). As the coarse DOD is a fraction of the total DOD, the annual mean coarse DOD of MONARCH, MIDAS, and AERONET shows the same spatial distribution as total DOD (Fig. 4). The temporal correlation between the MONARCH reanalysis and MIDAS, AEROIASI, and AERONET (Fig. 5p–r) is generally higher near the source and transport areas (CC up to 0.8) and diminishes towards the northern latitudes (i.e., north of 40∘ N). In fact, the comparison with AEROIASI even shows a negative correlation at these latitudes (CC < 0; Fig. 5q). The RMSE (Fig. 5j–l) and FGE (Fig. 5m–o) spatial distribution is similar among MIDAS, AEROIASI, and AERONET, showing maximum RMSE (> 0.32) and minimum FGE (< 0.4) in the regions with the strongest dust activity, where the maximum absolute MB was also found (e.g., Bodélé Depression; Fig. 5g–i). In long-range transport regions, AEROIASI presents larger errors (RMSE > 0.08; MB < −0.07) than MIDAS and AERONET.
The MONARCH reanalysis overestimates the coarse DOD over all the dust sources when compared to MIDAS and AEROIASI (Fig. 5g–h), with values that exceed 0.1 over the Bodélé Depression and its downwind areas, in addition to over the major dust sources of the western Sahara desert. Again here, as in the case of DOD MB, a discontinuity in the MB for MIDAS is noted between land and oceans. The comparison against AERONET shows overall underestimations (MB < 0) with maxima (MB < −0.1) at stations situated downwind of the Bodélé Depression towards the Gulf of Guinea, in Cabo Verde, and close to the Registan Desert (Fig. 5i). The overestimations of MONARCH in the comparison with MIDAS over desert dust sources (Fig. 5g) are related to the fact that the size distribution of MIDAS is skewed toward finer sizes (see Sect. 3). Moreover, slight underestimations in Europe in the comparison against AERONET (Fig. 5i) can be attributed to the discrimination method applied (see Sect. 2.5) that can also allow large sea salt particles or other coarse aerosols of local origin. The MONARCH reanalysis is in very good agreement with MIDAS over the remote regions of the North Atlantic and continental Europe, where MB is almost zero, whereas the comparison with AEROIASI away from the dust sources produced a very strong underestimate (MB < −0.1). Moreover, the MB in Fig. 5h changes abruptly when moving from desert to remote regions because the coarse DOD provided by AEROIASI is consistently larger than 0.09 over the entire domain, even in remote regions, whereas it does not exceed 0.36 over the dust sources (Fig. 5e), which is in agreement with the findings in Sect. 3 that AEROIASI tends to underestimate coarse DOD close to desert dust sources and to overestimate it far away from them (Fig. 3h).
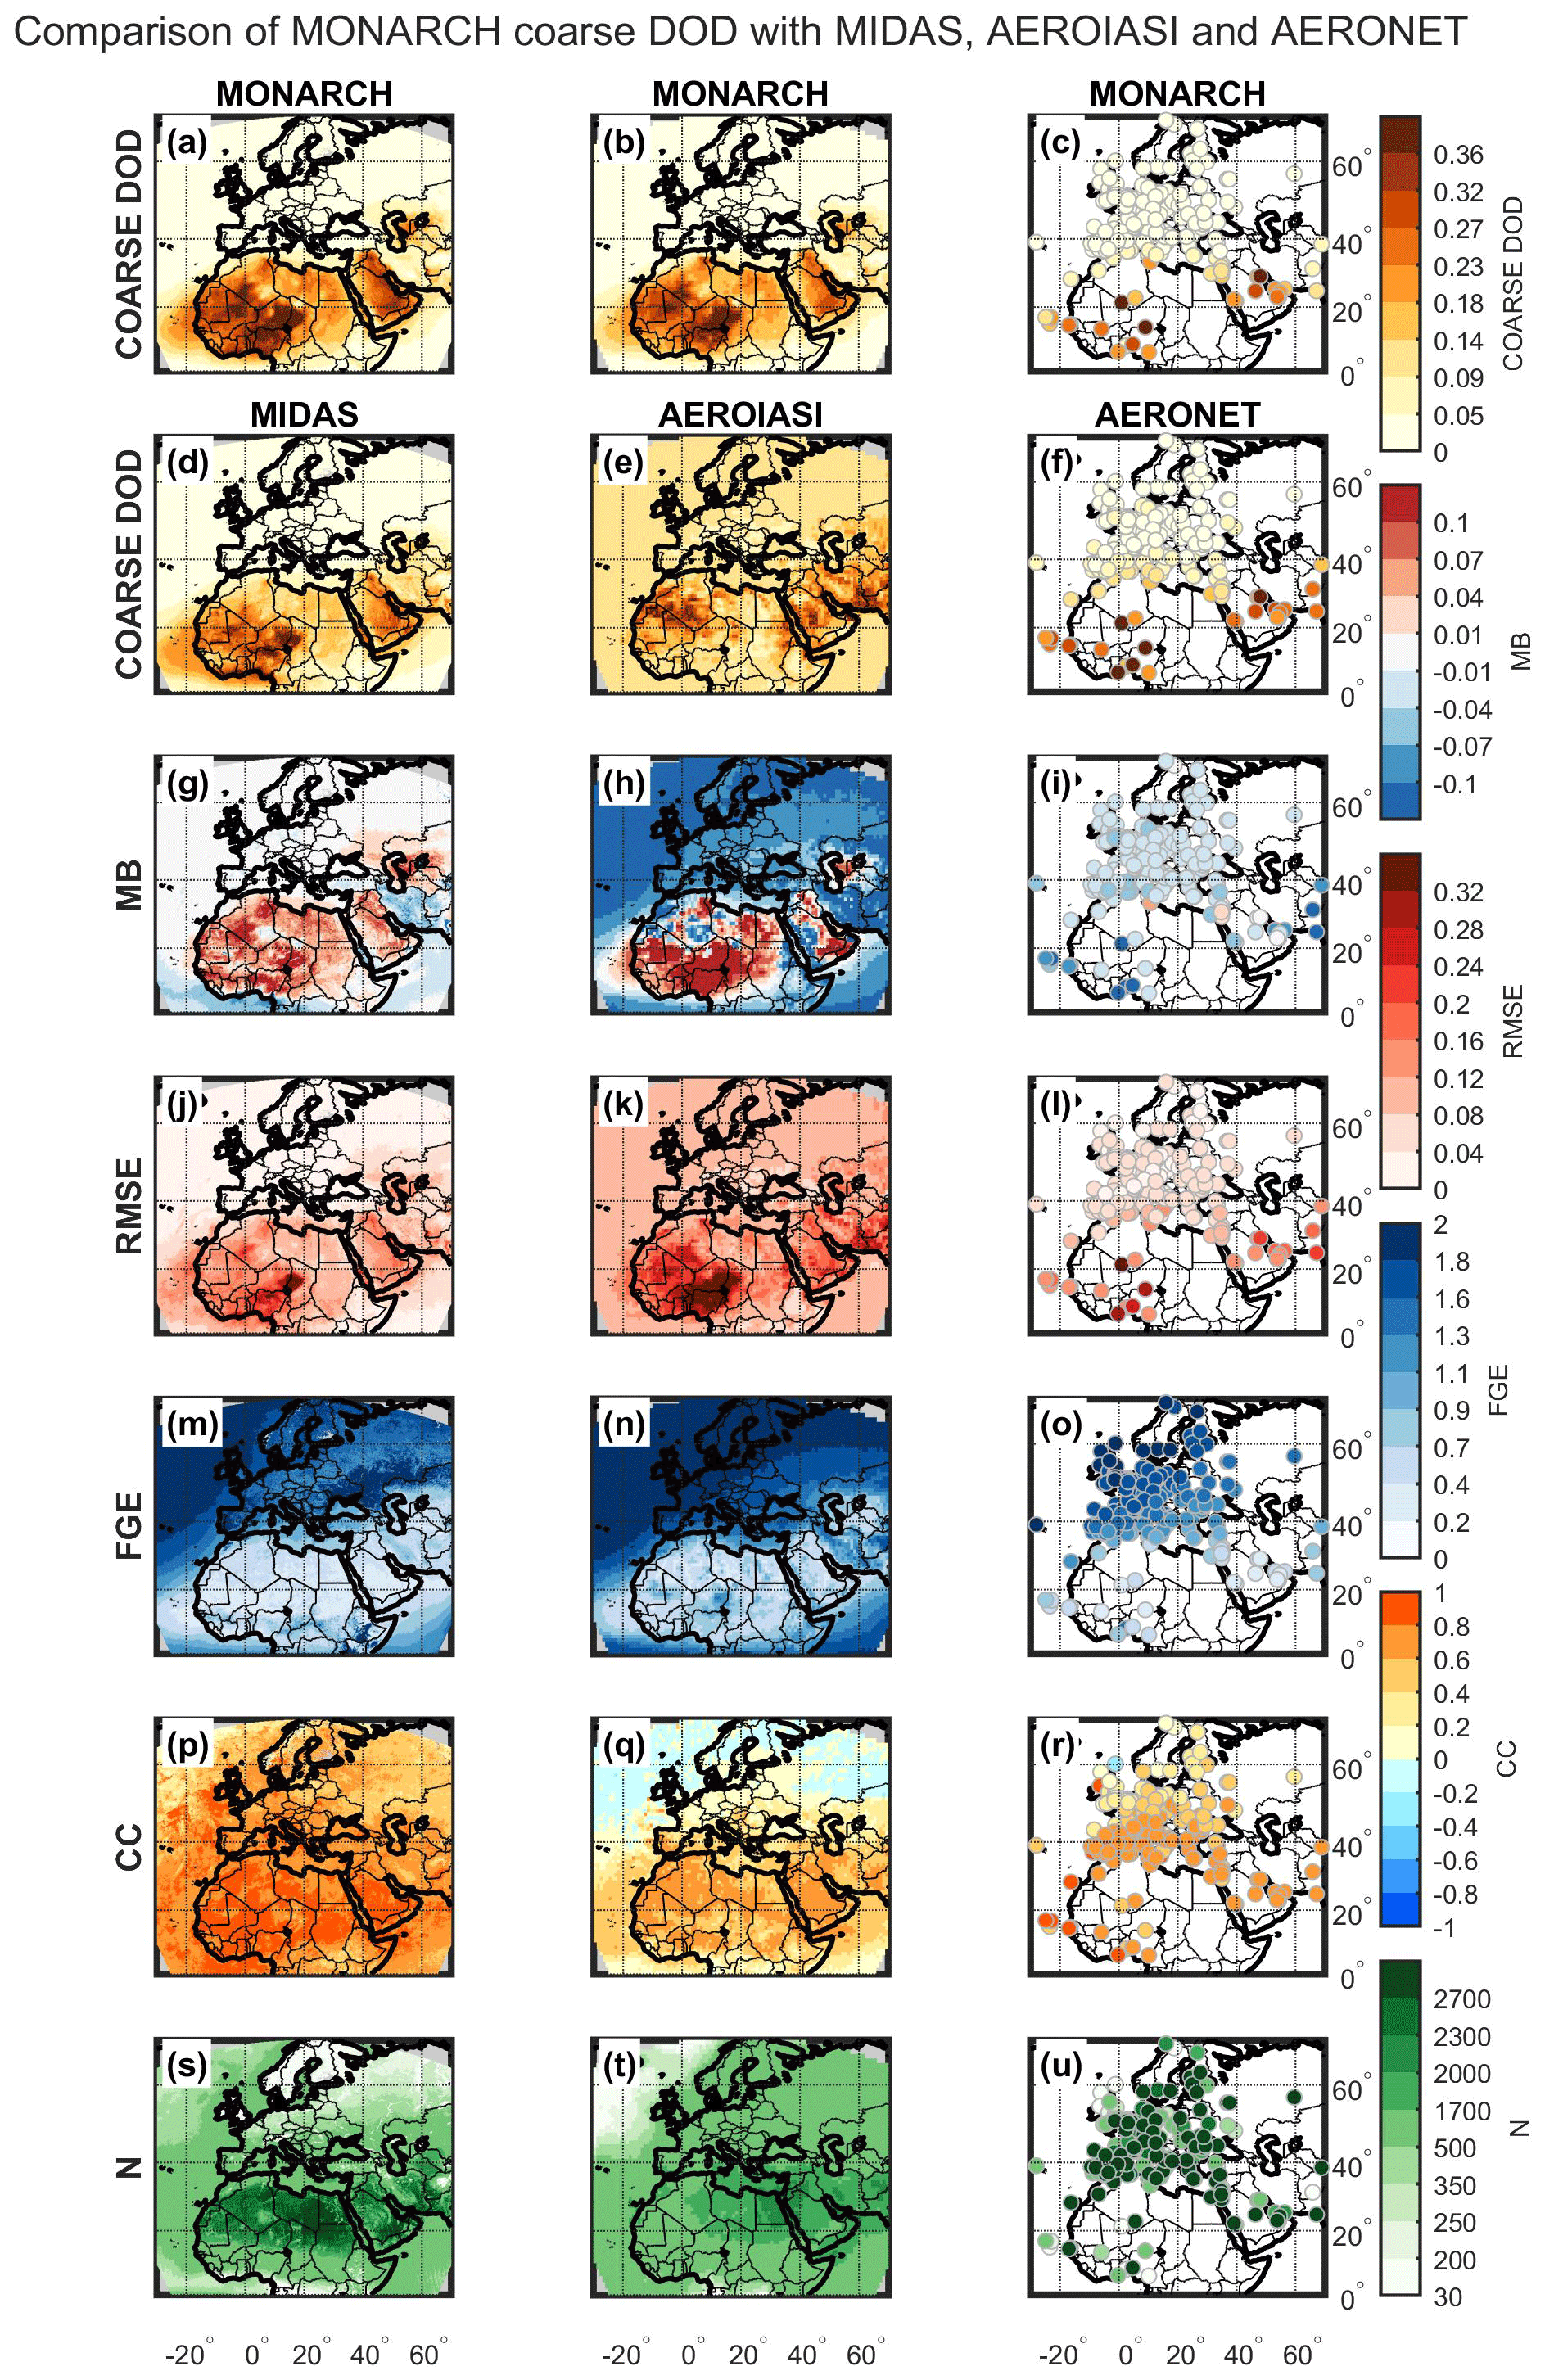
Figure 5Spatial distribution of the coarse DOD simulated by the MONARCH reanalysis (a–c) and colocated with observations by MIDAS (d), AEROIASI (e), and AERONET (f), along with the respective statistic parameters, including MB (g–i), RMSE (j–l), FGE (m–o), and CC (p–r). The number N gives the total number of pairs colocated during the study period of 2007–2016 at grid (s, t) and station level (u).
Finally, the regional metrics of the MONARCH coarse DOD, compared to MIDAS, AEROIASI and AERONET, were computed at annual and seasonal scales and are presented in Figs. S5, S6, and S7, respectively. Naturally, the regional coarse DOD follows the cycle of the total DOD over the subregions associated with dust emission (NorAfr, MidEas, and WesAsi), as the seasonal means of MIDAS, AEROIASI, and the colocated MONARCH data show (Figs. S5 and S6). The intra-annual variability in the long-range transport of the coarse dust particles is well represented by MIDAS and MONARCH seasonal coarse DOD over TroAtl, AraSea, and MedSea (maxima in JJA, JJA, and MAM, respectively). The two datasets are in good agreement too, providing very low seasonal and annual MB values in those subregions. On the other hand, AEROIASI does not exhibit any seasonality over the maritime and remote regions located north of 40∘ N, with no season-on-season changes in coarse DOD, which remain consistently greater than 0.1 (NorAtl, NorEur, and Russia), probably linked to lack of sensitivity. AEROIASI shows a weak performance for detecting low DOD values in seasons and in regions where minimal dust activity is expected, as already shown in Fig. 3h. As a consequence, large biases (MB < −0.08; RMSE > 0.09) and no correlation (CC ∼ 0) are obtained by the comparison with MONARCH coarse DOD.
Regarding the MONARCH versus AERONET comparison at regional and seasonal scales (Fig. S7), the typical patterns in seasonality are also found here. At AERONET sites located close to the dust sources (NorAfr and MidEas) and in their outflow regions (TroAtl and AraSea), the MONARCH reanalysis correctly provides maximum coarse-DOD values in MAM and JJA. Moreover, the MONARCH reanalysis succeeds in identifying the dry season months at the sites south of the Sahel (i.e., DJF and MAM in SubSah). However, MONARCH's annual and seasonal coarse DOD is, almost everywhere, lower than the values provided by AERONET (MB < 0). This is due to the fact that the AERONET coarse-DOD product can be contaminated by other coarse particles as well. The contribution of other aerosols can be insignificant in southern latitudes (< 40∘ N), where mineral dust is the dominant type, but under low dust conditions, their impact increases. In fact, in the remote regions of NorAtl, NorEur, and Russia and in MedSea, where sea salt predominates in coastal stations, AERONET coarse DOD (Fig. S7) results in most seasons being greater than AERONET total DOD (Fig. S3), which is impossible. AERONET's coarse DOD overestimates naturally lead to large relative biases compared to MONARCH coarse DOD (FGE > 1.17), and thereby, the validity of the MONARCH reanalysis evaluation results reported in those regions diminishes. On the other hand, in the regions where coarse DOD is higher, the seasonal results of both normalized metrics are very good (FGE < 1; CC > 0.7) and quite stable. This means that the MONARCH reanalysis reproduces the seasonal variability in the coarse DOD very well compared to AERONET, although not in absolute values. In fact, there are many similarities between the seasonal change in the MONARCH and AERONET coarse-mode fraction (CMF), which is defined as the coarse-DOD to total DOD ratio. For example, considering the seasonal DOD and coarse DOD in NorAfr (Figs. S3 and S7), the seasonality of MONARCH CMF (26 % – DJF, 35 % – MAM, 70 % – JJA, and 49 % – SON) is consistent with AERONET's seasonality (21 % – DJF, 40 % – MAM, 68 % – JJA, and 44 % – SON). This implies that the MONARCH reanalysis very efficiently reproduces the size distribution of the dust particles at the sites in the vicinity of the Sahara desert.
4.2 Assessment through multi-sensor aggregation
4.2.1 MONARCH DOD compared to MIDAS+MISR product
Overall, the DOD comparison results against the three independent datasets (i.e., MIDAS, MISR, and AERONET) shows that, over the areas of most interest, with high dust activity throughout the year and greater number of measurements, the evaluation scores are consistent, despite the different features of each dataset, namely the raw data, the dust separation assumptions, the uncertainties, and the spatiotemporal resolution and coverage. Consequently, the validity of the evaluation results is enhanced, leading to safer conclusions about the performance of the MONARCH reanalysis.
Nevertheless, differences between the results obtained from the different datasets do exist in some cases. In particular, the results obtained by MIDAS and MISR over the North Atlantic differ in MB, RMSE, and CC, and the same applies to CC between MIDAS and AERONET. These discrepancies may be due to several possible reasons related to the features of the datasets and the region. The uncertainties involved in the derivation of MIDAS, MISR, and AERONET dust products inevitably contribute to their differences too. All satellite-based instruments have increased difficulty in retrieving particle properties at low AOD – let alone the DOD fraction in regions where it is even lower – especially over some surface types for which the reflectance can negatively impact the retrieval quality. AERONET's discrimination method can also allow large sea salt particles to be misclassified as dust, especially at coastal sites. Moreover, MISR has much less frequent sampling compared to MIDAS, whereas AERONET's fine temporal resolution permits the detection of subdaily micro- and mesoscale dust activity caused by local sources that the satellites' less frequent sampling can miss. Last, unfavorable observing conditions, such as cloud cover that is common at high latitudes especially during wintertime, in addition to the basic sampling frequency, can also decrease the quality of DOD retrievals, for example, due to unmasked cirrus clouds misclassified as dust.
However, as shown in Fig. 4, in most regions that are subject to high DOD levels and frequent dust intrusions, the assessment results are not affected by the features of each dataset; instead, datasets from different sensors can be used in a complementary way to provide more solid insight into the performance of the MONARCH reanalysis. In particular, the regional results obtained from MIDAS (Fig. S1) and MISR (Fig. S2) were averaged to a final weighted mean (MIDAS+MISR), considering as weight the corresponding number N, as it is described in Sect. 2.6 and using the equations shown in Table A2. As mentioned earlier, the two datasets not only do not overlap but also complement each other in terms of space and time, favoring the combination of their results. In particular, MIDAS covers Aqua's overpass time (13:30 LT), both over land and sea, whereas MISR considers Terra's overpass time (10:30 LT) over sea. Moreover, MISR and MIDAS have different spatial and temporal resolutions. Consequently, the two MONARCH reanalysis samples obtained by colocation with the satellite datasets are complementary to each other. The combined regional results from MIDAS and MISR are presented by region and by temporal scale (Fig. S4); furthermore, the annual scores are displayed in maps (Fig. 6) to enable a better understanding of the geographical distribution of the results.
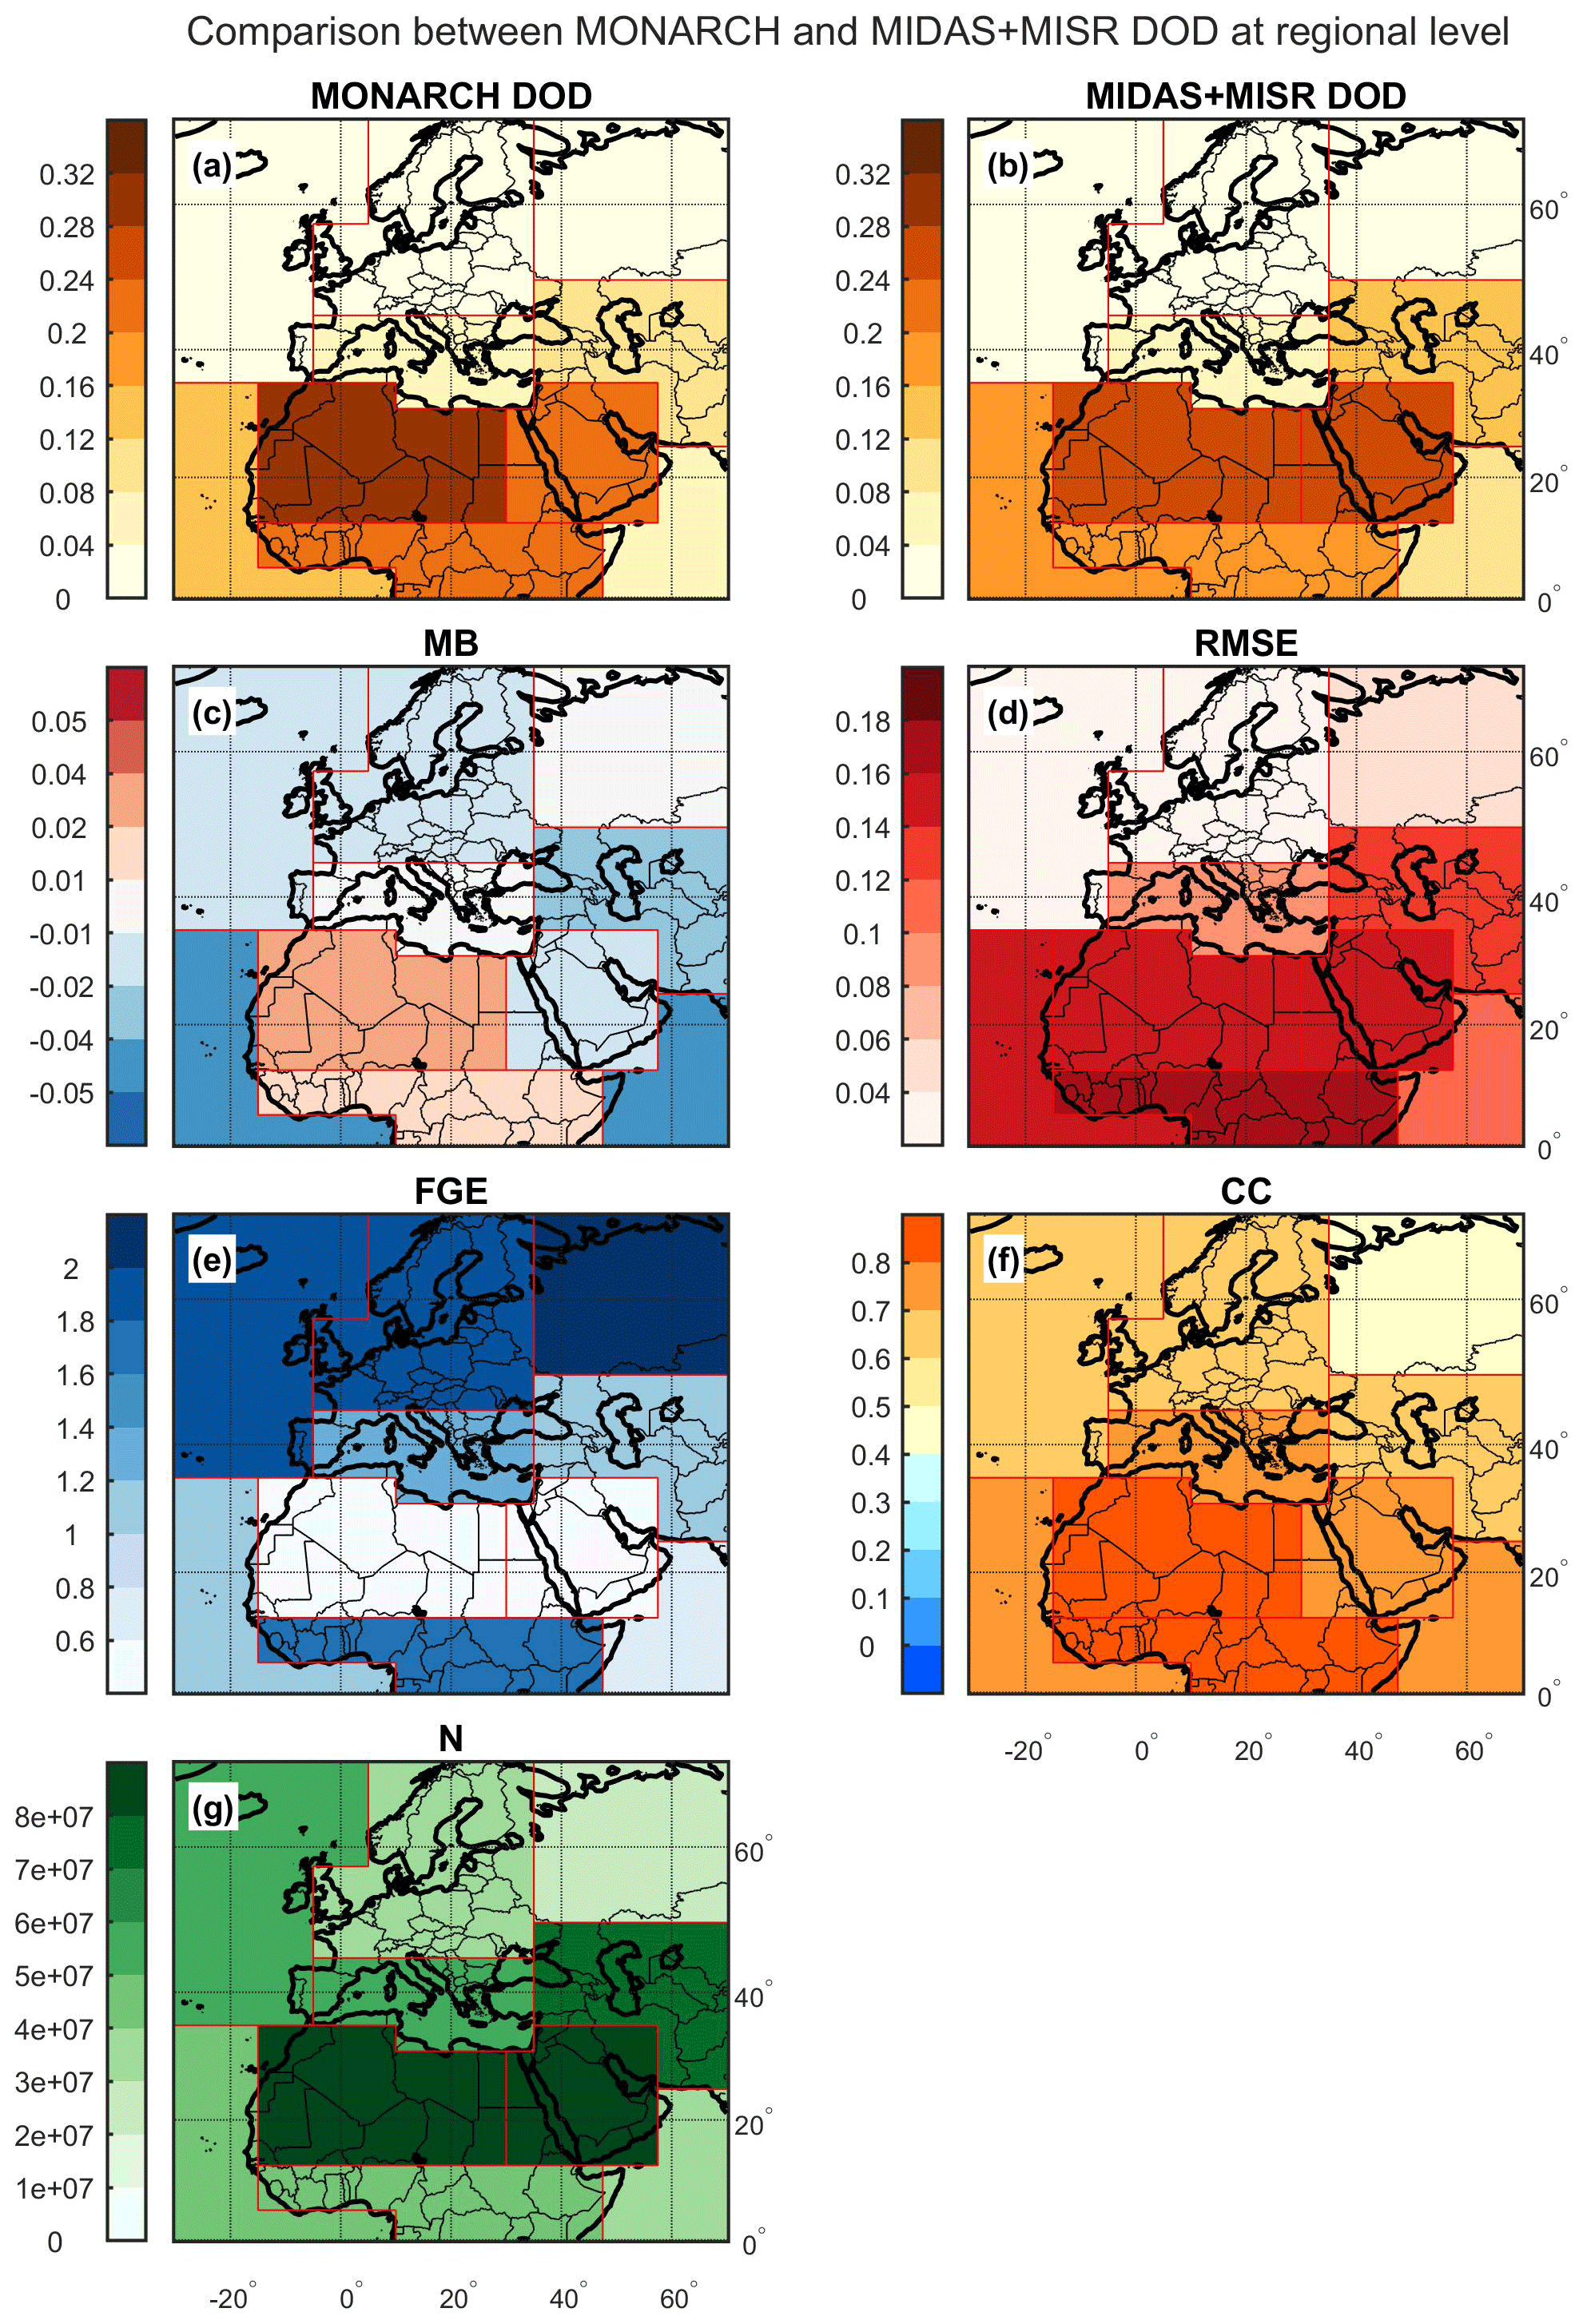
Figure 6Regional weighted annual mean of the MONARCH reanalysis DOD (a) and the MIDAS+MISR DOD (b) and their MB (c), RMSE (d), FGE (e), and CC (f), along with the total regional N (g). The results refer to the study period of 2007–2016.
The MONARCH DOD (Fig. 6a) and the multi-sensor aggregation DOD (Fig. 6b) present similar patterns, with small discrepancies in DOD values over and around the dust sources. In most subregions, MB (Fig. 6c) ranges between −0.02 and 0.02, which is quite low in most cases, compared to DOD values. Minimum differences are found in Russia (MB ∼ 0) and in dust source and outflow regions like SubSah (MB = 0.01), MidEas (MB = −0.01), and MedSea (MB ∼ 0). The largest positive difference is found in NorAfr (MB = 0.04), which contains the Sahara desert, and the highest annual regional DOD values are simulated or observed there (DOD = 0.29 and 0.25, respectively), whereas the lowest negative MB (−0.04) is found in TroAtl and AraSea, which are areas subject to frequent dust transport from the Sahara desert and the Arabian Peninsula, respectively.
The regional RMSE (Fig. 6d) shows that the greatest differences between the MONARCH reanalysis and observations occur in regions with the strongest dust activity, with values higher than 0.15 in MidEas, NorAfr, TroAtl, and SubSah, whereas the minimum RMSE (0.03) occurred in the remote region of NorEur. Conversely, the regional FGE (Fig. 6e) is maximized (> 1.8) over the remote regions of NorAtl, NorEur, and Russia, whereas the lowest values (FGE < 0.5) are found in MidEas and NorAfr. The regional CC (Fig. 6f) shows a clear north-to-south positive gradient, with a minimum value (CC = 0.49) over Russia and maximum values (CC > 0.8) in NorAfr and SubSah.
Considering all the results obtained from the evaluation metrics at the annual scale (as listed in Fig. S4 and visualized in Fig. 6) among subregions in which high dust concentrations are often observed by satellites (MIDAS+MISR DOD > 0.07), the best combined scores are found in MidEas (MB = −0.01; FGE = 0.43), NorAfr (FGE = 0.43; CC = 0.84), and MedSea (MB = 0; RMSE = 0.09), demonstrating that the MONARCH reanalysis has a very good performance in reproducing the DOD levels and its spatiotemporal variability over the major dust source regions of MidEas and NorAfr, in addition to the nearby outflow region of MedSea. Considering that the two highest mean annual DOD values in NorAfr and MidEas were recorded (MIDAS+MISR DOD = 0.25 and 0.24, respectively), the lowest FGE implies that the biases with respect to the MONARCH reanalysis are insignificant there. Moreover, the highest CC (0.84) in NorAfr indicates that the correct simulation in the reanalysis of the time evolution of dust emissions from the Sahara desert took place. Similarly, in MedSea, MONARCH MB reaches the perfect score, with quite low deviations from it, according to the RMSE, thereby implying a very good performance of the MONARCH reanalysis under low DOD conditions (MIDAS+MISR DOD = 0.07) and sporadic dust intrusions throughout the year. Furthermore, the fact that those three subregions have the top two largest (NorAfr and MidEas) and the fourth largest (MedSea) N (Fig. 6g) shows the consistency of the MONARCH reanalysis when evaluated against a large number of observations and corroborates the evaluation results.
On the other hand, the combination of the regional annual scores reveals a weak agreement between the MONARCH reanalysis and observations over TroAtl (MB = −0.04; RMSE = 0.16) and WesAsi (MB = −0.02; CC = 0.66). The intercomparison of the MIDAS+MISR and MONARCH DOD against AERONET observations (Fig. 2, third column, and Fig. 4, third column, respectively) shows that MIDAS+MISR DOD is in better agreement with AERONET compared to the MONARCH reanalysis, providing better scores in most of the common sites included in those two regions. In particular, the MONARCH reanalysis underestimates AERONET DOD by at least 0.1 (MB < −0.01) at the majority of the stations located in TroAtl and WesAsi, whereas MIDAS+MISR biases are usually lower than 0.07 (MB > −0.07). As far as TroAtl is concerned, this indicates that the MONARCH reanalysis simulates higher dust deposition rates that underestimate the real number of dust particles that travel towards the Atlantic Ocean; however, the MONARCH reanalysis captures the DOD spatiotemporal variability very well, as reflected by the strong correlation (CC = 0.8) found in this region (Fig. S4).
Last, the ability of the MONARCH reanalysis to correctly simulate the annual cycle of the regional dust activity was examined by computing the seasonally weighted means of the evaluation metrics for winter (DJF), spring (MAM), summer (JJA), and autumn (SON; Fig. S4). In general, atmospheric dust emissions and transport are subject to seasonal variation, following the changes in wind conditions at synoptic scale; consequently, each subregion presents a distinct seasonality. At first glance, it can be seen that the color patterns of simulated and observed DOD are very similar, showing that the MONARCH reanalysis captures the annual dust cycle very well over all subregions. Particularly in regions where the presence of dust is dominant, the MONARCH reanalysis reproduces the DOD peaks in MAM and JJA; correspondingly, the minimum seasonal DOD values are correctly simulated in DJF and SON. Accordingly, the MB and RMSE seasonal patterns are directly related to the seasonal DOD variation, with maximum values in MAM and in JJA which weaken during SON or DJF, for all the subregions of interest. On the contrary, in northern subregions, patterns in seasonality are less pronounced because of the low presence of dust. The sign of the seasonal MB agrees with the sign of the annual MB, with the exception of SubSah, where low underestimations during JJA (MB = −0.02) are likely associated with mesoscale convective dust storms (e.g., haboobs) that the model cannot simulate.
The MONARCH reanalysis performance in reproducing the regional dust cycle can be also assessed by the normalized parameters of FGE and CC, which are less magnitude dependent and are expected to remain invariable throughout the year. In fact, low FGE seasonal values exhibit remarkable intra-annual stability over the major dust emission regions of NorAfr (0.39 ≤ FGE ≤ 0.49) and MidEas (0.41 ≤ FGE ≤ 0.47), where intense dust activity and strong seasonal variability have been recorded. In addition, over the main dust transport region of TroAtl, the seasonal fluctuation in the FGE is insignificant. Likewise, almost all the subregions of interest present high CC values and weak seasonality, namely NorAfr (0.81 ≤ CC ≤ 0.85), MidEas (0.72 ≤ CC ≤ 0.81), TroAtl (0.76 ≤ CC ≤ 0.82), AraSea (0.72 ≤ CC ≤ 0.77), and MedSea (0.74 ≤ CC ≤ 0.76). The minimum seasonal CC (0.38) found over Russia in DJF, along with all the scores for the same season computed in Russia and in NorEur, should be considered unreliable because the number of dust retrievals decreases significantly in the north of Europe during the DJF winter season (N∼0 × 107 in Russia and in NorEur), as MIDAS covers only snow-free surfaces.
4.2.2 MONARCH coarse DOD compared to MIDAS+IASI product
Following the same methodology, the coarse-DOD comparison results from MIDAS (Fig. S5) and AEROIASI (Fig. S6) were combined on a regional scale. Again, the satellite datasets complement each other here, since the MODIS equatorial overpass time is 13:30 LT, while IASI crosses the Equator twice a day at 09:30 and 21:30 LT. The MIDAS+IASI scores are presented by region in Fig. S8, from which the annual means are illustrated in Fig. 7.

Figure 7Regional weighted annual mean of the MONARCH reanalysis coarse DOD (a) and the MIDAS+IASI coarse DOD (b) and their MB (c), RMSE (d), FGE (e), and CC (f), along with the total regional N (g). The results refer to the study period of 2007–2016.
Deviations in coarse DOD between the MONARCH reanalysis (Fig. 7a) and MIDAS+IASI (Fig. 7b) are evident in SubSah (MB = 0.04; Fig. 7c) and mainly in NorAfr, where the maximum overestimation is observed (MB = 0.06), which is 50 % greater compared to the DOD MB over the same subregion (Fig. 6c). This is a significant overestimation if we consider that the coarse DOD is a fraction of the total DOD. On the other hand, quasi-zero MBs were recorded in WesAsi, Russia, and MedSea. Accordingly, the RMSE (Fig. 7d) exceeds 0.12 in NorAfr, SubSah, and MidEas, whereas the best scores (RMSE ≤ 0.04) are recorded in NorAtl, NorEur, and Russia. In contrast, the lowest FGE values (≤ 0.5) can be found in MidEas and NorAfr and the highest (FGE ≥ 1.9) over the remote regions of NorAtl, NorEur, and Russia (Fig. 7e). Last, the CC (Fig. 7f) exceeds 0.8 in NorAfr and SubSah, while over Russia a very low correlation is observed (CC = 0.37), as the negative CC values recorded there during the MONARCH reanalysis versus AEROIASI comparison (Fig. 5q) affect the corresponding regional values (Fig. S6).
Considering all the regional annual results (Fig. S8), among subregions where high dust concentrations are often observed by satellites (MIDAS+IASI coarse DOD > 0.05), the best scores are found in AraSea (FGE = 0.74; CC = 0.78), MedSea (MB = 0.01; RMSE = 0.07), and TroAtl (MB = −0.01; CC = 0.79), which contain the main dust outflow pathways, with moderate and sporadic coarse dust activity throughout the year. On the other hand, the MONARCH reanalysis seems to perform less efficiently over the African continent, namely in NorAfr (MB = 0.06; RMSE = 0.14) and in SubSah (MB = 0.04; RMSE = 0.14), where MONARCH seems to generate a surplus of coarse dust particles. Given that both subregions present the highest CC (0.83), the coarse dust emissions from the Sahara desert seem to be overestimated by a constant factor during the entire study period.
Focusing on those two regions, the intercomparison of the MIDAS+IASI and MONARCH coarse DOD against AERONET (Fig. 3, third column, and Fig. 5, third column, respectively) shows that MONARCH coarse DOD is in better agreement with AERONET compared to MIDAS+IASI and provides better scores in most of the common sites. Especially at common sites located in the Sahara desert, MONARCH MB is limited between −0.04 and −0.01, showing very small differences with AERONET (Fig. 5i; see NorAfr), considering that AERONET coarse DOD at these sites exceeds 0.14 (Fig. 5f; NorAfr), whereas MIDAS+IASI MB varies from −0.1 to 0.1, implying significant deviations from the ground-based measurements (Fig. 3i; NorAfr). Actually, the MIDAS+IASI product at those sites is mostly biased due to AEROIASI's strong over- and underestimations (Fig. 3h; NorAfr), whereas MIDAS reproduces AERONET coarse DOD (−0.04 < MB < 0; Fig. 3g; NorAfr) quite well. On the other hand, the MONARCH reanalysis annual regional scores addressed in the previous paragraph are dominated by the MIDAS contribution (see the annual values in Figs. S5 and S8), due to a larger number of MODIS observations. Considering that MIDAS coarse DOD is derived using 0.5 µm as a cutoff radius, whereas MONARCH uses 0.6 µm, it means that, in the case of a common radius value, the MONARCH versus MIDAS MB results over NorAfr and SubSah would be even larger. This, again, should be attributed to the MERRA-2 fine-coarse-DOD ratio, which eventually underestimates MIDAS coarse DOD, especially over areas of high dust activity (Fig. 3g). In conclusion, the discrepancies between the MONARCH coarse DOD and both satellite datasets over the African continent are most likely due to the underestimations in MIDAS and AEROIASI coarse-DOD retrievals.
Any seasonality in the performance of the MONARCH reanalysis in reproducing the coarse DOD can be assessed by the seasonal values of the metrics computed at regional scale (Fig. S8). The reanalysis simulates the annual cycle of coarse dust at both emission and transport regions very well, where coarse-DOD seasonality is intense and peak activity occurs in MAM or in JJA, depending on the subregion, exactly as was observed by the two satellite instruments. The discrepancies are more pronounced and subject to seasonal variation over the main dust source regions of NorAfr and MidEas, where MB is maximized during JJA, when coarse dust loads are higher, and weakens during SON. A reverse pattern is recorded in SubSah, TroAtl, and MedSea, where the seasonal minima (MB ∼ 0) corresponds to seasons of quite high coarse-DOD values (i.e., JJA, DJF, and MAM, respectively). Moreover, in MedSea and mostly in WesAsi, seasonal MB remains remarkably low and stable throughout the year, despite the seasonal coarse-DOD fluctuations. On the other hand, the RMSE seasonal pattern consistently follows the corresponding coarse-DOD annual cycle of each subregion.
Regarding the normalized parameters FGE and CC, both dust emission and transport subregions present values with significant stability throughout the year. This actually reveals a small degree of dependence between the MONARCH reanalysis performance and coarse-DOD seasonality. In particular, the lowest FGE seasonality can be found in regions with strong seasonal changes in coarse DOD, namely in NorAfr (0.45 ≤ FGE ≤ 0.56) and MidEas (0.43 ≤ FGE ≤ 0.51). Similarly, seasonal CC values exhibit intra-annual stability in most of the source and transport regions, such as NorAfr (0.79 ≤ CC ≤ 0.84), MidEas (0.72 ≤ CC ≤ 0.80), TroAtl (0.74 ≤ CC ≤ 0.82), AraSea (0.71 ≤ CC ≤ 0.76), and MedSea (0.72 ≤ CC ≤ 0.74). On the other hand, in northern regions, where the number of MIDAS observations is lower compared to southern regions and AEROIASI's contribution to the combined product increases, the seasonal CC values decrease, and significant seasonality is noted. This should not be attributed to any MONARCH reanalysis uncertainties but to the low quality of the AEROIASI retrievals in northern latitudes, as concluded in Sect. 3 (Fig. 3), which can bias the regional results of the comparison.
Overall, the seasonal scores of the MONARCH total and coarse DOD derived from the comparison with MIDAS+MISR (Fig. S4) and MIDAS+IASI (Fig. S8), respectively, exhibit a similar degree of seasonality by region and by statistical parameter. In regions most affected by dust, the results are comparable, with best agreements for CC seasonal scores, implying that the performance of the MONARCH reanalysis for both total and coarse DOD is consistent.
MONARCH dust reanalysis is an advanced dust decadal (2007–2016) regional reanalysis, based on the weather–aerosol–chemistry MONARCH model, providing a continuous 3D representation of the atmospheric desert dust over the NAMEE region, with a high spatial and temporal resolution. Providing thorough information on dust variations and trends, this product can be exploited for the development of climate services tailored to key socioeconomic sectors, focusing on those that can be significantly affected by atmospheric dust, such as health, transportation, and the solar energy industry. Therefore, the assessment of the MONARCH reanalysis performance is of great importance in order to identify its strengths and potential weaknesses and in order for it to be considered in future applications.
Here in particular, we seek to assess the performance of the MONARCH reanalysis in reproducing the total column variables of total and coarse DOD using dust products derived from MODIS, MISR, and IASI spaceborne instruments, along with ground-based remote-sensing measurements from AERONET. Instead of using a single dataset as reference, in the present analysis, different observation-based products were combined, which together provide better coverage of MONARCH's spatiotemporal domain. However, each satellite sensor has its own strengths, limitations, and uncertainties. The total and coarse-DOD products of the reference datasets (i.e., MIDAS, MISR, and AEROIASI) were obtained following different retrieval techniques and assumptions; the limitations on each dust characterization technique introduce uncertainties into the DOD products. Therefore, an additional advantage of using different observational reference datasets is the ability to perform cross-validation of the MONARCH reanalysis performance, based on the results obtained from each dataset. By collating the comparison results obtained from the different datasets, we can identify biases caused by retrieval uncertainties and assess their contribution to the evaluation results.
Moreover, prior to the MONARCH reanalysis assessment, we checked the quality of the satellite-based dust products by applying a colocated intercomparison among the different datasets, using AERONET observations as the reference dataset. Significant discrepancies between satellite- and ground-based products over certain regions should be considered to be a potential source of skewness for the subsequent reanalysis assessment. More specifically, MIDAS and MISR tend to underestimate total DOD in areas close to the dust sources and slightly overestimate it in remote regions, whereas MIDAS underestimates coarse DOD everywhere; however, both MIDAS and MISR exhibit high correlation (CC > 0.8) and low relative bias (FGE < 0.4) at most sites where high dust concentrations are recorded (latitudes < 40∘ N). Last, AEROIASI shows moderate correlations (0.4 < CC < 0.8) for stations south of 40∘ N but overestimates coarse DOD (MB > 0.07) in remote regions (latitudes > 40∘ N), showing a weakness in capturing the temporal variations in coarse DOD in these areas at annual or seasonal scales, as indicated by the low correlation with AERONET.
Taking into account these outcomes, the MONARCH reanalysis assessment was based on the comparison with AERONET and the satellite products, highlighting the similarities among the obtained results for drawing safer conclusions. According to our findings, the MONARCH reanalysis reproduces the spatial distribution of atmospheric dust across the NAMEE region very well, identifying the major dust emission hotspots located in the Sahara desert and the Middle East and the main dust transport pathways toward the adjacent maritime regions of the Atlantic Ocean, the Arabian Sea, and the Mediterranean Sea. Moreover, the MONARCH reanalysis is able to reproduce the total and coarse-DOD seasonal variability very well and with good accuracy, especially over the aforementioned areas (annual and seasonal CC values are consistently greater than 0.6 and up to 0.87), indicating that the reanalysis captures the annual dust cycle quite well over both the sources and the nearby outflow regions.
Quantitatively, according to the evaluation scores, the MONARCH reanalysis seems to simulate more emitted and fewer transported dust particles. This could be due to several factors such as having observational constraint mostly over land only or potential issues in the dust deposition and transport in the underlying model. The comparison with the satellite multi-sensor products at a regional scale shows that, on average, the MONARCH reanalysis produces slightly higher DOD values over Africa and lower DOD over the Atlantic Ocean and the Arabian Sea. More specifically, the maximum annual overestimation in total DOD was found in NorAfr (MB = 0.04) in the subregion which contains the Sahara desert, which is rather insignificant compared to the mean DOD value obtained there from the satellite sensors (MIDAS+MISR DOD = 0.25). Similarly, the MONARCH reanalysis simulates higher coarse DOD over the Sahara desert compared to the multi-sensor product (MIDAS+IASI); however, the accuracy of this outcome remains questionable due to MIDAS systematic underestimations of the coarse-DOD product. On the other hand, the minimum negative MB was recorded over the maritime regions of TroAtl and AraSea, for both total DOD (MB = −0.04) and coarse DOD (MB = −0.02), indicating a slight underestimation in simulating the exact transported dust quantity in the main downstream directions during the study period. Finally, as an exception to that general conclusion, a near-zero DOD MB was recorded over the MedSea and a near-zero coarse-DOD MB over WesAsi, which are considered to be dust transport and dust source regions, respectively.
The calculation of the FGE, which corresponds to the absolute relative bias of the reanalysis, and the CC, which represents the spatiotemporal correlation between the simulations and the multi-sensor products, shows that the MONARCH reanalysis performs better (low FGE and high CC) over dust sources and over areas frequently affected by dust transport, whereas the reanalysis scores diminish towards the remote regions located in the northern parts of the study region, where very low annual DOD values are recorded. Both statistical parameters are normalized, allowing comparisons between the total DOD and coarse-DOD assessment results. In fact, the annual FGE calculated for each subregion presents small differences between total and coarse DOD, whereas the CC is almost identical, especially in regions of high dust concentrations, indicating that the regional scores depend more on the region and its dust levels than on the evaluated variable. According to our regional results, the subregions of NorAfr, MidEas, AraSea, and TroAtl provide FGE lower than 1 and CC higher than 0.78 for both variables. These good results are corroborated by the high number of available observations used for the MONARCH reanalysis assessment in these subregions. On the other hand, the remote subregions of NorEur and Russia are characterized by very large errors (FGE > 1.93) and low correlation (CC < 0.6). In this case, the very low availability of MIDAS observations and the significant overestimations of AEROIASI products over these regions prevent us from drawing strong conclusions. To sum up, the MONARCH reanalysis is very reliable over all the regions of frequent dust activity and high dust concentrations, where the best normalized statistics (low FGE and high CC) are presented and coincide with large N values, indicating the consistency of the MONARCH reanalysis when compared against a large number of observations; consequently, it has very good performance.
The present work shows that using data from different sensors increases the observational coverage, allowing one to assess a larger sample of model data and obtain better representativeness. More importantly, through the synergy of satellite sensors that perform differently depending on weather conditions, surface type, and atmospheric dust concentration, it is possible to better assess the performance of modeling products in conditions where the sensitivity of one sensor to dust particles is higher than another. In this direction, satellite missions like NASA's EMIT (Earth surface Mineral dust source InvesTigation; https://earth.jpl.nasa.gov/emit, last access: 30 March 2023) instrument or ESA's EarthCARE (Earth Cloud, Aerosol and Radiation Explorer; https://earth.esa.int/eogateway/missions/earthcare, last access: 30 March 2023) satellite with active sensors on board, in conjunction with improving observational capabilities from the ground through regional research infrastructures, such as, e.g., ACTRIS (Aerosol, Clouds and Trace gases Research InfraStructure; https://www.actris.eu, last access: 30 March 2023) and international initiatives such as GALION (Global Atmospheric Watch (GAW) Aerosol Lidar Observation Network; WMO, 2007), could contribute to overcoming the current limitations.
Table A1Summary of the statistical metrics that were used in the model reanalysis evaluation.
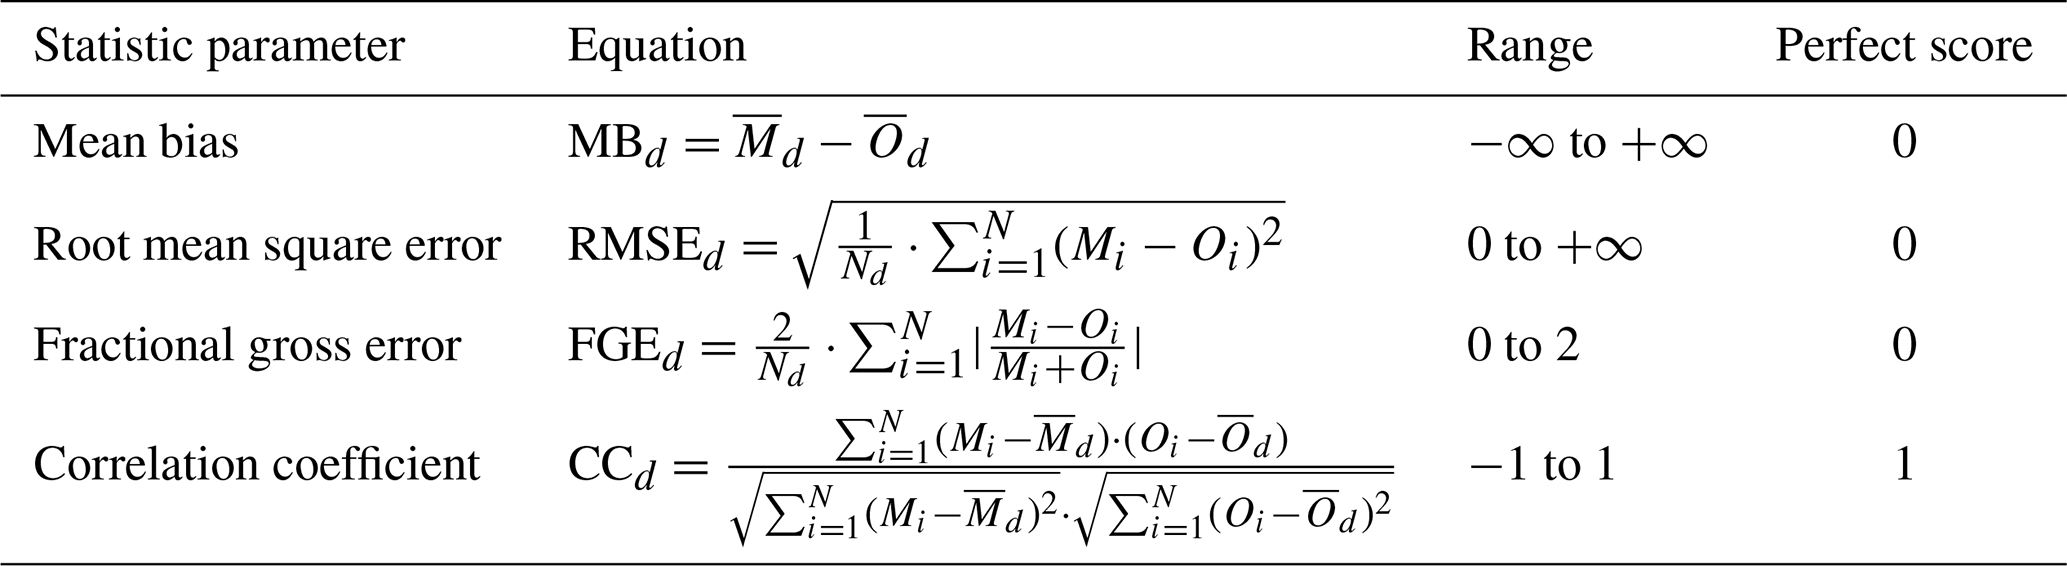
Table A2Weighted mean of the evaluation metrics obtained by different reference satellite datasets.

The evaluation metrics that were used to quantify the performance of the model reanalysis products (Mi) versus the observation-based retrievals (Oi) are presented in Table A1, where
are the mean and the standard deviation of the reanalysis (Eqs. A1–A2) and the observed DOD (Eqs. A3–A4). N indicates the total number of colocated and concurrent Mi-Oi pairs. The subscript d denotes the observational dataset used in the calculations.
MB captures the average deviation between the two datasets. A negative (positive) MB indicates the underestimation (overestimation) of the reanalysis with respect to the observations. It theoretically ranges from −∞ to +∞, and its perfect score is 0.
RMSE represents the root mean square difference between the reanalysis and observations. It is a measure of how spread out these differences are. RMSE is strongly dominated by the largest differences due to the squaring operation. It ranges between 0 and +∞, and its perfect score is 0.
FGE is a measure of the mean absolute relative bias, where the difference between the reanalysis and observation is normalized by their mean value. It is a positively defined indicator that behaves symmetrically with respect to the under- and overestimation, without over emphasizing outliers. FGE ranges from 0 to 2 (i.e., from 0 % to 200 %), where 0 indicates a perfect agreement, and values close to 1 or greater indicate very poor agreement.
CC indicates the extent to which spatial and temporal patterns in the reanalysis match those in the observations, quantifying their correlation and dependence. It ranges between −1 and 1, where −1 means the perfect anti-correlation, 0 means no correlation, and 1 indicates the perfect correlation.
The statistical results obtained by the comparison between the reanalysis and each reference satellite dataset can be aggregated in order to obtain total average scores by weighting the metrics of Table A1 with the number of observations Nd provided by each dataset and using the equations of Table A2, where
are the weighted mean and the combined standard deviation of the reanalysis (Eqs. A5–A6) and the aggregated satellite-based dust products (i.e., MIDAS+MISR for DOD and MIDAS+AEROIASI for coarse DOD; Eqs. A7–A8). The subscript d denotes the satellite dataset used in the calculations (d=1 MIDAS, and d=2 MISR for DOD; in addition to d=1 MIDAS, and d=2 AEROIASI for coarse DOD).
The MONARCH reanalysis dataset (Di Tomaso et al., 2021) is available at http://hdl.handle.net/21.12146/c6d4a608-5de3-47f6-a004-67cb1d498d98. The MIDAS dataset (Gkikas et al., 2020) is available at https://doi.org/10.5281/zenodo.4244106. AERONET Version 3 data are available from the AERONET web site (https://aeronet.gsfc.nasa.gov; NASA, 2023a). The MISR standard data products can be found at the Atmospheric Science Data Center (ASDC) Distributed Active Archive Center (DAAC) located at the NASA Langley Research Center (LaRC; https://asdc.larc.nasa.gov; NASA, 2023b). AEROIASI data can be provided upon request to Juan Cuesta (LISA/UPEC; cuesta@lisa.ipsl.fr), the principal investigator of the satellite data.
The supplement related to this article is available online at: https://doi.org/10.5194/acp-23-5487-2023-supplement.
MM, LM, SB, and EDT designed the study and conducted all of the analysis. SB collected and prepared the datasets. MM processed all the datasets and performed the data analysis. SC contributed to the statistical analysis of the data. MM wrote the draft, with contributions from LM and ST. MM, LM, SB, EDT, and CPGP discussed the main results. RK, SB, EDT, CPGP, AG, JC, ST, CD, and OJ reviewed and edited the paper. RK contributed to the part of the paper relating to MISR data. EDT contributed to the part relating to the MONARCH reanalysis data. AG contributed to the part relating to MIDAS data. JC and PF contributed to the part relating to AEROIASI data. All co-authors contributed to the final editing of the paper. MM, LM, EDT, SB, JC, and AG responded to the comments of two anonymous reviewers and revised the paper. LM supervised the entire work.
The contact author has declared that none of the authors has any competing interests.
Publisher’s note: Copernicus Publications remains neutral with regard to jurisdictional claims in published maps and institutional affiliations.
This article is part of the special issue “Dust aerosol measurements, modeling and multidisciplinary effects (AMT/ACP inter-journal SI)”. It is not associated with a conference.
The authors thank all the principal investigators and their staff, for establishing and maintaining the NASA and PHOTONS AERONET sites, and the MODIS and MISR mission scientists and associated NASA personnel, for the production of the data used in this study. Likewise, the three anonymous reviewers are acknowledged for providing constructive comments and useful suggestions that improved the quality of the present work. Sara Basart, Enza Di Tomaso, Oriol Jorba, and Carlos Pérez García-Pando acknowledge PRACE (grant nos. eDUST, eFRAGMENT1, and eFRAGMENT2) and RES (grant nos. AECT-2019-3-0001, AECT-2020-1-0007, and AECT-2020-3-0013) for awarding access to MareNostrum at the BSC and for providing technical support.
This research has been supported by the DustClim project, which is part of ERA4CS, an ERA-NET program initiated by JPI Climate, with co-funding by the European Union's Horizon 2020 research and innovation programme (grant no. 690462). The authors have received support from the ACTRIS-IMP (Implementation project), funded by the European Union's Horizon 2020 research and innovation programme (grant no. 871115). Michail Mytilinaios, Sergio Ciamprone, and Claudio Dema have received funding from CIR01_00015 under PER-ACTRIS-IT (Potenziamento della componente italiana della Infrastruttura di Ricerca Aerosol, Clouds and Trace Gases Research Infrastructure-Rafforzamento del capitale umano) and Avviso MUR DD (grant no. 2595 del 24.12.2019) Piano Stralcio (Ricerca e Innovazione 2015–2017). Sara Basart, Enza Di Tomaso, Oriol Jorba, and Carlos Pérez García-Pando have been supported by the European Research Council under the European Union's Horizon 2020 research and innovation programme (grant no. 773051; FRAGMENT), the AXA Research Fund (AXA Chair on Sand and Dust Storms), and the contribution agreement between AEMET and BSC to carry out the development and improvement activities of the products and services supplied by the World Meteorological Organization (WMO) Barcelona Dust Regional Center (i.e., the WMO Sand and Dust Storm Warning Advisory and Assessment System (SDS-WAS) Regional Center for northern Africa, the Middle East, and Europe). The work of Ralph Kahn has been supported in part by the NASA Aerosol-Cloud Modeling and Analysis Program under Richard Eckman and the NASA Earth Observing System Terra and MISR projects. Antonis Gkikas has been supported by the Hellenic Foundation for Research and Innovation (HFRI) under the “2nd Call for HFRI Research Projects to support Post-Doctoral Researchers” (ATLANTAS project no. 544). The MIDAS dataset has been developed in the framework of the DUST-GLASS project (grant no. 749461; European Union's Horizon 2020 Research and Innovation programme under the Marie Skłodowska-Curie Actions). The AEROIASI product has been developed at the LISA laboratory, with the financial support of the IASI-TOSCA (Terre, Océan, Surface Continentale et Atmosphère) project from the Centre National des Etudes Spatiales (CNES) and technical assistance of the AERIS French national data center. IASI is a joint mission of EUMETSAT and CNES.
This paper was edited by Stelios Kazadzis and reviewed by three anonymous referees.
Abdou, W. A., Diner, D. J., Martonchik, J. V., Bruegge, C. J., Kahn, R. A., Gaitley, B. J., Crean, K. A., Remer, L. A., and Holben, B.: Comparison of coincident Multiangle Imaging Spectroradiometer and Moderate Resolution Imaging Spectroradiometer aerosol optical depths over land and ocean scenes containing Aerosol Robotic Network sites, J. Geophys. Res.-Atmos., 110, D10S07, https://doi.org/10.1029/2004JD004693, 2005. a
Al-Hemoud, A., Al-Sudairawi, M., Neelamanai, S., Naseeb, A., and Behbehani, W.: Socioeconomic effect of dust storms in Kuwait, Arab. J. Geosci., 10, 18, https://doi.org/10.1007/s12517-016-2816-9, 2017. a
Amiridis, V., Marinou, E., Tsekeri, A., Wandinger, U., Schwarz, A., Giannakaki, E., Mamouri, R., Kokkalis, P., Binietoglou, I., Solomos, S., Herekakis, T., Kazadzis, S., Gerasopoulos, E., Proestakis, E., Kottas, M., Balis, D., Papayannis, A., Kontoes, C., Kourtidis, K., Papagiannopoulos, N., Mona, L., Pappalardo, G., Le Rille, O., and Ansmann, A.: LIVAS: a 3-D multi-wavelength aerosol/cloud database based on CALIPSO and EARLINET, Atmos. Chem. Phys., 15, 7127–7153, https://doi.org/10.5194/acp-15-7127-2015, 2015. a
Basart, S., Pérez, C., Cuevas, E., Baldasano, J. M., and Gobbi, G. P.: Aerosol characterization in Northern Africa, Northeastern Atlantic, Mediterranean Basin and Middle East from direct-sun AERONET observations, Atmos. Chem. Phys., 9, 8265–8282, https://doi.org/10.5194/acp-9-8265-2009, 2009. a, b
Benedetti, A., Reid, J. S., Knippertz, P., Marsham, J. H., Di Giuseppe, F., Rémy, S., Basart, S., Boucher, O., Brooks, I. M., Menut, L., Mona, L., Laj, P., Pappalardo, G., Wiedensohler, A., Baklanov, A., Brooks, M., Colarco, P. R., Cuevas, E., da Silva, A., Escribano, J., Flemming, J., Huneeus, N., Jorba, O., Kazadzis, S., Kinne, S., Popp, T., Quinn, P. K., Sekiyama, T. T., Tanaka, T., and Terradellas, E.: Status and future of numerical atmospheric aerosol prediction with a focus on data requirements, Atmos. Chem. Phys., 18, 10615–10643, https://doi.org/10.5194/acp-18-10615-2018, 2018. a
Bristow, C. S., Hudson-Edwards, K. A., and Chappell, A.: Fertilizing the Amazon and equatorial Atlantic with West African dust, Geophys. Res. Lett., 37, L14807, https://doi.org/10.1029/2010GL043486, 2010. a
Buchard, V., Randles, C. A., da Silva, A. M., Darmenov, A., Colarco, P. R., Govindaraju, R., Ferrare, R., Hair, J., Beyersdorf, A. J., Ziemba, L. D., and Yu, H.: The MERRA-2 aerosol reanalysis, 1980 onward. Part II: Evaluation and case studies, J. Climate, 30, 6851–6872, https://doi.org/10.1175/JCLI-D-16-0613.1, 2017. a
Cadelis, G., Tourres, R., and Molinie, J.: Short-Term Effects of the Particulate Pollutants Contained in Saharan Dust on the Visits of Children to the Emergency Department due to Asthmatic Conditions in Guadeloupe (French Archipelago of the Caribbean), PLOS One, 9, 1–11, https://doi.org/10.1371/journal.pone.0091136, 2014. a
Carslaw, K. S., Boucher, O., Spracklen, D. V., Mann, G. W., Rae, J. G. L., Woodward, S., and Kulmala, M.: A review of natural aerosol interactions and feedbacks within the Earth system, Atmos. Chem. Phys., 10, 1701–1737, https://doi.org/10.5194/acp-10-1701-2010, 2010. a
Clarisse, L., Clerbaux, C., Franco, B., Hadji-Lazaro, J., Whitburn, S., Kopp, A. K., Hurtmans, D., and Coheur, P.-F.: A decadal data set of global atmospheric dust retrieved from IASI satellite measurements, J. Geophys. Res.-Atmos., 124, 1618–1647, https://doi.org/10.1029/2018JD029701, 2019. a
Costa, S. C., Diniz, A. S. A., and Kazmerski, L. L.: Dust and soiling issues and impacts relating to solar energy systems: Literature review update for 2012–2015, Renew. Sust. Energ. Rev., 63, 33–61, https://doi.org/10.1016/j.rser.2016.04.059, 2016. a
Cuesta, J., Eremenko, M., Flamant, C., Dufour, G., Laurent, B., Bergametti, G., Höpfner, M., Orphal, J., and Zhou, D.: Three-dimensional distribution of a major desert dust outbreak over East Asia in March 2008 derived from IASI satellite observations, J. Geophys. Res.-Atmos., 120, 7099–7127, https://doi.org/10.1002/2014JD022406, 2015. a, b, c, d
Cuesta, J., Flamant, C., Gaetani, M., Knippertz, P., Fink, A. H., Chazette, P., Eremenko, M., Dufour, G., Di Biagio, C., and Formenti, P.: Three-dimensional pathways of dust over the Sahara during summer 2011 as revealed by new Infrared Atmospheric Sounding Interferometer observations, Q. J. Roy. Meteor. Soc., 146, 2731–2755, https://doi.org/10.1002/qj.3814, 2020. a, b, c
Cuevas, E., Camino, C., Benedetti, A., Basart, S., Terradellas, E., Baldasano, J. M., Morcrette, J. J., Marticorena, B., Goloub, P., Mortier, A., Berjón, A., Hernández, Y., Gil-Ojeda, M., and Schulz, M.: The MACC-II 2007–2008 reanalysis: atmospheric dust evaluation and characterization over northern Africa and the Middle East, Atmos. Chem. Phys., 15, 3991–4024, https://doi.org/10.5194/acp-15-3991-2015, 2015. a
Di Tomaso, E., Schutgens, N. A. J., Jorba, O., and Pérez García-Pando, C.: Assimilation of MODIS Dark Target and Deep Blue observations in the dust aerosol component of NMMB-MONARCH version 1.0, Geosci. Model Dev., 10, 1107–1129, https://doi.org/10.5194/gmd-10-1107-2017, 2017. a
Di Tomaso, E., Escribano, J., Basart, S., Macchia, F., Benincasa, F., Bretonnière, P.-A., Buñuel, A., Castrillo, M., Gonçalves, M., Jorba, O., Klose, M., Montané Pinto, G., Olid, M., and Pérez García-Pando, C.: MONARCH high-resolution reanalysis data set of desert dust aerosol over Northern Africa, the Middle East and Europe, BSC, THREDDS [data set], http://hdl.handle.net/21.12146/c6d4a608-5de3-47f6-a004-67cb1d498d98 (last access: 30 March 2023), 2021. a, b
Di Tomaso, E., Escribano, J., Basart, S., Ginoux, P., Macchia, F., Barnaba, F., Benincasa, F., Bretonnière, P.-A., Buñuel, A., Castrillo, M., Cuevas, E., Formenti, P., Gonçalves, M., Jorba, O., Klose, M., Mona, L., Montané Pinto, G., Mytilinaios, M., Obiso, V., Olid, M., Schutgens, N., Votsis, A., Werner, E., and Pérez García-Pando, C.: The MONARCH high-resolution reanalysis of desert dust aerosol over Northern Africa, the Middle East and Europe (2007–2016), Earth Syst. Sci. Data, 14, 2785–2816, https://doi.org/10.5194/essd-14-2785-2022, 2022. a, b, c
Diner, D., Beckert, J., Reilly, T., Bruegge, C., Conel, J., Kahn, R., Martonchik, J., Ackerman, T., Davies, R., Gerstl, S., Gordon, H., Muller, J.-P., Myneni, R., Sellers, P., Pinty, B., and Verstraete, M.: Multi-angle Imaging SpectroRadiometer (MISR) instrument description and experiment overview, IEEE T. Geosci. Remote, 36, 1072–1087, https://doi.org/10.1109/36.700992, 1998. a
Dubovik, O., Holben, B., Eck, T. F., Smirnov, A., Kaufman, Y. J., King, M. D., Tanré, D., and Slutsker, I.: Variability of absorption and optical properties of key aerosol types observed in worldwide locations, J. Atmos. Sci., 59, 590–608, https://doi.org/10.1175/1520-0469(2002)059<0590:VOAAOP>2.0.CO;2, 2002. a
Eck, T. F., Holben, B. N., Reid, J. S., Dubovik, O., Smirnov, A., O'Neill, N. T., Slutsker, I., and Kinne, S.: Wavelength dependence of the optical depth of biomass burning, urban, and desert dust aerosols, J. Geophys. Res.-Atmos., 104, 31333–31349, https://doi.org/10.1029/1999JD900923, 1999. a
Escribano, J., Di Tomaso, E., Jorba, O., Klose, M., Gonçalves Ageitos, M., Macchia, F., Amiridis, V., Baars, H., Marinou, E., Proestakis, E., Urbanneck, C., Althausen, D., Bühl, J., Mamouri, R.-E., and Pérez García-Pando, C.: Assimilating spaceborne lidar dust extinction can improve dust forecasts, Atmos. Chem. Phys., 22, 535–560, https://doi.org/10.5194/acp-22-535-2022, 2022. a
Flaounas, E., Kotroni, V., Lagouvardos, K., Kazadzis, S., Gkikas, A., and Hatzianastassiou, N.: Cyclone contribution to dust transport over the Mediterranean region, Atmos. Sci. Lett., 16, 473–478, https://doi.org/10.1002/asl.584, 2015. a
Gelaro, R., McCarty, W., Suárez, M. J., Todling, R., Molod, A., Takacs, L., Randles, C. A., Darmenov, A., Bosilovich, M. G., Reichle, R., Wargan, K., Coy, L., Cullather, R., Draper, C., Akella, S., Buchard, V., Conaty, A., da Silva, A. M., Gu, W., Kim, G.-K., Koster, R., Lucchesi, R., Merkova, D., Nielsen, J. E., Partyka, G., Pawson, S., Putman, W., Rienecker, M., Schubert, S. D., Sienkiewicz, M., and Zhao, B.: The Modern-Era Retrospective Analysis for Research and Applications, Version 2 (MERRA-2), J. Climate, 30, 5419–5454, https://doi.org/10.1175/JCLI-D-16-0758.1, 2017. a, b
Giles, D. M., Holben, B. N., Eck, T. F., Sinyuk, A., Smirnov, A., Slutsker, I., Dickerson, R. R., Thompson, A. M., and Schafer, J. S.: An analysis of AERONET aerosol absorption properties and classifications representative of aerosol source regions, J. Geophys. Res.-Atmos., 117, D17203, https://doi.org/10.1029/2012JD018127, 2012. a
Giles, D. M., Sinyuk, A., Sorokin, M. G., Schafer, J. S., Smirnov, A., Slutsker, I., Eck, T. F., Holben, B. N., Lewis, J. R., Campbell, J. R., Welton, E. J., Korkin, S. V., and Lyapustin, A. I.: Advancements in the Aerosol Robotic Network (AERONET) Version 3 database – automated near-real-time quality control algorithm with improved cloud screening for Sun photometer aerosol optical depth (AOD) measurements, Atmos. Meas. Tech., 12, 169–209, https://doi.org/10.5194/amt-12-169-2019, 2019. a, b, c
Ginoux, P., Garbuzov, D., and Hsu, N. C.: Identification of anthropogenic and natural dust sources using Moderate Resolution Imaging Spectroradiometer (MODIS) Deep Blue level 2 data, J. Geophys. Res.-Atmos., 115, D05204, https://doi.org/10.1029/2009JD012398, 2010. a
Ginoux, P., Clarisse, L., Clerbaux, C., Coheur, P.-F., Dubovik, O., Hsu, N. C., and Van Damme, M.: Mixing of dust and NH3 observed globally over anthropogenic dust sources, Atmos. Chem. Phys., 12, 7351–7363, https://doi.org/10.5194/acp-12-7351-2012, 2012a. a, b
Ginoux, P., Prospero, J. M., Gill, T. E., Hsu, N. C., and Zhao, M.: Global-scale attribution of anthropogenic and natural dust sources and their emission rates based on MODIS Deep Blue aerosol products, Rev. Geophys., 50, RG3005, https://doi.org/10.1029/2012RG000388, 2012b. a
Gkikas, A., Hatzianastassiou, N., Mihalopoulos, N., Katsoulis, V., Kazadzis, S., Pey, J., Querol, X., and Torres, O.: The regime of intense desert dust episodes in the Mediterranean based on contemporary satellite observations and ground measurements, Atmos. Chem. Phys., 13, 12135–12154, https://doi.org/10.5194/acp-13-12135-2013, 2013. a
Gkikas, A., Houssos, E. E., Lolis, C. J., Bartzokas, A., Mihalopoulos, N., and Hatzianastassiou, N.: Atmospheric circulation evolution related to desert-dust episodes over the Mediterranean, Q. J. Roy. Meteor. Soc., 141, 1634–1645, https://doi.org/10.1002/qj.2466, 2015. a
Gkikas, A., Basart, S., Hatzianastassiou, N., Marinou, E., Amiridis, V., Kazadzis, S., Pey, J., Querol, X., Jorba, O., Gassó, S., and Baldasano, J. M.: Mediterranean intense desert dust outbreaks and their vertical structure based on remote sensing data, Atmos. Chem. Phys., 16, 8609–8642, https://doi.org/10.5194/acp-16-8609-2016, 2016. a
Gkikas, A., Obiso, V., Pérez García-Pando, C., Jorba, O., Hatzianastassiou, N., Vendrell, L., Basart, S., Solomos, S., Gassó, S., and Baldasano, J. M.: Direct radiative effects during intense Mediterranean desert dust outbreaks, Atmos. Chem. Phys., 18, 8757–8787, https://doi.org/10.5194/acp-18-8757-2018, 2018. a
Gkikas, A., Giannaros, T., Kotroni, V., and Lagouvardos, K.: Assessing the radiative impacts of an extreme desert dust outbreak and the potential improvements on short-term weather forecasts: The case of February 2015, Atmos. Res., 226, 152–170, https://doi.org/10.1016/j.atmosres.2019.04.020, 2019. a
Gkikas, A., Proestakis, E., Amiridis, V., Kazadzis, S., Di Tomaso, E., Tsekeri, A., Marinou, E., Hatzianastassiou, N., and Pérez García-Pando, C.: ModIs Dust AeroSol (MIDAS): A global fine resolution dust optical depth dataset, Zenodo [data set], https://doi.org/10.5281/zenodo.4244106, 2020. a, b
Gkikas, A., Proestakis, E., Amiridis, V., Kazadzis, S., Di Tomaso, E., Tsekeri, A., Marinou, E., Hatzianastassiou, N., and Pérez García-Pando, C.: ModIs Dust AeroSol (MIDAS): a global fine-resolution dust optical depth data set, Atmos. Meas. Tech., 14, 309–334, https://doi.org/10.5194/amt-14-309-2021, 2021. a, b, c, d, e
Goossens, D. and Van Kerschaever, E.: Aeolian dust deposition on photovoltaic solar cells: the effects of wind velocity and airborne dust concentration on cell performance, Sol. Energy, 66, 277–289, https://doi.org/10.1016/S0038-092X(99)00028-6, 1999. a
Goudie, A. S. and Middleton, N. J.: Desert Dust in the Global System, edited by: Czeschlik, D., Springer Berlin, Heidelberg, 1st Edn., https://doi.org/10.1007/3-540-32355-4, 2006. a
Griffin, D. W.: Atmospheric Movement of Microorganisms in Clouds of Desert Dust and Implications for Human Health, Clin. Microbiol. Rev., 20, 459–477, https://doi.org/10.1128/CMR.00039-06, 2007. a
Guo, Y., Tian, B., Kahn, R. A., Kalashnikova, O., Wong, S., and Waliser, D. E.: Tropical Atlantic dust and smoke aerosol variations related to the Madden-Julian Oscillation in MODIS and MISR observations, J. Geophys. Res.-Atmos., 118, 4947–4963, https://doi.org/10.1002/jgrd.50409, 2013. a, b, c
Gyan, K., Henry, W., Lacaille, S., Laloo, A., Lamsee-Ebanks, C., McKay, S., Antoine, R. M., and Monteil, M. A.: African dust clouds are associated with increased paediatric asthma accident and emergency admissions on the Caribbean island of Trinidad, Int. J. Biometeorol., 49, 371–376, https://doi.org/10.1007/s00484-005-0257-3, 2005. a
Holben, B., Eck, T., Slutsker, I., Tanré, D., Buis, J., Setzer, A., Vermote, E., Reagan, J., Kaufman, Y., Nakajima, T., Lavenu, F., Jankowiak, I., and Smirnov, A.: AERONET – A Federated Instrument Network and Data Archive for Aerosol Characterization, Remote Sens. Environ., 66, 1–16, https://doi.org/10.1016/S0034-4257(98)00031-5, 1998. a
Hsu, N. C., Tsay, S.-C., King, M. D., and Herman, J. R.: Aerosol properties over bright-reflecting source regions, IEEE T. Geosci. Remote, 42, 557–569, https://doi.org/10.1109/TGRS.2004.824067, 2004. a
Hunt, B. R., Kostelich, E. J., and Szunyogh, I.: Efficient data assimilation for spatiotemporal chaos: A local ensemble transform Kalman filter, Physica D, 230, 112–126, https://doi.org/10.1016/j.physd.2006.11.008, 2007. a
Inness, A., Baier, F., Benedetti, A., Bouarar, I., Chabrillat, S., Clark, H., Clerbaux, C., Coheur, P., Engelen, R. J., Errera, Q., Flemming, J., George, M., Granier, C., Hadji-Lazaro, J., Huijnen, V., Hurtmans, D., Jones, L., Kaiser, J. W., Kapsomenakis, J., Lefever, K., Leitão, J., Razinger, M., Richter, A., Schultz, M. G., Simmons, A. J., Suttie, M., Stein, O., Thépaut, J.-N., Thouret, V., Vrekoussis, M., Zerefos, C., and the MACC team: The MACC reanalysis: an 8 yr data set of atmospheric composition, Atmos. Chem. Phys., 13, 4073–4109, https://doi.org/10.5194/acp-13-4073-2013, 2013. a
Inness, A., Ades, M., Agustí-Panareda, A., Barré, J., Benedictow, A., Blechschmidt, A.-M., Dominguez, J. J., Engelen, R., Eskes, H., Flemming, J., Huijnen, V., Jones, L., Kipling, Z., Massart, S., Parrington, M., Peuch, V.-H., Razinger, M., Remy, S., Schulz, M., and Suttie, M.: The CAMS reanalysis of atmospheric composition, Atmos. Chem. Phys., 19, 3515–3556, https://doi.org/10.5194/acp-19-3515-2019, 2019. a
Jiang, H., Lu, L., and Sun, K.: Experimental investigation of the impact of airborne dust deposition on the performance of solar photovoltaic (PV) modules, Atmos. Environ., 45, 4299–4304, https://doi.org/10.1016/j.atmosenv.2011.04.084, 2011. a
Jickells, T. D., An, Z. S., Andersen, K. K., Baker, A. R., Bergametti, G., Brooks, N., Cao, J. J., Boyd, P. W., Duce, R. A., Hunter, K. A., Kawahata, H., Kubilay, N., laRoche, J., Liss, P. S., Mahowald, N., Prospero, J. M., Ridgwell, A. J., Tegen, I., and Torres, R.: Global Iron Connections Between Desert Dust, Ocean Biogeochemistry, and Climate, Science, 308, 67–71, https://doi.org/10.1126/science.1105959, 2005. a
Kahn, R., West, R., McDonald, D., Rheingans, B., and Mishchenko, M. I.: Sensitivity of multiangle remote sensing observations to aerosol sphericity, J. Geophys. Res.-Atmos., 102, 16861–16870, https://doi.org/10.1029/96JD01934, 1997. a
Kahn, R., Banerjee, P., McDonald, D., and Diner, D. J.: Sensitivity of multiangle imaging to aerosol optical depth and to pure-particle size distribution and composition over ocean, J. Geophys. Res.-Atmos., 103, 32195–32213, https://doi.org/10.1029/98JD01752, 1998. a
Kahn, R., Banerjee, P., and McDonald, D.: Sensitivity of multiangle imaging to natural mixtures of aerosols over ocean, J. Geophys. Res.-Atmos., 106, 18219–18238, https://doi.org/10.1029/2000JD900497, 2001. a
Kahn, R. A. and Gaitley, B. J.: An analysis of global aerosol type as retrieved by MISR, J. Geophys. Res.-Atmos., 120, 4248–4281, https://doi.org/10.1002/2015JD023322, 2015. a, b, c, d
Kahn, R. A., Gaitley, B. J., Garay, M. J., Diner, D. J., Eck, T. F., Smirnov, A., and Holben, B. N.: Multiangle Imaging SpectroRadiometer global aerosol product assessment by comparison with the Aerosol Robotic Network, J. Geophys. Res.-Atmos., 115, D23209, https://doi.org/10.1029/2010JD014601, 2010. a, b
Kalashnikova, O. V. and Kahn, R.: Ability of multiangle remote sensing observations to identify and distinguish mineral dust types: 2. Sensitivity over dark water, J. Geophys. Res.-Atmos., 111, D11207, https://doi.org/10.1029/2005JD006756, 2006. a, b, c, d
Kalashnikova, O. V. and Kahn, R. A.: Mineral dust plume evolution over the Atlantic from MISR and MODIS aerosol retrievals, J. Geophys. Res.-Atmos., 113, D24204, https://doi.org/10.1029/2008JD010083, 2008. a
Kalashnikova, O. V., Garay, M. J., Martonchik, J. V., and Diner, D. J.: MISR Dark Water aerosol retrievals: operational algorithm sensitivity to particle non-sphericity, Atmos. Meas. Tech., 6, 2131–2154, https://doi.org/10.5194/amt-6-2131-2013, 2013. a, b, c
Kaly, F., Marticorena, B., Chatenet, B., Rajot, J., Janicot, S., Niang, A., Yahi, H., Thiria, S., Maman, A., Zakou, A., Coulibaly, B., Coulibaly, M., Koné, I., Traoré, S., Diallo, A., and Ndiaye, T.: Variability of mineral dust concentrations over West Africa monitored by the Sahelian Dust Transect, Atmos. Res., 164–165, 226–241, https://doi.org/10.1016/j.atmosres.2015.05.011, 2015. a
Kanatani, K. T., Ito, I., Al-Delaimy, W. K., Adachi, Y., Mathews, W. C., and Ramsdell, J. W.: Desert dust exposure is associated with increased risk of asthma hospitalization in children, Am. J. Resp. Crit. Care, 182, 1475–1481, https://doi.org/10.1164/rccm.201002-0296OC, 2010. a
Karydis, V. A., Tsimpidi, A. P., Bacer, S., Pozzer, A., Nenes, A., and Lelieveld, J.: Global impact of mineral dust on cloud droplet number concentration, Atmos. Chem. Phys., 17, 5601–5621, https://doi.org/10.5194/acp-17-5601-2017, 2017. a
Kaufman, Y. J., Koren, I., Remer, L. A., Tanré, D., Ginoux, P., and Fan, S.: Dust transport and deposition observed from the Terra-Moderate Resolution Imaging Spectroradiometer (MODIS) spacecraft over the Atlantic Ocean, J. Geophys. Res.-Atmos., 110, D10S12, https://doi.org/10.1029/2003JD004436, 2005. a
Klose, M., Jorba, O., Gonçalves Ageitos, M., Escribano, J., Dawson, M. L., Obiso, V., Di Tomaso, E., Basart, S., Montané Pinto, G., Macchia, F., Ginoux, P., Guerschman, J., Prigent, C., Huang, Y., Kok, J. F., Miller, R. L., and Pérez García-Pando, C.: Mineral dust cycle in the Multiscale Online Nonhydrostatic AtmospheRe CHemistry model (MONARCH) Version 2.0, Geosci. Model Dev., 14, 6403–6444, https://doi.org/10.5194/gmd-14-6403-2021, 2021. a
Kok, J. F., Ridley, D. A., Zhou, Q., Miller, R. L., Zhao, C., Heald, C. L., Ward, D. S., Albani, S., and Haustein, K.: Smaller desert dust cooling effect estimated from analysis of dust size and abundance, Nat. Geosci., 10, 274–278, https://doi.org/10.1038/ngeo2912, 2017. a
Kosmopoulos, P. G., Kazadzis, S., El-Askary, H., Taylor, M., Gkikas, A., Proestakis, E., Kontoes, C., and El-Khayat, M. M.: Earth-observation-based estimation and forecasting of particulate matter impact on solar energy in Egypt, Remote Sens., 10, 1870, https://doi.org/10.3390/rs10121870, 2018. a
Lambert, F., Kug, J.-S., Park, R. J., Mahowald, N., Winckler, G., Abe-Ouchi, A., O'ishi, R., Takemura, T., and Lee, J.-H.: The role of mineral-dust aerosols in polar temperature amplification, Nat. Clim. Change, 3, 487–491, https://doi.org/10.1038/nclimate1785, 2013. a
Lekas, T. I., Kushta, J., Solomos, S., and Kallos, G.: Some considerations related to flight in dusty conditions, Journal of Aerospace Operations, 3, 45–56, https://doi.org/10.3233/AOP-140043, 2014. a
Lekunberri, I., Lefort, T., Romero, E., Vázquez-Domínguez, E., Romera-Castillo, C., Marrasé, C., Peters, F., Weinbauer, M., and Gasol, J. M.: Effects of a dust deposition event on coastal marine microbial abundance and activity, bacterial community structure and ecosystem function, J. Plankton Res., 32, 381–396, https://doi.org/10.1093/plankt/fbp137, 2010. a
Levin, Z., Ganor, E., and Gladstein, V.: The effects of desert particles coated with sulfate on rain formation in the Eastern Mediterranean, J. Appl. Meteorol. Clim., 35, 1511–1523, https://doi.org/10.1175/1520-0450(1996)035<1511:TEODPC>2.0.CO;2, 1996. a
Liu, D., Wang, Z., Liu, Z., Winker, D., and Trepte, C.: A height resolved global view of dust aerosols from the first year CALIPSO lidar measurements, J. Geophys. Res.-Atmos., 113, D16214, https://doi.org/10.1029/2007JD009776, 2008. a
Liu, D., Taylor, J. W., Crosier, J., Marsden, N., Bower, K. N., Lloyd, G., Ryder, C. L., Brooke, J. K., Cotton, R., Marenco, F., Blyth, A., Cui, Z., Estelles, V., Gallagher, M., Coe, H., and Choularton, T. W.: Aircraft and ground measurements of dust aerosols over the west African coast in summer 2015 during ICE-D and AER-D, Atmos. Chem. Phys., 18, 3817–3838, https://doi.org/10.5194/acp-18-3817-2018, 2018. a
Lynch, P., Reid, J. S., Westphal, D. L., Zhang, J., Hogan, T. F., Hyer, E. J., Curtis, C. A., Hegg, D. A., Shi, Y., Campbell, J. R., Rubin, J. I., Sessions, W. R., Turk, F. J., and Walker, A. L.: An 11-year global gridded aerosol optical thickness reanalysis (v1.0) for atmospheric and climate sciences, Geosci. Model Dev., 9, 1489–1522, https://doi.org/10.5194/gmd-9-1489-2016, 2016. a
Mahowald, N., Albani, S., Kok, J. F., Engelstaeder, S., Scanza, R., Ward, D. S., and Flanner, M. G.: The size distribution of desert dust aerosols and its impact on the Earth system, Aeolian Res., 15, 53–71, https://doi.org/10.1016/j.aeolia.2013.09.002, 2014. a
Mallone, S., Stafoggia, M., Faustini, A., Gobbi, G. P., Marconi, A., and Forastiere, F.: Saharan dust and associations between particulate matter and daily mortality in Rome, Italy, Environ. Health Persp., 119, 1409–1414, https://doi.org/10.1289/ehp.1003026, 2011. a
Mani, M. and Pillai, R.: Impact of dust on solar photovoltaic (PV) performance: Research status, challenges and recommendations, Renew. Sust. Energ. Rev., 14, 3124–3131, https://doi.org/10.1016/j.rser.2010.07.065, 2010. a
Marinou, E., Amiridis, V., Binietoglou, I., Tsikerdekis, A., Solomos, S., Proestakis, E., Konsta, D., Papagiannopoulos, N., Tsekeri, A., Vlastou, G., Zanis, P., Balis, D., Wandinger, U., and Ansmann, A.: Three-dimensional evolution of Saharan dust transport towards Europe based on a 9-year EARLINET-optimized CALIPSO dataset, Atmos. Chem. Phys., 17, 5893–5919, https://doi.org/10.5194/acp-17-5893-2017, 2017. a, b
Middleton, N.: Desert dust hazards: A global review, Aeolian Res., 24, 53–63, https://doi.org/10.1016/j.aeolia.2016.12.001, 2017. a
Middleton, N. J. and Goudie, A. S.: Saharan dust: sources and trajectories, T. I. Brit. Geogr., 26, 165–181, https://doi.org/10.1111/1475-5661.00013, 2001. a
Miller, R. L., Cakmur, R. V., Perlwitz, J., Geogdzhayev, I. V., Ginoux, P., Koch, D., Kohfeld, K. E., Prigent, C., Ruedy, R., Schmidt, G. A., and Tegen, I.: Mineral dust aerosols in the NASA Goddard Institute for Space Sciences ModelE atmospheric general circulation model, J. Geophys. Res.-Atmos., 111, D06208, https://doi.org/10.1029/2005JD005796, 2006. a
Miri, A. and Middleton, N.: Long-term impacts of dust storms on transport systems in south-eastern Iran, Nat. Hazards, 114, 291–312, https://doi.org/10.1007/s11069-022-05390-z, 2022. a
Miyoshi, T. and Yamane, S.: Local ensemble transform Kalman filtering with an AGCM at a T159/L48 resolution, Mon. Weather Rev., 135, 3841–3861, https://doi.org/10.1175/2007MWR1873.1, 2007. a
Mona, L., Amodeo, A., Pandolfi, M., and Pappalardo, G.: Saharan dust intrusions in the Mediterranean area: Three years of Raman lidar measurements, J. Geophys. Res.-Atmos., 111, D16203, https://doi.org/10.1029/2005JD006569, 2006. a
Monteiro, A., Basart, S., Kazadzis, S., Votzis, A., Gkikas, A., Vandenbussche, S., Tobias, A., Gama, C., García-Pando, C. P., Terradellas, E., Notas, G., Middleton, N., Kushta, J., Amiridis, V., Lagouvardos, K., Kosmopoulos, P., Kotroni, V., Kanakidou, M., Mihalopoulos, N., Kalivitis, N., Dagsson-Waldhauserová, P., El-Askary, H., Sievers, K., Giannaros, T., Mona, L., Hirtl, M., Skomorowski, P., Virtanen, T. H., Christoudias, T., Di Mauro, B., Trippetta, S., Kutuzov, S., Meinander, O., and Nickovic, S.: Multi-sectoral impact assessment of an extreme African dust episode in the Eastern Mediterranean in March 2018, Sci. Total Environ., 843, 156861, https://doi.org/10.1016/j.scitotenv.2022.156861, 2022. a
Myhre, G. and Stordal, F.: Global sensitivity experiments of the radiative forcing due to mineral aerosols, J. Geophys. Res.-Atmos., 106, 18193–18204, https://doi.org/10.1029/2000JD900536, 2001. a
Myhre, G., Shindell, D., Bréon, F.-M., Collins, W., Fuglestvedt, J., Huang, J., Koch, D., Lamarque, J.-F., Lee, D., Mendoza, B., Nakajima, T., Robock, A., Stephens, G., Takemura, T., and Zhang, H.: Anthropogenic and Natural Radiative Forcing, in: Climate Change 2013: The Physical Science Basis. Contribution of Working Group I to the Fifth Assessment Report of the Intergovernmental Panel on Climate Change, edited by: Stocker, T. F., Qin, D., Plattner, G.-K., Tignor, M., Allen, S., Boschung, J., Nauels, A., Xia, Y., Bex, V., and Midgley, P. M., chap. 8, 659–740, Cambridge University Press, Cambridge, United Kingdom and New York, NY, USA, https://doi.org/10.1017/CBO9781107415324.018, 2013. a, b
Nabat, P., Somot, S., Mallet, M., Michou, M., Sevault, F., Driouech, F., Meloni, D., di Sarra, A., Di Biagio, C., Formenti, P., Sicard, M., Léon, J.-F., and Bouin, M.-N.: Dust aerosol radiative effects during summer 2012 simulated with a coupled regional aerosol–atmosphere–ocean model over the Mediterranean, Atmos. Chem. Phys., 15, 3303–3326, https://doi.org/10.5194/acp-15-3303-2015, 2015. a
NASA: AERONET, https://aeronet.gsfc.nasa.gov, last access: 30 March 2023a. a
NASA: Atmospheric Science Data Center, https://asdc.larc.nasa.gov, last access: 30 March 2023b. a
Okin, G. S., Mahowald, N., Chadwick, O. A., and Artaxo, P.: Impact of desert dust on the biogeochemistry of phosphorus in terrestrial ecosystems, Global Biogeochem. Cy., 18, GB2005, https://doi.org/10.1029/2003GB002145, 2004. a
O'Neill, N. T., Eck, T. F., Smirnov, A., Holben, B. N., and Thulasiraman, S.: Spectral discrimination of coarse and fine mode optical depth, J. Geophys. Res.-Atmos., 108, 4559, https://doi.org/10.1029/2002JD002975, 2003. a, b
Painter, T. H., Barrett, A. P., Landry, C. C., Neff, J. C., Cassidy, M. P., Lawrence, C. R., McBride, K. E., and Farmer, G. L.: Impact of disturbed desert soils on duration of mountain snow cover, Geophys. Res. Lett., 34, L12502, https://doi.org/10.1029/2007GL030284, 2007. a
Papagiannopoulos, N., Mona, L., Amodeo, A., D'Amico, G., Gumà Claramunt, P., Pappalardo, G., Alados-Arboledas, L., Guerrero-Rascado, J. L., Amiridis, V., Kokkalis, P., Apituley, A., Baars, H., Schwarz, A., Wandinger, U., Binietoglou, I., Nicolae, D., Bortoli, D., Comerón, A., Rodríguez-Gómez, A., Sicard, M., Papayannis, A., and Wiegner, M.: An automatic observation-based aerosol typing method for EARLINET, Atmos. Chem. Phys., 18, 15879–15901, https://doi.org/10.5194/acp-18-15879-2018, 2018. a
Papayannis, A., Amiridis, V., Mona, L., Tsaknakis, G., Balis, D., Bösenberg, J., Chaikovski, A., De Tomasi, F., Grigorov, I., Mattis, I., Mitev, V., Müller, D., Nickovic, S., Pérez, C., Pietruczuk, A., Pisani, G., Ravetta, F., Rizi, V., Sicard, M., Trickl, T., Wiegner, M., Gerding, M., Mamouri, R. E., D'Amico, G., and Pappalardo, G.: Systematic lidar observations of Saharan dust over Europe in the frame of EARLINET (2000–2002), J. Geophys. Res.-Atmos., 113, D10204, https://doi.org/10.1029/2007JD009028, 2008. a
Papayannis, A., Nicolae, D., Kokkalis, P., Binietoglou, I., Talianu, C., Belegante, L., Tsaknakis, G., Cazacu, M., Vetres, I., and Ilic, L.: Optical, size and mass properties of mixed type aerosols in Greece and Romania as observed by synergy of lidar and sunphotometers in combination with model simulations: A case study, Sci. Total Environ., 500–501, 277–294, https://doi.org/10.1016/j.scitotenv.2014.08.101, 2014. a
Pérez, C., Haustein, K., Janjic, Z., Jorba, O., Huneeus, N., Baldasano, J. M., Black, T., Basart, S., Nickovic, S., Miller, R. L., Perlwitz, J. P., Schulz, M., and Thomson, M.: Atmospheric dust modeling from meso to global scales with the online NMMB/BSC-Dust model – Part 1: Model description, annual simulations and evaluation, Atmos. Chem. Phys., 11, 13001–13027, https://doi.org/10.5194/acp-11-13001-2011, 2011. a
Pérez García-Pando, C., Stanton, M. C., Diggle, P. J., Trzaska, S., Miller, R. L., Perlwitz, J. P., Baldasano, J. M., Cuevas, E., Ceccato, P., Yaka, P., and Thomson, M. C.: Soil dust aerosols and wind as predictors of seasonal meningitis incidence in Niger, Environ. Health Persp., 122, 679–686, https://doi.org/10.1289/ehp.1306640, 2014. a
Peyridieu, S., Chédin, A., Capelle, V., Tsamalis, C., Pierangelo, C., Armante, R., Crevoisier, C., Crépeau, L., Siméon, M., Ducos, F., and Scott, N. A.: Characterisation of dust aerosols in the infrared from IASI and comparison with PARASOL, MODIS, MISR, CALIOP, and AERONET observations, Atmos. Chem. Phys., 13, 6065–6082, https://doi.org/10.5194/acp-13-6065-2013, 2013. a
Pierangelo, C., Mishchenko, M., Balkanski, Y., and Chédin, A.: Retrieving the effective radius of Saharan dust coarse mode from AIRS, Geophys. Res. Lett., 32, L20813, https://doi.org/10.1029/2005GL023425, 2005. a
Pierce, J. R., Kahn, R. A., Davis, M. R., and Comstock, J. M.: Detecting thin cirrus in Multiangle Imaging Spectroradiometer aerosol retrievals, J. Geophys. Res.-Atmos., 115, D08201, https://doi.org/10.1029/2009JD013019, 2010. a, b
Proestakis, E., Amiridis, V., Marinou, E., Georgoulias, A. K., Solomos, S., Kazadzis, S., Chimot, J., Che, H., Alexandri, G., Binietoglou, I., Daskalopoulou, V., Kourtidis, K. A., de Leeuw, G., and van der A, R. J.: Nine-year spatial and temporal evolution of desert dust aerosols over South and East Asia as revealed by CALIOP, Atmos. Chem. Phys., 18, 1337–1362, https://doi.org/10.5194/acp-18-1337-2018, 2018. a
Prospero, J. M.: Long-range transport of mineral dust in the global atmosphere: Impact of African dust on the environment of the southeastern United States, P. Natl. Acad. Sci. USA, 96, 3396–3403, https://doi.org/10.1073/pnas.96.7.3396, 1999. a
Prospero, J. M., Ginoux, P., Torres, O., Nicholson, S. E., and Gill, T. E.: Environmental characterization of global sources of atmospheric soil dust identified with the nimbus 7 Total Ozone Mapping Spectrometer (TOMS) absorbing aerosol product, Rev. Geophys., 40, 2-1–2-31, https://doi.org/10.1029/2000RG000095, 2002. a
Pu, B. and Ginoux, P.: The impact of the Pacific Decadal Oscillation on springtime dust activity in Syria, Atmos. Chem. Phys., 16, 13431–13448, https://doi.org/10.5194/acp-16-13431-2016, 2016. a
Querol, X., Tobías, A., Pérez, N., Karanasiou, A., Amato, F., Stafoggia, M., Pérez García-Pando, C., Ginoux, P., Forastiere, F., Gumy, S., Mudu, P., and Alastuey, A.: Monitoring the impact of desert dust outbreaks for air quality for health studies, Environ. Int., 130, 104867, https://doi.org/10.1016/j.envint.2019.05.061, 2019. a
Ramaswamy, V., Muraleedharan, P. M., and Babu, C. P.: Mid-troposphere transport of Middle-East dust over the Arabian Sea and its effect on rainwater composition and sensitive ecosystems over India, Sci. Rep.-UK, 7, 13676, https://doi.org/10.1038/s41598-017-13652-1, 2017. a
Roberts, A. and Knippertz, P.: Haboobs: convectively generated dust storms in West Africa, Weather, 67, 311–316, https://doi.org/10.1002/wea.1968, 2012. a
Sayer, A. M., Munchak, L. A., Hsu, N. C., Levy, R. C., Bettenhausen, C., and Jeong, M.-J.: MODIS Collection 6 aerosol products: Comparison between Aqua's e-Deep Blue, Dark Target, and “merged” data sets, and usage recommendations, J. Geophys. Res.-Atmos., 119, 13965–13989, https://doi.org/10.1002/2014JD022453, 2014. a
Schutgens, N. A. J., Miyoshi, T., Takemura, T., and Nakajima, T.: Applying an ensemble Kalman filter to the assimilation of AERONET observations in a global aerosol transport model, Atmos. Chem. Phys., 10, 2561–2576, https://doi.org/10.5194/acp-10-2561-2010, 2010. a
Sinyuk, A., Dubovik, O., Holben, B., Eck, T. F., Breon, F.-M., Martonchik, J., Kahn, R., Diner, D. J., Vermote, E. F., Roger, J.-C., Lapyonok, T., and Slutsker, I.: Simultaneous retrieval of aerosol and surface properties from a combination of AERONET and satellite data, Remote Sens. Environ., 107, 90–108, https://doi.org/10.1016/j.rse.2006.07.022, 2007. a
Sivakumar, M. V.: Impacts of Sand Storms/Dust Storms on Agriculture, in: Natural Disasters and Extreme Events in Agriculture: Impacts and Mitigation, edited by: Sivakumar, M. V., Motha, R. P., and Das, H. P., 159–177, Springer Berlin Heidelberg, Berlin, Heidelberg, https://doi.org/10.1007/3-540-28307-2_10, 2005. a
Slingo, A., Ackerman, T. P., Allan, R. P., Kassianov, E. I., McFarlane, S. A., Robinson, G. J., Barnard, J. C., Miller, M. A., Harries, J. E., Russell, J. E., and Dewitte, S.: Observations of the impact of a major Saharan dust storm on the atmospheric radiation balance, Geophys. Res. Lett., 33, L24817, https://doi.org/10.1029/2006GL027869, 2006. a
Sogacheva, L., Popp, T., Sayer, A. M., Dubovik, O., Garay, M. J., Heckel, A., Hsu, N. C., Jethva, H., Kahn, R. A., Kolmonen, P., Kosmale, M., de Leeuw, G., Levy, R. C., Litvinov, P., Lyapustin, A., North, P., Torres, O., and Arola, A.: Merging regional and global aerosol optical depth records from major available satellite products, Atmos. Chem. Phys., 20, 2031–2056, https://doi.org/10.5194/acp-20-2031-2020, 2020. a
Solomos, S., Kalivitis, N., Mihalopoulos, N., Amiridis, V., Kouvarakis, G., Gkikas, A., Binietoglou, I., Tsekeri, A., Kazadzis, S., Kottas, M., Pradhan, Y., Proestakis, E., Nastos, P. T., and Marenco, F.: From tropospheric folding to Khamsin and Foehn winds: How atmospheric dynamics advanced a record-breaking dust episode in Crete, Atmosphere, 9, 240, https://doi.org/10.3390/atmos9070240, 2018. a
Stefanski, R. and Sivakumar, M. V. K.: Impacts of sand and dust storms on agriculture and potential agricultural applications of a SDSWS, IOP C. Ser. Earth Env., 7, 012016, https://doi.org/10.1088/1755-1307/7/1/012016, 2009. a
Tegen, I. and Lacis, A. A.: Modeling of particle size distribution and its influence on the radiative properties of mineral dust aerosol, J. Geophys. Res.-Atmos., 101, 19237–19244, https://doi.org/10.1029/95JD03610, 1996. a
Tegen, I., Lacis, A. A., and Fung, I.: The influence on climate forcing of mineral aerosols from disturbed soils, Nature, 380, 419–422, https://doi.org/10.1038/380419a0, 1996. a
Tsikerdekis, A., Schutgens, N. A. J., and Hasekamp, O. P.: Assimilating aerosol optical properties related to size and absorption from POLDER/PARASOL with an ensemble data assimilation system, Atmos. Chem. Phys., 21, 2637–2674, https://doi.org/10.5194/acp-21-2637-2021, 2021. a
UNCCD: Sand and Dust Storms Compendium: Information and Guidance on Assessing and Addressing the Risks, United Nations Convention to Combat Desertification, Bonn, Germany, https://www.unccd.int/resources/publications/sand-and-dust-storms-compendium-information-and-guidance-assessing-and (last access: 30 March 2023), 2022. a
Wei, J., Li, Z., Peng, Y., and Sun, L.: MODIS Collection 6.1 aerosol optical depth products over land and ocean: validation and comparison, Atmos. Environ., 201, 428–440, https://doi.org/10.1016/j.atmosenv.2018.12.004, 2019. a
Weinzierl, B., Sauer, D., Minikin, A., Reitebuch, O., Dahlkötter, F., Mayer, B., Emde, C., Tegen, I., Gasteiger, J., Petzold, A., Veira, A., Kueppers, U., and Schumann, U.: On the visibility of airborne volcanic ash and mineral dust from the pilot's perspective in flight, Phys. Chem. Earth, 45–46, 87–102, https://doi.org/10.1016/j.pce.2012.04.003, 2012. a
WHO: WHO global air quality guidelines: particulate matter (PM2.5 and PM10), ozone, nitrogen dioxide, sulfur dioxide and carbon monoxide, World Health Organization, https://apps.who.int/iris/handle/10665/345329 (last access: 30 March 2023), 2021. a
Winker, D. M., Vaughan, M. A., Omar, A., Hu, Y., Powell, K. A., Liu, Z., Hunt, W. H., and Young, S. A.: Overview of the CALIPSO mission and CALIOP data processing algorithms, J. Atmos. Ocean. Tech., 26, 2310–2323, https://doi.org/10.1175/2009JTECHA1281.1, 2009. a
WMO: Plan for the implementation of the GAW Aerosol LIdar Observation Network (GALION), Tech. Rep. WMO/TD-No. 1443, GAW Report-No. 178, WMO, Hamburg, Germany, https://library.wmo.int/doc_num.php?explnum_id=9387 (last access: 30 March 2023), 2007. a
Yu, H., Chin, M., Yuan, T., Bian, H., Remer, L. A., Prospero, J. M., Omar, A., Winker, D., Yang, Y., Zhang, Y., Zhang, Z., and Zhao, C.: The fertilizing role of African dust in the Amazon rainforest: A first multiyear assessment based on data from Cloud-Aerosol Lidar and Infrared Pathfinder Satellite Observations, Geophys. Res. Lett., 42, 1984–1991, https://doi.org/10.1002/2015GL063040, 2015. a
Yu, H., Tan, Q., Zhou, L., Zhou, Y., Bian, H., Chin, M., Ryder, C. L., Levy, R. C., Pradhan, Y., Shi, Y., Song, Q., Zhang, Z., Colarco, P. R., Kim, D., Remer, L. A., Yuan, T., Mayol-Bracero, O., and Holben, B. N.: Observation and modeling of the historic “Godzilla” African dust intrusion into the Caribbean Basin and the southern US in June 2020, Atmos. Chem. Phys., 21, 12359–12383, https://doi.org/10.5194/acp-21-12359-2021, 2021. a
Yumimoto, K., Tanaka, T. Y., Oshima, N., and Maki, T.: JRAero: the Japanese Reanalysis for Aerosol v1.0, Geosci. Model Dev., 10, 3225–3253, https://doi.org/10.5194/gmd-10-3225-2017, 2017. a
Zender, C. S., Miller, R. L. L., and Tegen, I.: Quantifying mineral dust mass budgets:Terminology, constraints, and current estimates, EOS T. Am. Geophys. Un., 85, 509–512, https://doi.org/10.1029/2004EO480002, 2004. a
- Abstract
- Introduction
- Datasets and methodology
- Satellite-derived dust product intercomparison with AERONET
- MONARCH reanalysis assessment
- Conclusions
- Appendix A: Evaluation metrics
- Data availability
- Author contributions
- Competing interests
- Disclaimer
- Special issue statement
- Acknowledgements
- Financial support
- Review statement
- References
- Supplement