the Creative Commons Attribution 4.0 License.
the Creative Commons Attribution 4.0 License.
 | 16 May 2023
Understanding day–night differences in dust aerosols over the dust belt of North Africa, the Middle East, and Asia
Qinjian Jin
Utilizing the well-calibrated, high-spectral-resolution equal-quality performance of daytime and nighttime (09:30 and 21:30 local solar Equator-crossing time (local solar ECT)) products of the Infrared Atmospheric Sounder Interferometer (IASI) from the Laboratoire de Météorologie Dynamique (LMD), this study investigates the day–night differences in dust aerosols over the global dust belt of North Africa, the Middle East, and Asia. Both daytime dust optical depth (DOD) and nighttime DOD at 10 µm show high consistency with solar and lunar observations of coarse-mode aerosol optical depth (CAOD) from AErosol RObotic NETwork (AERONET) sites across the dust belt, with correlation coefficients of 0.8–0.9 for most sites. Both IASI DOD and dust layer height show a significant (95 % confidence level) day–night difference over the major dust sources within the dust belt. Daytime DOD over the central to northern Sahara, the central to eastern Arabian Peninsula, and the Taklamakan Desert is significantly higher than that of nighttime but lower than nighttime over the southern Sahel to the Guinea Coast and the western to central Indian subcontinent in the annual mean. The magnitude of the day–night differences in DOD is larger and more evident in boreal winter and spring than in other seasons. The positive day–night differences in DOD (i.e., higher daytime values than nighttime) over the central Sahara, the Middle East, and Asia are likely associated with greater dust emissions driven by higher dust uplift potential (DUP) and stronger wind speeds during daytime. Dust layer heights demonstrate negative day–night differences over dust source regions in the central Sahara, central Arabian Peninsula, and Taklamakan Desert and positive height differences in the southern Sahel to the Guinea Coast, southern parts of the Arabian Peninsula, and large parts of the Indian subcontinent. The higher dust layer height over the Guinea Coast and the Indian subcontinent during the daytime is associated with a deeper planetary boundary layer height and greater convective instability during daytime than nighttime, which promotes vertical transport and mixing of dust aerosols. The corresponding lower daytime DOD over the Sahel and the Indian subcontinent indicates a possible dilution of dust aerosols when they are transported to higher altitudes by convection where they are more susceptible to horizontal transport.
Ground-based observations of dust show surface PM10 concentration and CAOD exhibit a spatially varying diurnal cycle across the dust belt. CAOD and PM10 concentrations generally peak in late morning and from late afternoon to midnight in the Sahel and in early afternoon and around early morning in the Middle East, the timings of which are largely consistent with the day–night differences in IASI DOD. It is also found that DOD from reanalysis products (e.g., Modern-Era Retrospective Analysis for Research and Applications, version 2 (MERRA-2) and ECMWF Atmospheric Composition Reanalysis 4 (EAC4)) failed to capture the day–night differences in IASI DOD in large parts of the dust belt except in small dust source hotspots over North Africa.
- Article
(22019 KB) - Full-text XML
-
Supplement
(4157 KB) - BibTeX
- EndNote


Mineral dust is one of the primary aerosol species in the atmosphere and forms an integral part of the climate system. It is produced by wind erosion in deserts, dry lake beds, and arid and semi-arid regions (Penner et al., 2001). The uplift of dust aerosols over source regions mostly occurs when the surface wind speed, which is also affected by land surface characteristics and vegetative cover, exceeds a suitable threshold (e.g., Fernandez-Partagas et al., 1986; Marsham et al., 2008; Pu et al., 2020). The global emission of dust aerosols is estimated to range between 1000 and 5000 Tg yr−1 with high spatiotemporal variability (e.g., Duce, 1995; Ginoux et al., 2001; Huneeus et al., 2011; Checa-Garcia et al., 2021). North Africa alone accounts for about 50 % of the global dust emissions (Schütz, 1980; D'Almeida, 1986; Tegen and Fung, 1994; Swap et al., 1996; Ginoux et al., 2012; Kok et al., 2021), followed by the Middle East and Asia contributing about 40 % of global dust emissions (Prospero et al., 2002; Goudie and Middleton, 2006; Tanaka and Chiba, 2006; Huneeus et al., 2011; Kok et al., 2021).
Dust aerosol impacts the atmospheric radiative balance directly by dust–radiation interactions and indirectly by dust–cloud interactions, with the latter being one of the largest sources of uncertainties in modeling aerosol effects in global climate change (Forster et al., 2007; Haywood et al., 2005; Mahowald et al., 2010; Yan et al., 2015; Adebiyi and Kok, 2020). The radiative effect of dust refers to its scattering and absorption of incoming shortwave and outgoing longwave radiation, as well as thermal infrared (IR) emissions, consequently affecting regional climate, e.g., African and Indian monsoon systems (Miller and Tegen, 1998; Li et al., 2004; Mahowald et al., 2010; Jin et al., 2014, 2021) and tropical cyclones in the North Atlantic (Karyampudi and Carlson, 1988; Dunion and Velden, 2004; Wong and Dessler, 2005; Strong et al., 2018). Dust aerosols can also modify the macro- and micro-physical properties of clouds by serving as cloud condensation and ice nuclei, namely aerosol–cloud interactions that can further interact with the hydrological cycle (Levin et al., 1996; Rosenfield et al., 1997; Nakajima et al., 2001; DeMott et al., 2003; Bangert et al., 2012). When dust aerosols are deposited into the ocean and land, they provide nutrients such as phosphorus, iron, and nitrogen to continental and maritime ecosystems (Duce and Tindale, 1991; Mills et al., 2004; Okin et al., 2004). For instance, African dust has been found to influence ecosystems in the Amazon Basin (Swap et al., 1992; Bristow et al., 2010; Yu et al., 2015) and the Atlantic Ocean (Jickells et al., 2005; Mahowald et al., 2010).
Quantifying the climatic impacts of dust requires accurate and detailed information on their spatial and temporal distributions. In addition to seasonal, interannual, and decadal timescales of variability, the diurnal variation in dust aerosols is also an important aspect that has been explored by many works. Past studies have revealed significant diurnal variabilities in dust loading over the dust belt (Wang et al., 2004; Schepanski et al., 2009; Fiedler et al., 2013; Heinold et al., 2013; Kocha et al., 2013; Osipov et al., 2015; Yu et al., 2016; Chédin et al., 2020; Yu et al., 2021). For example, in North Africa, pronounced dust emissions during morning hours are found to be associated with the breaking down of the nocturnal low-level jets (e.g., Engelstaedter et al., 2006; Todd et al., 2008; Tulet et al., 2010; Knippertz and Todd, 2012) and in the late afternoon period as a result of mesoscale convective systems that generate dust emissions at the leading edge of density currents (Flamant et al., 2007; Marsham et al., 2008; Todd et al., 2008; Knippertz and Todd, 2012). Satellite observations and regional model simulations in western Africa showed a well-marked diurnal variability in dust associated with a rising planetary boundary layer maximizing at about 15:00 coordinated universal time (UTC; about 16:00 local solar time (LST)) (Chaboureau et al., 2007). Using the 15 min Meteosat Second Generation (MSG) Spinning Enhanced Visible and Infrared Imager (SEVIRI) satellite product, Schepanski et al. (2009) found about 65 % of the dust source activation in the Sahara occurring between 06:00 and 09:00 UTC (about 05:00–10:00 LST at the western and eastern boundaries of the Sahara).
In the Middle East, summertime dust emissions are primarily caused by the strong, persistent shamal winds which maximize around local noon over the Iraqi desert (Yu et al., 2016). Around the Gobi and Taklamakan deserts in Asia, dust emissions in spring to early summer show a diurnal change of more than ±10 % in aerosol optical depth (AOD) and ±30 % in the Angström exponent, with larger AOD and smaller Angström exponent values in the late afternoon (Wang et al., 2004). Smirnov et al. (2002) showed an increase of AOD by 10 %–40 % during the daytime over many AErosol RObotic NETwork (AERONET) sites in North Africa and Asia and a smaller diurnal variability range over regions where dust aerosol contributed largely to the total AOD. By analyzing aerosol extinction and typing profiles from the Cloud–Aerosol Transport System (CATS) lidar on a global scale, Yu et al. (2021) identified significant daytime and nighttime variations in dust and dust mixture loading over the major dust sources in North Africa, as well as western and southern North America.
However, observations of the full diurnal cycle of dust with a global coverage are still lacking. Ground-based instruments such as AERONET (Holben et al., 1998; O'Neill et al., 2003) and the Laboratoire Interuniversitaire des Systèmes Atmosphériques (LISA) stations over the Sahel (Marticorena et al., 2010) have high temporal resolutions (∼5–15 min for AERONET and hourly for LISA) but with low spatial coverage. On the other hand, while satellite products have much higher spatial resolutions and coverage, polar-orbiting instruments have a low temporal resolution, i.e., observations twice daily. Moreover, most of these instruments (both satellite and ground based) sample dust aerosols based on the measurement of radiance in the visible bands, making it difficult to observe dust events in the nighttime and thereby missing out on some important characteristics of dust. For instance, widely used products, such as the Moderate Resolution Imaging Spectroradiometer (MODIS) on board both the Terra and Aqua satellites and the Multi-angle Imaging SpectroRadiometer (MISR; Diner et al., 1998) on board the Terra satellite retrieve AOD once per day only in visible wavelengths. Observations from lidar instruments such as the Cloud–Aerosol Lidar with Orthogonal Polarization (CALIOP; Winker et al., 2009) provide vertically resolved aerosol extinction and clouds for snapshots during both daytime (13:30 local solar ECT) and nighttime (01:30 local solar ECT). However, CALIOP has two significant drawbacks when it is used to study day–night differences in dust optical depth (DOD): (1) a lower signal-to-noise ratio during the daytime than nighttime, making it less sensitive to daytime observations (Liu et al., 2009) and less reliable to directly compare its daytime and nighttime products, and (2) a narrow horizontal swath of 5 km and a 16 d repeat cycle, which means there is only one daily observation (afternoon or night) at a specific location; thus no day–night differences of DOD can be retrieved at the daily timescale. The SEVIRI instrument (Schmetz et al., 2002; Schepanski et al., 2007, 2009) aboard the Meteosat Second Generation satellite, which is a geostationary satellite located at 3.5∘ W above the Equator, provides dust observations from infrared (IR) channels every 15 min. However, this product mainly covers Africa and the Arabian Peninsula. The above challenges are partly addressed by the Infrared Atmospheric Sounder Interferometer (IASI; Chalon et al., 2001; Blumstein et al., 2004).
The IASI sensor on board the European Meteorological Operational satellite (MetOP) provides retrievals of dust optical depth (DOD) and dust layer height at IR bands twice per day (09:30 and 21:30 local solar ECT) at a global scale (Chalon et al., 2001; Klüser et al., 2013; Peyridieu et al., 2013; Capelle et al., 2014, 2018), facilitating the study of day–night variations in dust aerosols. Additionally, coarse-mode dust aerosols (e.g., radius > 1 µm) are more sensitive to infrared (IR) radiation than visible due to their large particle size, so they are preferentially retrieved in IR bands (Peyridieu et al., 2013; Capelle et al., 2018). IASI has fine spectral and spatial resolutions of 0.5 cm−1 and 12 km at nadir, respectively, and shows high quality in capturing the spatiotemporal variability in dust (Hewison et al., 2013) in comparison to ground measurements from AERONET (Capelle et al., 2014, 2018). The observation time of IASI generally coincides with the two dominant dust-generation mechanisms in North Africa and the breaking down of the nocturnal low-level jets in the early morning hours and mesoscale convective systems in the late afternoon and early evening period (Engelstaedter et al., 2006; Washington et al., 2006; Knippertz and Todd, 2012; Chédin et al., 2020). One important advantage of IASI is its equal-quality performance for daytime and nighttime observations (Hewison et al., 2013; Chédin et al. 2020), making it suitable to compare daytime and nighttime variability of dust. The data have been used to study characteristics of dust in the Sahara (Chédin et al., 2018, 2020; H. Yu et al., 2019) and over global oceans (Zheng et al., 2022).
In this work, we use the IASI DOD and dust layer height products from the Laboratoire de Météorologie Dynamique (LMD; Capelle et al., 2018) together with ground-based observations from AERONET and LISA sites (Berkoff et al., 2011; Holben et al., 1998; Marticorena et al., 2010) to understand the daytime and nighttime variability in dust aerosols over the dust belt of North Africa, the Middle East, and East Asia (Fig. 1). Aerosol reanalysis products, such as the Modern-Era Retrospective Analysis for Research and Applications (MERRA-2; Gelaro et al., 2017a; Randles et al., 2017) and the ECMWF Atmospheric Composition Reanalysis 4 (EAC4; Inness et al., 2019), which are widely used in model validation and case studies (e.g., Grandey et al., 2013; Carmona et al., 2020; Isaza et al., 2021), as they assimilate the total AOD from satellite products while providing high spatial and temporal coverage of dust distribution, are employed for comparative purposes with IASI results. We will examine whether these aerosol reanalysis products capture the day–night variations in dust shown in satellite products. Lastly, we will examine the meteorological conditions that contribute to the observed day–night variabilities in dust aerosols. Section 2 describes the study domain and introduces the datasets and data analysis techniques. Results are presented in Sect. 3, and uncertainties are discussed in Sect. 4. Major findings are summarized in Sect. 5.
2.1 Study domain
In this paper, we focus on the dust belt extending from North Africa through the Middle East and Central Asia to the deserts in western East Asia (Fig. 1). The Saharan dust belt (largely over 0–35∘ N, 16∘ W–25∘ E) is the world's largest source of aeolian desert dust aerosols, with annual emissions of 400–700 × 106 t of dust aerosols (D'Almeida, 1986; Schütz, 1980; Swap et al., 1996). There are two major dust sources within the Sahara – the Bodélé Depression in Chad and an area covering eastern Mauritania, western Mali, and southern Algeria (e.g., Middleton and Goudie, 2001; Schepanski et al., 2007; Ginoux et al., 2012; Yu et al., 2018).
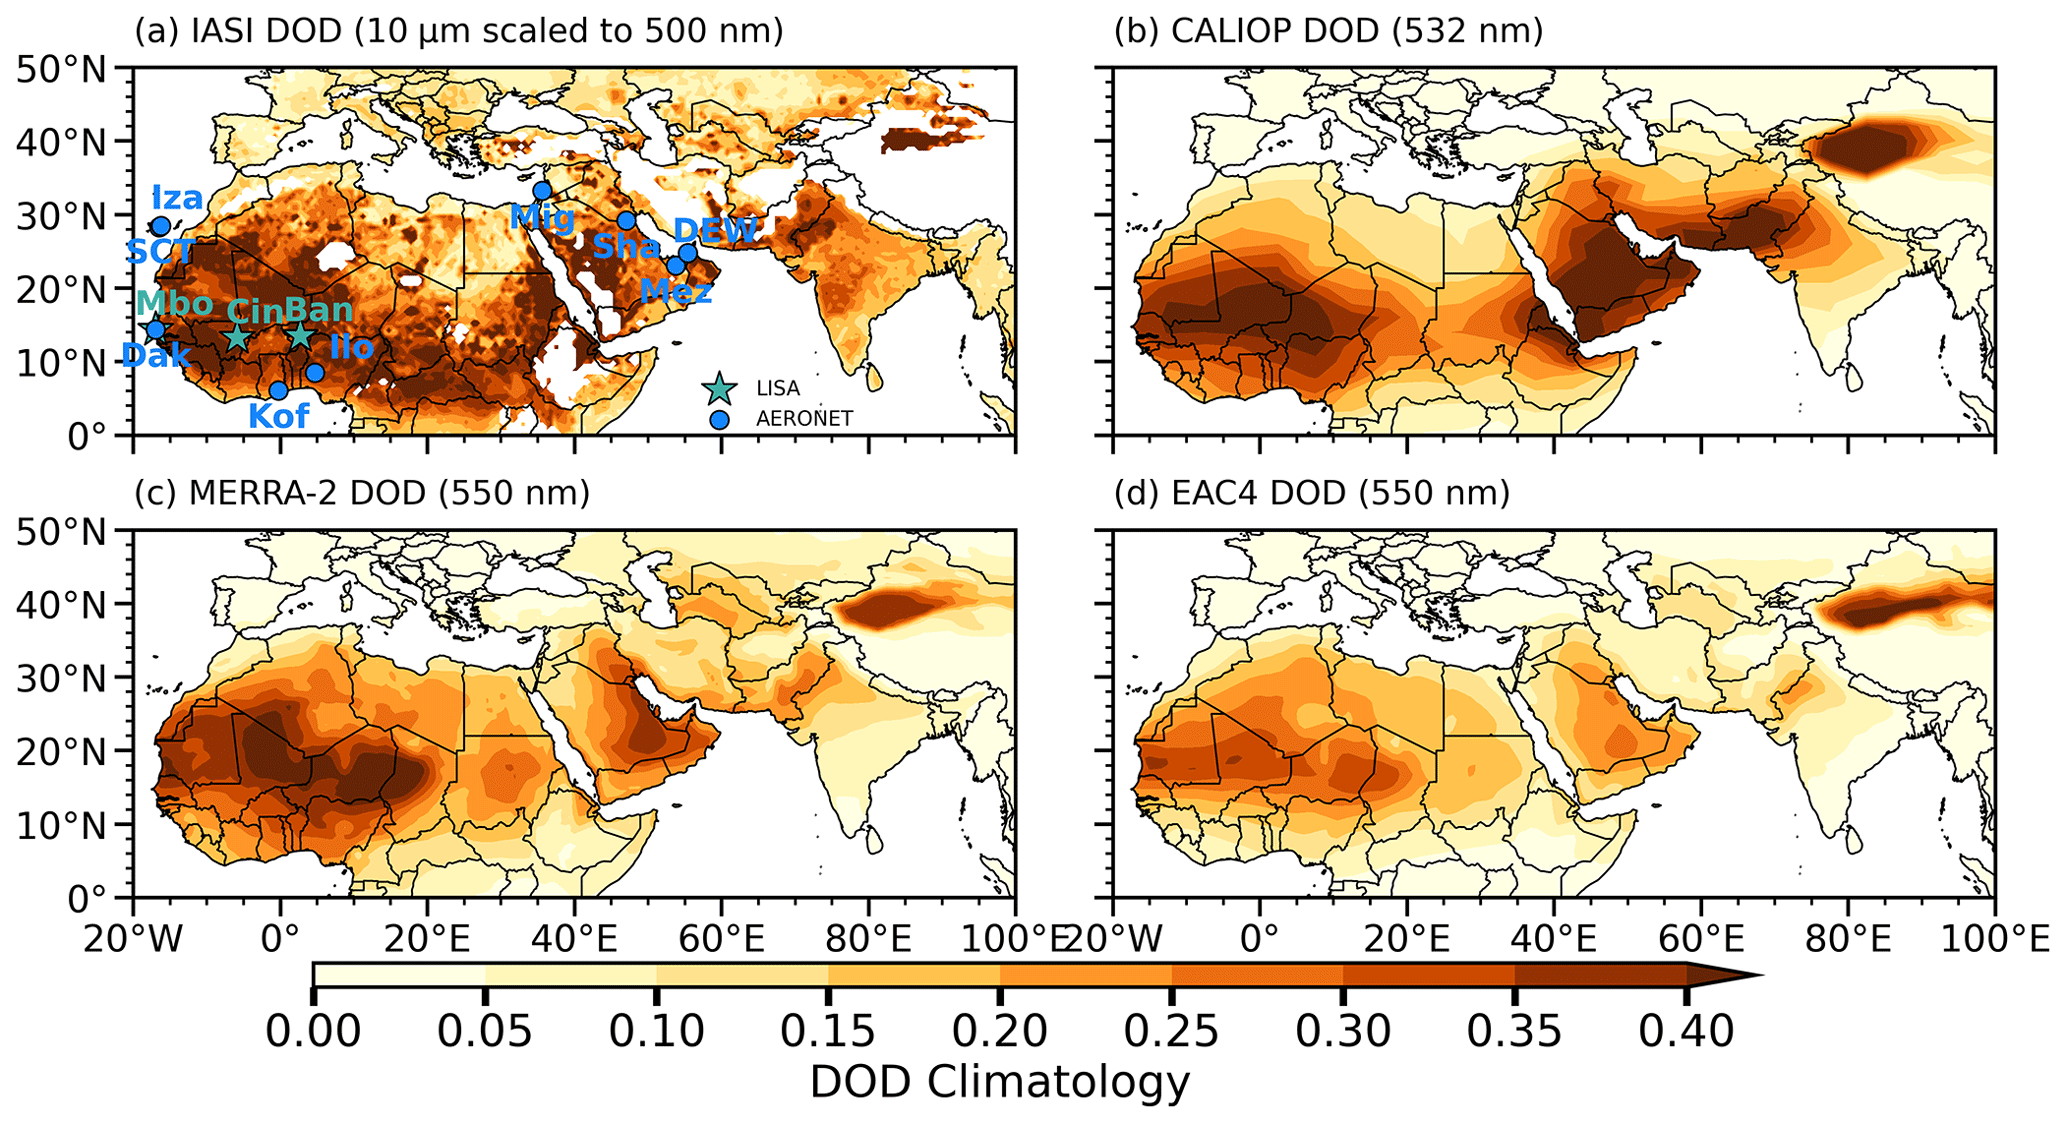
Figure 1Climatology (2008–2020) of DOD from (a) IASI (LMD version), (b) CALIOP, (c) MERRA-2, and (d) EAC4. The blue dots denote AERONET sites with both solar and lunar data that are used to examine day–night differences in coarse-mode AOD (CAOD). The cyan stars represent LISA sites. Note that IASI DOD in (a) represents the climatology of average daytime and nighttime DOD and is scaled from 10 µm infrared (IR) to 500 nm visible wavelength (VIS) using an IR VIS ratio of 0.60 (see text for details). Note that CALIOP data are up to July 2020.
The Middle East dust belt (roughly 13–38∘ N, 25–60∘ E) is the world's second largest dust source (Prospero et al., 2002; Goudie and Middleton, 2006; Huneeus et al., 2011; Kok et al., 2021). The Middle East and South Asian dust sources cover Sudan, the Arabian Peninsula, parts of Iran and Afghanistan, and Pakistan (Rezazadeh et al., 2013; Ginoux et al., 2012; Yu et al., 2018). The East Asian dust belt (25–50∘ N, 60–130∘ E) mainly includes the Taklamakan and the Gobi deserts (Prospero et al., 2002; Zhang et al., 2003; Ginoux et al., 2012) and is estimated to account for about 3 %–11 % of global dust emissions (Tanaka and Chiba, 2006). We did not consider the Gobi in our analysis due to a large area of missing data in IASI.
2.2 Datasets
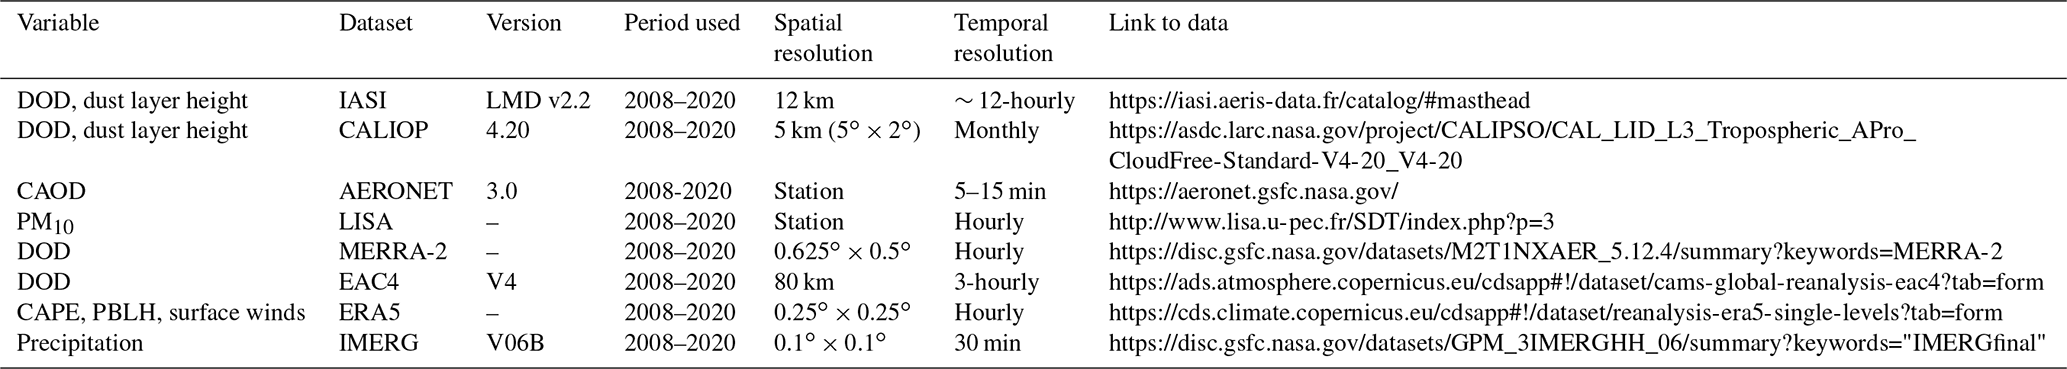
This study mainly uses the 10 µm DOD retrieved from IASI (LMD version) as the primary dataset to understand the day–night differences in DOD and dust plume layer height in the dust belt, along with ground-based observations. Results from IASI are compared with aerosol products from reanalyses. Meteorological variables from reanalysis and stations are used to examine their influences on the day–night differences in dust aerosols. All the datasets used in this study are summarized in Table 1.
Table 1Summary of datasets and variables used in this study.
All links were accessed on 25 April 2023.
2.2.1 LMD IASI
IASI is a high-spectral-resolution thermal infrared Fourier transform spectrometer (Chalon et al., 2001; Blumstein et al., 2004) on board MetOP-A, MetOP-B, and MetOP-C satellites. It measures radiance over 8641 spectral channels extending from 645 to 2760 cm−1 with a spectral resolution of 0.5 cm−1 after apodization. It has a ground resolution of 12 km at nadir. On board MetOP-A at an altitude of about 800 km, IASI observes Earth at an angle of up to 48.5∘ perpendicular to both sides of the satellite track. This corresponds to a swath width of ∼ 2200 km, leading to an approximate global coverage in 12 h. The satellite has a local solar ECT of approximately 09:30 and 21:30 and is available from July 2007 to October 2021 as of January 2023. MetOP-B was launched in September 2012 and has been operational since February 2013, while MetOP-C was launched in November 2018 and has been providing data since 2019. With the retirement of MetOP-A in November 2021, MetOP-B and MetOP-C will continue providing data. The three IASI instruments are expected to provide continuous measurements of up to a total of 15 years.
Due to its wide spectrum in longwave range and fine spectral resolution, IASI is widely used to retrieve atmospheric compositions (Clerbaux et al., 2009; Bauduin et al., 2016) during both daytime and nighttime. While several retrieval algorithms are available for IASI DOD and dust layer height (e.g., Callewaert et al., 2019; Clarisse et al., 2019), we use the retrieval from LMD (Peyridieu et al., 2013; Capelle et al., 2018), as it provides global retrievals of both DOD and dust layer height. IASI dust products show good consistency with ground observations (Peyridieu et al., 2013; Capelle et al., 2014, 2018; Zheng et al., 2022) and good performance in comparison with other IASI DOD retrievals (Klüser et al., 2016). LMD IASI has already been used to study characteristics of dust in the Sahara (Chédin et al., 2018, 2020). The publicly available level-2 data also allow us to validate and compare with ground observations in our study domain and to interpolate the data to a reasonably high spatial resolution (i.e., 0.5∘ × 0.5∘) to facilitate our study. LMD IASI dusty and cloudy pixels are distinguished using a cloud mask based on nine screening tests consisting of infrared observations from both IASI and the Advanced Microwave Sounding Unit (AMSU) at the same time and locations over the globe (Capelle et al., 2018). The retrieval of DOD and dust layer height from IASI cloud-free observations is based on an iterative two-step approach using different look-up tables (Peyridieu et al., 2013; Capelle et al., 2018). The first step determines the atmospheric state using 18 IASI channels, and the second step is the retrieval of the 10 µm DOD, dust layer mean altitude, and surface temperature, simultaneously using the algorithm similar to that which was originally applied to the Atmospheric Infrared Sounder (AIRS; Peyridieu et al., 2010). Here, the level-2 (version 2.2) daily 10 µm DOD and dust layer height at 09:30 and 21:30 local solar ECT (hereafter referred to as daytime and nighttime, respectively) are used and regridded into a 0.5∘ by 0.5∘ grid from January 2008 to December 2020. Dust layer height in the dataset is defined as the height at which half of the DOD is found above and the other half below (Peyridieu et al., 2013; Capelle et al., 2018; Chédin et al., 2020).
2.2.2 CALIOP
CALIOP is a spaceborne two-wavelength polarization lidar on board the Cloud–Aerosol Lidar and Infrared Pathfinder Satellite Observation (CALIPSO) satellite. It has been providing high-resolution vertical profiles of global cloud and aerosol measurements since June 2006 (Winker et al., 2009). CALIOP is a nadir-viewing instrument which has a very narrow swath width i.e., a beam diameter of 70 m at the Earth's surface corresponding to a 16 d repetition cycle with an instantaneous field of view approximately 300 and 70 m. Level-3 cloud-free monthly at 532 nm and with a dust layer height on a 5∘ × 2∘ grid from 2008 to 2020 are used to compare with IASI. Note that because of the high altitude and modest power aperture of CALIOP, its daytime product has an extremely low signal-to-noise ratio (Winker et al., 2017), making a direct comparison between daytime and nighttime products less reliable. Moreover, due to its narrow swath width, no day–night difference can be calculated at the daily timescale. To compare with the IASI dust layer height, we analyzed the dust altitude from CALIOP by calculating the mean of the highest and lowest dust aerosol layer detected.
2.2.3 AERONET
AERONET is a ground-based sun photometer aerosol-observation network established by the National Aeronautics and Space Administration (NASA) and the PHOtométrie pour le Traitement Opérationnel de Normalisation Satellitaire (PHOTONS), which measures atmospheric aerosol properties globally (Holben et al., 1998). The sun photometers perform measurements of solar irradiance in eight spectral bands (340, 380, 440, 500, 670, 870, 940, and 1020 nm) with a field of view of 1.2∘ in about every 5–15 min from 05:00 or 06:00 to 17:00 or 18:00 in UTC (depending on the site). The lunar photometers perform nocturnal measurements from 17:00 or 18:00 to 05:00 or 06:00 UTC with an approximate field of view of 1.29∘ at eight nominal wavelengths of 440, 500, 675, 870, 937, 938, 1020, and 1640 nm. The estimated uncertainty of AOD from direct solar radiation measurement is about 0.010–0.021 (wavelength dependent) (Eck et al., 1999).
We use version 3 level-2 (cloud-screened and quality-assured) spectral deconvolution algorithm (SDA; O'Neill et al., 2003) retrieval of the coarse-mode AOD (CAOD; Eck et al., 2010) around 500 nm to approximate DOD and compare with IASI DOD. It is important to note that the SDA algorithm of AERONET CAOD is sensitive to the presence of high clouds such as cirrus and may lead to overestimation of AERONET CAOD (Smirnov et al., 2018). Over coastal regions, CAOD may contain information from sea salt as well, with an estimated contribution of 0.05–0.10 (Spada et al., 2013; Clarisse et al., 2019). Level-2.0 data are not available at lunar sites, so level-1.5 data (cloud-screened but not quality-assured) are used.
For accurate comparison with IASI, several filtering steps are used to select the AERONET sites as shown in Figs. 1 and S1 and Tables 2–3. Firstly, only sites with a sample size greater than 3 years within the dust belt between 20∘ W–100∘ E and 0–36∘ N are selected. Secondly, following Capelle et al., (2018), SDA sites with higher root mean square errors (RMSEs) in CAOD (i.e., RMSE > 0.05 + 0.15 × CAOD) are removed. This criterion removed a few East Asian sites with low CAOD and high RMSEs. Validation of IASI daytime and nighttime DOD against AERONET solar and lunar retrievals is conducted at 46 sites for daytime and 11 sites for nighttime (Fig. 1 and Tables 2 and 3). The day–night difference analysis is carried out using sites with both solar and lunar data available on the same days after the filtering processes. Nine sites are found (blue dots in Fig. 1).
2.2.4 LISA
A network of three ground-based observations (shown as stars in Fig. 1), Banizoumbou (Niger, 13.54∘ N, 2.66∘ E), Cinzana (Mali, 13.28∘ N, 5.93∘ W), and M'Bour (Senegal; 14.39∘ N, 16.96∘ W), located on an east–west trajectory of the Saharan and Sahelian dust plumes (Sahelian dust transect), was deployed in the framework of the African Monsoon Multidisciplinary Analysis (AMMA, Redelsperger et al., 2006; Marticorena et al., 2010) international project in 2006. The stations monitor concentrations of surface particulate matter with an aerodynamic diameter ≤ 10 µm (PM10), which are mainly dust concentrations, and local meteorological conditions over the Sahel (Marticorena et al., 2010). All the data are maintained by the Laboratoire Interuniversitaire des Systèmes Atmosphériques (Interuniversity Laboratory of Atmospheric Systems; LISA) in the framework of the International Network to study Deposition and Atmospheric composition in Africa (INDAAF; Service National d'Observation de l'Institut National des Sciences de l'Univers, France). Hourly observations of PM10 concentrations and surface wind speed and precipitation from 2008 to 2020 are used to understand the day–night differences in dust aerosols and the potential impacts of meteorological conditions on the day–night differences.
2.2.5 Reanalysis datasets
We also compare DOD from MERRA-2 (Gelaro et al., 2017a; Randles et al., 2017) and EAC4 (Inness et al., 2019) global aerosol reanalysis datasets with IASI DOD. MERRA-2 is the first long-term (1980–present) reanalysis product in which aerosol and meteorological observations are jointly assimilated into global assimilation systems (Gelaro et al., 2017a). It assimilates AOD from MODIS on board Aqua and Terra, MISR, and the Advanced Very High Resolution Radiometer (AVHRR) as well as observations from AERONET (Gelaro et al., 2017a). EAC4 (Bozzo et al., 2017; Inness et al., 2019) is another aerosol reanalysis product we use in this study. It is produced using 4D-Var data assimilation in ECMWF's Integrated Forecast System (IFS) and assimilates remotely sensed AOD from Envisat's Advanced Along-Track Scanning Radiometer (AATSR) and MODIS from Aqua and Terra (Bozzo et al., 2017). Hourly DOD from MERRA-2 and 3-hourly DOD from EAC4 from 2008 to 2020 are used.
Meteorological variables such as hourly surface winds, vertical velocity at 850 hPa, convective available potential energy (CAPE), and planetary boundary layer height (PBLH) from ECMWF Reanalysis v5 (ERA5; Hersbach et al., 2020) from 2008 to 2020 are used in this study. Similar variables from MERRA-2 are also used for comparison purposes. Here, we resample the meteorological data at each grid point based on the IASI overpass time so that at each grid point the meteorological variables are at the same time as the IASI retrievals. For the full diurnal cycle, variables are shifted from UTC to local solar time (LST) based on the longitude of each AERONET site.
2.2.6 IMERG-GPM
Precipitation from the Integrated Multi-satellite Retrievals for Global Precipitation Measurements (IMERG; Huffman et al., 2015) from 2008 to 2020 is used to examine the impacts of precipitation on the day–night differences in dust aerosols over the dust belt. IMERG builds upon the legacy of the Tropical Rainfall Measuring Mission (TRMM) by providing high-quality estimates of global rainfall and snow for every 30 min at a 10 km spatial resolution. The Final Run product of IMERG (version V06B), which is calibrated with the Global Precipitation Climatology Centre (GPCC) reanalysis product, is used in this study. IMERG has been extensively validated against gauge, gridded, and satellite precipitation products over Africa (Dezfuli et al., 2017; Maranan et al., 2020; Ageet et al., 2022), the Middle East (Hosseini-Moghari and Tang, 2020; Arshad et al., 2021), and Asia (Huang et al., 2018; Kim et al., 2017; Lee et al., 2019). Though the performance of IMERG varies both spatially and temporally, it is shown by these studies to reasonably capture the observed precipitation over the dust belt. Some of the limitations of IMERG include large biases over mountainous areas (Huang et al., 2018), proneness to low-intensity false alarms, and overestimation of rainfall amount in weak convective systems over the western African forest zone (Maranan et al., 2020). We also resample precipitation from IMERG at each grid point based on the IASI overpass time, and for the full diurnal cycle, we shifted the data from UTC to LST.
2.3 Validation of IASI DOD against AERONET station observations
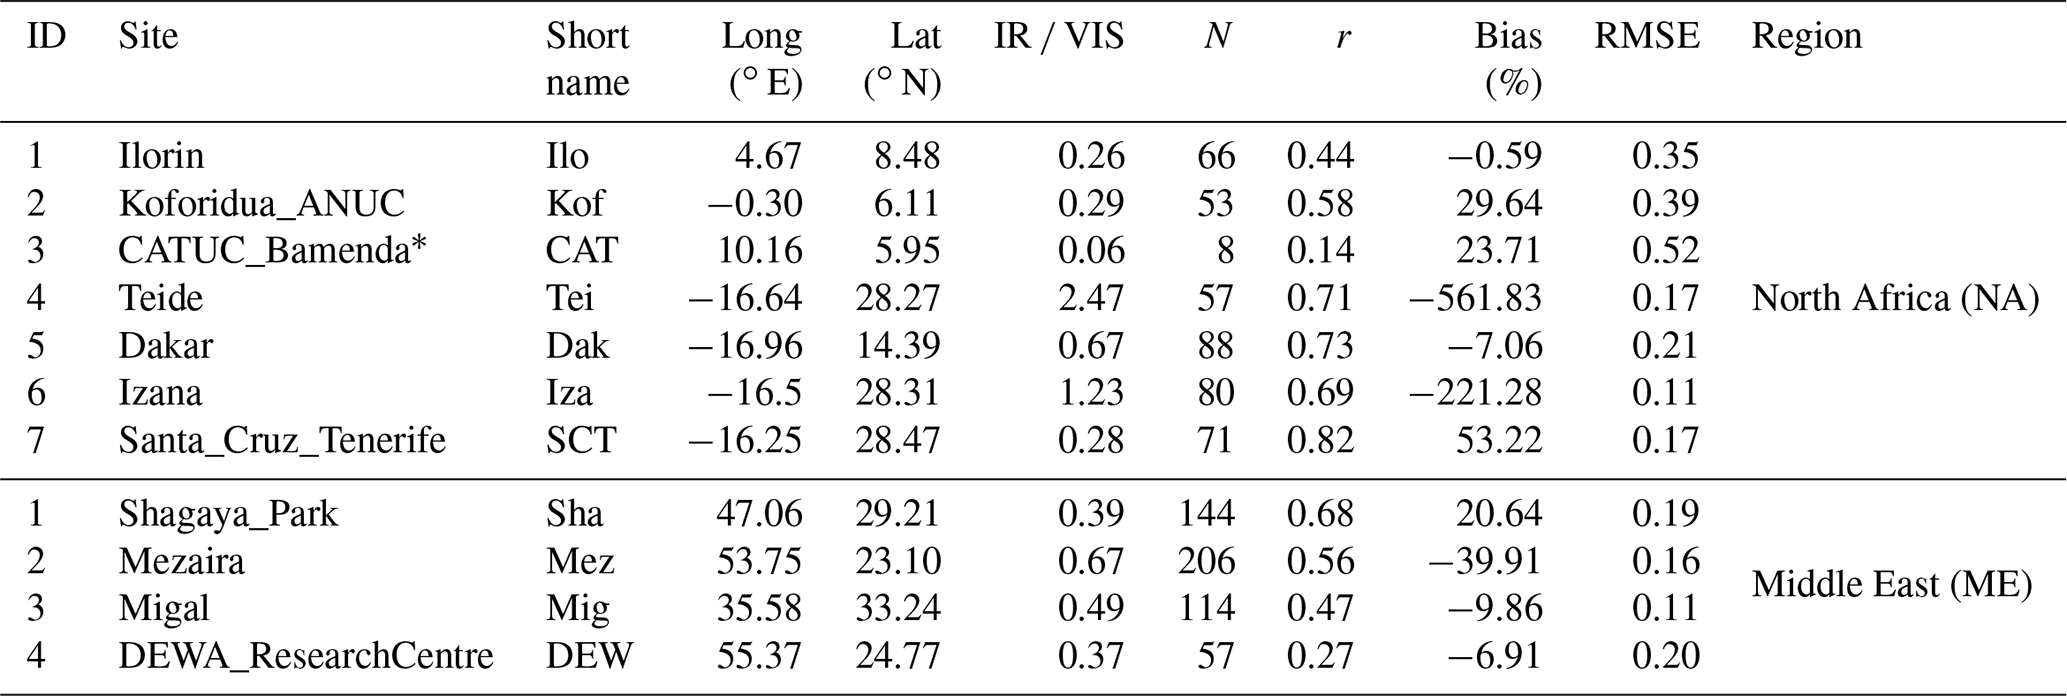
IASI daytime 10 µm DOD (LMD version) has been validated against AERONET solar CAOD by Capelle et al. (2014, 2018) at some selected AERONET sites over the land and ocean for 2007–2016. In this work, we extend the previous daytime validation by including nighttime retrievals over the dust belt and to a longer period from 2007 to 2020. To compare IASI DOD with AERONET CAOD, we first sample AERONET solar and lunar CAOD within ±30 min of the IASI overpass time and IASI DOD pixels within a radius of 30 km from the AERONET sites. In total, 22 462 and 944 AERONET–IASI matchups for daytime and nighttime, respectively, are used in this study. Next, we convert IASI DOD at 10 µm in the IR band to 500 nm in the visible band (VIS) to be consistent with AERONET CAOD at 500 nm. An accurate conversion requires detailed information of the refractive index, size distribution, and the effective radius of dust particles (Capelle et al., 2014), which are usually not available over a large domain. Previously, Peyridieu et al. (2013) and Capelle et al. (2014, 2018) compared IASI DOD with AERONET station data by scaling AERONET AOD (550 nm) or CAOD (500 nm) to the equivalent 10 µm DOD using an empirically determined IR VIS ratio at each AERONET site. Here, we follow a similar approach. At each AERONET station, the IR VIS ratio is determined by regressing AERONET CAOD onto IASI DOD, with the slope of the regression being the IR VIS ratio. However, the quality of such a linear fit depends on the sample size of IASI–AERONET collocations (Capelle et al., 2014). To prevent the ratios from being biased by the sample size, we exclude sites with fewer than 100 IASI–AERONET collocations for solar observations and 60 for lunar observations. Out of the 46 AERONET solar sites considered, only 5 sites (CATUC_Bamenda, Zinder_Airport, Banizoumbou, LAMTO-STATION, and NAM_CO) were excluded, whereas 4 out of the 11 lunar sites (Koforidua_ANUC, CATUC_Bamenda, Teide, and DEWA_ResearchCentre) were also excluded (see Tables 2 and 3). We found a mean IR VIS ratio of ∼ 0.62 ranging from 0.31 to 2.06 for solar measurements and ∼ 0.57 ranging from 0.26 to 1.23 for lunar observations. A constant IR VIS ratio of 0.60 (approximated by taking the mean of 0.62 for solar and 0.57 for lunar) is used to scale all IASI DOD from IR to VIS equivalent DOD at 500 nm for both data validation and the day–night difference analysis. Although the simple conversion method used here may lead to some uncertainties in the magnitude of the converted 500 nm IASI DOD, we found the calculated ratios to be largely within the range of empirically estimated IR VIS ratios by Peyridieu et al. (2013) and Capelle et al. (2014, 2018) and largely consistent with the VIS IR ratios used to convert IASI DOD (e.g., 1.54 by H. Yu et al., 2019, and 2.0 by Clarisse et al., 2019) for the conversion of IASI 10 µm DOD to 550 nm.
Table 2AERONET solar sites used in this study with their location and short names labeled on figures. Also shown are the infrared to visible conversion ratios (IR VIS) of each AERONET site for the solar measurements, the correlation coefficient (r) between IASI and AERONET CAOD at 500 nm, the number of IASI–AERONET collocated data points (N), relative bias (%), and root mean square error (RMSE). All the correlation coefficients pass the 95 % confidence level. The sites are divided into three broad regions of the dust belt: North Africa (NA), the Middle East (ME), and Asia (AS). Note that level-2 AERONET CAOD data are used for all solar sites except in Banizoumbou (Ban) and LAMTO-STATION (LAM) sites where level-1.5 data are used.
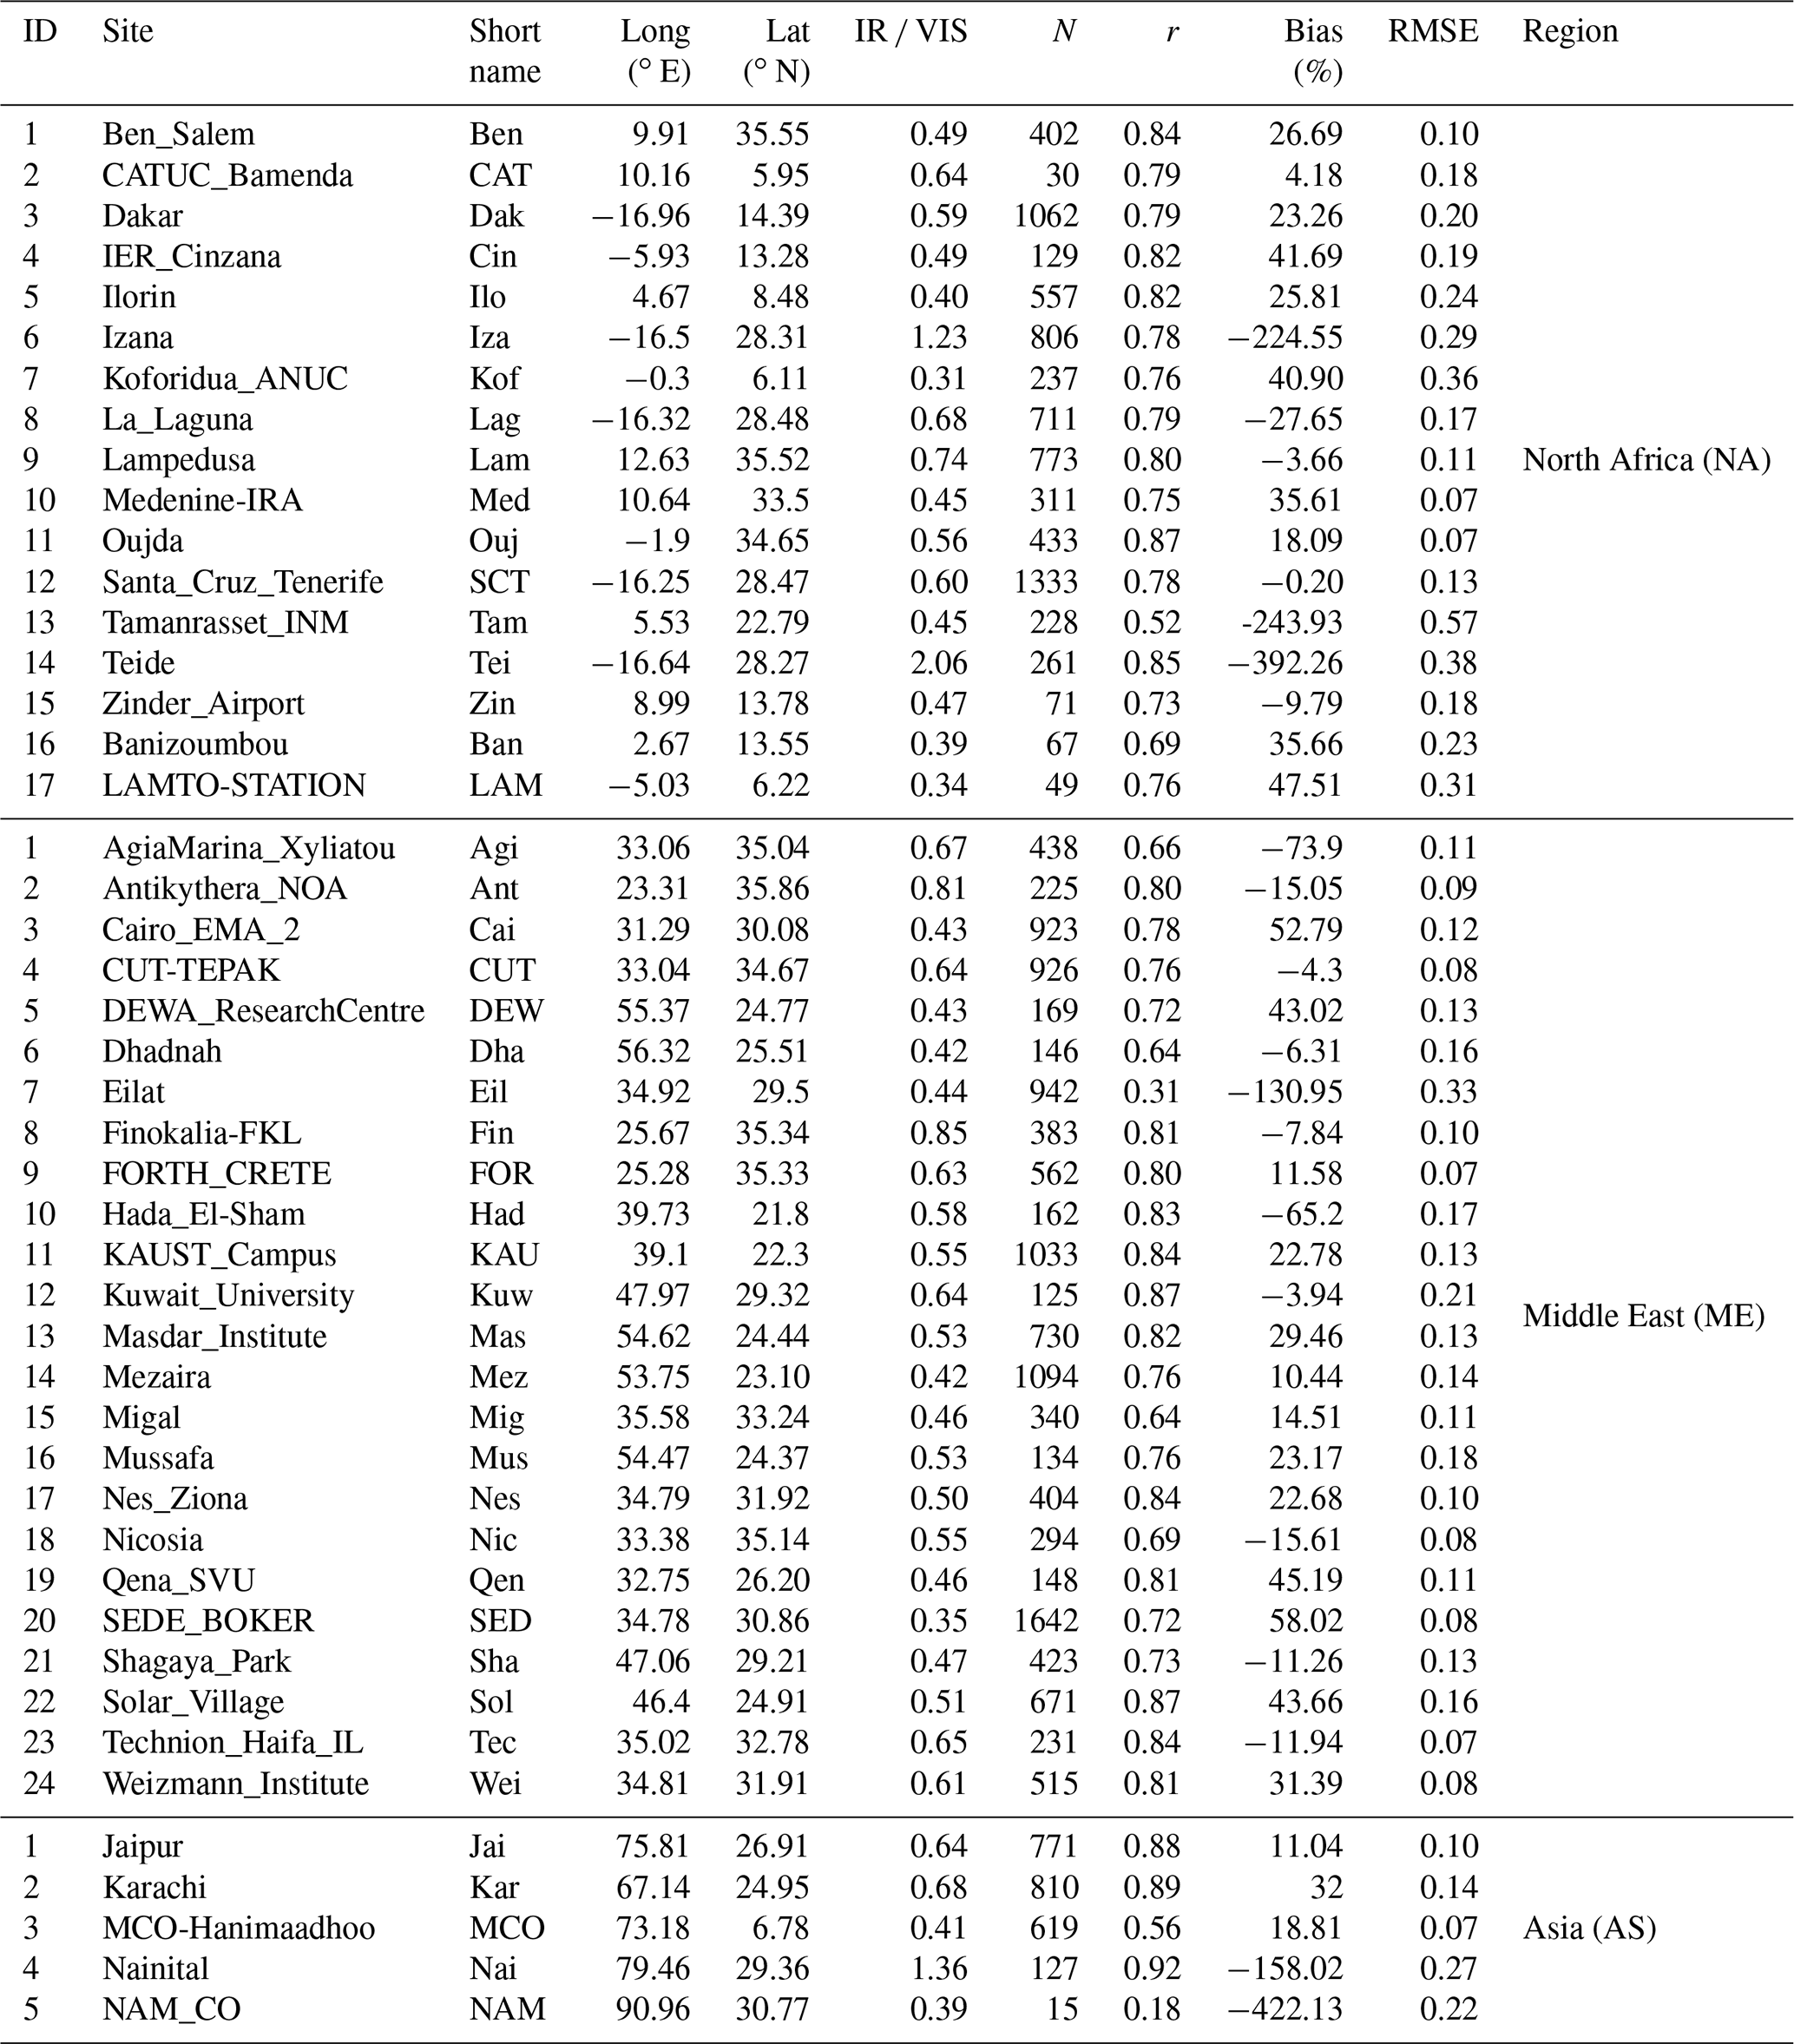
Table 3The same as Table 2 but for AERONET lunar measurements. Sites with an asterisk (*) denote an insignificant correlation coefficient at the 95 % confidence level.
3.1 Evaluation of daytime and nighttime IASI DOD against AERONET CAOD
We evaluate IASI daytime and nighttime DOD against AERONET ground observations before using the product to understand the day–night differences in dust aerosols over the dust belt. Such evaluations can be achieved by Taylor diagrams (Taylor, 2001). A Taylor diagram compares datasets in terms of three statistics i.e., the Pearson correlation coefficient between two datasets, the standard deviations, and the centered root mean square error (RMSE). Figure 2 shows normalized Taylor diagrams that compare IASI DOD (scaled to 500 nm using the average IR VIS ratio of 0.60) to AERONET CAOD (500 nm) for daytime (Fig. 2a) and nighttime (Fig. 2b) observations. The standard deviations and centered RMSEs of IASI DOD have been normalized by the standard deviation of AERONET CAOD (shown as REF). The results show IASI DOD is highly correlated with AERONET station observations with statistically significant (95 % confidence level) correlation coefficients ranging from 0.18–0.92 for solar sites and from 0.27–0.82 for lunar sites. The highest average correlation coefficient for solar data is observed in the Saharan and Sahelian dust belt with an average correlation coefficient of 0.77 ranging from as low as 0.52 in Tamanrasset (Tam) to as high as 0.87 in Oudjda (Ouj), followed by the Middle East sites with an average correlation coefficient of 0.75 ranging from 0.31 in Eilat (Eil) to 0.87 in Solar Village (Sol) and Kuwait University (Kuw). The performance of IASI over the Asian sites is highly variable with the lowest correlation coefficient of 0.18 at the NAM_CO (NAM) site to as high as 0.92 in Jaipur (Jai). The NAM site has the lowest sample size of IASI–AERONET collocations (N=15), and this may partly account for such a low correlation coefficient. These results are largely consistent with similar evaluations in past studies (Peyridieu et al., 2013; Capelle et al., 2014, 2018). However, we also notice underestimations of daytime DOD at a few sites, such as Eilat (Eil), with a weaker correlation coefficient of 0.36, a higher RMSE of 0.33, and a large negative bias of more than 100 % (see Table 2 and Fig. 2a). Similar large negative biases are also observed around other coastal sites over North Africa (e.g., Iza, Lag, and Tei), possibly due to the mixing of sea salt with dust aerosols and the complicated land surface conditions in the area leading to difficulties in DOD retrieval (Capelle et al., 2014, 2018). Similarly, nighttime DOD is also underestimated at Tei and Iza by more than 200 %

Figure 2Normalized Taylor diagrams for IASI DOD and AERONET CAOD at 500 nm during (a) daytime (09:30 local solar ECT) and (b) nighttime (21:30 local solar ECT). AERONET CAOD is sampled within ±30 min of the IASI overpass time, and IASI DOD is sampled within a radius of 30 km from each AERONET site. The grey dashed semi-circles show the normalized standard deviations, grey solid semi-circles denote the normalized centered RMSE, and the dashed radial lines represent the Pearson correlation coefficients. Sites are identified by their ID in Tables 2 (daytime) and 3 (nighttime), denoted by the number in the colored circles. Red, blue, and green denote sites in North Africa (NA), the Middle East (ME), and Asia (AS), respectively. Relative biases are denoted by triangles, with upward (downward) triangles indicating a positive (negative) bias. Sites with a normalized standard deviation greater than 2.0 are shown at the bottom of the Taylor diagram. Numbers above the black line are the normalized standard deviations and below are correlation coefficients.
The correlations over lunar sites are generally lower than solar sites (Fig. 2b). While over sites like Teide (Tei), Dakar (Dak), and Santa Cruz Tenerife (SCT) correlations between IASI DOD and AERONET CAOD are higher than 0.7, correlations over other sites are around 0.27–0.69. Note that the smaller correlation coefficient at CAT is insignificant and may be due to the complex topography of the area that makes IASI retrieval difficult, resulting in a smaller IASI–AERONET collocated sample size (N=8). Some sites over the Middle East (e.g., DEWA_Research_Centre (DEW) and Migal (Mig)) are also characterized by slightly lower nighttime correlation coefficients. The discrepancies between IASI DOD and AERONET CAOD records at sites over complex topographic regions (e.g., Iza with an altitude of ∼ 2.4 km) are also observed by Capelle et al. (2018), who attributed such lower correlations partially to the heterogeneity of the land surface or to rapid varying near-surface dust plumes that may reduce the sensitivity of infrared sounders. Reasons for the lower correlation in lunar data could range from the smaller sample size of lunar data to the quality of data used in the evaluation, which are cloud-screened but not quality-assured. In general, IASI DOD at sites around dust source regions is better correlated with AERONET CAOD than sites around regions where dust is transported from source regions (e.g., the southern Sahel) and worsened in areas characterized by complex terrains and pollutants from either biomass burning, industrial emissions, or coastal sediments (e.g., Eilat).
In addition to these Taylor diagrams, we further examined the relationship between IASI DOD and AERONET CAOD by combining all data points for daytime and nighttime measurements as shown in Fig. 3a–b. Consistent with the Taylor diagrams, the density scatterplots reveal a good performance of IASI DOD with an overall correlation coefficient of 0.7 for solar observations (Fig. 3a) and 0.57 for lunar measurements (Fig. 3b). These values are quite close to the average correlations over all solar sites in Table 2 (0.75) and all lunar sites in Table 3 (0.55). We also notice some overestimations of IASI DOD for small CAOD values (< 0.5) in both daytime and nighttime records (mainly over coastal sites such as Mez, Eil, and Dak in daytime and Mig and Mez in nighttime), which warrant future investigation. Overall, Figs. 2–3 show LMD IASI captures the spatiotemporal distribution of dust aerosols over the dust belt in both daytime and nighttime well and can therefore be used to understand the day–night variations in dust aerosols.
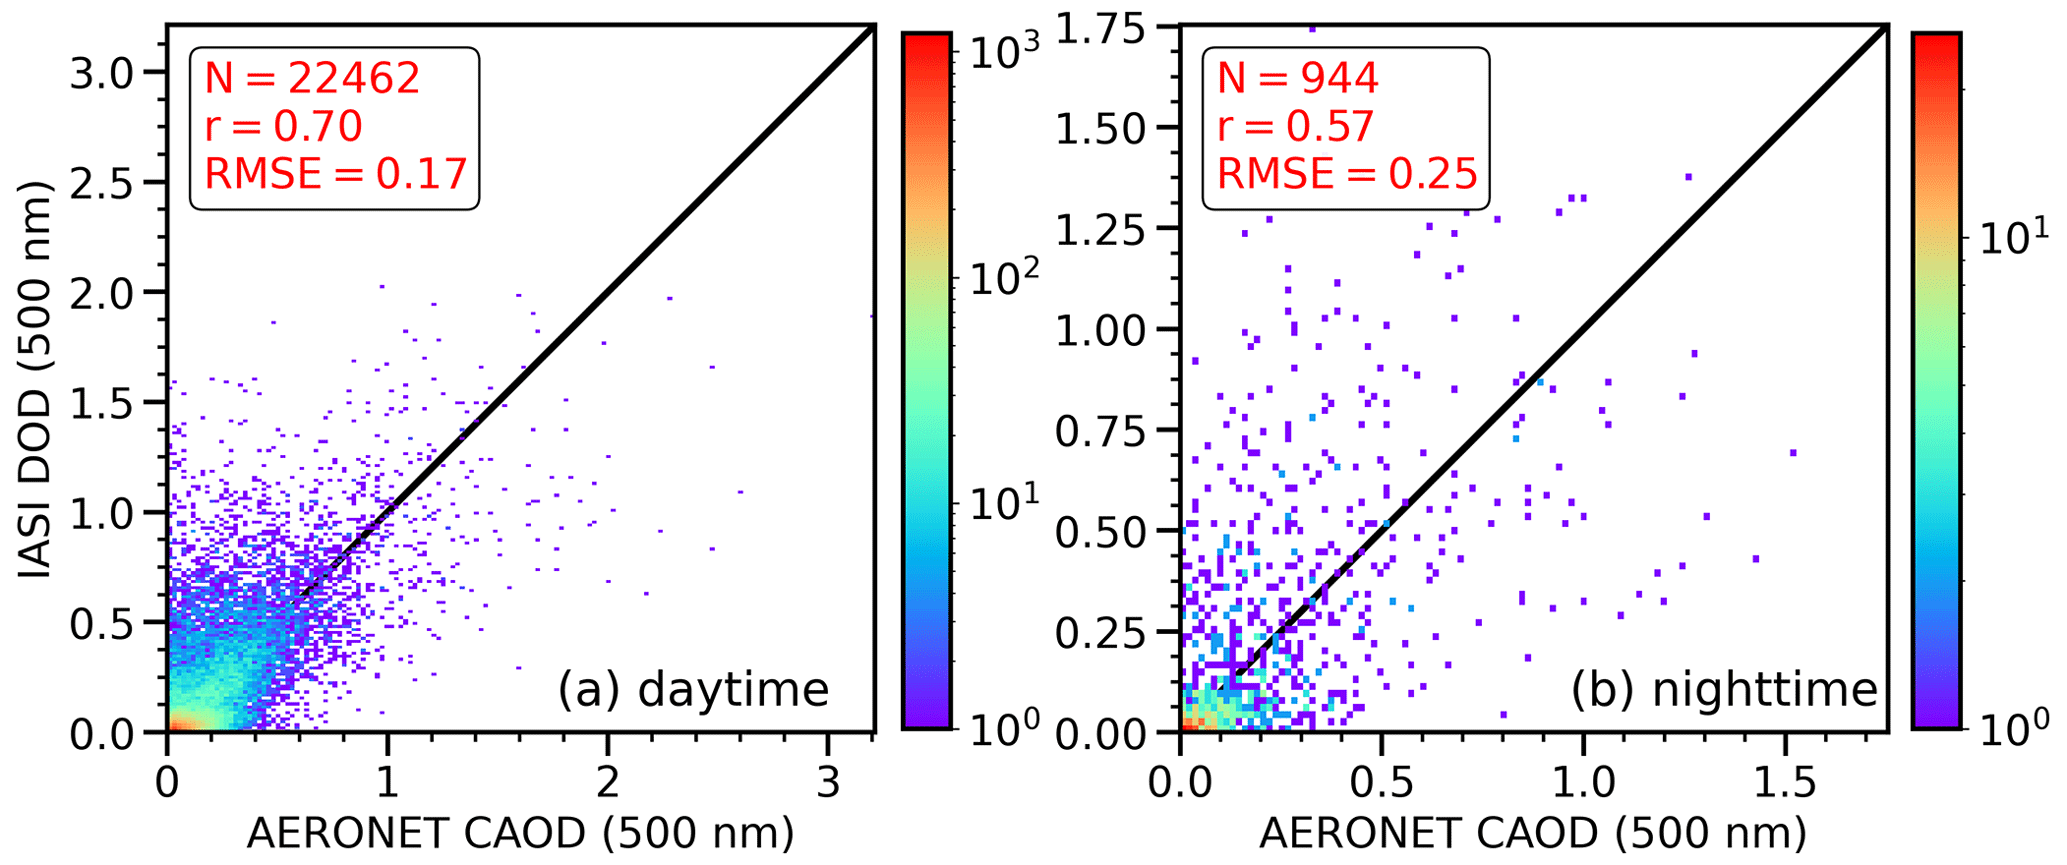
Figure 3A bivariate histogram (log scale) of IASI DOD versus AERONET CAOD over (a) all 46 AERONET solar sites and (b) 11 lunar sites across the dust belt (see locations in Tables 2 and 3 and Fig. S1 in the Supplement). r is the correlation coefficient between IASI DOD (scaled to 500 nm) and AERONET 500 nm CAOD, RMSE is the root mean square error, and N is the sample size of IASI–AERONET collocations.
3.2 Characteristics of daytime and nighttime dust aerosols over the dust belt
In this section, we examine the characteristics and differences between daytime (09:30 local solar ECT) and nighttime (21:30 local solar ECT) DOD and dust layer height from LMD IASI, along with CAOD from nine selected AERONET stations and surface PM10 concentrations from three LISA sites. Here, a mean uniform scaling factor of 0.60 is used to convert both daytime and nighttime 10 µm DOD to 500 nm. Using individual ratios will slightly improve the consistency between IASI DOD and AERONET CAOD (not shown) but may lead to some biases in the day–night differences. Figure 4 shows the annual and seasonal mean climatology (2008 to 2020) of IASI 500 nm DOD, AERONET 500 nm CAOD, and surface PM10 concentration for daytime, nighttime, and day–night difference. Both daytime DOD and nighttime DOD show similar seasonal cycles. In winter (DJF), the dustiest regions occur in the southern parts of the Sahel to the Guinea Coast (Fig. 4b, g). By spring (MAM), the maximum DOD begins to transition northward to the central to northern parts of the Sahara (Fig. 4c, h) and maximizes around summer (JJA) in the central to northwestern Sahara (Fig. 4d, i). Similarly, a pronounced DOD maximum is observed in the central parts of the Arabian Peninsula, northwestern parts of the Indian subcontinent, around the Iraqi and Irani deserts, and the Taklamakan Desert in northwestern China in JJA. DOD is reduced in fall (SON), with a magnitude comparable to that in DJF over the Middle East and Asia, but is slightly stronger over the Sahara yet weaker over the Sahel (Fig. 4e, j). Such seasonal migration of dust maxima is largely driven by the meridional migration of the Intertropical Convergence Zone (ITCZ) and is generally consistent with previous studies about dust aerosols in this region via satellite retrievals (e.g., Ginoux et al., 2012; Pu and Ginoux, 2018; H. Yu et al., 2019; Chédin et al., 2020; Vandenbussche et al., 2020; Y. Yu et al., 2021; Li et al., 2021).
Figure 4 also demonstrates statistically significant (95 % confidence level) differences between daytime and nighttime DOD. The day–night differences in DOD, i.e., daytime minus nighttime, are positive over the major dust source regions (i.e., most parts of the Sahara; the central Arabian Peninsula; parts of South Asia around eastern Iran, southwest Afghanistan, and central Pakistan; and the Taklamakan Desert) yet negative over regions near dust sources (i.e., the southern Sahel to the Guinea Coast, the southeastern coast of the Arabian Peninsula, and central to southern India). It is also important to note that there is a seasonal variability in the magnitude of the day–night differences in DOD, with the largest magnitude of the day–night difference in DJF and MAM (Fig. 4l, m) and a weaker magnitude in JJA and SON (Fig. 4n, o). The spatial pattern of the day–night differences in DOD in JJA is generally consistent with the day–night difference in dust emissions over North African dust sources shown by Chédin et al. (2020; e.g., their Fig. 4) and Todd and Cavazos-Guerra (2016; e.g., their Fig. 8).
Surface observations of dust properties are also examined to compare with results from IASI products. AERONET CAODs overlaid as circles on the IASI DOD show the two datasets generally agree on the seasonal daytime and nighttime distributions of dust aerosols (Fig. 4a–j), but the day–night differences in most seasons are insignificant, partially due to the smaller sample size and lower quality (level 1.5) of lunar data. Among all the sites analyzed, only Iza and Mig sites show significant day–night differences in CAOD in MAM, with Mig largely consistent with IASI DOD. The inconsistency between IASI DOD and AERONET CAOD in some AERONET sites may also be partially due to the uncertainties resulting from using CAOD to approximate DOD and uncertainties in IASI retrievals (see discussion in Sect. 3.7) as well.
Surface observations of PM10 concentrations during both daytime and nighttime from LISA are also overlaid as stars on the IASI DOD in Fig. 4. For a consistent comparison with IASI DOD, LISA hourly data are averaged over time steps approximately within ±30 min of IASI pixels that fall within a 30 km radius from each LISA site. Although DOD and surface PM10 concentrations reveal different aspects of dust activities, i.e., IASI DOD shows vertically integrated column extinction due to coarse dust, while PM10 concentrations reveal near-surface concentrations of large particles including both dust and sea salt (usually dominated by dust in dust source regions), we found that these results share similarities in terms of the day–night variations. For instance, the day–night differences in PM10 over Cin in JJA and Ban in DJF (Fig. 4n, l; significant at the 90 % and 95 % confidence levels, respectively) are quite consistent with IASI DOD.
The IASI dust layer height is another variable that can be useful in characterizing the day–night difference in the distribution of dust aerosols. Figure 5 shows the annual and seasonal mean climatology of daytime, nighttime, and day–night differences in dust layer height. The dust layer height reaches about 2.4–3.6 km in dust source regions over the Sahara and the Sahel, the central Arabian Peninsula, and the deserts in Central and East Asia in the annual mean (Fig. 5a, f) and are generally higher in DJF and MAM seasons (Fig. 5b, c, g, h) and lower in JJA and SON (Fig. 5e, j). The lower summertime dust layer height is somewhat in contrast to previous studies using CALIOP (e.g., Yu et al., 2010; Clarisse et al., 2019; see Fig. S3 and more discussion below). Negative day–night differences in dust layer height, i.e., lower dust layer height in daytime than nighttime, are observed mainly in dust source regions (e.g., large parts of the Sahara, Arabian Peninsula, and Taklamakan Desert), while positive differences are found over the dust downwind regions (e.g., the southern Sahel to the Guinea Coast and large areas in the Indian subcontinent; Fig. 5k–o). The magnitude of the day–night differences in dust layer height shows relatively small seasonal variations. Overall, the spatial pattern of the day–night differences in dust layer height (Fig. 5k–o) is largely opposite to that of DOD (Fig. 4k–o), which is generally consistent with the dust emission index defined by Chédin et al. (2020) that shows a higher DOD and lower dust layer height in dust source regions.
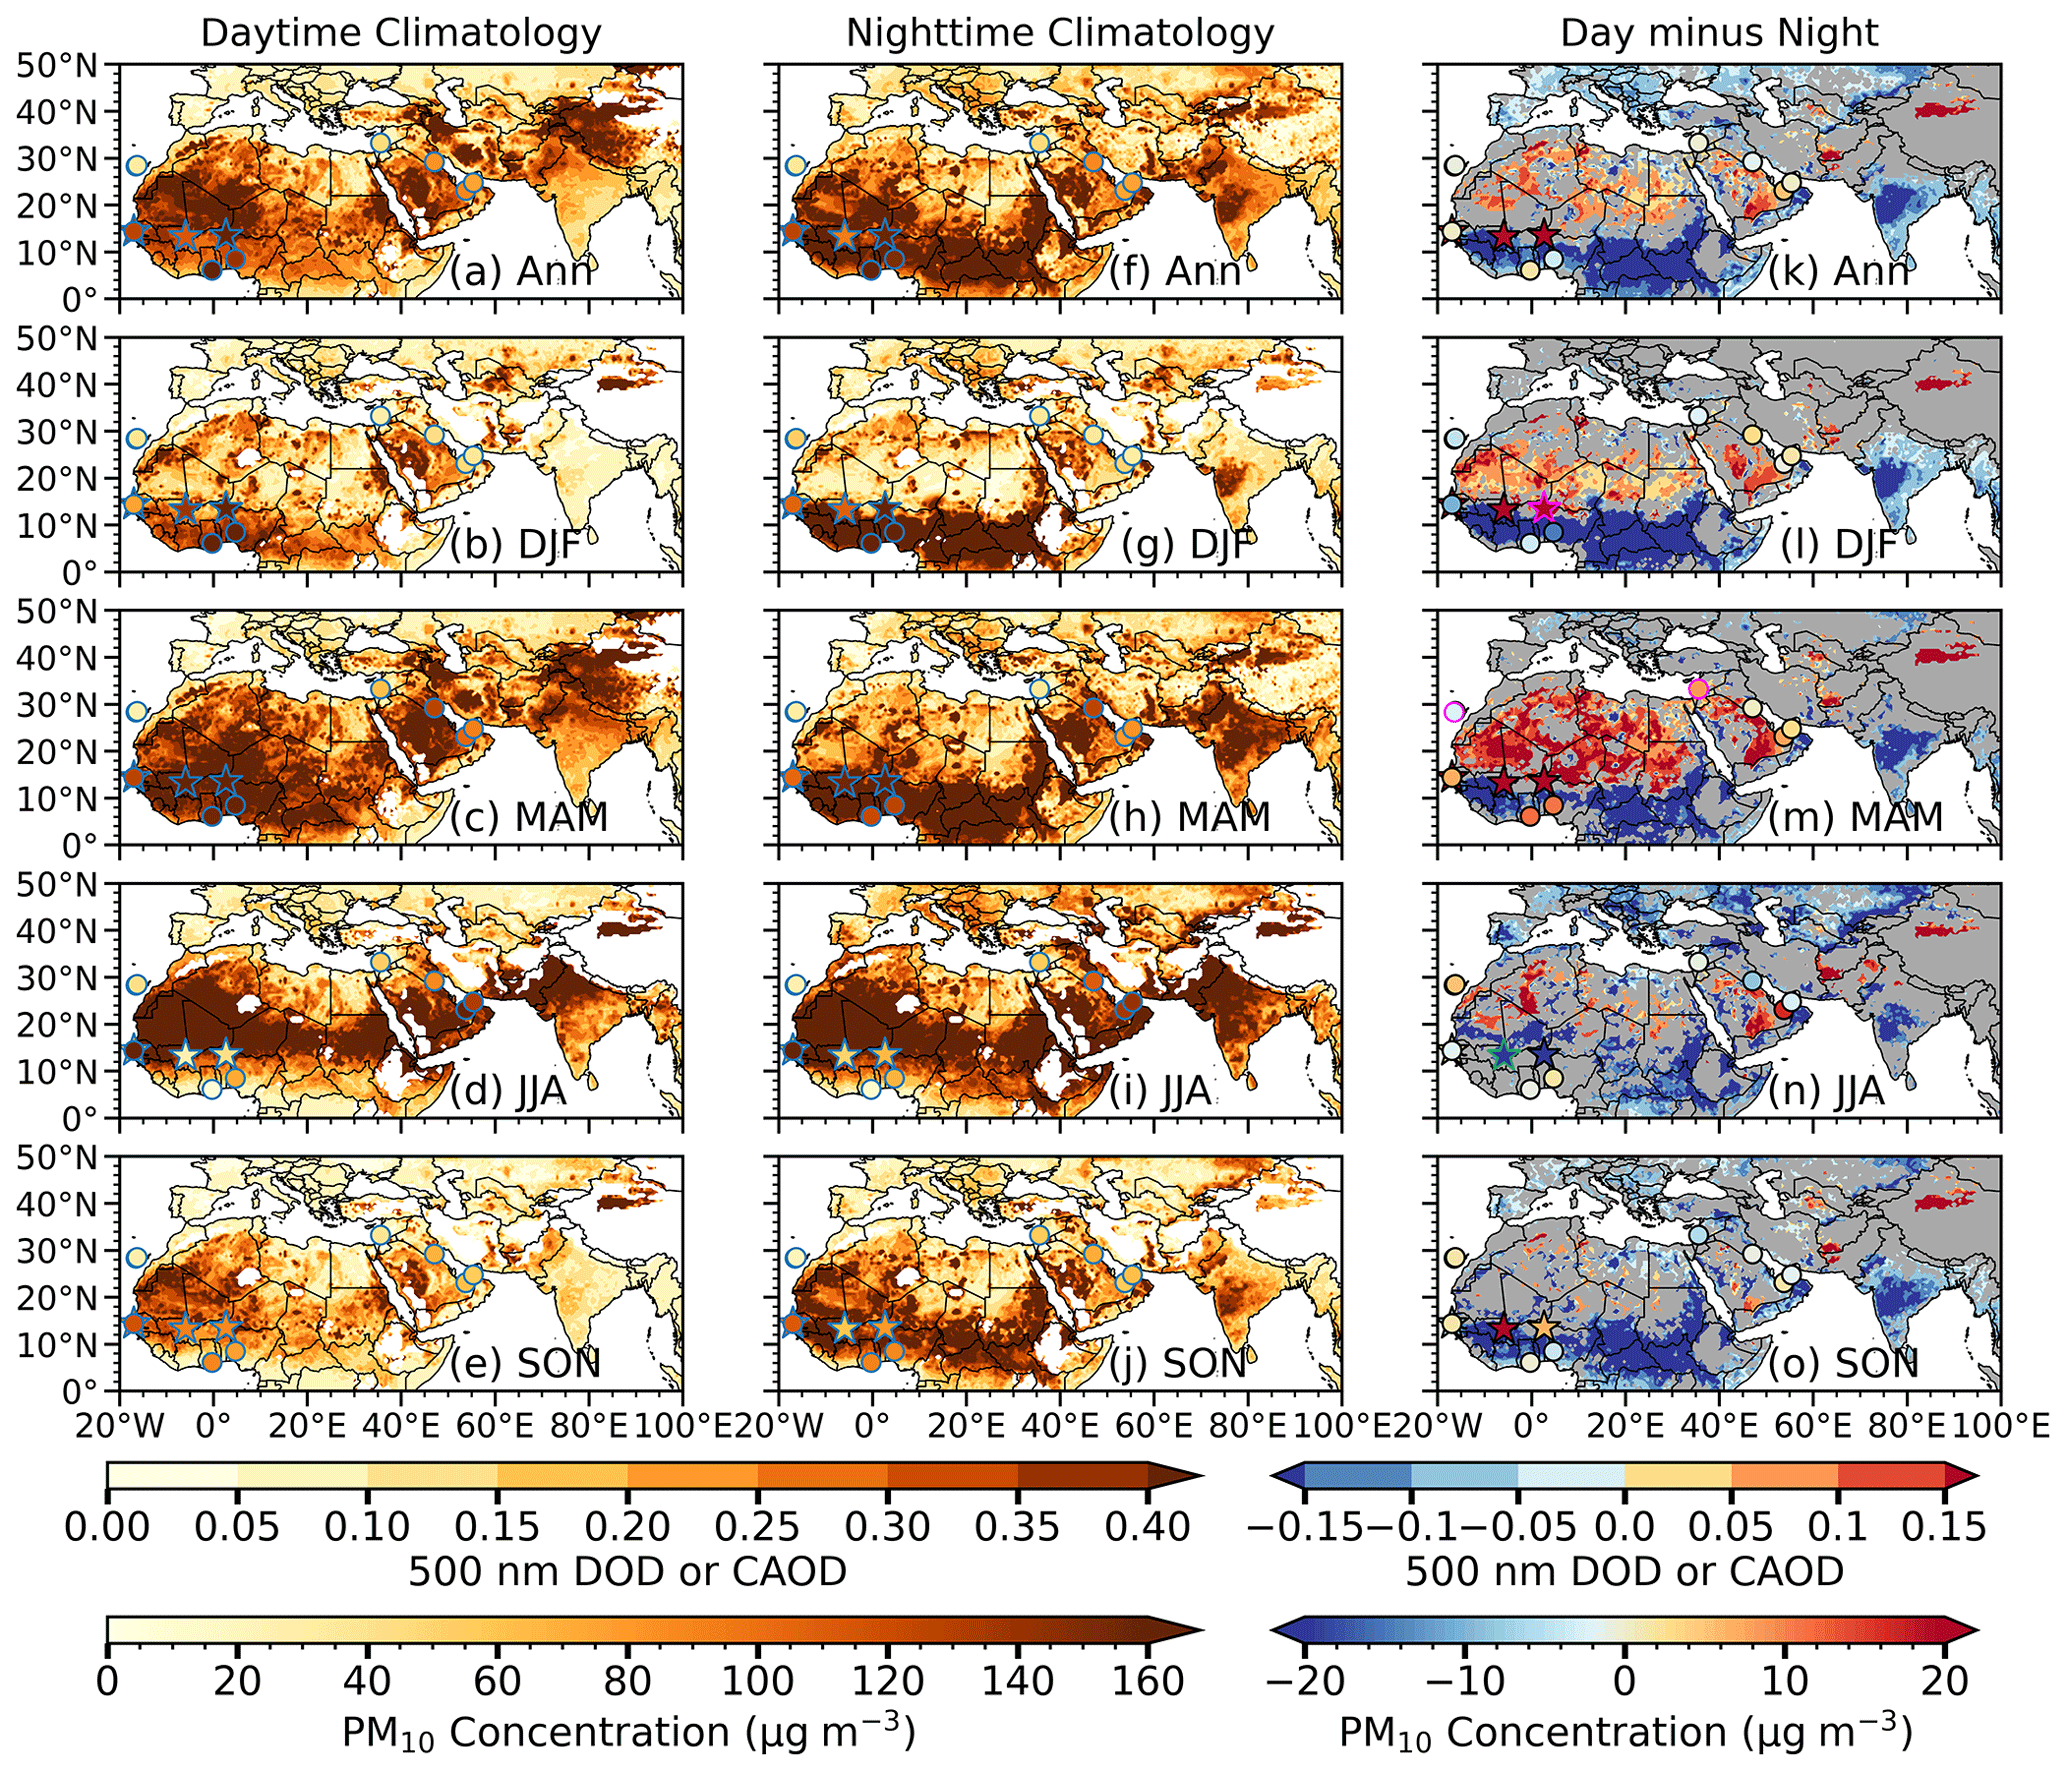
Figure 4Annual (Ann) and seasonal means of LMD IASI DOD (scaled from 10 µm to 500 nm using an IR VIS ratio of 0.60) from 2008 to 2020 for (a)–(e) daytime (09:30 local solar ECT), (f)–(j) nighttime (21:30 local solar ECT), and (k–o) day–night differences, along with LISA PM10 concentrations averaged over 2008–2020 (stars) and AERONET CAOD (dots) overlaid. The white color denotes oceanic grid cells and missing values over land. In (k)–(o), areas where day–night differences in DOD do not pass the 95 % confidence level (t test) are masked in grey. The magenta and green colors around the edges of LISA and AERONET sites in (k)–(o) show sites where the day–night differences in CAOD or PM10 concentrations pass the 95 % and 90 % confidence levels, respectively.
The seasonal cycle of daytime (13:30 local solar ECT) and nighttime (01:30 local solar ECT) DOD and dust layer height from CALIOP is also investigated to compare with IASI data (Figs. S2 and S3, respectively). The seasonal cycle of CALIOP DOD is very similar to IASI, consistent with the findings of H. Yu et al. (2019), although IASI shows a larger area of higher DOD over the Guinea Coast in nighttime in DJF (Figs. 4g, S2g). The day–night differences in DOD from CALIOP are insignificant for most parts of the dust belt across all the seasons except for a narrow region over the northern Sahara and parts of Central Asia and western China in MAM, JJA, and SON and are in general opposite to IASI. Such an inconsistency in the day–night differences in DOD between IASI and CALIOP may partially be attributed to the low signal-to-noise ratio of CALIOP daytime data and differences in the overpass times of the two instruments (∼ 4 h apart). Moreover, because of the narrow swath width of CALIOP with a sampling rate of twice per month (a repeat cycle of 16 d), the afternoon and nighttime observations are not on the same day, which also influences the day–night differences in CALIOP DOD.
In contrast to IASI, dust layer height in CALIOP shows maximum altitude in JJA over major dust source regions and minimum in DJF (Fig. S3). Previous studies show IASI dust layer height is systematically biased low by about −0.4 to −0.8 km in comparison with CALIOP (Peyridieu et al., 2013; Capelle et al., 2014; Kylling et al., 2018); however, here we found that the maximum altitudes are comparable between the two datasets over North Africa. The afternoon (13:30 local solar ECT) and midnight (01:30 local solar ECT) dust layer heights from CALIOP are also not significantly different from each other in most parts of the dust belt, except around the southern Sahel to the Guinea Coast, the southern Arabian Peninsula, and parts of the western Taklamakan Desert in DJF; western China in MAM; northern and eastern Sahara and parts of Central Asia in JJA; and western China in SON (Fig. S4l–o), while sharing some similarities with IASI over the western Taklamakan Desert, Central Asia (JJA), and coastal northwestern Africa (JJA). The differences between the IASI and CALIOP dust layer height could be attributed to several factors (Peyridieu et al., 2013; Chédin et al., 2020), such as different definitions of dust layer height, e.g., arithmetic mean dust layer height in CALIOP versus cumulative extinction height in IASI, and different overpass times of the two instruments (CALIOP lags behind IASI by about 4 h). Kylling et al. (2018) found that the bias of the dust layer height in IASI (LMD version) would be lower if the CALIOP dust layer height was defined by cumulative extinction height instead of arithmetic mean and was shifted to the observation time of IASI. Their results (their Table 3) show a difference of km between LMD IASI and CALIOP for the cumulative extinction and km for the arithmetic mean.
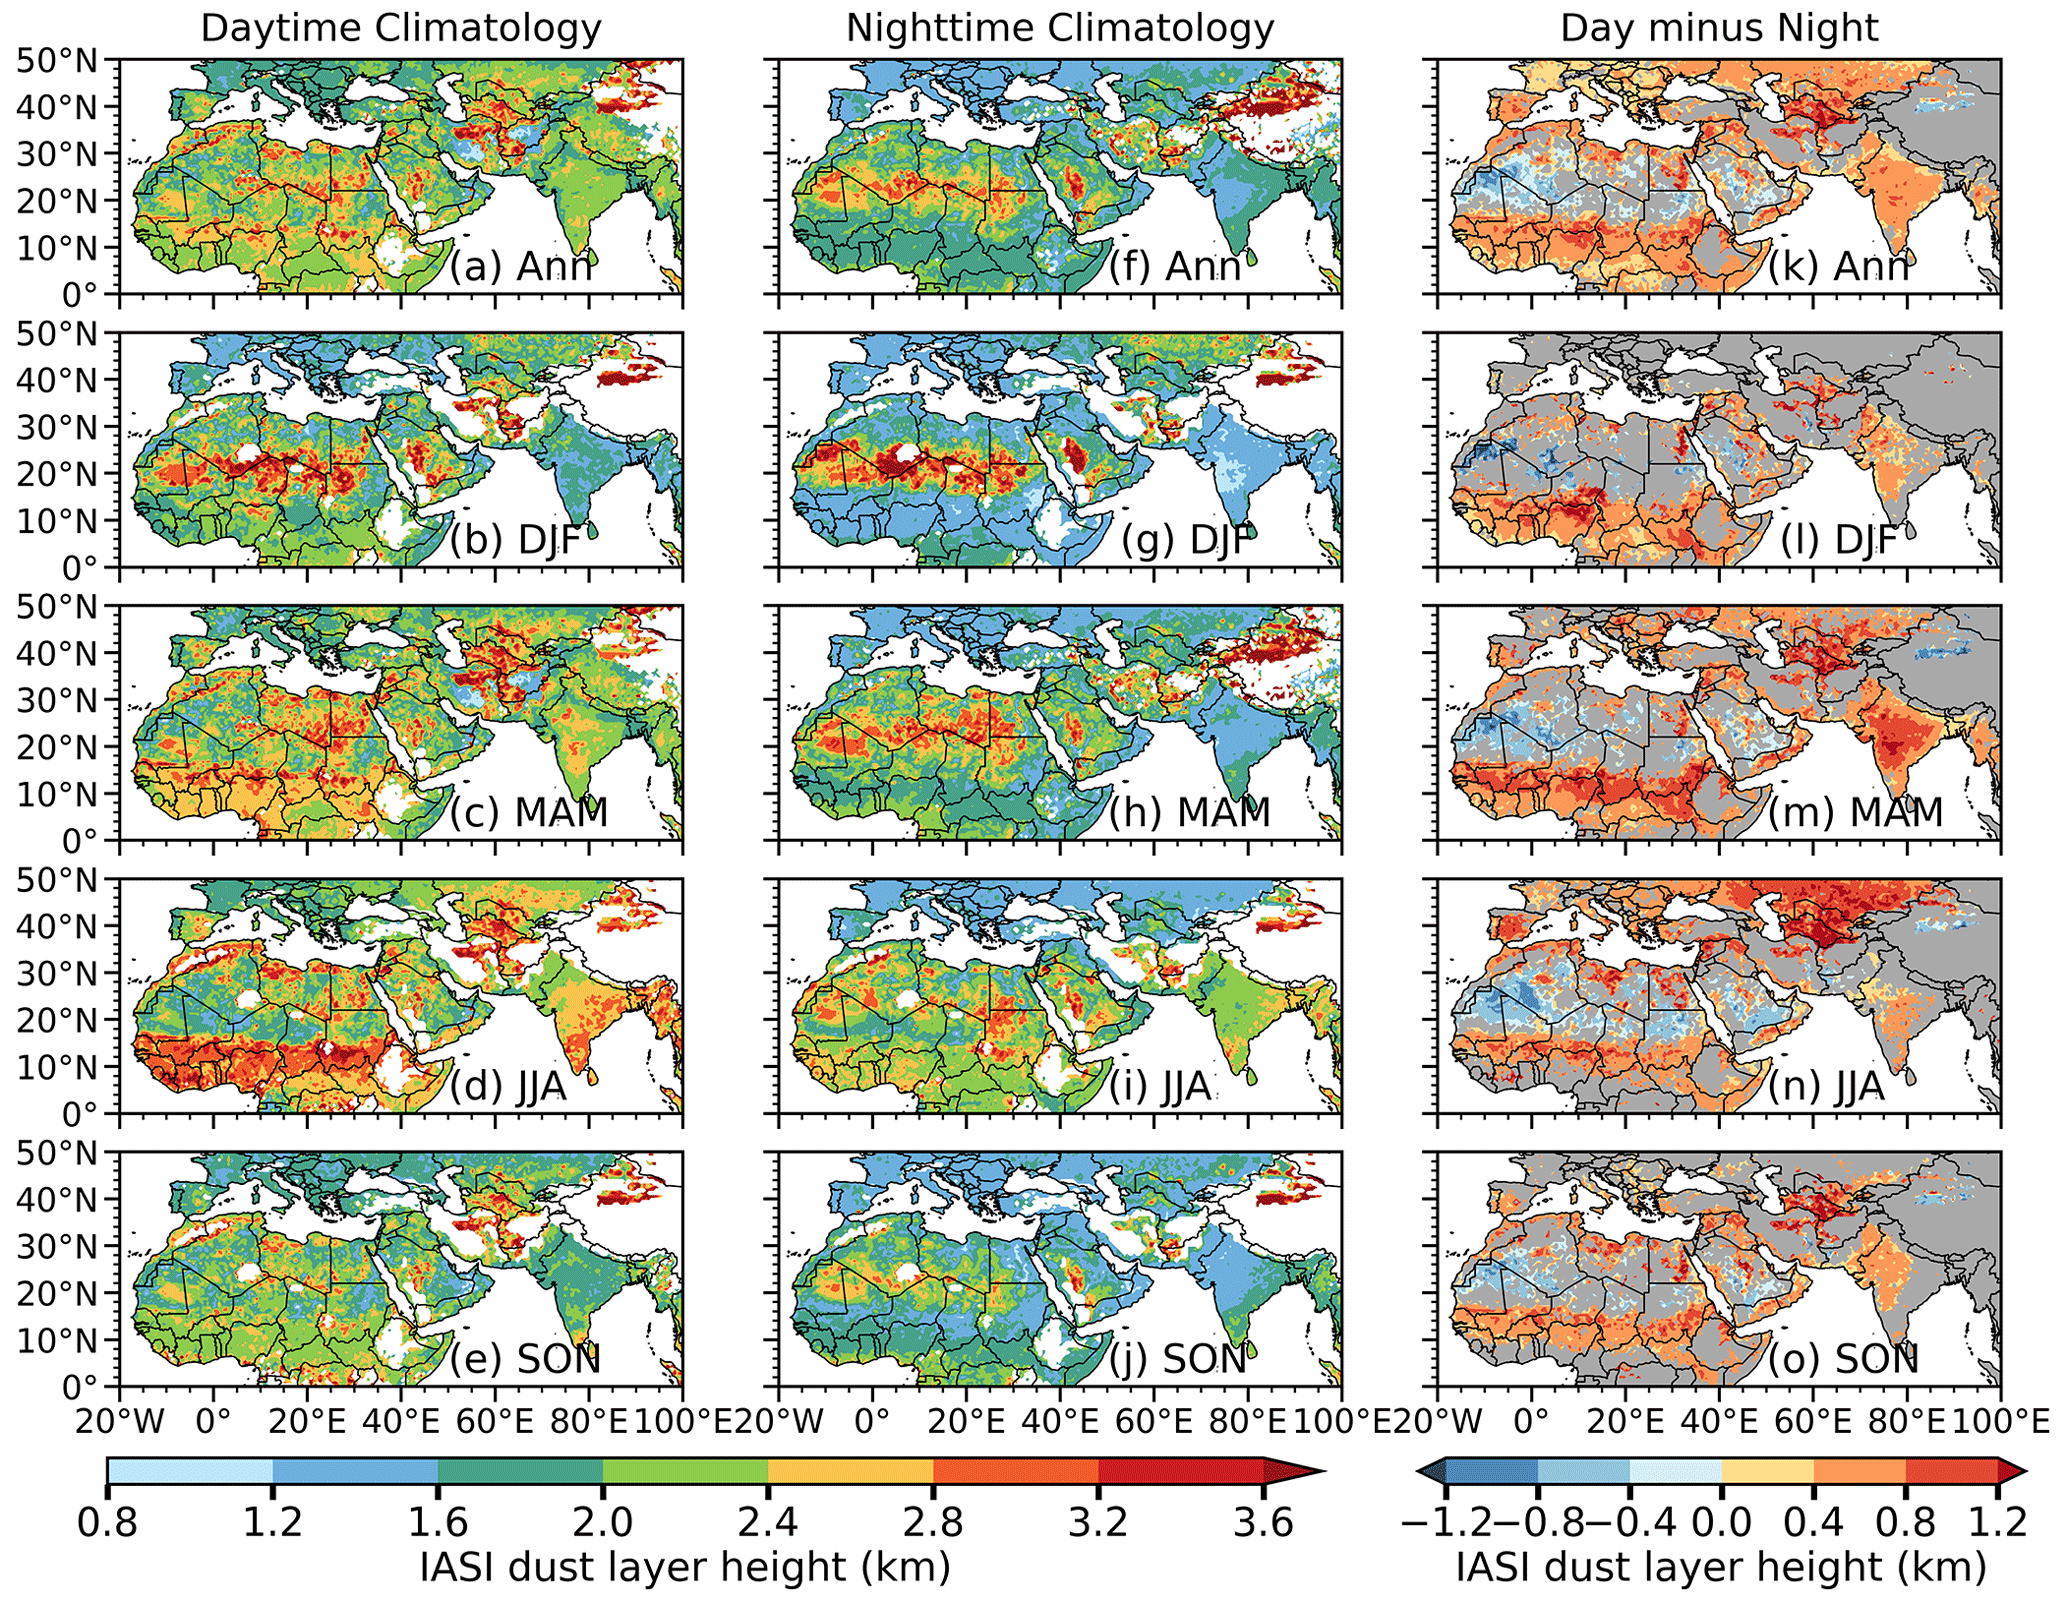
Figure 5The same as Fig. 4 but for the dust layer height (km) from LMD IASI. Dust layer height is defined as the height where half of the vertically integrated dust (DOD) is above, and the other half is below.
3.3 Seasonal cycle of day–night variations in dust aerosols from IASI, LISA, and AERONET
We compare the seasonal cycle of daytime and nighttime IASI DOD with LISA and AERONET ground-based observations to better understand how day–night differences in dust aerosols propagate in seasons. Figure 6 shows monthly mean surface PM10 concentrations from three LISA sites (Ban, Cin, and Mbo; see locations in Fig. 1) and monthly mean DOD from IASI averaged over a 30 km radius around LISA sites. We average hourly PM10 concentrations around ±30 min of the IASI overpass time for a consistent comparison with IASI. Note that the seasonal cycle of LISA records is different from DOD, with a minimum in JJA associated with monsoon rainfall and a peak in DJF and MAM due to transported dust from the central Sahara (Marticorena et al., 2010). The three sites are along 13–14∘ N but aligned in an east–west trajectory of the Sahelian dust transect. Such observations reveal a clear spatial variability of dust with a higher dust concentration over Banizoumbou (Ban), which is close to the Saharan dust sources, but decreases westward in Cinzana (Cin) and M'Bour (Mbo), similarly to the findings of previous studies (Marticorena et al., 2010; Kaly et al., 2015). Daytime PM10 concentration is significantly higher than nighttime in DJF and early MAM at Ban and Cin, while nighttime dust concentration is higher than daytime from late MAM to early SON at Ban and Cin (Fig. 6a–b). Mbo shows a similar seasonal cycle as Ban and Cin but the day–night difference is largely insignificant (Fig. 6c). Like LISA PM10, daytime IASI DOD is higher than nighttime in most DJF and MAM months but lower in JJA at Ban and Cin, consistent with the results shown in Fig. 4. Note that different from PM10 concentrations, nighttime IASI DOD at Mbo is higher than daytime throughout the entire year. This disparity could partially be due to the fact that the Mbo site is located along the transport path of the boreal JJA dust plumes, but further from the major dust sources of North Africa; thus dust aerosols are likely mixed to higher altitudes, which may be sampled differently between the near-nadir-viewing IASI instrument and the surface measurements and differently between day and night.
A similar analysis is carried out over nine AERONET sites (blue dots in Fig. 1) for IASI DOD and AERONET CAOD as shown in Fig. 7. AERONET CAOD is collocated with IASI temporally and spatially for consistent comparison between the two datasets. CAOD and DOD show very similar seasonal cycles, with maxima in late MAM to JJA for stations in the Sahara (Dak) and off the west coast of North Africa (Iza and SCT) and the Middle East (Mig, Sha, Mez, and DEW), whereas the Guinea Coast stations (Ilo and Kof) showed maximum DOD or CAOD in late DJF to MAM. The largest biases between IASI and AERONET occur in Iza during JJA where both IASI daytime DOD and nighttime DOD are higher than AERONET solar and lunar CAOD. It is worth noting that the Iza site is located at a higher altitude (∼ 2.4 km) and may contain some uncertainties. In terms of the spatial variability of dust, both IASI and AERONET showed consistency over all sites with maximum DOD or CAOD in JJA over Dak, Iza, SCT, Mig, Mez, and DEW; maximum DOD or CAOD in DJF over Ilo and Kof; and maximum DOD or CAOD in late MAM over Sha. In terms of the day–night differences, AERONET is consistent with IASI at the Dak site during JJA, with higher CAOD during nighttime than daytime. Over the Guinea Coast (Ilo and Kof sites), nighttime CAOD or DOD is higher than daytime for most months from late JJA to DJF, which is consistent with IASI. While seasonal variations in day–night differences in CAOD are largely similar to IASI DOD at Dak, Ilo, and Kof in JJA and SON, discrepancies are found at SCT in JJA, Mez in JJA and SON, Mig in MAM, Sha from late MAM to SON, and DEW in MAM, probably in association with the relatively smaller sample size and relatively lower quality (level 1.5) of AERONET lunar data and impacts of sea salt on CAOD at the coastal stations.
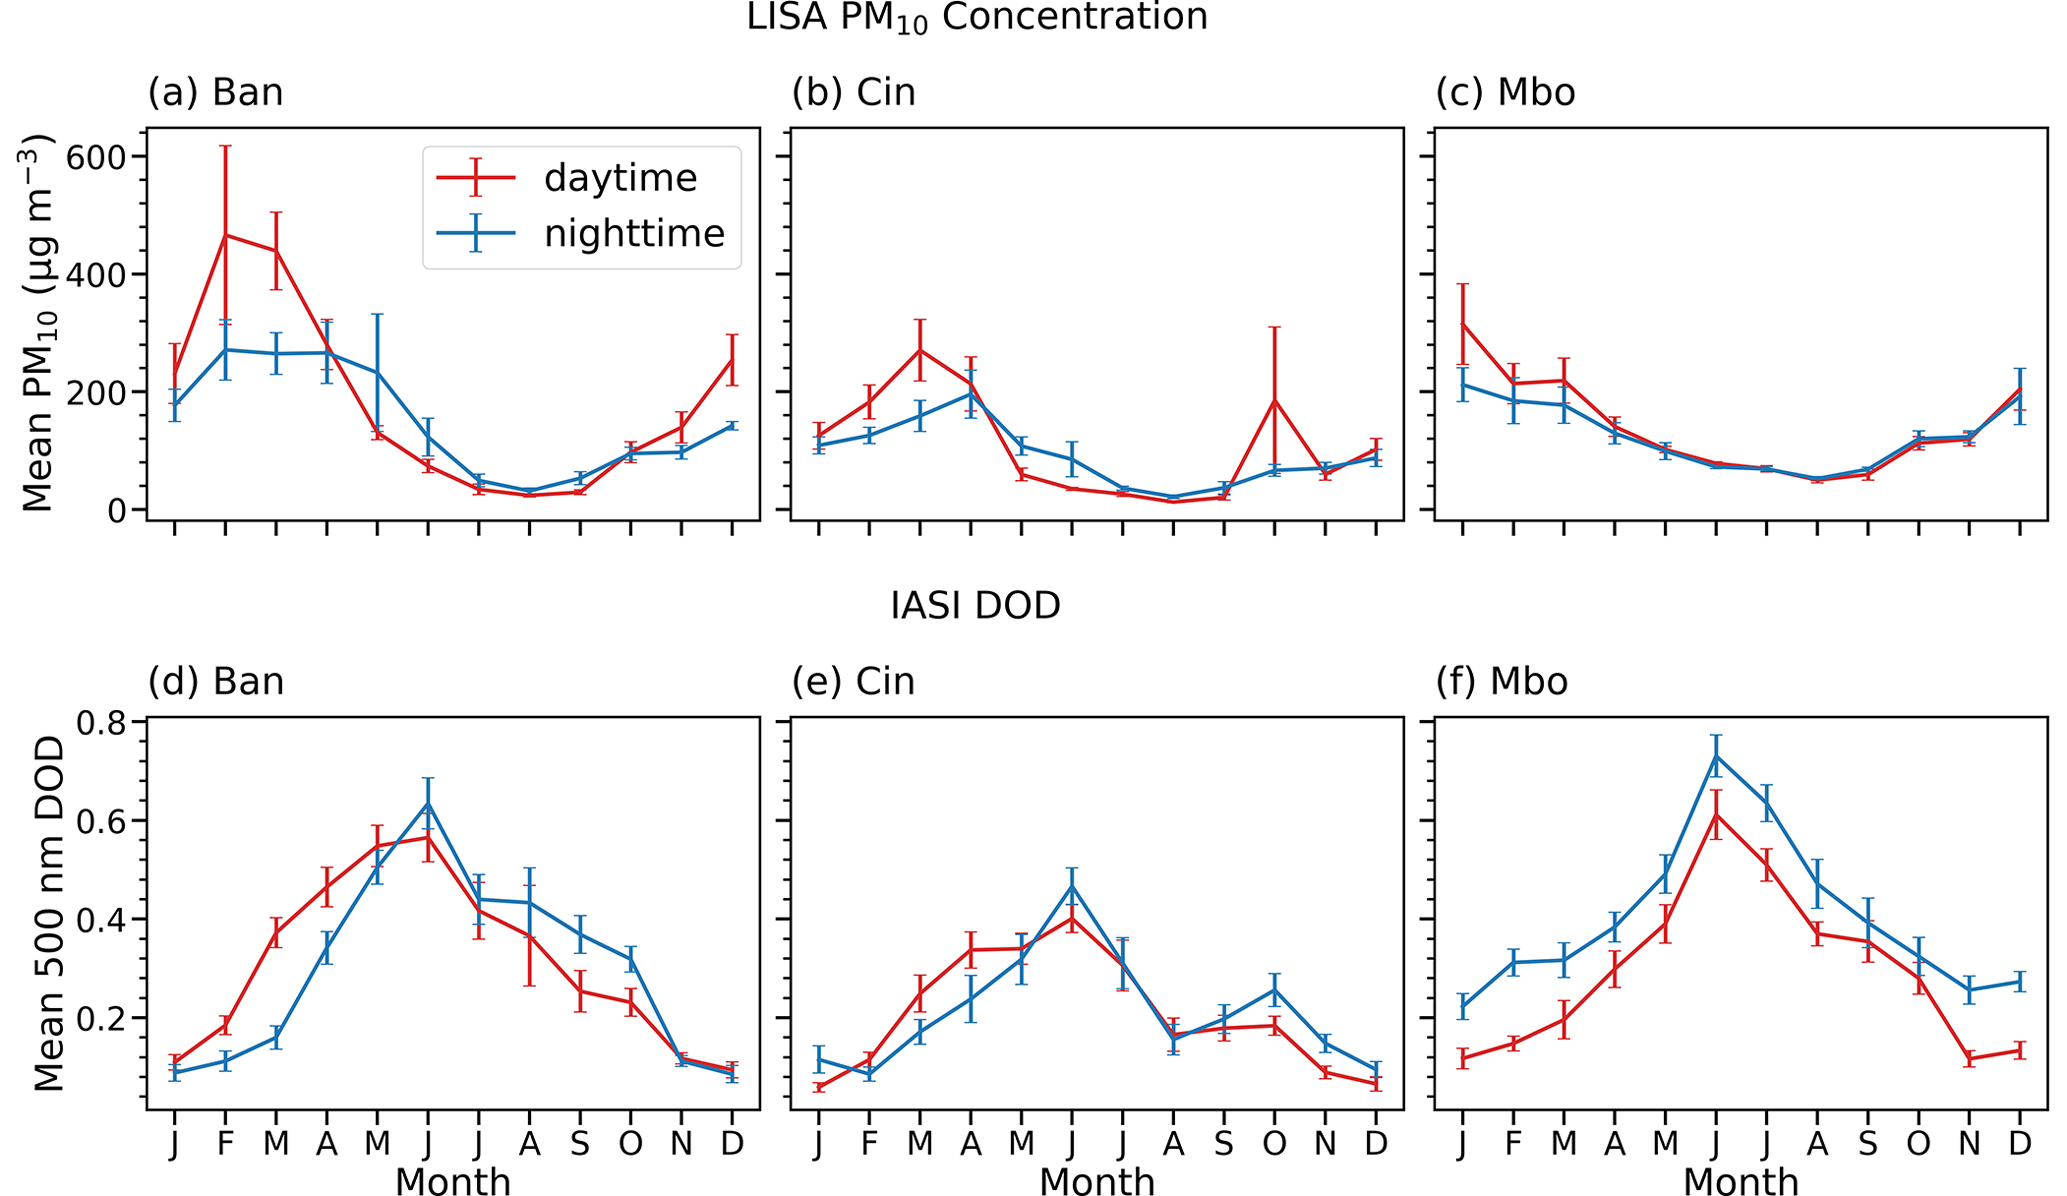
Figure 6Seasonal cycle of (a)–(c) PM10 concentrations (µg m−3) from LISA sites and (d)–(f) DOD from IASI at the same locations averaged from 2008 to 2020, except for LISA PM10 in Mbo where the average is from 2008–2019. The error bars show standard errors. PM10 concentrations and IASI DOD are collocated by averaging hourly LISA data around ±30 min of the IASI overpass time and averaging IASI pixels that fall within a radius of 30 km from each LISA site.
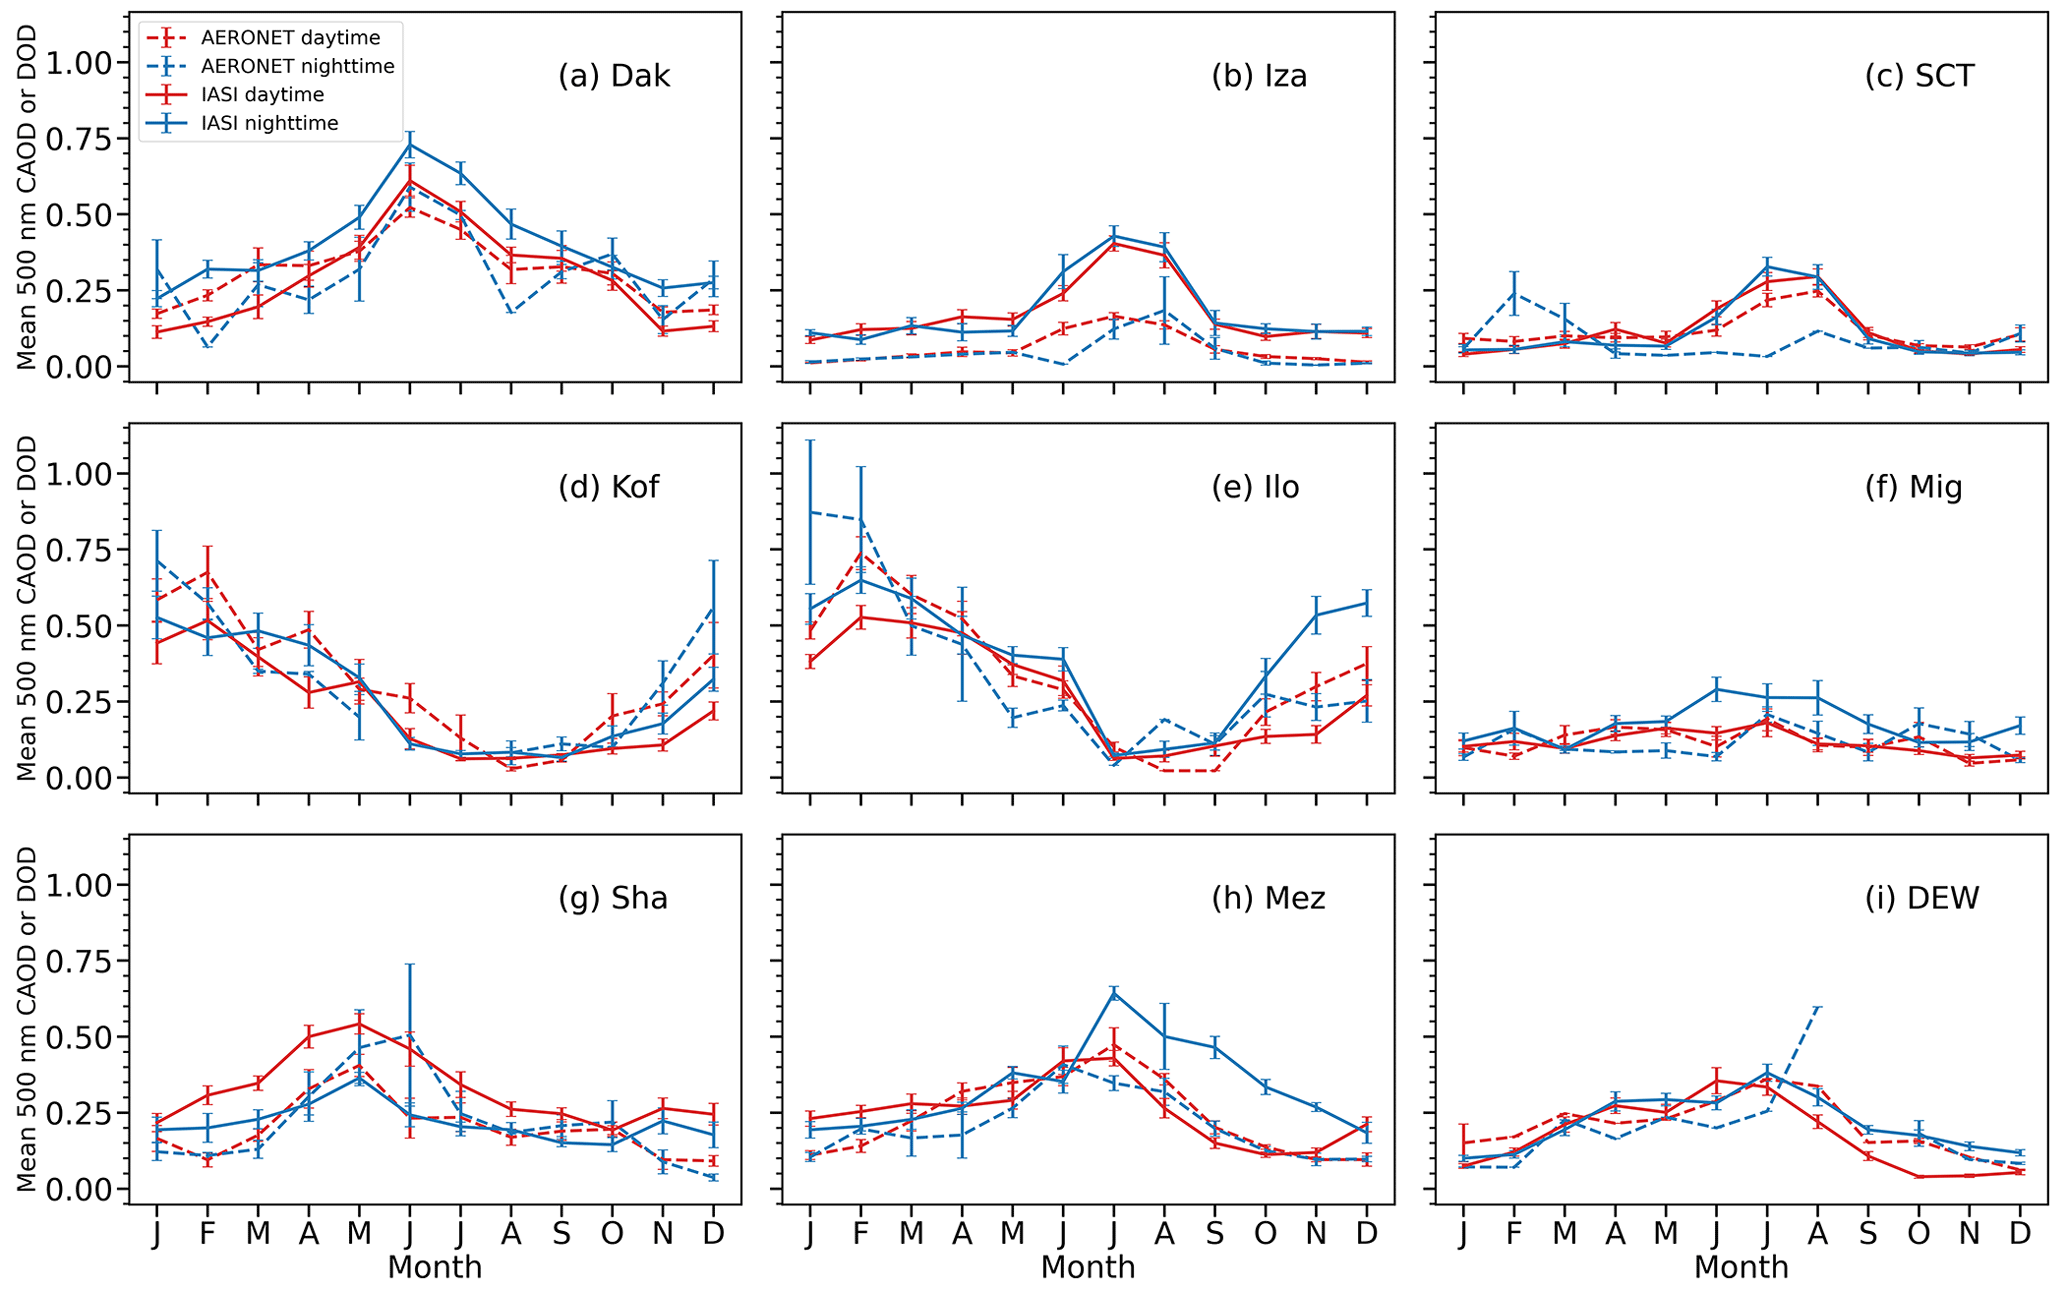
Figure 7Seasonal cycle of AERONET CAOD (dashed line) and LMD IASI DOD (solid line) at 500 nm for daytime (red) and nighttime (blue). The seasonal cycles of IASI DOD and AERONET CAOD were collocated and computed for a period of 2008–2020. However, the temporal range of AERONET varies from site to site but within 2008 to 2020. AERONET solar and lunar observations are sampled within ±30 min of the IASI overpass time, whereas IASI DOD is averaged over a radius of 30 km from each AERONET site.
3.4 Diurnal variations in dust aerosols
IASI DOD and dust layer height are available only two times daily. To have a clear picture of the full diurnal cycle of dust aerosols, data with a higher temporal resolution are required. Here, we use station data, i.e., typically 5 to 15 min AERONET CAOD and hourly LISA PM10 concentrations, to further explore diurnal variations in dust over the dust belt. Figure 8 represents the diurnal cycle of surface PM10 concentration in the Sahel (first row) and CAOD at AERONET sites (last three rows) for each season, with vertical cyan lines highlighting the overpass time of IASI (09:30 and 21:30 local solar ECT). The results indicate that surface PM10 concentrations at the three LISA sites in the Sahelian dust belt peak around 09:00–11:00 LST in the late morning in all seasons, except in JJA and SON when PM10 concentrations are low due to precipitation scavenging. Both Cin and Mbo sites have evening peaks around 19:00–20:00 LST (except in JJA at Mbo; Fig. 8b, c), but it is not very evident at the Ban site, which shows a peak around midnight in MAM (Fig. 8a). The passing time of IASI is largely consistent with the timing of maxima in surface PM10 concentrations.
At AERONET sites, daytime records (06:00 to 17:00 for Dak, Ilo, and Kof sites; 05:00 to 18:00 for Iza, SCT, Mez, Mig, Sha, and DEW; light yellow shading in Fig. 8) are observed by the sun photometer, and nighttime data (18:00 to 05:00 for Dak, Ilo, and Kof; 17:00 to 06:00 for Iza, SCT, Mez, Sha, DEW; 17:00 to 05:00 for Mig; grey shading in Fig. 8) are from the lunar photometer; thus the discontinuity between daytime and nighttime records is likely due to the different instruments (Fig. 8d–l). Furthermore, level-1.5 lunar data also have a higher uncertainty compared to level-2.0 solar data. AERONET CAOD also peaks in the morning around 07:00–09:00 LST for sites in the Guinea Coast (Ilo and Kof) in DJF, and the peaks in the Sahel (Dak), at the North Atlantic sites (Iza and SCT), and in the Middle East (Mez) are also around 07:00–09:00 LST in JJA, which is consistent with previous work in this region (Schepanski et al., 2009; Marticorena et al., 2010; Kaly et al., 2015; Yu et al., 2021). A secondary peak of daytime CAOD occurs in the afternoon around 15:00 LST (e.g., at Dak, Kof, Ilo, and Mez sites; Fig. 8d, g, h, k). The nighttime peak of CAOD varies in different regions. In North Africa, CAOD maximizes around 03:00 in Dak, 20:00 and 04:00 in Iza, 22:00 in SCT, 04:00 in Ilo, and midnight in Kof, while in the Arabian Peninsula CAOD peaks around 05:00 in Mig, 20:00 in Sha, and around 04:00 in DEW but without a clear peak at the Mez site (slightly higher around 05:00 in MAM and 02:00 in DJF; Fig. 8d–l). Overall, the available AERONET data in the dust belt show that IASI daytime data largely capture the early morning peaks of CAOD, while the nighttime data partially capture the high CAOD either after its early evening peak or before its nighttime maxima. As revealed by the comparison with LISA and AERONET station data, the day–night variations in IASI DOD could be quite similar to ground-observed CAOD and surface dust concentrations at some sites but not others. Although IASI data contain only two time steps, its high spatial resolution and global coverage provide useful information that complements sparsely located ground observations to help understand the diurnal cycle of dust.
3.5 Daytime and nighttime DOD from reanalysis products
With global coverage and high temporal resolution, aerosol products from reanalysis would be great tools to study the diurnal cycle of dust if they largely capture the observed day–night dust variations shown in satellite retrievals. Here we examine daytime and nighttime DOD from MERRA-2 and EAC4 to examine whether they capture the day–night differences in DOD as revealed by LMD IASI over the dust belt. After the reanalysis datasets are sampled at IASI overpass times at each grid point for consistency with satellite observations as discussed in Sect. 2.2.5, the annual and seasonal climatology of daytime, nighttime, and day–night differences in DOD from MERRA-2 and EAC4 are presented in Figs. 9 and 10, respectively. Like IASI, the results of the seasonal mean climatology of MERRA-2 and EAC4 DOD from 2008 to 2020 also revealed a higher DOD in MAM and JJA in comparison with other seasons. The magnitude of the day–night difference in DOD is, however, weak in the reanalysis products and largely insignificant as compared to that of IASI (Figs. 9 and 10). The magnitude of the day–night difference in MERRA-2 DOD appears to be large only in the Bodélé Depression (centered around 17∘ N, 18∘ E), with a positive difference throughout the year and a negative difference to the southwest (Fig. 9l–o). Over northeastern Africa and the coastal area of the Arabian Peninsula and Central Asia, some areas also show significant negative differences, i.e., with greater nighttime DOD. The sign of the day–night differences in MERRA-2 DOD is largely consistent with IASI in some parts of the Bodélé Depression and southern Arabian Peninsula in DJF and MAM and Central Asia in JJA but not in other regions or seasons.

Figure 8Diurnal cycle of (a)–(c) LISA PM10 concentrations (µg m−3, a–c) in the Sahel and (d)–(l) AERONET CAOD over sites across the dust belt. The diurnal cycle of LISA PM10 concentrations was averaged between 2008 and 2020 for Ban and Cin sites and between 2008 and 2019 for the Mbo site. The temporal ranges for AERONET data vary depending on the number of records available for both solar and lunar datasets. The cyan lines mark 09:30 and 21:30 local solar ECT of IASI. The grey (light yellow) background shading shows the temporal range of lunar (solar) CAOD from AERONET. Error bars show standard errors.
A slightly larger portion of the central to northern Sahara, the Middle East, Central Asia, and the eastern Taklamakan Desert is characterized by significant and negative day–night differences in DOD in EAC4 (Fig. 10l–o). In most of these areas, the day–night differences are opposite to that of IASI, except over the northeastern Sahara, the southern Arabian Peninsula, and northwestern Sudan in DJF and Central Asia in JJA. In short, aerosol reanalyses in general have difficulties in capturing the day–night differences in DOD shown by IASI. This may be partially because reanalyses do not assimilate nighttime observations (e.g., AERONET lunar data or infrared satellite products) to constrain AOD or DOD.
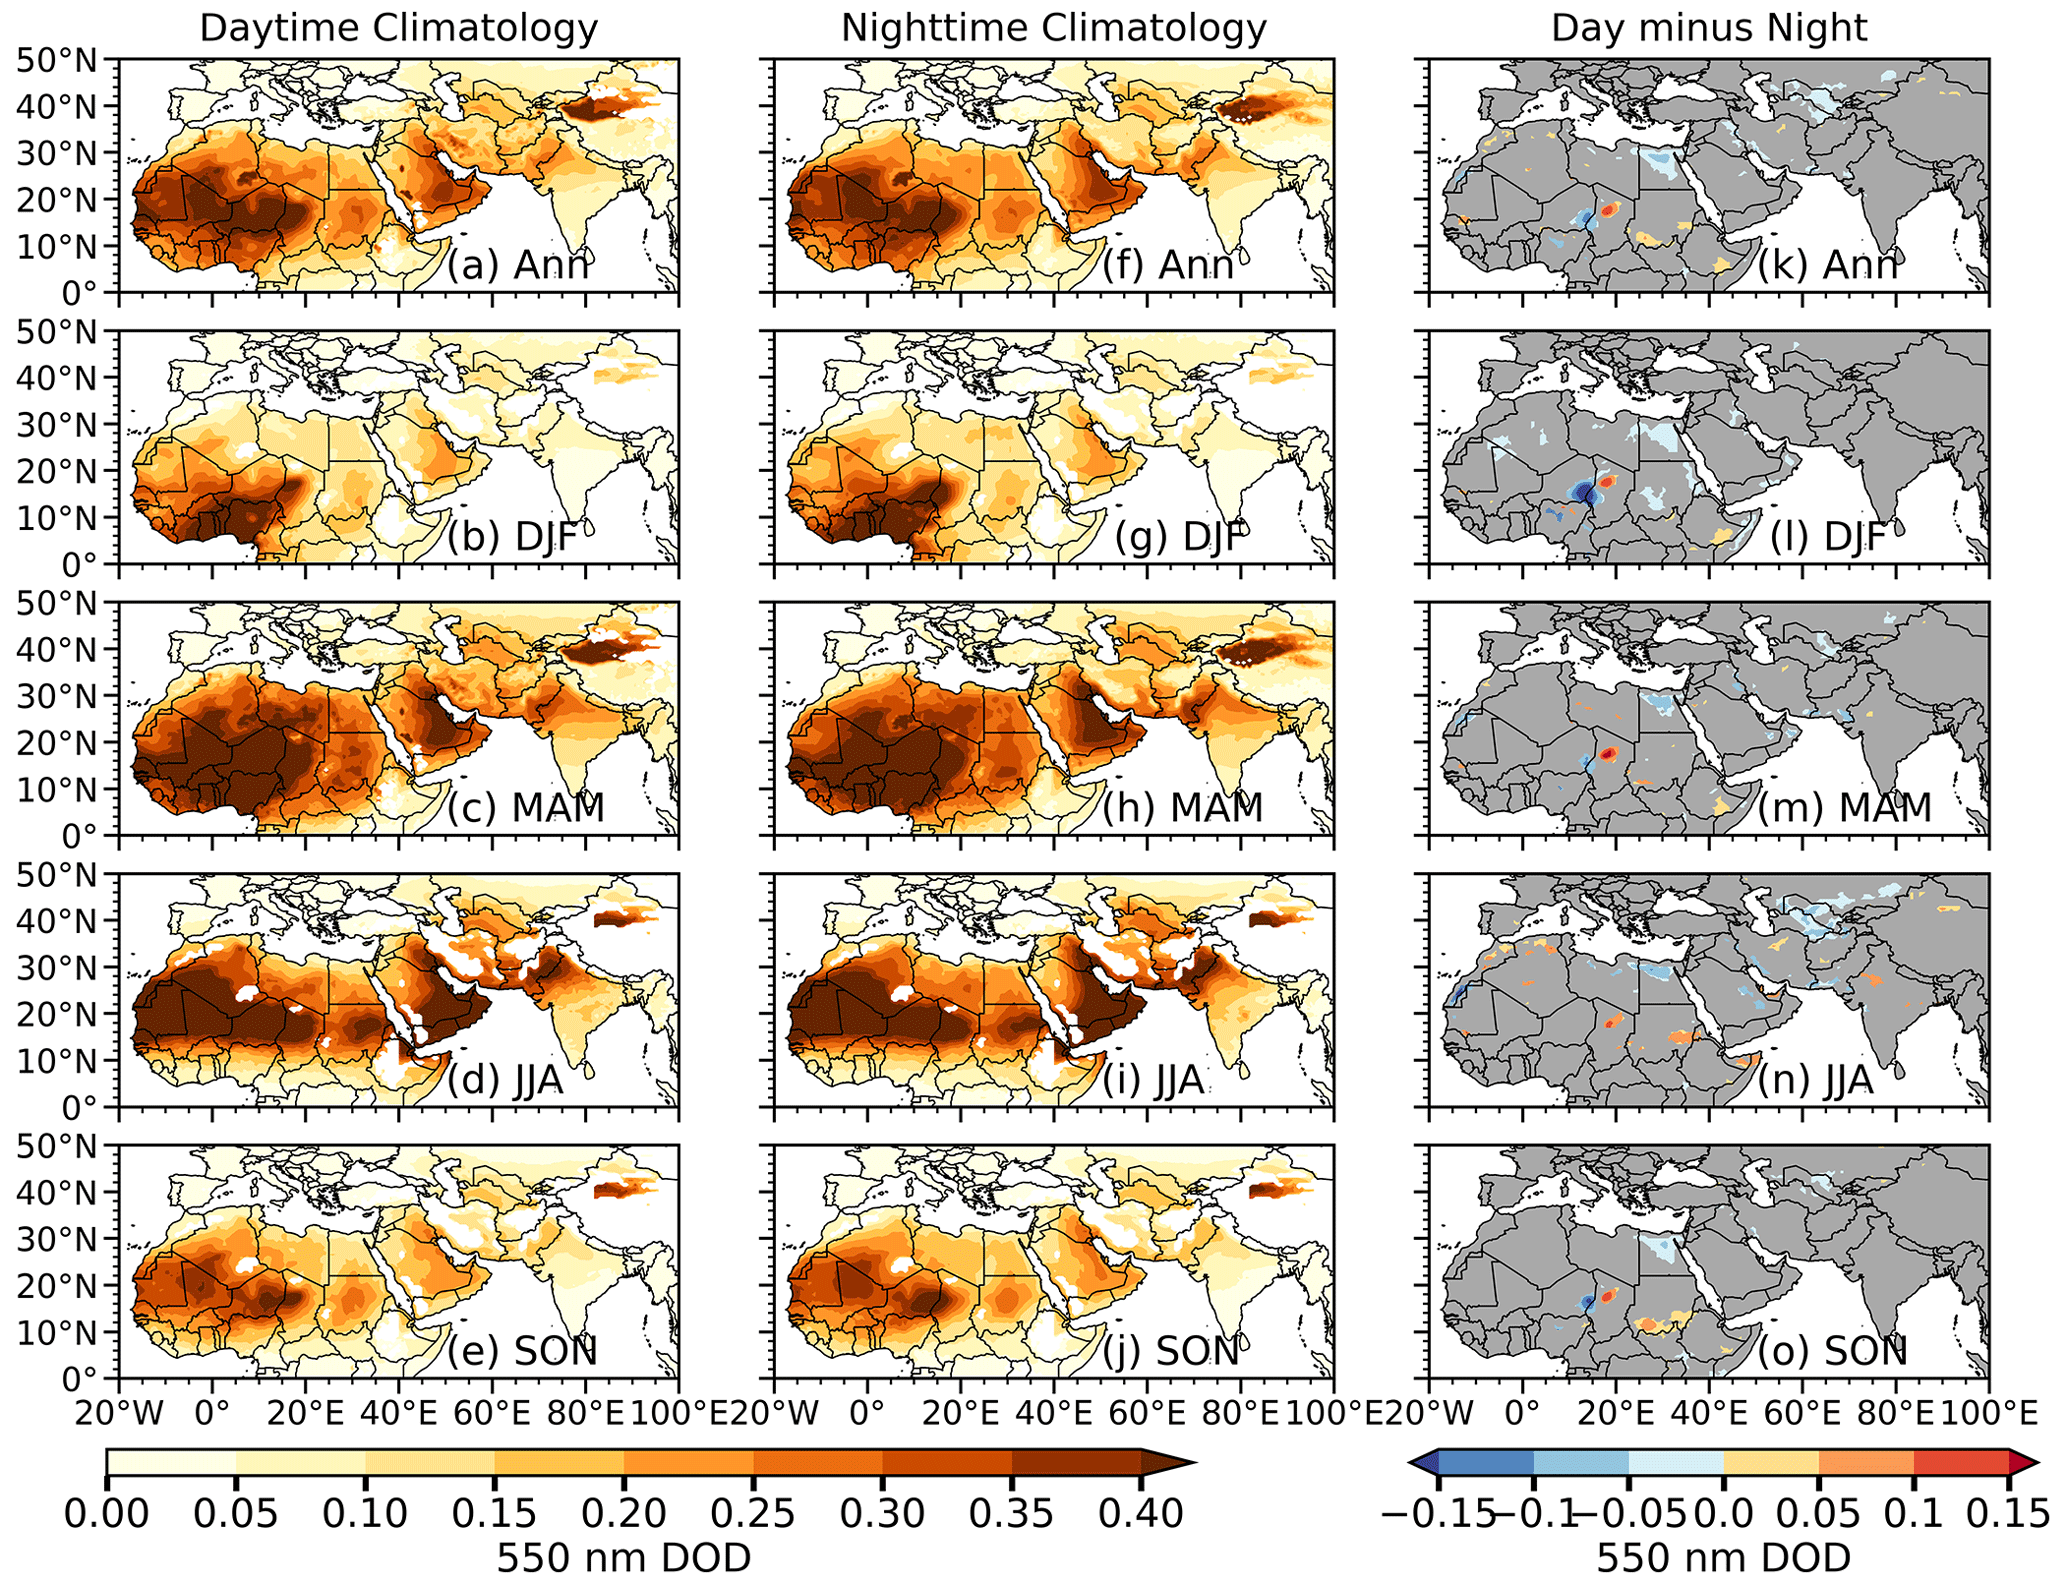
Figure 9Annual (Ann) and seasonal means of MERRA-2 DOD averaged from 2008 to 2020 (a)–(e) for daytime (09:30 local solar ECT) and (f)–(j) nighttime (21:30 local solar ECT) based on the IASI overpass time at each grid point and (k)–(o) day–night differences. The white areas over land in (a)–(j) denote missing values in IASI DOD. Areas where the day–night differences in MERRA-2 DOD do not pass the 95 % confidence level (t test) in (k)–(o) are masked out in grey.
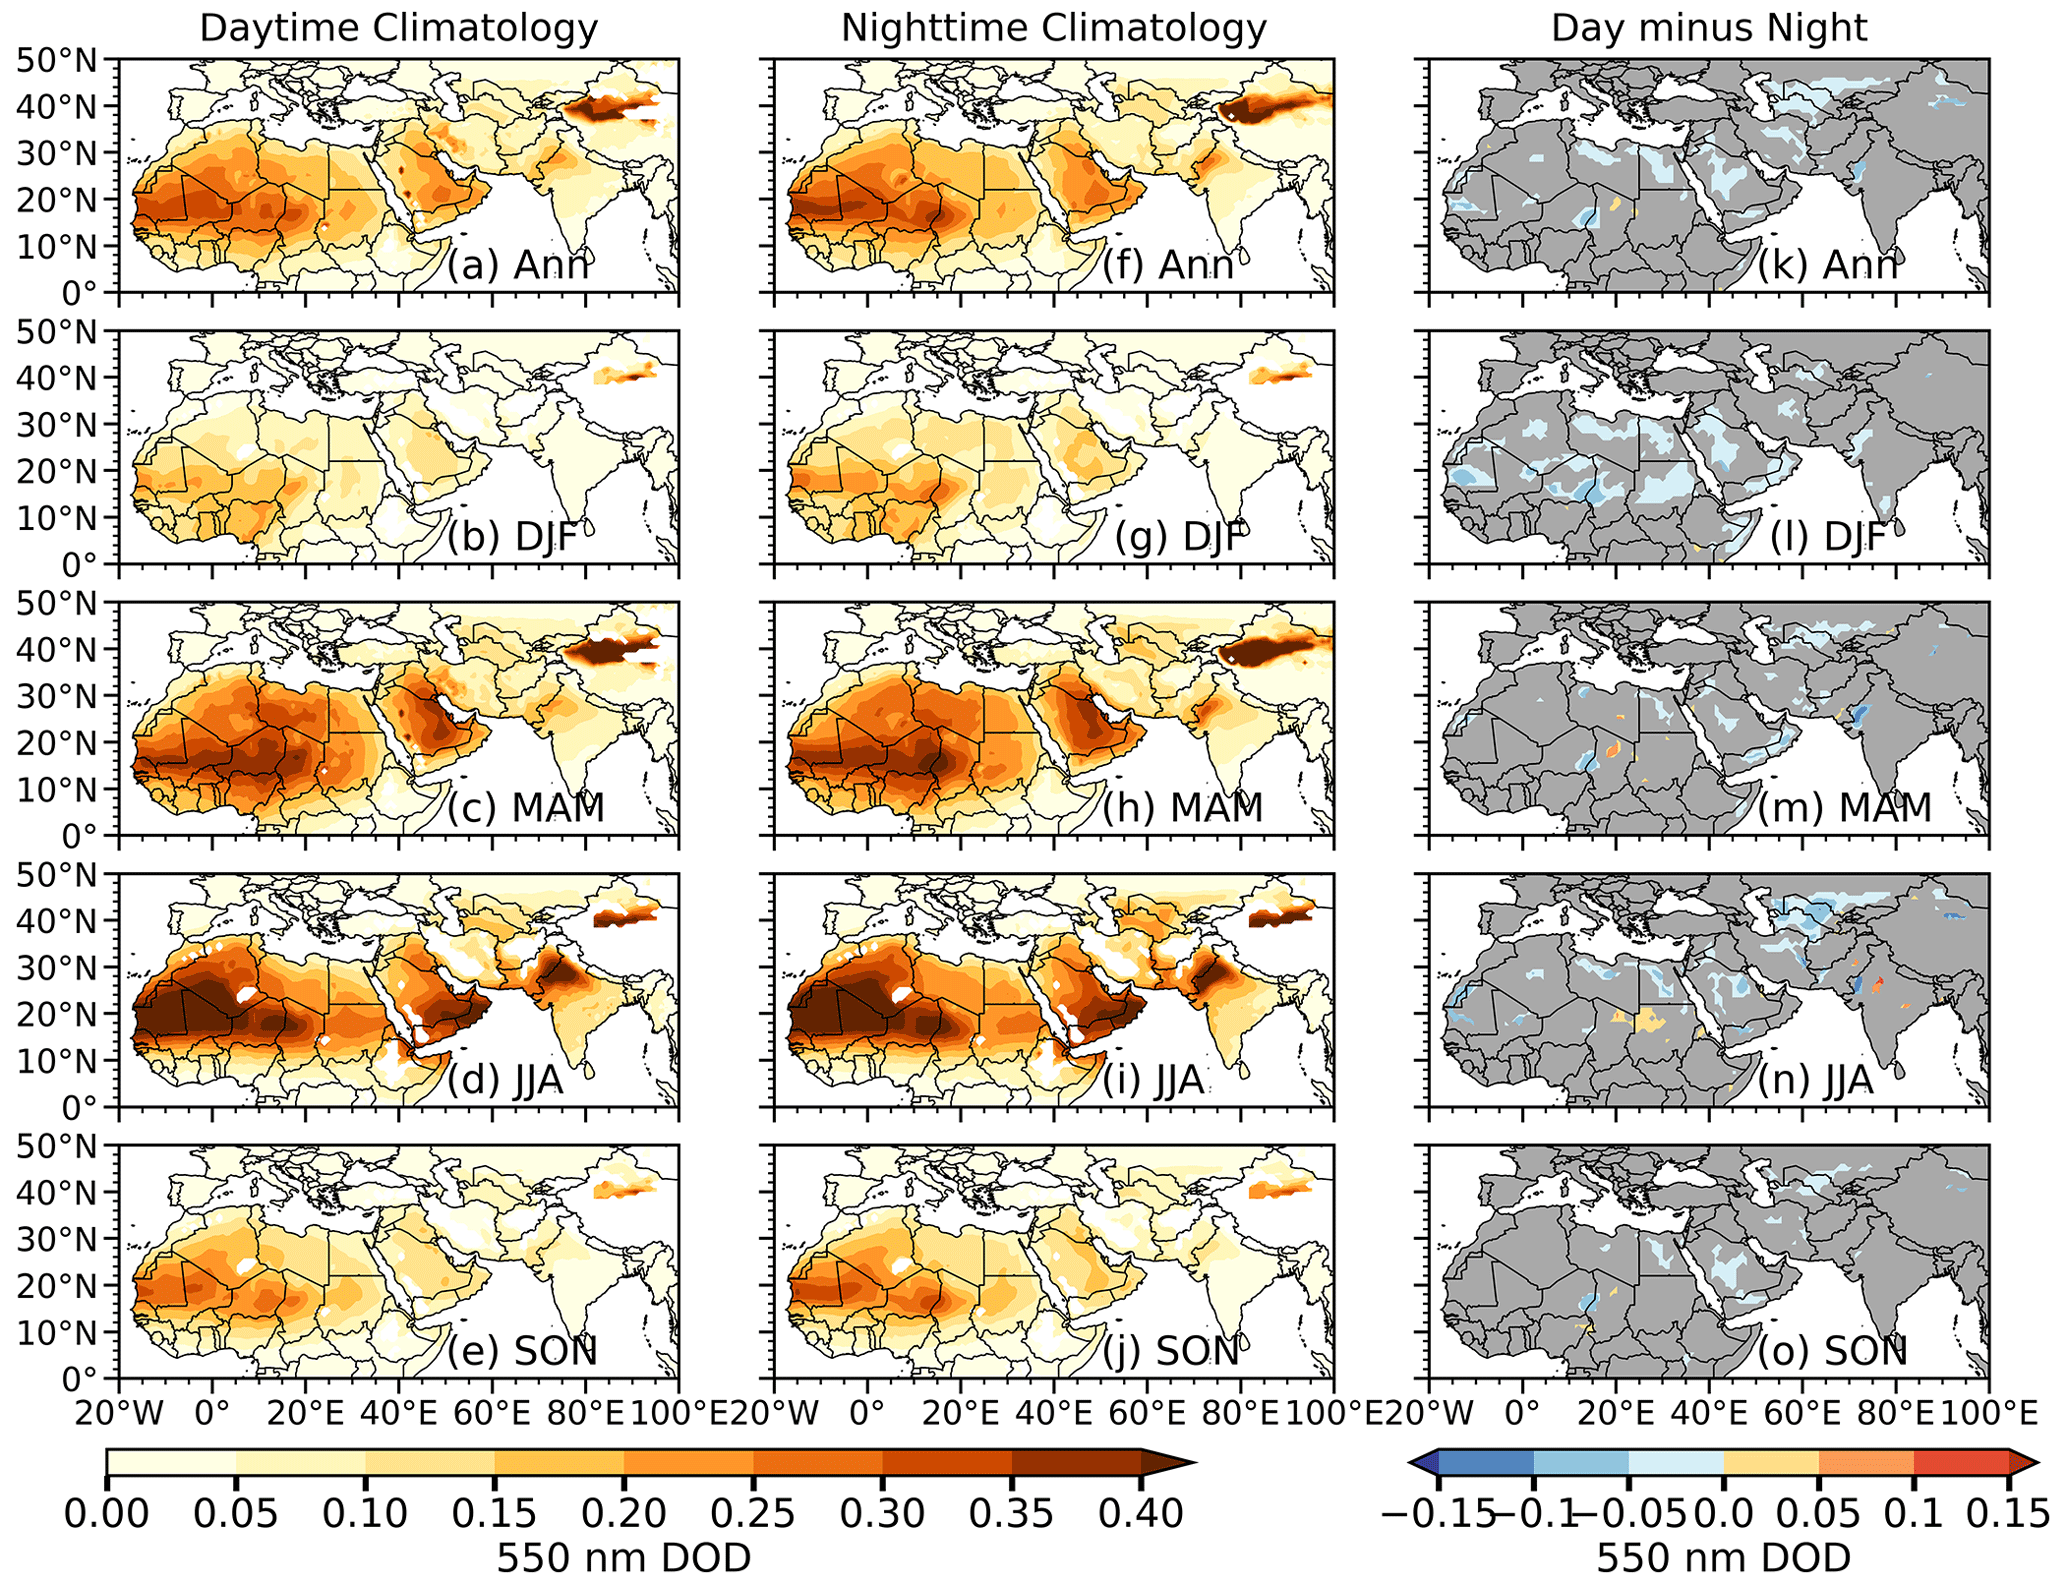
Figure 10The same as Fig. 9 but for EAC4.
3.6 Meteorological factors contributing to the observed day–night differences in dust aerosols
In this section we examine the impacts of meteorological conditions on the daytime and nighttime variations in dust aerosols, mainly DOD and dust layer height from IASI, over the dust belt using meteorological variables from MERRA-2, ERA5, IMERG, and LISA observational datasets.
3.6.1 Day–night differences in surface winds
Wind speed of appreciable magnitude can enhance dust emissions over dust source regions (Fernandez-Partagas et al., 1986; Todd et al., 2008; Schepanski et al., 2009; Marsham et al., 2011; Fiedler et al., 2013). Wind-driven dust emissions over source regions can be suspended in the atmosphere for several hours before depositing onto the surface; thus surface winds earlier or later than the passage of the IASI instrument can influence dust emissions at the IASI overpass time. To understand the impact of surface winds on the daytime and nighttime variations in DOD, we sampled ERA5 surface winds corresponding to IASI overpass times (i.e., 09:30 and 21:30 local solar ECT for daytime and nighttime; Fig. 11) and 3 h (06:30 and 18:30 local solar ECT; Fig. S4) and 6 h (03:30 and 15:30 local solar ECT; Fig. S5) prior to the IASI overpass time. Daytime wind speed is strong in magnitude and mostly northeasterly over a large area of North Africa in DJF, MAM, and SON (Fig. 11b, c, e), with a maximum in DJF over the central Sahara around the Bodélé Depression in Chad. This is consistent with the findings of Fiedler et al. (2013) and Schepanski et al. (2009), who showed a high frequency of nocturnal low-level jets over the Bodélé Depression in DJF. The strong surface winds over dust source regions, such as the Sahara and the Bodélé Depression, not only favor local dust emissions but also transport dust southward to the Guinea Coast (Fig. 4b, c, e). During JJA, following the development of the West African monsoon and Indian summer monsoon, surface winds become southwesterly over the Sahel, the Guinea Coast, and large parts of the Indian subcontinent (Fig. 11d, i). Consequently, a high magnitude of DOD is largely located over the northern Sahel and southern central Sahara between 15 and 30∘ N in North Africa and central to northern Pakistan in JJA (Fig. 4d).
Nighttime wind speeds are slightly weaker in comparison to the daytime (Fig. 11f–j). The magnitude of the day–night difference in surface wind is relatively strong during DJF–JJA, with a maximum in JJA (Fig. 11l–o). In North Africa, the day–night difference in surface wind speed is positive, i.e., with stronger daytime winds, and significant everywhere except over the northern portion of the Sahara along the coastal area of the Mediterranean Sea where the differences remain negative for all seasons and over the Guinea Coast where the differences are negative in DJF, MAM, and SON (Fig. 11l–o). Daytime surface wind speeds are more than 2 m s−1 higher than nighttime winds in some areas over the Sahara, likely resulting in stronger dust emissions and higher DOD in the Sahara during daytime. The weaker daytime winds over the central Arabian Peninsula and the Taklamakan Desert indicate that the observed day–night differences in surface winds likely cannot explain the positive day–night differences in IASI DOD in these source regions. Surface wind speed from MERRA-2 (not shown) revealed similar results except that the magnitude of the day–night difference is higher in DJF in MERRA-2. Similar patterns of daytime, nighttime, and day–night differences in surface winds are found at 3 to 6 h prior to the IASI overpass time but with smaller day–night differences than at the IASI overpass time (Figs. S4–S5).
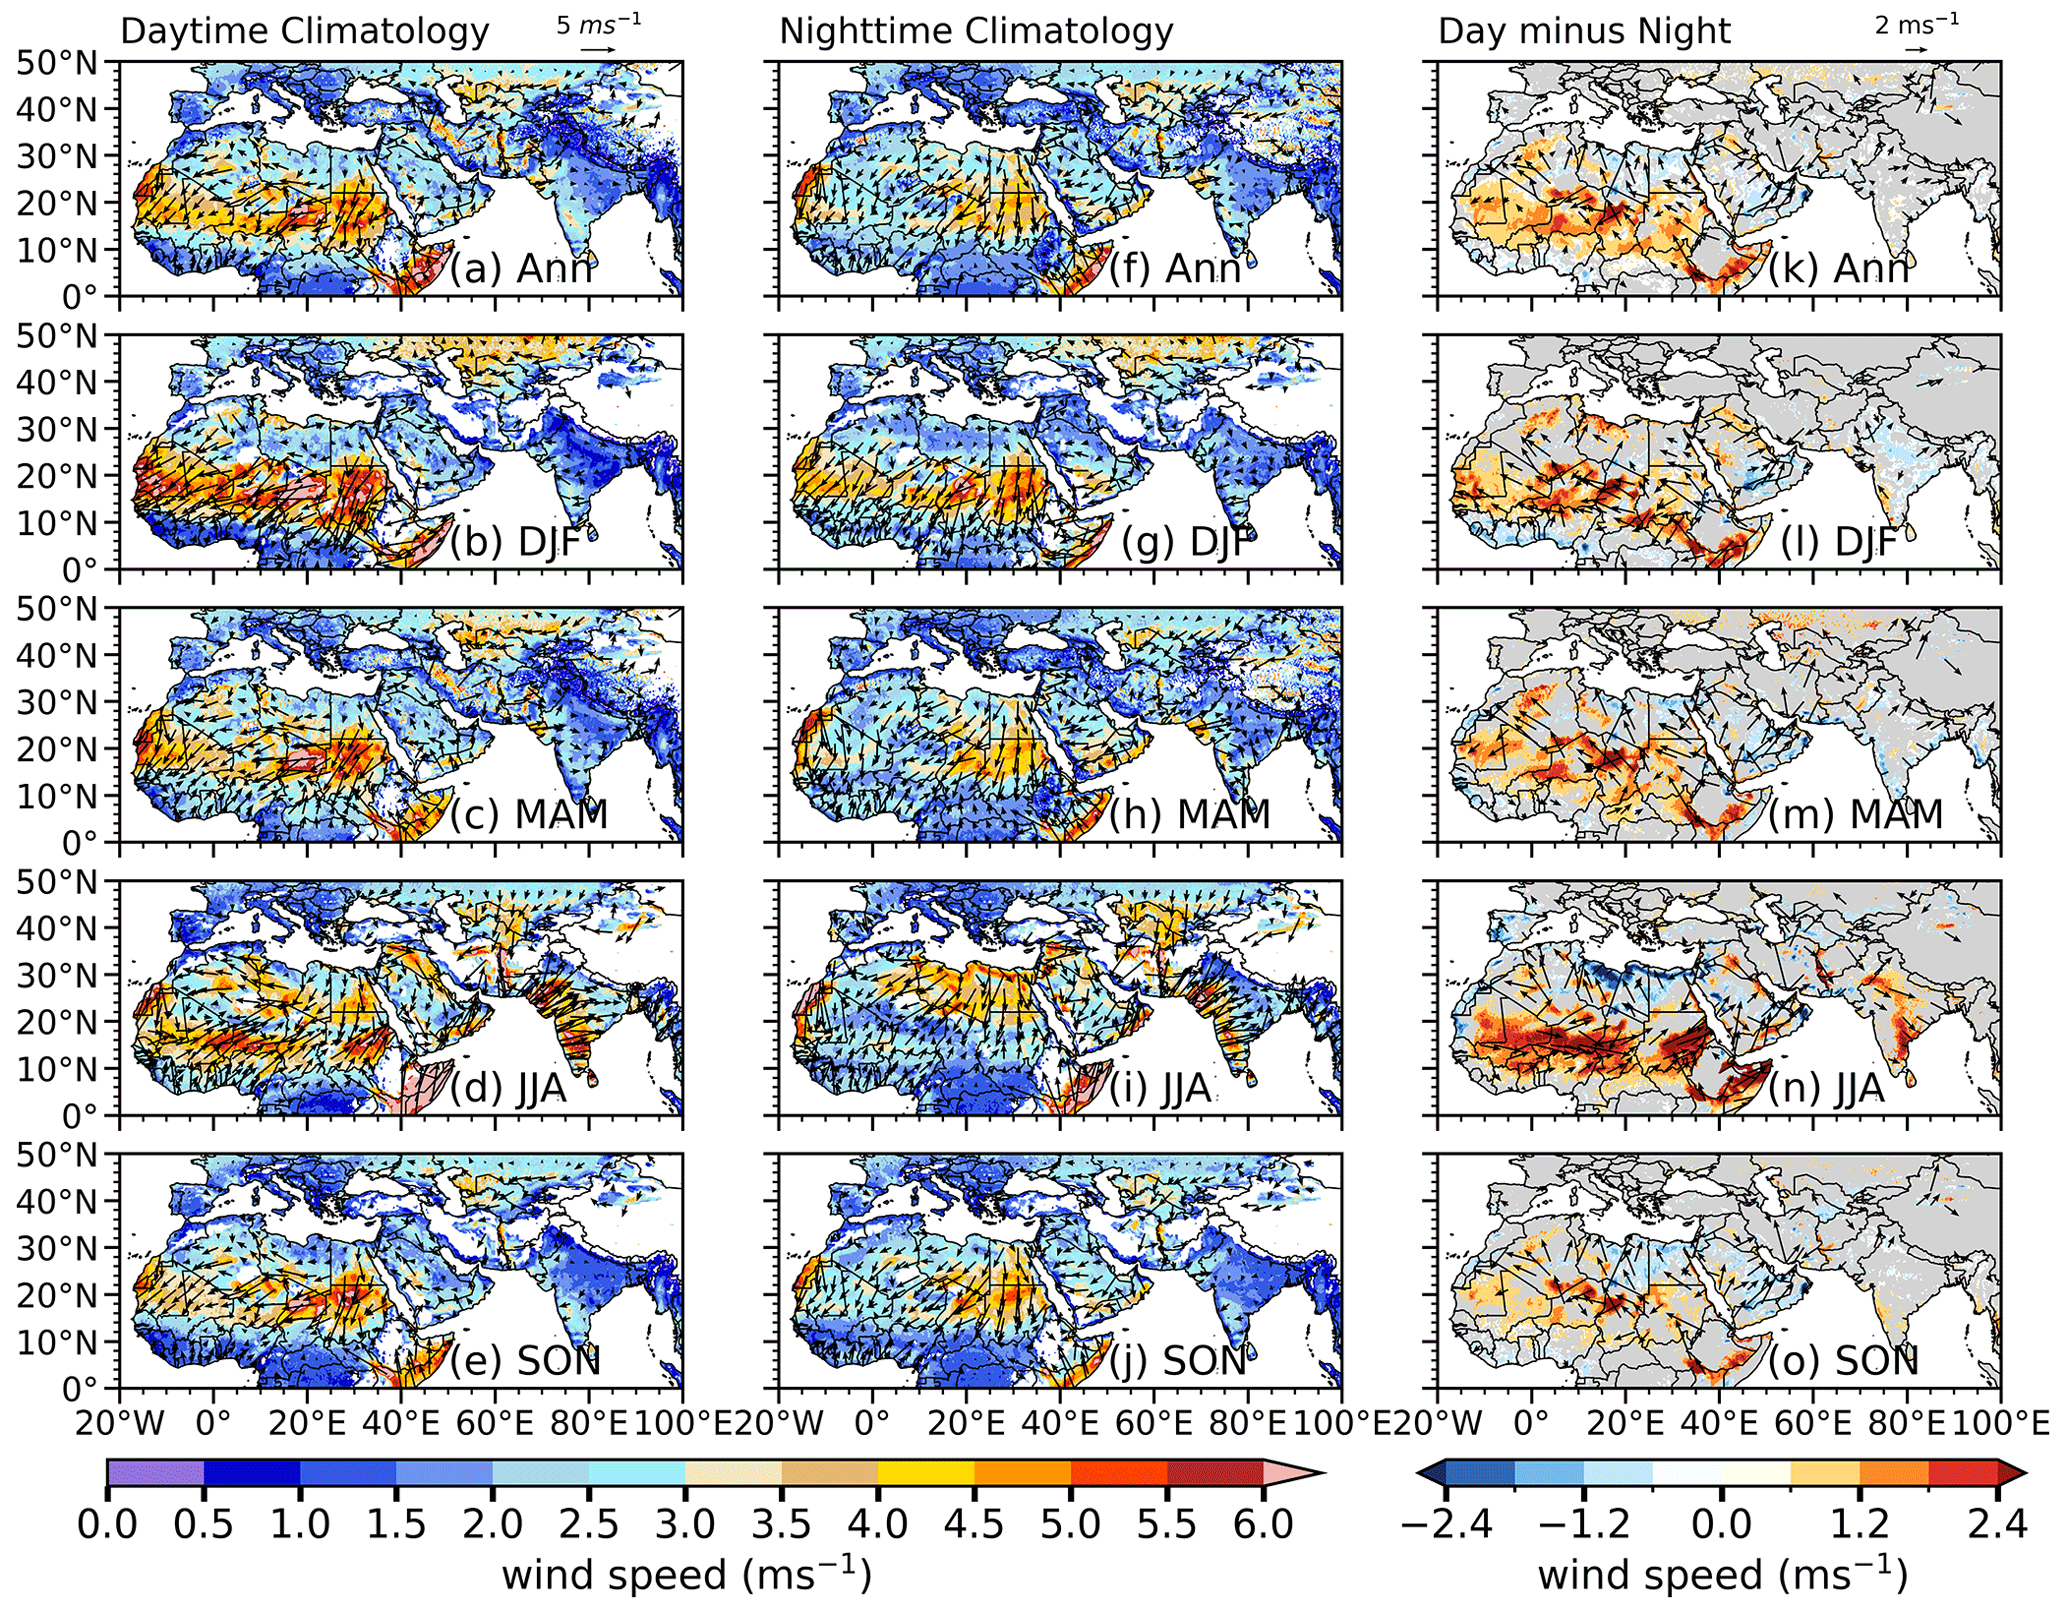
Figure 11Annual (Ann) and seasonal mean climatology (2008–2020) for (a)–(e) daytime and (f)–(j) nighttime and (k)–(o) day–night differences in surface winds from ERA5 (unit: m s−1). Data at each grid point are resampled according to the IASI overpass time, i.e., 09:30 local solar ECT during the daytime and 21:30 local solar ECT during nighttime. Shading shows wind speed, and vectors denote wind directions. Areas where day–night differences in wind speed do not pass the 95 % confidence level (t test) in (k)–(o) are masked out in grey. Only differences in wind vectors significant at the 95 % confidence level are shown.
While surface winds can affect both the emissions and transport of dust from source regions, the dust uplift potential (DUP; Marsham et al., 2011) better quantifies the dust emission power of winds. Figure 12 shows the climatology of daytime, nighttime, and day–night differences in DUP calculated using surface wind speed from ERA5 reanalysis and a monthly 2D threshold velocity of wind erosion retrieved by Pu et al. (2020). The seasonal climatology of DUP reveals that wind speed capable of dust emissions is predominantly in the northern part of the Sahel to the central Sahara, the central to eastern Arabian Peninsula, and around the Taklamakan Desert with the strongest DUP in DJF, MAM, and JJA. The day–night difference in DUP is positive and significant in the Sahara and around the central to eastern Arabian Peninsula, largely consistent with higher daytime DOD in these regions (Fig. 4l–o), indicating stronger daytime dust emissions and likely contributing to the positive day–night differences in DOD (Fig. 4). An attempt has been made to also compare these results with DUP calculated using a constant threshold wind velocity of 7 m s−1 following Marsham et al. (2011) and Bergametti et al. (2017), and the overall results are similar except the magnitude of DUP using a constant velocity threshold is slightly less (Fig. S6).
How do diurnal variations in surface winds affect the diurnal cycle of dust aerosols at LISA and AERONET sites? Figure 13 shows the diurnal cycle of observed surface wind speed from LISA station data over LISA sites and ERA5 reanalysis over AERONET sites. The vertical cyan lines mark the 09:30 and 21:30 local solar ECT corresponding to IASI overpass times. Surface wind speeds at LISA sites (Ban, Cin, and Mbo) over the Sahel peak in the morning around 10:00–11:00 LST in most of the seasons except at the Mbo site in JJA and SON, where surface winds maximize in the afternoon around 15:00–16:00 LST (Fig. 13a–c). A minimum of surface wind speed usually occurs in the evening around 20:00 or midnight, with a secondary minimum around early morning (∼ 07:00). The diurnal cycle of surface PM10 concentrations shows similar maxima in the late morning around 10:00–11:00 and minima in early morning around 06:00–07:00 (Fig. 8a–c), coinciding with the variations in surface wind speeds (Fig. 13a–c), which is consistent with the findings of Kaly et al. (2015).
The morning peaks (around 07:00–08:00 LST) of surface wind speed at AERONET stations in North Africa (Dak, Iza, SCT, Ilo, and Kof) are consistent with the morning maxima of CAOD (Fig. 8d–h), while the wind speed minima in the early hours (about 09:00–10:00) at SCT and late afternoon to evening (around 16:00–18:00) at most sites (Dak, Iza, Kof, and Ilo; Fig. 13d, f, g, h) are also consistent with the minima of CAOD (Fig. 8d–h). Over the Middle East sites (e.g., Mig, Sha, Mez, and DEW) wind speed generally peaks in late afternoon to early evening (about 16:00–18:00) in Mig and Sha during JJA (Fig. 13i, j) and in Mez and DEW during MAM (Fig. 13k, l) and also largely coincides with the maxima in CAOD (Fig. 8i–l). At Mez and Kof stations, the secondary peaks of CAOD in the afternoon or nighttime largely coincide with increases in surface wind speed but not so at other sites such as Ilo. In short, the comparison between the diurnal cycle of surface wind speed and CAOD or PM10 concentrations reveals similar diurnal variations, especially for the early morning minima of wind speed and CAOD or PM10 concentration and the late morning maxima. Individual sites show some local features depending on their distances to dust sources and ocean, elevation, and seasonality.
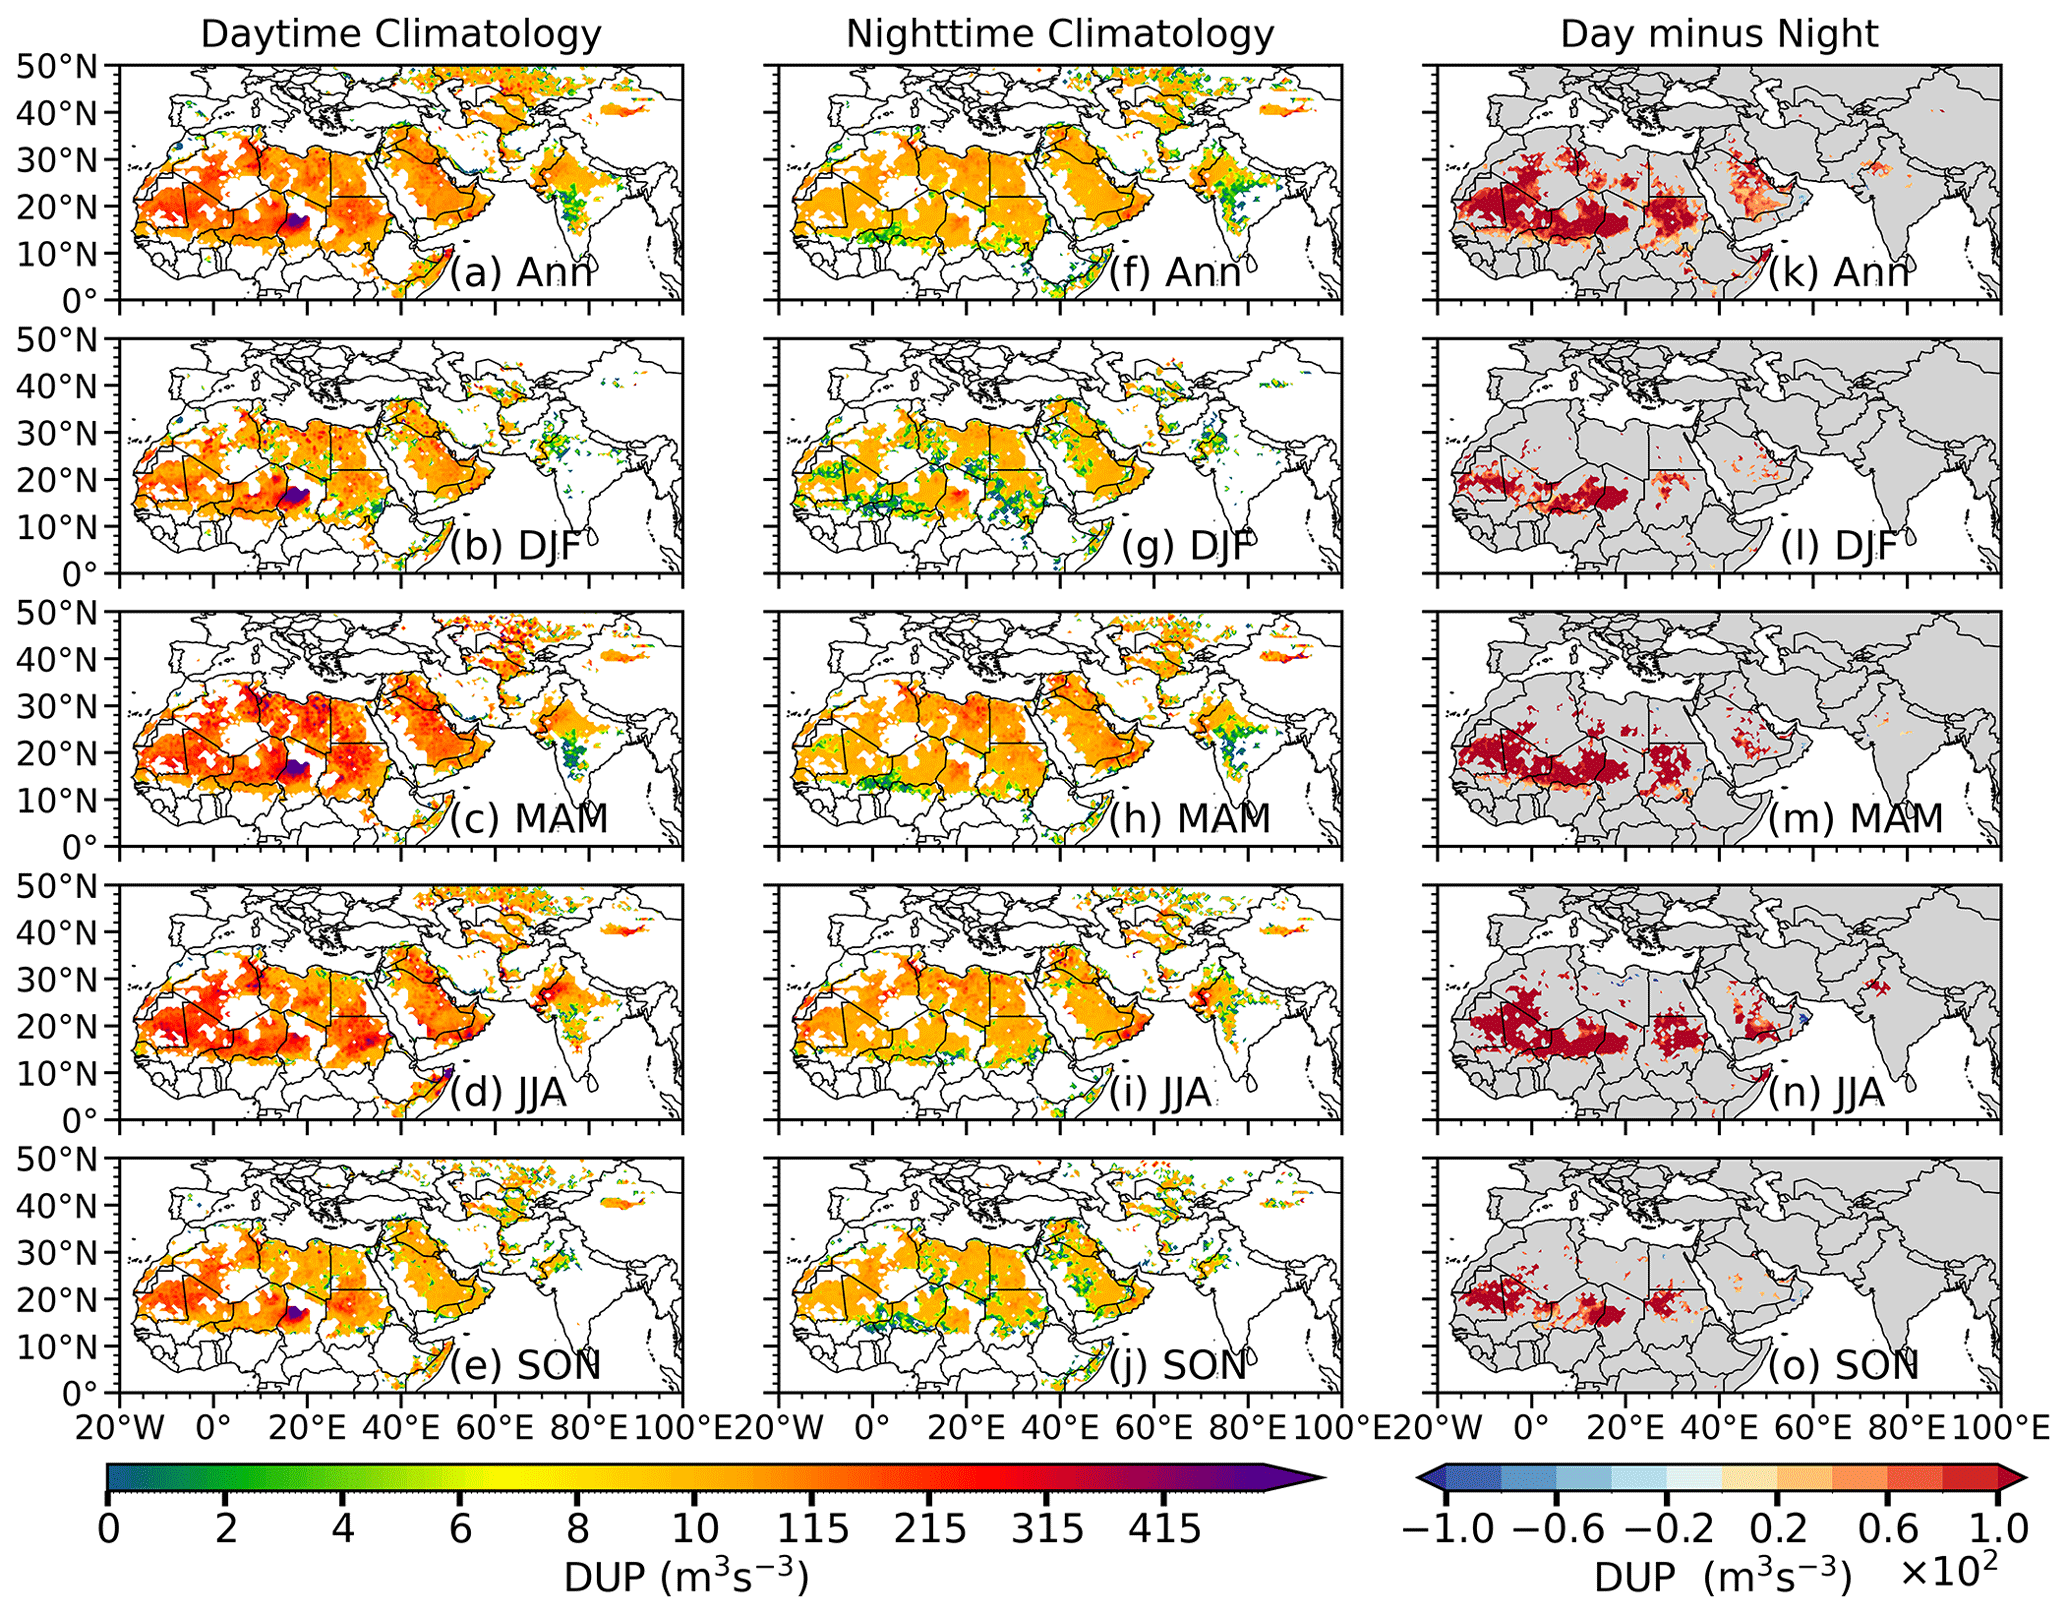
Figure 12Annual (Ann) and seasonal mean climatology (2008–2020) (a)–(e) of dust uplift potential (DUP) for daytime and (f)–(j) nighttime and (k)–(o) day–night difference using the wind velocity threshold estimated by Pu et al. (2020) and surface wind speed from ERA5 (unit: m3 s−3). Wind speeds at each grid point are resampled according to the IASI overpass time, i.e., 09:30 local solar ECT during the daytime and 21:30 local solar ECT during nighttime. Areas where day–night differences in DUP do not pass the 95 % confidence level (t test) in (k)–(o) are masked out in grey.
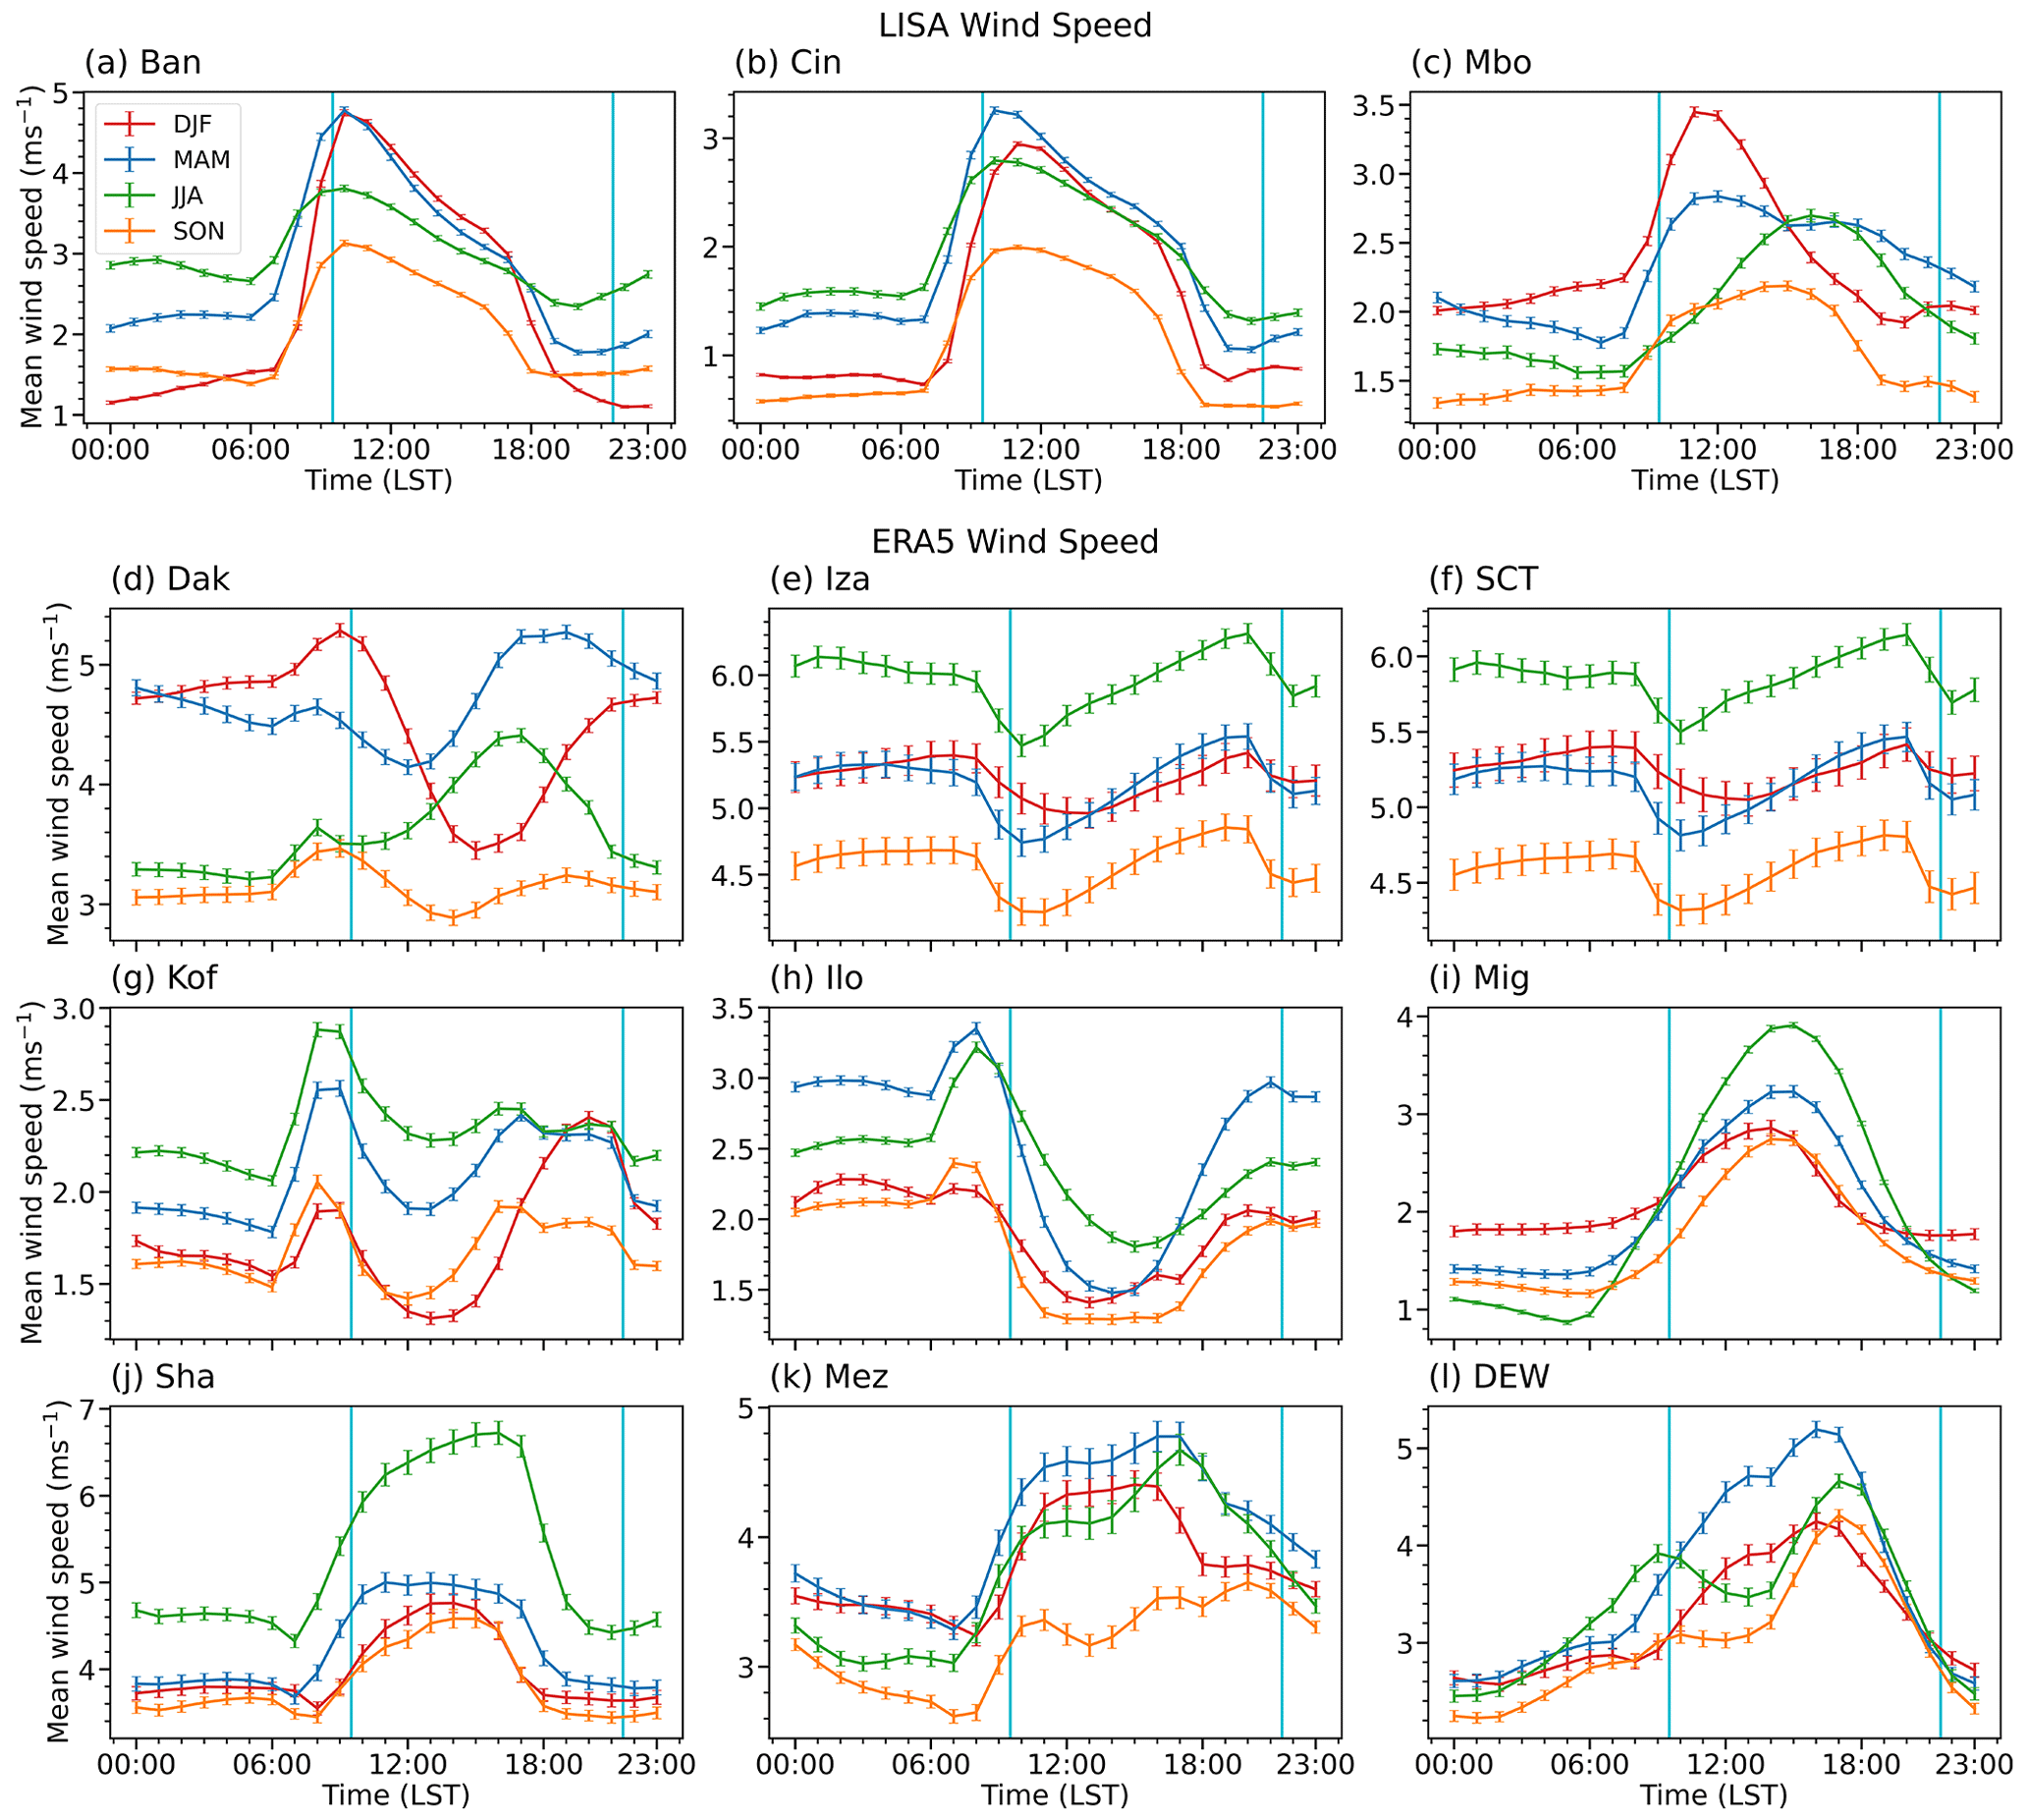
Figure 13Diurnal cycle of (a)–(c) observed surface wind speed at LISA sites and (d)–(l) ERA5 surface wind speed over AERONET sites in different seasons averaged over 2008–2020 for Ban and Cin, 2008–2012 for Mbo of LISA sites, and over 2008–2020 for ERA5 (unit: m s−1). Note that Iza and SCT sites are very close to each other (see Figs. 1, S1 and Tables 2, 3), so their surface winds are similar in ERA5. The vertical cyan lines mark the IASI passing time at 09:30 and 21:30 local solar ECT. Error bars show standard errors.
3.6.2 Precipitation
Precipitation is another factor that can influence the spatiotemporal variability of dust over the dust belt (Engelstaedter et al., 2006; Engelstaedter and Washington, 2007; Knippertz and Todd, 2012; Pu and Ginoux, 2018). Precipitation affects dust aerosols through wet deposition and increased soil moisture that modifies the threshold wind velocity for dust emissions. It is therefore expected that precipitation events several hours before the IASI passage may have impacts on dust emissions at the IASI overpass time. To examine the potential impacts of previous precipitation events on the daytime and nighttime variations in DOD, we analyze the annual and seasonal mean climatology of daytime and nighttime precipitation from IMERG sampled at the IASI overpass time (09:30 and 21:30 local solar ECT; Fig. 14), 3 h prior to the IASI overpass time (06:30 and 18:30 local solar ECT; Fig. S7), and 6 h prior to the IASI overpass time (03:30 and 15:30 local solar ECT; Fig. S8). At the IASI overpass time (Fig. 14), there is low precipitation over large areas of the domain, except at the western Guinea Coast in MAM, JJA, and SON and part of the Horn of Africa in MAM. The day–night differences in precipitation are only significant over a few spots over the central to northern Sahara in JJA, showing a slightly higher precipitation rate during nighttime (Fig. 14n), which may suppress dust emissions and partially contribute to higher daytime DOD in these regions. At about 3 h prior to the IASI overpass (06:30 and 18:30 local solar ECT; Fig. S7), precipitation rates are much higher during nighttime, with larger values along the southern Sahel and the Guinea Coast in JJA and SON and over the Indian subcontinent. Precipitation rates are even higher at 6 h prior to the IASI overpass (03:30 and 15:30 local solar ECTs; Fig. S8). Similarly, the day–night differences in precipitation at about 3 to 6 h prior to the IASI overpass time also show large insignificant areas (Figs. S7–S8), indicating that wet deposition may not be playing any significant role in controlling the observed day–night differences in IASI DOD.
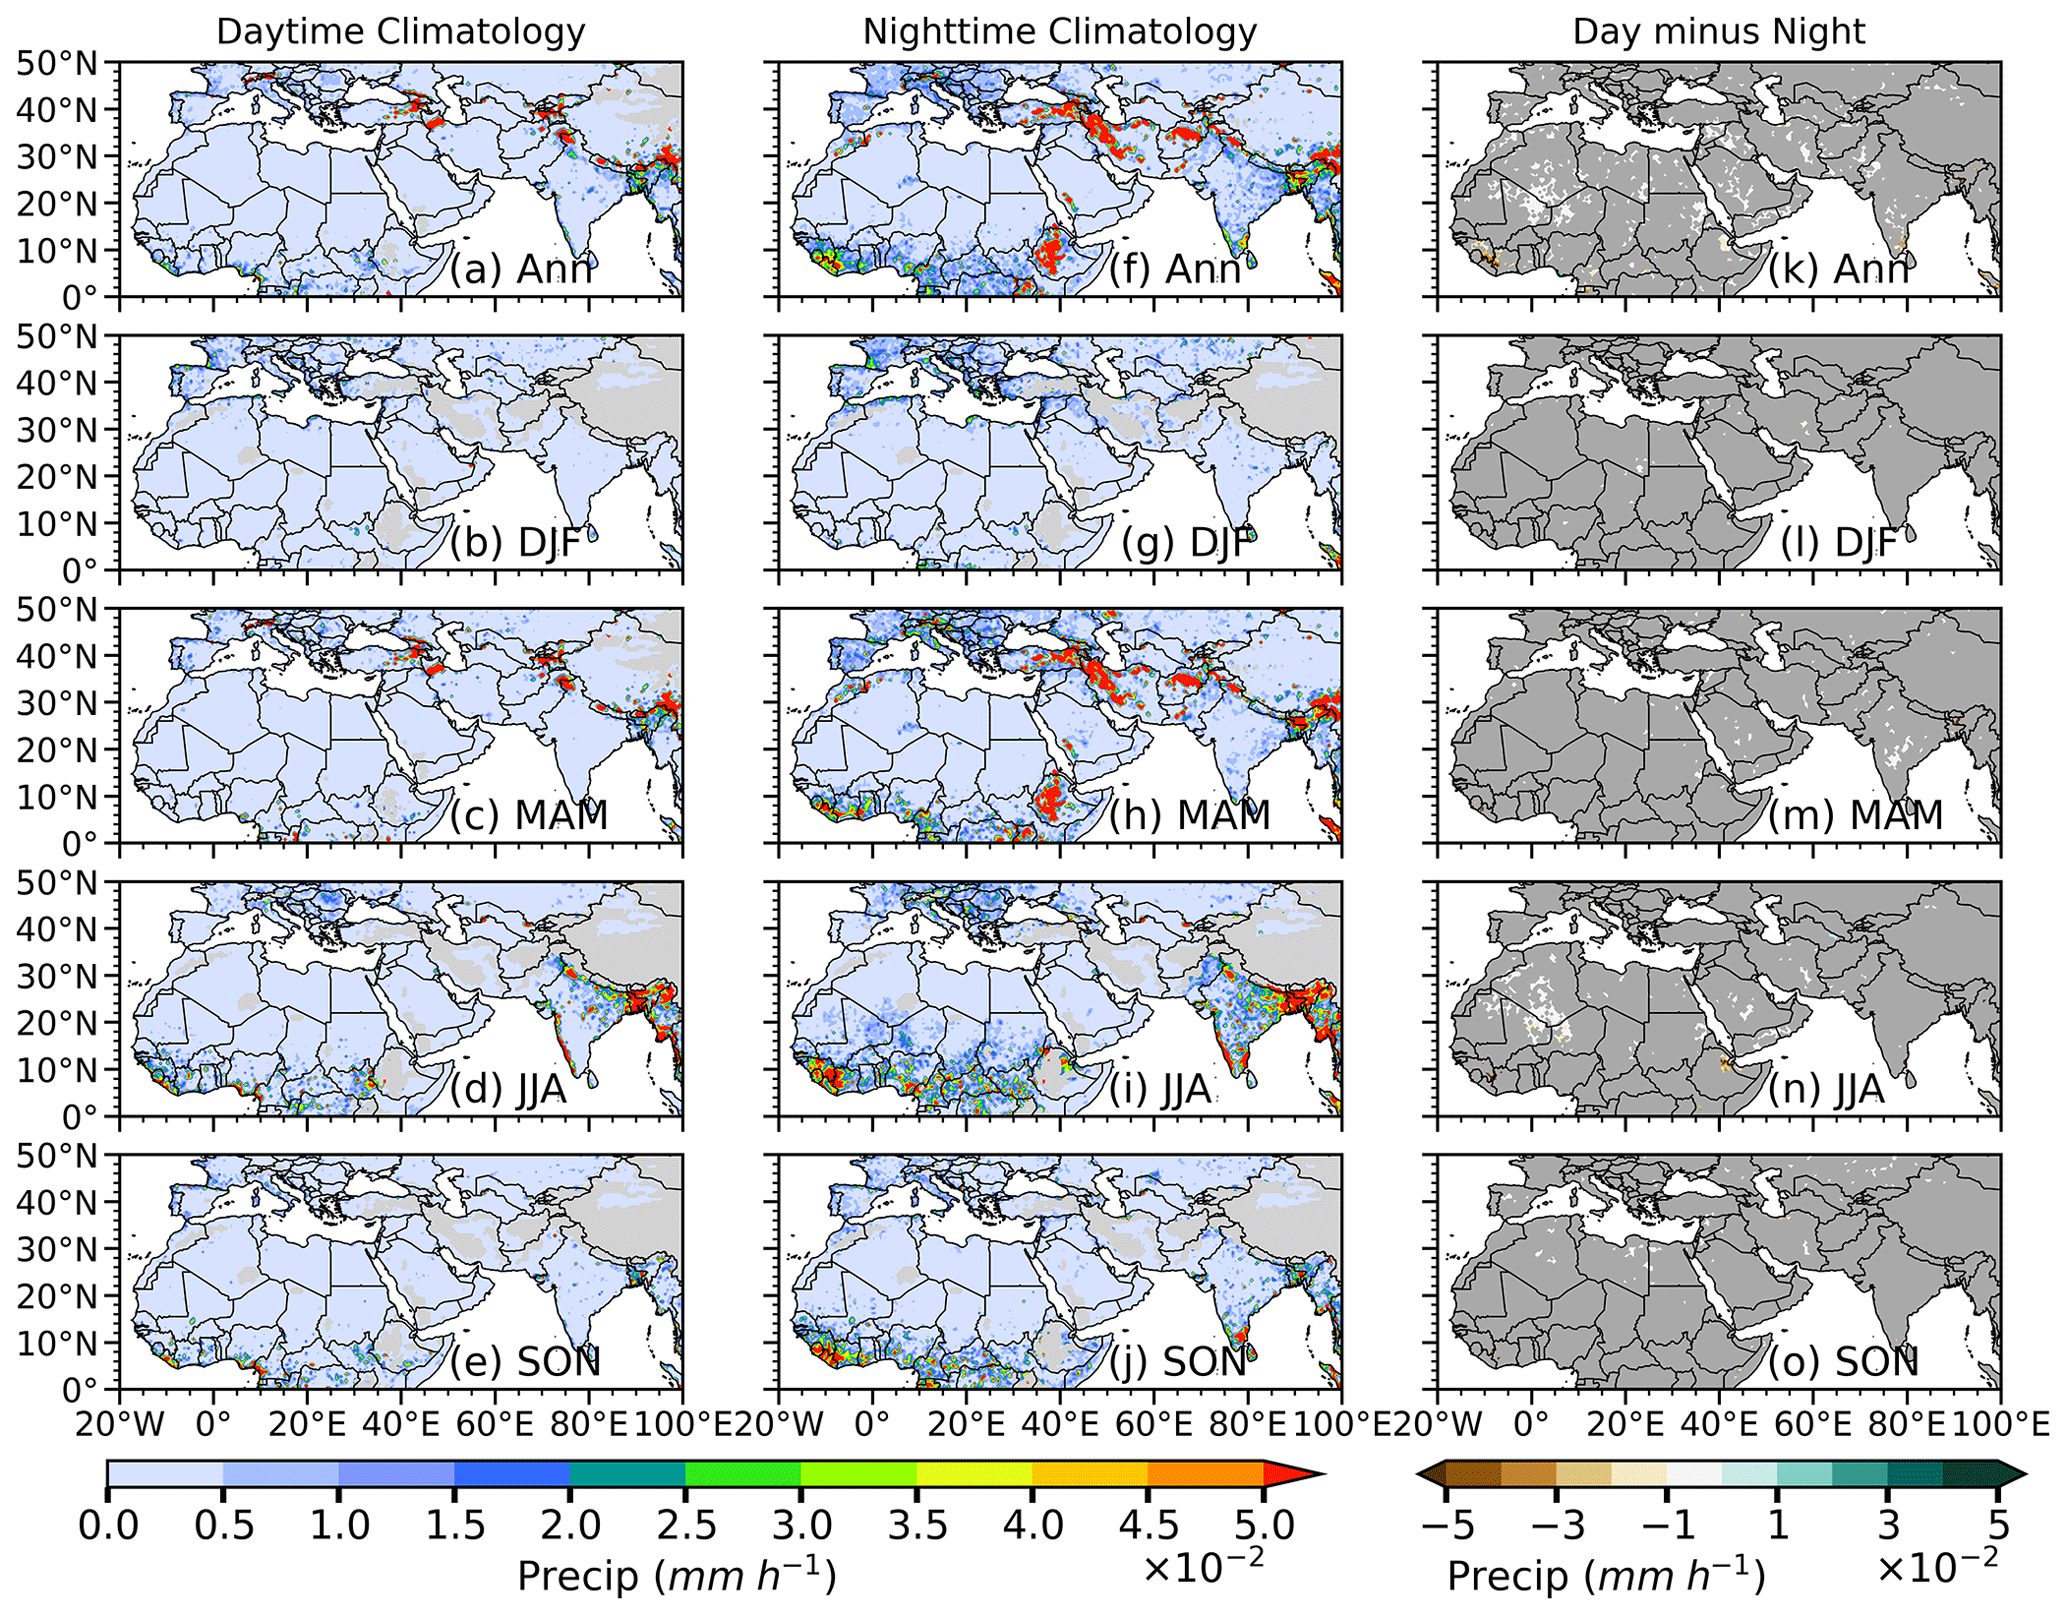
Figure 14Annual (Ann) and seasonal mean climatology (2008–2020) of IMERG precipitation (mm h−1) for (a)–(e) daytime (09:30 local solar ECT) and (f)–(j) nighttime (21:30 local solar ECT) and (k)–(o) the day–night difference. Precipitation at each grid point is sampled according to the IASI overpass time, i.e., 09:30 local solar ECT during the daytime and 21:30 local solar ECT during nighttime. Areas where day–night differences of precipitation do not pass the 95 % confidence level (t test) in (k)–(o) are masked out in grey.
To further explore the impacts of the diurnal cycle of precipitation on dust aerosols we examined precipitation at LISA and AERONET stations using LISA and IMERG observations (Fig. 15). From LISA observations over the Sahel, precipitation peaks around the early hours of the day (02:00 to 08:00) over Ban and Cin in JJA (Fig. 15a, b) and in the late afternoon to early evening (14:00 to 19:00) over Mbo in JJA and SON (Fig. 15c), which is consistent with previous studies in this region (Marticorena et al., 2010; Kaly et al., 2015). The higher precipitation rates from midnight to early morning in JJA possibly contributed to the lower daytime PM10 concentration in Ban and Cin (Fig. 8a, b), leading to a negative day–night difference in PM10 concentration at Ban and Cin (Fig. 4n).
Precipitation from IMERG reveals that Dak, which is collocated with the LISA Mbo site, has a peak in JJA around 17:00 to 22:00 and around 02:00 in SON (Fig. 15d), which is somewhat different from station observations (Fig. 15c). The increase in precipitation in the afternoon and the maxima around 17:00–18:00 (15:00–16:00) at Dak, Ilo, and Kof sites in JJA and SON (Fig. 15d, g, and h) roughly coincide with CAOD minima around 17:00–18:00 (Fig. 8d, g, and h), suggesting that wet deposition likely reduces airborne dust. Also note that since AERONET CAOD data are cloud-screened, few records are available during precipitation-prone hours. Thus, the scavenging effect of precipitation on dust may not be fully illustrated on the AERONET CAOD time series. The coastal sites, i.e., Iza and SCT, have a higher precipitation rate in DJF and SON than in other seasons, with a maximum at about 06:00 in Iza and around dawn in SCT (00:00–04:00; Fig. 15e, f) and a secondary peak at noon in SCT (Fig. 15e, f). The morning precipitation maxima in Iza and SCT may also contribute to minima in CAOD in the early hours of DJF and SON (Fig. 8e, f). Nonetheless, in the Middle East, the precipitation maxima around 21:00 in JJA at Mez (Fig. 15k), 03:00 in DJF at Mig and Sha (Fig. 15i and j), and 05:00 in DJF at DEW (Fig. 15l) largely correspond to smaller CAOD a few hours later in DJF and SON over Sha, Mig, and DEW (Fig. 8i, j, l) but are not so evident in Mig and Mez (Fig. 15i, k).
3.6.3 Planetary boundary layer height and atmospheric stability
The planetary boundary layer (PBL) plays a vital role in regulating the vertical mixing and transport of near-surface aerosols, including dust aerosols (Knippertz and Todd, 2012). A convective planetary boundary layer on a clear, sunny day over desert regions can enhance dust emissions and vertical transport (Sinclair, 1969; Oke et al., 2007; Ansmann et al., 2009; Knippertz and Todd, 2012). For regions far away from dust sources with lower local emissions, the rising boundary layer likely promotes horizontal and vertical dispersal of aerosols, leading to reductions in their concentrations (Petäjä et al., 2016; Pal et al., 2014; Li et al., 2017; Lou et al., 2019). High concentrations of absorbing dust aerosols within the boundary layer can enhance the absorption and scattering of a significant amount of solar radiation, decreasing the net radiation at the surface, which can reduce the sensible heat fluxes needed to drive the PBL evolution, leading to a much shallower PBL height (PBLH; Li et al., 2017). A shallower PBLH can further increase the surface concentration of aerosols, leading to a positive feedback loop (Li et al., 2017). It is thus important to examine the impacts of the PBLH on the day–night differences in dust aerosols.
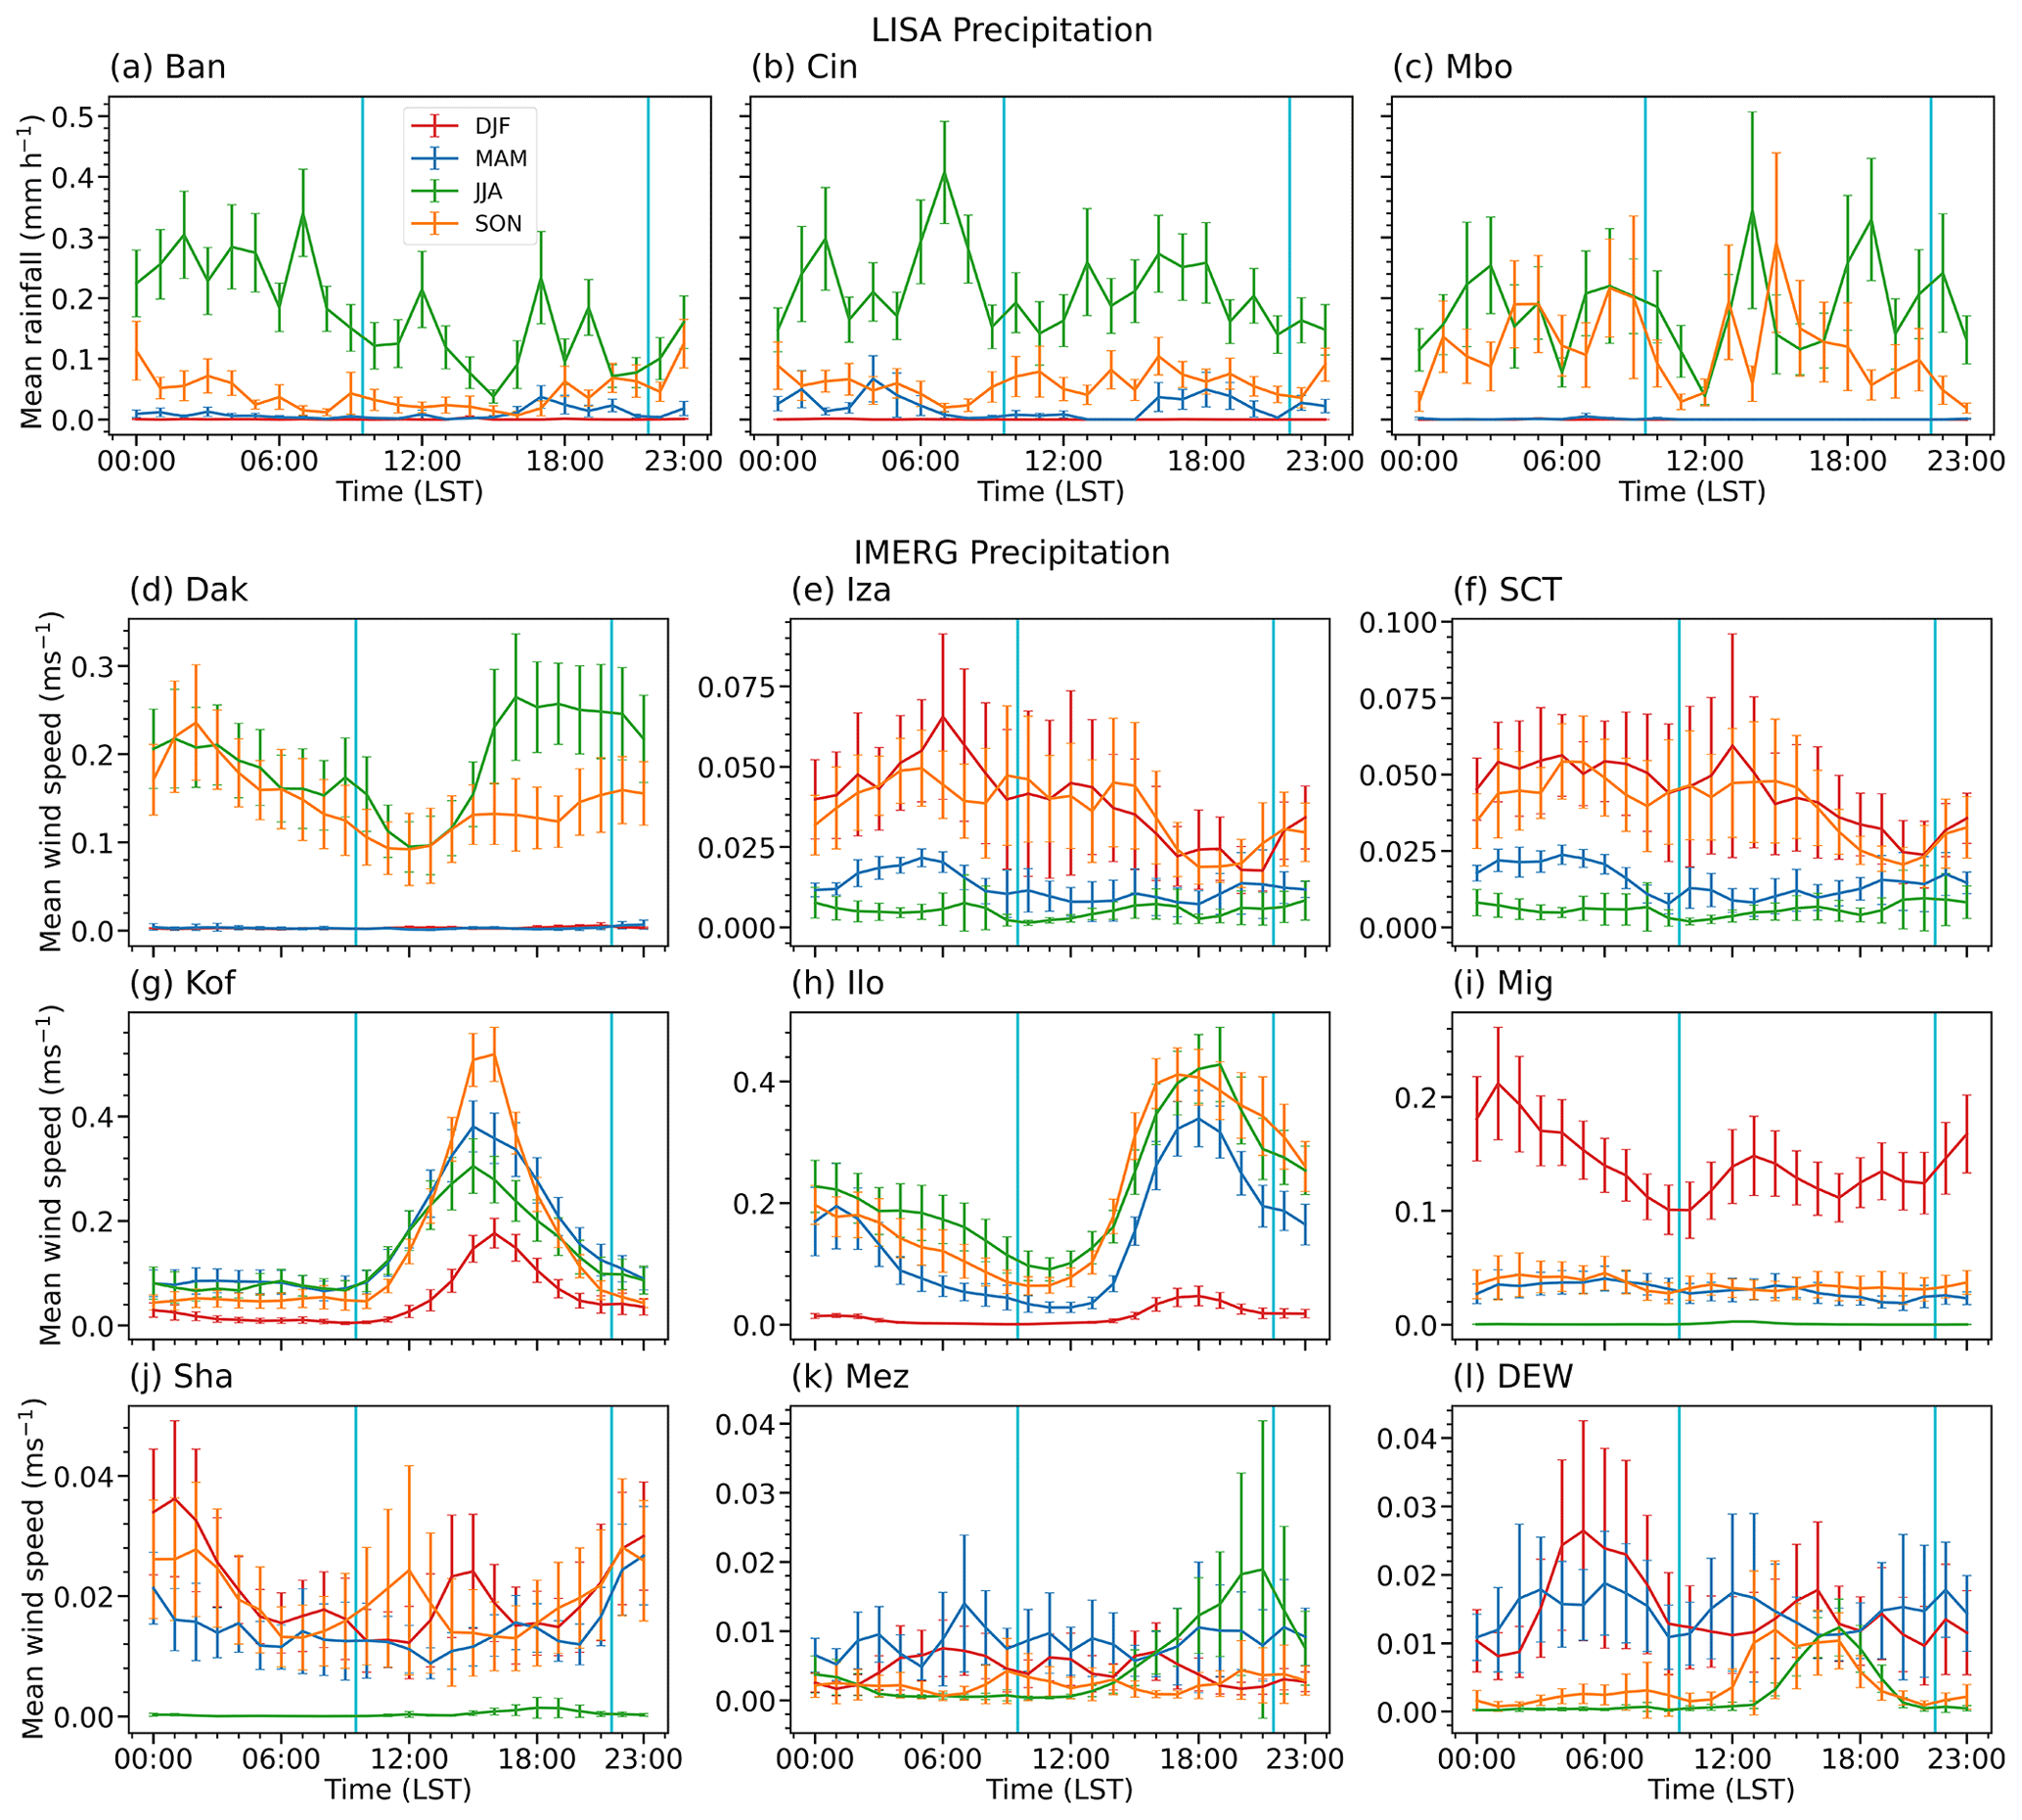
Figure 15Diurnal cycle of (a)–(c) observed precipitation over LISA sites and (d)–(l) IMERG precipitation over AERONET sites in different seasons averaged over 2008–2020 for Ban and Cin, 2008–2012 for Mbo of LISA sites, and 2008–2020 for IMERG (unit: mm h−1). The vertical cyan lines mark the IASI passing time at 09:30 and 21:30 local solar ECT. Error bars show the standard errors.
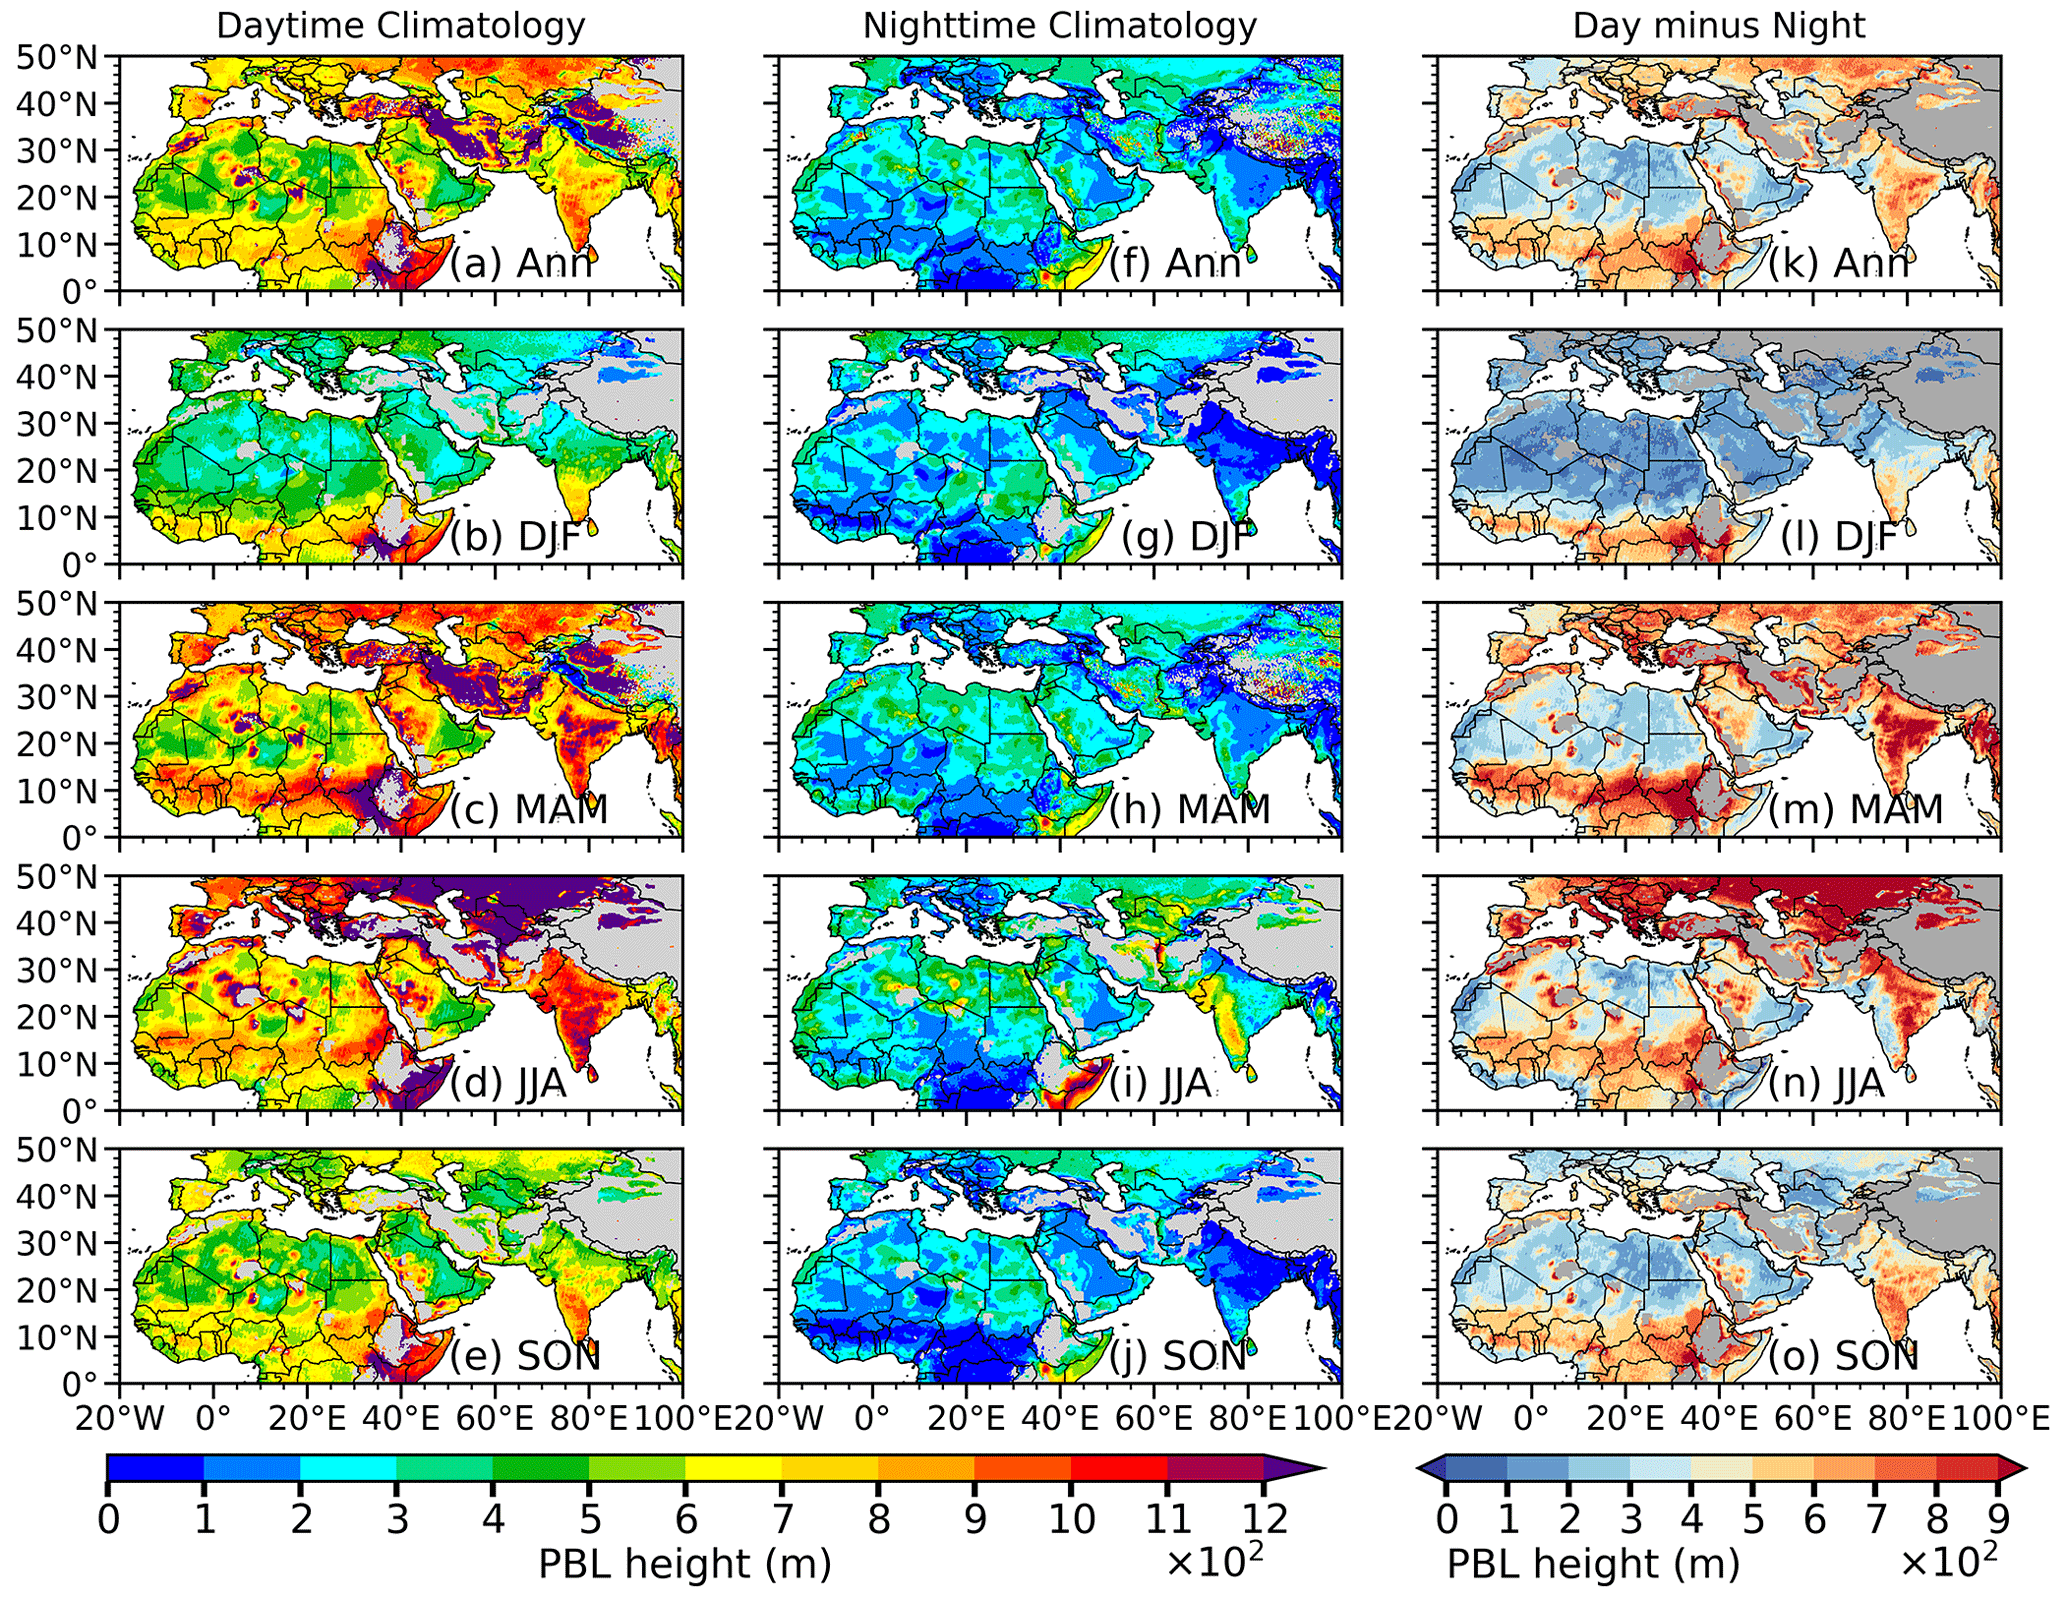
Figure 16Annual (Ann) and seasonal mean climatology (2008–2020) of planetary boundary layer height (PBLH) for (a)–(e) daytime (09:30 local solar ECT) and (f)–(j) nighttime (21:30 local solar ECT) and (k)–(o) day–night differences from ERA5. PBLH at each grid point is sampled according to the IASI overpass time, i.e., 09:30 local solar ECT during the daytime and 21:30 local solar ECT during nighttime. Areas where day–night differences in PBLH do not pass the 95 % confidence level (t test) in (k)–(o) are masked out in grey.
Figure 16 shows the climatology of PBLH during daytime and nighttime and the day–night differences over the dust belt from ERA5. PBLH is the highest at daytime during JJA, with higher values over the Guinea Coast, central Sahara, and large areas of Eurasia. In general, the day–night difference in PBLH is positive everywhere in the study domain, with smaller differences (0–400 m) over major dust source regions, e.g., the Sahara, the central to eastern Arabian Peninsula, and the Taklamakan Desert (DJF, SON; Fig. 16l, o), but larger differences (> 400 m) over the Guinea Coast, the western Arabian Peninsula, large parts of the Indian subcontinent, and around the Taklamakan Desert (MAM, JJA; Fig. 16m, n). These results are consistent with a similar analysis from MERRA-2 (Fig. S9), except MERRA-2 PBLH is much higher than that from ERA5, especially during the nighttime, by about 1000–1500 m over the Sahara and the Arabian Peninsula. The discrepancies are largely due to the different methods used to estimate PBLHs in the reanalyses, with the bulk Richardson number method being used in ERA5 and a threshold of total eddy diffusion coefficient of heat in MERRA-2 (Zhou et al., 2021).
A careful examination of these results reveals that the overall pattern of day–night differences in PBLH (Fig. 16k–o) is somewhat similar to the pattern of the day–night differences in dust layer height (Fig. 5k–o) but opposite to the pattern of day–night difference in DOD (Fig. 4k–o) in IASI. The larger day–night differences in PBLH over the southern Sahel, the Guinea Coast, and the Indian subcontinent indicate that a growing PBL during daytime is likely entraining dust aerosols into higher altitudes where they are susceptible to upper-level horizontal transport. The dilution may contribute to the negative day–night difference in DOD (i.e., lower daytime DOD than nighttime) in the regions.
An examination of the convective available potential energy (CAPE; Fig. 17) and vertical velocity at 850 hPa (Fig. S10) further shows higher CAPE along with a rising motion over the Sahel, the Guinea Coast, and the Indian subcontinent during the daytime (Figs. 17a–e, S10a–e), which may vertically mix dust aerosols into the free troposphere for horizontal dispersion, leading to lower dust concentrations and DOD and higher dust layer heights in daytime. For example, a higher daytime than nighttime CAPE over the southern Sahel (extending to the northern Sahel in JJA and SON; Fig. 17k–o), the Guinea Coast (DJF, MAM; Fig. 17l, m), and the central Indian subcontinent (MAM; Fig. 17m) is consistent with an upward motion in the southern parts of the Sahel, the Guinea Coast, and the central to northern Indian subcontinent during the daytime (Fig. S10b–e) as well as lower daytime DOD (Fig. 4k–o) and higher dust layer height (Fig. 5k–o).

Figure 17Annual (Ann) and seasonal mean climatology (2008–2020) of convective available potential energy (CAPE) for (a)–(e) daytime (09:30 local solar ECT) and (f)–(j) nighttime (21:30 local solar ECT) and (k)–(o) day–night differences from ERA5. CAPE at each grid point is sampled according to the IASI overpass time, i.e., 09:30 local solar ECT during the daytime and 21:30 local solar ECT during nighttime. Areas where day–night differences in CAPE do not pass the 95 % confidence level (t test) in (k)–(o) are masked out in grey.
While IASI products provide a viable source of information on the global distribution of dust aerosols to complement ground observations, uncertainties associated with the limitations of the instrument, retrieval algorithm, and sampling frequency may add to the uncertainty of our findings. The inability of the satellite to observe through clouds is a major setback in aerosol studies using satellite products (Schepanski et al., 2007; Heinold et al., 2013). The IASI infrared sensor cannot observe dust aerosols under cloudy convective systems such as haboobs, which often occur over North Africa in the evening periods, likely leading to a “morning bias” with more available data at the morning overpass i.e., 09:30 local solar ECT (Chédin et al., 2020). This could possibly affect the day–night differences in DOD and dust layer height observed from IASI over the convective regions (the Sahel, the Guinea Coast, and the Indian subcontinent), especially on the daily timescale, but likely has little effect on the monthly timescale or climatological mean (Chédin et al., 2020). On the other hand, a rigorous cloud-masking method is used for the LMD IASI products to ensure high confidence in cloud identification (Pierangelo et al., 2004; Crevoisier et al., 2009; Pernin et al., 2013; Capelle et al., 2018). Due to this, some aerosol loading, especially over the dust source regions, could be mistaken as clouds and be screened out, leading to an underestimation of the actual DOD (Capelle et al., 2018).
Other possible sources of uncertainty of IASI retrievals include weak sensitivity to dust aerosols in the first 100 m above the surface and difficulty in capturing low DOD of a similar order or smaller than the sensitivity of the instrument (Capelle et al., 2018). While the passing times of IASI largely coincide with the times of the two most important dust emission mechanisms in the Sahara, i.e., breaking down of the nocturnal low-level jets in the morning and mesoscale convective systems (haboobs) in the late afternoon to evening hours (Schepanski et al., 2009; Knippertz and Todd, 2012; Marsham et al., 2013; Chédin et al., 2020), some small dust events before and after the passage of IASI (09:30 and 21:30 local solar ECT) could be missed. For those large events that occur a few hours before or after IASI observations, while IASI may still be able to capture them, the location of dust plumes is often shifted from their original locations depending on the direction of the prevailing winds. Future studies of dust aerosols using instruments with different overpassing times will likely complement and improve our understanding of the diurnal cycle of dust aerosols. However, despite these challenges, the day–night differences in IASI DOD are largely consistent with the day–night differences in CAOD and PM10 concentrations from ground observations. The presence of orbital gaps around the tropics in current IASI products is partially addressed by the launches of IASI on board MetOP-B and MetOP-C satellites in 2012 and 2018, respectively (Carboni et al., 2013; Klüser et al., 2013; Chédin et al., 2020). Future investigations using IASI from these satellites and algorithms different from LMD are warranted to confirm and overcome some of the limitations in this study.
We used station products (i.e., AERONET CAOD and LISA PM10) to evaluate IASI DOD and examine the diurnal variability of dust as a complement to the day–night differences in IASI DOD. However, many factors may affect the reliability of station data as well. AERONET products are provided in three levels based on the quality of the data, i.e., level 2 (cloud-screened and quality-controlled), level 1.5 (cloud-screened but not quality-assured), and level 1.0 (raw data: neither cloud-screened nor quality-controlled). A lot of effort was made to use level-2.0 data in this study, but there were sites where level-2.0 data were unavailable, so level-1.5 data were used instead. Moreover, AERONET lunar data are still under development and level 2.0 is not yet available; hence level-1.5 data were used. The use of level-1.5 data and a generally smaller sample size of lunar data than solar data could also introduce additional uncertainties to the examination of day–night differences in dust aerosols. The sensitivity of AERONET observations to cirrus clouds can introduce a significant number of uncertainties in the aerosol retrievals (Smirnov et al., 2018), especially over sites close to the tropics. In addition, comparing between different observational platforms can be challenging. For instance, comparing between mass concentration (PM10) and vertically integrated (DOD or CAOD) quantities is not straightforward, as they characterize different aspects of dust. Despite these uncertainties, both station and IASI products largely agree well on the seasonal climatology of dust and at some sites on the day–night differences in dust aerosols over the dust belt.
In addition to the meteorological variables discussed above, we also found slightly higher relative humidity at 750 hPa during nighttime over the Guinea Coast and the southern coast of India (not shown) that may partially contribute to the higher nighttime DOD via the hygroscopic growth of aged dust, although the overall effect is hard to quantify in observations. Land surface variables such as soil moisture may also affect dust emissions in semi-arid regions. However, our examination of soil moisture from ERA5 showed that the difference in soil moisture between IASI daytime (09:30 local solar ECT) and nighttime (21:30 local solar ECT) overpasses is small and insignificant, indicating a likely negligible impact on the day–night differences in DOD. While surface wind speed, precipitation, PBLH, and atmospheric stability all affect day–night differences in DOD and dust layer height to some extent, they may be fundamentally driven by common factors, such as the diurnal cycle of surface radiation, and modulated by local land surface and circulation features. Additional sensitivity tests are needed to further quantify the relative contribution of individual factors to the day–night differences in dust aerosols revealed by IASI and station data and will be addressed in our future study.
While dust aerosol is one of the key factors affecting the climate system, constraining the full diurnal cycle of dust from current visible satellite products and sparsely located ground observations presents a challenge, which continues to contribute in a large way to the sources of uncertainties in estimating the total radiative forcing of aerosols and projecting climate change. Using the equal-quality performance for daytime (09:30 local solar ECT) and nighttime (21:30 local solar ECT) observations and global coverage at fine spectral and spatial resolutions of LMD IASI products, this study investigates the day–night differences in dust aerosols over the global dust belt of North Africa, the Middle East, and Asia. A comparison between IASI 500 nm (scaled from 10 µm) DOD and AERONET 500 nm CAOD revealed an overall correlation coefficient of ∼ 0.75 for 46 solar sites and ∼ 0.55 for 11 lunar sites, indicating IASI exhibits a reasonably good performance in capturing the spatiotemporal variability of dust events over the dust belt.
IASI showed significant (95 % confidence level) day–night differences in DOD and dust layer height within the dust belt, with a higher DOD and lower dust layer height during the daytime over dust source regions from the central to northern Sahara, the Arabian Peninsula, the northwestern Indian subcontinent, and the Taklamakan Desert. Over the southern Sahel to the Guinea Coast and large areas of the Indian subcontinent, nighttime DOD is observed to be higher than daytime, along with a lower dust layer height during nighttime. The day–night differences in DOD are greater in magnitude and more significant in large areas during MAM and DJF than in other seasons, while day–night differences in dust layer height show little seasonal variations. The higher daytime DOD in dust source regions (e.g., the central Sahara, the Arabian Peninsula, northwestern Indian subcontinent, and Taklamakan Desert) are likely associated with a higher dust uplift potential (DUP) during daytime in these regions and a stronger daytime surface wind in the Sahara. Over some spots of the Sahara, the central Arabian Peninsula, and the northwestern Indian subcontinent, the slightly higher nighttime precipitation rate may reduce airborne dust and partially contribute to lower nighttime DOD in JJA as well.
The lower daytime DOD over downwind regions, such as the southern Sahel, Guinea Coast, and the central to southern Indian subcontinent, coincides with a relatively higher planetary boundary layer height (PBLH) and greater convective available potential energy (CAPE) during daytime that corresponds to an unstable atmosphere. The growing PBLH during the daytime likely entrains dust aerosols into upper levels, resulting in a higher dust layer height and favoring horizontal transport of dust, which likely dilutes column concentrations of dust and results in lower DOD during daytime.
Seasonal analysis of day–night differences in DOD from MERRA-2 and EAC4 revealed that reanalysis products largely capture the temporal and spatial variability of DOD on the seasonal scale but failed to capture the day–night differences in DOD in almost the entire dust belt except in a few dust hotspots over North Africa (e.g., the northeastern Bodélé Depression in DJF and MAM in MERRA-2; over parts of northeastern North Africa in DJF, JJA, and SON in MERRA-2; and over the southern Arabian Peninsula in DJF in MERRA-2 and EAC4, which is due to the fact that the two reanalysis datasets only assimilate total AOD at the visible wavelength; thus no aerosol information in nighttime is assimilated.
Using ground-based measurements from LISA and AERONET observations, we have shown that dust aerosols exhibit a spatially varying diurnal cycle across the dust belt, with higher coarse-mode aerosol optical depth (CAOD) and PM10 concentrations in the morning hours (07:00–09:00 in CAOD and 09:00–11:00 in PM10), in the late afternoon (15:00–16:00 in CAOD and 18:00–21:00 in PM10), and at midnight (PM10) to the early morning (CAOD) in the Sahel, with higher CAOD in the afternoon (15:00–16:00) and early morning (02:00–05:00) over the Arabian Peninsula. The day–night differences in AERONET CAOD between 09:30 and 21:30 LST are also largely consistent with the day–night differences in IASI DOD in sign and magnitude at some sites but not others, possibly due to a smaller sample size of AERONET lunar data.
In conclusion, this work has shown that daytime dust aerosols around 09:30 local solar ECT over the dust belt are significantly different from nighttime at 21:30 local solar ECT, and such day–night differences are largely influenced by the local meteorological conditions, primarily surface circulation, atmospheric stability, and turbulent motion over the dust belt. Despite the uncertainties associated with satellite products and station data, the findings add to our current understanding of the diurnal of cycle of dust in major dust source and downwind regions.
Analysis codes can be provided by the corresponding authors upon request.
Daily IASI/Metop-A LMD Dust-AOD L2 products are downloaded from https://iasi.aeris-data.fr/catalog/#masthead (Capelle, 2020). CALIOP DOD and dust layer height are available at https://doi.org/10.5067/CALIOP/CALIPSO/CAL_LID_L3 (NASA/LARC/SD/ASDC, 2019). MERRA-2 DOD and meteorological variables are downloaded from https://disc.gsfc.nasa.gov/datasets?keywords=MERRA-2&page=1 (Gelaro et al., 2017b). AERONET SDA data are downloaded from https://aeronet.gsfc.nasa.gov/ (O'Neill et al., 2003). LISA surface PM10 concentrations and meteorological variables are available at http://www.lisa.u-pec.fr/SDT/index.php?p=3 (Marticorena et al., 2006). Hourly EAC4 dust aerosol optical depth at 550 nm are downloaded from https://ads.atmosphere.copernicus.eu/cdsapp#!/dataset/cams-global-reanalysis-eac4?tab=form (Inness et al., 2019). ERA5 hourly data on single and pressure levels are respectively retrieved from https://doi.org/10.24381/cds.adbb2d47 (Hersbach et al., 2023a) and https://doi.org/10.24381/cds.bd0915c6 (Hersbach et al., 2023b). The sub-hourly IMERG precipitation data are available at https://doi.org/10.5067/GPM/IMERG/3B-HH/06 (Huffman et al., 2019).
The supplement related to this article is available online at: https://doi.org/10.5194/acp-23-5435-2023-supplement.
BP and QJ conceived the study. JZT performed the analysis under the guidance of BP and QJ. JZT wrote the paper with input from BP and QJ.
The contact author has declared that none of the authors has any competing interests.
Publisher's note: Copernicus Publications remains neutral with regard to jurisdictional claims in published maps and institutional affiliations.
IASI is a joint mission of EUMETSAT and the Centre National d'Etudes Spatiales (CNES, France). We acknowledge the AERIS data infrastructure for providing access to the IASI data in this study and CNRS-LMD for the development of the retrieval algorithms. We especially thank Virginie Capelle, the principal investigator of LMD IASI dust products, for making the level-2 IASI data available. We also thank David Mechem and David Rahn of the University of Kansas for their helpful discussion on and valuable suggestions for this paper and Brian Harr for helpful edits. The valuable and constructive comments from the two anonymous reviewers greatly improved the paper and are sincerely appreciated.
This paper was edited by Pedro Jimenez-Guerrero and reviewed by two anonymous referees.
Adebiyi, A. A. and Kok, J. F.: Climate models miss most of the coarse dust in the atmosphere, Sci. Adv., 6, eaaz9507, https://doi.org/10.1126/sciadv.aaz9507, 2020.
Ageet, S., Fink, A. H., Maranan, M., Diem, J. E., Hartter, J., Ssali, A. L., and Ayabagabo, P.: Validation of Satellite Rainfall Estimates over Equatorial East Africa, J. Hydrometeorol., 23, 129–151, https://doi.org/10.1175/JHM-D-21-0145.1, 2022.
Ansmann, A., Tesche, M., Knippertz, P., Bierwirth, E., Althausen, D., MüLLER, D., and Schulz, O.: Vertical profiling of convective dust plumes in southern Morocco during SAMUM, Tellus B, 61, 340–353, https://doi.org/10.1111/j.1600-0889.2008.00384.x, 2009.
Arshad, M., Ma, X., Yin, J., Ullah, W., Ali, G., Ullah, S., Liu, M., Shahzaman, M., and Ullah, I.: Evaluation of GPM-IMERG and TRMM-3B42 precipitation products over Pakistan, Atmos. Res., 249, 105341, https://doi.org/10.1016/j.atmosres.2020.105341, 2021.
Bangert, M., Nenes, A., Vogel, B., Vogel, H., Barahona, D., Karydis, V. A., Kumar, P., Kottmeier, C., and Blahak, U.: Saharan dust event impacts on cloud formation and radiation over Western Europe, Atmos. Chem. Phys., 12, 4045–4063, https://doi.org/10.5194/acp-12-4045-2012, 2012.
Bauduin, S., Clarisse, L., Hadji-Lazaro, J., Theys, N., Clerbaux, C., and Coheur, P.-F.: Retrieval of near-surface sulfur dioxide (SO2) concentrations at a global scale using IASI satellite observations, Atmos. Meas. Tech., 9, 721–740, https://doi.org/10.5194/amt-9-721-2016, 2016.
Bergametti, G., Marticorena, B., Rajot, J. L., Chatenet, B., Féron, A., Gaimoz, C., Siour, G., Coulibaly, M., Koné, I., Maman, A., and Zakou, A.: Dust Uplift Potential in the Central Sahel: An Analysis Based on 10 years of Meteorological Measurements at High Temporal Resolution, J. Geophys. Res.-Atmos., 122, 12433–12448, https://doi.org/10.1002/2017JD027471, 2017.
Berkoff, T. A., Sorokin, M., Stone, T., Eck, T. F., Hoff, R., Welton, E., and Holben, B.: Nocturnal Aerosol Optical Depth Measurements with a Small-Aperture Automated Photometer Using the Moon as a Light Source, J. Atmos. Ocean. Tech., 28, 1297–1306, https://doi.org/10.1175/JTECH-D-10-05036.1, 2011.
Blumstein, D., Chalon, G., Carlier, T., Buil, C., Hebert, P., Maciaszek, T., Ponce, G., Phulpin, T., Tournier, B., and Simeoni, D.: IASI instrument: Technical overview and measured performances, Infrared Spaceborne Remote Sens. XII, 5543, 196–207, 2004.
Bozzo, A., Remy, S., Benedetti, A., Flemming, J., Bechtold, P., Rodwell, M. J., and Morcrette, J. J.: Implementation of a CAMS-based aerosol climatology in the IFS, 801, Reading, UK, European Centre for Medium-Range Weather Forecasts, 1–33, https://www.ecmwf.int/sites/default/files/elibrary/2017/17219-implementation-cams-based-aerosol-climatology-ifs.pdf (last access: 2 May 2023), 2017.
Bristow, C. S., Hudson-Edwards, K. A., and Chappell, A.: Fertilizing the Amazon and equatorial Atlantic with West African dust, Geophys. Res. Lett., 37, L14807, https://doi.org/10.1029/2010GL043486, 2010.
Callewaert, S., Vandenbussche, S., Kumps, N., Kylling, A., Shang, X., Komppula, M., Goloub, P., and De Mazière, M.: The Mineral Aerosol Profiling from Infrared Radiances (MAPIR) algorithm: version 4.1 description and evaluation, Atmos. Meas. Tech., 12, 3673–3698, https://doi.org/10.5194/amt-12-3673-2019, 2019.
Capelle, V.: Daily IASI/Metop-A LMD Dust-AOD L2 product, CNRS-LMD [data set], https://iasi.aeris-data.fr/catalog/#masthead, 2020.
Capelle, V., Chédin, A., Siméon, M., Tsamalis, C., Pierangelo, C., Pondrom, M., Crevoisier, C., Crepeau, L., and Scott, N. A.: Evaluation of IASI-derived dust aerosol characteristics over the tropical belt, Atmos. Chem. Phys., 14, 9343–9362, https://doi.org/10.5194/acp-14-9343-2014, 2014.
Capelle, V., Chédin, A., Pondrom, M., Crevoisier, C., Armante, R., Crepeau, L., and Scott, N. A.: Infrared dust aerosol optical depth retrieved daily from IASI and comparison with AERONET over the period 2007–2016, Remote Sens. Environ., 206, 15–32, https://doi.org/10.1016/j.rse.2017.12.008, 2018.
Carboni, E., Smith, A., Grainger, R., Dudhia, A., Thomas, G., Peters, D., Walker, J., and Siddans, R.: Satellite remote sensing of volcanic plume from Infrared Atmospheric Sounding Interferometer (IASI): results for recent eruptions, in: EGU General Assembly Conference Abstracts, EGU2013-11865, https://eodg.atm.ox.ac.uk/eodg/posters/2013/2013ec2.pdf (last access: 25 April 2023), 2013.
Carmona, J. M., Gupta, P., Lozano-García, D. F., Vanoye, A. Y., Yépez, F. D., and Mendoza, A.: Spatial and Temporal Distribution of PM2.5 Pollution over Northeastern Mexico: Application of MERRA-2 Reanalysis Datasets, Remote Sens., 12, 2286, https://doi.org/10.3390/rs12142286, 2020.
Chaboureau, J.-P., Tulet, P., and Mari, C.: Diurnal cycle of dust and cirrus over West Africa as seen from Meteosat Second Generation satellite and a regional forecast model, Geophys. Res. Lett., 34, L02822, https://doi.org/10.1029/2006GL027771, 2007.
Chalon, G., Cayla, F., and Diebel, D.: IASI- An advanced sounder for operational meteorology, in: IAF, International Astronautical Congress, 52 nd, Toulouse, France, 1–5 October 2001, https://iasi.cnes.fr/sites/default/files/drupal/201601/default/presentation_iaf_2001.pdf (last access: 25 April 2023), 2001.
Checa-Garcia, R., Balkanski, Y., Albani, S., Bergman, T., Carslaw, K., Cozic, A., Dearden, C., Marticorena, B., Michou, M., van Noije, T., Nabat, P., O'Connor, F. M., Olivié, D., Prospero, J. M., Le Sager, P., Schulz, M., and Scott, C.: Evaluation of natural aerosols in CRESCENDO Earth system models (ESMs): mineral dust, Atmos. Chem. Phys., 21, 10295–10335, https://doi.org/10.5194/acp-21-10295-2021, 2021.
Chédin, A., Capelle, V., and Scott, N. A.: Detection of IASI dust AOD trends over Sahara: How many years of data required?, Atmos. Res., 212, 120–129, https://doi.org/10.1016/j.atmosres.2018.05.004, 2018.
Chédin, A., Capelle, V., Scott, N. A., and Todd, M. C.: Contribution of IASI to the Observation of Dust Aerosol Emissions (Morning and Nighttime) Over the Sahara Desert, J. Geophys. Res.-Atmos., 125, e32014, https://doi.org/10.1029/2019JD032014, 2020.
Clarisse, L., Clerbaux, C., Franco, B., Hadji-Lazaro, J., Whitburn, S., Kopp, A. K., Hurtmans, D., and Coheur, P.-F.: A Decadal Data Set of Global Atmospheric Dust Retrieved From IASI Satellite Measurements, J. Geophys. Res.-Atmos., 124, 1618–1647, https://doi.org/10.1029/2018JD029701, 2019.
Clerbaux, C., Boynard, A., Clarisse, L., George, M., Hadji-Lazaro, J., Herbin, H., Hurtmans, D., Pommier, M., Razavi, A., Turquety, S., Wespes, C., and Coheur, P.-F.: Monitoring of atmospheric composition using the thermal infrared IASI/MetOp sounder, Atmos. Chem. Phys., 9, 6041–6054, https://doi.org/10.5194/acp-9-6041-2009, 2009.
Crevoisier, C., Nobileau, D., Fiore, A. M., Armante, R., Chédin, A., and Scott, N. A.: Tropospheric methane in the tropics – first year from IASI hyperspectral infrared observations, Atmos. Chem. Phys., 9, 6337–6350, https://doi.org/10.5194/acp-9-6337-2009, 2009.
D'Almeida, G. A.: A Model for Saharan Dust Transport, J. Appl. Meteorol. Clim., 25, 903–916, https://doi.org/10.1175/1520-0450(1986)025<0903:AMFSDT>2.0.CO;2, 1986.
DeMott, P. J., Sassen, K., Poellot, M. R., Baumgardner, D., Rogers, D. C., Brooks, S. D., Prenni, A. J., and Kreidenweis, S. M.: African dust aerosols as atmospheric ice nuclei, Geophys. Res. Lett., 30, 1732, https://doi.org/10.1029/2003GL017410, 2003.
Dezfuli, A. K., Ichoku, C. M., Huffman, G. J., Mohr, K. I., Selker, J. S., van de Giesen, N., Hochreutener, R., and Annor, F. O.: Validation of IMERG Precipitation in Africa, J. Hydrometeorol., 18, 2817–2825, https://doi.org/10.1175/JHM-D-17-0139.1, 2017.
Diner, D. J., Beckert, J. C., Reilly, T. H., Bruegge, C. J., Conel, J. E., Kahn, R. A., Martonchik, J. V., Ackerman, T. P., Davies, R., Gerstl, S. A. W., Gordon, H. R., Muller, J.-P., Myneni, R. B., Sellers, P. J., Pinty, B., and Verstraete, M. M.: Multi-angle Imaging SpectroRadiometer (MISR) instrument description and experiment overview, IEEE T. Geosci. Remote, 36, 1072–1087, https://doi.org/10.1109/36.700992, 1998.
Duce, R. A.: Sources, distributions, and fluxes of mineral aerosols and their relationship to climate, Aerosol Forcing Clim., 6, 43–72, 1995.
Duce, R. A. and Tindale, N. W.: Atmospheric transport of iron and its deposition in the ocean, Limnol. Oceanogr., 36, 1715–1726, https://doi.org/10.4319/lo.1991.36.8.1715, 1991.
Dunion, J. P. and Velden, C. S.: The Impact of the Saharan Air Layer on Atlantic Tropical Cyclone Activity, B. Am. Meteorol. Soc., 85, 353–366, https://doi.org/10.1175/BAMS-85-3-353, 2004.
Eck, T. F., Holben, B. N., Reid, J. S., Dubovik, O., Smirnov, A., O'Neill, N. T., Slutsker, I., and Kinne, S.: Wavelength dependence of the optical depth of biomass burning, urban, and desert dust aerosols, J. Geophys. Res.-Atmos., 104, 31333–31349, https://doi.org/10.1029/1999JD900923, 1999.
Eck, T. F., Holben, B. N., Sinyuk, A., Pinker, R. T., Goloub, P., Chen, H., Chatenet, B., Li, Z., Singh, R. P., Tripathi, S. N., Reid, J. S., Giles, D. M., Dubovik, O., O'Neill, N. T., Smirnov, A., Wang, P., and Xia, X.: Climatological aspects of the optical properties of fine/coarse mode aerosol mixtures, J. Geophys. Res., 115, D19205, https://doi.org/10.1029/2010JD014002, 2010.
Engelstaedter, S. and Washington, R.: Temporal controls on global dust emissions: The role of surface gustiness, Geophys. Res. Lett., 34, L15805, https://doi.org/10.1029/2007GL029971, 2007.
Engelstaedter, S., Tegen, I., and Washington, R.: North African dust emissions and transport, Earth-Sci. Rev., 79, 73–100, https://doi.org/10.1016/j.earscirev.2006.06.004, 2006.
Fernandez-Partagas, J., Helgren, D. M., and Prospero, J. M.: Threshold Wind Volocities for Raising Dust in the Western Sahara, Rosenstiel School of Marine and Atmospheric Science Miami FL, US department of defense, Report, https://apps.dtic.mil/sti/pdfs/ADA165662.pdf (last access: 25 April 2023), 1986.
Fiedler, S., Schepanski, K., Heinold, B., Knippertz, P., and Tegen, I.: Climatology of nocturnal low-level jets over North Africa and implications for modeling mineral dust emission, J. Geophys. Res.-Atmos., 118, 6100–6121, https://doi.org/10.1002/jgrd.50394, 2013.
Flamant, C., Chaboureau, J.-P., Parker, D. J., Taylor, C. M., Cammas, J.-P., Bock, O., Timouk, F., and Pelon, J.: Airborne observations of the impact of a convective system on the planetary boundary layer thermodynamics and aerosol distribution in the inter-tropical discontinuity region of the West African Monsoon, Q. J. Roy. Meteor. Soc., 133, 1175–1189, https://doi.org/10.1002/qj.97, 2007.
Forster, P., Ramaswamy, V., Artaxo, P., Berntsen, T., Betts, R., Fahey, D. W., Haywood, J., Lean, J., Lowe, D. C., Myhre, G., Nganga, J., Prinn, R., Raga, G., Schulz, M., and Van Dorland, R.: Changes in Atmospheric Constituents and in Radiative Forcing, chap. 2, Clim. Change 2007 Phys. Sci. Basis, https://www.ipcc.ch/site/assets/uploads/2018/02/ar4-wg1-chapter2-1.pdf (last access: 25 April 2023), 2007.
Gelaro, R., McCarty, W., Suárez, M. J., Todling, R., Molod, A., Takacs, L., Randles, C. A., Darmenov, A., Bosilovich, M. G., Reichle, R., Wargan, K., Coy, L., Cullather, R., Draper, C., Akella, S., Buchard, V., Conaty, A., Silva, A. M. da, Gu, W., Kim, G.-K., Koster, R., Lucchesi, R., Merkova, D., Nielsen, J. E., Partyka, G., Pawson, S., Putman, W., Rienecker, M., Schubert, S. D., Sienkiewicz, M., and Zhao, B.: The Modern-Era Retrospective Analysis for Research and Applications, Version 2 (MERRA-2), J. Climate, 30, 5419–5454, https://doi.org/10.1175/JCLI-D-16-0758.1, 2017a.
Gelaro, R., McCarty, W., Suárez, M. J., Todling, R., Molod, A., Takacs, L., Randles, C. A., Darmenov, A., Bosilovich, M. G., Reichle, R., Wargan, K., Coy, L., Cullather, R., Draper, C., Akella, S., Buchard, V., Conaty, A., da Silva, A. M., Gu, W., Kim, G. K., Koster, R., Lucchesi, R., Merkova, D., Nielsen, J. E., Partyka, G., Pawson, S., Putman, W., Rienecker, M., Schubert, S. D., Sienkiewicz, M., and Zhao, B.: The Modern-Era Retrospective Analysis for Research and Applications, Version 2 (MERRA-2), NASA [data set], https://disc.gsfc.nasa.gov/datasets?keywords=MERRA-2&page=1, 2017b.
Ginoux, P., Chin, M., Tegen, I., Prospero, J. M., Holben, B., Dubovik, O., and Lin, S.-J.: Sources and distributions of dust aerosols simulated with the GOCART model, J. Geophys. Res.-Atmos., 106, 20255–20273, https://doi.org/10.1029/2000JD000053, 2001.
Ginoux, P., Prospero, J. M., Gill, T. E., Hsu, N. C., and Zhao, M.: Global-scale attribution of anthropogenic and natural dust sources and their emission rates based on MODIS Deep Blue aerosol products, Rev. Geophys., 50, RG3005, https://doi.org/10.1029/2012RG000388, 2012.
Goudie, A. S. and Middleton, N. J.: Desert Dust in the Global System, Springer Science & Business Media, 287 pp., ISBN 13 978-3-540-32354-9, 2006.
Grandey, B. S., Stier, P., and Wagner, T. M.: Investigating relationships between aerosol optical depth and cloud fraction using satellite, aerosol reanalysis and general circulation model data, Atmos. Chem. Phys., 13, 3177–3184, https://doi.org/10.5194/acp-13-3177-2013, 2013.
Haywood, J. M., Allan, R. P., Culverwell, I., Slingo, T., Milton, S., Edwards, J., and Clerbaux, N.: Can desert dust explain the outgoing longwave radiation anomaly over the Sahara during July 2003?, J. Geophys. Res.-Atmos., 110, D05105, https://doi.org/10.1029/2004JD005232, 2005.
Heinold, B., Knippertz, P., Marsham, J. H., Fiedler, S., Dixon, N. S., Schepanski, K., Laurent, B., and Tegen, I.: The role of deep convection and nocturnal low-level jets for dust emission in summertime West Africa: Estimates from convection-permitting simulations, J. Geophys. Res.-Atmos., 118, 4385–4400, https://doi.org/10.1002/jgrd.50402, 2013.
Hersbach, H., Bell, B., Berrisford, P., Hirahara, S., Horányi, A., Muñoz-Sabater, J., Nicolas, J., Peubey, C., Radu, R., Schepers, D., Simmons, A., Soci, C., Abdalla, S., Abellan, X., Balsamo, G., Bechtold, P., Biavati, G., Bidlot, J., Bonavita, M., Chiara, G., Dahlgren, P., Dee, D., Diamantakis, M., Dragani, R., Flemming, J., Forbes, R., Fuentes, M., Geer, A., Haimberger, L., Healy, S., Hogan, R. J., Hólm, E., Janisková, M., Keeley, S., Laloyaux, P., Lopez, P., Lupu, C., Radnoti, G., Rosnay, P., Rozum, I., Vamborg, F., Villaume, S., and Thépaut, J.: The ERA5 global reanalysis, Q. J. Roy. Meteor. Soc., 146, 1999–2049, https://doi.org/10.1002/qj.3803, 2020.
Hersbach, H., Bell, B., Berrisford, P., Biavati, G., Horányi, A., Muñoz Sabater, J., Nicolas, J., Peubey, C., Radu, R., Rozum, I., Schepers, D., Simmons, A., Soci, C., Dee, D., and Thépaut, J.-N.: ERA5 hourly data on single levels from 1940 to present, Copernicus Climate Change Service (C3S) Climate Data Store (CDS) [data set], https://doi.org/10.24381/cds.adbb2d47, 2023a.
Hersbach, H., Bell, B., Berrisford, P., Biavati, G., Horányi, A., Muñoz Sabater, J., Nicolas, J., Peubey, C., Radu, R., Rozum, I., Schepers, D., Simmons, A., Soci, C., Dee, D., and Thépaut, J.-N.: ERA5 hourly data on pressure levels from 1940 to present, Copernicus Climate Change Service (C3S) Climate Data Store (CDS) [data set], https://doi.org/10.24381/cds.bd0915c6, 2023b.
Hewison, T. J., Wu, X., Yu, F., Tahara, Y., Hu, X., Kim, D., and Koenig, M.: GSICS Inter-Calibration of Infrared Channels of Geostationary Imagers Using Metop/IASI, IEEE T. Geosci. Remote, 51, 1160–1170, https://doi.org/10.1109/TGRS.2013.2238544, 2013.
Holben, B. N., Eck, T. F., Slutsker, I., Tanré, D., Buis, J. P., Setzer, A., Vermote, E., Reagan, J. A., Kaufman, Y. J., Nakajima, T., Lavenu, F., Jankowiak, I., and Smirnov, A.: AERONET – A Federated Instrument Network and Data Archive for Aerosol Characterization, Remote Sens. Environ., 66, 1–16, https://doi.org/10.1016/S0034-4257(98)00031-5, 1998.
Hosseini-Moghari, S.-M. and Tang, Q.: Validation of GPM IMERG V05 and V06 Precipitation Products over Iran, J. Hydrometeorol., 21, 1011–1037, https://doi.org/10.1175/JHM-D-19-0269.1, 2020.
Huang, W.-R., Chang, Y.-H., and Liu, P.-Y.: Assessment of IMERG precipitation over Taiwan at multiple timescales, Atmos. Res., 214, 239–249, https://doi.org/10.1016/j.atmosres.2018.08.004, 2018.
Huffman, G. J., Bolvin, D. T., Braithwaite, D., Hsu, K., Joyce, R., Xie, P., and Yoo, S.-H.: NASA global precipitation measurement (GPM) integrated multi-satellite retrievals for GPM (IMERG), Algorithm Theor. Basis Doc. ATBD Version, 4, 26, https://gpm.nasa.gov/sites/default/files/2020-05/IMERG_ATBD_V06.3.pdf (last access: 25 April 2023), 2015.
Huffman, G. J., Stocker, E. F., Bolvin, D. T., Nelkin, E. J., and Tan, J.: GPM IMERG Final Precipitation L3 Half Hourly 0.1 degree × 0.1 degree V06, Greenbelt, MD, Goddard Earth Sciences Data and Information Services Center (GES DISC) [data set], https://doi.org/10.5067/GPM/IMERG/3B-HH/06, 2019.
Huneeus, N., Schulz, M., Balkanski, Y., Griesfeller, J., Prospero, J., Kinne, S., Bauer, S., Boucher, O., Chin, M., Dentener, F., Diehl, T., Easter, R., Fillmore, D., Ghan, S., Ginoux, P., Grini, A., Horowitz, L., Koch, D., Krol, M. C., Landing, W., Liu, X., Mahowald, N., Miller, R., Morcrette, J.-J., Myhre, G., Penner, J., Perlwitz, J., Stier, P., Takemura, T., and Zender, C. S.: Global dust model intercomparison in AeroCom phase I, Atmos. Chem. Phys., 11, 7781–7816, https://doi.org/10.5194/acp-11-7781-2011, 2011.
Inness, A., Ades, M., Agustí-Panareda, A., Barré, J., Benedictow, A., Blechschmidt, A.-M., Dominguez, J. J., Engelen, R., Eskes, H., Flemming, J., Huijnen, V., Jones, L., Kipling, Z., Massart, S., Parrington, M., Peuch, V.-H., Razinger, M., Remy, S., Schulz, M., and Suttie, M.: The CAMS reanalysis of atmospheric composition, Atmos. Chem. Phys., 19, 3515–3556, https://doi.org/10.5194/acp-19-3515-2019, 2019 (data available at: https://ads.atmosphere.copernicus.eu/cdsapp#!/dataset/cams-global-reanalysis-eac4?tab=form, last access: 3 May 2023).
Isaza, A., Kay, M., Evans, J. P., Bremner, S., and Prasad, A.: Validation of Australian atmospheric aerosols from reanalysis data and CMIP6 simulations, Atmos. Res., 264, 105856, https://doi.org/10.1016/j.atmosres.2021.105856, 2021.
Jickells, T. D., An, Z. S., Andersen, K. K., Baker, A. R., Bergametti, G., Brooks, N., Cao, J. J., Boyd, P. W., Duce, R. A., Hunter, K. A., Kawahata, H., Kubilay, N., laRoche, J., Liss, P. S., Mahowald, N., Prospero, J. M., Ridgwell, A. J., Tegen, I., and Torres, R.: Global Iron Connections Between Desert Dust, Ocean Biogeochemistry, and Climate, Science, 308, 67–71, https://doi.org/10.1126/science.1105959, 2005.
Jin, Q., Wei, J., and Yang, Z.-L.: Positive response of Indian summer rainfall to Middle East dust, Geophys. Res. Lett., 41, 4068–4074, https://doi.org/10.1002/2014GL059980, 2014.
Jin, Q., Wei, J., Lau, W. K. M., Pu, B., and Wang, C.: Interactions of Asian mineral dust with Indian summer monsoon: Recent advances and challenges, Earth-Sci. Rev., 215, 103562, https://doi.org/10.1016/j.earscirev.2021.103562, 2021.
Kaly, F., Marticorena, B., Chatenet, B., Rajot, J. L., Janicot, S., Niang, A., Yahi, H., Thiria, S., Maman, A., Zakou, A., Coulibaly, B. S., Coulibaly, M., Koné, I., Traoré, S., Diallo, A., and Ndiaye, T.: Variability of mineral dust concentrations over West Africa monitored by the Sahelian Dust Transect, Atmos. Res., 164–165, 226–241, https://doi.org/10.1016/j.atmosres.2015.05.011, 2015.
Karyampudi, V. M. and Carlson, T. N.: Analysis and Numerical Simulations of the Saharan Air Layer and Its Effect on Easterly Wave Disturbances, J. Atmospheric Sci., 45, 3102–3136, https://doi.org/10.1175/1520-0469(1988)045<3102:AANSOT>2.0.CO;2, 1988.
Kim, K., Park, J., Baik, J., and Choi, M.: Evaluation of topographical and seasonal feature using GPM IMERG and TRMM 3B42 over Far-East Asia, Atmos. Res., 187, 95–105, https://doi.org/10.1016/j.atmosres.2016.12.007, 2017.
Klüser, L., Erbertseder, T., and Meyer-Arnek, J.: Observation of volcanic ash from Puyehue–Cordón Caulle with IASI, Atmos. Meas. Tech., 6, 35–46, https://doi.org/10.5194/amt-6-35-2013, 2013.
Klüser, L., Vandenbussche, S., Capelle, V., Clarisse, L., Kalashnikova, O., Garay, M. J., and Popp, T.: IASI dust algorithm inter-comparison within ESA's Climate Change Initiative, https://aerocom-classic.met.no/DATA/WWWAEROCOM/DATA/AEROCOM_WORK/rome15/aerosat_klueser.pdf (last access: 25 April 2023), 2016.
Knippertz, P. and Todd, M. C.: Mineral dust aerosols over the Sahara: Meteorological controls on emission and transport and implications for modeling, Rev. Geophys., 50, RG1007, https://doi.org/10.1029/2011RG000362, 2012.
Kocha, C., Tulet, P., Lafore, J.-P., and Flamant, C.: The importance of the diurnal cycle of Aerosol Optical Depth in West Africa, Geophys. Res. Lett., 40, 785–790, https://doi.org/10.1002/grl.50143, 2013.
Kok, J. F., Adebiyi, A. A., Albani, S., Balkanski, Y., Checa-Garcia, R., Chin, M., Colarco, P. R., Hamilton, D. S., Huang, Y., Ito, A., Klose, M., Li, L., Mahowald, N. M., Miller, R. L., Obiso, V., Pérez García-Pando, C., Rocha-Lima, A., and Wan, J. S.: Contribution of the world's main dust source regions to the global cycle of desert dust, Atmos. Chem. Phys., 21, 8169–8193, https://doi.org/10.5194/acp-21-8169-2021, 2021.
Kylling, A., Vandenbussche, S., Capelle, V., Cuesta, J., Klüser, L., Lelli, L., Popp, T., Stebel, K., and Veefkind, P.: Comparison of dust-layer heights from active and passive satellite sensors, Atmos. Meas. Tech., 11, 2911–2936, https://doi.org/10.5194/amt-11-2911-2018, 2018.
Lee, J., Lee, E.-H., and Seol, K.-H.: Validation of Integrated MultisatellitE Retrievals for GPM (IMERG) by using gauge-based analysis products of daily precipitation over East Asia, Theor. Appl. Climatol., 137, 2497–2512, https://doi.org/10.1007/s00704-018-2749-1, 2019.
Levin, Z., Ganor, E., and Gladstein, V.: The Effects of Desert Particles Coated with Sulfate on Rain Formation in the Eastern Mediterranean, J. Appl. Meteorol. Climatol., 35, 1511–1523, https://doi.org/10.1175/1520-0450(1996)035<1511:TEODPC>2.0.CO;2, 1996.
Li, F., Vogelmann, A. M., and Ramanathan, V.: Saharan Dust Aerosol Radiative Forcing Measured from Space, J. Climate, 17, 2558–2571, https://doi.org/10.1175/1520-0442(2004)017<2558:SDARFM>2.0.CO;2, 2004.
Li, J., Ge, X., He, Q., and Abbas, A.: Aerosol optical depth (AOD): spatial and temporal variations and association with meteorological covariates in Taklimakan desert, China, PeerJ, 9, e10542, https://doi.org/10.7717/peerj.10542, 2021.
Li, Z., Guo, J., Ding, A., Liao, H., Liu, J., Sun, Y., Wang, T., Xue, H., Zhang, H., and Zhu, B.: Aerosol and boundary-layer interactions and impact on air quality, Nat. Sci. Rev., 4, 810–833, https://doi.org/10.1093/nsr/nwx117, 2017.
Liu, Z., Vaughan, M., Winker, D., Kittaka, C., Getzewich, B., Kuehn, R., Omar, A., Powell, K., Trepte, C., and Hostetler, C.: The CALIPSO Lidar Cloud and Aerosol Discrimination: Version 2 Algorithm and Initial Assessment of Performance, J. Atmos. Ocean. Tech., 26, 1198–1213, https://doi.org/10.1175/2009JTECHA1229.1, 2009.
Lou, M., Guo, J., Wang, L., Xu, H., Chen, D., Miao, Y., Lv, Y., Li, Y., Guo, X., Ma, S., and Li, J.: On the Relationship Between Aerosol and Boundary Layer Height in Summer in China Under Different Thermodynamic Conditions, Earth Space Sci., 6, 887–901, https://doi.org/10.1029/2019EA000620, 2019.
Mahowald, N. M., Kloster, S., Engelstaedter, S., Moore, J. K., Mukhopadhyay, S., McConnell, J. R., Albani, S., Doney, S. C., Bhattacharya, A., Curran, M. A. J., Flanner, M. G., Hoffman, F. M., Lawrence, D. M., Lindsay, K., Mayewski, P. A., Neff, J., Rothenberg, D., Thomas, E., Thornton, P. E., and Zender, C. S.: Observed 20th century desert dust variability: impact on climate and biogeochemistry, Atmos. Chem. Phys., 10, 10875–10893, https://doi.org/10.5194/acp-10-10875-2010, 2010.
Maranan, M., Fink, A. H., Knippertz, P., Amekudzi, L. K., Atiah, W. A., and Stengel, M.: A Process-Based Validation of GPM IMERG and Its Sources Using a Mesoscale Rain Gauge Network in the West African Forest Zone, J. Hydrometeorol., 21, 729–749, https://doi.org/10.1175/JHM-D-19-0257.1, 2020.
Marsham, J. H., Parker, D. J., Grams, C. M., Taylor, C. M., and Haywood, J. M.: Uplift of Saharan dust south of the intertropical discontinuity, J. Geophys. Res.-Atmos., 113, D21102, https://doi.org/10.1029/2008JD009844, 2008.
Marsham, J. H., Knippertz, P., Dixon, N. S., Parker, D. J., and Lister, G. M. S.: The importance of the representation of deep convection for modeled dust-generating winds over West Africa during summer, Geophys. Res. Lett., 38, L16803, https://doi.org/10.1029/2011GL048368, 2011.
Marsham, J. H., Hobby, M., Allen, C. J. T., Banks, J. R., Bart, M., Brooks, B. J., Cavazos-Guerra, C., Engelstaedter, S., Gascoyne, M., Lima, A. R., Martins, J. V., McQuaid, J. B., O'Leary, A., Ouchene, B., Ouladichir, A., Parker, D. J., Saci, A., Salah-Ferroudj, M., Todd, M. C., and Washington, R.: Meteorology and dust in the central Sahara: Observations from Fennec supersite-1 during the June 2011 Intensive Observation Period, J. Geophys. Res.-Atmos., 118, 4069–4089, https://doi.org/10.1002/jgrd.50211, 2013.
Marticorena, B., Chatenet, B., and Rajot, J. L.: The Sahelian Dust Transect, AMMA, LISA [data set], http://www.lisa.u-pec.fr/SDT/index.php?p=3 (last access: 8 May 2023), 2006.
Marticorena, B., Chatenet, B., Rajot, J. L., Traoré, S., Coulibaly, M., Diallo, A., Koné, I., Maman, A., NDiaye, T., and Zakou, A.: Temporal variability of mineral dust concentrations over West Africa: analyses of a pluriannual monitoring from the AMMA Sahelian Dust Transect, Atmos. Chem. Phys., 10, 8899–8915, https://doi.org/10.5194/acp-10-8899-2010, 2010.
Middleton, N. J. and Goudie, A. S.: Saharan dust: sources and trajectories, Trans. Inst. Br. Geogr., 26, 165–181, https://doi.org/10.1111/1475-5661.00013, 2001.
Miller, R. L. and Tegen, I.: Climate Response to Soil Dust Aerosols, J. Climate, 11, 3247–3267, https://doi.org/10.1175/1520-0442(1998)011<3247:CRTSDA>2.0.CO;2, 1998.
Mills, M. M., Ridame, C., Davey, M., La Roche, J., and Geider, R. J.: Iron and phosphorus co-limit nitrogen fixation in the eastern tropical North Atlantic, Nature, 429, 292–294, https://doi.org/10.1038/nature02550, 2004.
Nakajima, T., Higurashi, A., Kawamoto, K., and Penner, J. E.: A possible correlation between satellite-derived cloud and aerosol microphysical parameters, Geophys. Res. Lett., 28, 1171–1174, https://doi.org/10.1029/2000GL012186, 2001.
NASA/LARC/SD/ASDC: CALIPSO Lidar Level 3 Tropospheric Aerosol Profiles, Cloud Free Data, Standard V4-20, NASA Langley Atmospheric Science Data Center DAAC [data set], https://doi.org/10.5067/CALIOP/CALIPSO/CAL_LID_L3, 2019.
Oke, A. M. C., Dunkerley, D., and Tapper, N. J.: Willy-willies in the Australian landscape: Sediment transport characteristics, J. Arid Environ., 71, 216–228, https://doi.org/10.1016/j.jaridenv.2007.03.014, 2007.
Okin, G. S., Mahowald, N., Chadwick, O. A., and Artaxo, P.: Impact of desert dust on the biogeochemistry of phosphorus in terrestrial ecosystems, Global Biogeochem. Cy., 18, GB2005, https://doi.org/10.1029/2003GB002145, 2004.
O'Neill, N. T., Eck, T. F., Smirnov, A., Holben, B. N., and Thulasiraman, S.: Spectral discrimination of coarse and fine mode optical depth, J. Geophys. Res.-Atmos., 108, 704–740, https://doi.org/10.1029/2002JD002975, 2003 (data available at: https://aeronet.gsfc.nasa.gov/, last access: 3 May 2023).
Osipov, S., Stenchikov, G., Brindley, H., and Banks, J.: Diurnal cycle of the dust instantaneous direct radiative forcing over the Arabian Peninsula, Atmos. Chem. Phys., 15, 9537–9553, https://doi.org/10.5194/acp-15-9537-2015, 2015.
Pal, S., Lee, T. R., Phelps, S., and De Wekker, S. F. J.: Impact of atmospheric boundary layer depth variability and wind reversal on the diurnal variability of aerosol concentration at a valley site, Sci. Total Environ., 496, 424–434, https://doi.org/10.1016/j.scitotenv.2014.07.067, 2014.
Penner, J. E., Andreae, M. O., Annegarn, H., Barrie, L., Feichter, J., Hegg, D., Jayaraman, A., Leaitch, R., Murphy, D., Nganga, J., and Pitari, G.: Aerosols, their Direct and Indirect Effects, Clim. Change 2001 Sci. Basis Contrib. Work. Group Third Assess. Rep. Intergov. Panel Clim. Change, 289–348, https://pure.mpg.de/pubman/faces/ViewItemOverviewPage.jsp?itemId=item_1831230 (last access: 25 April 2023), 2001.
Pernin, J., Armante, R., Chédin, A., Crevoisier, C., and Scott, N. A.: Detection of clouds and aerosols over land and sea by day and night from hyperspectral observations in the thermal infrared, in: 3rd IASI conference, Hyères, France, 4–8 February, 2013, 4–8, https://cnes.fr/sites/default/files/migration/smsc/iasi/PDF/conf3/posters/90_crevoisier_c.pdf (last access: 25 April 2023), 2013.
Petäjä, T., Järvi, L., Kerminen, V.-M., Ding, A. J., Sun, J. N., Nie, W., Kujansuu, J., Virkkula, A., Yang, X., Fu, C. B., Zilitinkevich, S., and Kulmala, M.: Enhanced air pollution via aerosol-boundary layer feedback in China, Sci. Rep., 6, 18998, https://doi.org/10.1038/srep18998, 2016.
Peyridieu, S., Chédin, A., Tanré, D., Capelle, V., Pierangelo, C., Lamquin, N., and Armante, R.: Saharan dust infrared optical depth and altitude retrieved from AIRS: a focus over North Atlantic – comparison to MODIS and CALIPSO, Atmos. Chem. Phys., 10, 1953–1967, https://doi.org/10.5194/acp-10-1953-2010, 2010.
Peyridieu, S., Chédin, A., Capelle, V., Tsamalis, C., Pierangelo, C., Armante, R., Crevoisier, C., Crépeau, L., Siméon, M., Ducos, F., and Scott, N. A.: Characterisation of dust aerosols in the infrared from IASI and comparison with PARASOL, MODIS, MISR, CALIOP, and AERONET observations, Atmos. Chem. Phys., 13, 6065–6082, https://doi.org/10.5194/acp-13-6065-2013, 2013.
Pierangelo, C., Chédin, A., Heilliette, S., Jacquinet-Husson, N., and Armante, R.: Dust altitude and infrared optical depth from AIRS, Atmos. Chem. Phys., 4, 1813–1822, https://doi.org/10.5194/acp-4-1813-2004, 2004.
Prospero, J. M., Ginoux, P., Torres, O., Nicholson, S. E., and Gill, T. E.: Environmental Characterization of Global Sources of Atmospheric Soil Dust Identified with the Nimbus 7 Total Ozone Mapping Spectrometer (toms) Absorbing Aerosol Product, Rev. Geophys., 40, 2-1–2-31, https://doi.org/10.1029/2000RG000095, 2002.
Pu, B. and Ginoux, P.: How reliable are CMIP5 models in simulating dust optical depth?, Atmos. Chem. Phys., 18, 12491–12510, https://doi.org/10.5194/acp-18-12491-2018, 2018.
Pu, B., Ginoux, P., Guo, H., Hsu, N. C., Kimball, J., Marticorena, B., Malyshev, S., Naik, V., O'Neill, N. T., Pérez García-Pando, C., Paireau, J., Prospero, J. M., Shevliakova, E., and Zhao, M.: Retrieving the global distribution of the threshold of wind erosion from satellite data and implementing it into the Geophysical Fluid Dynamics Laboratory land–atmosphere model (GFDL AM4.0/LM4.0), Atmos. Chem. Phys., 20, 55–81, https://doi.org/10.5194/acp-20-55-2020, 2020.
Randles, C. A., Da Silva, A. M., Buchard, V., Colarco, P. R., Darmenov, A., Govindaraju, R., Smirnov, A., Holben, B., Ferrare, R., Hair, J., Shinozuka, Y., and Flynn, C. J.: The MERRA-2 Aerosol Reanalysis, 1980 – onward, Part I: System Description and Data Assimilation Evaluation, J. Climate, 30, 6823–6850, https://doi.org/10.1175/JCLI-D-16-0609.1, 2017.
Redelsperger, J.-L., Thorncroft, C. D., Diedhiou, A., Lebel, T., Parker, D. J., and Polcher, J.: African Monsoon Multidisciplinary Analysis: An International Research Project and Field Campaign, B. Am. Meteorol. Soc., 87, 1739–1746, https://doi.org/10.1175/BAMS-87-12-1739, 2006.
Rezazadeh, M., Irannejad, P., and Shao, Y.: Climatology of the Middle East dust events, Aeolian Res., 10, 103–109, https://doi.org/10.1016/j.aeolia.2013.04.001, 2013.
Rosenfield, J. E., Considine, D. B., Meade, P. E., Bacmeister, J. T., Jackman, C. H., and Schoeberl, M. R.: Stratospheric effects of Mount Pinatubo aerosol studied with a coupled two-dimensional model, J. Geophys. Res.-Atmos., 102, 3649–3670, https://doi.org/10.1029/96JD03820, 1997.
Schepanski, K., Tegen, I., Laurent, B., Heinold, B., and Macke, A.: A new Saharan dust source activation frequency map derived from MSG-SEVIRI IR-channels, Geophys. Res. Lett., 34, L18803, https://doi.org/10.1029/2007GL030168, 2007.
Schepanski, K., Tegen, I., Todd, M. C., Heinold, B., Bönisch, G., Laurent, B., and Macke, A.: Meteorological processes forcing Saharan dust emission inferred from MSG-SEVIRI observations of subdaily dust source activation and numerical models, J. Geophys. Res.-Atmos., 114, D10201, https://doi.org/10.1029/2008JD010325, 2009.
Schmetz, J., Pili, P., Tjemkes, S., Just, D., Kerkmann, J., Rota, S., and Ratier, A.: AN INTRODUCTION TO METEOSAT SECOND GENERATION (MSG), B. Am. Meteorol. Soc., 83, 977–992, https://doi.org/10.1175/1520-0477(2002)083<0977:AITMSG>2.3.CO;2, 2002.
Schütz, L.: Long Range Transport of Desert Dust with Special Emphasis on the Sahara, Ann. NY Acad. Sci., 338, 515–532, https://doi.org/10.1111/j.1749-6632.1980.tb17144.x, 1980.
Sinclair, P. C.: General Characteristics of Dust Devils, J. Appl. Meteorol. Clim., 8, 32–45, https://doi.org/10.1175/1520-0450(1969)008<0032:GCODD>2.0.CO;2, 1969.
Smirnov, A., Holben, B. N., Eck, T. F., Slutsker, I., Chatenet, B., and Pinker, R. T.: Diurnal variability of aerosol optical depth observed at AERONET (Aerosol Robotic Network) sites, Geophys. Res. Lett., 29, 30-1–30-4, https://doi.org/10.1029/2002GL016305, 2002.
Smirnov, A., Zhuravleva, T. B., Segal-Rosenheimer, M., and Holben, B. N.: Limitations of AERONET SDA product in presence of cirrus clouds, J. Quant. Spectrosc. Ra., 206, 338–341, https://doi.org/10.1016/j.jqsrt.2017.12.007, 2018.
Spada, M., Jorba, O., Pérez García-Pando, C., Janjic, Z., and Baldasano, J. M.: Modeling and evaluation of the global sea-salt aerosol distribution: sensitivity to size-resolved and sea-surface temperature dependent emission schemes, Atmos. Chem. Phys., 13, 11735–11755, https://doi.org/10.5194/acp-13-11735-2013, 2013.
Strong, J. D. O., Vecchi, G. A., and Ginoux, P.: The Climatological Effect of Saharan Dust on Global Tropical Cyclones in a Fully Coupled GCM, J. Geophys. Res.-Atmos., 123, 5538–5559, https://doi.org/10.1029/2017JD027808, 2018.
Swap, R., Garstang, M., Greco, S., Talbot, R., and Kållberg, P.: Saharan dust in the Amazon Basin, Tellus B, 44, 133–149, https://doi.org/10.1034/j.1600-0889.1992.t01-1-00005.x, 1992.
Swap, R., Ulanski, S., Cobbett, M., and Garstang, M.: Temporal and spatial characteristics of Saharan dust outbreaks, J. Geophys. Res.-Atmos., 101, 4205–4220, https://doi.org/10.1029/95JD03236, 1996.
Tanaka, T. Y. and Chiba, M.: A numerical study of the contributions of dust source regions to the global dust budget, Global Planet. Change, 52, 88–104, https://doi.org/10.1016/j.gloplacha.2006.02.002, 2006.
Taylor, K. E.: Summarizing multiple aspects of model performance in a single diagram, J. Geophys. Res.-Atmos., 106, 7183–7192, https://doi.org/10.1029/2000JD900719, 2001.
Tegen, I. and Fung, I.: Modeling of mineral dust in the atmosphere: Sources, transport, and optical thickness, J. Geophys. Res.-Atmos., 99, 22897–22914, https://doi.org/10.1029/94JD01928, 1994.
Todd, M. C. and Cavazos-Guerra, C.: Dust aerosol emission over the Sahara during summertime from Cloud-Aerosol Lidar with Orthogonal Polarization (CALIOP) observations, Atmos. Environ., 128, 147–157, https://doi.org/10.1016/j.atmosenv.2015.12.037, 2016.
Todd, M. C., Washington, R., Raghavan, S., Lizcano, G., and Knippertz, P.: Regional Model Simulations of the Bodélé Low-Level Jet of Northern Chad during the Bodélé Dust Experiment (BoDEx 2005), J. Climate, 21, 995–1012, https://doi.org/10.1175/2007JCLI1766.1, 2008.
Tulet, P., Crahan-Kaku, K., Leriche, M., Aouizerats, B., and Crumeyrolle, S.: Mixing of dust aerosols into a mesoscale convective system: Generation, filtering and possible feedbacks on ice anvils, Atmos. Res., 96, 302–314, https://doi.org/10.1016/j.atmosres.2009.09.011, 2010.
Vandenbussche, S., Callewaert, S., Schepanski, K., and De Mazière, M.: North African mineral dust sources: new insights from a combined analysis based on 3D dust aerosol distributions, surface winds and ancillary soil parameters, Atmos. Chem. Phys., 20, 15127–15146, https://doi.org/10.5194/acp-20-15127-2020, 2020.
Wang, J., Xia, X., Wang, P., and Christopher, S. A.: Diurnal variability of dust aerosol optical thickness and Angström exponent over dust source regions in China, Geophys. Res. Lett., 31, L08107, https://doi.org/10.1029/2004GL019580, 2004.
Washington, R., Todd, M. C., Engelstaedter, S., Mbainayel, S., and Mitchell, F.: Dust and the low-level circulation over the Bodélé Depression, Chad: Observations from BoDEx 2005, J. Geophys. Res.-Atmos., 111, D03201, https://doi.org/10.1029/2005JD006502, 2006.
Winker, D., Hunt, W., and Weimer, C.: The on-orbit performance of the CALIOP LIDAR on CALIPSO, Proc. SPIE 10566, International Conference on Space Optics – ICSO 2008, 105661H, 21 November 2017, https://doi.org/10.1117/12.2308248, 2017.
Winker, D. M., Vaughan, M. A., Omar, A., Hu, Y., Powell, K. A., Liu, Z., Hunt, W. H., and Young, S. A.: Overview of the CALIPSO Mission and CALIOP Data Processing Algorithms, J. Atmos. Ocean. Tech., 26, 2310–2323, https://doi.org/10.1175/2009JTECHA1281.1, 2009.
Wong, S. and Dessler, A. E.: Suppression of deep convection over the tropical North Atlantic by the Saharan Air Layer, Geophys. Res. Lett., 32, L09808, https://doi.org/10.1029/2004GL022295, 2005.
Yan, H., Qian, Y., Zhao, C., Wang, H., Wang, M., Yang, B., Liu, X., and Fu, Q.: A new approach to modeling aerosol effects on East Asian climate: Parametric uncertainties associated with emissions, cloud microphysics, and their interactions, J. Geophys. Res.-Atmos., 120, 8905–8924, https://doi.org/10.1002/2015JD023442, 2015.
Yu, H., Chin, M., Winker, D. M., Omar, A. H., Liu, Z., Kittaka, C., and Diehl, T.: Global view of aerosol vertical distributions from CALIPSO lidar measurements and GOCART simulations: Regional and seasonal variations, J. Geophys. Res.-Atmos., 115, D00H30, https://doi.org/10.1029/2009JD013364, 2010.
Yu, H., Chin, M., Yuan, T., Bian, H., Remer, L. A., Prospero, J. M., Omar, A., Winker, D., Yang, Y., Zhang, Y., Zhang, Z., and Zhao, C.: The fertilizing role of African dust in the Amazon rainforest: A first multiyear assessment based on data from Cloud-Aerosol Lidar and Infrared Pathfinder Satellite Observations, Geophys. Res. Lett., 42, 1984–1991, https://doi.org/10.1002/2015GL063040, 2015.
Yu, H., Tan, Q., Chin, M., Remer, L. A., Kahn, R. A., Bian, H., Kim, D., Zhang, Z., Yuan, T., Omar, A. H., Winker, D. M., Levy, R. C., Kalashnikova, O., Crepeau, L., Capelle, V., and Chédin, A.: Estimates of African Dust Deposition Along the Trans-Atlantic Transit Using the Decadelong Record of Aerosol Measurements from CALIOP, MODIS, MISR, and IASI, J. Geophys. Res.-Atmos., 124, 7975–7996, https://doi.org/10.1029/2019JD030574, 2019.
Yu, Y., Notaro, M., Kalashnikova, O. V., and Garay, M. J.: Climatology of summer Shamal wind in the Middle East, J. Geophys. Res.-Atmos., 121, 289–305, https://doi.org/10.1002/2015JD024063, 2016.
Yu, Y., Kalashnikova, O. V., Garay, M. J., Lee, H., and Notaro, M.: Identification and Characterization of Dust Source Regions Across North Africa and the Middle East Using MISR Satellite Observations, Geophys. Res. Lett., 45, 6690–6701, https://doi.org/10.1029/2018GL078324, 2018.
Yu, Y., Kalashnikova, O. V., Garay, M. J., and Notaro, M.: Climatology of Asian dust activation and transport potential based on MISR satellite observations and trajectory analysis, Atmos. Chem. Phys., 19, 363–378, https://doi.org/10.5194/acp-19-363-2019, 2019.
Yu, Y., Kalashnikova, O. V., Garay, M. J., Lee, H., Choi, M., Okin, G. S., Yorks, J. E., Campbell, J. R., and Marquis, J.: A global analysis of diurnal variability in dust and dust mixture using CATS observations, Atmos. Chem. Phys., 21, 1427–1447, https://doi.org/10.5194/acp-21-1427-2021, 2021.
Zhang, X. Y., Gong, S. L., Zhao, T. L., Arimoto, R., Wang, Y. Q., and Zhou, Z. J.: Sources of Asian dust and role of climate change versus desertification in Asian dust emission, Geophys. Res. Lett., 30, 2272, https://doi.org/10.1029/2003GL018206, 2003.
Zheng, J., Zhang, Z., Garnier, A., Yu, H., Song, Q., Wang, C., Dubuisson, P., and Di Biagio, C.: The thermal infrared optical depth of mineral dust retrieved from integrated CALIOP and IIR observations, Remote Sens. Environ., 270, 112841, https://doi.org/10.1016/j.rse.2021.112841, 2022.
Zhou, L., Tian, Y., Wei, N., Ho, S., and Li, J.: Rising Planetary Boundary Layer Height over the Sahara Desert and Arabian Peninsula in a Warming Climate, J. Climate, 34, 4043–4068, https://doi.org/10.1175/JCLI-D-20-0645.1, 2021.