the Creative Commons Attribution 4.0 License.
the Creative Commons Attribution 4.0 License.
 | 15 May 2023
Source attribution of near-surface ozone trends in the United States during 1995–2019
Pengwei Li
Hailong Wang
Su Li
Pinya Wang
Baojie Li
Hong Liao
Emissions of ozone (O3) precursors in the United States have decreased in recent decades, and near-surface O3 concentrations showed a significant decrease in summer but an increase in winter. In this study, an O3 source tagging technique is utilized in a chemistry–climate model to investigate the source contributions to O3 mixing ratios in the US from various emitting sectors and regions of nitrogen oxides (NOx) and reactive carbon species during 1995–2019. We show that domestic emission reductions from energy and surface transportation are primarily responsible for the decrease in summertime O3 during 1995–2019. However, in winter, the emission control also weakens the NOx titration process, resulting in considerable increases in O3 levels from natural sources. Additionally, increases in aviation and shipping emissions and transpacific transport of O3 from Asia largely contribute to the winter O3 increase. We also found that changes in large-scale circulation favoring O3 transport from the upper atmosphere and foreign transport from Asia also explain 15 % of the increase in the US near-surface O3 levels in winter.
- Article
(6508 KB) - Full-text XML
-
Supplement
(1676 KB) - BibTeX
- EndNote


Ozone (O3) near the surface has a significant impact on air quality and public health (Haagen-Smit, 1952; Fleming et al., 2018). Since the increase in anthropogenic emissions of O3 precursors from preindustrial times, O3 has now become the third most important anthropogenic greenhouse gas in the troposphere (Myhre et al., 2013). Major sources of O3 in the troposphere include the transport from the stratosphere and formation through photochemical reactions within the troposphere involving two chemically distinct groups of precursors: nitrogen oxides (NOx) and reactive carbon species, including carbon monoxide (CO), methane (CH4), and non-methane volatile organic compounds (NMVOCs) (Atkinson, 2000). O3 precursors come from a variety of sectors, and its relatively long lifetime of about 22 d (Stevenson et al., 2006) favors the long-range transport of O3. Due to the nonlinearity of the O3 production and its associated dependence on precursor emissions (Seinfeld and Pandis, 2006), attributing O3 pollution to its sources is complicated.
Since the 1980s, O3 precursor emissions have significantly reduced in the United States (Duncan et al., 2016; Xing et al., 2013; Zhang et al., 2016, 2021). However, due to the nonlinear production chemistry of O3, complex seasonal meteorological influence and long-range transport from foreign source regions, domestic emission reductions do not imply a decrease in seasonal and annual O3 concentrations. According to remote surface measurements (Cooper et al., 2020) and aircraft observations (Gaudel et al., 2020), the Sixth Assessment Report of the Intergovernmental Panel on Climate Change (Szopa et al., 2021) showed a decreasing trend in annual mean O3 concentrations in the western US but an increasing trend in the eastern US since the mid-1990s. On the seasonal timescale, surface observations and modeling results showed that O3 concentrations over the US had decreased in summer due to the reductions in domestic anthropogenic emissions and increased in winter related to the weakened NOx titration since the late 1980s (Cooper et al., 2012; Lin et al., 2017). It also shows that the increased background O3, especially due to an increased transport from Asia, can partly offset the benefit of domestic emission control over the western US in summer.
Source apportionment is a useful method for quantifying contributions to air pollutants from specific source regions and/or sectors, which is beneficial to emission control strategies (Yang et al., 2018). One method of obtaining an O3 source–receptor relationship is to zero out or perturb emissions from a given source region or sector in sensitivity simulations along with a baseline simulation, which gives information about the response of O3 to changes in precursor emissions (e.g., Fiore et al., 2009; Hoor et al., 2009). However, the emission perturbation method requires many additional model simulations when being used to estimate the impacts of changes in multiple sources (Koo et al., 2009; Wang et al., 2014). The perturbation method may invalidate the assumption of a linear relationship between the magnitude of the emission perturbation and the magnitude of the O3 change considering the nonlinearity in O3 chemistry, especially if large perturbations (e.g., zeroing out regional or sector-wide emissions) are used. The tagging approach produces information about the contribution of precursor emissions to the total amount of O3 (Butler et al., 2020). The perturbation and tagging methods are two different methods answering different scientific questions, with the first for the impacts and the last for the contributions (Emmons et al., 2012; Clappier et al., 2017; Thunis et al., 2019). Both of these two methods can be used for a specific purpose to provide a comprehensive understanding of source–receptor relationships between precursor emissions and O3 concentrations.
The source tagging method has been widely adopted in regional air quality models to examine the O3 attribution in the US, China and/or Europe (Gao et al., 2016; Collet et al., 2018; Lupaşcu and Butler, 2019). In some regional models, O3 apportionment is based on the ratio of chemical indicators to determine the regime of O3 generation (e.g., VOC-limited or NOx-limited regimes) and then attribute the generation of O3 to the tag carried by a certain precursor (VOCs or NOx), which, however, cannot simultaneously attribute O3 production to NOx and VOCs, respectively (Dunker et al., 2002; Kwok et al., 2015), while some models do not use the chemical indicators (Lupaşcu and Butler, 2019; Mertens et al., 2020). In addition, due to the limitation in domain size of regional air quality models, it is difficult to account for contributions of intercontinental transport from several sources outside the model domain. Recently, O3 tagging techniques have been implemented in the global models (e.g., Sudo and Akimoto, 2007; Zhang et al., 2008; Emmons et al., 2012; Grewe et al. 2017; Butler et al., 2018; Han et al., 2018; Bates and Jacob, 2020). However, in many global models, O3 is tagged by the production regions rather than the precursor emission regions, so that O3 can only be attributed to the area where O3 is generated, rather than the source of precursor emissions.
Here, based on a state-of-the-art tagging system implementation in a global chemistry–climate model, the trends of near-surface O3 mixing ratios in the US during 1995–2019 and the source attributions of the O3 variations to various emission sectors and regions of NOx and reactive carbon species are investigated in this study. Mechanisms of explaining the O3 trends that involve changes in anthropogenic emissions and large-scale circulations are also explored.
2.1 Model description
Tropospheric O3 mixing ratios are simulated using the Community Atmosphere Model version 4 with chemistry (CAM4-chem) (Lamarque et al., 2012; Tilmes et al., 2015), which is the atmospheric chemistry component of the Community Earth System Model (CESM), at a horizontal resolution of 1.9∘ latitude by 2.5∘ longitude with 26 vertical levels extending to 40 km above the surface. The height of bottom layer is about 120 m and there are about four layers under 2 km. The model configuration uses a comprehensive tropospheric chemistry mechanism based on the Model for Ozone and Related chemical Tracers version 4 (MOZART-4) (Emmons et al., 2010, 2012). Model configurations simulate wet deposition of gas species using the Neu and Prather (2011) scheme. Dry deposition is represented following the resistance approach originally described in Wesely (1989). Stratosphere–troposphere exchange of O3 is treated by setting O3 to stratospheric values as their climatological means over 1996–2005 at the tropopause (Lamarque et al., 2012), which is affected by atmospheric circulation and experiences the same loss rates as O3 in the troposphere (Tilmes et al., 2016). Sea surface temperatures and sea ice concentrations in our simulations are prescribed at present-day climatological conditions. The zonal and meridional wind fields are nudged towards the MERRA-2 (Modern Era Retrospective-Analysis for Research and Applications Version 2) reanalysis (Gelaro et al., 2017) at a 6-hourly relaxation timescale in this study to better constrain large-scale circulations by observations. The CAM4-chem performance in simulating tropospheric O3 and precursors has been fully evaluated in Tilmes et al. (2015).

Figure 1Source regions that are selected for O3 source tagging in this study include Africa (AFR), Central America (CAM), East Asia (EAS), Europe (EUR), the Middle East (MDE), North America (NAM), South Asia (SAS), Southeast Asia (SEA) and the rest of the world (ROW).
2.2 Ozone source tagging technique
The novel O3 source tagging technique implemented in the model was developed by Butler et al. (2018), which can provide a separate source apportionment of tropospheric O3 to the two distinct groups of precursor emissions, i.e., NOx and reactive carbon (CO, CH4 and NMVOCs). The portion of tropospheric O3 that is attributable to the stratosphere–troposphere exchange can also be quantified using this unique tagging technique. The source attribution of O3 requires two separate model runs, with the tagging applied to NOx and reactive carbon species, respectively. Details of the O3 tagging technique are described in Butler et al. (2018).
In this study, near-surface O3 is attributed to emission sectors and regions. Emissions from individual sectors, including agriculture (AGR); energy (ENE); industry (IND); residential, commercial and other (RCO); surface transportation (TRA); waste management (WST); international shipping (SHP); and biomass burning (BMB) emissions, as well as chemical production in the stratosphere (STR) and extra chemical production (XTR; a small amount of O3 produced due to the self-reaction of OH radicals and the reactions of HO2 with certain organic peroxy radicals) are tagged for both NOx and reactive carbon species. Aircraft (AIR), soil (SOIL) and lightning (LGT) sources are separately tagged for NOx emissions, while solvents (SLV) and biogenic (BIO) sources are separately tagged for NMVOC emissions.
For the regional source attribution, we separately tag anthropogenic sources from Africa (AFR), Central America (CAM), Europe (EUR), the Middle East (MDE), North America (NAM), East Asia (EAS), South Asia (SAS), Southeast Asia (SEA) and the rest of the world (ROW) (see Fig. 1 for the region map) and natural sources (BMB, SOIL, LGT, BIO, STR and XTR). Additional tags for methane (CH4) and carbon monoxide (CO) are applied in both of the reactive carbon tagging simulations that are used to attribute O3 to emission sectors and regions. We do not tag CH4 by individual sources, and the contributions of CH4 from various sources are lumped in this study. It is because CH4 has a relatively long lifetime in the troposphere, and it is well mixed in the troposphere due to its exceptionally low reactivity, which can contribute to O3 formation at any location in the troposphere where photochemical conditions are favorable (Fiore et al., 2008). CO also has a longer lifetime and lower reactivity than most NMVOCs. The lumped CO is tagged in the simulations for emission sectors but not specifically tagged in the simulations for emission regions due to the computational limit.
2.3 Emissions and observation
The global anthropogenic emissions, including NOx, CO, NMVOCs, SO2 and NH3, over 1990–2019 are from the Community Emissions Data System (CEDS) version 20210205 (Hoesly et al., 2018) (see Table S1 and Figs. S1–S3 in the Supplement). Biomass burning emissions are obtained from the CMIP6 (Coupled Model Intercomparison Project Phase 6) over 1990–2014 (van Marle et al., 2017), and the emissions for the following 5 years (2015–2019) are interpolated from the SSP2-4.5 forcing scenario (O'Neill et al., 2016). NOx emitted from soils and biogenic NMVOCs emitted from vegetation are prescribed as in Tilmes et al. (2015) and are kept at the present-day (2000) climatological levels during simulations. Lightning emissions of NOx are estimated online using the parameterization based on simulated cloud top heights from Price et al. (1997), which are scaled to provide a global annual emission of 3–5 Tg N yr−1 (Lamarque et. al., 2012). CH4 is fixed at a global average level of 1760 ppb (parts per billion, volume ratio in this study) during simulations.
Many studies have reported that the previous CEDS version 20160726 (hereafter CEDS2016) has large biases in the regional emission estimates (e.g., Cheng et al., 2021; Fan et al., 2018). In this study, the CEDS version 20210205 is used (hereafter CEDS2021), which builds on the extension of the CEDS system described in McDuffie et al. (2020) and extends the anthropogenic emissions to the year 2019. It updates country-level emission inventories for North America, Europe and China and has considered the significant emission reductions in China since the clean air actions in recent years. The global total NOx emission from CEDS2021 is lower than that of CEDS2016 after 2006, and it shows a fast decline since then. In 2014, the global total anthropogenic emission of NOx in CEDS2021 is about 10 % lower than the CEDS2016 estimate. This difference is mainly reflected in the NOx emissions in China and India. CEDS2021 has a lower estimate of the global NMVOC emission than CEDS2016 by more than 10 % during the recent decades, attributed to lower emissions from Africa, Central and South America, the Middle East, and India. The using of the CEDS2021 emission inventory in this study could reduce the contributions of NOx emissions from East Asia and South Asia to the US O3 mixing ratios and trends, as compared to CEDS2016. However, a recent study reported a difference in aviation emission distribution of NOx between CMIP5 and CMIP6 related to an error in data pre-processing in CEDS, leading to a northward shift of O3 burden in CMIP6 (Thor et al., 2023). Therefore, the contribution of the aircraft emissions of NOx to the O3 mixing ratios could be overestimated at high-latitude regions.
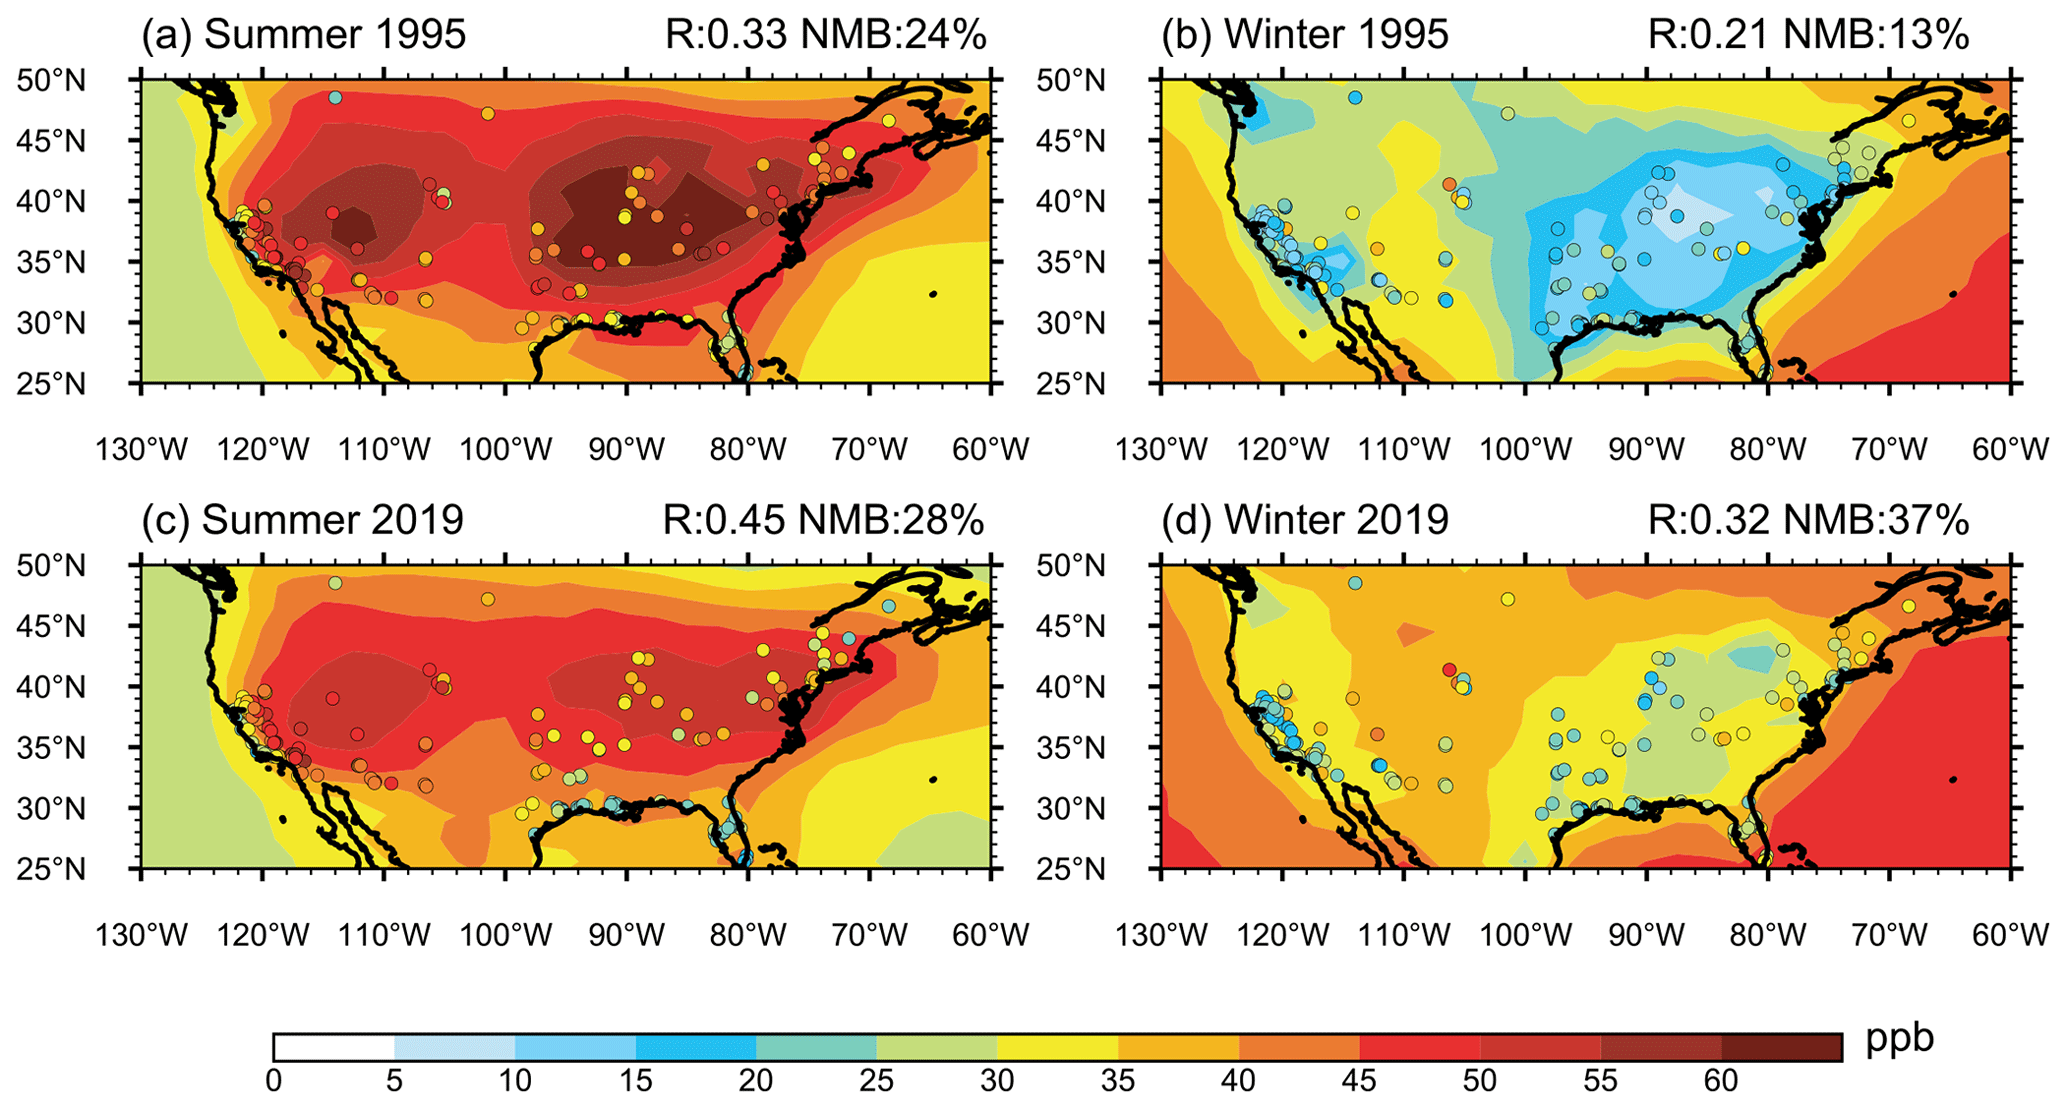
Figure 2The simulated (contours) and observed (scatters) seasonal mean near-surface O3 mixing ratios over the United States in JJA (a, c) and DJF (b, d) and in 1995 (a, b) and 2019 (c, d). The correlation coefficient and normalized mean bias (NMB, ) are shown on the top right of each panel.
Surface O3 measurements in the US are obtained from the US Environmental Protection Agency (EPA). Linear trends of surface O3 are calculated separately for boreal summer (June–July–August, JJA) and winter (December–January–February, DJF). The seasonal mean for any site that has less than 50 % data availability in any month of a season is discarded following Lin et al. (2017). O3 trends are calculated only when the seasonal data availability is greater than 85 % during the analyzed period (more than 22 years). Trends in this study are calculated based on the linear least-squares regressions, and the statistical significance is identified through the F test with the 95 % confidence level.
2.4 Experimental design
In this study, four groups of experiments are conducted; each group includes both a NOx tagging simulation and a reactive carbon tagging simulation. Two BASE experiment groups include simulations with emission sectors and regions, respectively, tagged for the two chemically distinct precursors. The BASE experiments are performed with time-varying anthropogenic emissions and winds nudged to MERRA-2 reanalysis. The other two groups of sensitivity experiments (MET) are the same as the BASE experiments, except that the anthropogenic emissions are held at the year 2019 level during the simulations. All experiments are performed over 1990–2019, with the first 5 years treated as a model spin-up and the last 25 years used for analysis. The BASE experiments are analyzed to quantify the source attributions of O3 in the US, unless stated otherwise. We note that although the wind fields are nudged at a 6-hourly relaxation timescale, the atmospheric dynamics could also be slightly different between simulations, leading to slight changes in the contributions from the same tags between simulations.
2.5 Model evaluation
Figure 2 compares the simulated near-surface O3 mixing ratios with those from observations in 1995 and 2019, respectively. In general, the model overestimates O3 mixing ratios in the US in both summer and winter by 10 %–40 %. It can capture the seasonal pattern of O3 with high mixing ratios in summer and low mixing ratios in winter. The spatial distributions can also be roughly captured by the model, with statistically significant correlation coefficients between simulations and observations in the range of 0.21–0.45. From 1995 to 2019, the O3 mixing ratios in the US decreased in summer and increased in winter, presented in the observations. The model can produce the sign of the changes but has large biases in magnitudes, which will be discussed in the following section.
3.1 Ground-level ozone trends in the US
Emissions of O3 precursors have substantially reduced since 1995 in both the western US (WUS; 30–45∘ N, 100–125∘ W) and eastern US (EUS; 30–45∘ N, 70–100∘ W), primarily owing to the reductions in anthropogenic emissions (Figs. S1–S3). However, the simulated annual near-surface O3 mixing ratios present opposite trends between the WUS and EUS, with increases in the EUS but weak decreases in the WUS, which also exist in observations (Fig. 3a).
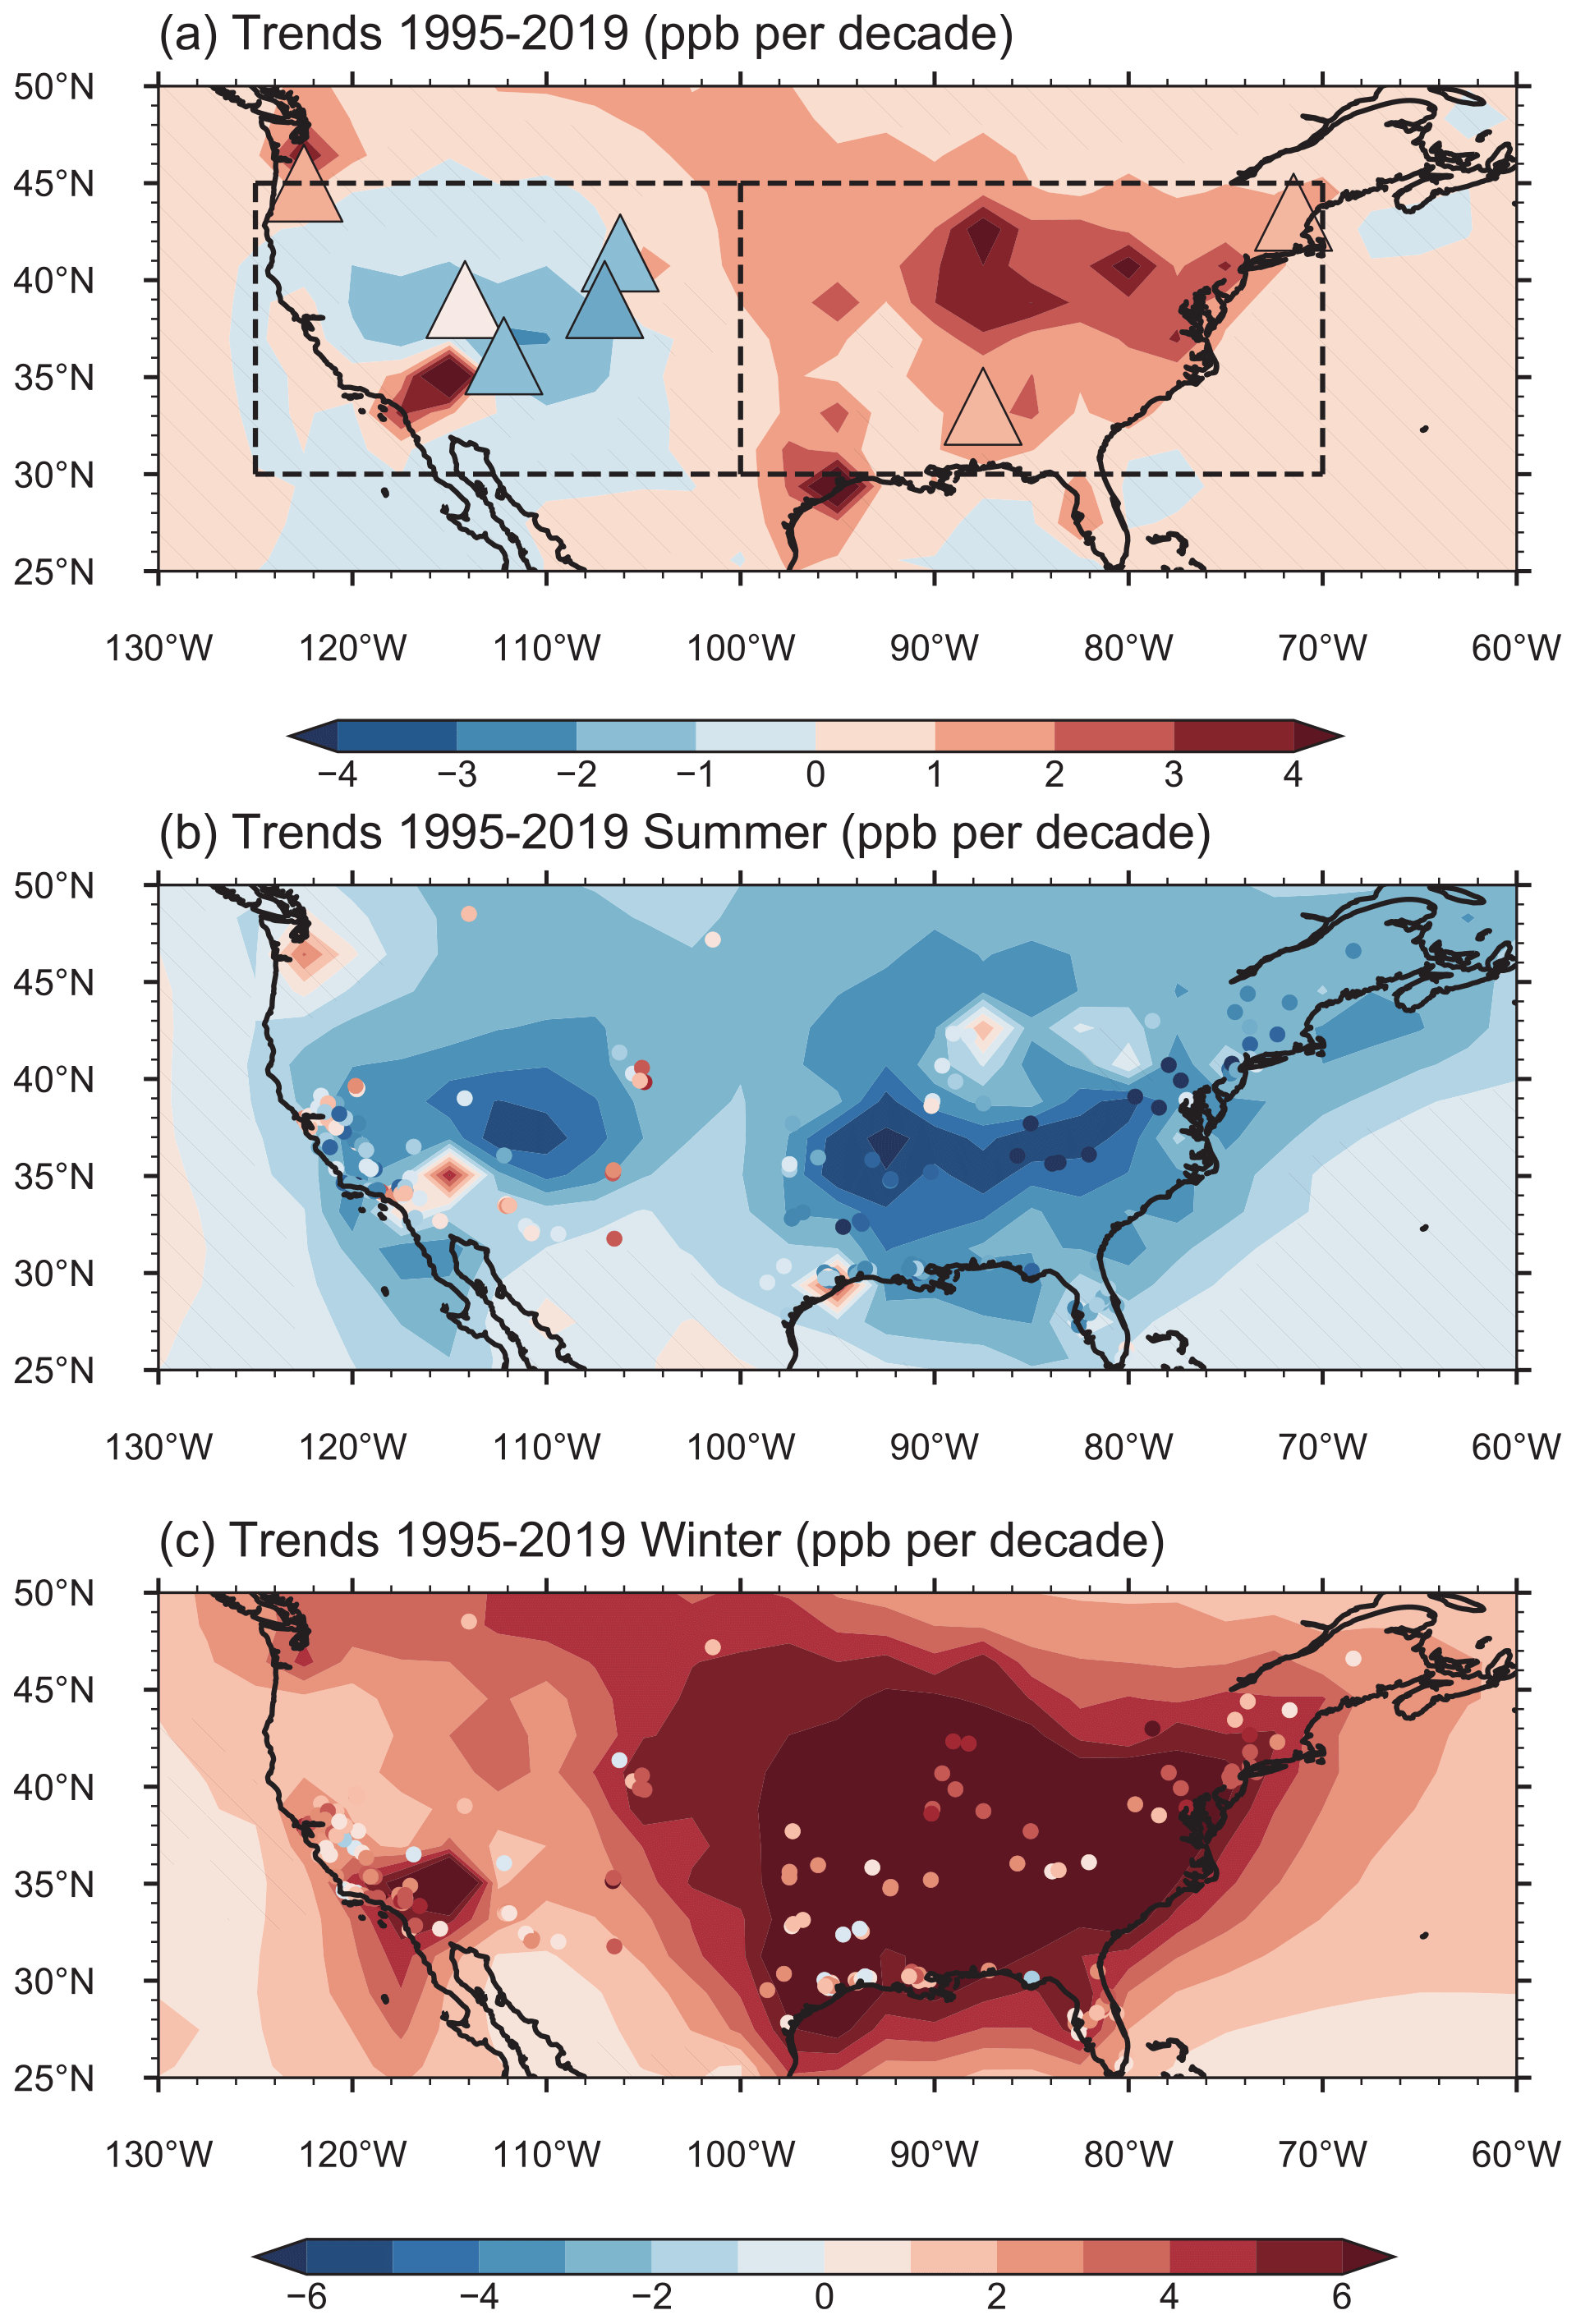
Figure 3Linear trends (ppb per decade) of simulated (contours) and observed (color-filled markers) (a) annual, (b) JJA and (c) DJF mean near-surface O3 mixing ratios during 1995–2019. Areas without hatches indicate statistical significance with 95 % confidence. The boxes in panel (a) mark the western US (WUS; 30–45∘ N, 100–125∘ W) and eastern US (EUS; 30–45∘ N, 70–100∘ W), respectively. The observed annual O3 mixing ratio trends in panel (a) are derived from IPCC AR6, based on Cooper et al. (2020) and Gaudel et al. (2020) over 1995–2017. The observed seasonal O3 mixing ratio trends in panels (b) and (c) are calculated based on the US EPA O3 measurements over 1995–2019.
The simulated contrasting trends in annual mean O3 mixing ratios between the WUS and EUS are dominated by the strong decreases in O3 mixing ratios in summer across the US (Fig. 3b) and increased O3 levels in winter over the central-eastern US during 1995–2019 (Fig. 3c). The opposite trends between summer and winter have also been noted in many previous studies (e.g., Cooper et al., 2012; Lin et al., 2017; Jaffe et al., 2018). The model reproduces the observed O3 trend over the EUS in summer and roughly captures the O3 trend over the WUS in winter (Table 1). The decreasing trend over the WUS in summer and the increasing trend over the EUS in winter, however, are largely overestimated in the model, partly attributed to the coarse model resolution. The model also tends to overestimate the weakening of NOx titration in winter, leading to the biases. For spring and autumn, they are the transition between summer and winter, having the similar spatial pattern of O3 trends as annual average, and will not be concerned with in this study.
Table 1O3 trends (ppb per decade) over the eastern US and western US in winter (December–January–February, DJF) and summer (June–July–August, JJA) from observations and model simulations.
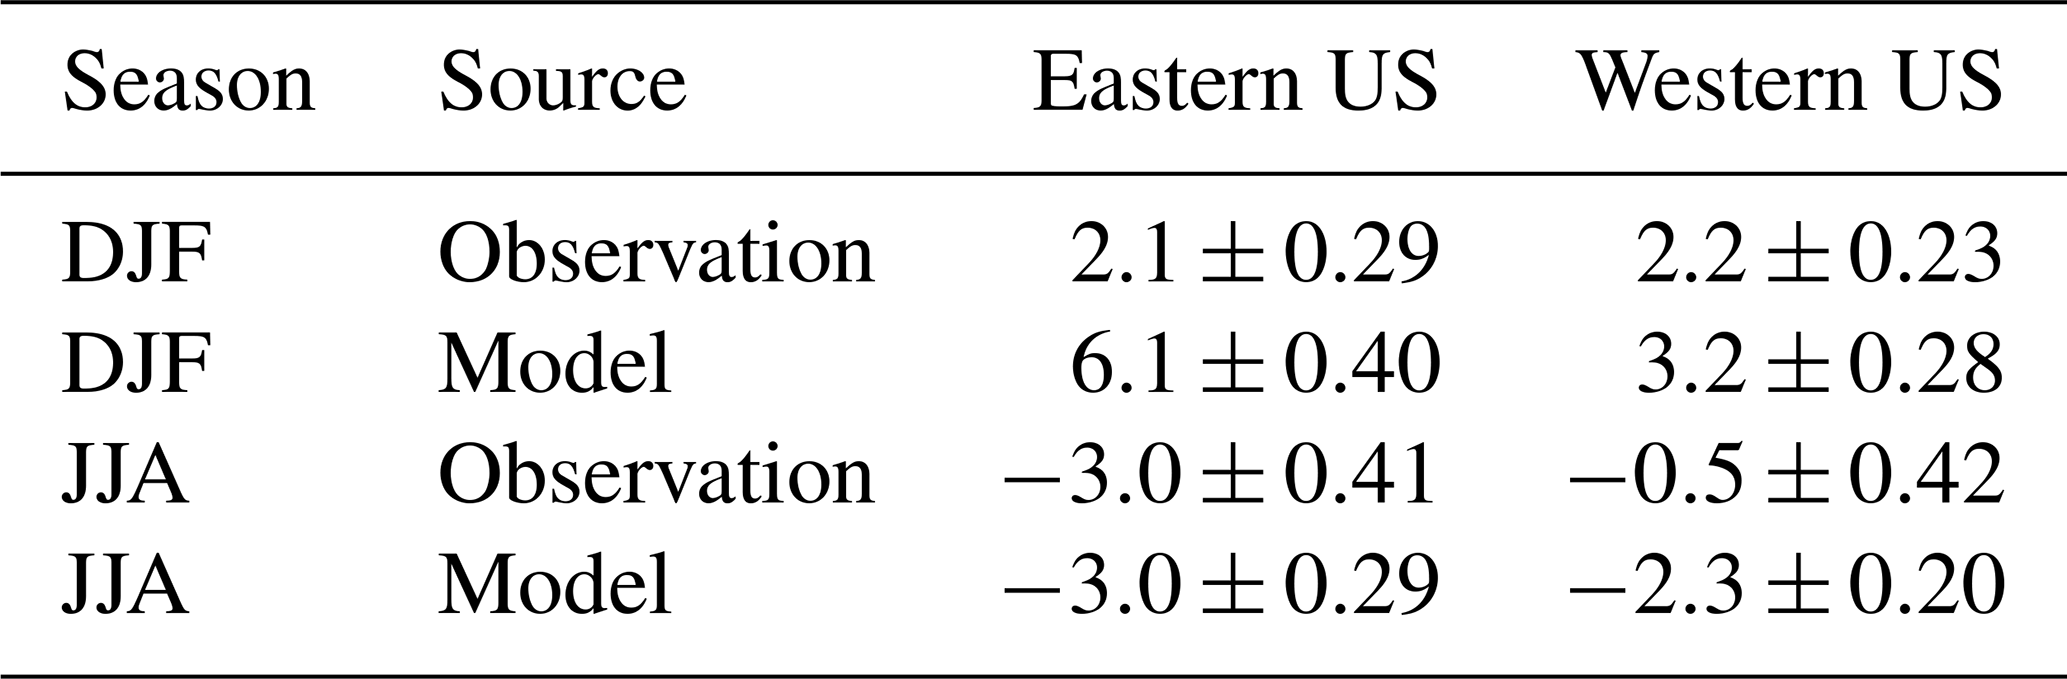
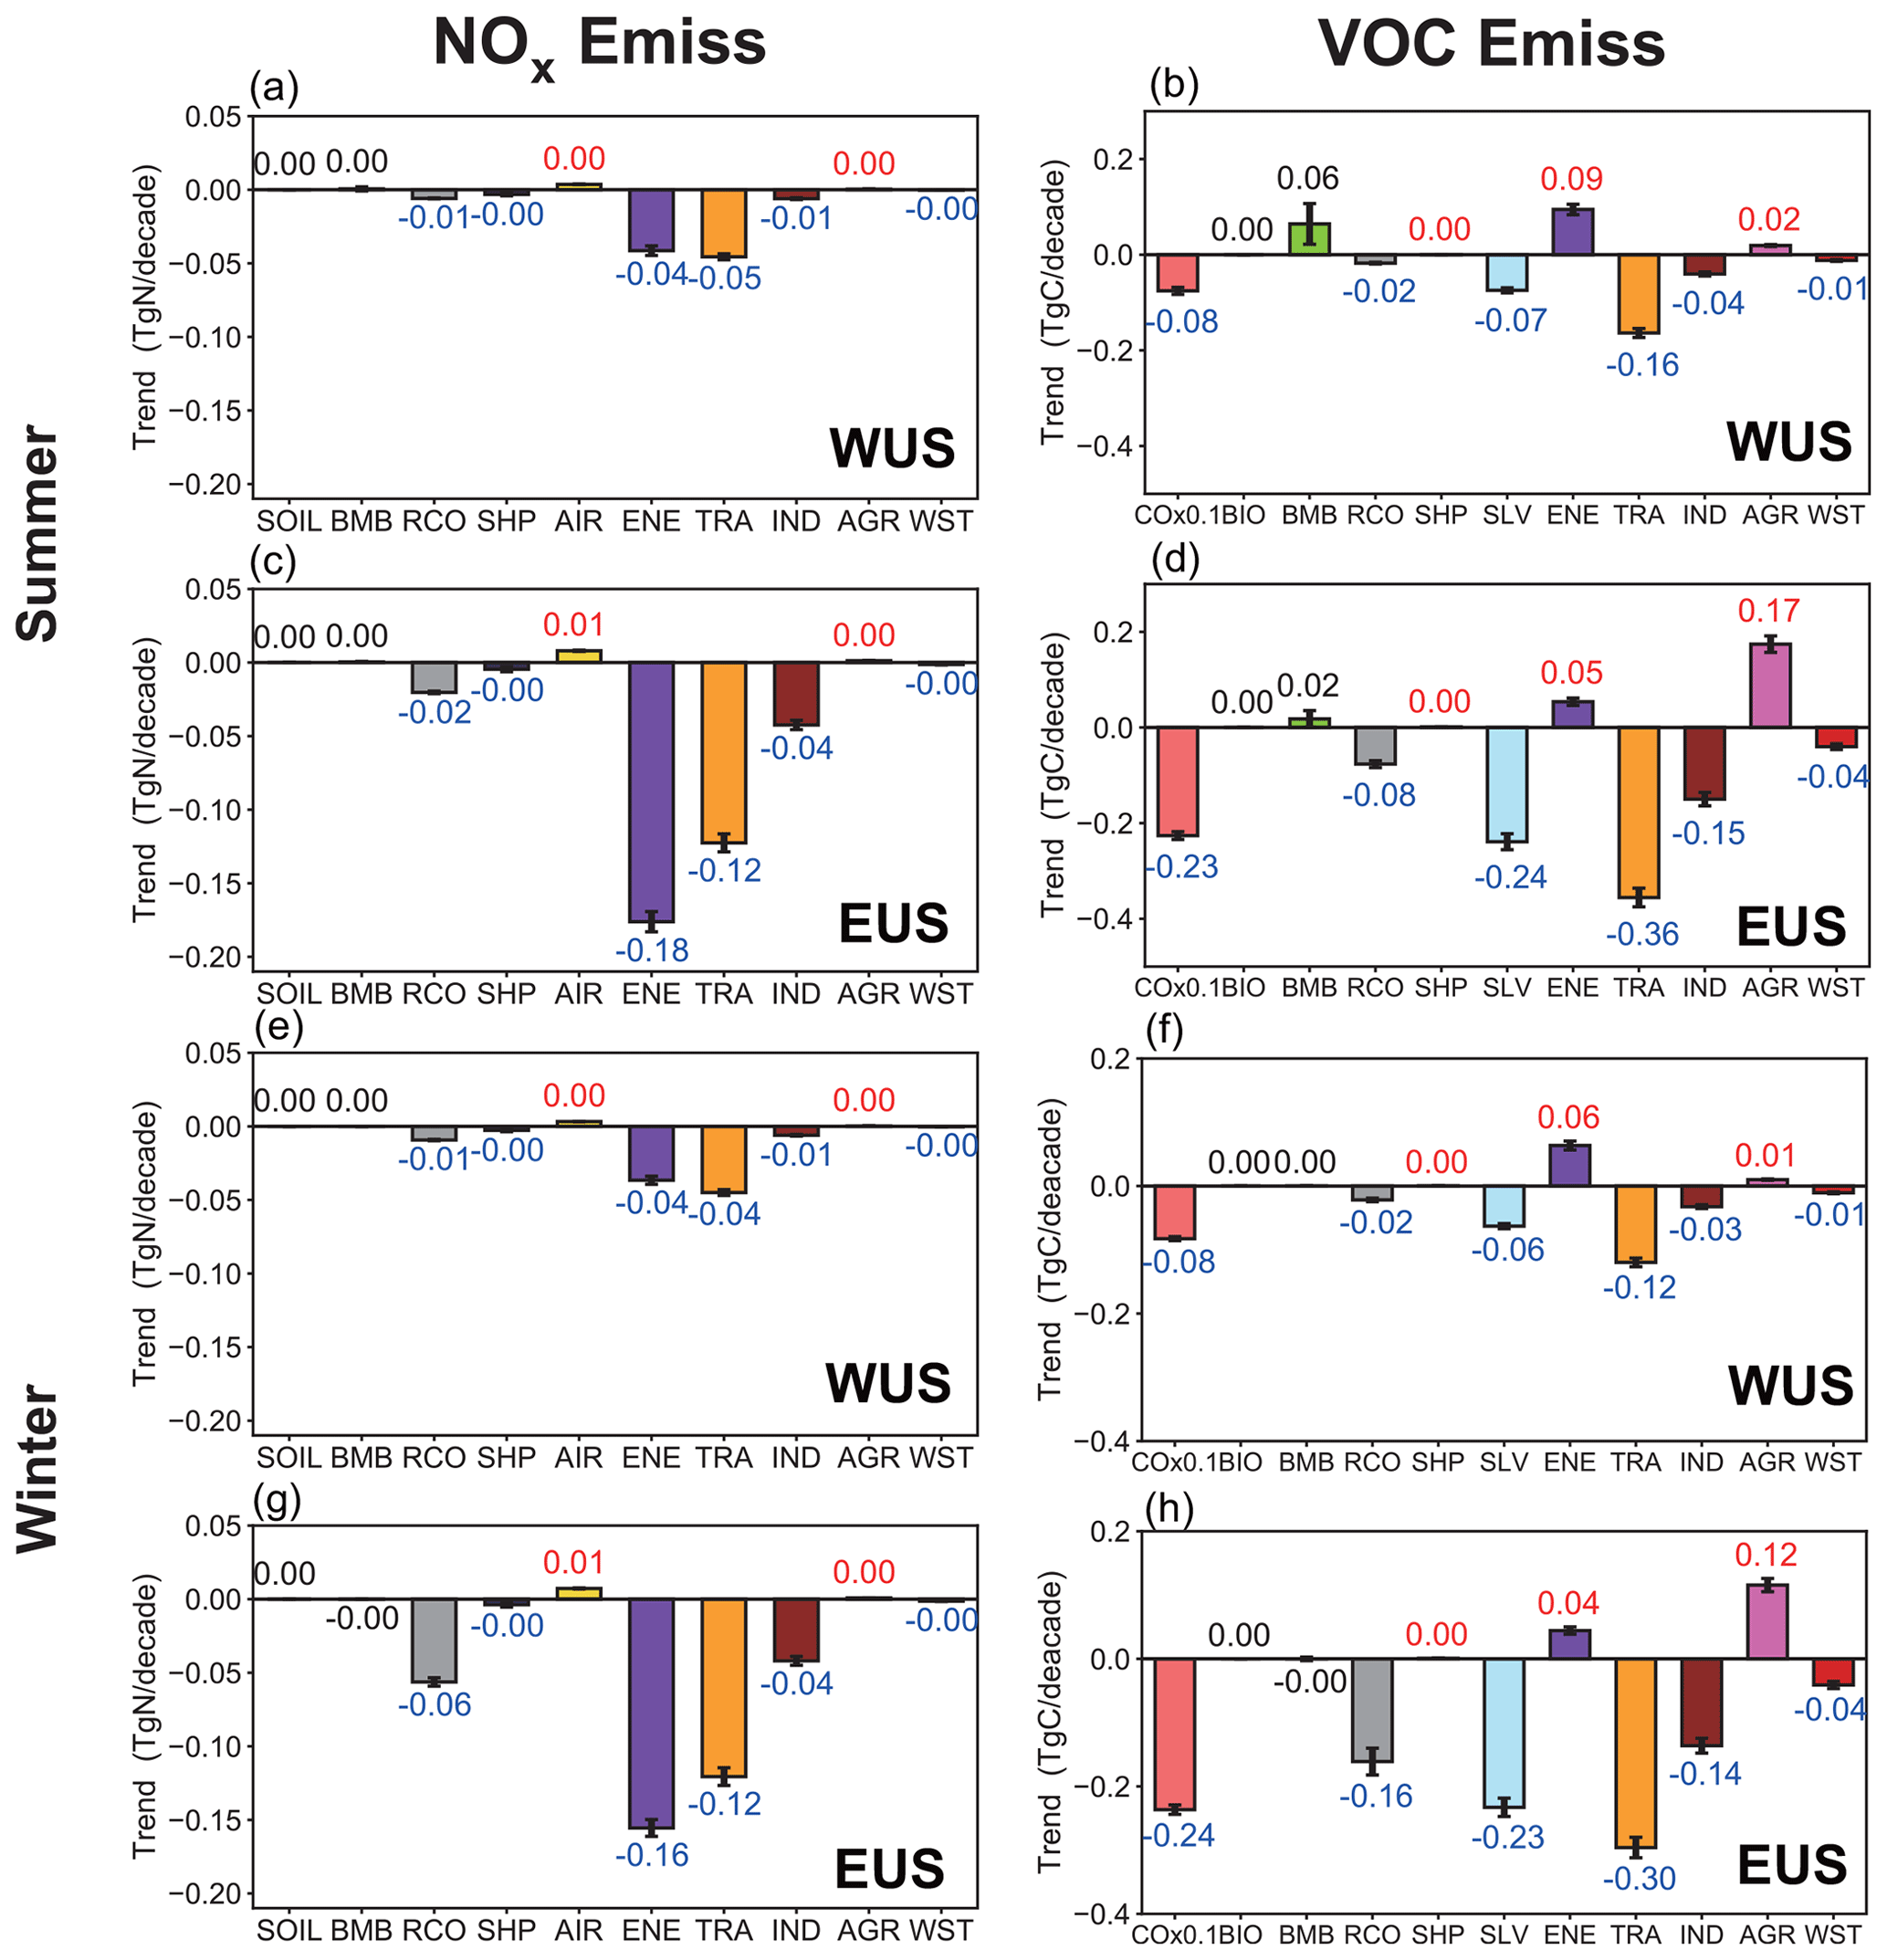
Figure 4Linear trends of NOx and reactive carbon emissions from various sectors in summer and winter over the WUS and EUS. The increasing and decreasing trends marked with red and blue values, respectively, indicate statistical significance with 95 % confidence.
3.2 Source attribution of ozone trends to emission sectors
During 1995–2019, summer and winter NOx emissions from energy and surface transport sectors significantly decreased in both the WUS and EUS, followed by industry and residential sectors, while those from aircraft increased slightly (Fig. 4). Emissions of NMVOCs from surface transportation, solvents, industry, residential sectors and waste sectors have decreased across the US, while those from energy and agriculture have increased. CO emissions have also significantly decreased over this time period.
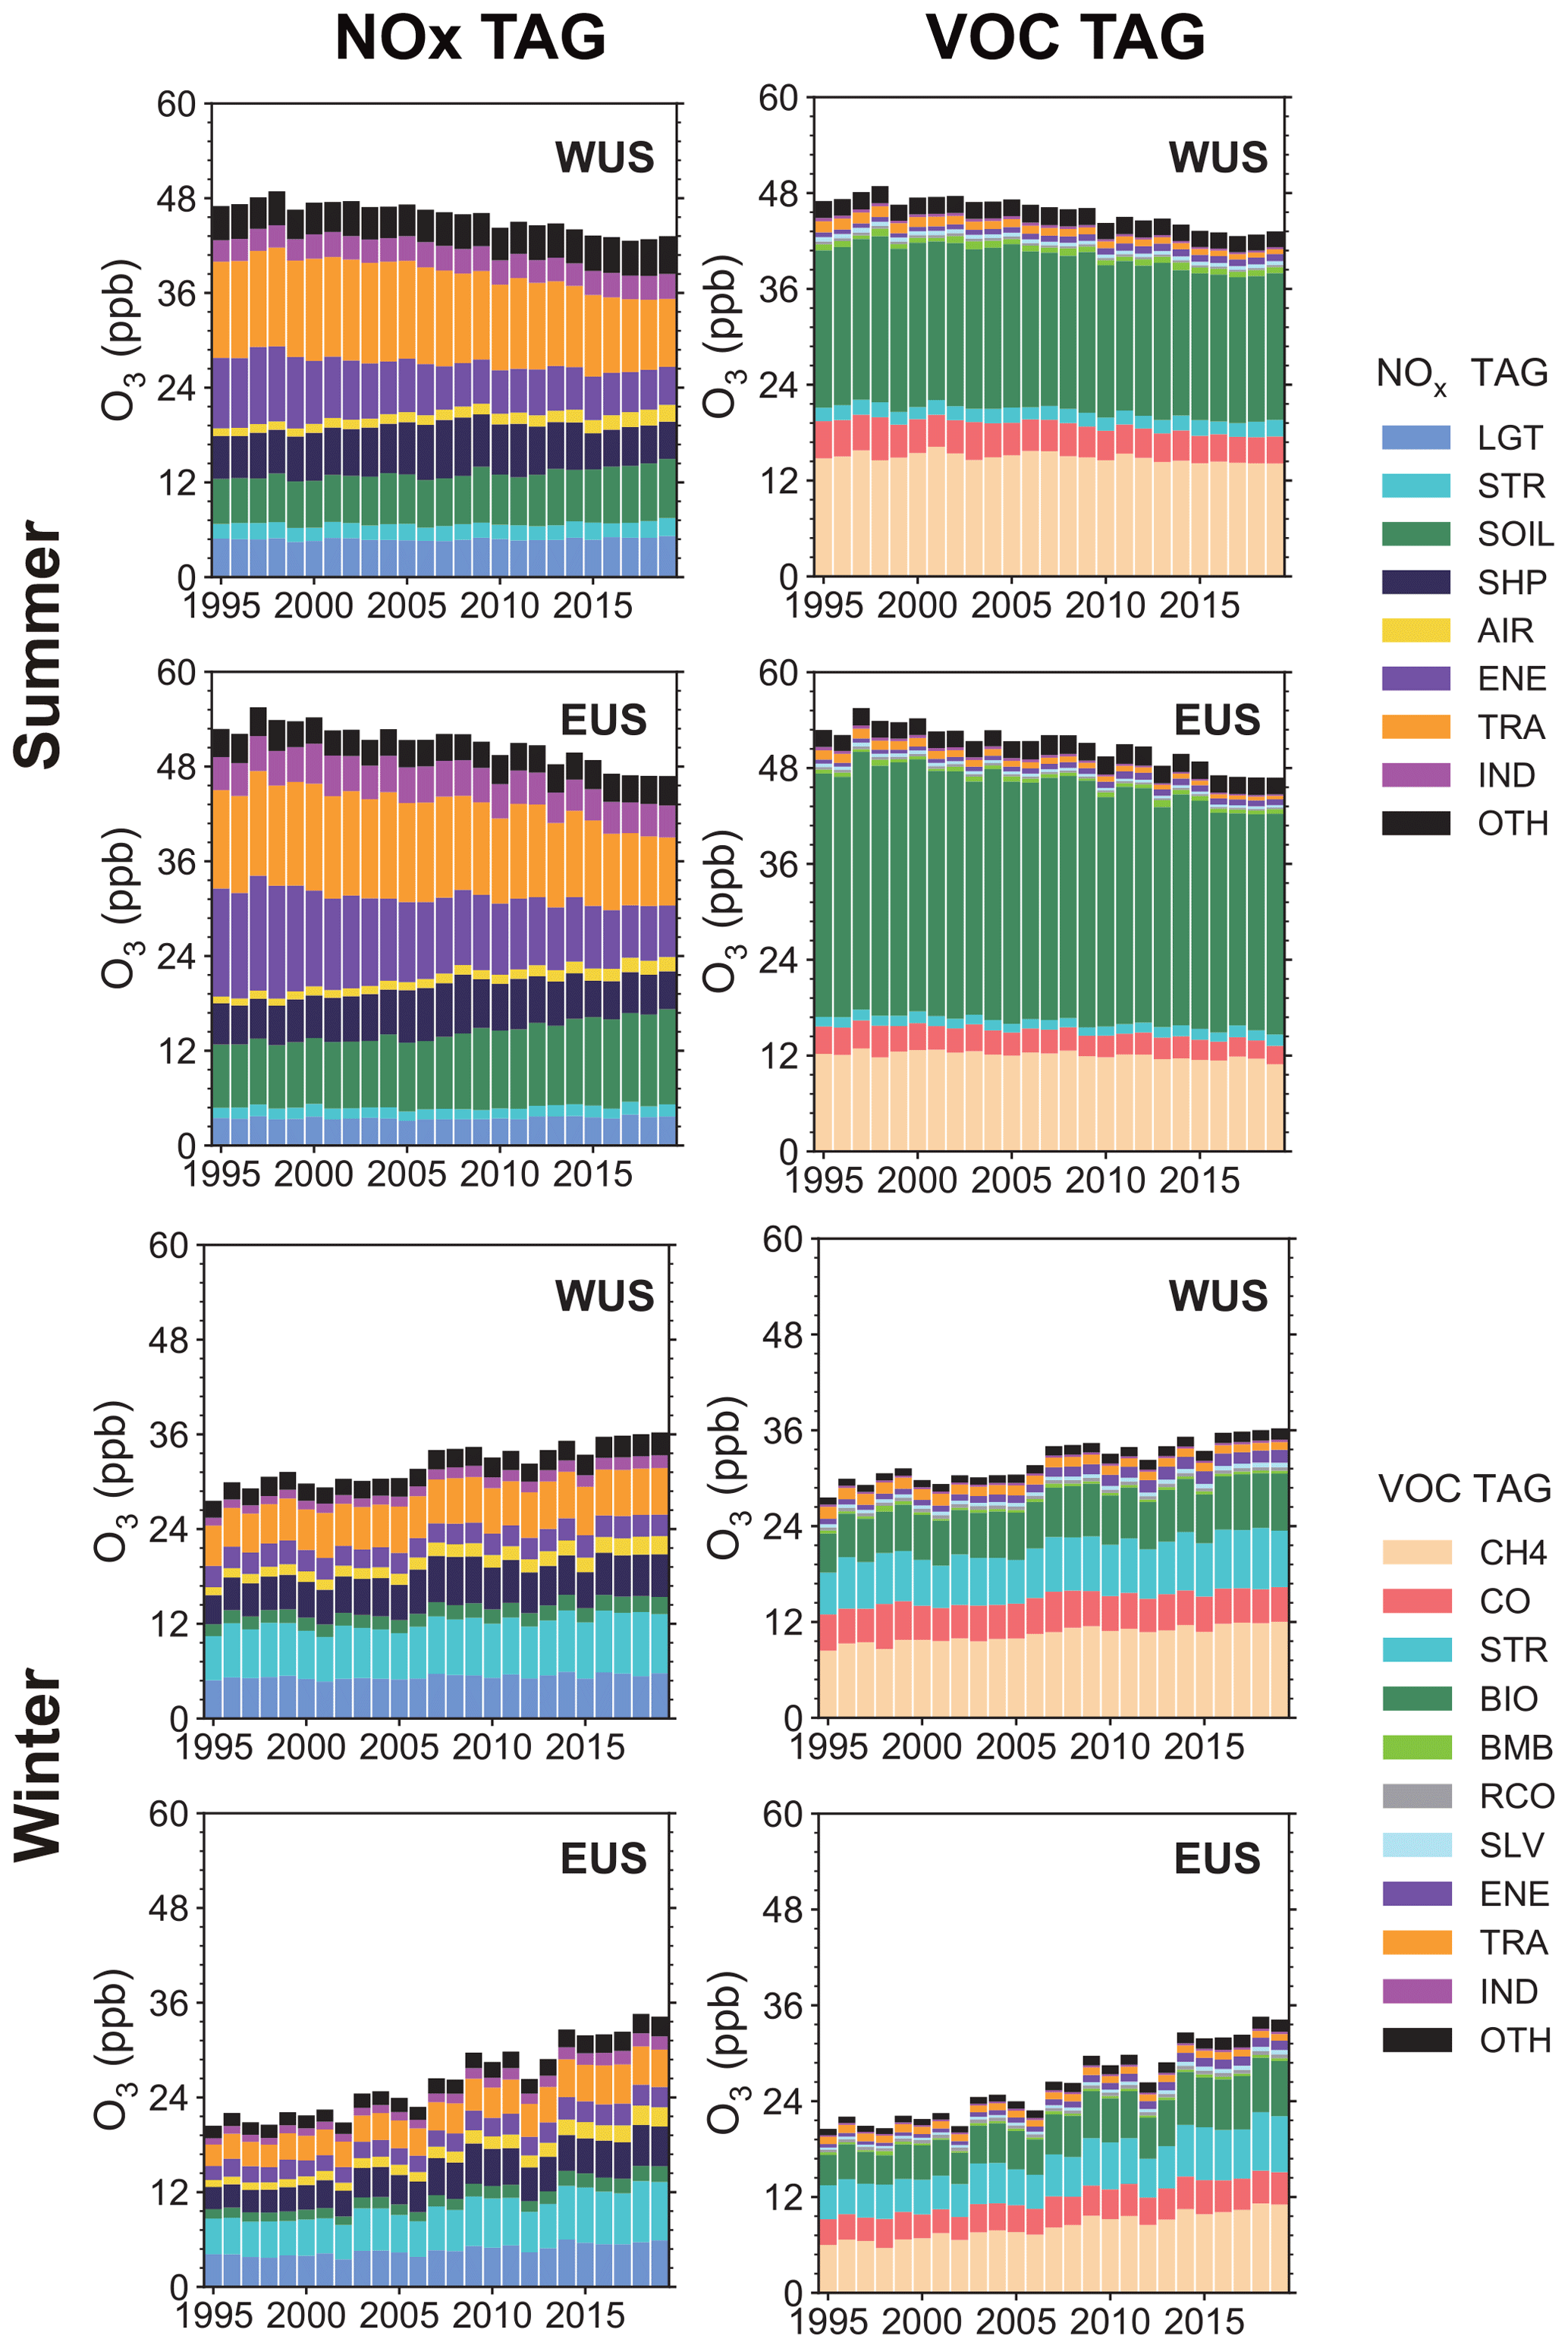
Figure 5Time series of near-surface O3 mixing ratios (ppb) averaged over the WUS and EUS, contributed by NOx and reactive carbon emissions from different sectors in summer and winter during 1995–2019. Sources with small contributions are combined and shown as OTH.

Figure 6Linear trends (ppb per decade) of near-surface O3 mixing ratios in summer and winter over the WUS and EUS, contributed by the NOx (left) and reactive carbon (right) emissions from various sectors (color bars). The increasing and decreasing trends marked with red and blue color numbers, respectively, indicate statistical significance with 95 % confidence. Other sources having small contributions are combined and shown as OTH.
The time series of the source sector contributions to O3 mixing ratios from NOx and reactive carbon emissions are shown in Fig. 5, and the O3 trends in the US attributed to different emission source sectors are shown in Fig. 6. In summer, the O3 attributed to NOx emissions from energy and surface transportation decreased at the rate of 2.0 ± 0.2 and 1.6 ± 0.2 ppb per decade in the WUS and 3.2 ± 0.2 and 1.7 ± 0.2 ppb per decade in the EUS, respectively (Fig. 6a and c). On the contrary, the O3 contributed by aircraft NOx emissions increased by 0.4 ± 0.0 ppb per decade in both the WUS and EUS. Along with the reductions in anthropogenic emissions, natural emissions are becoming increasingly important as sources for O3 formation near the surface. Although NOx emissions from soil are held at the present-day climatological levels, they account for 0.7 ± 0.1 and 1.7 ± 0.1 ppb per decade increases in the WUS and EUS, respectively, during 1995–2019, related to the changing O3 production efficiency under the more NOx-sensitive condition. Note that, during 1995–2019, the molar ratio (mol N (mol C)−1) of emitted NOx to NMVOCs reduced from 0.11 to 0.07 in the WUS and from 0.14 to 0.07 in the EUS, confirming the enhanced NOx-sensitive condition during the analyzed time period. In recent decades, global emissions from international shipping have increased rapidly (Eyring et al., 2005; Müller-Casseres et al., 2021) but have declined near the coast of the United States. Due to a strong chemical sink associated with photolysis of O3 with subsequent production of hydroxyl radical (OH) from water vapor in summer (Johnson et al., 1999), the effect of increased international shipping emissions over the remote ocean regions on the continental US was blunted. But the increase in shipping emissions inland tends to increase O3 mixing ratios in the eastern US (Fig. S4).
In summer, biogenic sources dominate the emissions of NMVOCs in the US (Fig. S3). As the O3 decreases, mainly due to the reductions in domestic NOx emissions, the contributions from biogenic emissions of NMVOCs have a decreasing trend in the US during 1995–2019 (Fig. 6b and d), even though biogenic emissions were fixed during simulations. This also applies to CH4, of which the mixing ratio was kept constant. This does not actually mean that CH4 and biogenic NMVOCs themselves contributed to the overall O3 trend through changing the precursor levels, since they were kept constant during simulations; rather, mainly due to the reductions in NOx emissions, O3 production efficiency by reactive carbon species decreases, leading to decreasing trends of O3 contribution by CH4 and biogenic NMVOCs. In conjunction with NOx emission reductions, decreases in NMVOC emissions from surface transportation and industry sectors contribute negative O3 trends of −0.3 ± 0.0 and −0.1 ± 0.0 ppb per decade, respectively, in both the WUS and EUS in summer (Fig. 6b and d), which are offset by the increases in NMVOC emissions from energy and agriculture sectors. Although the O3 production efficiency of CO is relatively low, the contributions of CO to O3 mixing ratios largely decreased with trends of −0.6 ± 0.1 and −0.5 ± 0.1 ppb per decade in the WUS and EUS, respectively, due to the massive reduction in anthropogenic emissions of CO (Fig. S1).
In winter, through the weakened NOx titration process (Gao et al., 2013; Simon et al., 2015), the NOx emission control causes an increase in O3 levels during 1995–2019, especially the contribution from surface transportation (0.4 ± 0.0 ppb per decade in the WUS and 0.8 ± 0.1 ppb per decade in EUS) (Fig. 6e and g). Although aircraft NOx emissions slightly increased, O3 attributed to aircraft NOx emissions shows positive trends as large as 0.4 ± 0.0 and 0.6 ± 0.0 ppb per decade in the WUS and EUS, respectively. It is because aircraft emissions are injected directly into the upper troposphere and lower stratosphere in a low ambient NOx condition and have a much higher O3 enhancement efficiency than surface emissions (Hodnebrog et al., 2011). It can be confirmed that the NOx from aircraft contributes to the increase in O3 mixing ratios at 250 hPa in high-latitude regions of the Northern Hemisphere during 1995–2019 (Fig. S5). The decrease in near-shore shipping emissions weakened the NOx titration, together with the weakened O3 chemical sink from water vapor in winter, leading to large increasing trends of O3 by 0.8 ± 0.1 and 1.0 ± 0.1 ppb per decade, respectively, in the WUS and EUS during 1995–2019. Although most natural emissions do not change during the simulations, the net O3 chemical production is more sensitive to NOx under the emission control condition, resulting in the increasing O3 trends contributed by the soil and lightning NOx emissions. Due to the weakened NOx titration in winter, the contribution of stratospheric intrusion increases at a rate of 0.6 ± 0.1 and 1.0 ± 0.1 ppb per decade over the WUS and EUS, respectively, when stratospheric contribution to the near-surface O3 is relatively high (Butler et al., 2018). Along with the weakened NOx titration, contributions from reactive carbon emissions to the near-surface O3 in the US also increase for most species and sectors (Fig. 6f and h).
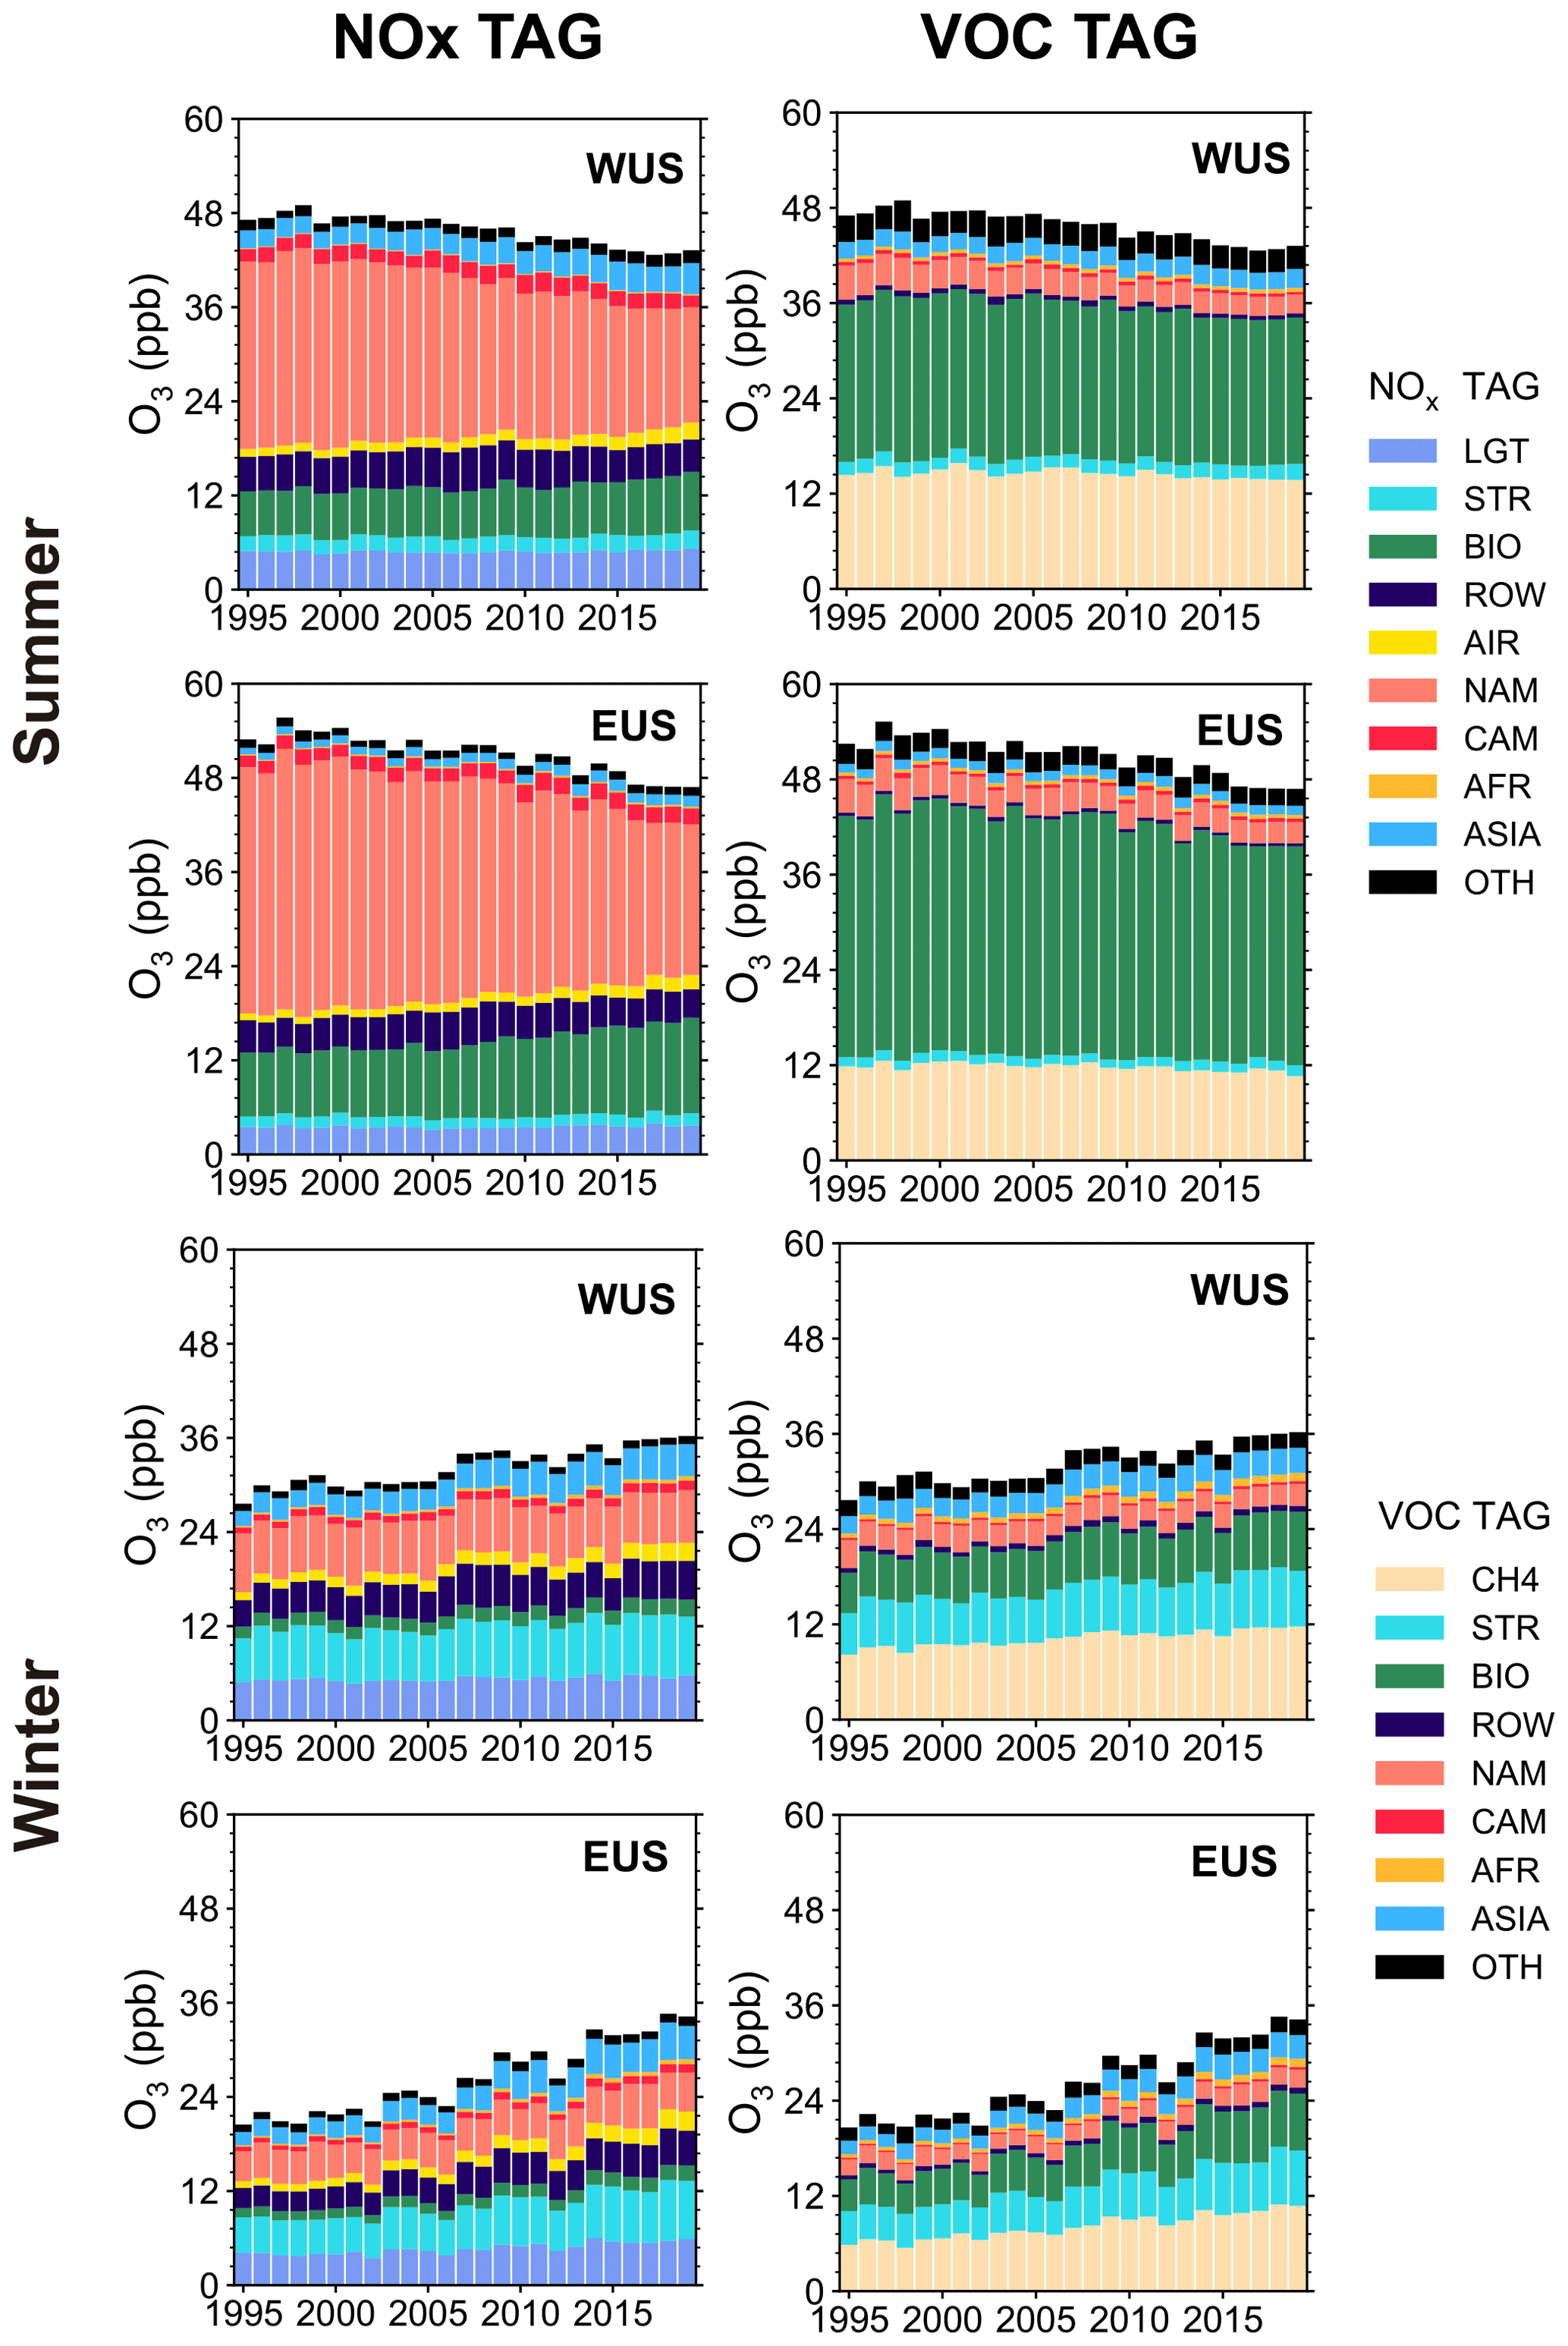
Figure 7Time series of near-surface O3 mixing ratios (ppb) averaged over the WUS and EUS, contributed by NOx and reactive carbon emissions from different source regions in summer and winter during 1995–2019. Sources with small contributions are combined and shown as OTH.
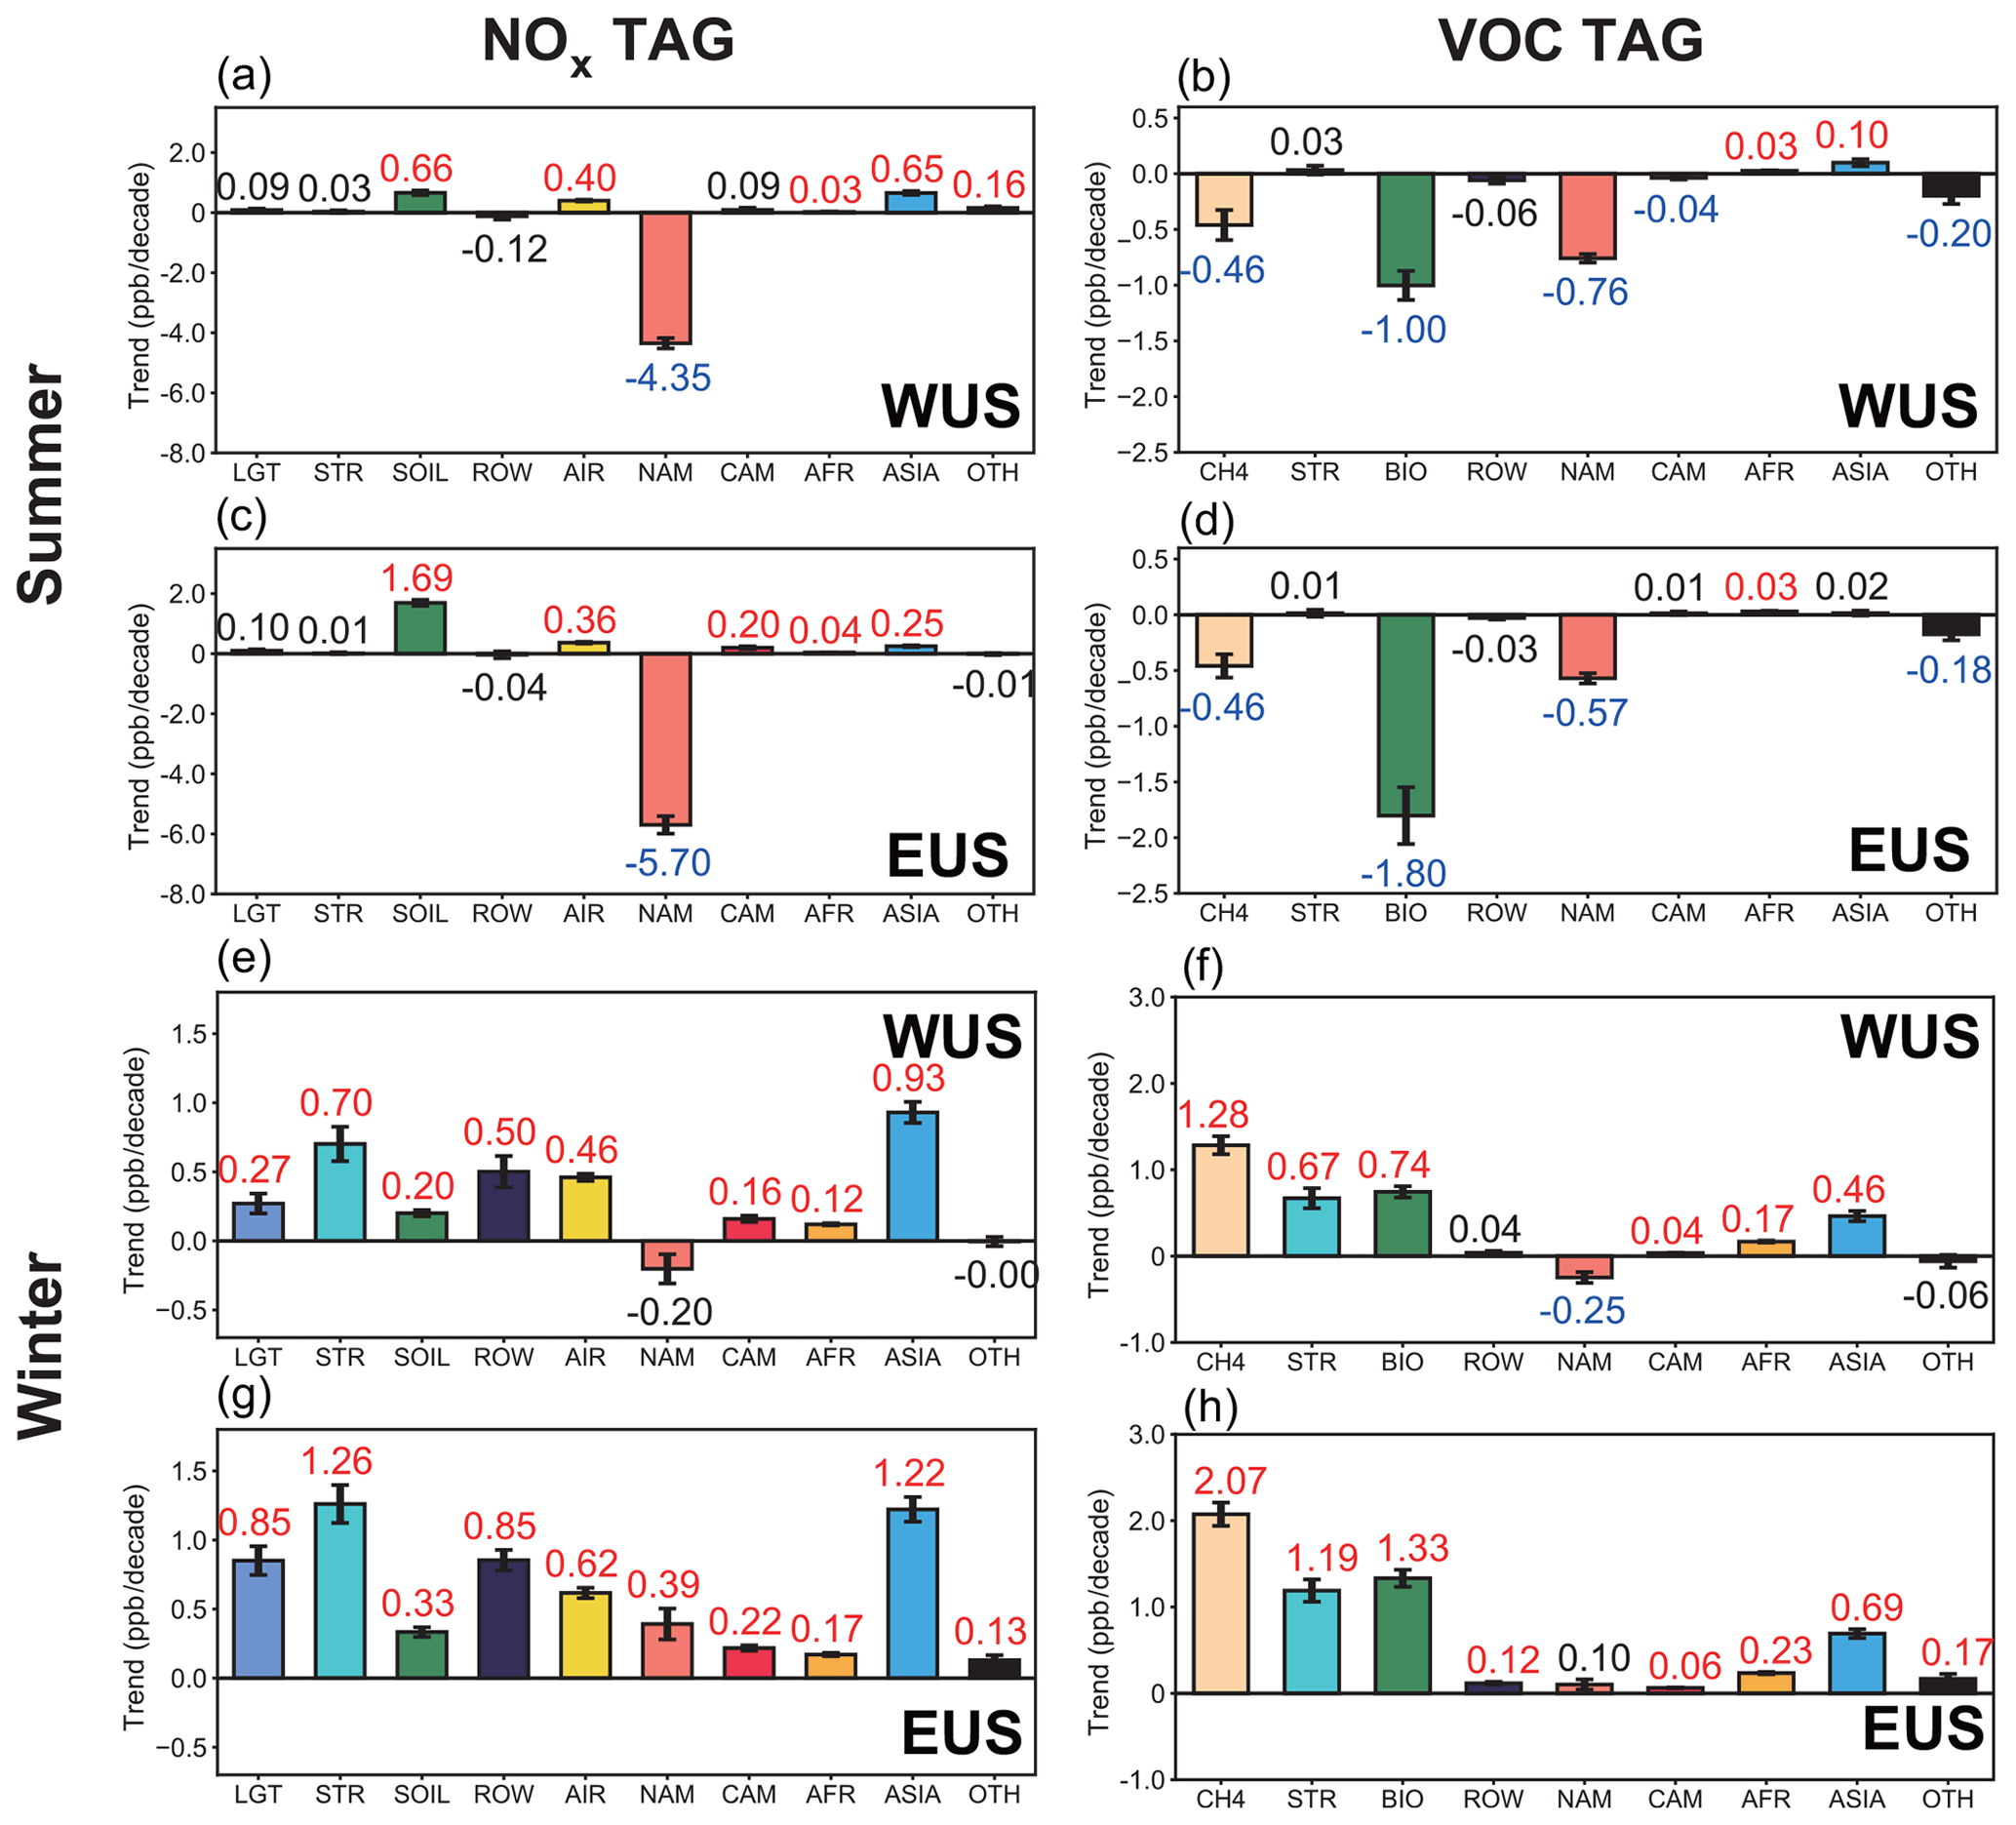
Figure 8Linear trends (ppb per decade) of near-surface O3 mixing ratios in summer and winter over the WUS and EUS, contributed by the NOx (left, a, c, e and g) and reactive carbon (right, b, d, f, and h) emissions from various source regions (color bars). The increasing and decreasing trends marked with red and blue colored numbers, respectively, indicate statistical significance with 95 % confidence. Contributions from source regions EAS, SAS and SEA are combined into ASIA. Other sources having small contributions are combined and shown as OTH.
3.3 Source attribution of ozone trends to emission regions
Time series of the source region contributions to near-surface O3 mixing ratios are shown in Fig. 7, and the O3 trends in the US attributed to different emission source regions are presented in Fig. 8. In summer, domestic anthropogenic NOx emissions (excluding those from soil) within North America account for 49 % of the near-surface O3 mixing ratio averaged over the US (WUS + EUS) in 1995–2019. The domestic emission reduction is the dominant factor causing the decline in surface O3 mixing ratios, with contributions of −4.4 ± 0.2 and −5.7 ± 0.3 ppb per decade to the trends over WUS and EUS, respectively, during 1995–2019 (Fig. 8a and c). Reductions in the NMVOC emissions from North American anthropogenic sources also decrease O3 mixing ratios (Fig. 8b and d), accompanying the domestic NOx emission control. The increase in NOx emissions from Asia contributes 0.7 ± 0.1 ppb per decade to the total O3 increasing trend in the WUS, partly offsetting the negative impact of domestic emission reductions, but has a weak impact in the EUS, which is consistent with previous studies (Lin et al., 2017).
In winter, domestic anthropogenic NOx emissions only account for 19 % of the surface O3 mixing ratio in the US over 1995–2019, while NOx sources from lightning, the rest of the world (mainly from international shipping) and Asia contribute 17 %, 14 % and 11 %, respectively. O3 from stratospheric intrusion contributes 21 % of the near-surface O3 in the US in winter. During 1995–2019, the significant increases in wintertime surface O3 mixing ratios are not directly linked to the reductions in domestic anthropogenic emissions (Fig. 8e and g). However, the domestic emission control weakens the NOx titration, resulting in considerable increases in O3 originating from natural sources, including O3 from stratospheric intrusion, lightning and soil emissions. The natural sources combined contribute to positive O3 trends of 1.2 ± 0.2 and 2.4 ± 0.3 ppb per decade in the WUS and EUS, respectively. If the O3 increase is attributed to NMVOC emissions, the combined natural source contribution is even larger (1.4 ± 0.2 in the WUS and 2.5 ± 0.2 ppb per decade in the EUS) (Fig. 8f and h). O3 produced by CH4 increases at rates of 1.3 ± 0.1 and 2.1 ± 0.1 ppb per decade in the WUS and EUS, respectively, due to the weakened NOx titration. Increases in aviation and shipping emissions together explain the 1.2 ± 0.1 and 1.5 ± 0.1 ppb per decade of O3 trends in the WUS and EUS, respectively (Fig. 6e and g). Long-range transport of O3 produced from Asian NOx emissions enhances the wintertime O3 increasing trends by 0.9 ± 0.1 and 1.2 ± 0.1 ppb per decade in the WUS and EUS, respectively, which are equally contributed by sources from East Asia, South Asia and Southeast Asia (Fig. 8e and g).
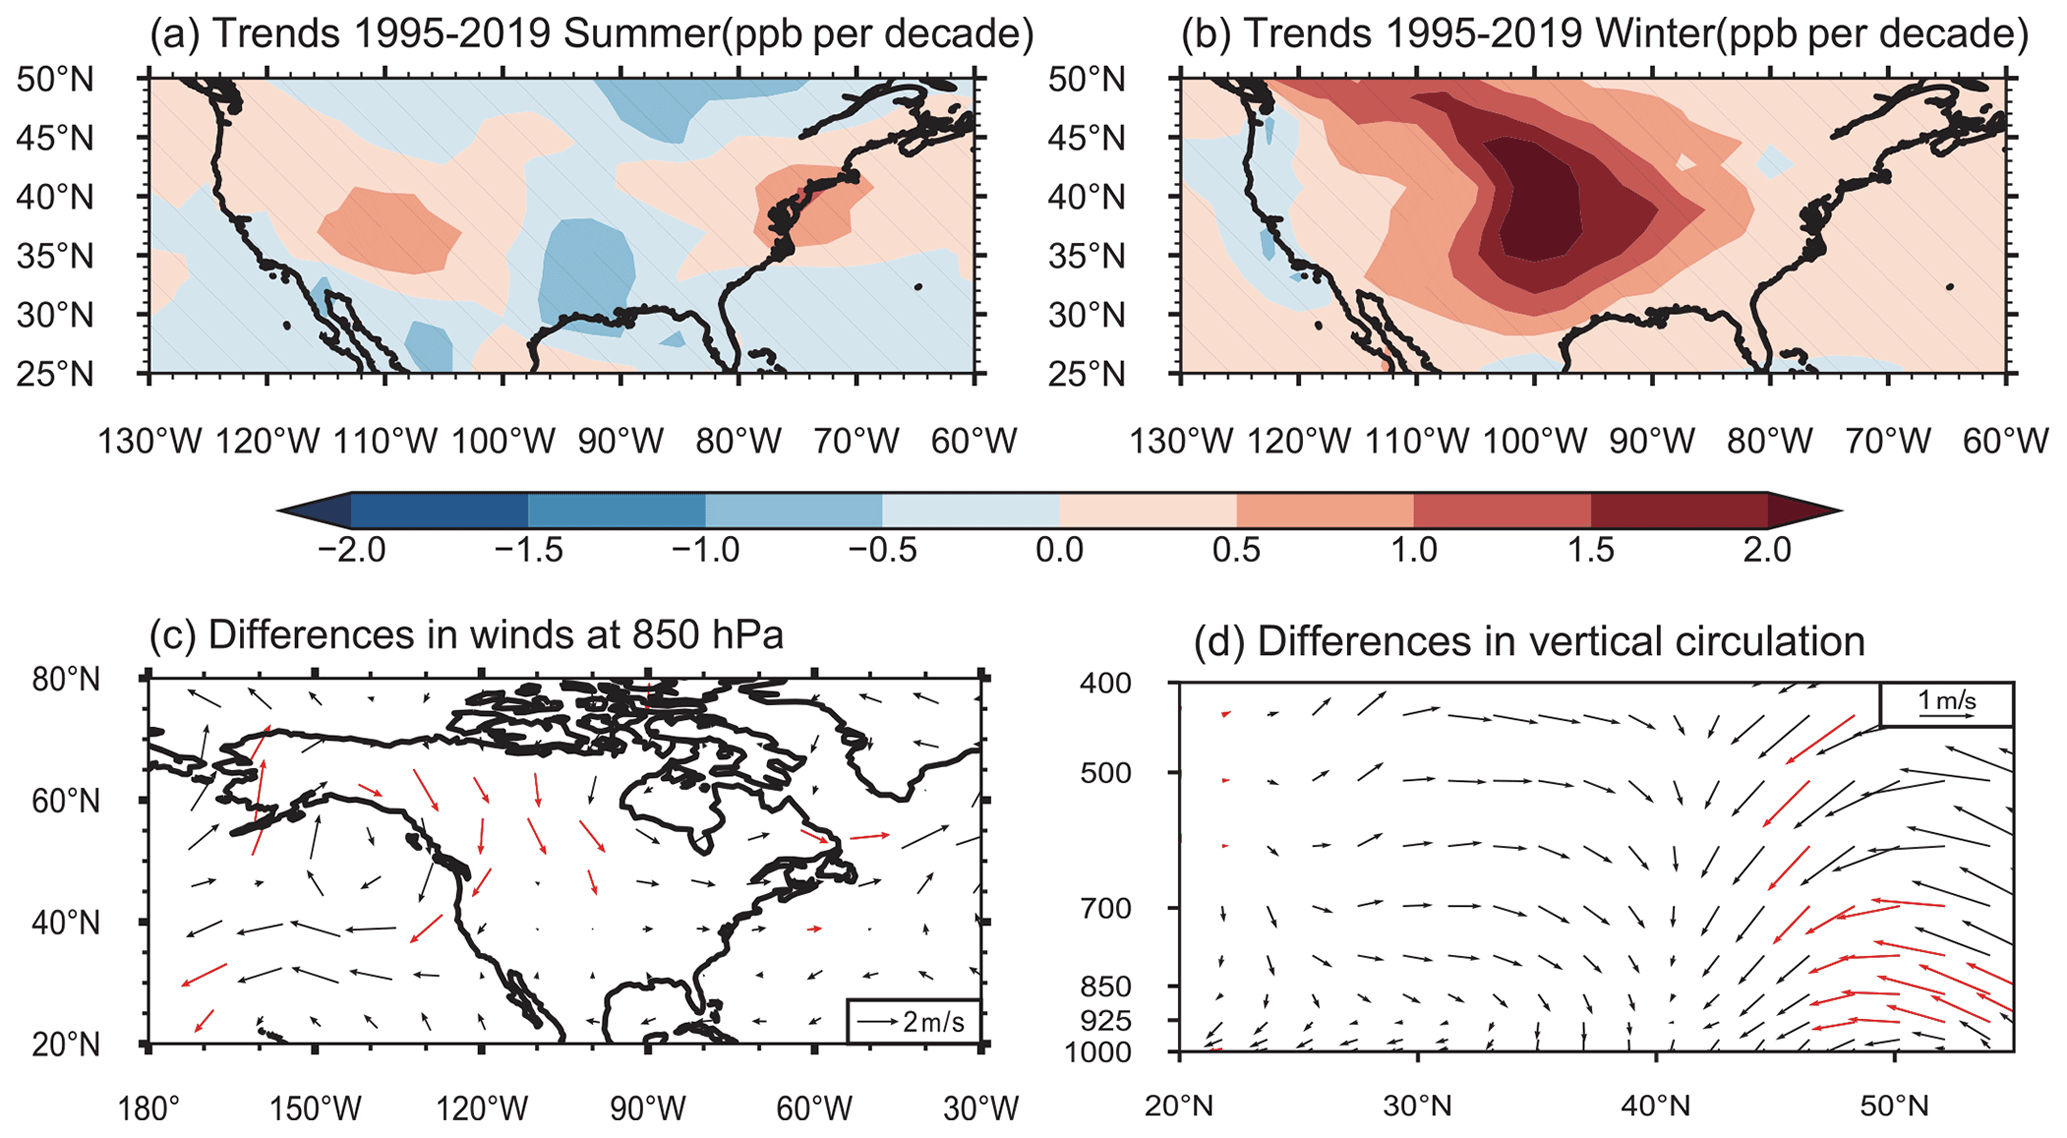
Figure 9Linear trends (ppb per decade) of simulated (a) JJA and (b) DJF mean near-surface O3 mixing ratios during 1995–2019. Differences between the first (1995–1999) and last (2015–2019) 5 years during 1995–2019 (last–first) in DJF mean (c) 850 hPa horizontal winds and (d) meridional winds and vertical velocity averaged over 90–105∘ W. Areas without hatches in panels (a) and (b) and red arrows in panels (c) and (d) indicate statistical significance with 95 % confidence. All results are from the MET experiments.
3.4 Impact of variations in large-scale circulations on ozone trends
Many studies have reported that O3 spatial distribution is strongly modulated by changes in large-scale circulations (e.g., Shen and Mickley, 2017; Yang et al., 2014, 2022). Based on our MET experiments, with anthropogenic emissions kept unchanged, the changes in large-scale circulations show a weak influence on the US O3 trends in summer (Fig. 9a) but cause a significant O3 rise in the central US in winter (Fig. 9b). Averaged over the US, the near-surface O3 mixing ratio in winter increases at the rate of 0.7 ± 0.3 ppb per decade during 1995–2019 in MET experiments. It suggests that the variation in large-scale circulations is responsible for 15 % of the increasing trend in the wintertime O3 mixing ratio by 4.7 ± 0.3 ppb per decade in the US during 1995–2019, simulated in the BASE experiment.
Figure 10Linear trends (ppb per decade) of near-surface O3 mixing ratios in winter over the US, contributed by the NOx (a, c) and reactive carbon (b, d) emissions from various source sectors (a, b) and regions (c, d). The increasing and decreasing trends marked with red and blue colored numbers, respectively, indicate statistical significance with 95 % confidence. Contributions from source regions EAS, SAS and SEA are combined into ASIA. Some sources having small contributions are combined and shown as OTH.
The changes in the atmospheric circulation pattern support the above finding. Compared to 1995–1999, anomalous northerly winds are located over the high latitudes of North America in 2015–2019 (Fig. 9c), strengthening the prevailing northerly winds in winter. In addition, an anomalous subsidence occurs over the central US in 2015–2019, compared to in 1995–1999 (Fig. 9d). The anomalous subsidence transports O3 from high altitudes, and even the stratosphere, to the surface and the strengthened winds transport O3 from remote regions (e.g., O3 produced by Asian NOx emission) to the central US, both contributing to 0.2 ± 0.1 ppb per decade of the O3 increase over the US (Fig. 10). The finding is consistent with Lin et al. (2015) that variations in the circulation facilitate O3 transport from upper altitudes to the surface, as well as foreign contributions from Asia. The anomalous atmospheric circulation is likely linked to the location of the midlatitude jet stream, which is influenced by the El Niño–Southern Oscillation (ENSO) cycle.
Using a global chemistry–climate model equipped with an O3 source tagging technique, we examine the long-term trends and source apportionment of O3 in the continental US over 1995–2019 to various emission source sectors and regions in this study. This model can capture the decreasing O3 trend over the EUS in summer and the increasing trend over the WUS in winter during this time period but largely overestimates the decreasing trend over the WUS in summer and increasing trend over the EUS in winter.
In summer, our simulation results show that the decline in surface O3 is dominated by the rapid reductions in NOx emissions from energy and surface transportation sectors, contributing to O3 decreases at a rate of −2.0 and −1.6 ppb per decade in the WUS and −3.2 and −1.7 ppb per decade in the EUS, respectively. As the anthropogenic NOx decreases, the more NOx-sensitive condition leads to a positive O3 trend of 0.7 and 1.7 ppb per decade in the WUS and EUS, respectively, contributed by the NOx emissions from soil. Due to the reductions in NOx emissions, the O3 production efficiency by reactive carbon species also decreased, leading to the decreasing contributions to O3 from reactive carbon species in summer during 1995–2019. Even though biogenic NMVOC emissions and the CH4 mixing ratio were fixed during simulations, their contributions also decreased related to the weakened O3 production efficiency by these precursors. Source region tagging suggests that the domestic emission reductions are primarily responsible for the decreasing trend in summertime near-surface O3 mixing ratios in the US during 1995–2019.
The mechanisms of wintertime O3 increases over the US are more complicated. First, the domestic emission control weakens the NOx titration, resulting in considerable increases in O3 originating from natural sources, including O3 from stratospheric intrusion, lightning, soil and biogenic emissions. The natural sources combined contribute a positive O3 trend of more than 1 and 2 ppb per decade in the WUS and EUS, respectively. Second, increases in aviation and shipping emissions together explain the 1.2 and 1.5 ppb per decade of O3 trends in the WUS and EUS, respectively. Third, long-range transport of O3 produced from Asian NOx emissions enhances the wintertime O3, increasing trends by 0.9 and 1.2 ppb per decade in the WUS and EUS, respectively. Fourth, the variation of horizontal and vertical transport O3 associated with the changes in large-scale circulation contributes to the near-surface O3 increases over the US by 15 % in winter during 1995–2019.
Compared to observations, the decreasing trend of O3 mixing ratios over the WUS in summer and increasing trend over the EUS in winter are overestimated in the CAM4-chem model. Because most O3 monitors are located in urban areas, and these areas generate strong O3 during the day and have strong oxidation titration at night, the daily and grid-averaged O3 mixing ratios output by the model could be inconsistent with the urban observations. The overestimate of the O3 trend in the EUS might be related to a potential biased model representation of vertical mixing in winter. Large uncertainties existing in the emissions also result in the biases in the O3 simulation. Lin et al. (2017) found that the contribution from increasing Asian emissions offset that from the US emission reductions, resulting in a weak O3 trend in the WUS. In this study, the Asian NOx emissions only contribute to 0.6 ppb per decade of the total positive trend in the WUS in summer, much lower than the 3.7 ppb per decade decrease attributable to the domestic emission reductions, suggesting that the Asian contribution to the O3 trends in the WUS is possibly underestimated in this study. We also found that the model did not capture the significant increase in summertime O3 levels in China in recent years, which could explain the low contribution from Asian sources. Additionally, international shipping can have a disproportionately high influence on tropospheric O3 due to the dispersed nature of NOx emissions (Butler et al., 2020; Kasibhatla et al., 2000; von Glasow et al., 2003), together with the weakened NOx titration, resulting in the overestimation of O3 trends. The fixed CH4 mixing ratio during simulations also biased the modeled O3 trends, which deserves further investigation with the varying CH4 levels in future studies. The coarse model resolution also contributed to the biases. The overestimate of the O3 trend over the EUS in winter, likely related to the bias in NOx titration, implies the overestimate of source contributions to the trends in magnitude.
Compared with Butler et al. (2018), the simulation in this study shares similar source sector contributions to the zonal average of O3 mixing ratios at the surface and 400 hPa in 2010 (Figs. S7 and S8 in this study and Figs. 5 and 6 in Butler et al., 2018). The contributions from the stratosphere and lightning NOx are relatively higher in this study than Butler et al. (2018). This may be related to the different anthropogenic emission inventories used, causing different O3 production and loss efficiencies by natural precursors. When comparing the contributions from different source regions to surface O3 mixing ratios in North America, NOx emissions from East Asia, South Asia, North America and Europe contributed 2.2, 1.1, 8.3 and 0.7 ppb of the surface O3 in North America, respectively (Fig. S9), in this study, which are also similar to those from Fig. 4 in Butler et al. (2020). Both studies show that the contributions of anthropogenic NMVOCs to surface O3 mixing ratios in North America are less than 10 ppb.
The CESM is maintained by NCAR and is provided freely to the community. The ozone tagging code has been described by Butler et al. (2018). The MERRA-2 reanalysis data are from NASA GESDISC data (https://goldsmr5.gesdisc.eosdis.nasa.gov/data/MERRA2/M2I6NVANA.5.12.4/; NASA, 2023). The surface O3 measurements in the US are obtained from the US Environmental Protection Agency (https://aqs.epa.gov/aqsweb/airdata/download_files.html#Daily; EPA, 2023). The modeling results are made available at https://doi.org/10.5281/Zenodo.6891316 (Yang, 2022).
The supplement related to this article is available online at: https://doi.org/10.5194/acp-23-5403-2023-supplement.
YY designed the research, PL and SL performed the simulations, and PL analyzed the data. All authors including HW, KL, PW, BL and HL discussed the results and wrote the paper.
The contact author has declared that none of the authors has any competing interests.
Publisher's note: Copernicus Publications remains neutral with regard to jurisdictional claims in published maps and institutional affiliations.
Hailong Wang acknowledges the support by the US Department of Energy (DOE), Office of Science, Office of Biological and Environmental Research (BER), as part of the Earth and Environmental System Modeling program. The Pacific Northwest National Laboratory (PNNL) is operated for the DOE by the Battelle Memorial Institute under contract DE-AC05-76RLO1830.
This study was supported by the National Key Research and Development Program of China (grant no. 2020YFA0607803), the National Natural Science Foundation of China (grant no. 42105166), the Jiangsu Science Fund for Distinguished Young Scholars (grant no. BK20211541), and the Jiangsu Science Fund for Carbon Neutrality (grant no. BK20220031).
This paper was edited by Tim Butler and reviewed by two anonymous referees.
Atkinson, R.: Atmospheric chemistry of VOCs and NOx, Atmos. Environ., 34, 2063–2101, https://doi.org/10.1016/S1352-2310(99)00460-4, 2000.
Bates, K. H. and Jacob, D. J.: An Expanded Definition of the Odd Oxygen Family for Tropospheric Ozone Budgets: Implications for Ozone Lifetime and Stratospheric Influence, Geophys. Res. Lett., 47, e2019GL084486, https://doi.org/10.1029/2019gl084486, 2020.
Butler, T., Lupascu, A., Coates, J., and Zhu, S.: TOAST 1.0: Tropospheric Ozone Attribution of Sources with Tagging for CESM 1.2.2, Geosci. Model Dev., 11, 2825–2840, https://doi.org/10.5194/gmd-11-2825-2018, 2018.
Butler, T., Lupascu, A., and Nalam, A.: Attribution of ground-level ozone to anthropogenic and natural sources of nitrogen oxides and reactive carbon in a global chemical transport model, Atmos. Chem. Phys., 20, 10707–10731, https://doi.org/10.5194/acp-20-10707-2020, 2020.
Cheng, J., Tong, D., Liu, Y., Yu, S., Yan, L., Zheng, B., Geng, G., He, K., and Zhang, Q.: Comparison of current and future PM2.5 air quality in China under CMIP6 and DPEC emission scenarios, Geophys. Res. Lett., 48, e2021GL093197, https://doi.org/10.1029/2021GL093197, 2021.
Collet, S., Kidokoro, T., Karamchandani, P., Jung, J., and Shah, T.: Future year ozone source attribution modeling study using CMAQ-ISAM, J. Air Waste Manage., 68, 1239–1247, https://doi.org/10.1080/10962247.2018.1496954, 2018.
Cooper, O. R., Gao, R.-S., Tarasick, D., Leblanc, T., and Sweeney, C.: Long-term ozone trends at rural ozone monitoring sites across the United States, 1990–2010, J. Geophys. Res.-Atmos., 117, D22307, https://doi.org/10.1029/2012JD018261, 2012.
Cooper, O. R., Schultz, M. G., Schröder, S., Chang, K.-L., Gaudel, A., Gerardo, Benítez, C., Cuevas, E., Fröhlich, M., Galbally, I. E., Kubistin, D., Lu, X., Audra, McClure-Begley, A., Molloy, S., Nédélec, P., O'Brien, J., Oltmans, S. J., Irina, Petropavlovskikh, I., Ries, L., Senik, I., Sjöberg, K., Solberg, S., Spain, T. G., Spangl, W., Steinbacher, M., Tarasick, D., Thouret, V., and Xu, X.: Multi-decadal surface ozone trends at globally distributed remote locations, Elemementa Sci. Anth., 8, 23, https://doi.org/10.1525/elementa.420, 2020.
Clappier, A., Belis, C. A., Pernigotti, D., and Thunis, P.: Source apportionment and sensitivity analysis: two methodologies with two different purposes, Geosci. Model Dev., 10, 4245–4256, https://doi.org/10.5194/gmd-10-4245-2017, 2017.
Duncan, B. N., Lamsal, L. N., Thompson, A. M., Yoshida, Y., Lu, Z., Streets, D. G., Hurwitz, M. M., and Pickering, K. E.: A space-based, high-resolution view of notable changes in urban NOx pollution around the world (2005–2014), J J. Geophys. Res.-Atmos., 21, 976–996, https://doi.org/10.1002/2015JD024121, 2016.
Dunker, A. M., Yarwood, G., Ortmann, J. P., and Wilson, G. M.: Comparison of Source Apportionment and Source Sensitivity of Ozone in a Three-Dimensional Air Quality Model, Environ. Sci. Technol., 36, 2953–2964, https://doi.org/10.1021/es011418f, 2002.
Emmons, L. K., Walters, S., Hess, P. G., Lamarque, J.-F., Pfister, G. G., Fillmore, D., Granier, C., Guenther, A., Kinnison, D., Laepple, T., Orlando, J., Tie, X., Tyndall, G., Wiedinmyer, C., Baughcum, S. L., and Kloster, S.: Description and evaluation of the Model for Ozone and Related chemical Tracers, version 4 (MOZART-4), Geosci. Model Dev., 3, 43–67, https://doi.org/10.5194/gmd-3-43-2010, 2010.
Emmons, L. K., Hess, P. G., Lamarque, J.-F., and Pfister, G. G.: Tagged ozone mechanism for MOZART-4, CAM-chem and other chemical transport models, Geosci. Model Dev., 5, 1531–1542, https://doi.org/10.5194/gmd-5-1531-2012, 2012.
EPA: Ozone Daily Summary Date, EPA [data set], https://aqs.epa.gov/aqsweb/airdata/download_files.html#Daily (last access: 1 May 2023), 2023.
Eyring, V., Köhler, H. W., van Aardenne, J., and Lauer, A.: Emissions from international shipping: 1. The last 50 years, J. Geophys. Res., 110, D17305, https://doi.org/10.1029/2004JD005619, 2005.
Fan, T., Liu, X., Ma, P.-L., Zhang, Q., Li, Z., Jiang, Y., Zhang, F., Zhao, C., Yang, X., Wu, F., and Wang, Y.: Emission or atmospheric processes? An attempt to attribute the source of large bias of aerosols in eastern China simulated by global climate models, Atmos. Chem. Phys., 18, 1395–1417, https://doi.org/10.5194/acp-18-1395-2018, 2018.
Fiore, A. M., West, J. J., Horowitz, L. W., Naik, V., and Schwarzkopf, M. D.: Characterizing the tropospheric ozone response to methane emission controls and the benefits to climate and air quality, J. Geophys. Res., 113, D08307, https://doi.org/10.1029/2007JD009162, 2008.
Fiore, A. M., Dentener, F. J., Wild, O., Cuvelier, C., Schultz, M. G., Hess, P., Textor, C., Schulz, M., Doherty, R. M., Horowitz, L. W., MacKenzie, I. A., Sanderson, M. G., Shindell, D. T., Stevenson, D. S., Szopa, S., van Dingenen, R., Zeng, G., Atherton, C., Bergmann, D., Bey, I., Carmichael, G., Collins, W. J., Duncan, B. N., Faluvegi, G., Folberth, G., Gauss, M., Gong, S., Hauglustaine, D., Holloway, T., Isaksen, I. S. A., Jacob, D. J., Jonson, J. E., Kaminski, J. W., Keating, T. J., Lupu, A., Marmer, E., Montanaro, V., Park, R. J., Pitari, G., Pringle, K. J., Pyle, J. A., Schroeder, S., Vivanco, M. G., Wind, P., Wojcik, G., Wu, S., and Zuber, A.: Multimodel estimates of intercontinental source-receptor relationships for ozone pollution, J. Geophys. Res., 114, D04301, https://doi.org/10.1029/2008JD010816, 2009.
Fleming, Z. L., Doherty, R. M., Schneidemesser, E. V., Malley, C. S., Cooper, O. R., Pinto, J. P., Colette, A., Xu, X., Simpson, D., Schultz, M. G., Lefohn, A. S., Hamad, S., Moolla, R., Solberg, S., and Feng, Z.: Tropospheric Ozone Assessment Report: Present-day ozone distribution and trends relevant to human health, Elemementa Sci. Anth., 6, 12, https://doi.org/10.1525/elementa.273, 2018.
Gao, J., Zhu, B., Xiao, H., Kang, H., Hou, X., and Shao, P.: A case study of surface ozone source apportionment during a high concentration episode, under frequent shifting wind conditions over the Yangtze River Delta, China, Sci. Total Environ., 544, 853–863, https://doi.org/10.1016/j.scitotenv.2015.12.039, 2016.
Gao, Y., Fu, J. S., Drake, J. B., Lamarque, J.-F., and Liu, Y.: The impact of emission and climate change on ozone in the United States under representative concentration pathways (RCPs), Atmos. Chem. Phys., 13, 9607–9621, https://doi.org/10.5194/acp-13-9607-2013, 2013.
Gaudel, A., Cooper, O. R. , Chang, K. L., Bourgeois, I., Ziemke, J. R., Strode, S. A., Oman, L. D., Sellitto, P., Nédélec, P., Bolt, R., Thouret, V., and Granier,C.: Aircraft observations since the 1990s reveal increases of tropospheric ozone at multiple locations across the Northern Hemisphere, Sci. Adv., 6, eaba8272, https://doi.org/10.1126/sciadv.aba8272, 2020.
Gelaro, R., McCarty, W., Suárez, M. J., Todling, R., Molod, A., Takacs, L., Randles, C. A., Darmenov, A., Bosilovich, M. G., Re- ichle, R., Wargan, K., Coy, L., Cullather, R., Draper, C., Akella, S., Buchard, V., Conaty, A., da Silva, A. M., Gu, W., Kim, G., Koster, R., Lucchesi, R., Merkova, D., Nielsen, J. E., Partyka, G., Pawson, S., Putman, W., Rienecker, M., Schubert, S. D., Sienkiewicz, M., and Zhao, B.: The Modern-Era Retrospective Analysis for Research and Applications, Version 2 (MERRA-2), J. Climate, 30, 5419–5454, https://doi.org/10.1175/JCLI-D-16-0758.1, 2017.
Grewe, V., Tsati, E., Mertens, M., Frömming, C., and Jöckel, P.: Contribution of emissions to concentrations: the TAGGING 1.0 submodel based on the Modular Earth Submodel System (MESSy 2.52), Geosci. Model Dev., 10, 2615–2633, https://doi.org/10.5194/gmd-10-2615-2017, 2017.
Haagen-Smit, A. J.: Chemistry and Physiology of Los Angeles Smog, Ind. Eng. Chem., 44, 1342–1346, https://doi.org/10.1021/ie50510a045, 1952.
Han, H., Liu, J., Yuan, H., Zhuang, B., Zhu, Y., Wu, Y., Yan, Y., and Ding, A.: Characteristics of intercontinental transport of tropospheric ozone from Africa to Asia, Atmos. Chem. Phys., 18, 4251–4276, https://doi.org/10.5194/acp-18-4251-2018, 2018.
Hodnebrog, Ø., Berntsen, T. K., Dessens, O., Gauss, M., Grewe, V., Isaksen, I. S. A., Koffi, B., Myhre, G., Olivié, D., Prather, M. J., Pyle, J. A., Stordal, F., Szopa, S., Tang, Q., van Velthoven, P., Williams, J. E., and Ødemark, K.: Future impact of non-land based traffic emissions on atmospheric ozone and OH – an optimistic scenario and a possible mitigation strategy, Atmos. Chem. Phys., 11, 11293–11317, https://doi.org/10.5194/acp-11-11293-2011, 2011.
Hoesly, R. M., Smith, S. J., Feng, L., Klimont, Z., Janssens-Maenhout, G., Pitkanen, T., Seibert, J. J., Vu, L., Andres, R. J., Bolt, R. M., Bond, T. C., Dawidowski, L., Kholod, N., Kurokawa, J.-I., Li, M., Liu, L., Lu, Z., Moura, M. C. P., O'Rourke, P. R., and Zhang, Q.: Historical (1750–2014) anthropogenic emissions of reactive gases and aerosols from the Community Emissions Data System (CEDS), Geosci. Model Dev., 11, 369–408, https://doi.org/10.5194/gmd-11-369-2018, 2018.
Hoor, P., Borken-Kleefeld, J., Caro, D., Dessens, O., Endresen, O., Gauss, M., Grewe, V., Hauglustaine, D., Isaksen, I. S. A., Jöckel, P., Lelieveld, J., Myhre, G., Meijer, E., Olivie, D., Prather, M., Schnadt Poberaj, C., Shine, K. P., Staehelin, J., Tang, Q., van Aardenne, J., van Velthoven, P., and Sausen, R.: The impact of traffic emissions on atmospheric ozone and OH: results from QUANTIFY, Atmos. Chem. Phys., 9, 3113–3136, https://doi.org/10.5194/acp-9-3113-2009, 2009.
Jaffe, D. A., Cooper, O. R., Fiore, A. M., Henderson, B. H., Tonnesen, G. S., Russell, A. G., Henze, D. K., Langford, A. O., Lin, M., and Moore, T.: Scientific assessment of background ozone over the U.S.: Implications for air quality management, Elemeneta Sci. Anth., 6, 56, https://doi.org/10.1525/elementa.309, 2018.
Johnson, C., Collins, W., Stevenson, D., and Derwent, R.: Relative roles of climate and emissions changes on future tropospheric oxidant concentrations, J. Geophys. Res., 104, 18631–18645, https://doi.org/10.1029/1999JD900204, 1999.
Kasibhatla, P., Levy, H., Moxim, W. J., Pandis, S. N., Corbett, J. J., Peterson, M. C., Honrath, R. E., Frost, G. J., Knapp, K., Parrish, D. D., and Ryerson, T. B.: Do emissions from ships have a significant impact on concentrations of nitrogen oxides in the marine boundary layer?, Geophys. Res. Lett., 27, 2229–2232, https://doi.org/10.1029/2000gl011387, 2000.
Koo, B., Wilson, G. M., Morris, R., Dunker, A. M., and Yarwood, G.: Comparison of Source Apportionment and Sensitivity Analysis in a Particulate Matter Air Quality Model, Environ. Sci. Technol., 43, 6669–6675, https://doi.org/10.1021/es9008129, 2009.
Kwok, R. H. F., Baker, K. R., Napelenok, S. L., and Tonnesen, G. S.: Photochemical grid model implementation and application of VOC, NOx, and O3 source apportionment, Geosci. Model Dev., 8, 99–114, https://doi.org/10.5194/gmd-8-99-2015, 2015.
Lamarque, J.-F., Emmons, L. K., Hess, P. G., Kinnison, D. E., Tilmes, S., Vitt, F., Heald, C. L., Holland, E. A., Lauritzen, P. H., Neu, J., Orlando, J. J., Rasch, P. J., and Tyndall, G. K.: CAM-chem: description and evaluation of interactive atmospheric chemistry in the Community Earth System Model, Geosci. Model Dev., 5, 369–411, https://doi.org/10.5194/gmd-5-369-2012, 2012.
Lin, M., Fiore, A. M., Horowitz, L. W., Langford, A. O., Oltmans, S. J., Tarasick, D., and Rieder, H. E.: Climate variability modulates western U.S. ozone air quality in spring via deep stratospheric intrusions, Nat. Commun., 6, 7105, https://doi.org/10.1038/ncomms8105, 2015.
Lin, M., Horowitz, L. W., Payton, R., Fiore, A. M., and Tonnesen, G.: US surface ozone trends and extremes from 1980 to 2014: quantifying the roles of rising Asian emissions, domestic controls, wildfires, and climate, Atmos. Chem. Phys., 17, 2943–2970, https://doi.org/10.5194/acp-17-2943-2017, 2017.
Lupaşcu, A. and Butler, T.: Source attribution of European surface O3 using a tagged O3 mechanism, Atmos. Chem. Phys., 19, 14535–14558, https://doi.org/10.5194/acp-19-14535-2019, 2019.
McDuffie, E. E., Smith, S. J., O'Rourke, P., Tibrewal, K., Venkataraman, C., Marais, E. A., Zheng, B., Crippa, M., Brauer, M., and Martin, R. V.: A global anthropogenic emission inventory of atmospheric pollutants from sector- and fuel-specific sources (1970–2017): an application of the Community Emissions Data System (CEDS), Earth Syst. Sci. Data, 12, 3413–3442, https://doi.org/10.5194/essd-12-3413-2020, 2020.
Mertens, M., Kerkweg, A., Grewe, V., Jöckel, P., and Sausen, R.: Attributing ozone and its precursors to land transport emissions in Europe and Germany, Atmos. Chem. Phys., 20, 7843–7873, https://doi.org/10.5194/acp-20-7843-2020, 2020.
Müller-Casseres, E., Edelenbosch, O. Y., Szklo, A., Schaeffer, R., and van Vuuren, D. P.: Global futures of trade impacting the challenge to decarbonize the international shipping sector, Energy, 237, 121547, https://doi.org/10.1016/j.energy.2021.121547, 2021.
Myhre, G., D. Shindell, F.-M. Bréon, W. Collins, J. Fuglestvedt, J. Huang, D. Koch, J.-F. Lamarque, D. Lee, B. Mendoza, T. Nakajima, A. Robock, G. Stephens, T. Takemura and H. Zhang: Anthropogenic and Natural Radiative Forcing, in: Climate Change 2013: The Physical Science Basis. Contribution of Working Group I to the Fifth Assessment Report of the Intergovernmental Panel on Climate Change, edited by: Stocker, T. F., Qin, D., Plattner, G.- K., Tignor, M., Allen, S. K., Boschung, J., Nauels, A., Xia, Y., Bex , V., and Midgley , P. M., Cambridge University Press, Cambridge, United Kingdom and New York, NY, USA, 2013.
NASA: MERRA-2 reanalysis data, NASA [data set], https://goldsmr5.gesdisc.eosdis.nasa.gov/data/MERRA2/M2I6NVANA.5.12.4/ (last access: 1 May 2023), 2023.
Neu, J. L. and Prather, M. J.: Toward a more physical representation of precipitation scavenging in global chemistry models: cloud overlap and ice physics and their impact on tropospheric ozone, Atmos. Chem. Phys., 12, 3289–3310, https://doi.org/10.5194/acp-12-3289-2012, 2012.
O'Neill, B. C., Tebaldi, C., van Vuuren, D. P., Eyring, V., Friedlingstein, P., Hurtt, G., Knutti, R., Kriegler, E., Lamarque, J.-F., Lowe, J., Meehl, G. A., Moss, R., Riahi, K., and Sanderson, B. M.: The Scenario Model Intercomparison Project (ScenarioMIP) for CMIP6, Geosci. Model Dev., 9, 3461–3482, https://doi.org/10.5194/gmd-9-3461-2016, 2016.
Price, C., Penner, J., and Prather, M.: NOx from lightning: 1. Global distribution based on lightning physics, J. Geophys. Res., 102, 5929–5941, https://doi.org/10.1029/96JD03504, 1997.
Seinfeld, J. H. and Pandis, S. N.: Atmospheric Chemistry and Physics: From Air Pollution to Climate Change, J. Wiley, Hoboken, NJ, ISBN 978-1-118-94740-1, 2006.
Shen, L. and Mickley, L. J.: Effects of El Niño on summertime ozone air quality in the eastern United States, Geophys. Res. Lett., 44, 12543–12550, https://doi.org/10.1002/2017GL076150, 2017.
Simon, H., Reff, A., Wells, B., Xing, J., and Frank, N.: Ozone trends across the United States over a period of decreasing NOx and VOC emissions, Environ. Sci. Technol., 49, 186–195, https://doi.org/10.1021/es504514z, 2015.
Stevenson, D. S., Dentener, F. J., Schultz, M. G., Ellingsen, K., van Noije, T. P. C., Wild, O., Zeng, G., Amann, M., Atherton, C. S., Bell, N., Bergmann, D. J., Bey, I., Butler, T., Cofala, J., Collins, W. J., Derwent, R. G., Doherty, R. M., Drevet, J., Eskes, H. J., Fiore, A. M., Gauss, M., Hauglustaine, D. A., Horowitz, L. W., Isaksen, I. S. A., Krol, M. C., Lamarque, J.-F., Lawrence, M. G., Montanaro, V., Müller, J.-F., Pitari, G., Prather, M. J., Pyle, J. A., Rast, S., Rodriguez, J. M., Sanderson, M. G., Savage, N. H., Shindell, D. T., Strahan, S. E., Sudo, K., and Szopa, S.: Multimodel ensemble simulations of present-day and near-future tropospheric ozone, J. Geophys. Res., 111, D08301, https://doi.org/10.1029/2005JD006338, 2006.
Sudo, K. and Akimoto, H.: Global source attribution of tropospheric ozone: Long-range transport from various source regions, J. Geophys. Res., 112, D12302, https://doi.org/10.1029/2006JD007992, 2007.
Szopa, S., Naik, V., Adhikary, B., Artaxo, P., Berntsen, T., Collins, W. D., Fuzzi, S., Gallardo, L., Kiendler-Scharr, A., Klimont, Z., Liao, H., Unger, N., and Zanis, P.: Short-Lived Climate Forcers, in Climate Change 2021: The Physical Science Basis. Contribution of Working Group I to the Sixth Assessment Report of the Intergovernmental Panel on Climate Change, edited by: Masson-Delmotte, V., Zhai, P., Pirani, A., Connors, S. L., Péan, C., Berger, S., Caud, N., Chen, Y., Goldfarb, L., Gomis, M. I., Huang, M., Leitzell, K., Lonnoy, E., Matthews, J. B. R., Maycock, T. K., Waterfield, T., Yelekçi, O., Yu, R., and Zhou, B., Cambridge University Press, Cambridge, United Kingdom and New York, NY, USA, pp. 817–922, https://doi.org/10.1017/9781009157896.008, 2021.
Thor, R. N., Mertens, M., Matthes, S., Righi, M., Hendricks, J., Brinkop, S., Graf, P., Grewe, V., Jöckel, P., and Smith, S.: An inconsistency in aviation emissions between CMIP5 and CMIP6 and the implications for short-lived species and their radiative forcing, Geosci. Model Dev., 16, 1459–1466, https://doi.org/10.5194/gmd-16-1459-2023, 2023.
Thunis, P., Clappier, A., Tarrason, L., Cuvelier, C., Monteiro, A., Pisoni, E., Wesseling, J., Belis, C., Pirovano, G., Janssen, S., Guerreiro, C., and Peduzzi, E.: Source apportionment to support air quality planning: Strengths and weaknesses of existing approaches, Environ. Int., 130, 104825, https://doi.org/10.1016/j.envint.2019.05.019, 2019.
Tilmes, S., Lamarque, J.-F., Emmons, L. K., Kinnison, D. E., Ma, P.-L., Liu, X., Ghan, S., Bardeen, C., Arnold, S., Deeter, M., Vitt, F., Ryerson, T., Elkins, J. W., Moore, F., Spackman, J. R., and Val Martin, M.: Description and evaluation of tropospheric chemistry and aerosols in the Community Earth System Model (CESM1.2), Geosci. Model Dev., 8, 1395–1426, https://doi.org/10.5194/gmd-8-1395-2015, 2015.
Tilmes, S., Lamarque, J.-F., Emmons, L. K., Kinnison, D. E., Marsh, D., Garcia, R. R., Smith, A. K., Neely, R. R., Conley, A., Vitt, F., Val Martin, M., Tanimoto, H., Simpson, I., Blake, D. R., and Blake, N.: Representation of the Community Earth System Model (CESM1) CAM4-chem within the Chemistry-Climate Model Initiative (CCMI), Geosci. Model Dev., 9, 1853–1890, https://doi.org/10.5194/gmd-9-1853-2016, 2016.
van Marle, M. J. E., Kloster, S., Magi, B. I., Marlon, J. R., Daniau, A.-L., Field, R. D., Arneth, A., Forrest, M., Hantson, S., Kehrwald, N. M., Knorr, W., Lasslop, G., Li, F., Mangeon, S., Yue, C., Kaiser, J. W., and van der Werf, G. R.: Historic global biomass burning emissions for CMIP6 (BB4CMIP) based on merging satellite observations with proxies and fire models (1750–2015), Geosci. Model Dev., 10, 3329–3357, https://doi.org/10.5194/gmd-10-3329-2017, 2017.
von Glasow, R., Lawrence, M. G., Sander, R., and Crutzen, P. J.: Modeling the chemical effects of ship exhaust in the cloud-free marine boundary layer, Atmos. Chem. Phys., 3, 233–250, https://doi.org/10.5194/acp-3-233-2003, 2003.
Wang, H., Rasch, P. J., Easter, R. C., Singh, B., Zhang, R., Ma, P.-L., Qian, Y., Ghan, S. J., and Beagley, N.: Using an explicit emission tagging method in global modeling of source-receptor relationships for black carbon in the Arctic: Variations, sources, and transport pathways, J. Geophys. Res.-Atmos., 119, 12888–12909, https://doi.org/10.1002/2014JD022297, 2014.
Wesely, M. L.: Parameterizations for surface resistance to gaseous dry deposition in regional-scale numerical models, Atmos. Environ., 23, 1293–1304, https://doi.org/10.1016/0004-6981(89)90153-4, 1989.
Xing, J., Pleim, J., Mathur, R., Pouliot, G., Hogrefe, C., Gan, C.-M., and Wei, C.: Historical gaseous and primary aerosol emissions in the United States from 1990 to 2010, Atmos. Chem. Phys., 13, 7531–7549, https://doi.org/10.5194/acp-13-7531-2013, 2013.
Yang, Y.: Data for “Source attribution of near-surface ozone in the United States during 1995–2019”, Zenodo [data set], https://doi.org/10.5281/zenodo.6891316, 2022.
Yang, Y., Liao, H., and Li, J.: Impacts of the East Asian summer monsoon on interannual variations of summertime surface-layer ozone concentrations over China, Atmos. Chem. Phys., 14, 6867–6879, https://doi.org/10.5194/acp-14-6867-2014, 2014.
Yang, Y., Wang, H., Smith, S. J., Zhang, R., Lou, S., Yu, H., Li, C., and Rasch, P. J.: Source apportionments of aerosols and their direct radiative forcing and long-term trends over continental United States, Earths Future, 6, 793–808, https://doi.org/10.1029/2018EF000859, 2018.
Yang, Y., Li, M., Wang, H., Li, H., Wang, P., Li, K., Gao, M., and Liao, H.: ENSO modulation of summertime tropospheric ozone over China, Environ. Res. Lett., 17, 034020, https://doi.org/10.1088/1748-9326/ac54cd, 2022.
Zhang, L., Jacob, D. J., Boersma, K. F., Jaffe, D. A., Olson, J. R., Bowman, K. W., Worden, J. R., Thompson, A. M., Avery, M. A., Cohen, R. C., Dibb, J. E., Flock, F. M., Fuelberg, H. E., Huey, L. G., McMillan, W. W., Singh, H. B., and Weinheimer, A. J.: Transpacific transport of ozone pollution and the effect of recent Asian emission increases on air quality in North America: an integrated analysis using satellite, aircraft, ozonesonde, and surface observations, Atmos. Chem. Phys., 8, 6117–6136, https://doi.org/10.5194/acp-8-6117-2008, 2008.
Zhang, Y., Cooper, O. R., Gaudel, A., Nedelec, P., Ogino, S. Y., Thompson, A. M., and West, J. J.: Tropospheric ozone change from 1980 to 2010 dominated by equatorward redistribution of emissions, Nat. Geosci., 9, 875–879, https://doi.org/10.1038/ngeo2827, 2016.
Zhang, Y., West, J. J., Emmons, L. K., Flemming, J., Jonson, J. E., Lund, M. T., Sekiya, T., Sudo, K., Gaudel, A., Chang, K. L., Nédélec, P., and Thouret, V.: Contributions of World Regions to the Global Tropospheric Ozone Burden Change From 1980 to 2010, Geophys. Res. Lett., 48, e2020GL089184, https://doi.org/10.1029/2020GL089184, 2021.