the Creative Commons Attribution 4.0 License.
the Creative Commons Attribution 4.0 License.
 | 11 May 2023
Seasonal controls on isolated convective storm drafts, precipitation intensity, and life cycle as observed during GoAmazon2014/5
Thiago S. Biscaro
John M. Peters
Isolated deep convective cloud life cycle and seasonal changes in storm properties are observed for daytime events during the US Department of Energy (DOE) Atmospheric Radiation Measurement (ARM) Green Ocean Amazon Experiment (GoAmazon2014/5) campaign to understand controls on storm behavior. Storm life cycles are documented using surveillance radar from initiation through maturity and dissipation. Vertical air velocity estimates are obtained from radar wind profiler overpasses, with the storm environment informed by radiosondes.
Dry-season storm conditions favored reduced morning shallow cloud coverage and larger low-level convective available potential energy (CAPE) than wet-season counterparts. The typical dry-season storm reached its peak intensity and size earlier in its life cycle compared with wet-season cells. These cells exhibited updrafts in core precipitation regions (Z>35 dBZ) to above the melting level as well as persistent downdrafts aloft within precipitation adjacent to their cores. Moreover, dry-season cells recorded more intense updrafts to earlier life cycle stages as well as a higher incidence of strong updrafts (i.e., >5 m s−1) at low levels. In contrast, wet-season storms were longer-lived and featured a higher incidence of moderate (i.e., 2–5 m s−1) updrafts aloft. These storms also favored a shift in their most intense properties to later life cycle stages. Strong downdrafts were less frequent within wet-season cells aloft, indicating a potential systematic difference in draft behaviors, as linked to graupel loading and other factors between the seasons. Results from a stochastic parcel model suggest that dry-season cells may expect stronger updrafts at low levels because of larger low-level CAPE in the dry season. Wet-season cells anticipate strong updrafts aloft because of larger free-tropospheric relative humidity and reduced entrainment-driven dilution. Enhanced dry-season downdrafts are partially attributed to increased evaporation, dry-air entrainment mixing, and negative buoyancy in regions adjacent to sampled dry-season cores.
- Article
(7175 KB) - Full-text XML
- BibTeX
- EndNote


Deep convective clouds (DCCs) play a critical role in regulating the global energy cycle through their extensive cloud coverage and the exchange of latent heat. DCCs are a primary focus of weather and climate model improvement because of their critical role in the global climate system. It is crucial to understand how these storms evolve, in part due to the high socioeconomic impacts associated with severe weather, heavy rainfall, and lightning (e.g., Trapp et al., 2009; Diffenbaugh et al., 2013; Sillman et al., 2013; Seeley and Romps, 2015; Feng et al., 2016; Prein et al., 2017). Nevertheless, gaps remain in our understanding of the factors that regulate DCC size, frequency, and updraft or precipitation intensity. These gaps are partially attributed to a lack of DCC dynamical and microphysical observations, a problem tied to the difficulty in sampling storms that have intense vertical velocities, undergo long and complex life cycles, and are organized on scales larger than individual updrafts.
As home to frequent convective clouds, the Amazon Basin has been at the forefront of impactful DCC studies (e.g., Williams et al., 2002; Andreae et al., 2004; Koren et al., 2008; Rosenfeld et al., 2008; Wang et al., 2016; Fan et al., 2018). The Amazon forest is the largest tropical rain forest on the planet, and this setting promotes diverse clouds that are influenced by a range of land surface and aerosol conditions and that vary according to seasonal regimes, with behaviors that span tropical, oceanic, and continental characteristics. Amazon cloud conditions are interconnected to shifts in the synoptic-scale thermodynamic conditions and coupled local-scale feedbacks (e.g., Fu et al., 1999; Machado et al., 2004; Li and Fu, 2004; Misra, 2008), which is a significant challenge to climate modeling (e.g., Richter and Xie, 2008; Nobre et al., 2009; Yin et al., 2013). Given this important global setting, multiagency campaigns have long targeted this region for DCC studies (e.g., Williams et al., 2002; Petersen et al., 2002; Machado et al., 2014, 2018; Adams et al., 2013, 2017; Martin et al., 2017).
Our focus is on isolated diurnal DCCs that are ubiquitous to the humid Amazon Basin, where low wind shear promotes short-lived and slow-moving storms. In these settings, DCCs often span their entire life cycle under the umbrella of a single surveillance radar O[300 km] (where “O[]” represents the order of the scale given within the square brackets). Cloud regimes in the Amazon are commonly divided into two seasons: the “wet season” and the “dry season”. There are distinct meteorological differences between these environments, including shifts in the convective available potential energy (CAPE), calculated over different depths, and changes in the free-tropospheric relative humidity (e.g., Giangrande et al., 2020). Hence, these conditions may provide a natural laboratory for assessing the impact of bulk environmental shifts on convective cloud characteristics. Identifying and explaining these differences is a primary objective of the present article.
To accomplish this objective, we employ radar cell-tracking concepts, as have been well-established with a recent emphasis on larger, longer-lived cells and mesoscale convective system (MCS) studies (e.g., Maddox, 1980; Williams and Houze, 1987; Rosenfeld, 1987; Dixon and Wiener, 1993; Machado et al., 1998; Göke et al., 2007; Feng et al., 2012; Borque et al., 2014; Limpert et al., 2015; Fridlind et al., 2019; Feng et al., 2019; Hu et al., 2019; Tian et al., 2022). This study draws from a unique Amazon dataset collected during the 2-year US Department of Energy (DOE) Atmospheric Radiation Measurement (ARM) observations and modeling of the Green Ocean Amazon Experiment (GoAmazon2014/5; Martin et al., 2017; Giangrande et al., 2017) that featured surveillance radar coupled with atmospheric profiling capabilities. Although previous Amazon studies have documented seasonal-composite cloud properties (e.g., Machado et al., 2004; Ghate and Kollias, 2016; Giangrande et al., 2016; Biscaro et al., 2021; Tian et al., 2021), few adopt a cell life cycle viewpoint as enabled by radar cell tracking. A unique aspect of this study is its emphasis on a set of radar-tracked cells that overpass the ARM profiling equipment, yielding direct observations of vertical hydrometeor and, by proxy, air motions. This coupled use of profiling-based vertical air velocity information builds on recent Amazon studies that have been integral to the understanding of DCC dynamics (e.g., Cifelli et al., 2002; Anderson et al., 2005; Giangrande et al., 2016; Wang et al., 2019, 2020). Our approach advances previous observational works (e.g., Byers and Braham, 1948; LeMone and Zipser, 1980; May and Rajopadhyaya, 1999; Giangrande et al., 2013; Kumar et al., 2015; Schiro et al., 2018; Wang et al., 2020) by analyzing the evolution of draft properties throughout the DCC life cycle.
The data for this study were collected during the GoAmazon2014/5 field campaign that deployed from January 2014 to December 2015. The main site for the deployment was in the city of Manacapuru (herein “T3”; 3.213∘ S, 60.598∘ W), 70 km west of Manaus, Brazil. The datasets were collected by the US Department of Energy Atmospheric Radiation Measurement (ARM; Ackerman and Stokes, 2003; Mather and Voyles, 2013) Mobile Facility 1 (AMF1; Miller et al., 2016). The GoAmazon2014/5 AMF1 details, including cumulative campaign instrument summaries and other larger-scale regime breakdowns, are found in Giangrande et al. (2017, 2020). In addition to in situ datasets obtained by the AMF1 at T3, this study uses data collected by the nearby Manaus CENSIPAM (Amazonian Protection System) weather radar (herein “SIPAM”; Saraiva et al., 2016). These radar data serve as the input for a cell-tracking algorithm that documents storms that overpassed the site. All events require daytime convective initiation that follows an available morning radiosonde (Sect. 2.1.2). We adopt a definition of isolated cells which requires that the SIPAM was able to track a longer-lived (>50 min) DCC in its coverage domain without an obvious split/merger (tracking criteria are outlined in Sect. 2.2.2). A final requirement was that cells overpass profiling instrumentation at the ARM T3 location (e.g., Sect. 2.1.1, 2.1.2). A list of the events is located in Tables 1 and 2.
Table 1Wet-season events and event details.
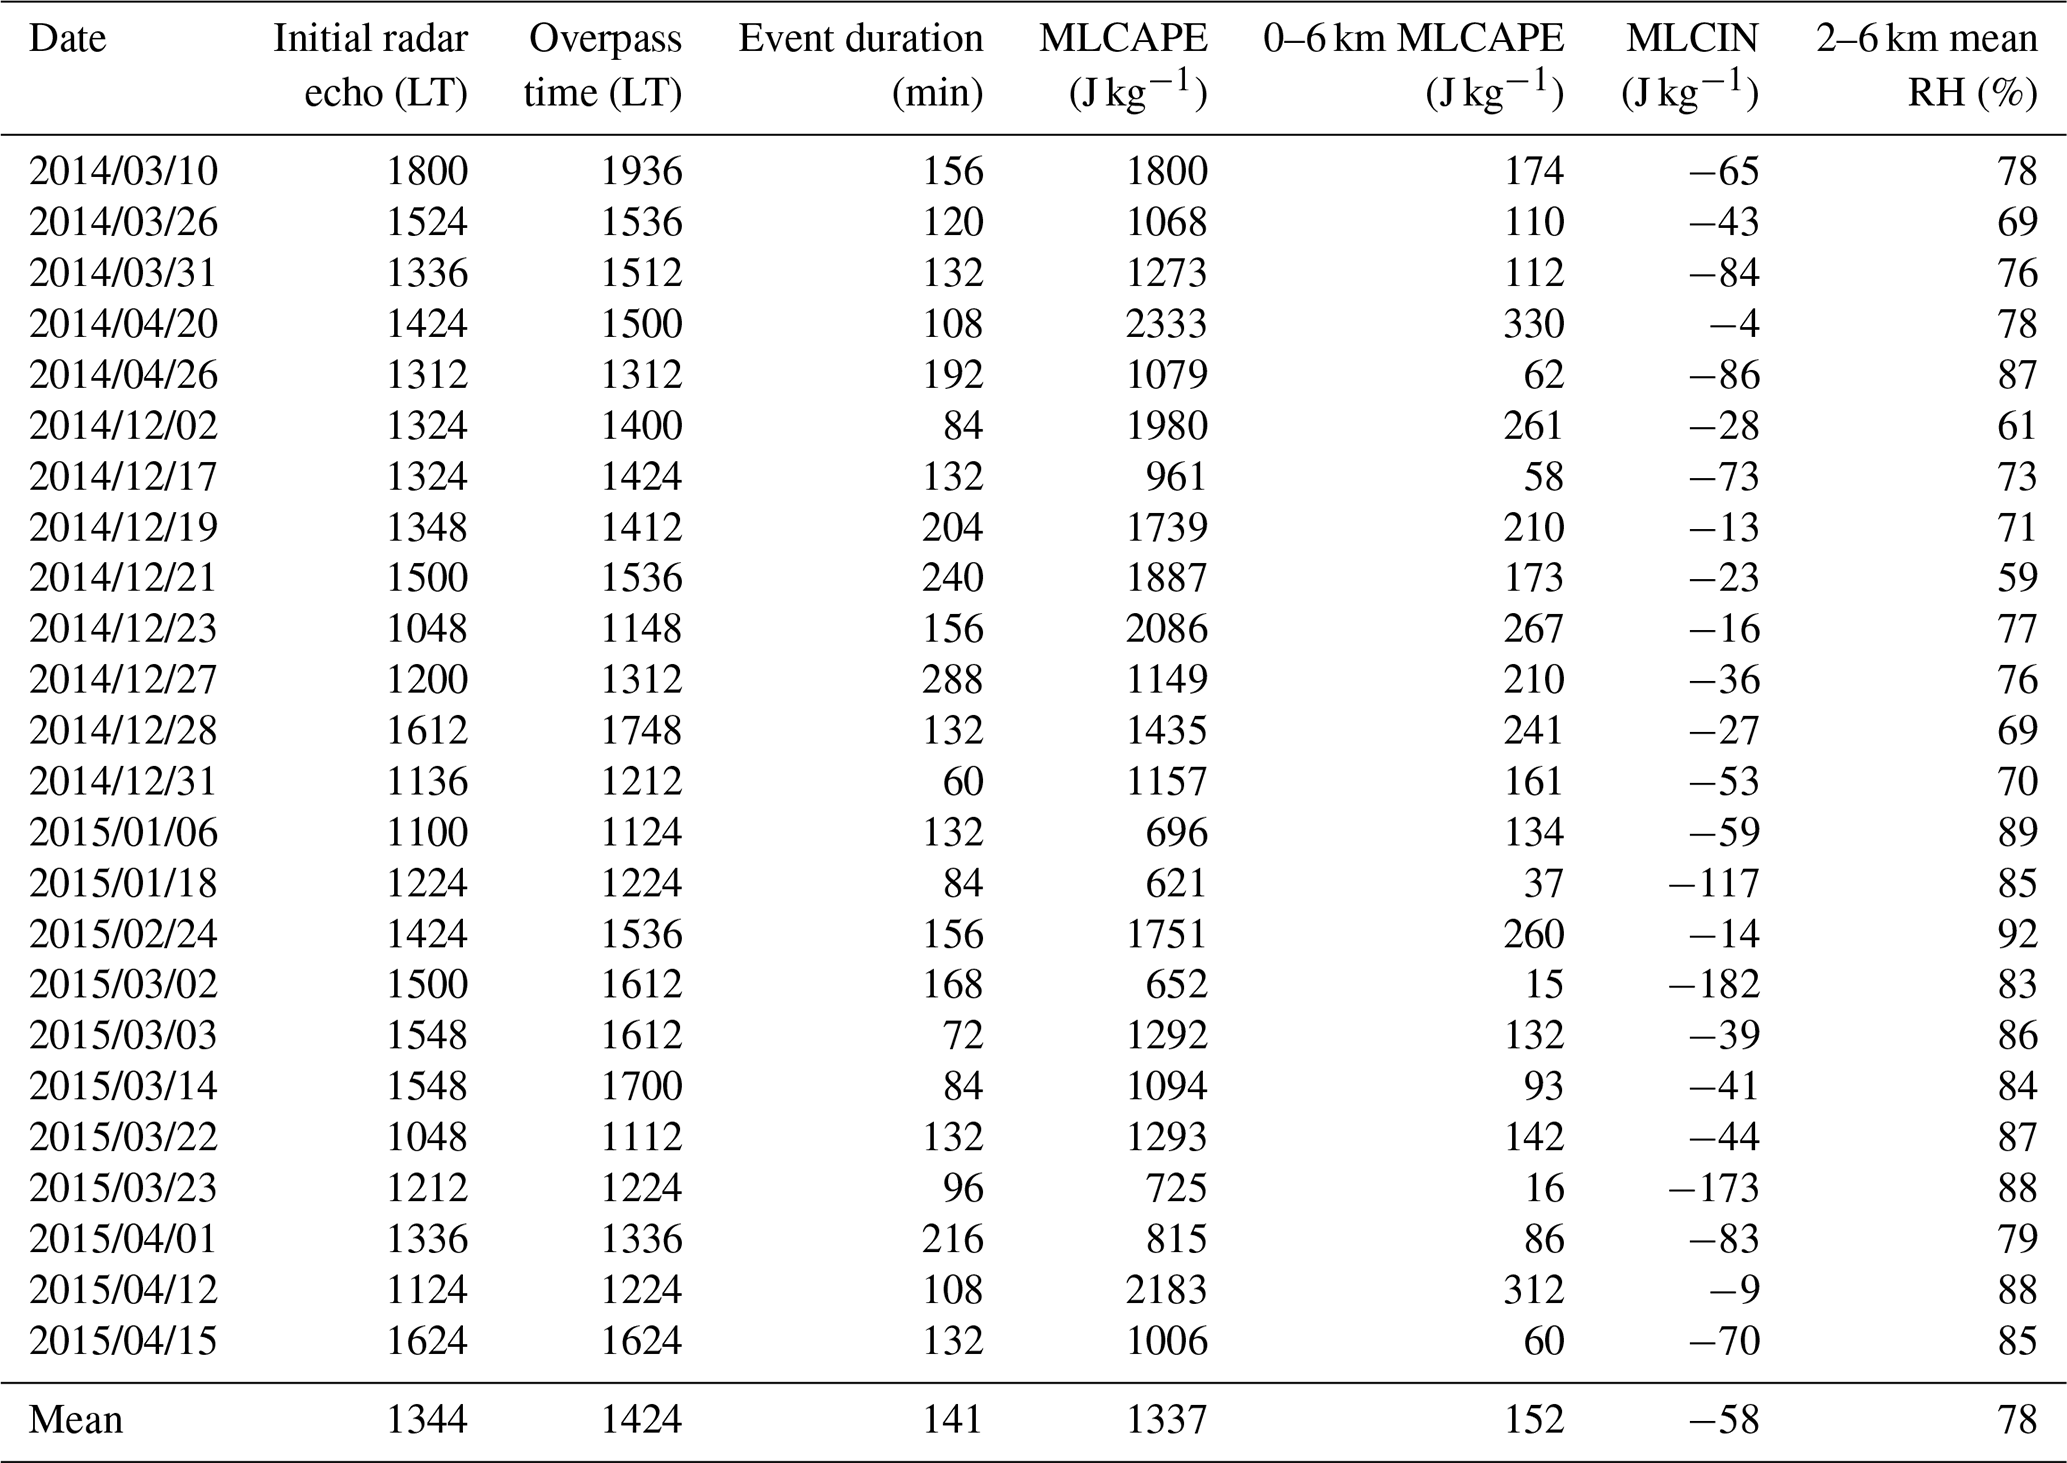
The abbreviations used in the table are as follows: MLCAPE denotes mean-layer convective available potential energy, MLCIN denotes mean-layer convective inhibition, and RH denotes relative humidity.
2.1 ARM AMF1 datasets
2.1.1 Radar wind profiler and vertical air motion retrievals
Vertical air velocity profiles were retrieved from a 1290 MHz ARM radar wind profiler (RWP) located at the T3 site. During GoAmazon2014/5, the RWP operated in a precipitation mode (200 m gate spacing, 10∘ beamwidth) wherein time–height (at approx. 6 s update) collections were interwoven with boundary layer wind modes (e.g., Tridon et al., 2013). These precipitation modes collect radar moments for the signal-to-noise ratio (SNR) and mean Doppler velocity (O[1 km] horizontal resolution at 6 km altitude). Reflectivity factor was estimated from the SNR and calibrated (within 1–2 dBZ) using a co-located disdrometer (e.g., Wang et al., 2018).
The vertical air velocity was retrieved following Giangrande et al. (2013, 2016) and recent Amazon studies (e.g., Wang et al., 2019, 2020). The techniques assume that the vertical air motion is the difference between the mean Doppler velocity and a hydrometeor fall speed (estimated as a function of Z). For retrievals at the native RWP resolutions, the approach is typically accurate within O[1–2 m s−1] in convective cores (e.g., Heymsfield et al., 2010). Fall speed assumptions use a power-law relationship of the following form: Vf=aZb, where Z is the reflectivity factor in linear [mm6 m−3] units. Fall speeds are subsequently corrected for changes in air density aloft (e.g., Foote and Du Toit, 1969).
For this study, we adopt a fall speed correction that follows results found in Giangrande et al. (2016). Specifically, Amazon convection was suggested as favoring higher-density graupel or frozen drops above the melting level, associated with faster fall speeds closer to that of rain than lower-density ice hydrometeors (i.e., Vf=aZb, where a=2.7 and b=0.1). Our approach was to extend rain coefficients to all hydrometeors above the melting level (approx. 5 km above the radar) in DCC contexts. This approach is consistent with previous RWP studies that routinely apply rain relationships in DCC cores with Z>35 dBZ where higher-density hydrometeors are expected. Our simplification is in applying this fall speed assumption for retrievals to a wider range of adjacent isolated convective (reflectivity dBZ) conditions, including in the vicinity of the melting level, where slower-falling lower-density graupel, ice, or aggregates are not expected as the dominant bulk scatterers. One caveat is that this choice may overestimate fall speed corrections to regions aloft (i.e., >7–8 km a.g.l.) if the convective ice hydrometeors' density decreases in these contexts with altitude (e.g., Protat and Williams, 2011), and this may bias RWP retrievals at higher altitudes (i.e., for a similar Z, subtracting an overly large fall speed contribution). Our results and discussions will consider draft properties contingent on different Z thresholds (i.e., Z>25 dBZ and Z>35 dBZ) to differentiate behaviors that may shift when using this simplified approach.
Velocity profiles are summarized using normalized velocity cumulative frequency with altitude displays (CFADs; Yuter and Houze, 1995). CFADs are drawn from the nearest 5 min to the associated RWP storm overpass as viewed by SIPAM radar and, in select plots, centered on the time of the highest RWP echo-top height (ETH) for that overpass (ETH is defined as the height at which the RWP column Z drops below 10 dBZ, following Wang et al., 2018). This choice also minimizes individual events disproportionately contributing to our summary plots (i.e., cells may remain over the RWP for extended periods that include multiple radar volumes). We include only those retrievals associated with Z values exceeding the matching SIPAM cell-tracking threshold (e.g., >25 dBZ). These choices limit our analysis to precipitation regions for these events (e.g., Z∼25 dBZ or R∼0.5 mm h−1). CFAD velocity properties above 10 km are not included owing to RWP sampling limitations at higher altitudes (limitations include the sampling quantity, fall speed corrections, and beamwidth/resolution considerations). Similarly, we require greater than 250 retrievals at a given altitude to include that altitude on summary CFADs. This choice was subjective and based on visual inspection of CFADs (to reduce noisiness); however, CFAD interpretations for this study did not vary significantly when testing for minimum sample counts of less than 500 samples. Finally, RWP retrieval interpretation is tied to the representativeness of narrow-field-of-view/vertically pointing observations (i.e., “chording”; Jorgensen et al., 1985; Borque et al., 2014). It is known that even fortuitous DCC samples may underestimate extremes owing to randomness and/or natural variability. Previous studies have indicated that similar retrievals may exhibit expected low-biased updraft magnitudes exceeding 30 % (e.g., Jorgensen et al., 1985; Wang et al., 2020).
2.1.2 AMF1 radiosonde, surface, and profiling instruments
Events were associated with a clear 12:00 GMT (08:00 LT) radiosonde that preceded convective initiation time for a tracked cell that overpassed the T3 site. A clear radiosonde was defined as one without precipitation at the T3 location within 30 min of the launch. The was confirmed by checking the SIPAM radar for a lack of echoes in the vicinity of the T3 site. We computed mean-layer convective available potential energy (MLCAPE) and mean-layer convective inhibition (MLCIN) using radiosonde profiles by lifting an air parcel with the average properties of the lowest 1 km of the atmosphere adiabatically (with a mixed phase between T=273.15 K and T=263.15 K). This choice is consistent with estimated planetary boundary layer (PBL) heights for Amazon events and follows the methods described in Peters et al. (2022).
Additional instruments were available to investigate the pre-convective storm environments to possibly identify discrepancies in the boundary layer and its evolution. This study draws from the ARM surface meteorology station at T3 for temperature measurements and for the daytime PBL height as estimated by a co-located ceilometer. Diurnal composites for the cloud cover at T3 (cloud frequency of occurrence) are estimated by the multi-sensor ARM W-band Cloud Radar (WACR) Active Remote Sensing of Clouds (ARSCL) value-added product (e.g., Clothiaux et al., 2000).
2.2 Surveillance radar and radar cell tracking
2.2.1 SIPAM radar
The SIPAM S-Band (2.2 GHz) radar is a single-polarization Doppler weather radar performing a volume scan with 17 elevations (lowest: 0.9∘; highest: 19∘) every 12 min, with a 1.98∘ beamwidth and radial (gate) resolution of 500 m. The SIPAM is located in the city of Manaus and has a 240 km radius coverage area. Clutter-corrected reflectivity factor data were gridded into a 2 km × 2 km horizontal, 3 km level constant altitude plan position indicator (CAPPI). These CAPPIs serve as input for our tracking algorithm (Sect. 2.2.2) as well as associated life cycle characterization of the convective cells.
2.2.2 Tracking method and definitions
The tracking algorithm is based on an area overlap approach, following the forecast and tracking the evolution of cloud clusters (ForTraCC) methods described by Vila et al. (2008) and conceptual figures found in that study. Our main improvement is that the time step between two adjacent radar reflectivity factor CAPPIs is automatically detected in our current implementation, which allows for nonuniform radar time steps. The algorithm works by comparing two successive radar CAPPI fields. A first step is to identify areas with contiguous reflectivity values above a certain threshold. We consider two thresholds, a 25 and a 35 dBZ threshold; these values are consistent with a light rain lower bound and one typical of a tropical “convective” radar threshold (Anagnostou, 2004; Steiner et al., 1995; Wang et al., 2018).
Cells are defined using gridded CAPPI pixel clusters, and clusters smaller than 10 pixels (40 km2) were excluded to avoid noise contamination. A subsequent step verifies which cluster has an area that overlaps with the previous radar field. If a cluster at a given time matches a cluster at the previous time (defined by a minimum 20 % overlap area), the cluster is said to be the continuation of that cell, and repeating this process generates the trackable cell records. Once done, we sub-select all storms that overpassed the RWP T3 site. Events were sorted for overpasses associated with storms with life cycles >50 min (i.e., a minimum of five SIPAM scans). The resulting set was sorted by season, with cells exhibiting split/merge characteristics in their tracked evolution removed. This process led to 24 event-cells identified during the Amazon wet season and 19 identified during the dry season (Tables 1 and 2, respectively).
Table 2Dry-season events and event details.
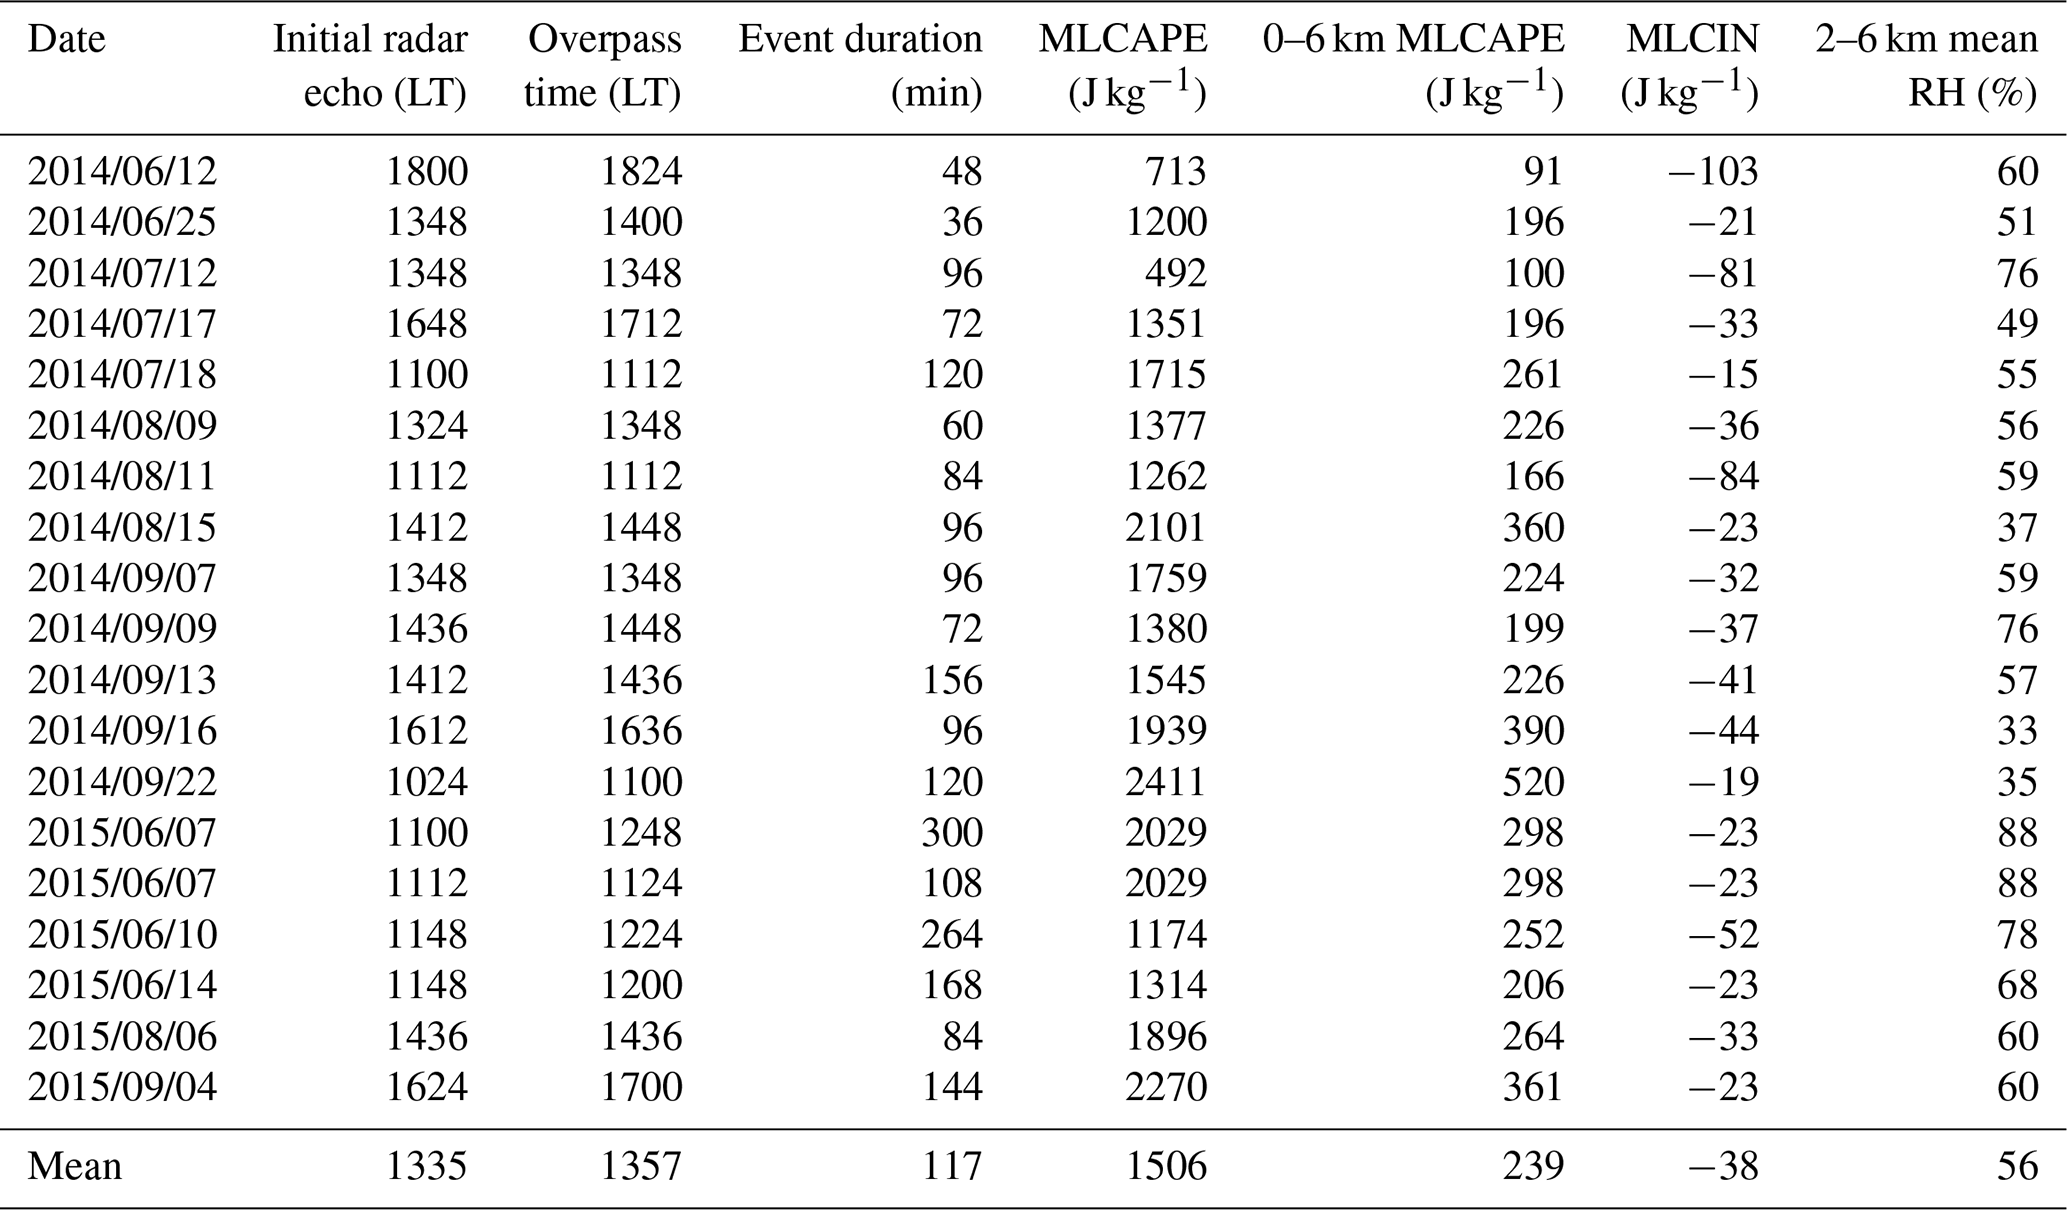
The abbreviations used in the table are as follows: MLCAPE denotes mean-layer convective available potential energy, MLCIN denotes mean-layer convective inhibition, and RH denotes relative humidity.
Overall, our typical wet-season storm was longer-lived than its dry-season counterpart; however, there was modest overlap for most tracked-cell behaviors (using the Z>25 dBZ threshold). The mean lifetime for these cells was 131 min (standard deviation of 61 and median of 120), with a mean wet-season cell lasting 141 min (standard deviation of 55 and median of 132) and a mean dry-season cell lasting 117 min (standard deviation of 66 and median of 96). As these times are based on a Z>25 dBZ threshold, total cloud lifetimes will exceed those of radar precipitation echoes. Separately, the life cycle timings for Z>35 dBZ echoes were also similar across seasons, with an approximate mean of 90 min and a standard deviation of 30 min. The average cell in our composites using the Z>25 dBZ threshold initiates at a time of 13:40 LT (standard deviation of approx. 2 h), with the mean dry-season storm initiating by 13:35 LT and the mean wet-season cell initiating by 13:44 LT.
Amazon regimes are defined using calendar definitions (December–January–February–March–April for “wet”; June–July–August–September for “dry”). Events' radiosonde properties are not consistent with those of transitional environments that may promote more intense convective updrafts or storm electrification (e.g., Williams et al., 2002; Giangrande et al., 2016, 2020). Larger-scale forcing tendencies for single-column models (e.g., Tang et al., 2016) and/or reanalysis fields are not shown but are consistent with seasonal environments reported in previous studies (e.g., Giangrande et al., 2020).

Figure 1Composite radiosonde skew-T log-P diagrams for the Amazon (a) wet-season and (b) dry-season launches (launched at 12:00 UTC, prior to convective cells). Shading represents the standard deviation of events. Temperature values are displayed in red, and dew point temperature values are given in green.
3.1 Composite thermodynamic profiles and event convective parameter summaries
In Fig. 1, we plot composite radiosondes for our events. Overall, the behaviors are similar to previous studies drawn from 12:00 UTC GoAmazon2014/5 radiosondes (e.g., Giangrande et al., 2020). The main shift between seasonal profiles is associated with the drier middle to upper levels observed for the dry season. Each composite indicates a low-level capping or remnant nocturnal temperature inversion that may act to inhibit daytime shallow cumulus and/or promote deeper cloud modes when convection initiates.
A breakdown of event convective parameters (see also Tables 1 and 2) is as follows: dry-season low-level (0–6 km) MLCAPE values are larger than during wet-season events, with a mean MLCAPE value of 239 J kg−1 compared with a mean wet-season MLCAPE of 152 J kg−1. This difference is statistically significant at the 95th confidence level based on a student's t test (herein “significant”). The dry-season profile MLCAPE values are also larger, MLCAPE of 1506 J kg−1 (dry) versus MLCAPE of 1337 J kg−1 (wet); however, this difference is not statistically significant. Insignificant seasonal differences are found in low-level wind shear (not shown) and MLCIN. As expected, mean relative humidity (RH) values in the lower free troposphere are significantly larger in the wet season (78 %) than in the dry season (56 %).
3.2 Composite boundary layer and diurnal cloud development
In Fig. 2, we plot composite diurnal cloud and boundary layer properties to inform on pre-DCC onset differences between wet and dry events. In Fig. 2a and b, we plot the ARSCL cloud frequency of occurrence for the event hours around radiosonde launch through convective initiation (typically prior to 14:00 LT). In Fig. 2c and d, we plot T3 soil surface temperature (ARM Surface Energy Balance System – SEBS) and the ceilometer-estimated PBL heights, respectively. Morning shallow to mid-level clouds are more common for our typical wet-season event when compared with composite dry-season cases. This observation is not surprising and is consistent with previous studies that infer higher humidity as a control for increased cloudiness. The reduction in dry-season cloud cover is also consistent with a more rapid PBL height increase that follows sunrise than in the wet season (Fig. 2d), which (presumably) results from greater insolation in the dry season. The largest PBL height discrepancies build prior to 12:00 LT, preceding the transition to congestus or deeper cloud modes. This transition is also suggested by cloud radar profiling in that more frequent cloud radar echoes to higher altitudes are observed (an initial congestus transition occurs prior to 12:00 LT for wet and slightly later for dry). In short, both seasonal composites indicate similar tendencies for the daytime shallower cloud mode (echo-top heights <2 km) shortly after 10:00 LT, with a transition towards deeper clouds (echo-top height ≥4 km) after 12:00 LT. However, we observe an earlier presence of upper-level (anvil) cloud signatures coupled with an absence of mid-level clouds (Fig. 2b) in the dry season (by approx. 13:00 LT), which suggests that a more rapid transition to deeper convection occurs in the dry season.
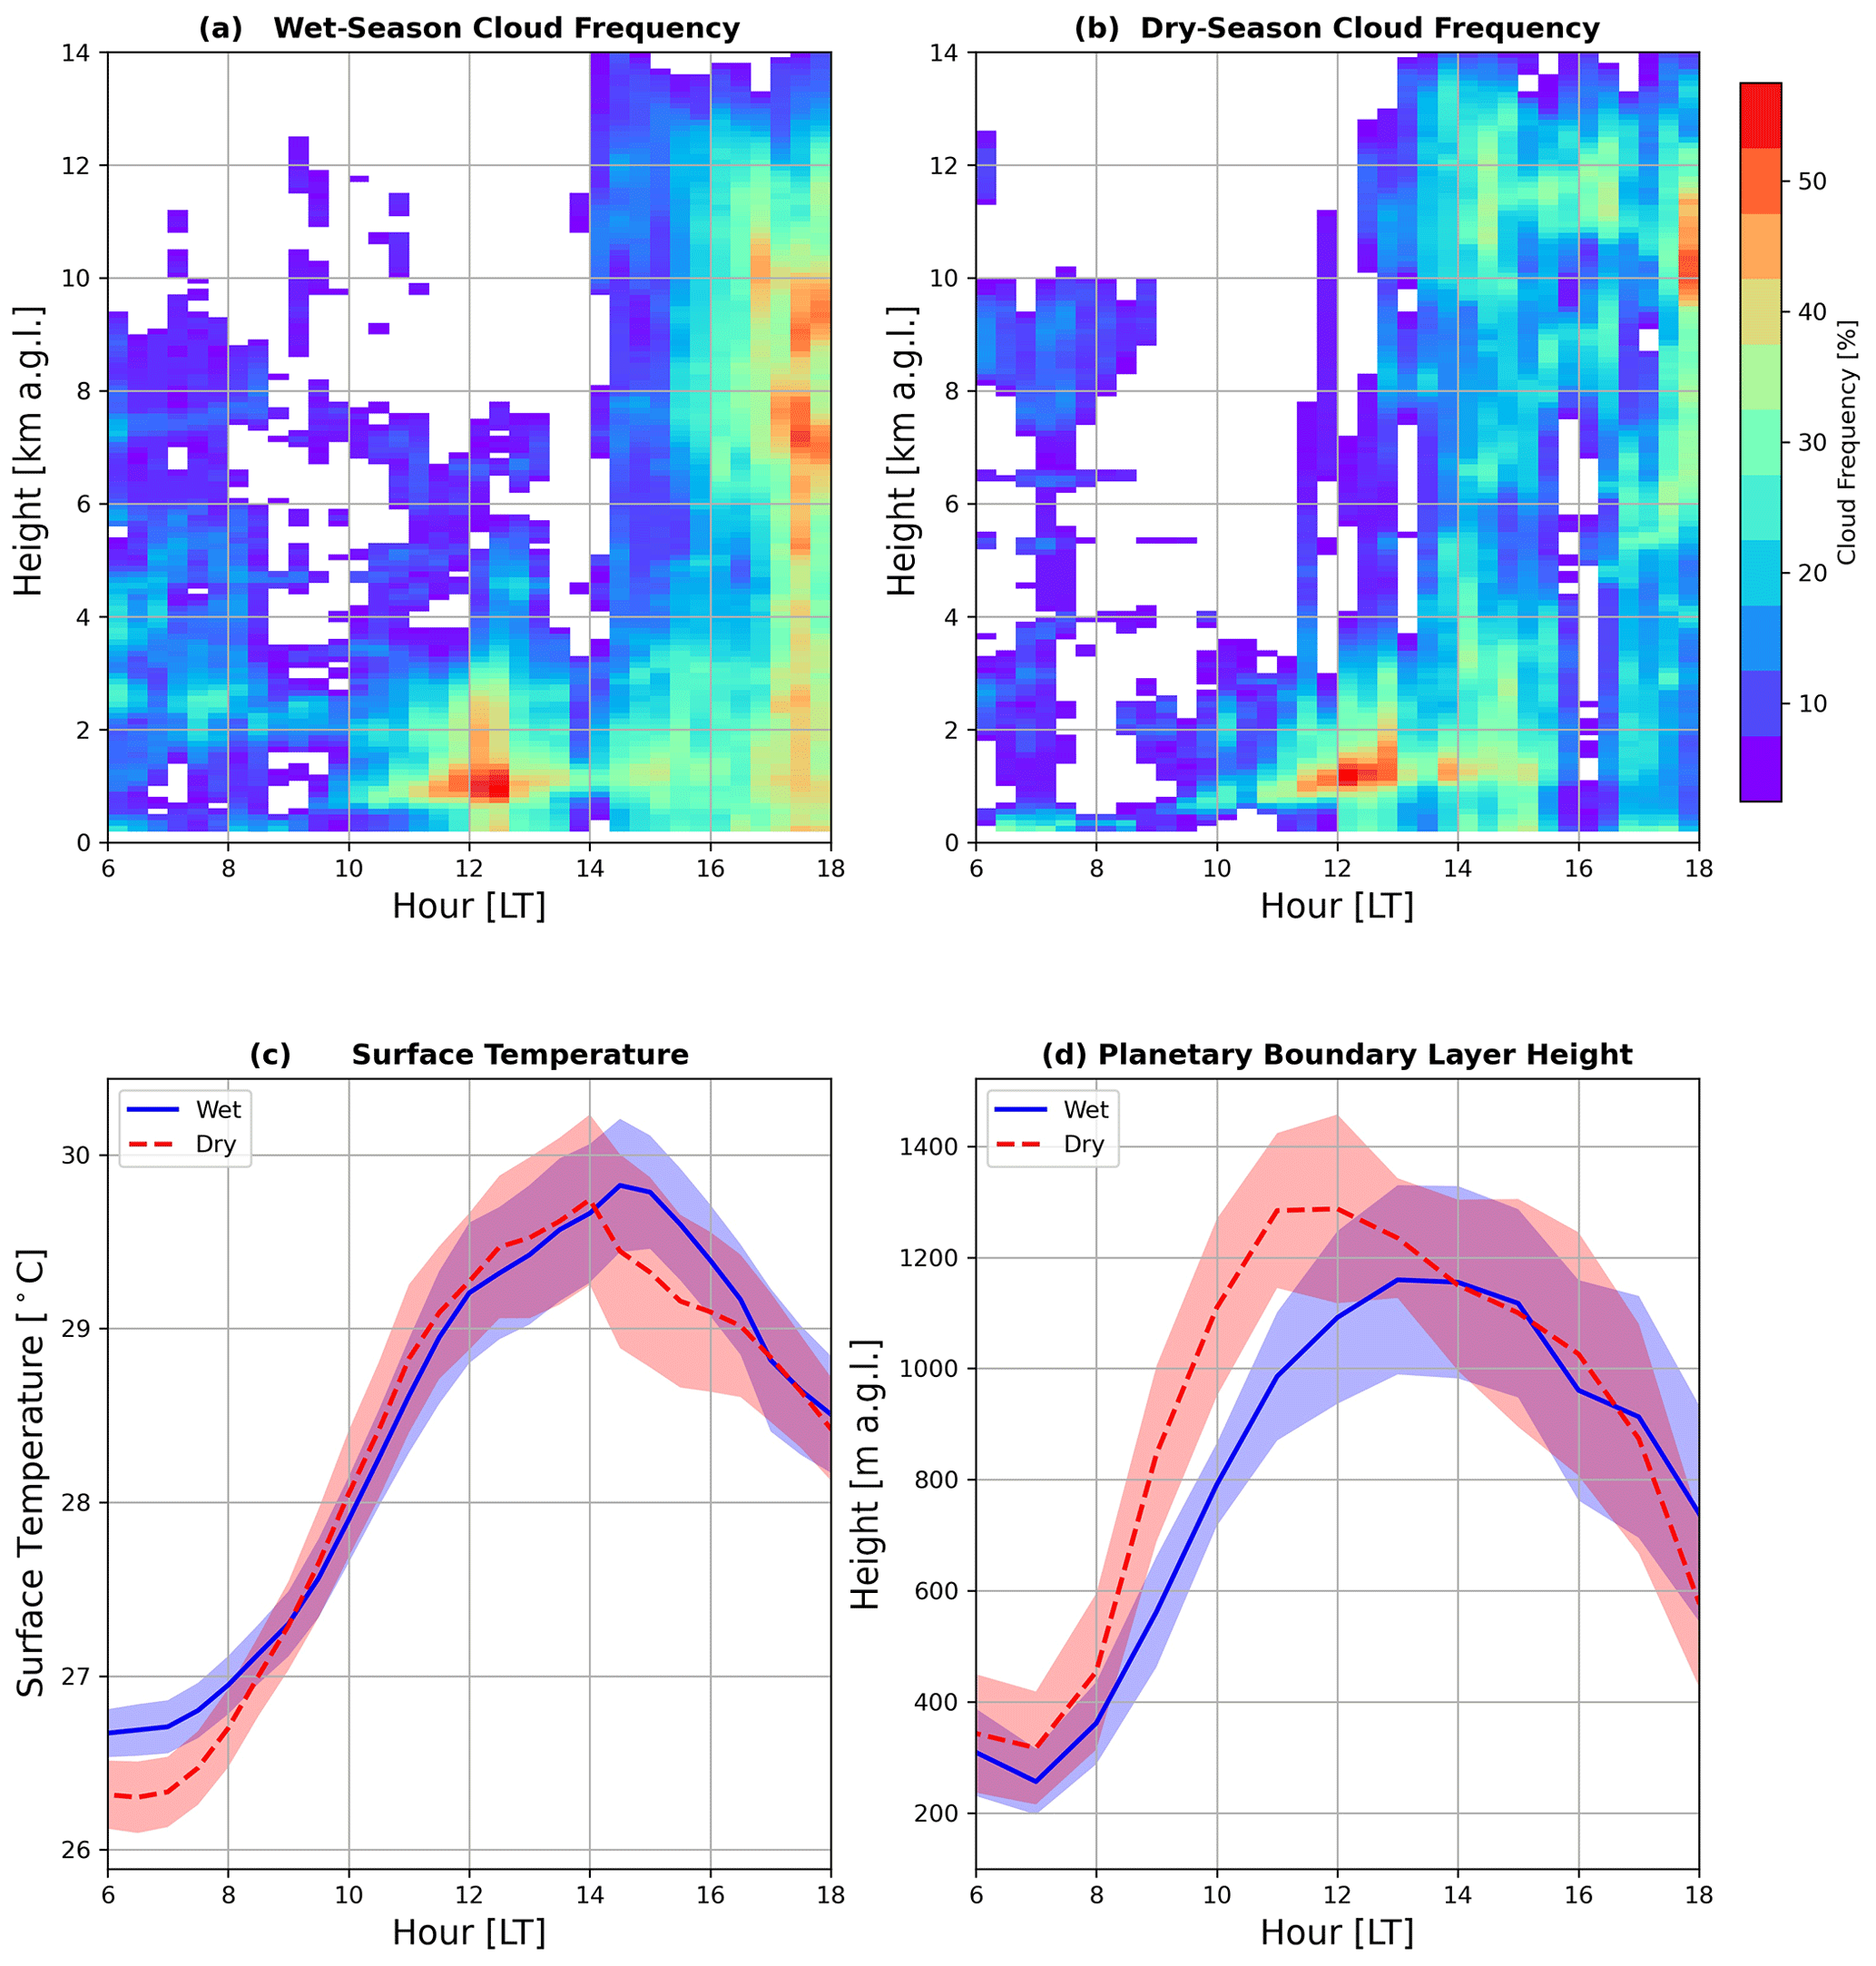
Figure 2Diurnal cycle for cloud frequency as a function of height at the T3 site during our (a) wet-season and (b) dry-season isolated cell events, respectively. (c) Wet-season (blue) and (d) dry-season (red) diurnal cycle plots for the surface temperature and PBL height for the same convective events. Lines are event-mean values, and shading represents the standard deviation.
The PBL evolution in the dry season also suggests a more rapid onset of deeper convection. The physical arguments that support this include the higher morning MLCAPE (at similar or reduced MLCIN) coupled with building PBL instability during the pre-convective hours from an increase in incoming solar radiation (reduced cloud frequency and slightly higher surface temperature). While complete surface flux measurements were unavailable, the authors speculate that dry-season conditions may favor a higher Bowen ratio (i.e., reduced soil moisture and humidity) and stronger generation of turbulent boundary layer growth (leading to the observed higher PBL height). Note that, while our subset of radar-tracked cells exhibited similar onset timing, wet-season cells were longer-lived (using the Z>25 dBZ threshold). As we plot in Fig. 3, echo statistics drawn from the larger SIPAM domain cell-tracking populations from these events suggests that our wet (solid lines) and dry (dashed lines) events show a similar frequency of occurrence and diurnal timing for Z>25 dBZ and Z>35 dBZ convective echoes. However, dry events exhibited more frequent occurrence of intense convective echoes Z>45 dBZ, consistent with arguments for stronger dry-season cells overall, and a more rapid deep transition and/or increased anvil cloud presence. In contrast, wet-season events suggested slightly earlier Z>25 dBZ and Z>35 dBZ populations, which may be associated with additional precipitating congestus, or extended congestus-to-deep cloud transitioning.
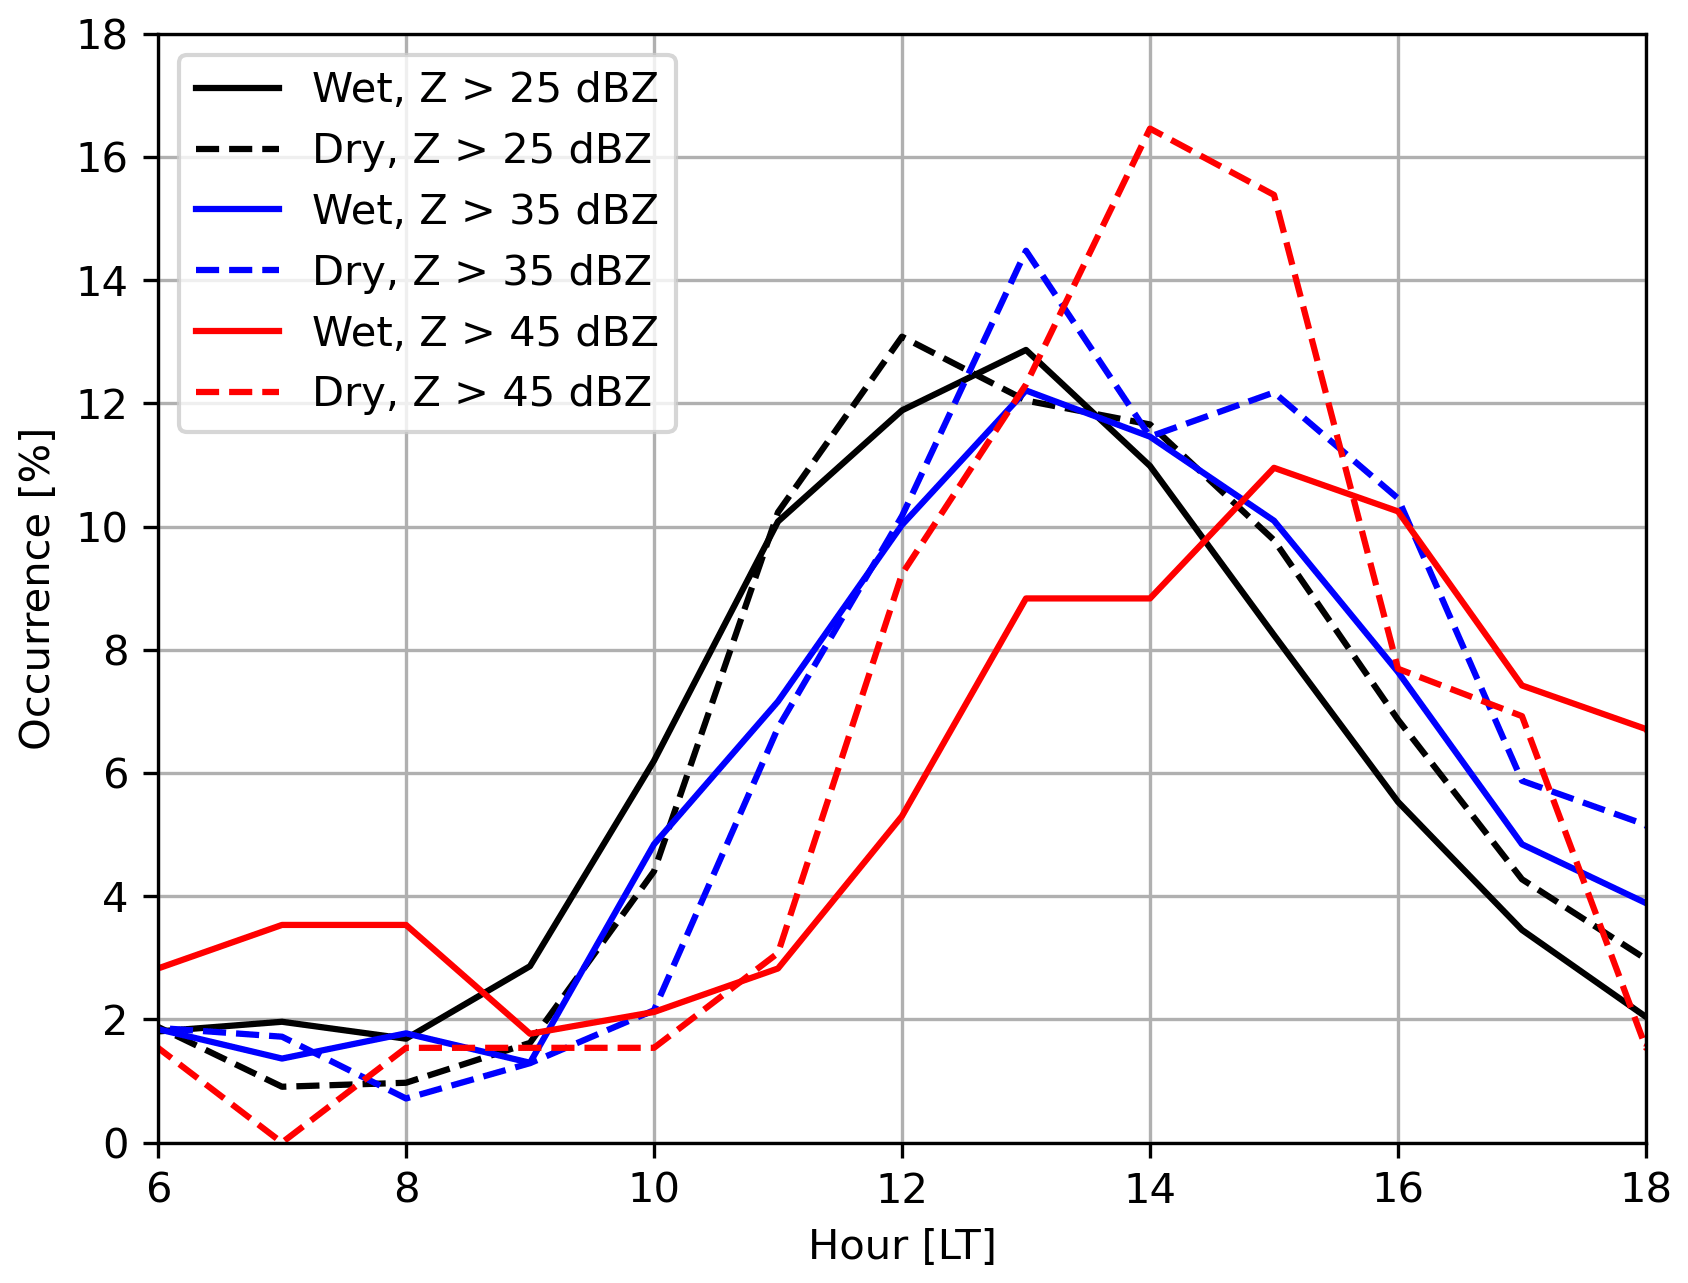
Figure 3Diurnal cycle of the frequency of occurrence for select SIPAM radar reflectivity factor levels for the selected wet- and dry-season events.
This section presents composite radar-tracked storm properties and discusses the potential connections between those characteristics and seasonal environmental controls. As DCC intensity and life cycle may be defined in several ways (i.e., rainfall or updraft maximum), we compare storm life cycle properties as viewed by surveillance radar (precipitation quantities) to fortuitous profiler overpass observations (dynamics). To conclude the section, the results of a simple Amazon updraft model sensitivity test (Sect. 4.3, 4.4) are provided to lend possible physical explanation for observed draft differences.

Figure 4Composite Amazon wet-season (blue) and dry-season (red) cell-tracking properties for dataset events. Time is normalized according to the difference between the first and last radar cell echoes exceeding the specified Z threshold. Lines represent the event-mean values, and shaded regions are the standard deviation. Panels (a) and (b) show the cell area according to a specified Z threshold of 25 and 35 dBZ, respectively.
4.1 Time-varying surveillance radar behaviors
In Fig. 4, we plot seasonal life cycle composites for precipitation properties of our tracked storms. These depictions apply a normalized cell lifetime for compositing purposes, where 0 represents the echo onset time and 1 represents the final time a qualifying echo was observed. Most tracked cells (19 for wet and 12 for dry) within the lower-threshold set (Z>25 dBZ; Fig. 4a) are contained within the higher-threshold tracking set (Z>35 dBZ; Fig. 4b) (i.e., exceeding 10 pixels for multiple scans exceeding 50 min). Each event recorded a maximum Z>35 dBZ at multiple points during its evolution. In Fig. 4c and d, we plot the mean Z associated with the tracked cells, and we plot the corresponding maximum Z composite properties for those cells in Fig. 4e. The distribution of the cell overpass times relative to the normalized life cycle stage is found in Fig. 4f.
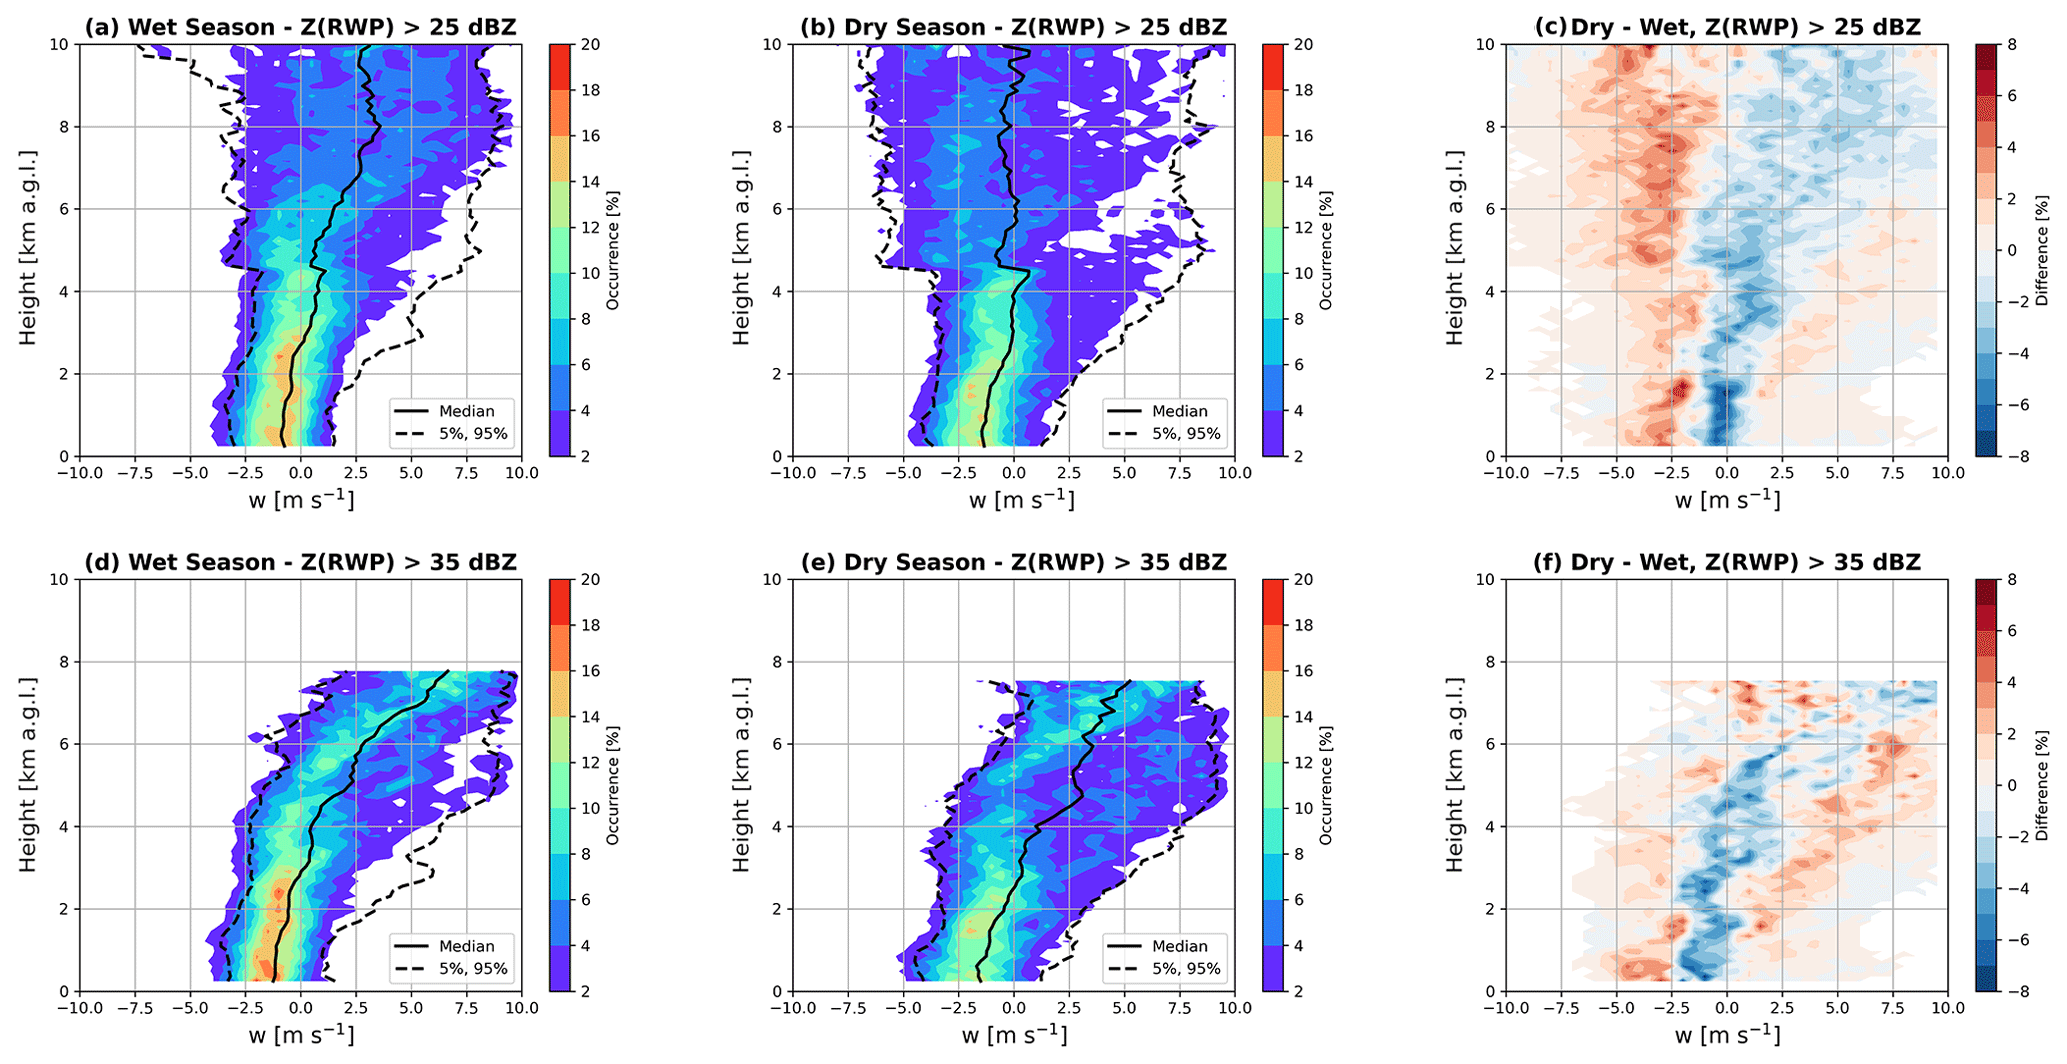
Figure 5Cell overpass cumulative vertical air velocity retrievals (CFADs) for the wet season (a, d), dry season (b, e), and wet minus dry difference fields (c, f). Panels (a), (b), and (c) include overpass retrievals with Z>25 dBZ, whereas panels (d), (e), and (f) are retrievals drawn from more intense Z>35 dBZ regions.
The plot of seasonal cell properties for precipitation area coverage is found in Fig. 4a and b. Initially, composite cell properties with Z>25 dBZ (Fig. 4a) display similar increases in coverage throughout earlier stages (normalized time <0.4). However, dry-season cells typically remain a similar size in light rain/periphery area coverage (e.g., Z∼25 dBZ) for times >0.4, whereas wet-season cells continue to increase in such coverage until a peak at normalized time ≅0.7. Adopting a more stringent Z>35 dBZ convective echo threshold (Fig. 4b), composite area properties are more consistent across the seasons, albeit representing a shorter-lived subset of the previous tracking. For the wet season, there are hints that Z>35 dBZ echo regions eventually outgrow those of the dry season, although most cells quickly dissipate at later relative stages (times >0.7). Overall, composites suggest that dry-season cells are relatively compact and intense, occupied by higher Z>35 dBZ echoes and retaining modest precipitation intensity for much of their lifetimes. These findings are consistent with previous GoAmazon2014/5 studies by Giangrande et al. (2020) that proposed that drier mid-levels in the drier seasons may limit periphery precipitation (i.e., enhanced evaporation), whereas wet-season cells may exhibit more resilient periphery precipitation.
Seasonal differences are also revealed when considering radar properties that are more directly associated with Z magnitude (Fig. 4c, d, e). Dry-season composites skew their strongest Z signatures to earlier life cycle stages, often with maximum behaviors found prior to normalized life cycle time <0.2 (i.e., within the first few qualifying radar volumes). An early storm intensification is consistent with arguments from the previous section indicating increased PBL instability during the dry season, reduced MLCIN, and higher low-level MLCAPE. Nevertheless, composite dry-season cell areas remain relatively unvarying after an initial intensification period throughout a lengthy portion of their normalized lifetime. In contrast, wet-season composites indicate a gradual increase in Z and areal precipitation coverage, with peak Z (normalized time ≅0.4) preceding an associated peak in precipitation coverage (i.e., normalized time ≅ 0.7). Composite wet-season storms appear to achieve similarly intense Z cores to our sampled dry counterparts at later moments in the cell life cycle. This result may not be surprising because our events share statistically similar CAPE values and these comparisons target longer-lived cells that conditionally may favor the more intense behaviors from the wet season.
4.2 Composite overpass profiler behaviors
In Fig. 5, we plot cumulative overpass vertical air velocity retrievals contingent on season (panels a and d present “wet”, panels b and e present “dry”, and panels c and f present the “dry–wet difference”) and according to multiple RWP retrieval thresholds (panels a–c show >25 dBZ and panels d–f show >35 dBZ). Median vertical air velocity (solid lines) and 5th/95th percentiles (dashed lines) are overlaid on the CFADs as reference for the extreme instantaneous observations from these events. Overall, composite velocity CFADs indicate that downdrafts are common at low levels, but CFADs transition towards more prominent updraft observations aloft (peak updrafts ≅10 m s−1; Fig. 5a, b, c).
With respect to updraft observations, the Z>25 dBZ CFADs suggest that dry-season maximal updrafts are more intense, although the relative enhancement is modest O[2–3 m s−1] and primarily observed at low levels below the melting level (to approx. 6 km). The dry-season samples in these Z>25 dBZ CFADs are favoring more frequent and modest downdrafts aloft (to be discussed). However, updraft extremes aloft indicate that dry-season observations are recording updrafts of comparable intensity to our wet-season samples; the most intense (95th percentile) updraft retrievals for both seasons are O[10 m s−1]. Potential physical reasons for observed seasonal updraft profile characteristics, comparable magnitudes aloft, and shifts therein will be discussed in Sect. 4.3.
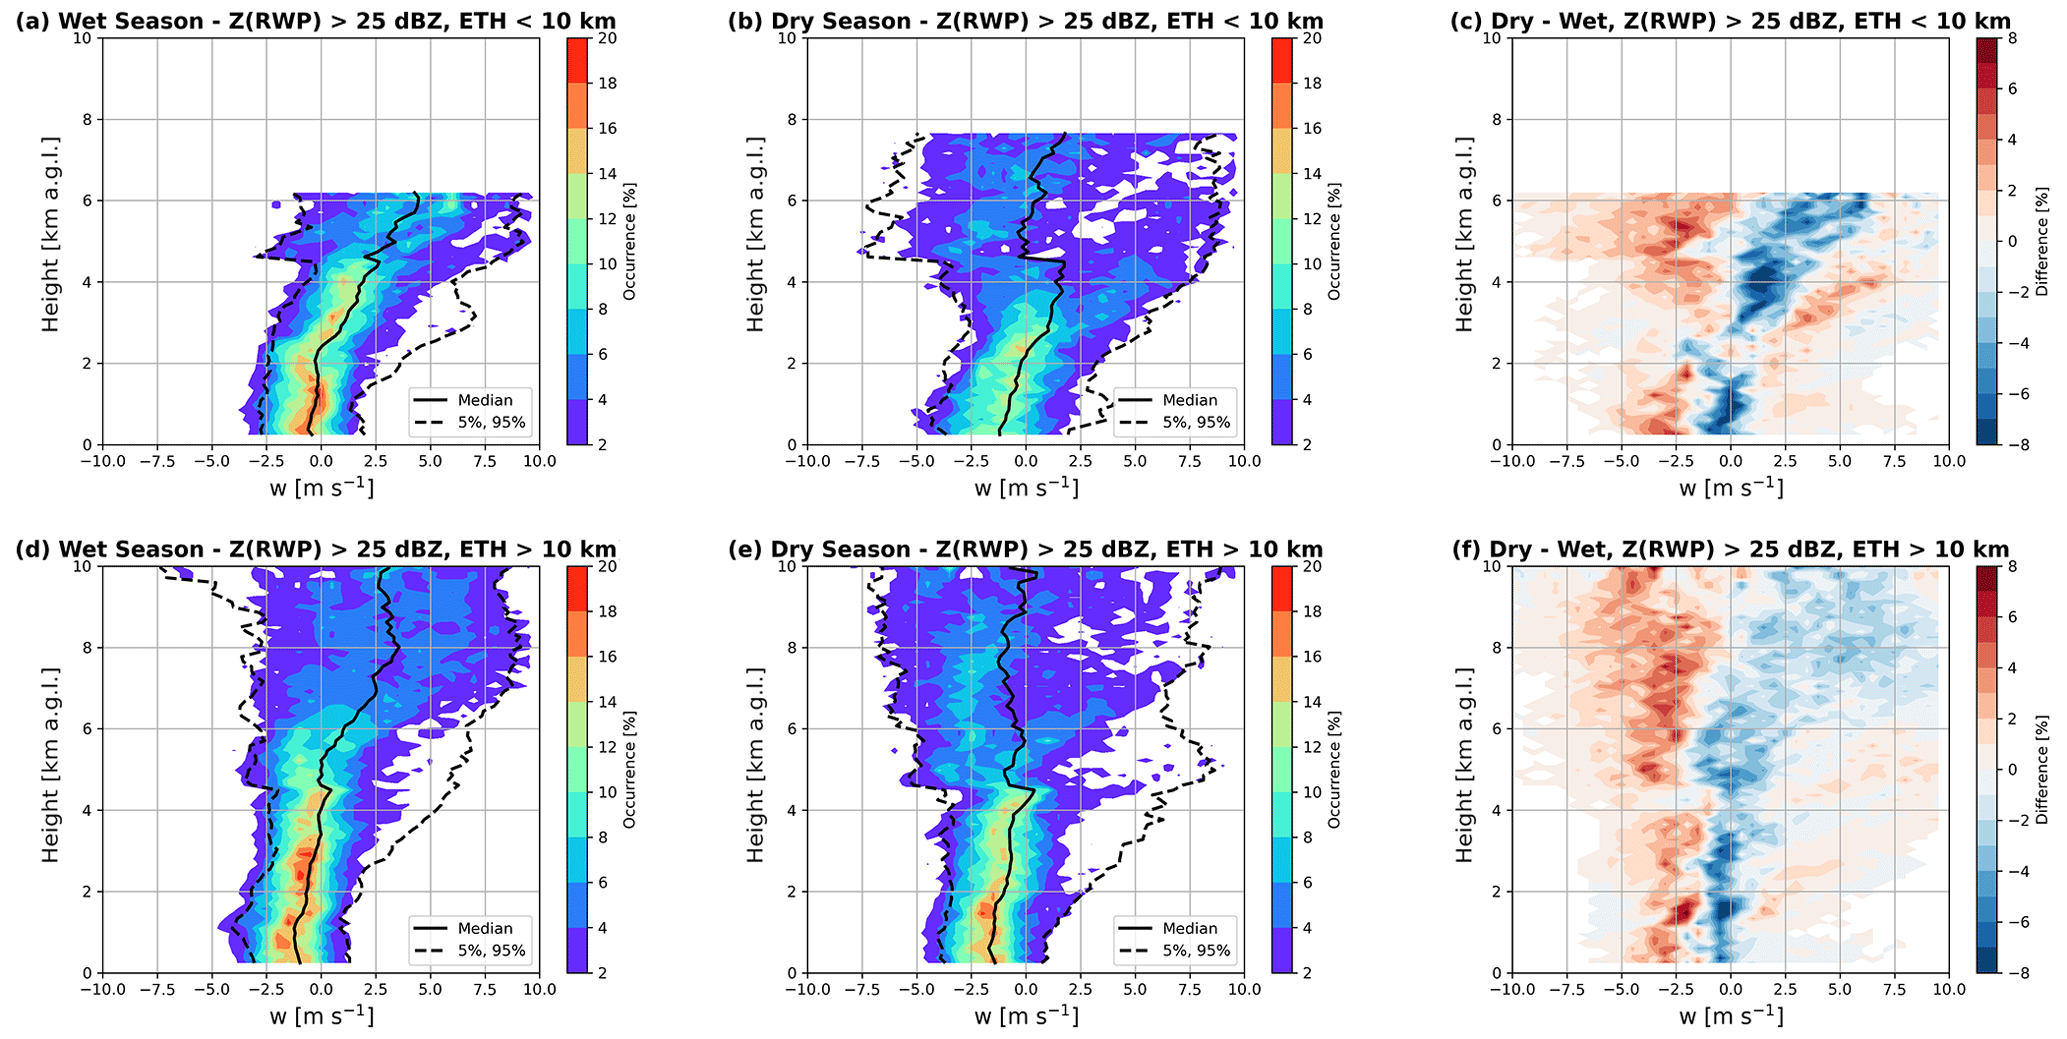
Figure 6Cell overpass vertical air velocity retrievals (CFADs, Z>25 dBZ) for the wet season (a, d), dry season (b, e), and wet minus dry difference fields (c, f). Panels (a), (b), and (c) are cumulative CFADs for ETH < 10 km, whereas panels (d), (e), and (f) are for the ETH > 10 km retrievals.
For downdraft observations, the most consistent downdrafts that we observed were associated with regions below the melting level (precipitation driven). Interestingly, downdrafts are observed to higher altitudes, but the most frequent and vigorous (>5 m s−1) are found within the dry-season events for the altitudes below 10 km. As will be confirmed with our subsequent Z>35 dBZ CFAD discussions, the majority of these dry-season downdraft retrievals aloft are associated with weaker Z<35 dBZ echoes and are, thus, found towards the peripheries of the more intense cores. Previously, Giangrande et al. (2016) investigated the GoAmazon2014/5 RWP dataset and suggested that strong downdrafts aloft may provide indirect evidence for stronger updrafts (under higher-CAPE/CIN and/or dry-season conditions). Their interpretation was that compensating toroidal-like circulations associated with stronger updrafts that were not directly observed may promote those stronger downdrafts aloft. While not stated by those authors, greater precipitation/condensate loading associated with stronger updrafts may also contribute to stronger downdrafts using those arguments. As with their efforts, we did not observe significantly stronger updrafts aloft, but we found that the observed shift in downdraft likelihood and intensity was primarily a dry-season phenomenon at these altitudes. A discussion on possible physical reasons for observing enhanced dry-season downdraft signatures at these altitudes is found in Sect. 4.4 to complement updraft discussions in Sect. 4.3.
In Fig. 5d, e, and f, cumulative CFAD plots shift towards prominent updraft signatures when we emphasize only those observations from the more intense Z>35 dBZ “core” precipitation instances from these same overpasses. Moreover, higher-reflectivity regions aloft are consistently, and increasingly to higher altitude, associated with updrafts. Physically, one interpretation is that larger or more intense precipitation signatures (lofted, larger, or more dense hydrometeors) aloft are also those conditionally associated with stronger updrafts overall. For the wet season in particular, maximum updraft signatures consistently peak above the melting level, with extreme values O[10 m s−1] similar to those retrieved during the dry-season events (above 6–7 km). Both seasons record less frequent observations of intense downdrafts within these higher or core Z>35 dBZ regions aloft. Stronger dry-season downdrafts are observed below the melting level, similar to Amazon MCS studies by Wang et al. (2019).
When interpreting the cumulative CFAD results above, the cell maturity of the corresponding overpasses is not explicitly revealed by these displays. In Figs. 6 and 7, we plot CFADs contingent on cell overpass ETH, where retrievals before/after an ETH of 10 km are used as a proxy for relative storm maturity. Overall, low-level precipitation-driven downdraft signatures for both seasons are more prominent and extend further above the melting level for our higher-ETH observations. As in cumulative CFADs, dry-season overpasses indicate stronger updrafts, but these stronger updrafts are primarily found below 6 km, and we associate them with developing cloud life cycle stages for the ETH <10 km retrieval instances. In later ETH >10 km stages, dry-season retrievals are dominated by downdrafts (frequency), with strong downdraft motions observed O[5 m s−1] aloft. In contrast, wet-season CFADs suggest a strengthening and more prevalent updrafts aloft to the later ETH <10 km stage observations.
The ETH displays filtered by Z>35 dBZ regions display a much clearer association between the presence of larger Z values reaching higher altitudes and stronger updraft observations (both seasons). However, our CFADs suggest that similarly intense reflectivity factors aloft (i.e., sampling 35 dBZ to 6 km) may be associated with a fairly wide range of updraft intensity contingent on the season and/or where those observations fall within the storm life cycle. Physically, these complications follow from storms having updrafts that are, at times, less impeded by precipitation, but any transition to stronger updrafts may also be convolved within increasing precipitation (i.e., heavier rainfall, graupel formation, and/or larger Z). Nevertheless, the Z>35 dBZ CFADs reinforce that strong Z signatures to higher altitudes may be attributed to strong updrafts and/or to close proximity to updrafts above the melting level.
Quartile breakdowns of storm life cycle for RWP retrievals are plotted in Fig. 8. Dry-season vertical air velocity retrievals suggest that the strongest upwards air motions are confined to the earliest life cycle stages, consistent with surveillance radar signatures for dry-season storm intensification. Wet-season quartile breakdowns reveal a gradual shift in draft characteristics towards more intense air motions by the middle quartiles (or associated peaks in Z and ETH), also in alignment with previous surveillance properties. The evidence for more intense dry-season upwards air motions at the low levels does not appear confined to any particular life cycle stage. However, stronger updrafts aloft are found with increasing time for the wet season, and more prominent downdrafts aloft are found with increasing time for the dry season. Late-cell-phase samples (time >0.75) are unavailable for the dry season, but late-stage wet-season samples imply a higher frequency of observations associated with downdrafts below the melting level as well as a shift for the observations of updrafts further aloft (i.e., possible signatures for remnant anvil/dissipating cloud air motions).

Figure 7As in Fig. 6 but for RWP retrievals with Z>35 dBZ.
4.3 Physical reasons for seasonal differences in updraft behavior
We explore the physical reasons for the differences in draft behaviors evident in Figs. 4–8 by applying a simplified updraft model to the 12:00 UTC sounding from each case. Because the entrainment rates in the observed updrafts are not known, we aim to simulate ascending parcels with a range of entrainment rates that encompasses what we might reasonably expect in weakly sheared tropical convection. To generate this range of entrainment rates, we use a stochastic parcel model (SPM) that is formulated in a similar manner to the eddy diffusivity/mass flux shallow convective scheme described in Sušelj et al. (2013, 2019). A detailed technical description of the model is available in Appendix A. In short, we simulate 100 different parcels in each sounding. The choice of 100 parcels was a compromise for model speed versus performance; however, repeat analyses using 1000 parcels (not shown) provided little change to the offered results. We assume entrainment in each parcel occurs in a series of discrete stochastic mixing events that follow a Poisson distribution, with the peak of the distribution corresponding to a typical fractional entrainment rate in tropical deep convection of m−1 (e.g., Romps and Kuang, 2010). Finally, we produce histograms at each height for the vertical air velocities among those parcels to compare this SPM output to observed CFAD characteristics from the previous sections. These histograms were generated by dividing the vertical velocity versus height parameter space into 1 m s−1 and 250 m bins, respectively, and summing all the points along SPM parcel paths that fell into each bin over a given season (i.e., wet or dry). We divided by the number of events in that season and applied a Gaussian filter with a radius of influence of 5 m s−1 and 1250 m with respect to vertical velocity and height, respectively. For the model outputs, those parcels that did not reach 5 km were excluded to maintain our focus on DCCs (Fig. 9).
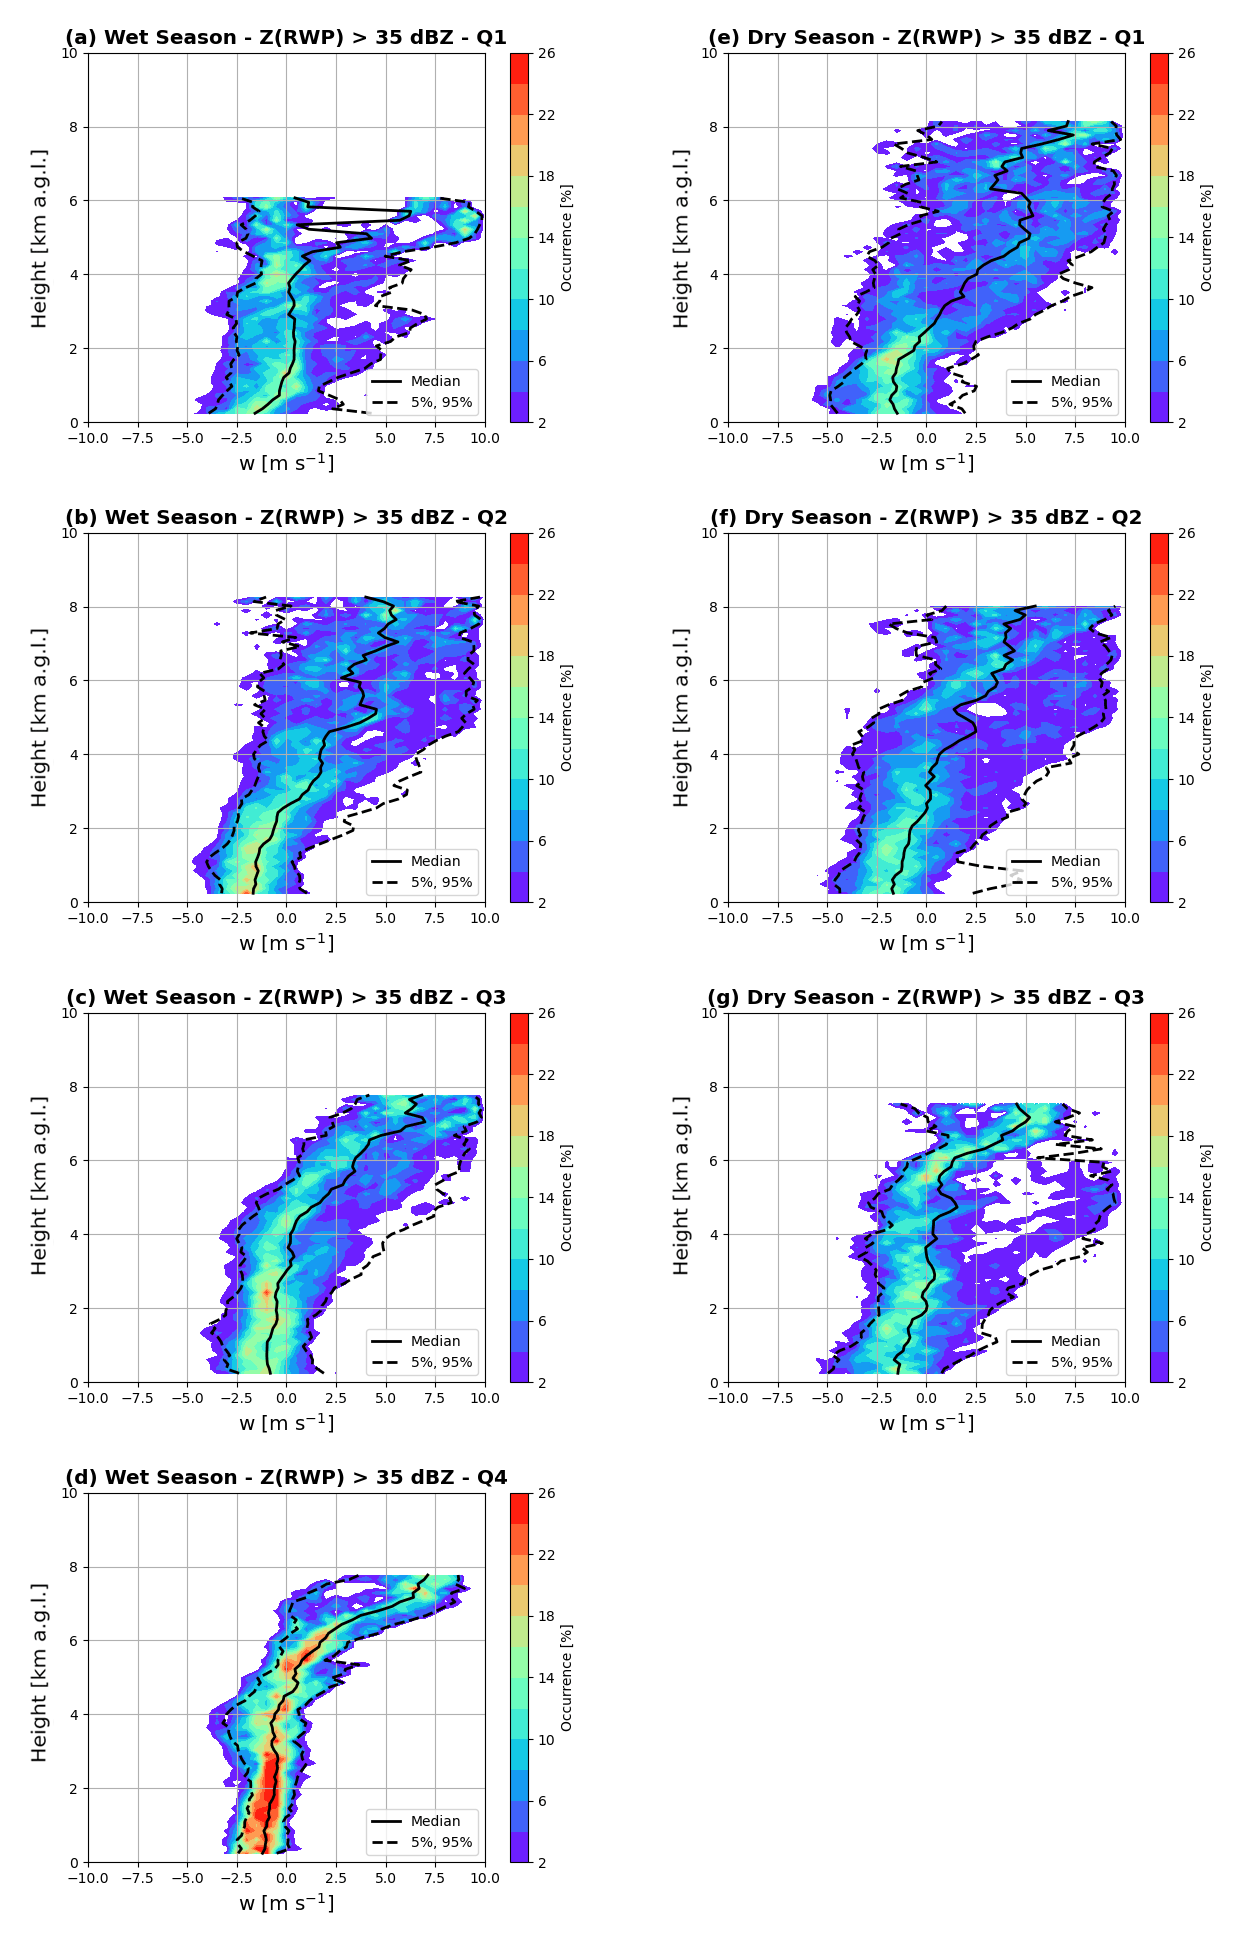
Figure 8Quartile life cycle breakdowns for overpass vertical air velocity retrievals (CFAD, Z>25 dBZ). Panels (a), (b), (c), and (d) are for the wet-season events, whereas panels (e), (f), and (g) are for the dry-season events.
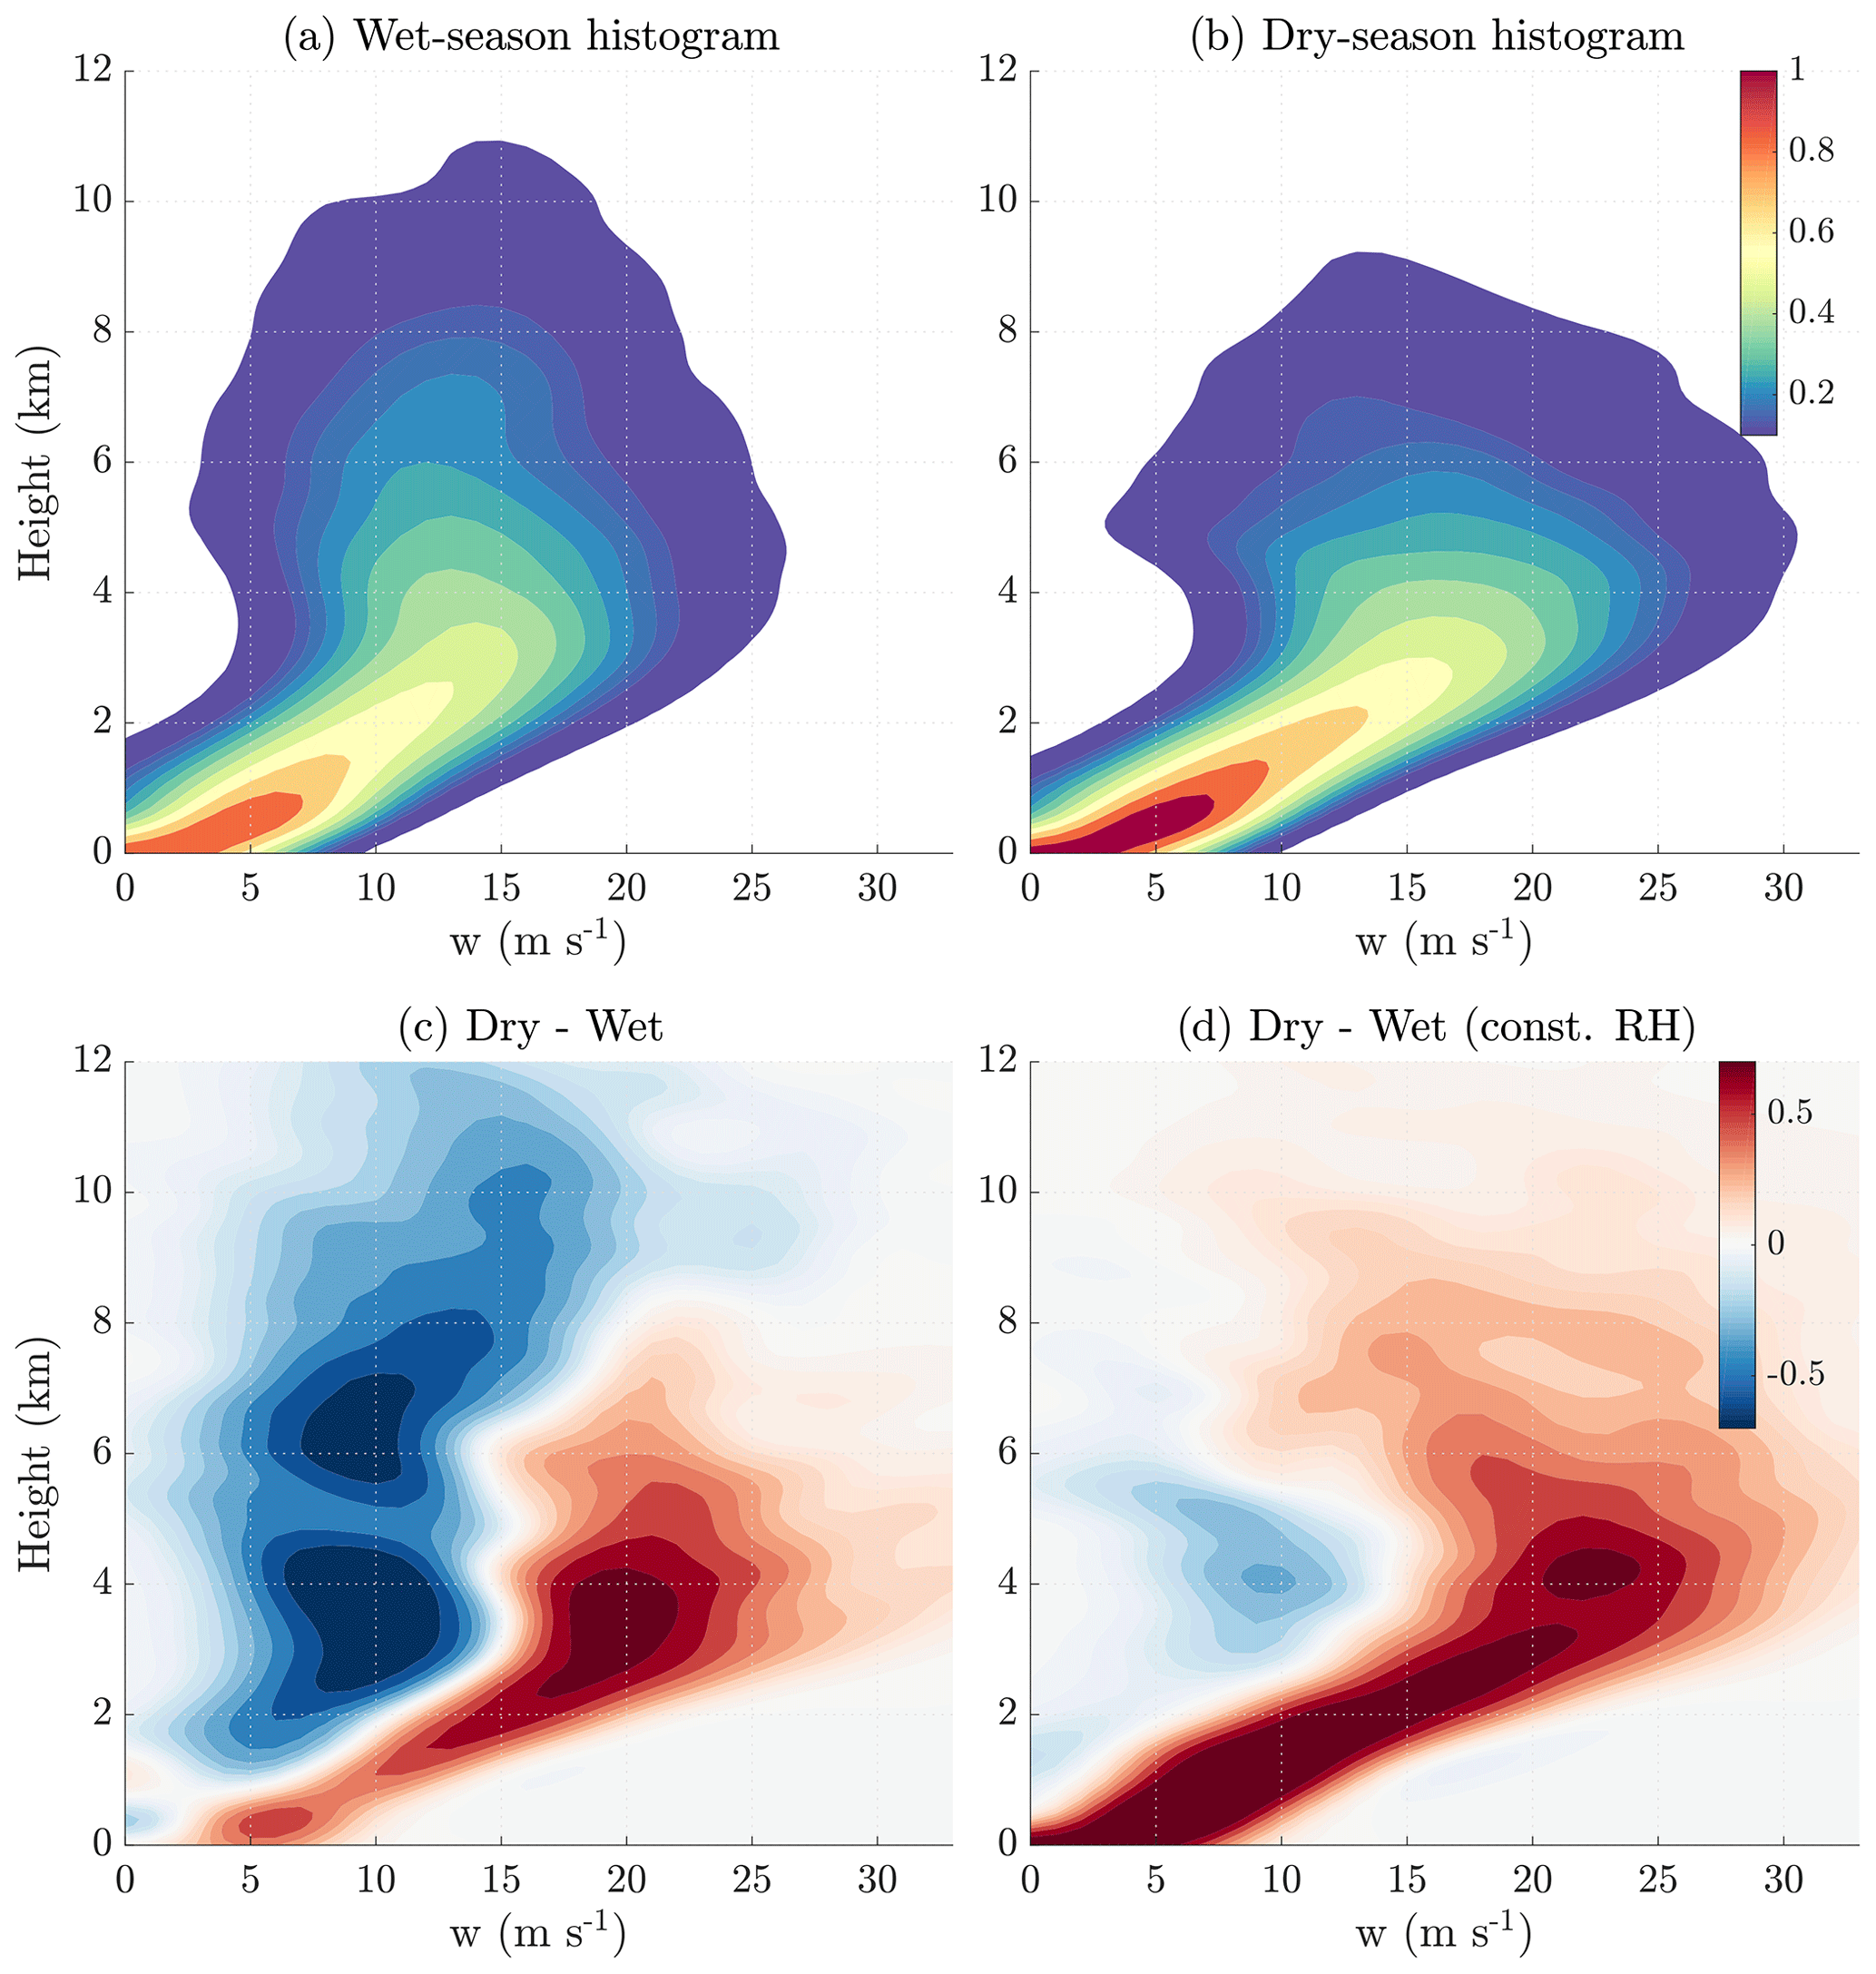
Figure 9Histograms of vertical velocity from all SPM runs using (a) wet-season radiosonde profiles and (b) dry-season profiles. Panel (c) presents a plot of wet-season histograms minus dry-season histograms, where positive values are blue and negative values are red. Panel (d) is the same as panel (c) but with all radiosonde inputs given the average RH profile from the dry-season cases above 2 km.
In Fig. 9a and b, we plot summary velocity profile behaviors from the multiple realizations that start from the morning radiosondes for each wet (Fig. 9a) and dry (Fig. 9b) event. Maximum parcel heights for SPM parcels were in the 10–13 km range (Fig. 9a, b), which is generally consistent with observed echo-top heights (e.g., Wang et al., 2018). This suggests that the entrainment rates of SPM parcels were reasonably consistent with those in the observed storms, as entrainment strongly regulates cloud depth. Peak vertical velocities are 50 %–100 % larger than what was observed by the RWPs. This discrepancy between peak SPM vertical velocities and observations is at least partially explained by an expected underestimation of the extreme/peak updraft velocities by RWP sampling (as was previously noted).
We subtracted the wet-season histogram from the dry-season histogram in Fig. 9c to plot seasonal differences in parcel behavior, where blue (red) values indicate that the SPM outputs a higher incidence for more intense wet-season (dry-season) updrafts. More intense dry-season updrafts are prevalent in model realizations at the lower levels, which is attributed to the higher low-level MLCAPE. This result is consistent with RWP observations that also suggest more intense low-level updrafts for dry-season samples. Strong (i.e., 5–10 m s−1) updrafts become more prominent aloft (>6–7 km) in the wet season and more comparable to those in the dry season. These comparatively stronger updrafts aloft between the wet- and dry-season model realizations are also consistent with the shift in our RWP difference fields (i.e., Figs. 7f, 9c).
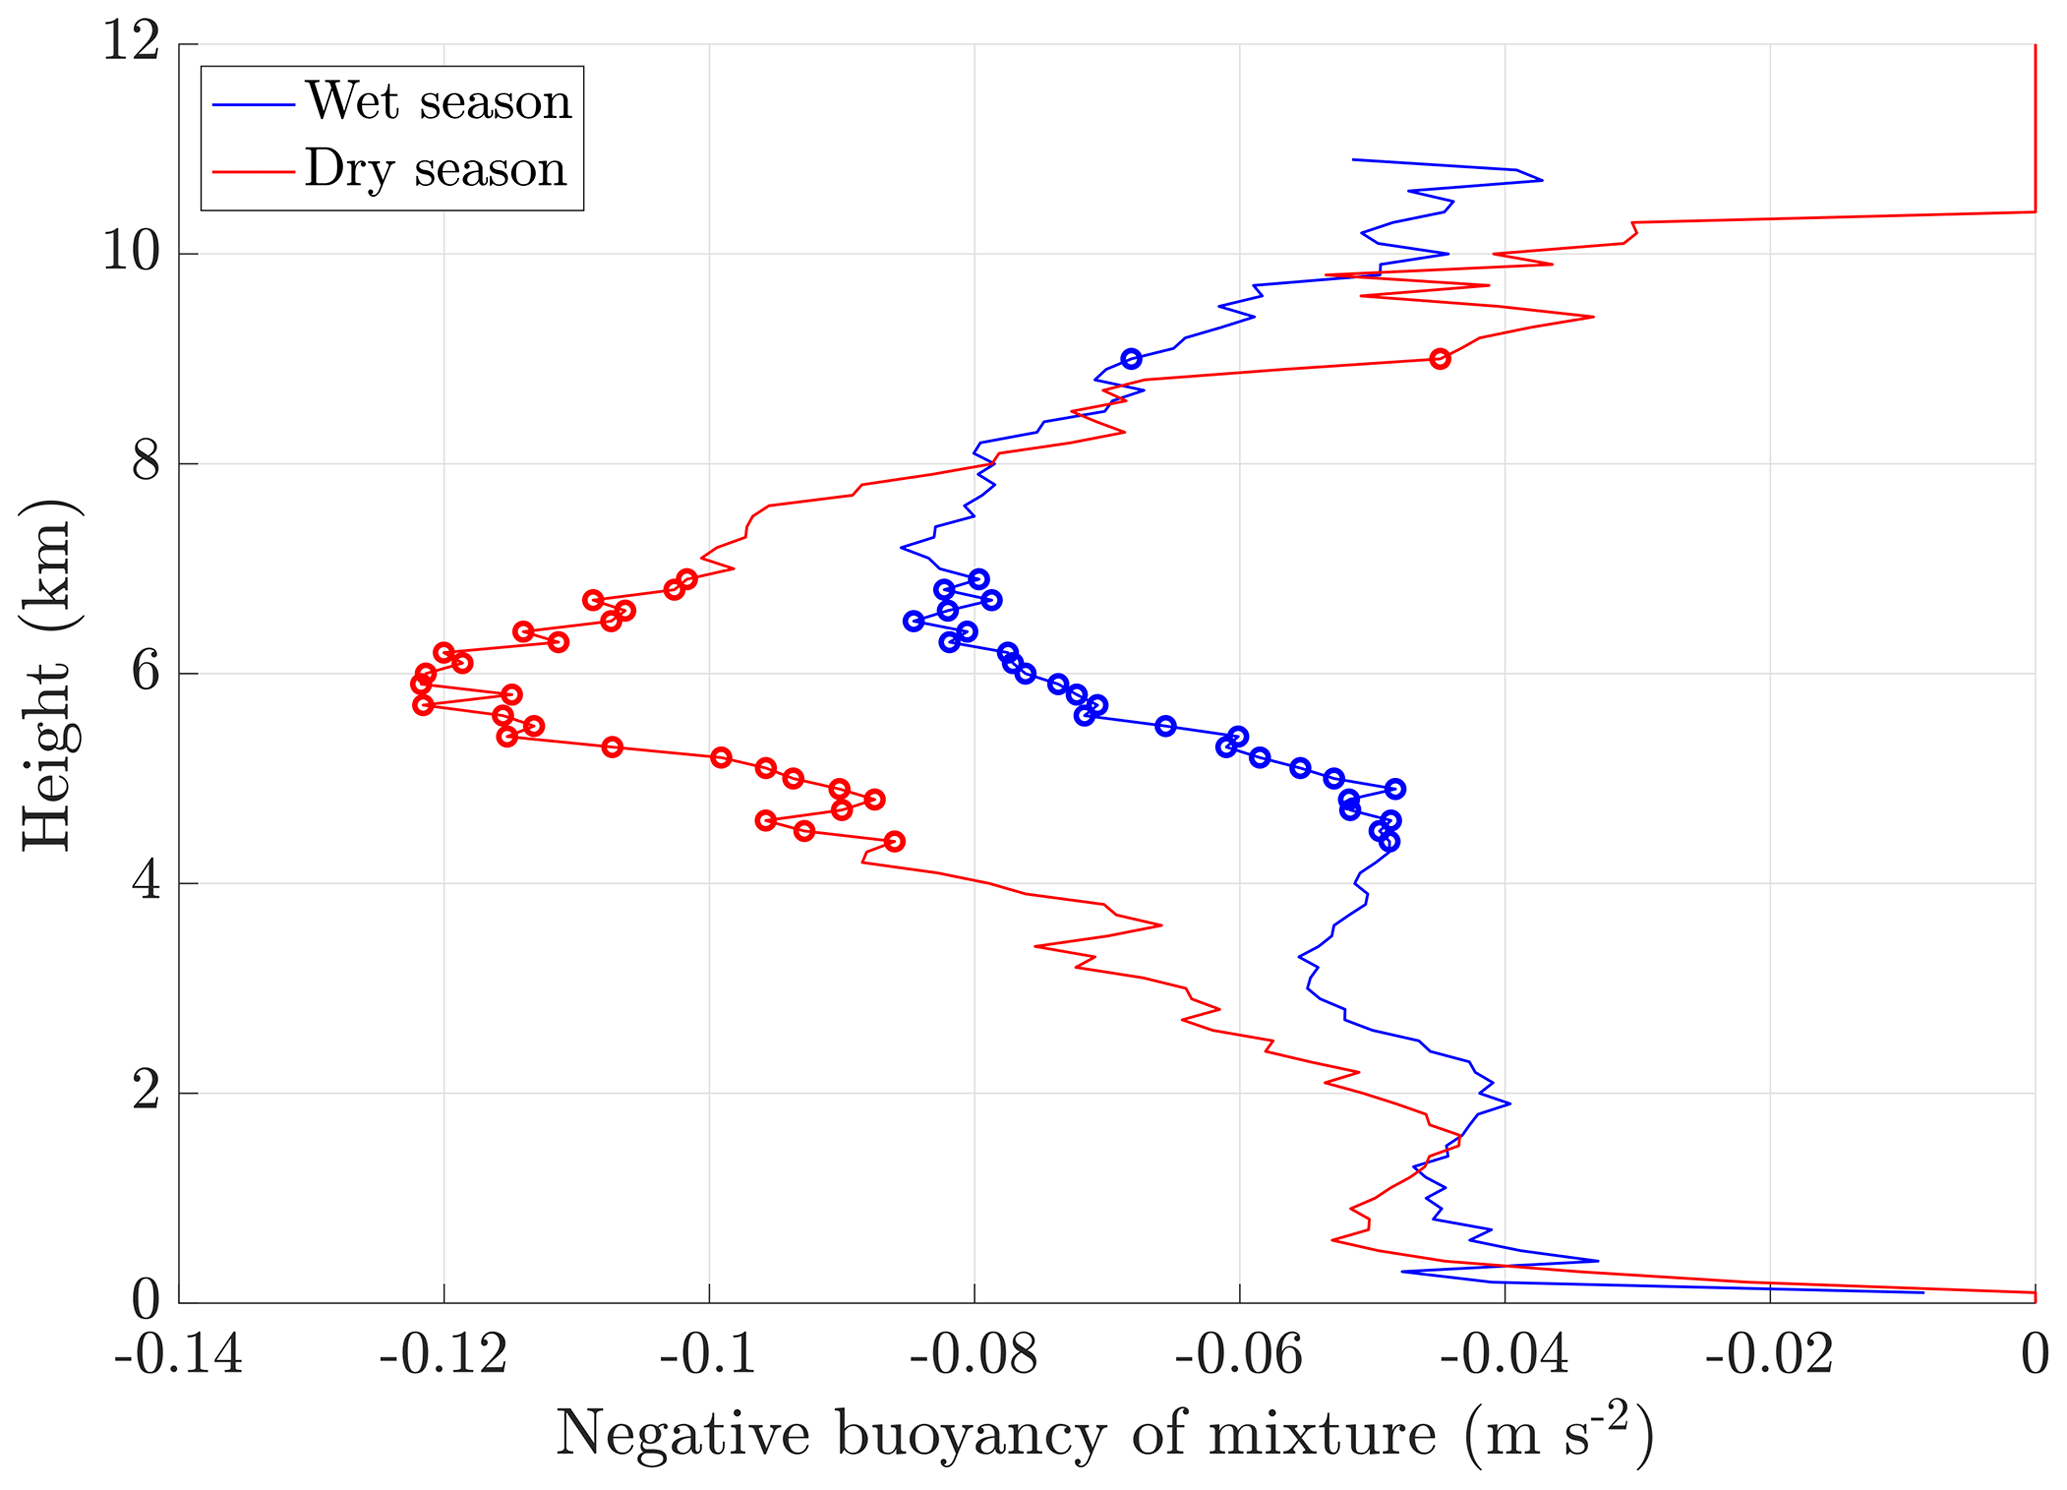
Figure 10Profiles of negative buoyancy (x axis, m s−2) resulting from mixtures of updraft and environmental air, computed using the procedure described in Sect. 4.4. Blue profiles show the average over all wet-season events, and red profiles show the average over all dry-season events. Circles correspond to heights where the difference between the two curves was statistically significant.
In Fig. 9d, we plot SPM results in the form of dry–wet differences, as from Fig. 9c, but after rerunning the realizations for each case and replacing all of the RH profiles (above 2 km) with an average RH over all dry-season cases. The motivation for these tests was an attempt to remove RH considerations, thereby possibly highlighting residual differences resulting from the different CAPE profiles. Given the more prominent dry-season updraft realizations to higher levels, one implication of this test is that stronger updrafts dominate the dry-season realizations if seasonal RH considerations are removed. This may suggest that the lower RH mitigates the intensity of dry-season updrafts or, equivalently, that the larger RH of the wet season is essential to its larger incidence of deeper updrafts.
4.4 Physical reasons for seasonal differences in downdraft behavior
To conclude our analysis, we provide plausible explanations for why downdrafts were more intense aloft in the dry season than observed for the wet season. Recent Amazon MCS observations from Wang et al. (2019, 2020) indicate that drier dry-season low- to mid-level conditions favor stronger downdrafts and/or higher downdraft origin heights. One hypothesis for our isolated cell events is that mixtures between drafts and environmental parcels are more negatively buoyant in the dry season. Consequently, these parcels will experience more intense downwards accelerations. To evaluate this, we leveraged the parcel properties simulated by the SPM in the previous subsection.
For each case, we selected the SPM parcel at each height with the median moist static energy (MSE). This parcel was defined as the “updraft parcel”, for which we recorded the MSE, water vapor (q_v), and condensate (q_c) mixing ratios of this parcel. For these tests, we assumed that the MSE and q_c of the updraft parcel mix linearly with the environment (q_c is zero in the environment), and we consider mixtures with fractions of updraft air ranging from 0.1 to 0.9 at intervals of 0.1 (i.e., the environment composes the other fraction of this mixture). Using this range of mixtures and assuming saturation, we solved for the parcel temperature and buoyancy for each updraft air fraction. We then recorded the average buoyancy of all negatively buoyant mixtures at each height, which gives a vertical profile of negative buoyancy for each event. We expect that mixtures of the updraft and the environment are more negatively buoyant in dry-season events than in wet-season events, due to the smaller free-tropospheric relative humidity in the former. We further assume that these mixtures between an updraft and its environment are responsible for initiating downdrafts and that strongly negatively buoyant mixtures will initiate stronger downdrafts than their less negatively buoyant counterparts.
As we plot in Fig. 10, the resulting dry-season buoyancy profiles are more negative than wet-season buoyancy profiles between 2 and 8 km. The difference is statistically significant between 4 and 6 km, with the dry-season buoyancy being a factor of 1.5 to 2 more negative than the wet-season negative buoyancy. Note that the calculations in Fig. 10 apply to updraft mixtures. However, we speculate that different mixtures of the cloud's surrounding environmental air mixed with detrained updraft air or downdrafts would behave similarly, where mean dry-season drafts would exhibit greater negative buoyancy compared with wet-season drafts.
Alternative interpretations for the observational differences may be rooted in RWP sampling as related to the seasonal differences in cell areal precipitation characteristics, cell lifecycle timing and intensity. Recall that dry-season downdrafts aloft were most frequently observed in dBZ samples and at later life cycle stages; these observations may be those preferentially collected near the edges of dry-season cells that radar indicates as more compact than their wet-season counterparts. This compact nature was attributed to evaporation and/or mixing with the drier RH environment limiting cell growth, potentially prioritizing RWP observations to locations where these processes, stronger air motions, and/or greater precipitation loading was occurring (e.g., Giangrande et al., 2016). In particular, dry-season RWP characteristics are consistent with additional graupel formation earlier in dry-season storm lifecycles, which may contribute to additional condensate loading in those events. There was evidence (not shown) for stronger downdrafts aloft (>8–10 km) at later stages for wet-season events that may also support an evolving relationship with stronger updrafts leading to additional loading; however, such observations were limited by the RWP sampling choices adopted in the present study. Equivalently, wet-season observations in those similar dBZ ranges may also include additional samples embedded within resilient and/or wider-spread precipitation areas (i.e., periphery or slower-falling snow) and regions that are more insulated from the cloud edge; these locations are consequently less prone to being associated with downdrafts in RWP samples. A comprehensive exploration of all downdraft possibilities is beyond the scope of our study but will be examined in future research.
This study investigates daytime DCC observations to document changes in storm characteristics contingent on larger-scale shifts between the Amazon wet and dry seasons. Our focus is on the use of surveillance weather radar cell tracking and coupled profiler-based vertical air velocity observations. Overall, the Amazon offers a unique natural laboratory for these studies, providing the frequent DCCs necessary for documenting storm life cycle in the manner presented. Observations of this kind are rare, but they are critical for the development of high-resolution cloud models that have added new capabilities for forward-radar operators but that lack coupled microphysical/dynamical observations (e.g., Stein et al., 2015).
The key findings of this study are as follows:
-
Dry-season cells show more intense drafts and precipitation properties compared with wet-season storms but also display reduced convective area coverage.
-
These dry storms rapidly developed and achieved peak intensity at early life cycle stages, potentially due to higher low-level MLCAPE and/or reduced morning cloud cover in the dry season.
-
Wet-season storms were longer-lived, achieving modest precipitation intensity and attaining larger convective area coverage Z>35 dBZ compared with dry-season counterparts and also achieving their most intense precipitation and updrafts later in their life cycle.
-
Dry-season updraft profiles exhibited stronger updrafts at lower altitudes below the melting level and stronger downdrafts above the melting layer than wet-season storms. However, wet-season storms exhibited a higher incidence of moderate to strong updrafts aloft than in the dry season and also exhibited less intense and/or frequent downdrafts overall for our sampling conditions (i.e., observations collected above the melting layer but below 10 km).
-
The stronger updrafts at low levels in the dry season are attributed to the larger low-level CAPE in the storm environment, whereas, a higher prevalence of updrafts aloft in the wet season resulted from larger environmental RH and less entrainment-driven dilution of updraft buoyancy.
-
Stronger downdrafts aloft in the dry season were attributed to factors including additional graupel loading at mid-levels, lower environmental RH, and an associated increased likelihood of evaporation and negative buoyancy within the mixtures of updraft and environmental air that initiate downdrafts.
Finally, our results put forward practical connections between quantities such as radar reflectivity and updraft intensity. These ideas are of interest for proxy retrievals of storm dynamics (updraft intensity and mass flux) from spaceborne platforms that can fill gaps in oceanic, remote, or similarly challenged regions (e.g., Jeyaratnam et al., 2021). For example, we observe a strong association between the earlier occurrence and deeper Z>35 dBZ regions aloft with the presence of stronger updrafts. These connections are not perfect, but they may be physically intuitive; intense updrafts are those that likely generate more intense precipitation while also being necessary to loft larger hydrometeors associated with larger reflectivity. While column reflectivity echo heights or integrated reflectivity measures (e.g., Kumar et al., 2016) are informative, our studies suggest adding life cycle guidance for proxy velocity or mass flux retrievals should help improve those methods.
The SPM uses dry static energy (DSE) and moist static energy (MSE) as prognostic thermodynamic variables, which we define as follows:
Here, cp=1005 J kg−1 K−1 is the heat capacity of dry air; T is updraft temperature; Lv=2 501 000 J kg−1 and Li=330 000 J kg−1 are the latent heats of vaporization and freezing, respectively (approximated with their empirical values at 273.15 K); qv and qc are the updraft's water vapor and condensate mass fractions, respectively; and g is gravity. The dimensionless parameter ω discriminates liquid from ice. It is set to 0 when T>273.15 K, 1 when T<253.15 K, and linearly transitions from 0 to 1 over the temperature range between 273.15 and 253.15 K. Next, we define the updraft kinetic energy k as follows:
where w is vertical velocity. Finally, we define the saturation water vapor mass fraction q∗ as follows:
where Rd=287 J kg−1 K−1 and Rv=461 J kg−1 K−1 are the dry and moist specific gas constants, respectively.
During the subsaturated part of ascent (i.e., , the prognostic thermodynamic equations are
Once a parcel achieves saturation, they become
The prognostic equation for k at all levels is
Variables with a subscript “0” represent the updraft background environment (in this case, the radiosonde profile), ε is a fractional entrainment inverse length scale, cd is a drag coefficient that is set to 0.5 based on Morrison and Peters (2018), and L is a length scale that represents the updraft radius (given a value below). The last term in Eq. (10) represents the effects of momentum entrainment (via ε) and form drag on ascending cloud elements (via the term).
We simulate 100 updrafts per sounding, wherein parcels within updrafts are subject to discrete Poisson-process entrainment events as they ascend. Hence, ε is defined as follows:
where φ is an operator that returns a random number from the Poisson distribution specified by the rate parameter Δz / L; Δz is the vertical grid spacing of the discretized model, and L is once again the length scale that represents the updraft radius. As stated in the main text, we set L to 1000 m. Our conclusions were relatively unchanged by variations in L from 500 to 1500 m.
Our model is vertically integrated with a simple first-order upwind Euler scheme, with an initial w ranging from 0.5 to 1.5 m s−1, T′ ranging from 0.5 to 1.5 K, ranging from 0.5 to 1.5 g kg−1 (where a′ denotes a departure from the value at the lowest level of the sounding), and a vertical grid spacing of 100 m. Vertical integration was stopped in each updraft at the first instance of k<0, and the vertical grid point below this level was defined as the updraft top. Using all updrafts simulated among all dry- and wet-season events, histograms were created at each grid height of w, binned at 1 m s−1 intervals.
All ARM data, including RWP (https://doi.org/10.5439/1256461, Coulter et al., 2015), WACR ARSCL (https://doi.org/10.5439/1097548, Giangrande et al., 2015), SONDE (https://doi.org/10.5439/1595321, Holdridge et al., 2015), CEIL (https://doi.org/10.5439/1181954, Morris et al., 2015), MET (https://doi.org/10.5439/1786358, Kyrouac and Shi, 2015), and other datasets used in this study, can be downloaded at https://www.arm.gov/ (last access: 10 August 2022). These efforts are associated with several standard ARM raw streams, value-added products (VAP), and GoAmazon2014/5 “PI Product” datasets.
SEG, TB, and JMP designed the research, performed the research, and wrote the paper.
The contact author has declared that none of the authors has any competing interests.
Publisher’s note: Copernicus Publications remains neutral with regard to jurisdictional claims in published maps and institutional affiliations.
This study was supported by the US Department of Energy (DOE) Atmospheric System Research (ASR) program. This paper has been authored by an employee of Brookhaven Science Associates, LLC, under contract no. DE-SC0012704 with the US DOE. The publisher, by accepting the paper for publication, acknowledges that the United States Government retains a nonexclusive, paid-up, irrevocable, worldwide license to publish or reproduce the published form of this paper, or allow others to do so, for United States Government purposes. This work was also supported by the DOE ARM program and its AMF3 Site Science project, which is supported by the Office of Biological and Environmental Research in the DOE, Office of Science, and through the US DOE contract no. DE-SC0012704 to Brookhaven National Laboratory. We also acknowledge FAPESP (São Paulo Research Foundation) project no. 2009/15235-8. We would like to thank CENSIPAM (Centro Gestor e Operacional do Sistema de Proteção da Amazônia) for providing the Manaus SIPAM radar data. The authors also wish to thank David Mechem (KU), Luiz Machado (USP), and Milind Sharma (TAMU) for their thoughtful comments on this work.
This research has been supported by the US Department of Energy (grant no. DE-SC0012704) and the Fundação de Amparo à Pesquisa do Estado de São Paulo (grant no. 2009/15235-8).
This paper was edited by Peter Haynes and reviewed by two anonymous referees.
Ackerman, T. P. and Stokes, G. M.: The Atmospheric Radiation Measurement Program, Phys. Today, 56, 38–44, https://doi.org/10.1063/1.1554135, 2003.
Adams, D. K., Gutman, S., Holub, K., and Pereira, D.: GNSS Observations of Deep Convective timescales in the Amazon, Geophys. Res. Lett., 40, 2818–2823, https://doi.org/10.1002/grl.50573, 2013.
Adams, D. K., Barbosa, H. M. J., and Gaitán De Los Ríos, K. P.: A Spatiotemporal Water Vapor–Deep Convection Correlation Metric Derived from the Amazon Dense GNSS Meteorological Network, Mon. Weather Rev., 145, 279–288, https://doi.org/10.1175/MWR-D-16-0140.1, 2017.
Anagnostou, E. N.: A convective/stratiform precipitation classification algorithm for volume scanning weather radar observations, Meteorol. Appl., 11, 291–300, https://doi.org/10.1017/S1350482704001409, 2004.
Anderson, N. F., Grainger, C. A., and Stith, J. L.:. Characteristics of Strong Updrafts in Precipitation Systems over the Central Tropical Pacific Ocean and in the Amazon, J. Appl. Meteorol., 44, 731–738, 2005.
Atmospheric Radiation Measurement (ARM): Climate Research Facility: Balloon-Borne Sounding System (SONDE), 3.21297∘ S 60.5981∘ W: ARM Mobile Facility (MAO) Manacapuru, Amazonas, Brazil; AMF1 (M1), in: Atmospheric Radiation Measurement (ARM) Climate Research Facility Data Archive, edited by: Holdridge, D., Kyrouac, J., and Coulter, R., Oak Ridge, Tennessee, USA, https://doi.org/10.5439/1025284, 1993.
Biscaro, T. S., Machado, L. A. T., Giangrande, S. E., and Jensen, M. P.: What drives daily precipitation over the central Amazon? Differences observed between wet and dry seasons, Atmos. Chem. Phys., 21, 6735–6754, https://doi.org/10.5194/acp-21-6735-2021, 2021.
Borque, P., Kollias, P., and Giangrande, S.: First Observations of Tracking Clouds Using Scanning ARM Cloud Radars, J. Appl. Meteorol. Clim., 53, 2732–2746, 2014.
Cifelli, R., Petersen, W. A., Carey, L. D., Rutledge, S. A., and da Silva Dias, M. A. F.: Radar observations of the kinematic, microphysical, and precipitation characteristics of two MCSs in TRMM LBA, J. Geophys. Res., 107, 8077, https://doi.org/10.1029/2000JD000264, 2002.
Coulter, R., Muradyan, P., and Martin, T.: Radar Wind Profiler (1290RWPPRECIPMOM), Atmospheric Radiation Measurement (ARM) User Facility, mao1290precipmomM1.a0, [data set], https://doi.org/10.5439/1256461 (last access: 10 August 2022), 2015.
Dixon, M. and Wiener, G.: 1 TITAN: Thunderstorm Identification, Tracking, Analysis, and Nowcasting – A radar-based methodology, J. Atmos. Ocean. Technol., 10, 785–797, 1993.
Feng Z., Dong, X., Xi, B., Xi, B., McFarlane, S. A., Kennedy, A., and Lin, B.: Life Cycle of Midlatitude Deep Convective Systems in a Lagrangian Framework, J. Geophys. Res.-Atmos., 117, doi:10.1029/2012JD018362, 2012.
Feng, Z., Leung, L. R., Hagos, S., Houze, R. A., Burleyson, C. D., and Balaguru, K.: More frequent intense and long-lived storms dominate the springtime trend in central US rainfall, Nat. Commun., 7, 13429, https://doi.org/10.1038/ncomms13429, 2016.
Feng, Z., Houze, R. A., Leung, L. R., Song, F., Hardin, J. C., Wang, J., Gustafson, W. I., and Homeyer, C. R.: Spatiotemporal Characteristics and Large-Scale Environments of Mesoscale Convective Systems East of the Rocky Mountains, J. Climate, 32, 7303–7328, 2019.
Foote, G. B. and Du Toit, P. S.: Terminal Velocity of Raindrops Aloft, J. Appl. Meteorol. Clim., 8, 249–253, 1969.
Fridlind, A. M., van Lier-Walqui, M., Collis, S., Giangrande, S. E., Jackson, R. C., Li, X., Matsui, T., Orville, R., Picel, M. H., Rosenfeld, D., Ryzhkov, A., Weitz, R., and Zhang, P.: Use of polarimetric radar measurements to constrain simulated convective cell evolution: a pilot study with Lagrangian tracking, Atmos. Meas. Tech., 12, 2979–3000, https://doi.org/10.5194/amt-12-2979-2019, 2019.
Ghate, V. P. and Kollias, P.: On the Controls of Daytime Precipitation in the Amazonian Dry Season, J. Hydrometeorol., 17, 3079–3097, 2016.
Giangrande, S. E., Collis, S., Straka, J., Protat, A., Williams, C., and Krueger, S.: A Summary of Convective-Core Vertical Velocity Properties Using ARM UHF Wind Profilers in Oklahoma, J. Appl. Meteorol. Clim., 52, 2278–2295, 2013.
Giangrande, S. E., Johnson, K., Clothiaux, E., and Kollias, P.: W-band Cloud Radar Active Remote Sensing of Cloud (ARSCLWACRBND1KOLLIAS), Atmospheric Radiation Measurement (ARM) User Facility, maoarsclwacrbnd1kolliasM1.c1, [data set], https://doi.org/10.5439/1097548, 2015.
Giangrande, S. E., Toto, T., Jensen, M. P., Bartholomew, M. J., Feng, Z., Protat, A., Williams, C. R., Schumacher, C., and Machado, L.: Convective cloud vertical velocity and mass-flux characteristics from radar wind profiler observations during GoAmazon2014/5, J. Geophys. Res.-Atmos., 121, 12891–12913, doi:10.1002/2016JD025303, 2016.
Giangrande, S. E., Feng, Z., Jensen, M. P., Comstock, J. M., Johnson, K. L., Toto, T., Wang, M., Burleyson, C., Bharadwaj, N., Mei, F., Machado, L. A. T., Manzi, A. O., Xie, S., Tang, S., Silva Dias, M. A. F., de Souza, R. A. F., Schumacher, C., and Martin, S. T.: Cloud characteristics, thermodynamic controls and radiative impacts during the Observations and Modeling of the Green Ocean Amazon (GoAmazon2014/5) experiment, Atmos. Chem. Phys., 17, 14519–14541, https://doi.org/10.5194/acp-17-14519-2017, 2017.
Giangrande, S. E., Wang, D., and Mechem, D. B.: Cloud regimes over the Amazon Basin: perspectives from the GoAmazon2014/5 campaign, Atmos. Chem. Phys., 20, 7489–7507, https://doi.org/10.5194/acp-20-7489-2020, 2020.
Göke, S., Ochs, H. T., and Rauber, R. M.: Radar analysis of precipitation initiation in maritime versus continental clouds near the Florida coast: Inferences concerning the role of CCN and giant nuclei, J. Atmos. Sci., 64, 3695–3707, https://doi.org/10.1175/JAS3961.1, 2007.
Holdridge, D., Ritsche, M., Coulter, R., Kyrouac, J., and Keeler, E.: Atmospheric Radiation Measurement (ARM) user facility, updated hourly, Balloon-Borne Sounding System (SONDEWNPN), ARM Mobile Facility (MAO) Manacapuru, Amazonas, Brazil, AMF1 (M1), ARM Data Center, maosondewnpnM1.b1, [data set], https://doi.org/10.5439/1595321, 2015.
Hu, J., Rosenfeld, D., Ryzhkov, A., Zrnic, D., Williams, E., Zhang, P., Snyder, J. C., Zhang, R., and Weitz, R.: Polarimetric radar convective cell tracking reveals large sensitivity of cloud precipitation and electrification properties to CCN, J. Geophys. Res.-Atmos., 124, 12194–12205, https://doi.org/10.1029/2019JD030857, 2019.
Jeyaratnam, J., Luo, Z. J., Giangrande, S. E., Wang, D., and Masunaga, H.: A satellite-based estimate of convective vertical velocity and convective mass flux: Global survey and comparison with radar wind profiler observations, Geophys. Res. Lett., 48, e2020GL090675, https://doi.org/10.1029/2020GL090675, 2021.
Jorgensen, D. P., Zipser, E. J., and LeMone, M. A.: Vertical Motions in Intense Hurricanes, J. Atmos. Sci., 42, 839–856, 1985.
Kumar, V. V., Jakob, C., Protat, A., Williams, C. R., and May, P. T.: Mass-Flux Characteristics of Tropical Cumulus Clouds from Wind Profiler Observations at Darwin, Australia, J. Atmos. Sci., 72, 1837–1855, 2015.
Kumar, V. V., Protat, A., Jakob, C., Williams, C. R., Rauniyar, S., Stephens, G. L., and May, P. T.: The estimation of convective mass flux from radar reflectivities, J. Appl. Meteorol. Clim., 55, 1239–1257, https://doi.org/10.1175/JAMC-D-15-0193., 2016.
Kyrouac, J. and Shi, Y.: Surface Meteorological Instrumentation (MET), Atmospheric Radiation Measurement (ARM) User Facility, maometM1.b1, [data set], https://doi.org/10.5439/1786358, 2015.
Limpert, G., Houston, A., and Lock, N.: The advanced algorithm for tracking objects (AALTO), Meteor. Apps., 22, 694–704, https://doi.org/10.1002/met.1501, 2015.
Machado, L. A., Rossow, W. B., Guedes, R. L., and Walker, A. W.: Life cycle variations of mesoscale convective systems over the Americas, Mon. Weather Rev., 126, 1630–1654, 1998.
Machado, L. A. T., Laurent, H., Dessay, N., and Miranda, I.: Seasonal and diurnal variability of convection over the Amazonia: A comparison of different vegetation types and large scale forcing, Theor. Appl. Climatol., 78, 61–77, https://doi.org/10.1007/s00704-004-0044-9, 2004.
Machado, L. A. T., Silva Dias, M. A. F., Morales, C., Fisch, G., Vila, D., Albrecht, R., Goodman, S. J., Calheiros, A. J. P., Biscaro, T., Kummerow, C., Cohen, J., Fitzjarrald, D., Nascimento, E. L., Sakamoto, M. S., Cunningham, C., Chaboureau, J.-P., Petersen, W. A., Adams, D. K., Baldini, L., Angelis, C. F., Sapucci, L. F., Salio, P., Barbosa, H. M. J., Landulfo, E., Souza, R. A. F., Blakeslee, R. J., Bailey, J., Freitas, S., Lima, W. F. A., and Tokay, A.: The CHUVA Project: How Does Convection Vary across Brazil?, B. Am. Meteorol. Soc., 95, 1365–1380, https://doi.org/10.1175/BAMS-D-13-00084.1, 2014.
Machado, L. A. T., Calheiros, A. J. P., Biscaro, T., Giangrande, S., Silva Dias, M. A. F., Cecchini, M. A., Albrecht, R., Andreae, M. O., Araujo, W. F., Artaxo, P., Borrmann, S., Braga, R., Burleyson, C., Eichholz, C. W., Fan, J., Feng, Z., Fisch, G. F., Jensen, M. P., Martin, S. T., Pöschl, U., Pöhlker, C., Pöhlker, M. L., Ribaud, J.-F., Rosenfeld, D., Saraiva, J. M. B., Schumacher, C., Thalman, R., Walter, D., and Wendisch, M.: Overview: Precipitation characteristics and sensitivities to environmental conditions during GoAmazon2014/5 and ACRIDICON-CHUVA, Atmos. Chem. Phys., 18, 6461–6482, https://doi.org/10.5194/acp-18-6461-2018, 2018.
Maddox, R. A.: Mesoscale convective complexes, B. Am. Meteorol. Soc., 61, 1374–1387, 1980.
Martin, S. T., Artaxo, P., Machado, L., Manzi, A. O., Souza, R. A., Schumacher, C., Wang, J., Biscaro, T., Brito, J., Calheiros, A., Jardine, K., Medeiros, A., Portela, B., de Sá, S. S., Adachi, K., Aiken, A. C., Albrecht, R., Alexander, L., Andreae, M. O., Barbosa, H. M., Buseck, P., Chand, D., Comstock, J. M., Day, D. A., Dubey, M., Fan, J., Fast, J., Fisch, G., Fortner, E., Giangrande, S., Gilles, M., Goldstein, A. H., Guenther, A., Hubbe, J., Jensen, M., Jimenez, J. L., Keutsch, F. N., Kim, S., Kuang, C., Laskin, A., McKinney, K., Mei, F., Miller, M., Nascimento, R., Pauliquevis, T., Pekour, M., Peres, J., Petäjä, T., Pöhlker, C., Pöschl, U., Rizzo, L., Schmid, B., Shilling, J. E., Dias, M. A., Smith, J. N., Tomlinson, J. M., Tóta, J., and Wendisch, M.: The Green Ocean Amazon Experiment (GoAmazon2014/5) Observes Pollution Affecting Gases, Aerosols, Clouds, and Rainfall over the Rain Forest, B. Am. Meteorol. Soc., 98, 981–997, https://doi.org/10.1175/BAMS-D-15-00221.1, 2017.
Mather, J. H. and Voyles, J. W.: The ARM Climate Research Facility: A Review of Structure and Capabilities, B. Am. Meteorol. Soc., 94, 377–392, https://doi.org/10.1175/BAMS-D-11-00218.11, 2013.
Morris, V., Zhang, D., and Ermold, B.: Ceilometer (CEIL), Atmospheric Radiation Measurement (ARM) User Facility, maoceilM1.b1, [data set], https://doi.org/10.5439/1181954, 2015.
Morrison, H. and Peters, J. M.: Theoretical Expressions for the Ascent Rate of Moist Deep Convective Thermals, J. Atmos. Sci., 75, 1699–1719, 2018.
Nobre, P., Malagutti, M., Urbano, D. F., De Almeida, R. A. F., and Giarolla, E.: Amazon deforestation and climate change in a coupled model simulation, J. Climate, 22, 5686–5697, 2009.
Peters, J. M., Mulholland, J. P., and Chavas, D. R.: Generalized Lapse Rate Formulas for Use in Entraining CAPE Calculations, J. Atmos. Sci., 79, 815–836, 2022.
Petersen, W. A., Nesbitt, S. W., Blakeslee, R. J., Cifelli, R., Hein, P., and Rutledge, S. A.: TRMM Observations of Intraseasonal Variability in Convective Regimes over the Amazon, J. Climate, 15, 1278–1294, 2002.
Prein, A. F., Liu, C. K. I., Trier, S. B., Rasmussen, R., M., Holland, G. J., and Clark, M. P.: Increased rainfall volume from future convective storms in the US, Nat. Clim. Change, 7, 880–884, 2017.
Protat, A. and Williams, C. R.: The Accuracy of Radar Estimates of Ice Terminal Fall Speed from Vertically Pointing Doppler Radar Measurements, J. Appl. Meteorol. Clim., 50, 2120–2138, 2011.
Rosenfeld, D.: Objective method for analysis and tracking of convective cells as seen by radar, J. Atmos. Ocean. Technol., 4, 422–434, 1987.
Saraiva, I., Silva Dias, M. A. F., Morales, C. A. R., and Saraiva, J. M. B.: Regional Variability of Rain Clouds in the Amazon Basin as Seen by a Network of Weather Radars, J. Appl. Meteorol. Clim., 55, 2657–2675, https://doi.org/10.1175/JAMC-D-15-0183.1, 2016.
Schiro, K. A., Ahmed, F., Giangrande, S. E., and Neelin, J. D.: GoAmazon2014/5 campaign points to deep-inflow approach to deep convection across scales, P. Natl. Acad. Sci. USA, 115, 4577–4582, https://doi.org/10.1073/pnas.1719842115, 2018.
Stein, T. H. M., Hogan, R. J., Clark, P. A., Halliwell, C. E., Hanley, K. E., Lean, H. W., Nicol, J. C., and Plant, R. S.: The DYMECS project: A statistical approach for the evaluation of convective storms in high-resolution NWP models, B. Am. Meteorol. Soc., 96, 939–951, https://doi.org/10.1175/BAMS-D-13-00279.1, 2015.
Steiner, M., Houze, R. A., and Yuter, S. E.: Climatological Characterization of Three-Dimensional Storm Structure from Operational Radar and Rain Gauge Data, J. Appl. Meteorol. Clim., 34, 1978–2007, 1995.
Sušelj, K., Teixeira, J., and Chung, D.: A Unified Model for Moist Convective Boundary Layers Based on a Stochastic Eddy-Diffusivity/Mass-Flux Parameterization, J. Atmos. Sci., 70, 1929–1953, 2013.
Sušelj, K., Kurowski, M. J., and Teixeira, J.: On the Factors Controlling the Development of Shallow Convection in Eddy-Diffusivity/Mass-Flux Models, J. Atmos. Sci., 76, 433–456, 2019.
Tang, S., Xie, S., Zhang, Y., Zhang, M., Schumacher, C., Upton, H., Jensen, M. P., Johnson, K. L., Wang, M., Ahlgrimm, M., Feng, Z., Minnis, P., and Thieman, M.: Large-scale vertical velocity, diabatic heating and drying profiles associated with seasonal and diurnal variations of convective systems observed in the GoAmazon2014/5 experiment, Atmos. Chem. Phys., 16, 14249–14264, https://doi.org/10.5194/acp-16-14249-2016, 2016.
Tian, Y., Zhang, Y., Klein, S. A., and Schumacher, C.: Interpreting the diurnal cycle of clouds and precipitation in the ARM GoAmazon observations: Shallow to deep convection transition, J. Geophys. Res.-Atmos., 126, e2020JD033766, https://doi.org/10.1029/2020JD033766, 2021.
Tian, Y., Zhang, Y., and Klein, S. A.: What determines the number and the timing of pulses in afternoon precipitation in the Green Ocean Amazon (GoAmazon) observations?, Geophys. Res. Lett., 49, e2021GL096075, https://doi.org/10.1029/2021GL096075, 2022.
Vila, D. A., Machado, L. A. T., Laurent, H., and Velasco, I.: Forecast and Tracking the Evolution of Cloud Clusters (ForTraCC) Using Satellite Infrared Imagery: Methodology and Validation, Weather Forecast., 23, 233–245, https://doi.org/10.1175/2007WAF2006121.1, 2008.
Wang, J., Krejci, R., Giangrande, S., Kuang, C., Barbosa, H. M., Brito, J., Carbone, S., Chi, X., Comstock, J., Ditas, F., Lavric, J., Manninen, H. E., Mei, F., Moran-Zuloaga, D., Pöhlker, C., Pöhlker, M. L., Saturno, J., Schmid, B., Souza, R. A., Springston, S. R., Tomlinson, J. M., Toto, T., Walter, D., Wimmer, D., Smith, J. N., Kulmala, M., Machado, L. A., Artaxo, P., Andreae, M. O., Petäjä, T., and Martin, S. T.: Amazon boundary layer aerosol concentration sustained by vertical transport Nature, 539, 416–419, https://doi.org/10.1038/nature19819, 2016.
Wang, D., Giangrande, S. E., Bartholomew, M. J., Hardin, J., Feng, Z., Thalman, R., and Machado, L. A. T.: The Green Ocean: precipitation insights from the GoAmazon2014/5 experiment, Atmos. Chem. Phys., 18, 9121–9145, https://doi.org/10.5194/acp-18-9121-2018, 2018.
Wang, D., Giangrande, S. E., Schiro, K., Jensen, M. P., and Houze, R. A.: The characteristics of tropical and midlatitude mesoscale convective systems as revealed by radar wind profilers, J. Geophys. Res.-Atmos., 124, 4601–4619, https://doi.org/10.1029/2018JD030087, 2019.
Wang, D., Giangrande, S. E., Feng, Z., Hardin, J. C., and Prein, A. F.: Updraft and Downdraft Core Size and Intensity as Revealed by Radar Wind Profilers: MCS Observations and Idealized Model Comparisons, J. Geophys. Res.-Atmos., 125, e2019JD031774, https://doi.org/10.1029/2019JD031774, 2020.
Williams, M. and Houze, R. A.: Satellite-observed characteristics of winter monsoon cloud clusters, Mon. Weather Rev., 115, 505–519, 1987.
Williams, E., Rosenfeld, D., Madden, N., Gerlach, J., Gears, N., Atkinson, L., Dunnemann, N., Frostrom, G., Antonio, M., Biazon, B., Camargo, R., Franca, H., Gomes, A., Lima, M., Machado, R., Manhaes, S., Nachtigall, L., Piva, H., Quintiliano, W., Machado, L., Artaxo, P., Roberts, G., Renno, N., Blakeslee, R., Bailey, J., Boccippio, D., Betts, A., Wolff, D., Roy, B., Halverson, J., Rickenbach, T., Fuentes, J., and Avelino, E.: Contrasting convective regimes over the Amazon: Implications for cloud electrification, J. Geophys. Res., 107, 8082, https://doi.org/10.1029/2001JD000380, 2002.
Yin, L., Fu, R., Shevliakova, E., and Dickinson, R.: How well can CMIP5 simulate precipitation and its controlling processes over tropical South America?, Clim. Dynam., 41, 3127–3143, https://doi.org/10.1007/s00382-012-1582-y, 2013.
Yuter, S. E. and Houze, R. A.: Three-dimensional kinematic and microphysical evolution of Florida cumulonimbus, Part II: Frequency distribution of vertical velocity, reflectivity, and differential reflectivity, Mon. Weather Rev., 123, 1941–1963, 1995.
- Abstract
- Introduction
- Dataset and methods
- Composite seasonal thermodynamic and diurnal conditions
- Regime-based Amazon storm life cycle, precipitation, and draft comparisons
- Summary of key findings
- Appendix A: Stochastic parcel model formulation
- Code and data availability
- Author contributions
- Competing interests
- Disclaimer
- Acknowledgements
- Financial support
- Review statement
- References