the Creative Commons Attribution 4.0 License.
the Creative Commons Attribution 4.0 License.
 | 10 May 2023
Toward a versatile spaceborne architecture for immediate monitoring of the global methane pledge
Yuchen Wang
Xvli Guo
Yajie Huo
Mengying Li
Yuqing Pan
Alexander Baklanov
Daniel Rosenfeld
John H. Seinfeld
Pengfei Li
The global methane pledge paves a fresh, critical way toward carbon neutrality. However, it remains largely invisible and highly controversial due to the fact that planet-scale and plant-level methane retrievals have rarely been coordinated. This has never been more essential within the narrow window to reach the Paris target. Here we present a two-tiered spaceborne architecture to address this issue. Using this framework, we focused on the United States, China, the Middle East, and North Africa, and simultaneously uncovered methane-abundant regions and plumes. These include new super-emitters, potential leakages, and unprecedented multiple plumes in a single source. More importantly, this framework is shown to challenge official emission reports that possibly mislead estimates from global, regional, and site scales, particularly by missing super-emitters. Our results show that, in principle, the above framework can be extended to be multi-tiered by adding upcoming stereoscopic measurements and suitable artificial intelligence, and thus it is sufficiently versatile for immediate and future monitoring of the global methane pledge.
- Article
(3260 KB) - Full-text XML
-
Supplement
(2405 KB) - BibTeX
- EndNote


Global methane pledges finalized at the COP26 (the 26th United Nations Climate Change Conference of the Parties) have been never more ambitious (Schellnhuber et al., 2016; Schurer et al., 2018; United Nations, 2021). More than 100 countries have promised 30 % methane emission reductions by 2030. Also, energy giants (e.g., Shell and BP) have committed to clear targets of methane mitigation. Such pledges have never been more essential within the narrow window (< 10 years) to reach the Paris target. The scientific context is that atmospheric methane is a powerful greenhouse gas second only to carbon dioxide (CO2), trapping ∼80 times more heat than the same amount of CO2 (per molecule) over a 20-year time horizon (Etminan et al., 2016; Saunois et al., 2016, 2020). Worse still, it has been rising since 2007 (Mikaloff and Hinrich, 2019), with a surge in 2014 (Nisbet et al., 2019) and a record high in 2021 (National Oceanic and Atmospheric Administration, 2022). Fortunately, methane is short-lived (∼ 10 years) (Shoemaker et al., 2013), and particularly that from human activities can be reduced in half using existing technologies by 2030 (Ocko et al., 2021).
However, a classic dilemma emerges, dimming the hopes of scientists and policymakers (Masood and Tollefson, 2021). That is, on the eve of the Paris target, large uncertainties in emissions remain, and thus hinder effective mitigation. The main issue is the Paris framework relies on countries or corporate giants to report emissions (Allen et al., 2015; Alvarez, 2018; Ganesan et al., 2019). Moreover, the reports are based on indirect statistics, such as oil and gas (O&G) inventories, rather than direct measurements (Deng et al., 2022). This leads to a broad consensus that prominent discrepancies exist between the reports. For example, field campaigns report nearly double official claims of methane emissions in the United States by detecting leak detection (Alvarez, 2018).
To this end, widespread super-emitters present a unique opportunity worldwide (Duren et al., 2019; Lauvaux et al., 2022; Pandey et al., 2019; Zavala-Araiza et al., 2015, 2017). Super-emitters can generally be defined as emission sources that comprise highly concentrated methane plumes and dominate localized methane budgets ( km2). In contrast to region-scale hotspots (or area sources), they can be attributed to individual facilities (e.g., factories, chimneys, and pipelines), typically with dimensions varying from several meters to tens of meters depending on monitoring instruments. Super-emitters are typically responsible for the underestimates of methane emissions (Alvarez et al., 2018; Duren et al., 2019; Irakulis-Loitxate et al., 2021; Lauvaux et al., 2022; Thompson et al., 2016). Moreover, there is increasing evidence that methane emissions follow a heavy-tailed distribution (Duren et al., 2019; Frankenberg et al., 2016; Lauvaux et al., 2022), for which a relatively small number of sources (so-called super-emitters) can account for a disproportionately large share of total emissions. In contrast to area sources (e.g., cities), super-emitters are typically coal mines, wells, gathering stations, storage tanks, pipelines, and flares, with diameters on the order of dozens of meters or less, but generating plumes of highly concentrated methane (Allen et al., 2013; Miller et al., 2019; Subramanian et al., 2015; Varon et al., 2019). We thus anticipate that significant emission mitigation could be achieved by deploying well-designed systems to identify methane super-emitters. For instance, in support of the Paris Agreement, the 17th World Meteorological Congress (2015) requested an Integrated Global Greenhouse Gas Information System (IG3IS) that aimed to develop a measurement framework for methane emission reductions (Phil DeCola and WMO Secretariat, 2017).
To date, a large body of field measurements (e.g., in situ and aircraft surveys) between 2012 and 2020 has been designed for methane super-emitters. Despite this, they are spatially limited (e.g., regionally) and temporally infrequent (e.g., a few weeks), missing many methane super-emitters (Alvarez, 2018; Conley et al., 2016; Duren et al., 2019; Marchese et al., 2015; Nisbet et al., 2020; Smith et al., 2017; Thompson et al., 2016; Thorpe et al., 2016). Today, substantial advances have been made towards detecting and quantifying methane super-emitters from space (Cusworth et al., 2019; Hu et al., 2018; Irakulis-Loitxate et al., 2021; Jacob et al., 2016; Pandey et al., 2019; Thompson et al., 2016) (Table 1). Such advances, however, have rarely been expanded to measure the global methane pledge because wide swaths and high-resolution sampling have not been simultaneously available. Recently, global methane monitoring has become possible. A flagship satellite mission is the TROPOspheric Monitoring Instrument (TROPOMI) onboard the Copernicus Sentinel-5 Precursor satellite (Lauvaux et al., 2022; Veefkind et al., 2012). It provides daily global methane columns, with a large swath width of ∼2600 km, a moderate resolution of 7.0×5.5 km2 (since August 2019), and a high signal-to-noise ratio. However, its relatively coarse spatial sampling still limits its application to detect methane super-emitters (Lauvaux et al., 2022). Next-generation satellite missions, pioneered by the GHGSat constellation (three satellites at the moment), have emerged for mapping methane super-emitters (Cusworth et al., 2019), with a narrow swath (e.g., ∼12 km) but a ground-breaking high-resolution spatial sampling (e.g., 25–50 m) (Jervis et al., 2021; Varon et al., 2020). Complementary to the GHGSat constellation, satellite-based hyperspectral imager spectrometers, such as PRISMA, GF-5, ZY1, Sentinel-2, and Worldview-3, have shown great potential (Guanter et al., 2021; Irakulis-Loitxate et al., 2021; Sánchez-García et al., 2022; Varon et al., 2021). They can resolve methane enhancements and attribute them to specific infrastructures via similar narrow swaths and high-resolution sampling (e.g., 30 m). Note that the regions these satellites usually observed are already known to contain methane super-emitters. Narrow swath coverage thus remains a crucial limitation for global surveys of methane super-emitters. Collectively, existing studies still struggle to survey global methane super-emitters due to the fact that individual satellite missions, such as TROPOMI or PRISMA, do not both have a wide swath and high-resolution sampling.

To address this issue, we present a two-tiered, space-based framework that coordinates TROPOMI and PRISMA for both planet-scale and plant-level methane retrievals. The key is that ready-made satellite missions alone have the potential to initiate immediate monitoring of the global methane pledge. Using this framework, we focused on China, the United States, Iraq, Kuwait, and Algeria and reveal both region-scale hotspots and plant-level super-emitters. We also monitored a single source to map multiple plumes and to look for possible methane leaks. These results can challenge national reports that possibly miss unexpected super-emitters or mislead emission magnitude. On the eve of the Paris target, at least while a global methane monitoring network is not in place, the two-tiered satellite constellation presented in this study has great potential for measuring progress towards global methane pledges.
2.1 Two-tiered satellite constellation
The two-tiered satellite constellation is designed to reconcile global-scale and high-resolution methane monitoring. First, TROPOMI offers a unique potential for global methane monitoring due to its large swath (i.e., ∼2600 km), daily revisit time, moderate footprint (i.e., 5.5×7 km2 since August 2019), and excellent sounding precision and accuracy (i.e., <1 %) (Veefkind et al., 2012). TROPOMI observes approximately a full swath per second, resulting in ∼ 216 spectra per second. This instrument comprises two spectrometer modules, the first consisting of near-infrared (NIR) spectral channels, and the second dedicated to the shortwave-infrared (SWIR) spectral channel. The NIR and SWIR channels are equipped with spectral resolutions of 0.38 and 0.25 nm and spectral sampling ratios of 2.8 and 2.5, respectively. Since the NIR and SWIR detectors are incorporated in different instrument modules, the NIR spectra will be co-registered with the SWIR spectra before performing methane retrievals. The methane total column-averaged dry-air mole fraction (XCH4) is retrieved from near-infrared (NIR) (757–774 nm) and shortwave-infrared (SWIR) (2305–2385 nm) spectral measurements for sunlight backscattered by Earth's surface and atmosphere (Hu et al., 2018). In this study, only high-quality measurements, retrieved under cloud-free and low aerosol load conditions, are used. These measurements are filtered, in addition, for solar zenith angle (< 70∘), low viewing zenith angle (< 60∘), and smooth topography (the surface elevation of < 80 m within 5 km radius) as described in Hu et al. (2018).
Hyperspectral satellite missions serve as the second tier, responsible for mapping localized methane super-emitters due to their unprecedented resolution (i.e., 3–50 m). Therein PRISMA, as an open-access representative, is specifically suitable for this work. It can image the solar radiation reflected by the Earth's surface and atmosphere via hundreds of spectral channels between the visible and SWIR spectrum (∼400–2500 nm). Measurements in the SWIR spectrum from 2000 to 2500 nm sample absorption features from water vapor, carbon dioxide, and methane. Therein, the 2100 and 2450 nm windows are especially sensitive to methane. Furthermore, the signal-to-noise ratio is reported to be about 100 in the SWIR for a relatively dark vegetation pixel and increases up to above 200 for bright soil surfaces in oil and gas extraction sites. More importantly, it covers areas of 30×30 km2 with a 30 m spatial sampling.
We collect dozens of daily measurements from the two-tiered satellite constellation. These measurements experimentally map regional methane hotspots and localize methane super-emitters across the United States, China, the Middle East (Iraq and Kuwait), and North Africa (Algeria). The acquisitions are mostly taken between April 2020 and January 2022.
2.2 Two-tiered methane retrievals
In the first tier of our framework, we employ the operational TROPOMI methane products onboard the Sentinel 5 satellite. The target product is the column-averaged dry-air volume mixing ratio of methane (XCH4), which is retrieved simultaneously with scattering properties of the atmosphere. The operational retrieval algorithm is based on RemoTeC (Butz et al., 2009; Hasekamp and Butz, 2008), which is originally developed for CO2 and methane retrievals from GOSAT observations (Butz et al., 2011). It attempts to fit spectra observed by the TROPOMI-based NIR and SWIR channels. Its sensitivities to atmospheric scattering properties, atmospheric input data, and instrument calibration errors have been extensively evaluated (Sha et al., 2021; Verhoelst et al., 2021). As a result, the operational products are proved to be critically stable, with a convergence rate of 99 % and high significance as compared with both satellite-based (e.g., GOSAT) and ground-based (e.g., TCCON) measurements. The required accuracy and precision of < 1 % for the XCH4 product are met for clear-sky measurements over land surfaces and after appropriate filtering of difficult scenes. Moreover, the forward model error is less than 1 % for about 95 % of the valid retrievals. Model errors in the input profile of water do not influence the retrieval outcome noticeably. The methane product is expected to meet the requirements if errors in input profiles of pressure and temperature remain below 0.3 % and 2 K, respectively. Of all instrument calibration errors, the retrieval results are the most sensitive to an error in the instrument spectral response function of the shortwave infrared channel.
In the second tier of our framework, we apply the matched-filter algorithm to calculate per-pixel methane enhancements with respect to background levels based on the SWIR sample spectrum (i.e., the 2100–2450 nm window) onboard the PRISMA (Foote et al., 2020; Guanter et al., 2021; Irakulis-Loitxate et al., 2021). In theory, the retrieval method can depend on physically based or data-driven algorithms. The former aims to explicitly resolve the radiative transfer between the surface, the atmosphere, and the hyperspectral spectrometers. A key representative is the family of differential optical absorption spectroscopy (DOAS) methods (Cusworth et al., 2019, 2020, 2021b, a). The latter seeks a methane absorption spectrum across a hyperspectral image using statistical methods. It is commonly based on the matched-filter and the singular vector decomposition concepts. These methods are both widely applied and evaluated, especially for observations from instruments deployed on satellite (e.g., PRISMA, GF-5, and ZY-1) and airborne (e.g., AVIRIS and AVIRIS-NG) platforms (Cusworth et al., 2020; Foote et al., 2020; Guanter et al., 2021; Irakulis-Loitxate et al., 2021; Thompson et al., 2016; Thorpe et al., 2016). In this study, the data-driven retrieval based on the matched-filter concept is used. The main reason is that it can implicitly account for potential radiometric and spectral errors in satellite-based imaging spectroscopy. For instance, vertical striping is prevalent in hyperspectral measurements due to detector inhomogeneity, thus substantially degrading methane retrievals. The matched-filter algorithm focuses on the individual columns rather than the whole scene to resolve methane enhancements. This means that the methane enhancement per column is calculated separately (i.e., methane enhancements were calculated on a per-column basis). More explanations can be found in Guanter et al. (2021). Besides, the physically based method requires background concentrations that are difficult to determine around the super-emitters. In contrast, the data-driven method is independent of background levels and can directly seek methane enhancements. Finally, the data-driven method generally has a substantially superior computational efficiency compared to the physically-based method.
The matched-filter retrieval used here is similar to the one used by Thompson et al. (2016) for the Hyperion imaging spectrometer onboard the EO-1 satellite. The calculation process of methane enhancements (ΔXCH4, ppb) is as follows.
The x denotes the spectrum under analysis. The μ and Σ represent the mean background radiance and corresponding covariance, respectively. The μ and Σ represent the mean value and covariance of the background radiance, respectively. To avoid any contamination of the target spectrum into these background parameters, we estimate them with an iterative approach by removing all gas enhancement signals. More technical details are reported in previous studies (Foote et al., 2020). Note that, owing to the non-uniform response of individual detectors in PRISMA, enhancements are calculated based on per-column spectrums in order to consider different responses of across-track sensors to radiance. The t is the target spectrum that reflects the background radiance enhanced by the methane plume. It is generated by the element-wise multiplication of μ and k. This implicit parameter k represents a unit methane absorption spectrum derived from a look-up table simulated by the MODTRAN radiative transfer model. Similarly, the spectral convolution is also performed on a per-column basis.
In principle, it would be more difficult to detect methane enhancements in pixels over low-albedo surfaces. Although methane absorption is independent of albedo, the resulting signal in absolute radiance is weakened with decreasing surface albedo. A major measure to compensate for the albedo effect is to scale the target spectrum t by the pixel-specific albedo factor due to the fact that the Beer–Lambert absorption law depends on the initial radiance in the absence of the absorber. Here the pixel-specific scalar f is calculated based on the spectral average μ and the analysis spectrum x as follows:
ΔXCH4 is then scaled by this pixel-specific scalar (f) and thus normalized by the albedo term, similar to the per-pixel normalization in previous hyperspectral analysis (Kraut et al., 2005). The premise to launch the matched-filter algorithm is the accurate knowledge of the response of the instrument spectra to the methane absorption nature. To this end, the objective is to gain the best fit between the simulated and reference spectra. An initial step is thus conducted to update the spectral calibration for the channels within the 2100–2400 nm window, in which the channel wavelength center and width are updated for each across-track position in each scene. Other details are illustrated in previous attempts (Foote et al., 2020; Guanter et al., 2021; Irakulis-Loitxate et al., 2021).
2.3 Two-tiered attribution of methane hotspots and plumes
In the first tier of our framework, we apply visual inspection to identify methane hotspots using the TROPOMI-based methane retrievals. The transformation from visual inspection to automatic recognition would significantly advance long-term, global methane monitoring. However, no satisfactory set of criteria was found that could be suitable for this study. This was mainly because in localized regions methane budgets respond to the changes in not only super-emitters but also complex external factors (e.g., meteorology, topography, and background concentrations). Similar compromises are also adopted in previous studies. Therefore, automatic recognition enabled by artificial intelligence would play an essential role in a versatile spaceborne architecture for long-term, global methane monitoring (Ouerghi et al., 2021; Paoletti et al., 2018; Yang et al., 2018; Yu et al., 2017; Zhang et al., 2018).
Regarding the identified methane hotspots, we utilize a Boolean mask to select plume-influenced pixels downwind of the source. The background distribution (mean ± standard deviation) is defined by an upwind sample of the measured columns, in which the hourly wind field data come from the ERA5 reanalysis dataset produced by the European Centre for Medium-Range Weather Forecasts (ECMWF) (Hoffmann et al., 2019). We then sample the surrounding (5×5) pixels centered on each pixel and compare the corresponding distributions to the background distribution based on a Student's t test. Pixels with a distribution substantially higher than the background at a confidence level of 95 % are assigned to the plume. More details in the Boolean plume mask can be found in previous studies (Pandey et al., 2019; Varon et al., 2018).
Regarding the identified regional hotspots, we also apply visual inspection to search for plumes within their surrounding 30 km scales (i.e., corresponding to the swath width of PRISMA) in the second tier of our framework (Irakulis-Loitxate et al., 2021; Lauvaux et al., 2022; Van Damme et al., 2018; Varon et al., 2020). To date, it is still challenging to distinguish methane plumes in hyperspectral images using full physically based algorithms. The main cause is potential methane retrieval artifacts from hyperspectral satellites that are spatially correlated to surface features. Specifically, we manually search for methane enhancement pixels with gas-plume-like shapes, i.e., high methane enhancements progressively decreasing downwind. The resulting pixels are subsequently compared to the spectral radiance data at the 2300 nm absorption feature sensitive to low surface albedos. In this way, the fake positives due to specific surface features are prevented. On this basis, the candidate pixels are overlaid over simultaneous (i.e., hourly) wind fields and high-resolution imageries in individual scenes. They would be considered to be true plumes if they roughly align with simultaneous wind direction and originate from explicit infrastructure. Here the high-resolution satellite imagery is taken from the Google Map. The hourly wind field data also come from the ERA5 reanalysis dataset. Finally, we manually draw polygons to mask such resulting plumes. As preparation for plume emission quantification, we remove the background using the threshold of the median values of the scenes.
These satellite imageries allow us to categorize methane plumes within narrow spatial scales between 50 and 500 m2, such as O&G extraction platforms, storage tanks, and compressor stations. They even enable the attribution of plumes to specific emission ports in individual sources due to their very high resolution. Furthermore, we could name them based on points of interest in the Google Maps image. On this basis, such sources could be visually retrospected via long-term, high-resolution (i.e., 10 m) satellite images from the Sentinel-2 mission (Ehret et al., 2022; Varon et al., 2021). Their key details, like ages and statuses (e.g., active or inactive), are thus collected reliably. Note that regarding such information national reports are typically credible but inaccessible, particularly regarding global missions. In addition, it should be highlighted that in high source regions, such as megacities, there are likely super-emitters that are undetectable following our method. Other causes are discussed in uncertainty analysis in the Supplement.
2.4 Two-tiered quantification of methane emissions
In our framework, we calculate the total excess mass of methane in kilograms in the detected hotspots (in the first tier) and plumes (in the second tier) using the so-called integrated mass enhancement (IME) model (Frankenberg et al., 2016; Varon et al., 2018). To make conservative estimates, we define the background levels as the 10 % of the average methane concentrations in the TROPOMI-based and PRISMA-based scenes (Figs. 1b–g) (Frankenberg et al., 2016; Varon et al., 2018). On this basis, we eliminate the interferences from the background concentrations and calculate IMEs as the methane masses of the masked hotspots and plumes.
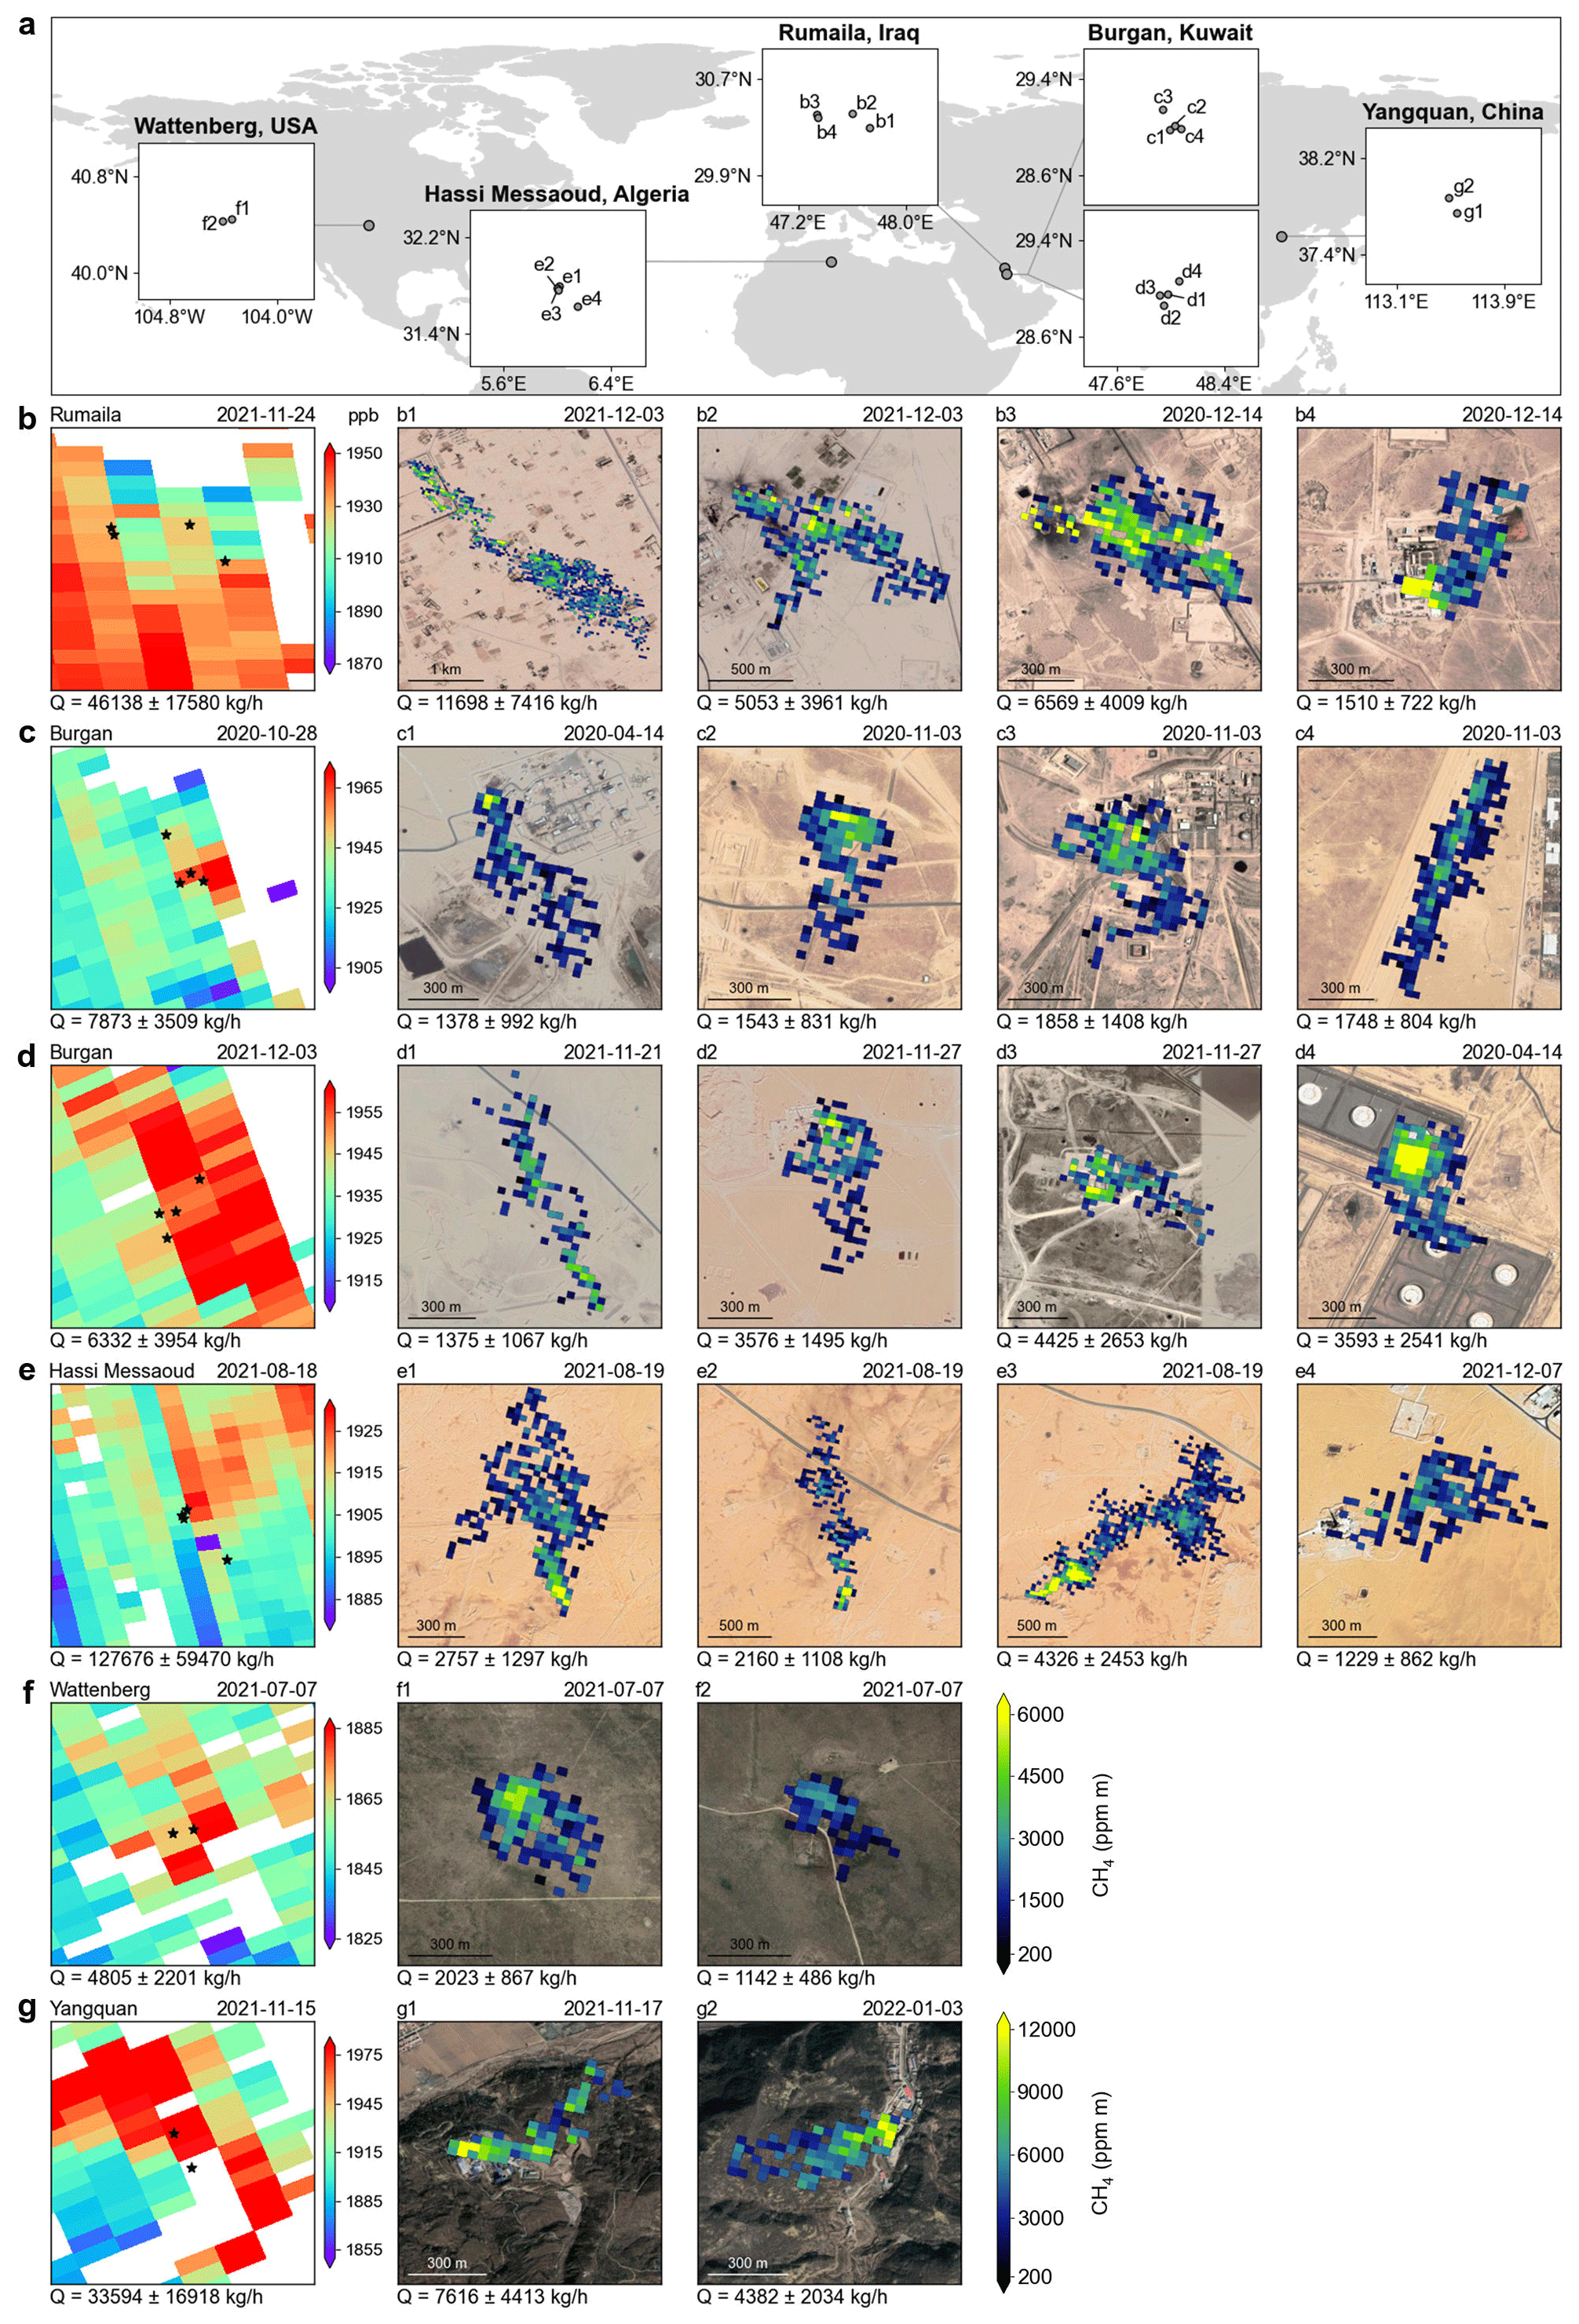
Figure 1Methane hotspots and associated super-emitters across the United States, China, Iraq, Kuwait, and Algeria via the two-tiered daily satellite constellation. (a) Methane-abundant regions and associated super-emitters are captured by TROPOMI and PRISMA, respectively. Their locations are marked by black rectangles and dots, respectively. Their names are obtained from Google Maps and are usually the names of the nearest O&G fields and coal mines. (b–g) Each row presents a methane-abundant region and the super-emitters detected within it (b1–b4, c1–c4, d1–d4, e1–e4, f1–f2, and g1–g2). For each super-emitter (five-pointed stars), the overpass moments of the two-tiered satellite constellation and the consequent emission estimate are presented. The base maps were obtained from © Google Maps. The second color bar for PRISMA is suitable for the super-emitters in China, while the first applies for other countries. Plume sources in the PRISMA results are marked by red circles.
Overall, this method links the emission rate (Q) with the measured IME via the residence time of methane (. This residence time relies on an effective wind speed (Ueff) and a characteristic plume size (L) as follows:
Specifically, the IME and L can be inferred from the observations of the hotspots or plumes. During this process, we carefully apply a Boolean plume mask that separates the pixels (i) with notable signals (ΔΩi) from background pixels and thus defines the total areas ( of the hotspots or plumes. The L is defined as the square root of the total plume areas. Hence, the IME is calculated as follows:
In the first tier of our framework, the effective wind speed (Ueff) is defined as the 10 m wind speed U10 obtained from the ERA5 reanalysis dataset. According to the detected hotspot, the value at the nearest hour and location are used.
In the second tier of our framework, we apply an ensemble of large eddy simulations (LESs) to establish an empirical, linear relationship between Ueff and the measured 10 m wind speed U10 as follows (Fig. S8)
The configurations of these simulations, such as spatial resolution and precision, are comparable to our PRISMA data. Other details in this methodology were described in Varon et al. (2018).
We estimate the uncertainties of Q by propagating the random errors in U10 and IME. This processes have been described in previous studies (Cusworth et al., 2019, 2021b; Irakulis-Loitxate et al., 2021). As shown in previous findings, the major error source come from the U10 term, which typically has a random error of 50 %. On this basis, this error is integrated quadratically with the standard error of the IME, the result of which can be treated as the final random error of Q. The intrinsic errors of the IME model are quantified in the following uncertainty analysis. As demonstrated in the Supplement, our comprehensive uncertainty analysis establishes the robustness of our estimates, with uncertainties being entirely controllable within a range of −70 % (Table S1 in the Supplement). Such uncertainties are also used and shown in Figs. 1–4.
2.5 Uncertainty analysis
The objective of this work is to promote a two-tiered satellite constellation that can monitor global methane pledges. To better understand the performance of our framework, we conduct comprehensive uncertainty analysis. Note that the protocol of the uncertainty analysis in our framework that we need to account for originates from previous studies (Irakulis-Loitxate et al., 2021; Varon et al., 2020). Specifically, we need to account for the uncertainties in the TROPOMI-based and PRISMA-based methane retrievals and subsequent emission estimates. Therein, the operational TROPOMI-based methane retrieval products have been evaluated strictly and have proven to be globally reliable (except in low- and high-albedo areas and snow-covered areas) (Lorente et al., 2021; Sha et al., 2021). In this work, we thus focus on three main sources of uncertainties, specifically including (1) uncertainties in the PRISMA-based methane retrievals, (2) uncertainties in the TROPOMI-based methane emission estimates, and (3) uncertainties in PRISMA-based methane emission estimates. During the analysis for the latter two uncertainty sources, we further investigate the potential wind impacts on the methane emission estimates. Note that it remains challenging to directly quantify the uncertainties in the wind fields across our cases due to the lack of measurements. We would thus assess the variations in the methane emission estimates driven by distinct wind data. From such analysis, we could confirm the reliable performance of our framework. Details can be found in Supplement.
The detection limit of this framework depends mainly on the TROPOMI-based and PRISMA-based methane retrievals, which have been thoroughly discussed in previous studies (Guanter et al., 2021; Hu et al., 2018). As the robust relationship between the “minimum source” and the related methane enhancement developed by Jacob et al. (2016) and Guanter et al. (2021) shows, the detection threshold for the TROPOMI instrument is 4000 kg h−1 with a wind speed of 5 km h−1. Following the same relationship for the PRISMA instrument, we estimate that a retrieval precision of 114 ppb (6.1 % with the assumed background concentration of 1850 ppb), such as in the case of the Hassi Messaoud site (Fig. S10e1), would lead to a detection limit of 800 kg h−1 for the same wind speed (analogous to the reported range of 500–900 kg h−1) (Guanter et al., 2021; Irakulis-Loitxate et al., 2021). Similar instruments and detection limits are generally comparable to emissions from anthropogenic sectors, like O&G and coal mines in this study or landfills, agriculture, and waste management in previous studies (Lauvaux et al., 2022; Maasakkers et al., 2023; Sadavarte et al., 2021). However, no conclusive evidence has so far shown that short-term (e.g., daily) satellite-based measurements with such detection limits can capture methane hotspots driven by natural sources (e.g., wetlands). In contrast, long-term (e.g., year-round) satellite-based measurements with much higher detection limits have shown potential for monitoring natural methane hotspots (Pandey et al., 2021).
3.1 Two-tiered imaging of global methane hotspots and super-emitters
Figure 1 presents representative sets of methane hotspots and associated super-emitters across the United States, China, the Middle East (Iraq and Kuwait), and North Africa (Algeria) via our two-tiered satellite constellation. Each group first clarifies a methane-abundant region and further focuses on explicit super-emitters. Among them, five methane-abundant regions are captured in Wattenberg (United States), Yangquan (China), Rumaila (Iraq), Burgan (Kuwait), and Hassi Messaoud (Algeria) (Fig. 1a and Table S1). These account for 4805–46 138 kg h−1 methane emissions based on our daily first-tiered (i.e., TROPOMI-based) monitoring. From the perspective of a state-of-the-art global methane emission inventory (i.e., EDGARv6.0), such high values rank among the top 1 % regarding emission intensities per unit area (km2) (Fig. S1) (Crippa et al., 2020). The Rumaila field, for example, is known as the largest oil field in Iraq (in terms of both reserves and yields). In this work, it is found to have a significant methane emission intensity exceeding 45 000 kg h−1 (Fig. 1b). Besides the well-known oil fields (Fig. 1c–f), methane hotspots have also emerged in developing coal mine fields, such as the Yangquan field, which exhibit comparable emission levels (> 30 000 kg h−1) (Fig. 1g).
We attribute these methane enhancements to specific methane plumes via the second-tiered (i.e., PRISMA-based) monitoring (Fig. 1b1–1g2). There are substantial variations in the methane plumes' amounts, types, and magnitudes, even in a single methane-abundant region. For instance, in the Burgan field, the second-tiered monitoring detects up to eight methane plumes in a handful of grids in the first-tiered monitoring (Fig. 1c1–1c4 and 1d1–1d4). Such intensive distributions are also found in previous region-oriented surveys in the Permian basin and California (Duren et al., 2019; Irakulis-Loitxate et al., 2021). Together with high-definition images (Fig. S2), we find that such plumes originate from various sources, such as flares, factories, and wells. A breakthrough is the capture of two distinctive plumes in an individual methane source with extremely high emissions (> 10 000 kg h−1), unprecedented in previous satellite-based exploration and only observable in aircraft surveys (Fig. 1b1). Such precise distinctions benefit from the high resolution of the second-tiered monitoring, despite being limited by the relatively higher detection threshold (∼ 800 kg h−1). Besides, factories and wells can also emit such evident plumes (Fig. 1c1, 1e1 and 1e2). By comparison, other plumes are typically more diffuse but with comparable emission magnitude (∼ 1000–7000 kg h−1).
Note that the above results represent only snapshots at the overpass moments of the satellites (i.e., TROPOMI and PRISMA) (Fig. 1). Specifically, for a given set (including both a methane-abundant region and associated super-emitters), the overpass timing of TROPOMI can be nearly concordant with that of PRISMA in some cases. For instance, within only 2 d (18 and 19 August 2021, 15 and 17 November 2021), our two-tiered satellite constellation goes through the Hassi Messaoud field and the Yangquan coal mine and provides in-depth views of methane budgets, including methane-abundant regions and their drivers (Fig. 1e and g). Even over just a single day (7 July 2021) our two-tiered satellite constellation not only uncovers methane enhancements in the Wattenberg field (Fig. 1f) but also tracks them back to explicit methane super-emitters (Fig. 1f1 and 1f2). As expected, if we extend the monitoring window of our framework to years, more methane super-emitters are subsequently captured (Fig. S3). Moreover, our framework uses this two-tiered satellite constellation to pave the way for routine monitoring of global methane hotspots and associated super-emitters.
3.2 Two-tiered verification of global methane super-emitters
Four unexpected cases occur in Burgan (Iraq), Hassi Messaoud (Algeria), and Yangquan (China) that are potentially explainable if we take mutual verification of the first- and second-tiered monitoring into consideration. First, an anomalous methane plume is detected in the Burgan field (Fig. 1c4) of high emission magnitude (> 1500 kg h−1), notably exceeding typical O&G facilities, from an elusive source (i.e., no clear source could be attributed) (Fig. S2). The long-term measurements of our two-tiered satellite constellation intermittently, rather than accidentally, observe this abnormal plume (Figs. S4). Furthermore, uncertainty analysis (see Sect. 2) helps to confirm this real plume. In particular, the methane plumes are clearly uncorrelated with the surface brightness from space (Fig. S4). Consequently, the most likely hypothesis for this super-emitter is methane leakage from gigantic O&G pipelines as shown in the Google Maps image (Fig. S2).
Second, we observe suspect trails of methane plumes above the storage tanks in the Burgan field (Fig. 1d4). Conceivably, the technical noise driven by albedo effects bore the brunt, although it is believed to be corrected reliably (See Materials and Methods). To this end, we apply a multi-spectral retrieval algorithm to eliminate this effect to a large extent. We utilize two spectral bands to launch the matched-filter algorithm separately: one that is highly sensitive to methane absorption (i.e., 2300 nm) and another that is much less sensitive (i.e., 1700 nm) but exhibits similar surface and aerosol reflectance properties. Figure S5 shows that the 2300 nm driven matched-filter algorithm results in noticeable methane vestiges above the storage tanks, while the 1700 nm driven algorithm does not. Consequently, we provide evidence that non-negligible methane emissions (> 3500 kg h−1) may very well be the only explanation, likely related to fugitive methane leaks from the storage tanks. This has previously only been seen in aircraft-based surveys (Frankenberg et al., 2016). Therefore, our two-tiered outcomes indicate there are more widespread methane leaks than have previously been detected. Note that the multi-spectral retrieval algorithm cannot completely remove the albedo effects in our results. However, our methods could lead to targeted on-site re-inspection of O&G fields worldwide.
Third, our framework detects a new methane super-emitter in the Hassi Messaoud field on 7 December 2021 (Fig. 1e4). By revisiting historical satellite images in the second-tiered monitoring (Fig. S6), we could confirm that this super-emitter arose between 18 October and 12 November 2021. These results indicate that monitoring of global methane super-emitters can attain monthly resolution via current satellite constellations alone. More satellites could capture changes during even shorter time windows. Fourth, a distinct methane plume appears in a coal mine in a mountainous area (in the Yangquan field, China), exceeding all of the detected O&G super-emitters regarding the emission rate (> 7000 kg h−1) (Fig. 1g1).
Figure 2 illustrates the extent to which the second tier of our two-tiered satellite constellation explains the regional budget detected by the first tier. Overall, the share of the regional budget due to the plumes ranges from 8.2 % (Hassi Messaoud) to 53.8 %–65.9 % (Rumaila, Burgan, and Wattenberg). Note that such contribution estimates might occasionally exceed 100 %, mainly owing to the different overpass time between the first- and second-tier monitoring. By comparison, the relatively low but still significant contributions in the Hassi Messaoud field (8.2 %) and Yangquan coal mine (35.7 %) are partly due to the technical limitation of our framework in detecting methane plumes on top of high background levels. Collectively, the heavy-tail law of methane plume distributions, previously reported for regional O&G fields (like the Permian Basin and California) (Duren et al., 2019; Irakulis-Loitxate et al., 2021), is possibly applicable worldwide. To further explore such a hypothesis, we extend the temporal sample window of our two-tiered framework. Using year-round snapshots in the second tier of our framework, we inspect the identified super-emitters (Fig. 1b–g) repeatedly and find more methane plumes, as expected (Fig. S3). This reinforces our hypothesis of the widespread occurrence of methane super-emitters.
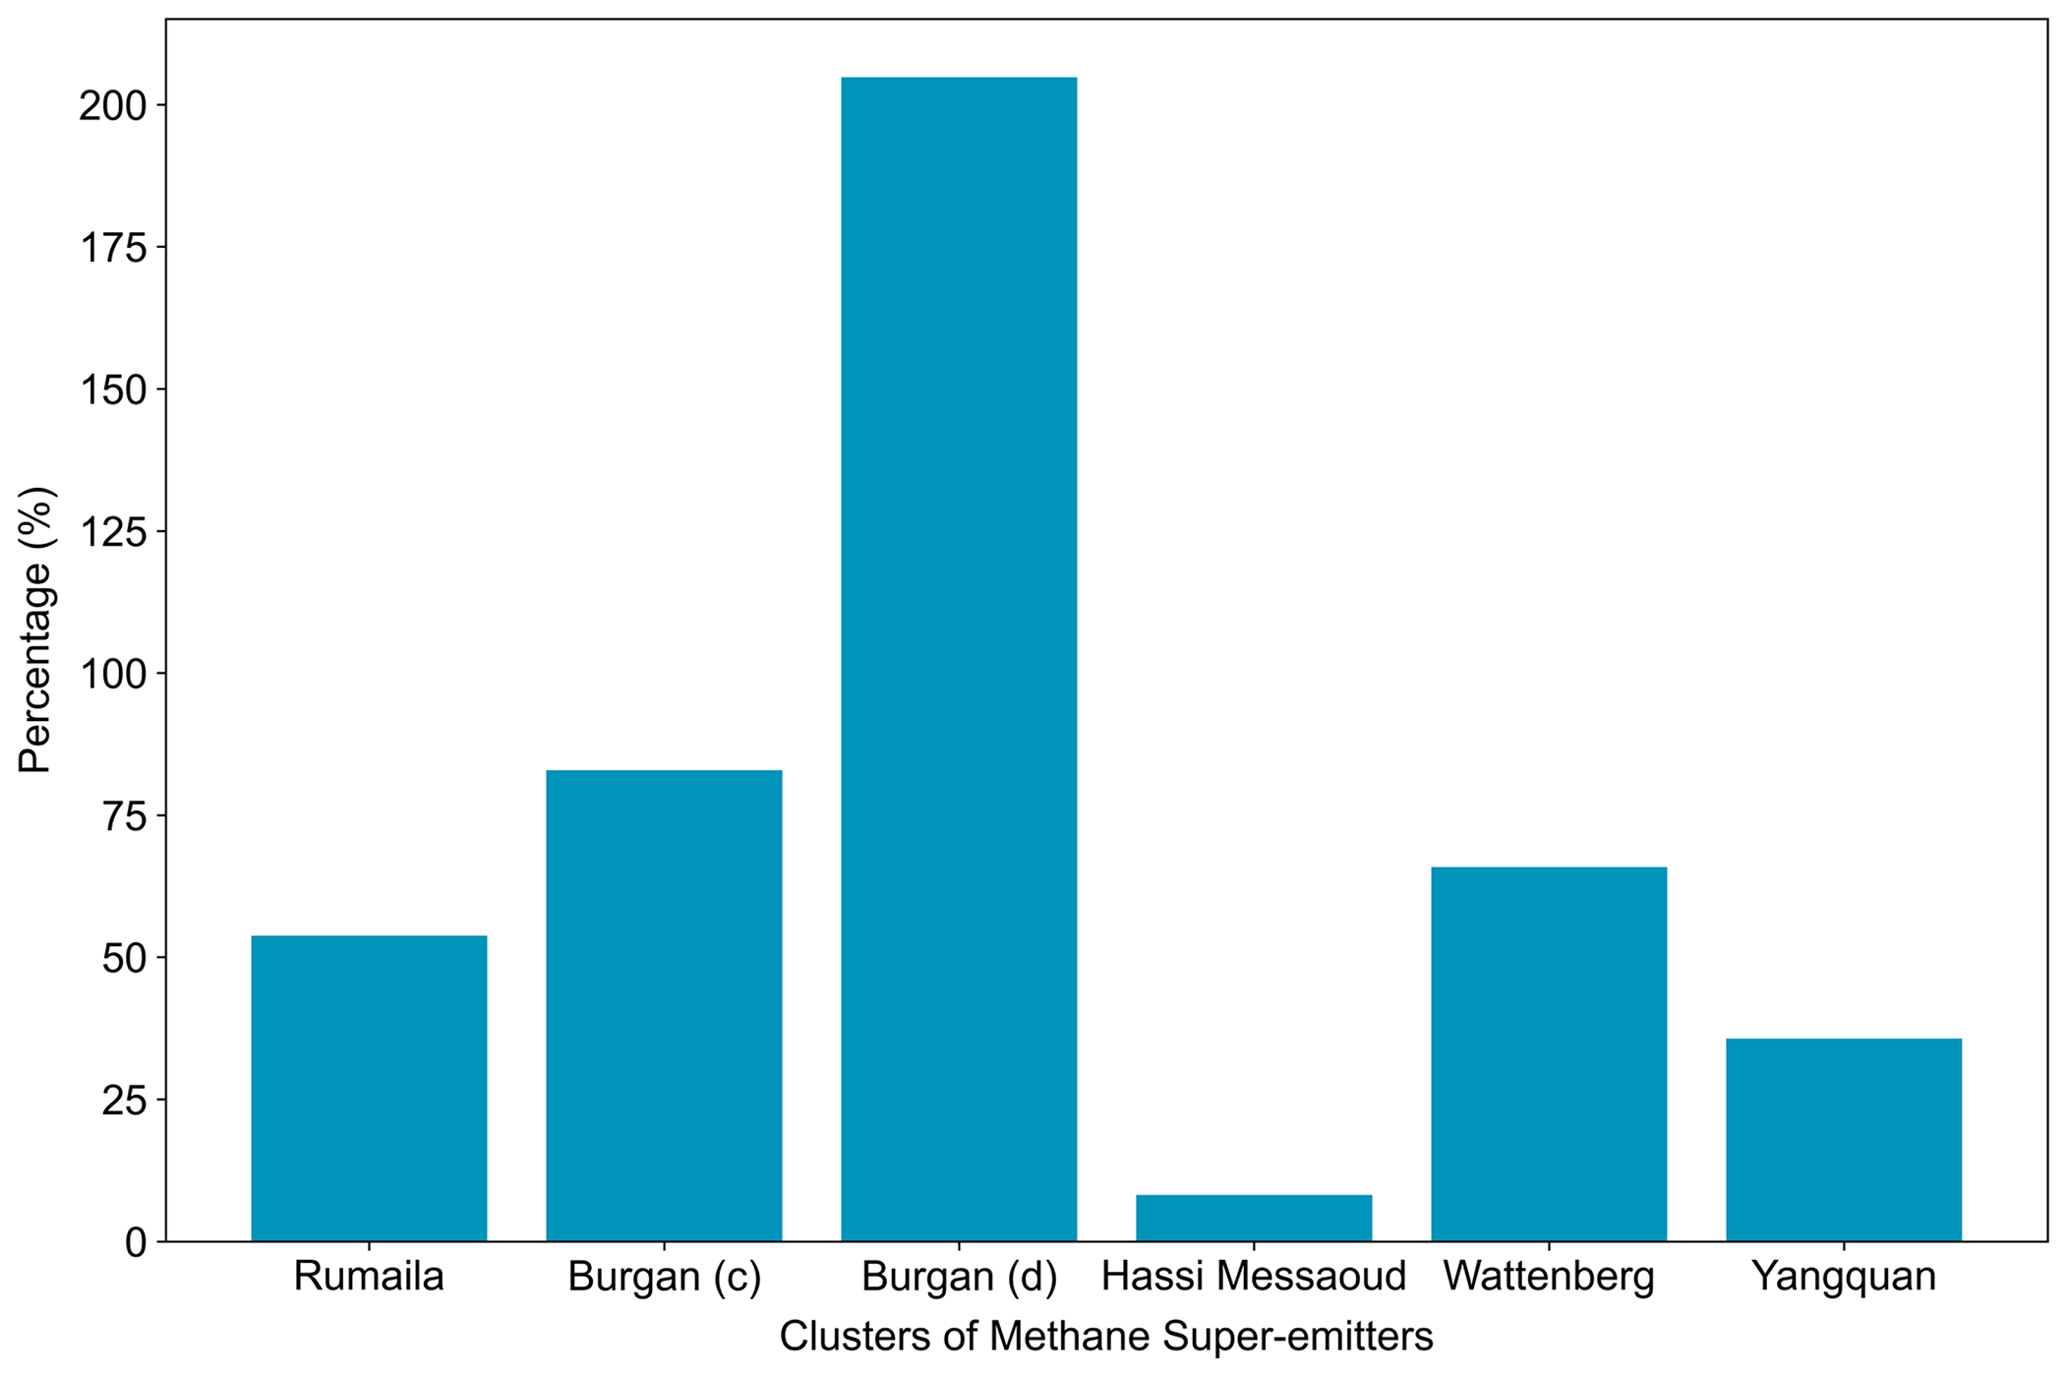
Figure 2High contributions of methane super-emitters to corresponding regional methane budgets.
Note that there are differences in the order of magnitude of the TROPOMI-based and PRISMA-based results. The main cause for this is that the TROPOMI-based and PRISMA-based results represent the methane emissions from different spatial scales. The former results represent region-scale methane budgets, while the latter ones resolve the emission magnitude from the individual methane super-emitter therein (Fig. 1). Although the latter results can explain a large fraction of the former (Fig. 2), the gaps remain mainly due to different overpass times between the two-tiered results or sources still missed by the PRISMA-based results. In other words, closing the temporal gaps between the two tiers or improving the detection ability of the second tier would help to reconcile the first- and second-tiered results.
A regional survey in a Californian field provides some useful data for evaluating our results owing to its utilization of systematic airborne measurements to detect and quantify methane super-emitters (Duren et al., 2019). The Californian survey aims to provide the first view of methane super-emitters across the state. This survey was conducted with the Next Generation Airborne Visible/Infrared Imaging Spectrometer (AVIRIS-NG), with 5 nm SWIR spectral sampling, 1.8 km view field, 3 m horizontal resolution, and 3 km cruise altitude, and it included five campaigns over several months from 2016 to 2018. Moreover, this instrument is unique due to its high signal-to-noise ratio and is capable of characterizing methane super-emitters with emissions as small as 2–10 kg h−1 for typical surface winds of 5 m s−1. The survey reports 1181 methane plumes, more than 500 times the number of plumes reported by previous aerial studies (Englander et al., 2018), with a median emission intensity of 170 kg h−1. These results are thus used to directly evaluate the outcomes in the second tier (Fig. 3). Even though some regions of interest in our study are far less well known than the Californian fields, their emission intensities are much higher. Specifically, the plumes detected by the second-tiered monitoring have emission intensities (1142–11 698 kg h−1) that exceed the median value in the Californian field.
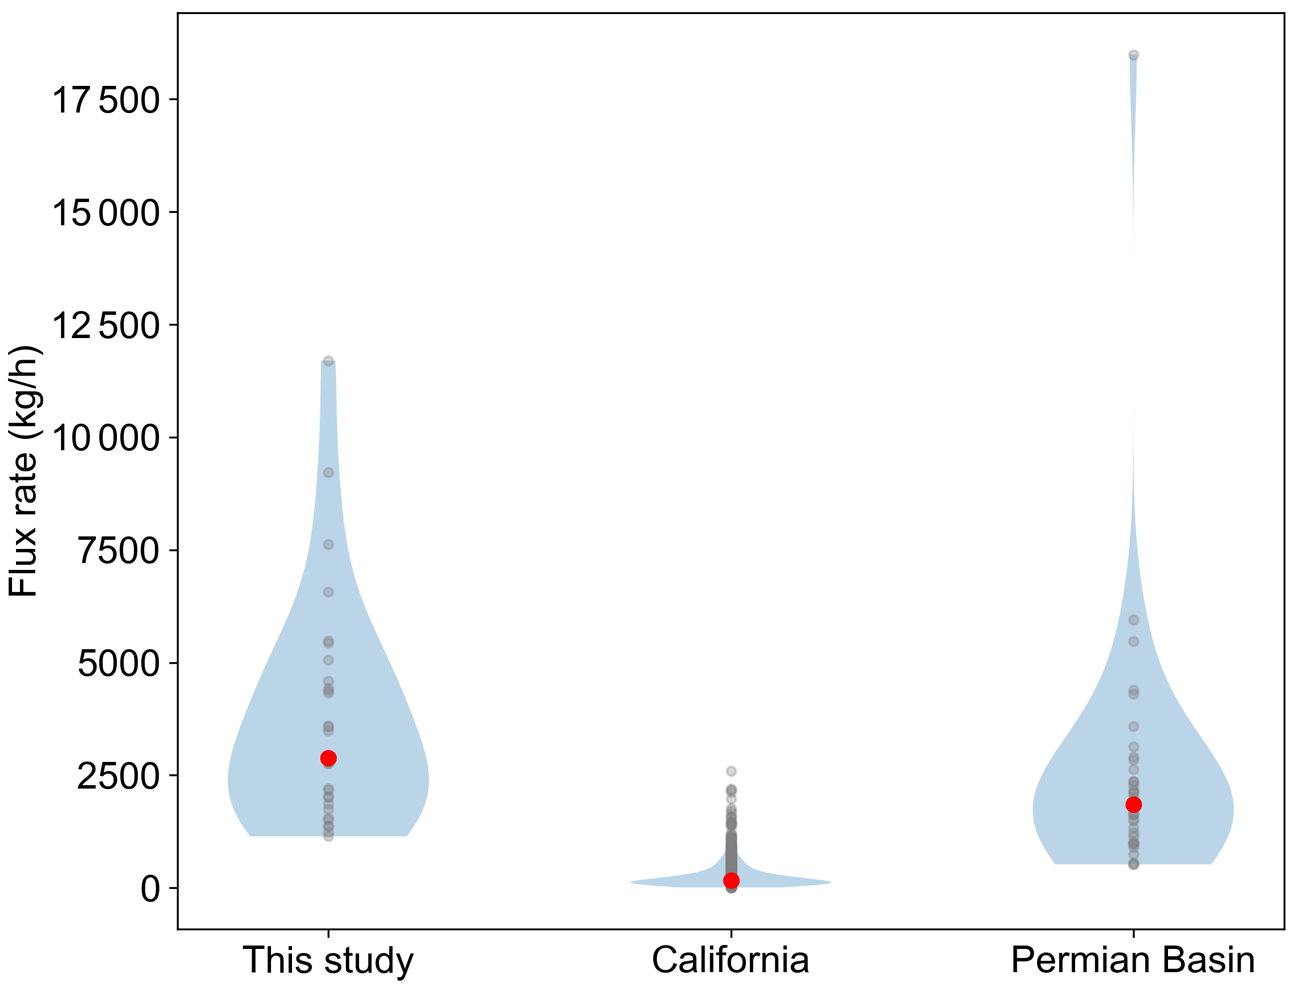
Figure 3Comparison of emission estimates of methane plumes between surveys. The surveys for the Californian field and Permian basin are selected as the references. They report 1181 and 39 methane plumes, while our second-tiered survey attempts 29 plumes. Violin plots show statistical distributions of methane plume emission rates for these surveys. For each survey, the gray dots refer to the emission rates of the individual plumes, while the red dot represents the median value. The shading represents the number distribution of the methane plumes with different emission rates.
Satellite observations taken over the Permian basin (one of the top O&G bases worldwide) from 2019 to 2020 (Irakulis-Loitxate et al., 2021) provide additional comparison data (Fig. 3). The Permian survey took advantage of imaging spectroscopy technologies to provide the first spaceborne region-scale and high-resolution survey of methane super-emitters in the Permian basin. This survey acquired 30 hyperspectral images from three satellite missions, including Gaofen-5, ZY1, and PRISMA, and focuses on an area of roughly 200×150 km2 in the Delaware sub-basin of the Permian basin within several days (mostly on four different dates: 15 May 2019, 1 November 2019, 29 December 2019, and 8 February 2020). More technical details about these two surveys can be found in previous studies (Duren et al., 2019; Irakulis-Loitxate et al., 2021). Compared to the surveys in the Californian field, those in the Permian basin reported a much higher number of strong methane super-emitters, and the median emission rates (1850 kg h−1) were much closer to ours (2888 kg h−1). Although collectively such comparisons are not quantitative due to many differences in measurement characteristics (e.g., spatial resolution and detection limit), they provide context for the emission magnitudes of the methane super-emitters we have identified and indicate that our results are within the range of values obtained from field campaigns. More importantly, these results highlight the urgent need for global monitoring of “nameless” O&G facilities that possibly emit as much methane as the Californian field and Permian basin.
3.3 Two-tiered challenges of national emission inventories
Comparing emissions from our two-tiered approach with a state-of-the-art methane emission inventory (EDGARv6.0) for 2018, (Fig. 4), we find that our emission estimates using TROPOMI data over methane hotspots are roughly consistent with the inventory, with biases ranging from −49.9 % to 91.8 %, with an average bias of 63.2 %. The exception is the Hassi Messaoud field in Algeria, where the O&G sector is in rapid development: here our estimate is 498.2 % of the EDGARv6.0 inventory. On the other hand, our estimates using PRISMA data over plumes are orders of magnitude greater than the EDGARv6.0 emissions. This suggests that traditional emission inventories may have acceptable performance for methane-abundant regions but may grossly underestimate emission from methane super-emitters.
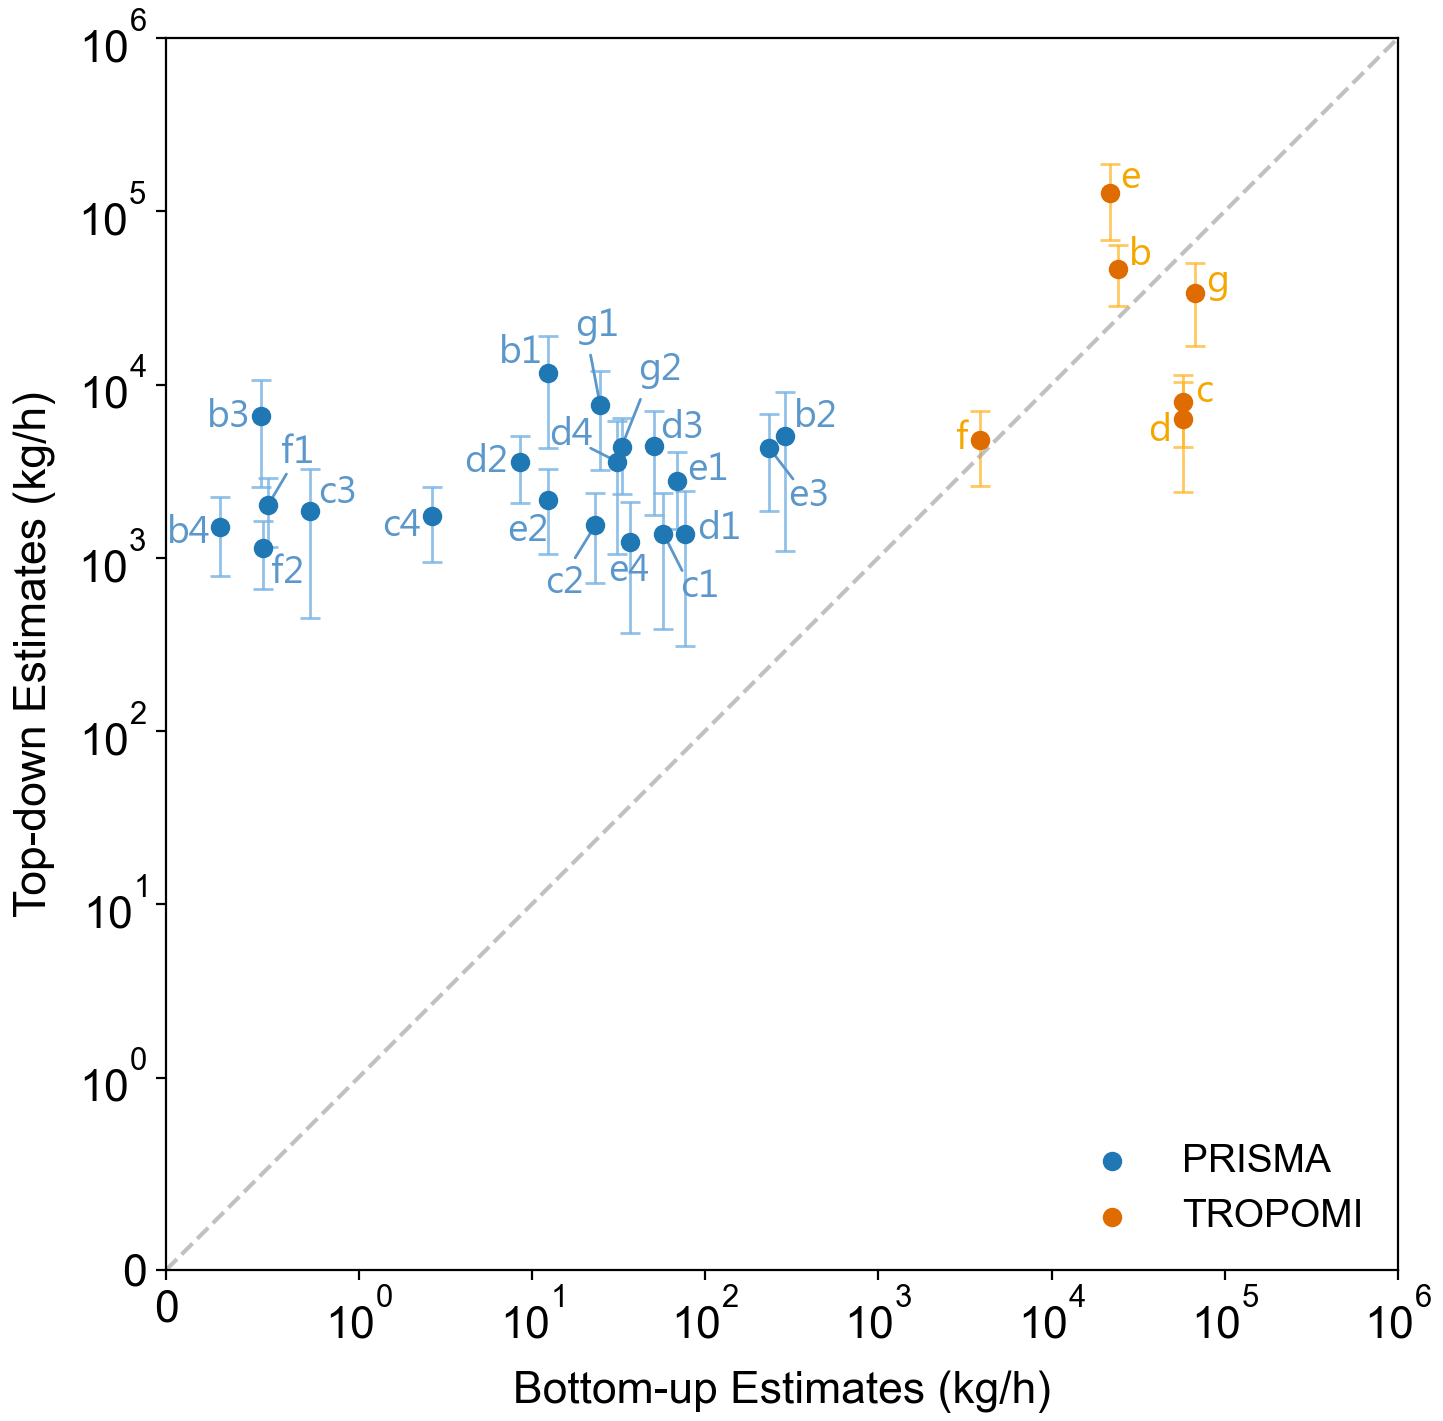
Figure 4Two-tiered emission estimates versus bottom-up emission inventories. We first interpolate the bottom-up emission inventories into the resolution consistent with our two-tiered results. On this basis, the bottom-up emission rates in the grids that the detected hotspots and plumes cover are summed up to compare with the results. The detected hotspots (yellow dots) and plumes (blue dots) correspond to those as shown in Fig. 1. The 1:1 line is shown by gray dashes.
There are a number of possible explanations for the low estimates from EDGARv6.0. First, to establish bottom-up methane emission inventories, we need to allocate area sources to regular grids based on spatial information, like nighttime lights (so-called spatial proxies) (Geng et al., 2017). Outdated spatial proxies might explain the large divergence between our plant-based estimates and the EDGARv6.0 (Figs. 1b1 and S7). Moreover, the EDGARv6.0 is designed for the year 2018, missing the newly established O&G plants with high methane emissions. Second, in principle, conventional inventories directly miss high emissions caused by abnormal operations (e.g., equipment failures) (Figs. 1c4 and S8) such as the O&G blowout (Pandey et al., 2019). Generally, because of technical difficulties or safety risks, we have to compromise to measure such abnormal emissions downwind rather than on sites. (Alvarez, 2018).
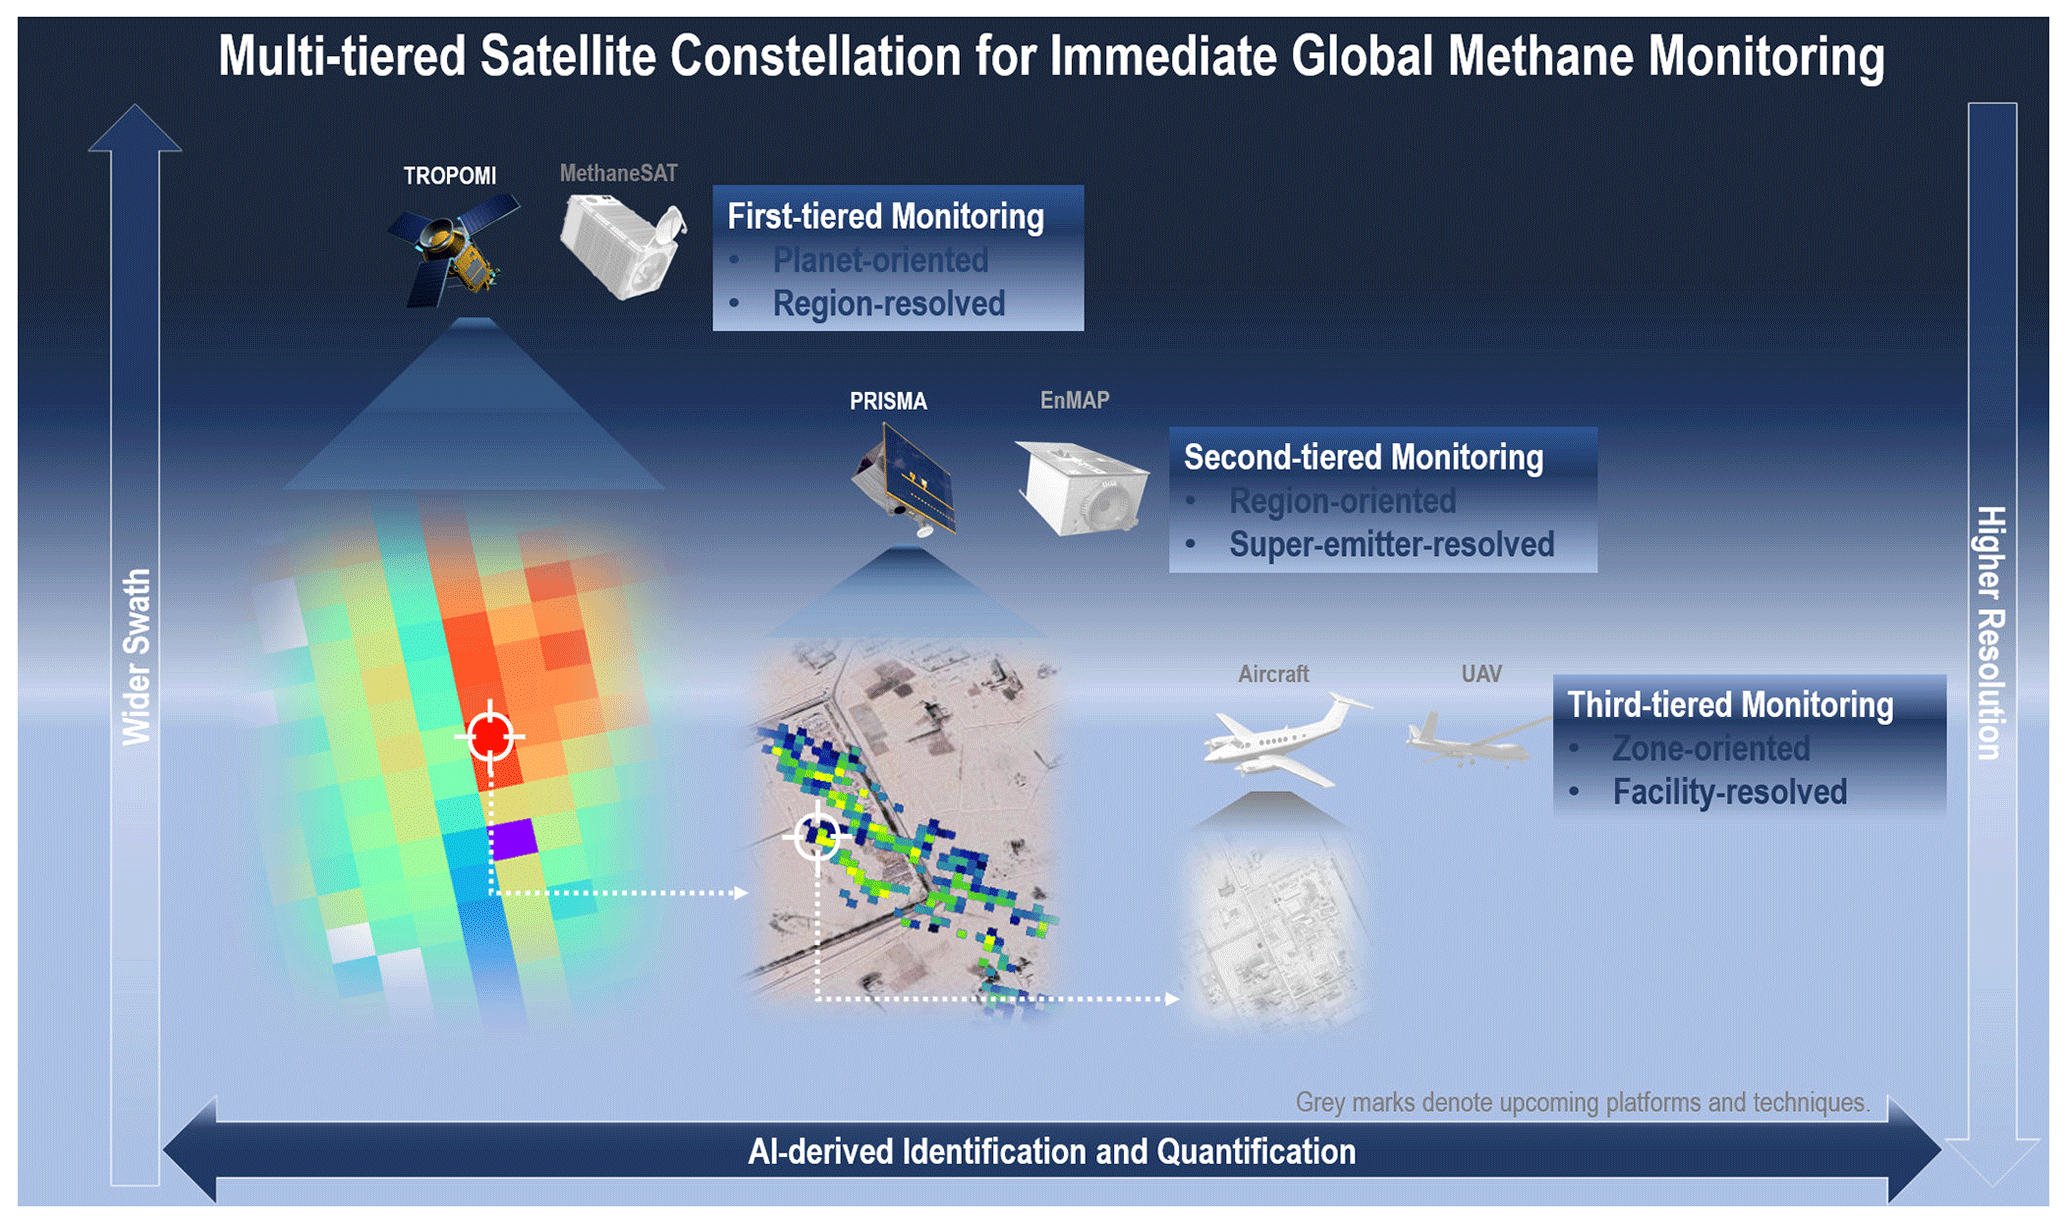
Figure 5Multi-tiered satellite framework for immediate global methane monitoring. The images of the TROPOMI, MethaneSAT, PRISMA, and EnMAP are obtained from http://www.tropomi.eu/ (last access: 8 May 2023), https://www.methanesat.org (last access: 8 May 2023), https://www.asi.it/en/earth-science/prisma/ (last access: 8 May 2023), and https://www.enmap.org/ (last access: 8 May 2023), respectively. The methane maps from the TROPOMI and PRISMA refer to the results in Fig. 1e1 and b1. The gray marks indicate upcoming platforms (i.e., MethaneSAT and EnMAP) and techniques (e.g., artificial intelligence techniques that can optimize the identification and quantification of methane super-emitters).
Third, the above divergence between our plant-based estimates and the EDGARv6.0 might also be explained by other causes, such as outdated emission factors. Empirically, a bottom-up inventory, once optimized by direct measurements, can raise total methane emissions by ∼ 60 %, although source categories can vary substantially (Alvarez, 2018). Besides, temporal variability might also explain top-down and bottom-up differences in methane emission estimates. For instance, the peak emission rate could exceed a point 40 % higher than the average, which might occur in the mid-afternoon due to specific processes, like episodic venting from manual liquid unloading (Vaughn et al., 2018). This aligns with the sampling time of the satellites, thus biassing bottom-up inventories. Collectively, it is necessary to carefully consider all factors affecting methane emissions, including emission factor updates and spatiotemporal variations, in order to develop effective strategies for mitigating methane emissions.
3.4 Implications for global methane monitoring
We have presented a two-tiered, space-based framework that can harmonize planet-scale and plant-level methane retrievals (Fig. 5). We have demonstrated this framework with examples from around the world, with synergistic, proactive detections in methane-abundant regions and methane super-emitters across the United States, China, the Middle East (Iraq and Kuwait), and North Africa (Algeria). We have located new methane super-emitters, tracked potential methane leakages from storage tanks, and resolved multiple methane plumes from a single source. Such achievements are mostly unprecedented in satellite surveys and only observed in aircraft campaigns. On this basis, our results suggest inventories miss unknown super-emitters and underestimate emission magnitudes, partly due to a surge in the number of oil and gas (O&G) facilities and widespread abnormalities in O&G operations. Our data prove that existing satellite missions can already lead to immediate, proactive monitoring of global methane pledges, in contrast to existing surveys that have to focus on a priori methane-abundant regions. While the window for achieving the Paris target is rapidly closing, our approach can provide improved methane emission estimates before the deployment of more advanced instruments, which can also be integrated into our system, like MethaneSAT and SBG in the United States, EnMAP in Germany, a new version of GF-5 in China, and, later, the European Space Agency's CHIME from 2025 to 2030 (Cusworth et al., 2019).
It should be noted that the multi-tiered framework is extremely flexible. (Fig. 5). First, it can harmonize multiple satellites. The potential representatives include upcoming official missions (e.g., the GF-5) (Irakulis-Loitxate et al., 2021), current private constellations (e.g., the GHGSat series) (Jervis et al., 2021; Varon et al., 2020), and multispectral products that can be explored (e.g., the Worldview-3 and Sentinel-2) (Sánchez-García et al., 2022). Second, the framework is not confined to satellites and can be expanded by integrating in situ (e.g., Global Atmosphere Watch Programme) (World Meteorological Organization, 2022), aircraft, and uncrewed aerial vehicle (UAV) data (Cusworth et al., 2020; Gålfalk et al., 2021; Tuzson et al., 2020). Note that such a multi-tiered framework based on multiple satellites, aircraft, and UAVs will provide greater spatial coverage and more frequent revisits. This flexibility will provide effective, efficient, and economic monitoring of global methane pledges, though this will require careful balancing of coverage and resolution between instruments. This will be the topic of our next study. Third, nighttime methane monitoring is important because abnormal leakages or pulses might also occur during nighttime (Plant et al., 2022; Poindexter et al., 2016). In these events, lidar instruments (e.g., MERLIN) (Ehret et al., 2017) can retrieve methane fluxes day and night at all latitudes, in all seasons, and in all weather conditions. Fourth, better characterizing methane vertical profiles would help to optimize our analysis by minimizing the uncertainties in tropospheric air mass factors and subsequent methane enhancements. Finally, rapid advances in artificial intelligence techniques can significantly speed up the detection of faint signals from methane enhancements and significantly optimize data-driven algorithms of methane emission estimates (Reichstein et al., 2019; Yuan et al., 2020). In principle, subsequent mitigation of such super-emitters via routine maintenances, leak detections, or emergent repairs can provide effective, efficient, and economic solutions toward the Paris target (Mayfield et al., 2017).
These outcomes have important ramifications for low- and middle-income countries. World powers, like the United States and European Union, lead new national methane pledges. They are separately on the way to creating vast operational infrastructures to monitor ambitious climate goals. Still, large gaps remain in coverage. This is especially true for low- and middle-income countries, where tight budgets dim the hopes for filling these gaps by 2030, while methane emissions are likely to rise as countries continue to develop. In this context, the present framework can serve as a cost-effective component of the global methane monitoring network and thus support fair climate negotiations between countries.
This framework harmonizes global-scale and high-resolution methane retrievals, with a dual focus on mapping region-scale and plant-level drivers. In this work, the framework reconciles the spacious swath of TROPOMI (i.e., ∼ 2600 km) with the high resolution of PRISMA (i.e., 30×30 m2), in contrast to conventional satellite-based surveys that were of either insufficient samplings or narrow views. Looking forward, developments in Earth's monitoring platforms (e.g., satellites, aircraft, and UAVs) and AI will continue to strengthen the performance of methane plume retrievals and emission estimates. On the eve of the Paris target, at least while a super methane satellite with spacious swath, high resolution, and agile analysis is not in place, our multi-tiered satellite constellation has important implications for measuring global methane pledges.
The code used in this paper is available upon request to the corresponding author.
The operational TROPOMI product is available at https://scihub.copernicus.eu/dhus/#/home (last access: 8 May 2023; ESA, 2023b), https://www.temis.nl/emissions/data.php (last access: 8 May 2023; ESA, 2023a). The PRISMA data are publicly available to registered users at https://prisma.asi.it/ (last access: 8 May 2023; WSO2 Identity Server, 2023). The WRF-CHEM model code is available at https://ruc.noaa.gov/wrf/wrf-chem/ (last access: 8 May 2023; NOAA, 2023). All Sentinel-2 satellite data are publicly available through the Copernicus Open Access Hub (ESA, 2023b). The HITRAN line spectra is publicly available through the HITRANonline database (https://hitran.org/lbl/, last access: 8 May 2023; Hitran online, 2023). The ERA5 data come from https://www.ecmwf.int/en/forecasts/datasets/reanalysis-datasets/era5 (last access: 8 May 2023; ECMWF, 2023). The EDGARv6.0 dataset comes from https://edgar.jrc.ec.europa.eu/gallery?release=v60ghg&substance=CH4§or=TOTALS (last access: 8 May 2023; European Commission, 2023).
The supplement related to this article is available online at: https://doi.org/10.5194/acp-23-5233-2023-supplement.
PL designed this study and wrote the manuscript. PL and YW developed the retrieval algorithm. PL, YW, XG, YH, and YP performed the data analysis. SY, AB, DR, and JHS contributed to the manuscript.
The contact author has declared that none of the authors has any competing interests.
Publisher's note: Copernicus Publications remains neutral with regard to jurisdictional claims in published maps and institutional affiliations.
We thank the ESA and the S-5P/TROPOMI team for their great work initiating and realizing the TROPOMI data. We also thank the Italian Space Agency for their great work on the PRISMA data.
This research has been supported by National Natural Science Foundation of China (grant nos. 22006030, 72361137007, 22076172, 21577126 and 41561144004), Science and Technology Program of Hebei Province (grant no. 22343702D), Science and Technology Project of Hebei Education Department (grant nos. BJ2020032 and QN2019184), Basic Scientific Research Foundation of Hebei (grant no. KY2021024), Initiation Fund of Hebei Agricultural University (grant nos. 412201904 and YJ201833), the Department of Science and Technology of China (grant nos. 2016YFC0202702, 2018YFC0213506 and 2018YFC0213503), and National Research Program for Key Issues in Air Pollution Control in China (grant no. DQGG0107).
This paper was edited by Eduardo Landulfo and reviewed by Karen Cady-Pereira and one anonymous referee.
Allen, D. T., Torres, V. M., Thomas, J., Sullivan, D. W., Harrison, M., Hendler, A., Herndon, S. C., Kolb, C. E., Fraser, M. P., Hill, A. D., Lamb, B. K., Miskimins, J., Sawyer, R. F., and Seinfeld, J. H.: Measurements of methane emissions at natural gas production sites in the United States, P. Natl. Acad. Sci. USA, 110, 17768–17773, https://doi.org/10.1073/pnas.1304880110, 2013.
Allen, F., Gokul, I., Leon, C., James, E., Nathan, H., Haewon, M., Joeri, R., Reed, S., Jameel, A., R., A. G., Jared, C., Minji, J., James, M., Anupriya, M., and Wenjing, S.: Can Paris pledges avert severe climate change?, Science, 80, 1168–1169, https://doi.org/10.1126/science.aad5761, 2015.
Alvarez, R. A.: Assessment of methane emissions from the U.S. oil and gas supply chain, Science, 80, 186–188, https://doi.org/10.1126/science.aar7204, 2018.
Alvarez, R. A., Zavala-Araiza, D., Lyon, D. R., Allen, D. T., Barkley, Z. R., Brandt, A. R., Davis, K. J., Herndon, S. C., Jacob, D. J., and Karion, A.: Assessment of methane emissions from the US oil and gas supply chain, Science, 80, 186–188, 2018.
Butz, A., Hasekamp, O. P., Frankenberg, C., and Aben, I.: Retrievals of atmospheric CO2 from simulated space-borne measurements of backscattered near-infrared sunlight: accounting for aerosol effects, Appl. Opt., 48, 3322–3336, https://doi.org/10.1364/AO.48.003322, 2009.
Butz, A., Guerlet, S., Hasekamp, O., Schepers, D., Galli, A., Aben, I., Frankenberg, C., Hartmann, J.-M., Tran, H., Kuze, A., Keppel-Aleks, G., Toon, G., Wunch, D., Wennberg, P., Deutscher, N., Griffith, D., Macatangay, R., Messerschmidt, J., Notholt, J., and Warneke, T.: Toward accurate CO2 and CH4 observations from GOSAT, Geophys. Res. Lett., 38, 14812–14817, https://doi.org/10.1029/2011GL047888, 2011.
Butz, A., Galli, A., Hasekamp, O., Landgraf, J., Tol, P., and Aben, I.: TROPOMI aboard Sentinel-5 Precursor: Prospective performance of CH4 retrievals for aerosol and cirrus loaded atmospheres, Remote Sens. Environ., 120, 267–276, https://doi.org/10.1016/j.rse.2011.05.030, 2012.
Conley, S., Franco, G., Faloona, I., Blake, D. R., Peischl, J., and Ryerson, T. B.: Methane emissions from the 2015 Aliso Canyon blowout in Los Angeles, CA, Science, 80, 1317–1320, 2016.
Crippa, M., Solazzo, E., Huang, G., Guizzardi, D., Koffi, E., Muntean, M., Schieberle, C., Friedrich, R., and Janssens-Maenhout, G.: High resolution temporal profiles in the Emissions Database for Global Atmospheric Research, Sci. Data, 7, 121, https://doi.org/10.1038/s41597-020-0462-2, 2020.
Cusworth, D. H., Jacob, D. J., Varon, D. J., Chan Miller, C., Liu, X., Chance, K., Thorpe, A. K., Duren, R. M., Miller, C. E., Thompson, D. R., Frankenberg, C., Guanter, L., and Randles, C. A.: Potential of next-generation imaging spectrometers to detect and quantify methane point sources from space, Atmos. Meas. Tech., 12, 5655–5668, https://doi.org/10.5194/amt-12-5655-2019, 2019.
Cusworth, D. H., Duren, R. M., Yadav, V., Thorpe, A. K., Verhulst, K., Sander, S., Hopkins, F., Rafiq, T., and Miller, C. E.: Synthesis of Methane Observations Across Scales: Strategies for Deploying a Multitiered Observing Network, Geophys. Res. Lett., 47, e2020GL087869, https://doi.org/10.1029/2020GL087869, 2020.
Cusworth, D. H., Duren, R. M., Thorpe, A. K., Olson-Duvall, W., Heckler, J., Chapman, J. W., Eastwood, M. L., Helmlinger, M. C., Green, R. O., Asner, G. P., Dennison, P. E., and Miller, C. E.: Intermittency of Large Methane Emitters in the Permian Basin, Environ. Sci. Technol. Lett., 8, 567–573, https://doi.org/10.1021/acs.estlett.1c00173, 2021a.
Cusworth, D. H., Duren, R. M., Thorpe, A. K., Pandey, S., Maasakkers, J. D., Aben, I., Jervis, D., Varon, D. J., Jacob, D. J., and Randles, C. A.: Multisatellite Imaging of a Gas Well Blowout Enables Quantification of Total Methane Emissions, Geophys. Res. Lett., 48, e2020GL090864, https://doi.org/10.1029/2020GL090864, 2021b.
Deng, Z., Ciais, P., Tzompa-Sosa, Z. A., Saunois, M., Qiu, C., Tan, C., Sun, T., Ke, P., Cui, Y., Tanaka, K., Lin, X., Thompson, R. L., Tian, H., Yao, Y., Huang, Y., Lauerwald, R., Jain, A. K., Xu, X., Bastos, A., Sitch, S., Palmer, P. I., Lauvaux, T., d'Aspremont, A., Giron, C., Benoit, A., Poulter, B., Chang, J., Petrescu, A. M. R., Davis, S. J., Liu, Z., Grassi, G., Albergel, C., Tubiello, F. N., Perugini, L., Peters, W., and Chevallier, F.: Comparing national greenhouse gas budgets reported in UNFCCC inventories against atmospheric inversions, Earth Syst. Sci. Data, 14, 1639–1675, https://doi.org/10.5194/essd-14-1639-2022, 2022.
Duren, R. M., Thorpe, A. K., Foster, K. T., Rafiq, T., Hopkins, F. M., Yadav, V., Bue, B. D., Thompson, D. R., Conley, S., and Colombi, N. K.: California's methane super-emitters, Nature, 575, 180–184, 2019.
ECMWF: Datasets, ECMWF [data set], https://www.ecmwf.int/en/forecasts/datasets/reanalysis-datasets/era5 (last access: 8 May 2023), 2023.
Ehret, G., Bousquet, P., Pierangelo, C., Alpers, M., Millet, B., Abshire, J. B., Bovensmann, H., Burrows, J. P., Chevallier, F., Ciais, P., Crevoisier, C., Fix, A., Flamant, P., Frankenberg, C., Gibert, F., Heim, B., Heimann, M., Houweling, S., Hubberten, H. W., Jöckel, P., Law, K., Löw, A., Marshall, J., Agusti-Panareda, A., Payan, S., Prigent, C., Rairoux, P., Sachs, T., Scholze, M., and Wirth, M.: MERLIN: A French-German Space Lidar Mission Dedicated to Atmospheric Methane, Remote Sens., 9, 1052–1080, https://doi.org/10.3390/rs9101052, 2017.
Ehret, T., De Truchis, A., Mazzolini, M., Morel, J.-M., d'Aspremont, A., Lauvaux, T., Duren, R., Cusworth, D., and Facciolo, G.: Global Tracking and Quantification of Oil and Gas Methane Emissions from Recurrent Sentinel-2 Imagery, Environ. Sci. Technol., 56, 10517–10529, https://doi.org/10.1021/acs.est.1c08575, 2022.
EMIT: Earth Surface Mineral Dust Source Investigation (EMIT), https://earth.jpl.nasa.gov/emit/ (last access: 8 May 2023), 2023.
Englander, J. G., Brandt, A. R., Conley, S., Lyon, D. R., and Jackson, R. B.: Aerial Interyear Comparison and Quantification of Methane Emissions Persistence in the Bakken Formation of North Dakota, USA, Environ. Sci. Technol., 52, 8947–8953, https://doi.org/10.1021/acs.est.8b01665, 2018.
ESA: Select emission data area, ESA [data set], https://www.temis.nl/emissions/data.php (last access: 8 May 2023), 2023a.
ESA: Copernicus Open Access Hub, ESA [data set], https://scihub.copernicus.eu/dhus/#/home, last access: 8 May 2023b.
Etminan, M., Myhre, G., Highwood, E. J., and Shine, K. P.: Radiative forcing of carbon dioxide, methane, and nitrous oxide: A significant revision of the methane radiative forcing, Geophys. Res. Lett., 43, 12612–614623, https://doi.org/10.1002/2016GL071930, 2016.
European Commission: EDGAR – Emissions Database for Global Atmospheric Research, European Commission [data set], https://edgar.jrc.ec.europa.eu/gallery?release=v60ghg&substance=CH4§or=TOTALS (last access: 8 May 2023), 2023.
Foote, M. D., Dennison, P. E., Thorpe, A. K., Thompson, D. R., Jongaramrungruang, S., Frankenberg, C., and Joshi, S. C.: Fast and Accurate Retrieval of Methane Concentration From Imaging Spectrometer Data Using Sparsity Prior, IEEE Trans. Geosci. Remote Sens., 58, 6480–6492, https://doi.org/10.1109/TGRS.2020.2976888, 2020.
Frankenberg, C., Meirink, J. F., Bergamaschi, P., Goede, A. P. H., Heimann, M., Körner, S., Platt, U., van Weele, M., and Wagner, T.: Satellite chartography of atmospheric methane from SCIAMACHY on board ENVISAT: Analysis of the years 2003 and 2004, J. Geophys. Res.-Atmos., 111, 7303–7320, https://doi.org/10.1029/2005JD006235, 2006.
Frankenberg, C., Thorpe, A. K., Thompson, D. R., Hulley, G., Kort, E. A., Vance, N., Borchardt, J., Krings, T., Gerilowski, K., Sweeney, C., Conley, S., Bue, B. D., Aubrey, A. D., Hook, S., and Green, R. O.: Airborne methane remote measurements reveal heavy-tail flux distribution in Four Corners region, P. Natl. Acad. Sci. USA, 113, 9734–9739, https://doi.org/10.1073/pnas.1605617113, 2016.
Gålfalk, M., Nilsson Påledal, S., and Bastviken, D.: Sensitive Drone Mapping of Methane Emissions without the Need for Supplementary Ground-Based Measurements, ACS Earth Sp. Chem., 5, 2668–2676, https://doi.org/10.1021/acsearthspacechem.1c00106, 2021.
Ganesan, A. L., Schwietzke, S., Poulter, B., Arnold, T., Lan, X., Rigby, M., Vogel, F. R., van der Werf, G. R., Janssens-Maenhout, G., Boesch, H., Pandey, S., Manning, A. J., Jackson, R. B., Nisbet, E. G., and Manning, M. R.: Advancing Scientific Understanding of the Global Methane Budget in Support of the Paris Agreement, Global Biogeochem. Cy., 33, 1475–1512, https://doi.org/10.1029/2018GB006065, 2019.
Geng, G., Zhang, Q., Martin, R. V., Lin, J., Huo, H., Zheng, B., Wang, S., and He, K.: Impact of spatial proxies on the representation of bottom-up emission inventories: A satellite-based analysis, Atmos. Chem. Phys., 17, 4131–4145, https://doi.org/10.5194/acp-17-4131-2017, 2017.
Guanter, L., Irakulis-Loitxate, I., Gorroño, J., Sánchez-García, E., Cusworth, D. H., Varon, D. J., Cogliati, S., and Colombo, R.: Mapping methane point emissions with the PRISMA spaceborne imaging spectrometer, Remote Sens. Environ., 265, 112671, https://doi.org/10.1016/j.rse.2021.112671, 2021.
Hasekamp, O. P. and Butz, A.: Efficient calculation of intensity and polarization spectra in vertically inhomogeneous scattering and absorbing atmospheres, J. Geophys. Res.-Atmos., 113, 20309–20319, https://doi.org/10.1029/2008JD010379, 2008.
Hitran online: Line-by-Line Search, Hitran online [data set], https://hitran.org/lbl/, last access: 8 May 2023.
Hoffmann, L., Günther, G., Li, D., Stein, O., Wu, X., Griessbach, S., Heng, Y., Konopka, P., Müller, R., Vogel, B., and Wright, J. S.: From ERA-Interim to ERA5: the considerable impact of ECMWF's next-generation reanalysis on Lagrangian transport simulations, Atmos. Chem. Phys., 19, 3097–3124, https://doi.org/10.5194/acp-19-3097-2019, 2019.
Hu, H., Landgraf, J., Detmers, R., Borsdorff, T., Aan de Brugh, J., Aben, I., Butz, A., and Hasekamp, O.: Toward Global Mapping of Methane With TROPOMI: First Results and Intersatellite Comparison to GOSAT, Geophys. Res. Lett., 45, 3682–3689, https://doi.org/10.1002/2018GL077259, 2018.
Irakulis-Loitxate, I., Guanter, L., Liu, Y.-N., Varon, D. J., Maasakkers, J. D., Zhang, Y., Chulakadabba, A., Wofsy, S. C., Thorpe, A. K., Duren, R. M., Frankenberg, C., Lyon, D. R., Hmiel, B., Cusworth, D. H., Zhang, Y. G., Segl, K., Gorroño, J., Sánchez-García, E., Sulprizio, M. P., Cao, K., Zhu, H., Liang, J., Li, X., Aben, L., and Jacob, D. J.: Satellite-based survey of extreme methane emissions in the Permian basin, Sci. Adv., 7, eabf4507, https://doi.org/10.1126/sciadv.abf4507, 2021.
Jacob, D. J., Turner, A. J., Maasakkers, J. D., Sheng, J., Sun, K., Liu, X., Chance, K., Aben, I., McKeever, J., and Frankenberg, C.: Satellite observations of atmospheric methane and their value for quantifying methane emissions, Atmos. Chem. Phys., 16, 14371–14396, https://doi.org/10.5194/acp-16-14371-2016, 2016.
Jervis, D., McKeever, J., Durak, B. O. A., Sloan, J. J., Gains, D., Varon, D. J., Ramier, A., Strupler, M., and Tarrant, E.: The GHGSat-D imaging spectrometer, Atmos. Meas. Tech., 14, 2127–2140, https://doi.org/10.5194/amt-14-2127-2021, 2021.
Kraut, S., Scharf, L. L., and Butler, R. W.: The adaptive coherence estimator: a uniformly most-powerful-invariant adaptive detection statistic, IEEE Trans. Signal Process., 53, 427–438, https://doi.org/10.1109/TSP.2004.840823, 2005.
Kuze, A., Suto, H., Shiomi, K., Kawakami, S., Tanaka, M., Ueda, Y., Deguchi, A., Yoshida, J., Yamamoto, Y., Kataoka, F., Taylor, T. E., and Buijs, H. L.: Update on GOSAT TANSO-FTS performance, operations, and data products after more than 6 years in space, Atmos. Meas. Tech., 9, 2445–2461, https://doi.org/10.5194/amt-9-2445-2016, 2016.
Lauvaux, T., Giron, C., Mazzolini, M., d'Aspremont, A., Duren, R., Cusworth, D., Shindell, D., and Ciais, P.: Global assessment of oil and gas methane ultra-emitters, Science, 80, 557–561, 2022.
Lorente, A., Borsdorff, T., Butz, A., Hasekamp, O., aan de Brugh, J., Schneider, A., Wu, L., Hase, F., Kivi, R., Wunch, D., Pollard, D. F., Shiomi, K., Deutscher, N. M., Velazco, V. A., Roehl, C. M., Wennberg, P. O., Warneke, T., and Landgraf, J.: Methane retrieved from TROPOMI: improvement of the data product and validation of the first 2 years of measurements, Atmos. Meas. Tech., 14, 665–684, https://doi.org/10.5194/amt-14-665-2021, 2021.
Maasakkers, J. D., Varon, D. J., Elfarsdóttir, A., McKeever, J., Jervis, D., Mahapatra, G., Pandey, S., Lorente, A., Borsdorff, T., Foorthuis, L. R., Schuit, B. J., Tol, P., van Kempen, T. A., van Hees, R., and Aben, I.: Using satellites to uncover large methane emissions from landfills, Sci. Adv., 8, eabn9683, https://doi.org/10.1126/sciadv.abn9683, 2023.
Marchese, A. J., Vaughn, T. L., Zimmerle, D. J., Martinez, D. M., Williams, L. L., Robinson, A. L., Mitchell, A. L., Subramanian, R., Tkacik, D. S., Roscioli, J. R., and Herndon, S. C.: Methane Emissions from United States Natural Gas Gathering and Processing, Environ. Sci. Technol., 49, 10718–10727, https://doi.org/10.1021/acs.est.5b02275, 2015.
Masood, E. and Tollefson, J.: COP26 climate pledges: What scientists think so far, Nature, d41586-021-03034-z, https://doi.org/10.1038/d41586-021-03034-z, 2021.
Mayfield, E. N., Robinson, A. L., and Cohon, J. L.: System-wide and Superemitter Policy Options for the Abatement of Methane Emissions from the U.S. Natural Gas System, Environ. Sci. Technol., 51, 4772–4780, https://doi.org/10.1021/acs.est.6b05052, 2017.
Mikaloff, F. S. E. and Hinrich, S.: Rising methane: A new climate challenge, Science, 80, 932–933, https://doi.org/10.1126/science.aax1828, 2019.
Miller, S. M., Michalak, A. M., Detmers, R. G., Hasekamp, O. P., Bruhwiler, L. M. P., and Schwietzke, S.: China's coal mine methane regulations have not curbed growing emissions, Nat. Commun., 10, 1–8, 2019.
National Oceanic and Atmospheric Administration: Increase in atmospheric methane set another record during 2021, https://www.noaa.gov/news-release/increase-in-atmospheric-methane-set-another-record-during-2021 (last access: 8 May 2023), 2022.
Nisbet, E. G., Manning, M. R., Dlugokencky, E. J., Fisher, R. E., Lowry, D., Michel, S. E., Myhre, C. L., Platt, S. M., Allen, G., and Bousquet, P.: Very Strong Atmospheric Methane Growth in the 4 Years 2014–2017: Implications for the Paris Agreement, Global Biogeochem. Cy., 33, 318–342, https://doi.org/10.1029/2018GB006009, 2019.
Nisbet, E. G., Fisher, R. E., Lowry, D., France, J. L., Allen, G., Bakkaloglu, S., Broderick, T. J., Cain, M., Coleman, M., Fernandez, J., Forster, G., Griffiths, P. T., Iverach, C. P., Kelly, B. F. J., Manning, M. R., Nisbet-Jones, P. B. R., Pyle, J. A., Townsend-Small, A., al-Shalaan, A., Warwick, N., and Zazzeri, G.: Methane Mitigation: Methods to Reduce Emissions, on the Path to the Paris Agreement, Rev. Geophys., 58, e2019RG000675, https://doi.org/10.1029/2019RG000675, 2020.
NOAA: Weather Research and Forecasting model coupled to Chemistry (WRF-Chem), NOAA [data set], https://ruc.noaa.gov/wrf/wrf-chem/ (last access: 8 May 2023), 2023.
Ocko, I. B., Sun, T., Shindell, D., Oppenheimer, M., Hristov, A. N., Pacala, S. W., Mauzerall, D. L., Xu, Y., and Hamburg, S. P.: Acting rapidly to deploy readily available methane mitigation measures by sector can immediately slow global warming, Environ. Res. Lett., 16, 54042, https://doi.org/10.1088/1748-9326/abf9c8, 2021.
Ouerghi, E., Ehret, T., de Franchis, C., Facciolo, G., Lauvaux, T., Meinhardt, E., and Morel, J.-M.: DETECTION OF METHANE PLUMES IN HYPERSPECTRAL IMAGES FROM SENTINEL-5P BY COUPLING ANOMALY DETECTION AND PATTERN RECOGNITION, ISPRS Ann. Photogramm. Remote Sens. Spatial Inf. Sci., V-3-2021, 81–87, https://doi.org/10.5194/isprs-annals-V-3-2021-81-2021, 2021.
Pandey, S., Gautam, R., Houweling, S., Van Der Gon, H. D., Sadavarte, P., Borsdorff, T., Hasekamp, O., Landgraf, J., Tol, P., and Van Kempen, T.: Satellite observations reveal extreme methane leakage from a natural gas well blowout, P. Natl. Acad. Sci. USA, 116, 26376–26381, 2019.
Pandey, S., Houweling, S., Lorente, A., Borsdorff, T., Tsivlidou, M., Bloom, A. A., Poulter, B., Zhang, Z., and Aben, I.: Using satellite data to identify the methane emission controls of South Sudan's wetlands, Biogeosciences, 18, 557–572, https://doi.org/10.5194/bg-18-557-2021, 2021.
Pandey, S., van Nistelrooij, M., Maasakkers, J. D., Sutar, P., Houweling, S., Varon, D. J., Tol, P., Gains, D., Worden, J., and Aben, I.: Daily detection and quantification of methane leaks using Sentinel-3: a tiered satellite observation approach with Sentinel-2 and Sentinel-5p, arXiv preprint, https://doi.org/10.48550/ARXIV.2212.11318, 2022.
Paoletti, M. E., Haut, J. M., Plaza, J., and Plaza, A.: A new deep convolutional neural network for fast hyperspectral image classification, ISPRS J. Photogramm. Remote Sens., 145, 120–147, https://doi.org/10.1016/j.isprsjprs.2017.11.021, 2018.
Phil DeCola and WMO Secretariat: An Integrated Global Greenhouse Gas Information System (IG3IS), https://public.wmo.int/en/resources/bulletin/integrated-global-greenhouse-gas-information-system-ig3is (last access: 8 May 2023), 2017.
Plant, G., Kort, E. A., Brandt, A. R., Chen, Y., Fordice, G., Gorchov Negron, A. M., Schwietzke, S., Smith, M., and Zavala-Araiza, D.: Inefficient and unlit natural gas flares both emit large quantities of methane, Science, 80, 377, 1566–1571, https://doi.org/10.1126/science.abq0385, 2022.
Poindexter, C. M., Baldocchi, D. D., Matthes, J. H., Knox, S. H., and Variano, E. A.: The contribution of an overlooked transport process to a wetland's methane emissions, Geophys. Res. Lett., 43, 6276–6284, https://doi.org/10.1002/2016GL068782, 2016.
Reichstein, M., Camps-Valls, G., Stevens, B., Jung, M., Denzler, J., Carvalhais, N., and Prabhat: Deep learning and process understanding for data-driven Earth system science, Nature, 566, 195–204, https://doi.org/10.1038/s41586-019-0912-1, 2019.
Sadavarte, P., Pandey, S., Maasakkers, J. D., Lorente, A., Borsdorff, T., Denier van der Gon, H., Houweling, S., and Aben, I.: Methane Emissions from Superemitting Coal Mines in Australia Quantified Using TROPOMI Satellite Observations, Environ. Sci. Technol., 55, 16573–16580, https://doi.org/10.1021/acs.est.1c03976, 2021.
Sánchez-García, E., Gorroño, J., Irakulis-Loitxate, I., Varon, D. J., and Guanter, L.: Mapping methane plumes at very high spatial resolution with the WorldView-3 satellite, Atmos. Meas. Tech., 15, 1657–1674, https://doi.org/10.5194/amt-15-1657-2022, 2022.
Saunois, M., Bousquet, P., Poulter, B., Peregon, A., Ciais, P., Canadell, J. G., Dlugokencky, E. J., Etiope, G., Bastviken, D., Houweling, S., Janssens-Maenhout, G., Tubiello, F. N., Castaldi, S., Jackson, R. B., Alexe, M., Arora, V. K., Beerling, D. J., Bergamaschi, P., Blake, D. R., Brailsford, G., Brovkin, V., Bruhwiler, L., Crevoisier, C., Crill, P., Covey, K., Curry, C., Frankenberg, C., Gedney, N., Höglund-Isaksson, L., Ishizawa, M., Ito, A., Joos, F., Kim, H.-S., Kleinen, T., Krummel, P., Lamarque, J.-F., Langenfelds, R., Locatelli, R., Machida, T., Maksyutov, S., McDonald, K. C., Marshall, J., Melton, J. R., Morino, I., Naik, V., O'Doherty, S., Parmentier, F.-J. W., Patra, P. K., Peng, C., Peng, S., Peters, G. P., Pison, I., Prigent, C., Prinn, R., Ramonet, M., Riley, W. J., Saito, M., Santini, M., Schroeder, R., Simpson, I. J., Spahni, R., Steele, P., Takizawa, A., Thornton, B. F., Tian, H., Tohjima, Y., Viovy, N., Voulgarakis, A., van Weele, M., van der Werf, G. R., Weiss, R., Wiedinmyer, C., Wilton, D. J., Wiltshire, A., Worthy, D., Wunch, D., Xu, X., Yoshida, Y., Zhang, B., Zhang, Z., and Zhu, Q.: The global methane budget 2000–2012, Earth Syst. Sci. Data, 8, 697–751, https://doi.org/10.5194/essd-8-697-2016, 2016.
Saunois, M., Stavert, A. R., Poulter, B., Bousquet, P., Canadell, J. G., Jackson, R. B., Raymond, P. A., Dlugokencky, E. J., Houweling, S., Patra, P. K., Ciais, P., Arora, V. K., Bastviken, D., Bergamaschi, P., Blake, D. R., Brailsford, G., Bruhwiler, L., Carlson, K. M., Carrol, M., Castaldi, S., Chandra, N., Crevoisier, C., Crill, P. M., Covey, K., Curry, C. L., Etiope, G., Frankenberg, C., Gedney, N., Hegglin, M. I., Höglund-Isaksson, L., Hugelius, G., Ishizawa, M., Ito, A., Janssens-Maenhout, G., Jensen, K. M., Joos, F., Kleinen, T., Krummel, P. B., Langenfelds, R. L., Laruelle, G. G., Liu, L., Machida, T., Maksyutov, S., McDonald, K. C., McNorton, J., Miller, P. A., Melton, J. R., Morino, I., Müller, J., Murguia-Flores, F., Naik, V., Niwa, Y., Noce, S., O'Doherty, S., Parker, R. J., Peng, C., Peng, S., Peters, G. P., Prigent, C., Prinn, R., Ramonet, M., Regnier, P., Riley, W. J., Rosentreter, J. A., Segers, A., Simpson, I. J., Shi, H., Smith, S. J., Steele, L. P., Thornton, B. F., Tian, H., Tohjima, Y., Tubiello, F. N., Tsuruta, A., Viovy, N., Voulgarakis, A., Weber, T. S., van Weele, M., van der Werf, G. R., Weiss, R. F., Worthy, D., Wunch, D., Yin, Y., Yoshida, Y., Zhang, W., Zhang, Z., Zhao, Y., Zheng, B., Zhu, Q., Zhu, Q., and Zhuang, Q.: The Global Methane Budget 2000–2017, Earth Syst. Sci. Data, 12, 1561–1623, https://doi.org/10.5194/essd-12-1561-2020, 2020.
Schellnhuber, H. J., Rahmstorf, S., and Winkelmann, R.: Why the right climate target was agreed in Paris, Nat. Clim. Chang., 6, 649–653, https://doi.org/10.1038/nclimate3013, 2016.
Schurer, A. P., Cowtan, K., Hawkins, E., Mann, M. E., Scott, V., and Tett, S. F. B.: Interpretations of the Paris climate target, Nat. Geosci., 11, 220–221, https://doi.org/10.1038/s41561-018-0086-8, 2018.
Sha, M. K., Langerock, B., Blavier, J.-F. L., Blumenstock, T., Borsdorff, T., Buschmann, M., Dehn, A., De Mazière, M., Deutscher, N. M., Feist, D. G., García, O. E., Griffith, D. W. T., Grutter, M., Hannigan, J. W., Hase, F., Heikkinen, P., Hermans, C., Iraci, L. T., Jeseck, P., Jones, N., Kivi, R., Kumps, N., Landgraf, J., Lorente, A., Mahieu, E., Makarova, M. V., Mellqvist, J., Metzger, J.-M., Morino, I., Nagahama, T., Notholt, J., Ohyama, H., Ortega, I., Palm, M., Petri, C., Pollard, D. F., Rettinger, M., Robinson, J., Roche, S., Roehl, C. M., Röhling, A. N., Rousogenous, C., Schneider, M., Shiomi, K., Smale, D., Stremme, W., Strong, K., Sussmann, R., Té, Y., Uchino, O., Velazco, V. A., Vigouroux, C., Vrekoussis, M., Wang, P., Warneke, T., Wizenberg, T., Wunch, D., Yamanouchi, S., Yang, Y., and Zhou, M.: Validation of methane and carbon monoxide from Sentinel-5 Precursor using TCCON and NDACC-IRWG stations, Atmos. Meas. Tech., 14, 6249–6304, https://doi.org/10.5194/amt-14-6249-2021, 2021.
Shoemaker, J. K., Schrag, D. P., Molina, M. J., and Ramanathan, V.: What role for short-lived climate pollutants in mitigation policy?, Science, 80, 1323–1324, 2013.
Smith, M. L., Gvakharia, A., Kort, E. A., Sweeney, C., Conley, S. A., Faloona, I., Newberger, T., Schnell, R., Schwietzke, S., and Wolter, S.: Airborne Quantification of Methane Emissions over the Four Corners Region, Environ. Sci. Technol., 51, 5832–5837, https://doi.org/10.1021/acs.est.6b06107, 2017.
Subramanian, R., Williams, L. L., Vaughn, T. L., Zimmerle, D., Roscioli, J. R., Herndon, S. C., Yacovitch, T. I., Floerchinger, C., Tkacik, D. S., Mitchell, A. L., Sullivan, M. R., Dallmann, T. R., and Robinson, A. L.: Methane Emissions from Natural Gas Compressor Stations in the Transmission and Storage Sector: Measurements and Comparisons with the EPA Greenhouse Gas Reporting Program Protocol, Environ. Sci. Technol., 49, 3252–3261, https://doi.org/10.1021/es5060258, 2015.
Suto, H., Kataoka, F., Kikuchi, N., Knuteson, R. O., Butz, A., Haun, M., Buijs, H., Shiomi, K., Imai, H., and Kuze, A.: Thermal and near-infrared sensor for carbon observation Fourier transform spectrometer-2 (TANSO-FTS-2) on the Greenhouse gases Observing SATellite-2 (GOSAT-2) during its first year in orbit, Atmos. Meas. Tech., 14, 2013–2039, https://doi.org/10.5194/amt-14-2013-2021, 2021.
Thompson, D. R., Thorpe, A. K., Frankenberg, C., Green, R. O., Duren, R., Guanter, L., Hollstein, A., Middleton, E., Ong, L., and Ungar, S.: Space-based remote imaging spectroscopy of the Aliso Canyon CH4 superemitter, Geophys. Res. Lett., 43, 6571–6578, https://doi.org/10.1002/2016GL069079, 2016.
Thorpe, A. K., Frankenberg, C., Aubrey, A. D., Roberts, D. A., Nottrott, A. A., Rahn, T. A., Sauer, J. A., Dubey, M. K., Costigan, K. R., Arata, C., Steffke, A. M., Hills, S., Haselwimmer, C., Charlesworth, D., Funk, C. C., Green, R. O., Lundeen, S. R., Boardman, J. W., Eastwood, M. L., Sarture, C. M., Nolte, S. H., Mccubbin, I. B., Thompson, D. R., and McFadden, J. P.: Mapping methane concentrations from a controlled release experiment using the next generation airborne visible/infrared imaging spectrometer (AVIRIS-NG), Remote Sens. Environ., 179, 104–115, https://doi.org/10.1016/j.rse.2016.03.032, 2016.
Tuzson, B., Graf, M., Ravelid, J., Scheidegger, P., Kupferschmid, A., Looser, H., Morales, R. P., and Emmenegger, L.: A compact QCL spectrometer for mobile, high-precision methane sensing aboard drones, Atmos. Meas. Tech., 13, 4715–4726, https://doi.org/10.5194/amt-13-4715-2020, 2020.
United Nations: Global methane pledge, https://unfccc.int/news/world-leaders-kick-start-accelerated-climate-action-at-cop26 (last access: 8 May 2023), 2021.
Van Damme, M., Clarisse, L., Whitburn, S., Hadji-Lazaro, J., Hurtmans, D., Clerbaux, C., and Coheur, P.-F.: Industrial and agricultural ammonia point sources exposed, Nature, 564, 99–103, https://doi.org/10.1038/s41586-018-0747-1, 2018.
Varon, D., McKeever, J., Jervis, D., Maasakkers, J. D., Pandey, S., Houweling, S., Aben, I., Scarpelli, T., and Jacob, D. J.: Satellite Discovery of Anomalously Large Methane Point Sources From Oil/Gas Production, Geophys. Res. Lett., 46, 13507–13516, https://doi.org/10.1029/2019GL083798, 2019.
Varon, D. J., Jacob, D. J., McKeever, J., Jervis, D., Durak, B. O. A., Xia, Y., and Huang, Y.: Quantifying methane point sources from fine-scale satellite observations of atmospheric methane plumes, Atmos. Meas. Tech., 11, 5673–5686, https://doi.org/10.5194/amt-11-5673-2018, 2018.
Varon, D. J., Jacob, D. J., Jervis, D., and McKeever, J.: Quantifying Time-Averaged Methane Emissions from Individual Coal Mine Vents with GHGSat-D Satellite Observations, Environ. Sci. Technol., 54, 10246–10253, https://doi.org/10.1021/acs.est.0c01213, 2020.
Varon, D. J., Jervis, D., McKeever, J., Spence, I., Gains, D., and Jacob, D. J.: High-frequency monitoring of anomalous methane point sources with multispectral Sentinel-2 satellite observations, Atmos. Meas. Tech., 14, 2771–2785, https://doi.org/10.5194/amt-14-2771-2021, 2021.
Vaughn, T. L., Bell, C. S., Pickering, C. K., Schwietzke, S., Heath, G. A., Pétron, G., Zimmerle, D. J., Schnell, R. C., and Nummedal, D.: Temporal variability largely explains top-down/bottom-up difference in methane emission estimates from a natural gas production region, P. Natl. Acad. Sci. USA, 115, 11712–11717, 2018.
Veefkind, J. P., Aben, I., McMullan, K., Förster, H., de Vries, J., Otter, G., Claas, J., Eskes, H. J., de Haan, J. F., Kleipool, Q., van Weele, M., Hasekamp, O., Hoogeveen, R., Landgraf, J., Snel, R., Tol, P., Ingmann, P., Voors, R., Kruizinga, B., Vink, R., Visser, H., and Levelt, P. F.: TROPOMI on the ESA Sentinel-5 Precursor: A GMES mission for global observations of the atmospheric composition for climate, air quality and ozone layer applications, Remote Sens. Environ., 120, 70–83, https://doi.org/10.1016/j.rse.2011.09.027, 2012.
Verhoelst, T., Compernolle, S., Pinardi, G., Lambert, J.-C., Eskes, H. J., Eichmann, K.-U., Fjæraa, A. M., Granville, J., Niemeijer, S., Cede, A., Tiefengraber, M., Hendrick, F., Pazmiño, A., Bais, A., Bazureau, A., Boersma, K. F., Bognar, K., Dehn, A., Donner, S., Elokhov, A., Gebetsberger, M., Goutail, F., Grutter de la Mora, M., Gruzdev, A., Gratsea, M., Hansen, G. H., Irie, H., Jepsen, N., Kanaya, Y., Karagkiozidis, D., Kivi, R., Kreher, K., Levelt, P. F., Liu, C., Müller, M., Navarro Comas, M., Piters, A. J. M., Pommereau, J.-P., Portafaix, T., Prados-Roman, C., Puentedura, O., Querel, R., Remmers, J., Richter, A., Rimmer, J., Rivera Cárdenas, C., Saavedra de Miguel, L., Sinyakov, V. P., Stremme, W., Strong, K., Van Roozendael, M., Veefkind, J. P., Wagner, T., Wittrock, F., Yela González, M., and Zehner, C.: Ground-based validation of the Copernicus Sentinel-5P TROPOMI NO2 measurements with the NDACC ZSL-DOAS, MAX-DOAS and Pandonia global networks, Atmos. Meas. Tech., 14, 481–510, https://doi.org/10.5194/amt-14-481-2021, 2021.
World Meteorological Organization: Global Atmosphere Watch Programme (GAW), https://community.wmo.int/activity-areas/gaw (last access: 8 May 2023), 2022.
WSO2 Identity Server: Sign In, WSO2 Identity Server [data set], https://prisma.asi.it/ (last access: 8 May 2023), 2023.
Yang, X., Ye, Y., Li, X., Lau, R. Y. K., Zhang, X., and Huang, X.: Hyperspectral Image Classification With Deep Learning Models, IEEE Trans. Geosci. Remote Sens., 56, 5408–5423, https://doi.org/10.1109/TGRS.2018.2815613, 2018.
Yu, S., Jia, S., and Xu, C.: Convolutional neural networks for hyperspectral image classification, Neurocomputing, 219, 88–98, https://doi.org/10.1016/j.neucom.2016.09.010, 2017.
Yuan, Q., Shen, H., Li, T., Li, Z., Li, S., Jiang, Y., Xu, H., Tan, W., Yang, Q., Wang, J., Gao, J., and Zhang, L.: Deep learning in environmental remote sensing: Achievements and challenges, Remote Sens. Environ., 241, 111716, https://doi.org/10.1016/j.rse.2020.111716, 2020.
Zavala-Araiza, D., Lyon, D., Alvarez, R. A., Palacios, V., Harriss, R., Lan, X., Talbot, R., and Hamburg, S. P.: Toward a Functional Definition of Methane Super-Emitters: Application to Natural Gas Production Sites, Environ. Sci. Technol., 49, 8167–8174, https://doi.org/10.1021/acs.est.5b00133, 2015.
Zavala-Araiza, D., Alvarez, R. A., Lyon, D. R., Allen, D. T., Marchese, A. J., Zimmerle, D. J., and Hamburg, S. P.: Super-emitters in natural gas infrastructure are caused by abnormal process conditions, Nat. Commun., 8, 14012, https://doi.org/10.1038/ncomms14012, 2017.
Zhang, M., Li, W., and Du, Q.: Diverse Region-Based CNN for Hyperspectral Image Classification, IEEE Trans. Image Process., 27, 2623–2634, https://doi.org/10.1109/TIP.2018.2809606, 2018.