the Creative Commons Attribution 4.0 License.
the Creative Commons Attribution 4.0 License.
 | 09 May 2023
Mixed-phase direct numerical simulation: ice growth in cloud-top generating cells
Lulin Xue
Sarah Tessendorf
Kyoko Ikeda
Courtney Weeks
Roy Rasmussen
Melvin Kunkel
Derek Blestrud
Shaun Parkinson
Melinda Meadows
Nick Dawson
In this study, a state-of-the-art microphysical model using a Lagrangian-particle-based direct numerical simulation framework is presented to examine the growth of ice particles in turbulent mixed-phase clouds. By tracking the interactions between individual ice, droplets, and turbulence at the native scales, the model offers new insights into the microphysical processes taking place in mixed-phase clouds at sub-meter-length scales.
This paper examines the conditions that favor effective ice growth in the cloud-top generating cells (GCs), which are small regions of enhanced radar reflectivity near cloud tops. GCs are commonly observed in many types of mixed-phase clouds and play a critical role in producing precipitation from rain or snow. Investigations over a range of environmental (macrophysical and turbulent) and microphysical conditions (ice number concentrations) that distinguish GCs from their surrounding cloudy air were conducted.
Results show that high liquid water content (LWC) or high relative humidity (RH) is critical for effective ice growth and the maintenance of mixed-phase conditions. As a result, GCs with high LWC and high RH provide favorable conditions for rapid ice growth. When the ice number concentration is below 1 cm−3, which is typical in mixed-phase clouds, a high LWC is needed for the formation of large ice particles. The study also found that supersaturation fluctuations induced by small-scale turbulent mixing have a negligible effect on the mean particle radius, but they can substantially broaden the size spectra, affecting the subsequent collection process.
- Article
(2788 KB) - Full-text XML
- BibTeX
- EndNote


It is well-recognized that the model representation of natural ice is not accurate due to a poor understanding of the physics related to, and therefore the poor model representation of, the ice and mixed-phase microphysical processes such as the ice nucleation mechanisms, representation of supercooled liquid water, and the interactions between the ice–liquid-phase hydrometeors (Korolev and Milbrandt, 2022; Korolev et al., 2017; Koop and Mahowald, 2013; Ovchinnikov et al., 2014). This poor model representation is exacerbated by the insufficient measurements used for constraining the microphysical parameterization at sub-grid scales (Fridlind et al., 2012; Baumgardner et al., 2017; Heymsfield et al., 2017; Korolev et al., 2017; Field et al., 2017). This uncertainty in the growth of ice can further impact the forecast of the supercooled liquid water amount in mixed-phase clouds (e.g., Morrison and Pinto, 2006; Barrett et al., 2017) via the Weber–Bergeron–Findeisen (WBF) mechanism (i.e., ice grows at the expense of liquid evaporation as a result of the difference in saturation vapor pressures with respect to liquid and ice, e.g., Storelvmo and Tan, 2015) and thus the subsequent precipitation process.
The interaction between the ice particles and the supercooled liquid water in a turbulent environment is a multi-scale issue, and detailed information, such as the Lagrangian history of particle growth and the spatial distribution of the particles of distinct phases at fine scales, is key to the understanding of the decay and maintenance of mixed-phase clouds (Korolev and Milbrandt, 2022). Theoretical, modeling, and observational studies have been conducted to examine the influence of various factors on mixed-phase clouds such as the entrainment-mixing, the WBF process, large eddies, vertical oscillations, and ice number concentrations (Hoffmann, 2020; Korolev, 2007, 2008; Korolev and Field, 2008; Khain et al., 2022; Morrison et al., 2012; Lee et al., 2021). Nevertheless, the native scales, at which there were interactions between individual ice particles, liquid droplets, and turbulence, were rarely explored due to the limitation of the spatial resolution of the models and in situ measurements. Lagrangian-particle-based direct numerical simulations (DNSs) can fill this knowledge gap in fine-scale microphysics and dynamics by resolving the turbulence and cloud particle growth.
DNS has been applied in cloud microphysics modeling since the early 2000s (Vaillancourt et al., 2001, 2002) to study the turbulent impact on particle growth and spectral broadening. The bulk of the research has centered on warm-phase clouds (e.g., Ayala et al., 2008; Grabowski and Wang, 2013; Li et al., 2020; Gotoh et al., 2016, 2021; Saito et al., 2019; Chen et al., 2018a, b, 2020, 2021), with a limited number of studies investigating ice-phase clouds (Vowinckel et al., 2019a, b). In contrast, mixed-phase processes have received very little attention to date, despite their importance and complexity.
In this study, a Lagrangian-particle-based mixed-phase microphysics was implemented in the DNS model to untangle the interactions between ice, droplets, and turbulence at true native scales relevant to microphysics and to improve the fundamental understanding of ice growth in mixed-phase clouds. This paper aims to present a mixed-phase DNS model with the capability of simulating the microphysical processes key to the development, maintenance, and decay of mixed-phase environments, and the evolution of the ice and droplet size distributions.
Specifically, this study investigates the influence of cloud-top generating cells (GCs) on ice growth in mixed-phase clouds. GCs are fine-scale structures commonly observed in different types of clouds such as the winter orographic clouds (Tessendorf et al., 2019; Kumjian et al., 2014), midlatitude cyclones (Keeler et al., 2016; Rauber et al., 2015), and mixed-phase clouds in the Southern Ocean (Wang et al., 2020). The GCs typically contain more liquid and ice and stronger updrafts than the adjacent portion of the clouds. Therefore, it is a key region for the formation of ice and precipitation. To resolve processes in GCs, an accurate representation of microphysics and dynamics is needed. The processes involve interactions between ice particles and liquid particles at centimeter scales. The structure of the flow at this length scale is difficult to measure using in situ data and is also unable to resolve in mesoscale models. Therefore, a mixed-phase DNS is beneficial to obtain a process-level understanding at such fine scales.
With the overarching research question of “how can we use this innovative tool to design experiments and improve ice parameterizations in models that do not resolve mixed-phase microphysics explicitly?”, our model development efforts aim to
-
present a DNS model studying the mixed-phase cloud microphysics with resolved fine-scale turbulence and Lagrangian cloud particles (aerosols, droplets, and ice crystals) and demonstrate the capability of such a model
-
investigate the impact of turbulence and environmental conditions on the ice growth and cloud glaciation at the native scales of droplet–ice interactions. We explored the potential mechanism of efficient ice growth in GCs. Controlled experiments are conducted by the mixed-phase DNS to quantitatively examine the impact of the GC environment on the ice growth. In situ measurement data from the Seeded and Natural Orographic Wintertime clouds – the Idaho Experiment (SNOWIE) (Tessendorf et al., 2019) are used to set up the initial conditions for the microphysics and environmental conditions which resemble those inside and outside GCs. Finally, the atmospheric implications of the simulations will be discussed.
As a part of our continued efforts to develop a comprehensive cloud microphysics model (Chen et al., 2016, 2018a, 2018b, 2020, 2021), this study presents the first version of a mixed-phase DNS model. The aim of this model is to address the intricacies of the interactions between droplets, ice, dynamics, and thermodynamics at microscales. The modeling framework of the warm-phase DNS model developed by Chen et al. (2018b) was adopted for this purpose. In this modeling framework, droplets are modeled as Lagrangian particles and are treated as inertial particles, subject to both turbulent flow and gravity. The simulation domain is defined by a triply periodic boundary condition. The following two model improvements were made to consider the ice depositional growth in a turbulent-mixing environment:
-
added depositional growth of spherical ice particles, and
-
added external forcing on the thermodynamic fluctuation fields (i.e., temperature, T′, and water vapor mixing ratio, ) to account for the effects of turbulent mixing cascading down from larger scales.
2.1 Depositional growth of ice particles
This model is designed to simulate the growth of small ice crystals (<100 µm) mixed-phase clouds, with the purpose of understanding the impacts of microphysical and/or environmental conditions on the production of larger ice particles. The specific focus is on the potential impact of fine-scale turbulence on the WBF process, which refers to the rapid growth of ice at the expense of the evaporation of droplets. In this study, the deposition growth of newly nucleated ice crystals was considered in the model as the only mechanism for ice growth. Other nucleation and growth mechanisms such as the freezing of supercooled droplets, secondary ice productions, ice aggregation, and riming were not considered in this study. The ice depositional growth rate, in mass, of each individual spherical ice crystal was calculated in the model (Rogers and Yau, 1989, Eq. 9.4):
where is the mass of a spherical ice crystal with a radius of r, C=r is the capacitance for a spherical ice crystal, Si is the supersaturation over the ice surface, and J kg−1 is the latent heat required to deposit per unit mass of water vapor to ice. Rv=467 J K−1 kg−1 is the individual gas constant for water vapor, and K′ and D′ are, respectively, the thermal conductivity and water vapor diffusivity that include kinetic effects (see Eqs. 11a–11b in Grabowski et al., 2011, for the detailed expressions). Note that the ice crystals are assumed to be spherical in this study, and therefore the kinetic effects on the diffusivity and conductivity of ice crystals are treated in the same way as water. Zhang and Herrington (2014) demonstrated that when ice crystals take non-spherical shapes, the kinetic effects can be very different, and their shape parameter needs to be considered. esat,i is the saturation water vapor pressure. The assumption of a circular ice particle may not accurately represent the true geometry of observed ice particles, whose true habit depends on temperature and humidity (Korolev and Isaac, 2003). Model development is undergoing to consider ice habits in future simulations.
2.2 Thermodynamic forcings on fluctuation fields
To account for the effects of turbulent mixing between different parts of the cloud cascaded down from scales larger than DNS domain size (i.e., L≫1 m), a forcing scheme was implemented to modulate the fluctuations of the temperature field (T′) and the water vapor mixing ratio field (). In this way, statistical stationarity of thermodynamic fluctuations imposed by large-scale turbulence is achieved:
In these equations, U is the flow velocity, W′ is the vertical perturbation velocity, and and are the differential droplet condensational rate and differential ice depositional rate, respectively, between the grid cell and the entire domain. Dt and Dv are thermal diffusivity and water vapor diffusivity. FT and are forcing terms. The two fluctuation fields were forced in a low-wavenumber band in the Fourier space, similar to the way the velocity field is forced (Chen et al., 2016). The energy cascades down to smaller and smaller scales via the non-linear interactions between eddies and is eventually dissipated by viscosity and thermal diffusivity at millimeter scales. The forcing intensity, which measures the strength or efficiency of the turbulent mixing of the scalar fields (T and qv), is determined by the prescribed standard deviation (σT, σqv) which can be obtained from flight measurements:
Here, and are constants determined by the domain size of the simulation.
To set up the model initial conditions, in situ measurements during the intensive observation period (IOP) 22 of the Seeded and Natural Orographic Wintertime clouds – the Idaho Experiment (SNOWIE, see Tessendorf et al., 2019) were used. IOP22 was observed from 9 March 2017 14:00–18:00 UTC. We utilized the data from flight segment “A” to extract the environmental conditions of the generating cells. In segment A (14:08–14:10 UTC, with a flight distance of ∼12 km given a mean aircraft speed of 98.9 m s−1), 13 GCs in total were identified. Six of the GCs had at least 5 s of flight measurements, which translates to a horizontal length scale of roughly 500 m or longer. We selected the time series of GC that lasted the longest in the measurement period (i.e., the largest generating cell of the five), as the statistics were believed to be more representative of GC conditions than the rest of the time series. Table 1 summarizes the environmental conditions measured in this segment. As demonstrated, the observed number concentrations of drizzle and large ice particles (d>100 µm) in the GC environment are much higher than those of non-GC environments.
Table 1The environmental and microphysical conditions of the GCs from SNOWIE IOP22's flight segment A.
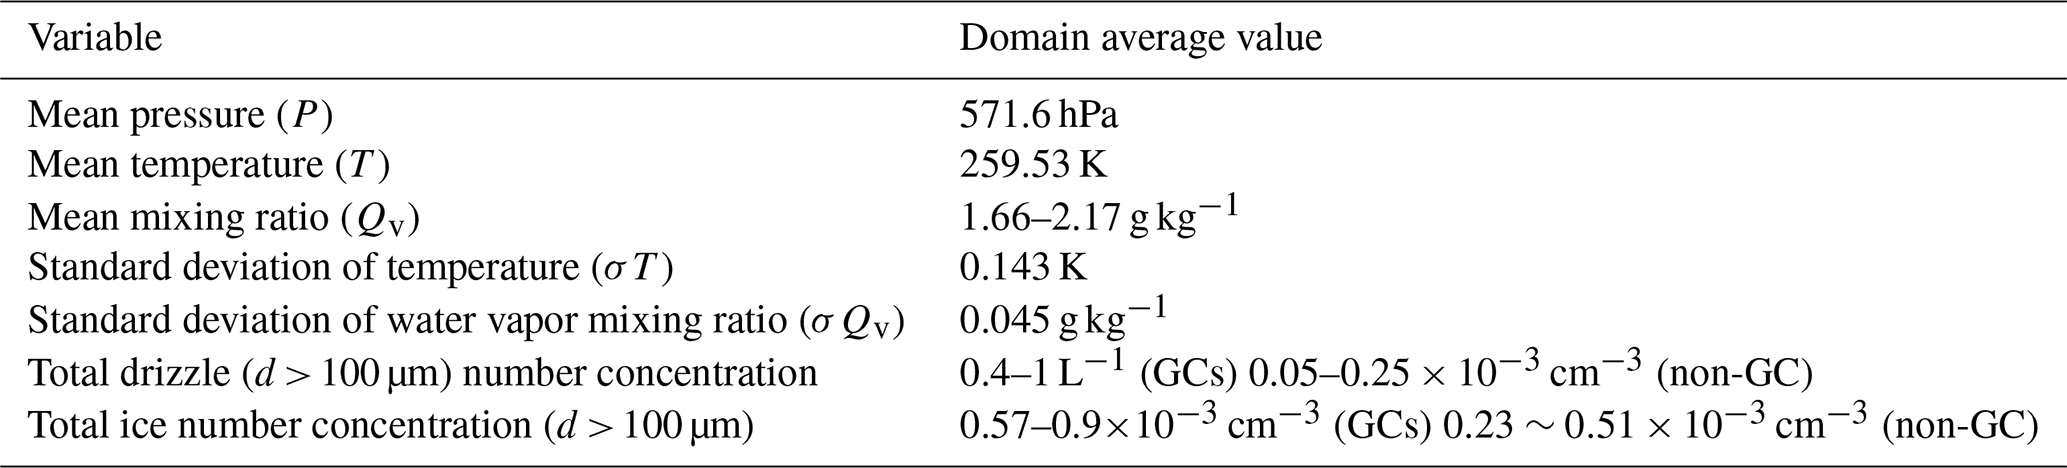
Two sensors (Rosemount and DMT100) were available to measure the water vapor mixing ratio, which has uncertainty in the mean values (1.66 g kg−1 from DMT100 and 2.17 g kg−1 from Rosemount); therefore, both values are tested to account for the measurement uncertainty. To study the WBF process, a diagnostic relation between the supersaturation and temperature was calculated using a simple steady-state parcel model to identify the range of relative humidity (RH) favoring the WBF process (as shown in the triangular shaded area in Fig. 1). To ensure that (1) the tested range covers both conditions that are favorable or unfavorable for the WBF process and (2) the corresponding mixing ratio at this condition reflects the measured range and its uncertainty (Table 1), we chose a range in supersaturation between % and 5 %, corresponding to RH = 80 %–105 % (purple stripe in Fig. 1) at the given temperature, and the pressure condition of the GCs was chosen as the initial conditions in the DNS. The microphysical response to varying moisture levels was therefore investigated.
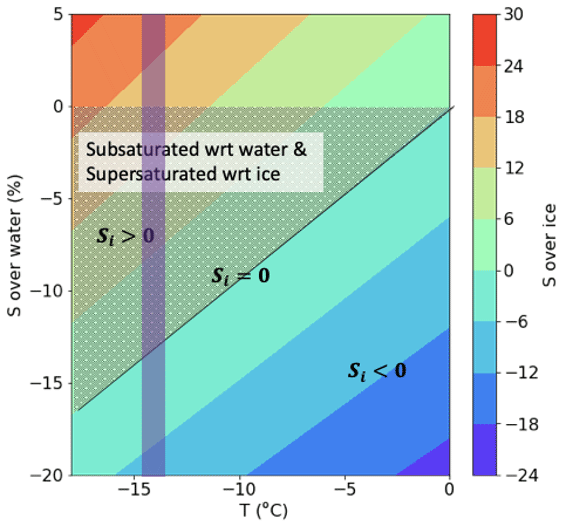
Figure 1Diagnostic relationship of the temperature (x axis), supersaturation over the liquid water (y axis), and supersaturation over ice (color contours). The shaded gray triangular area indicates the condition in favor of the WBF process, and the purple column marks the mean temperature of the generating cell measured in IOP22 ( ∘C). The range of supersaturation (−20 % to 5 %, i.e., RH = 80 %–105 %) in the y axis will be examined in the current study.
Six groups of experiments, including the control group, were performed, which consisted of 18 simulations in total (see summary of the experiments in Table 2). Within each group, only one condition is varied and the rest remain the same. The initial conditions for the controlled experiment are listed in Table 2. Droplets have a dry radius of 1 µm, with a hygroscopicity parameter κ= 0.3. The purpose of conducting these sensitivity tests is firstly to validate the model on whether it could produce reasonable results and secondly, by tuning different controlling variables, to understand what conditions favor ice growth and explore why the generating cell environment tends to produce more ice. The giant dry radius of 1 µm is not a typical aerosol radius; however, it is used in this experimental setup for the purpose of examining the upper-bound impact of the aerosol's hygroscopic effects on the ice growth and the WBF process.
The GCs were reported to contain a higher liquid water content (LWC) than the surrounding cloud body. Therefore, two groups of experiments were conducted, which highlight a high LWC and a low LWC condition, respectively. The high LWC experiments were initialized with LWC = 0.55 g m−3(Rwet=10 µm, Nd=100 cm−3), a typical value observed in a GC during SNOWIE, and therefore are named RH_GC. Likewise, the low LWC experiments were initiated with LWC = 0.002 g m−3(Rwet=1.5 µm, Nd= 100 cm−3), a much lower value than inside the generating cell, and are named RH_noGC (see Table 2 for setup detail). The primary objective of conducting experiments in low LWC environments is to demonstrate the crucial role of large drops in ice growth under the same RH conditions as well as the susceptibility of ice growth to changes in RH at varying LWC environments.
Table 2Summary of the initial conditions of the DNS experiments conducted in this study. In each experimental group, only the conditions that are different from the control group are listed in the remaining groups.
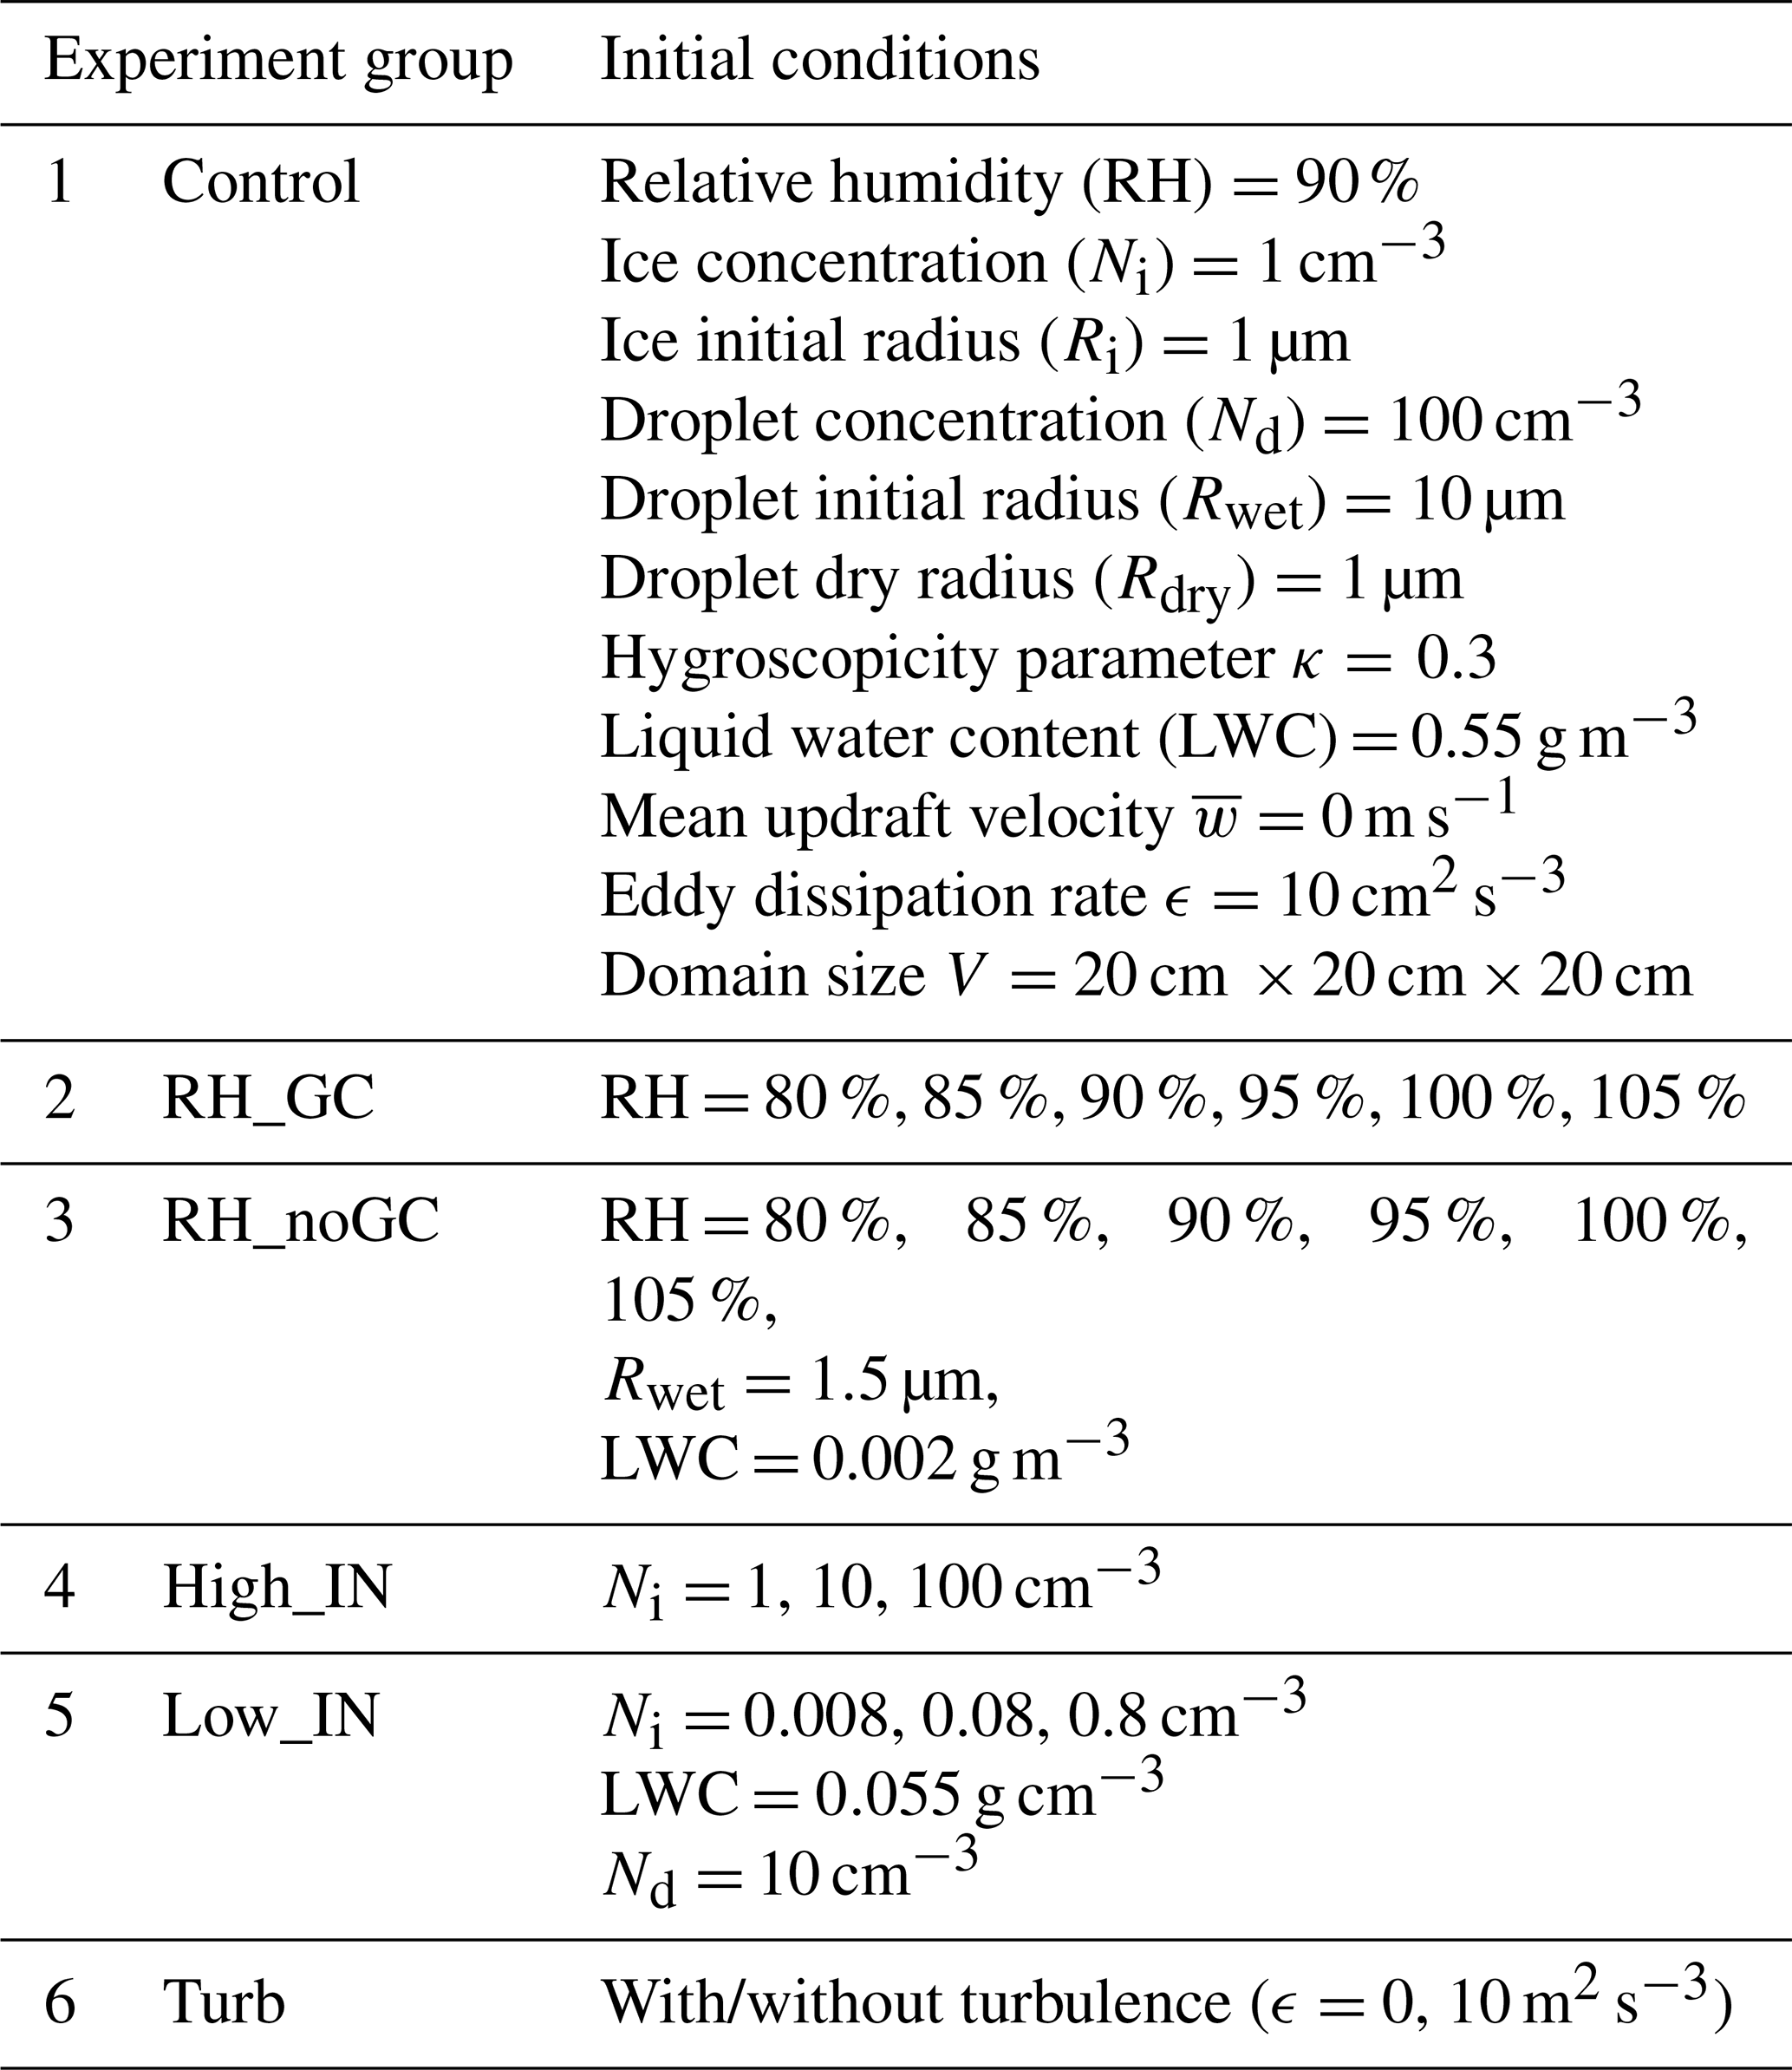
Another two groups of experiments were conducted with different initial ice number concentrations. The first group is named High_IN, in which the small ice number concentrations vary from 1 to 100 cm−3 with the same initial radius of 1 µm (Table 2). The second group is named Low_IN, with Ni= 8, 80, 800 L−1. This range is commonly observed in many natural mixed-phase clouds.
To examine how turbulent-mixing-induced supersaturation fluctuations affect the ice growth and the glaciation process, the last group, named Turb, compares simulated results with and without turbulence. The model configurations are the same as the control group, except that the experiment without turbulence has no fluctuations in the velocity, temperature, and mixing ratio fields. In other words, the model is treated as a traditional cloud parcel, with no external forcing term and turbulent transportation term in the temperature and mixing ratio equations (Eqs. 2–3) to generate supersaturation fluctuations.
To accurately capture all turbulent scales (i.e., scales down to Kolmogorov length scales) in the computational domain, the spatial resolution was set to 0.15625 mm. The time step was set to be very small ( s) to ensure that the smallest eddies and the particle relaxation timescales could be resolved. The droplet relaxation timescale defines how fast a droplet's surface temperature adjusts to equilibrium (see also the discussion of relaxation timescales in Vaillancourt et al., 2001). The domain size was 20 cm × 20 cm × 20 cm, and with a droplet number concentration of 100 cm−3, 800 000 droplets were simulated and tracked within the domain.
4.1 Macrophysical impact
We first investigate the impacts of initial macrophysical conditions (i.e., mean quantities) on the ice growth. We emphasize the relative humidity and liquid water content, as the two are directly related to the water availability and immediately affect the ice growth.
Figure 2 shows the response of the mean particle radius and mean supersaturation to various initial RH. In the RH_GC group, the mean supersaturation adjusts to quasi-stationarity within 20–30 s and remains relatively unchanging for the duration of the simulation (Fig. 2c–d). All air parcels become nearly saturated with respect to water and supersaturated over ice (Si ≈ 10 %) and remain statistically steady thereafter. In fact, this quasi-stationary saturation ratio is maintained by an unstable microphysical condition under which the WBF process (the ice grows rapidly at the expense of droplet evaporation) is active (Fig. 2a–b). The loss of water vapor due to the ice growth is continuously replenished by the evaporation of droplets, leading to a quasi-stationary RH.
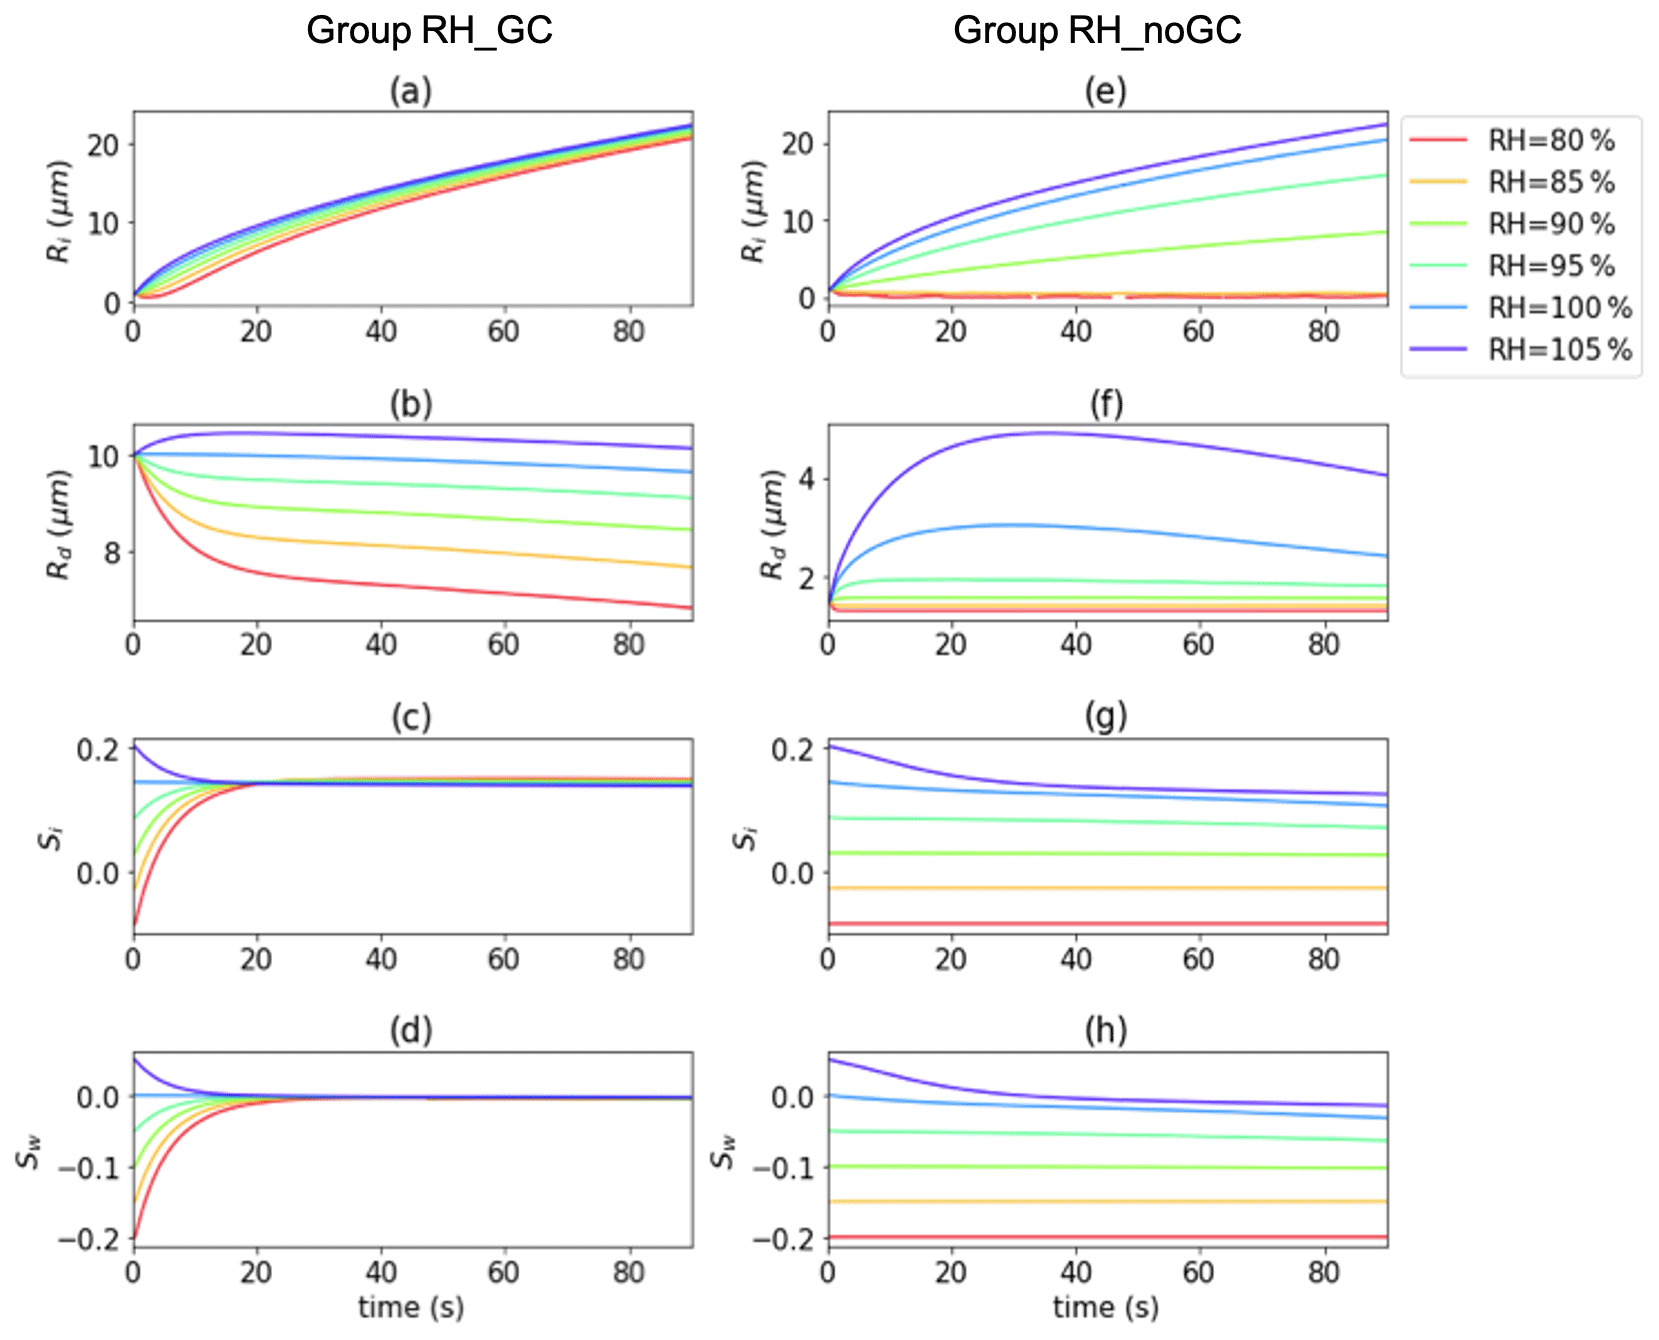
Figure 2From top to bottom, the evolution of mean ice radius, mean droplet radius, mean supersaturation over ice, and mean supersaturation over water responding to different initial RH. The left panels demonstrate results from a high LWC case (initial LWC= 0.55g m−3, group RH_GC) and the right panels from a low LWC case (initial LWC= 0.002g m−3, group RH_noGC).
In weather models or large-eddy simulation (LES), a time step of 1–20 s is typically used with the assumption that liquid water is in thermodynamic equilibrium but not the ice. This assumption is based on the approximation that the phase relaxation time for droplets is faster than that of ice. This simplified assumption that water condensation/evaporation is faster than ice processes is based on the single-phase cloud (i.e., warm cloud or ice cloud), where droplets and ice respond to moisture fields independently of one another. The phase relaxation time (τphase, the time it takes for the saturation ratio to relax exponentially to 100 %) can be calculated as , where m2 s−1 is the diffusivity of water vapor, and is the mean droplet radius. For a liquid cloud with a number concentration of N=100 cm−3 and a mean radius of 10 µm, τphase= 3.12 s; for an ice cloud with a much lower number concentration (N=1 cm−3 and R=1 µm in our case), τphase=3121 s. However, this assumption does not hold true for evolving microphysics (i.e., number concentration and mean radius changing over time) or in mixed-phase environments where water vapor exchange occurs between ice and water drops. In mixed-phase conditions, ice, droplets, and thermodynamic fields interact concurrently. Both particles react to the thermodynamic fields in the same phase-relaxation timescale that evolves with time in the system, resulting in a slower reaction timescale to reach quasi-stationarity than the one defined by the droplet phase-relaxation timescale.
The RH_GC experiments demonstrate that the saturation at its quasi-stationarity is insensitive to the initial RH when at high LWC conditions (Fig. 2c–d). During the quasi-stationarity, all ice grows at a relatively constant rate and is less sensitive to the initial relative humidity compared to droplet growth (Fig. 2a). All air parcels tend to be glaciated, and the rate of glaciation depends on the initial RH. As Fig. 3 demonstrates, a low RH parcel glaciates faster than that of a high RH but produces a lower ice water content (IWC) due to less available total water vapor. In the atmosphere, when patches of droplets or drizzle drops are falling through or transported to a subsaturated environment from elsewhere through processes such as strong turbulent mixing and fallstreak of a hydrometeor (drizzle or melted snow) from the GCs, they can quickly replenish the surrounding air and create favorable conditions for ice growth. In the meantime, the cloud region with a high RH environment, such as in the GCs due to its more upward motion than the surrounding environment, can maintain a mixed-phase longer but also generate a high IWC due to the high availability of water vapor and liquid water.
In RH_noGC environments, due to insufficient liquid water in the parcel, ice growth rate is highly dependent on RH (Fig. 2e). For RH < 90 %, the air parcel is too dry to maintain ice growth due to low availability in both liquid water and water vapor, reaching a negative quasi-stationary supersaturation (Fig. 2g). For RH ≥ 90 %, the air parcel is still supersaturated with respect to ice (Fig. 2g), and thus positive ice growth is maintained. The ice grows at a much slower rate compared to its counterpart in the RH_GC group. It is shown that the air parcel generally glaciates faster regardless of its lower IWC (Fig. 3c, d).
The impact of RH on the glaciation rate is also prominent. Compared to the low RH cases, the air parcel initialized with a high RH glaciates slower but produces ice water faster (Fig. 3). This is because a high RH can delay and slow down the WBF process. It is shown that maintaining a high RH is important for efficient ice growth while maintaining a mixed phase for a longer period. In RH_GC group, droplets with RH = 105 % maintain growth for the first few seconds (Fig. 2b); in RH_noGC, droplets maintain high growth rates in the first 30 s (Fig. 2f). This difference in the two groups is caused by the difference in the initial droplet wet radius. RH_noGC was initiated with droplets with a wet radius of 1.5 µm and RH_GC with 10 µm, while droplets in both groups have the same dry radius of 1 µm. Following the κ–Kohler theory (Petters and Kreidenweis, 2007), the effective saturation ratio that considers the solute and curvature effects at the droplet surface is (see Eq. 1 in Chen et al., 2020 for the detailed explanation of the terms and constants), where κ is the hygroscopicity parameter, is the solute term, and is the curvature term. Gcurv≈1.0 in our case, and Ssat≈Gsolu. The droplet growth rate is proportional to S−Ssat, where S is the environmental saturation ratio. Therefore, either a large S or a small Ssat can lead to an effective droplet growth.
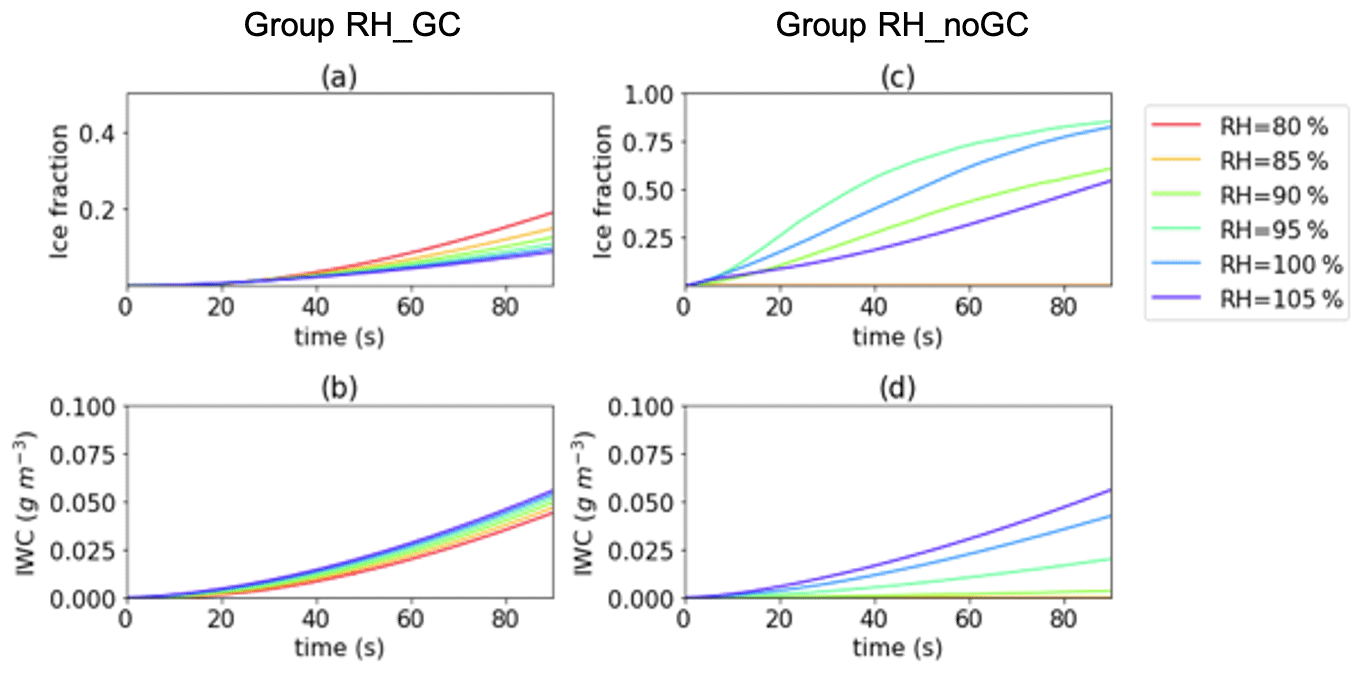
Figure 3(a–b) The evolution of ice fraction and ice water content, respectively, responding to different initial RH with an initial LWC of 0.55 g m−3 in group RH_GC. Panels (c–d) the same as (a–b) but with an initial LWC of 0.002 g m−3 in group RH_noGC. The ice fraction is defined as the ratio between ice water content and total water content.
In RH_noGC, the droplets have a large dry radius and a thin wet layer to begin with (, with Rwet=1.5 µm and Rdry=1 µm), and the solute term has an immediate strong impact on the growth rate in cases with RH ≥100 %, i.e., S−Ssat ≫ 0. One can observe the prominent droplet growth in Fig. 2f at the beginning, which is absent in the RH_GC case (Fig. 2b). When droplets grow to a larger size, Rwet, the growth rate slows down due to a higher effective saturation ratio and a lower environmental saturation ratio (i.e., a smaller S−Ssat). For example, for a droplet that grows to Rwet=5 µm, . With the environmental saturation ratio becoming subsaturated at a later time (), a negative growth rate is expected. In RH_GC, the solute effect is not important (Gsolu≈1.0 for Rwet=10 µm), and therefore, the growth rate is mainly determined by the environmental saturation ratio.
In summary, the value of supercooled liquid imposes an opposite impact on the ice growth and glaciation rate: a higher LWC can generate a higher IWC but results in a slower glaciation rate. To maintain both effective ice growth and a mixed phase for a long time, the environment needs either a high RH or a source of liquid water. Generating cells with a higher LWC and RH than the adjacent portion of the clouds provide ideal environments for efficient ice growth. In the meantime, solute effects from large aerosols can be important at the initial growth stage to maintain droplet growth and thus the increased LWC; this has an important implication for future cloud seeding operations to maintain a high LWC for a more active WBF process.
We also examined the evolution of particle size distribution (PSD) and found that it is highly sensitive to RH and LWC available in the air parcel. In RH_noGC, the RH plays a critical role in determining the mean radius: the higher the RH, the larger the ice mean size (Fig. 4b). At RH < 95 %, most droplets evaporate, and ice growth is inhibited.
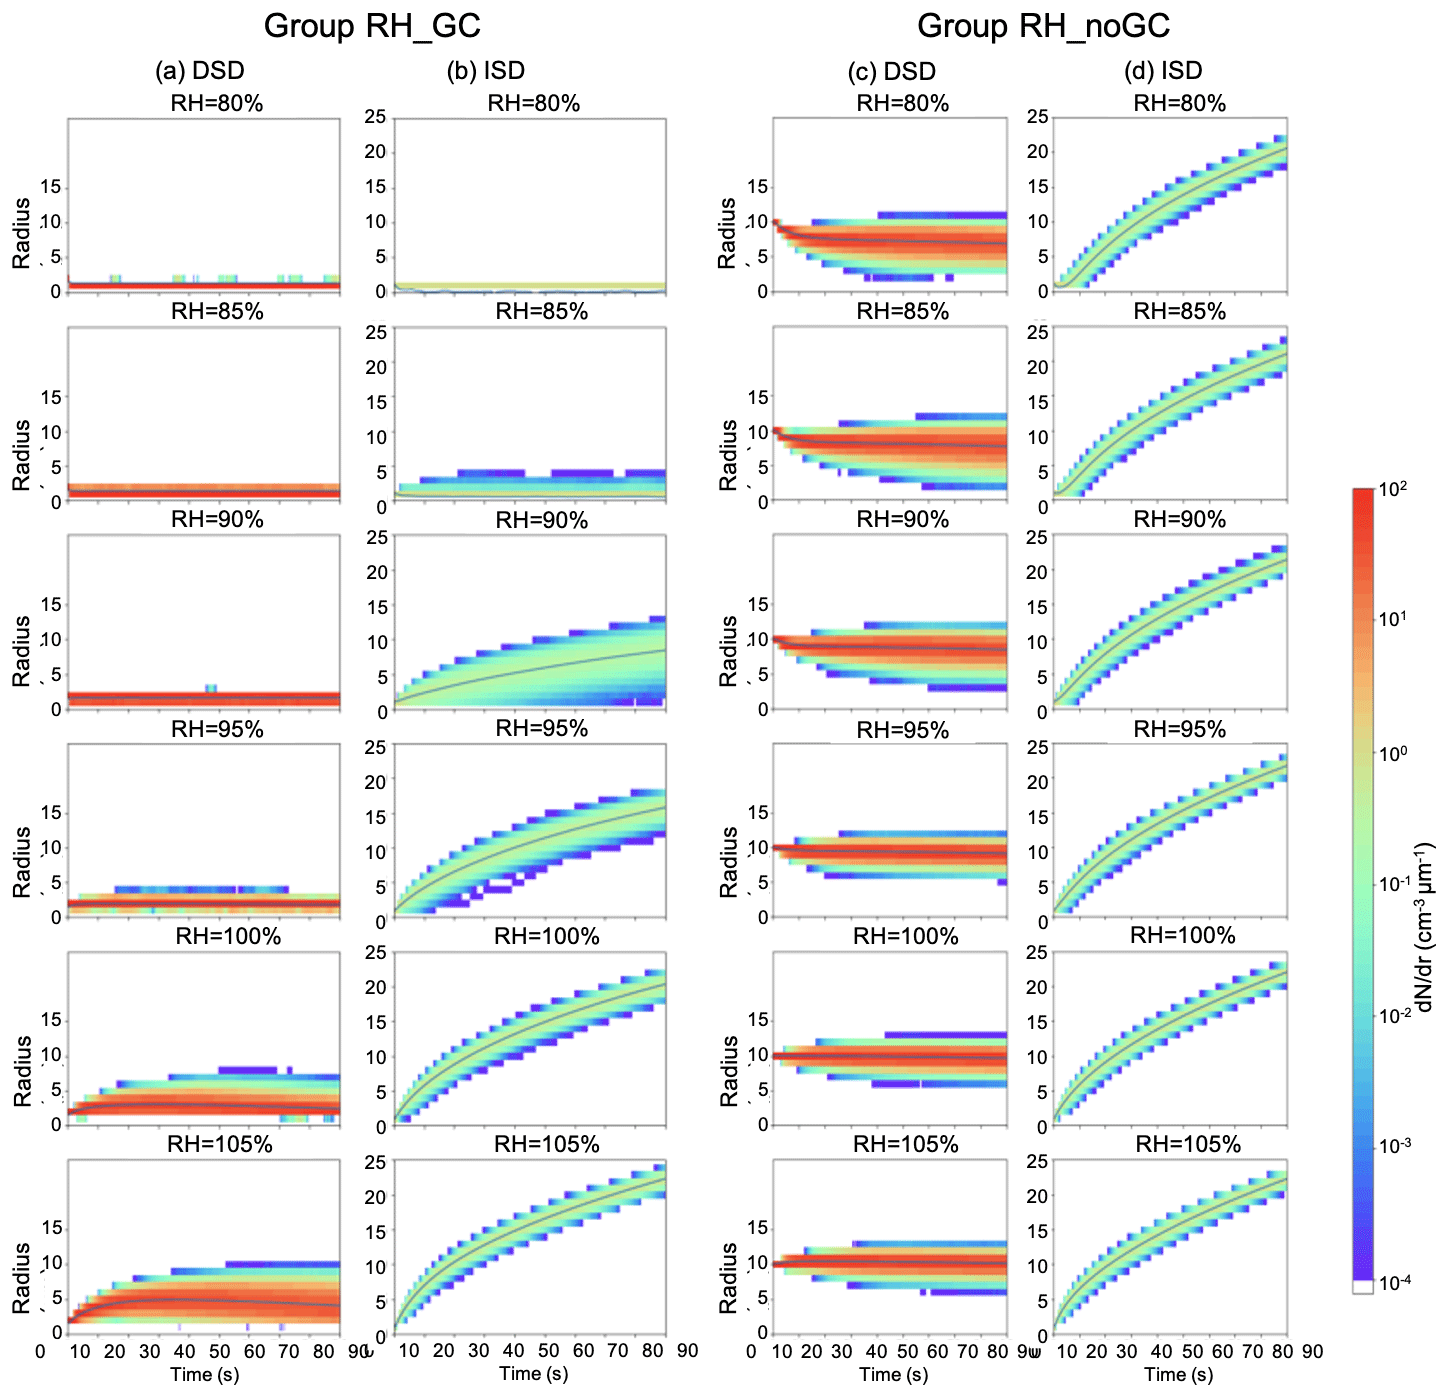
Figure 4From columns (a–d), the evolution of the (a) droplet size distribution and (b) ice size distribution in RH_noGC and the evolution of (c) droplet size distribution and (d) ice size distribution in RH_GC. From top to bottom, the initial relative humidity increases from 80 % to 105 %. Colors indicate the number concentration of the individual size bin.
Given that all ice particles have the same initial size, the broadening of the spectral width is solely due to the turbulent fluctuation of the supersaturation field. The spectral width of the ice peaked at RH = 90 %, where the supersaturation with respect to ice is close to 100 % (Fig. 2g). Ice particles can experience positive or negative supersaturation in their immediate vicinity, as they are advected by the turbulent flow. This results in a highly variable Lagrangian growth history within the ice population and thus the widest spectra. For cases with RH < 90 %, where Si ≪ 0 when reaching quasi-stationary, the growth of the entire ice population is inhibited; for cases with RH > 90 %, where Si ≫ 0 at quasi-stationarity, the effect of mean supersaturation dominates the fluctuations, and ice growth is less diversified. This can also be seen in RH_GC, where Si ≫ 0 in all simulations, the impact of initial RH on the mean ice radius and spectral width is negligible, and the ice PSDs are very similar (Fig. 4d). The theoretical study from Korolev (2008) found that for a typical LWC and IWC, ice growth is significantly less sensitive to the vertical velocity in mixed-phase clouds than the droplet growth. This finding is consistent with our finding, as the vertical velocity determines the saturation ratio (i.e., RH).
The effective impacts of supersaturation fluctuations on spectral widening can be quantified by the relative dispersion, which is a measure of the relative width of the PSD and is defined as the standard deviation of the particle radius normalized by its mean radius. In RH_GC, the relative dispersion of the ice size spectra only differs initially during the RH adjusting to quasi-stationarity and converges to the same width at the end (Fig. 5a). A mildly negative relation between the initial RH and relative dispersion of droplet size spectra is found (Fig. 5b), indicating that supersaturation fluctuations, which broaden the size spectra, play a more important role in a low subsaturated environment. In RH_noGC, the spectral broadening for both ice and droplets is more sensitive to the initial RH. Different from RH_GC, the relative dispersion of droplet size spectra shows a reverse trend and increases with RH (Fig. 5d). This reverse trend is because most of the droplets evaporate in the low RHs and therefore reach a nearly zero relative dispersion.
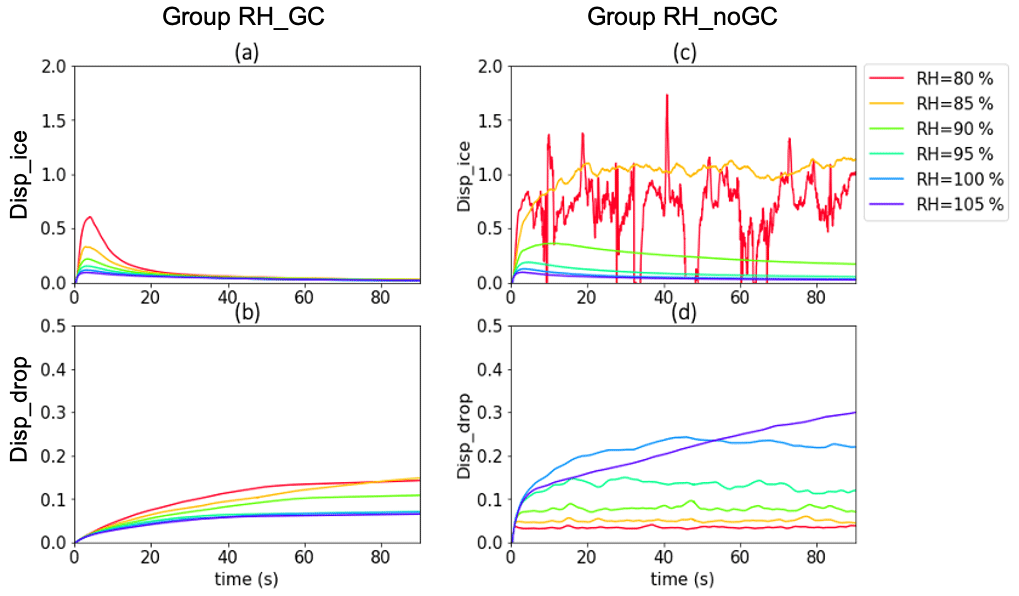
Figure 5The relative dispersion of (a, c) the ice size distribution and (b, d) the droplet size distribution in air parcels initiated with different RH. The left column shows results from RH_GC and the right column from RH_noGC.
4.2 Microphysical impact
Next, we investigate the microphysical impact, such as the initial particle number concentration and particle size, on the ice growth. In group High_IN, the range of ice number concentrations tested is much higher than the typical number concentrations of natural ice observed in mixed-phase clouds, which usually is much lower than 1 cm−3 in the atmosphere. However, it is well-recognized that measuring the ice particles below 100 µm is challenging and bears a high uncertainty. Ice particles with size ≪100 µm can be largely under detected. This means that 1 L−1 of ice particles > 100 µm could be a result of ice crystal growth at a higher concentration. Therefore, the purpose of using this higher range is (1) to examine the sensitivity of a resulting large ice particle number concentration to the initial ice crystal number concentration and (2) to test the upper-bound effects of ice number concentration.
Changing ice concentration exerts a huge impact. At Ni=100 cm−3, ice particles quickly consume the water vapor (Fig. 6c, d), and droplets completely evaporate after 50 s. Therefore, the parcel is glaciated within 1 min (Fig. 6e). Though both IWC and total water content (TWC) stay the highest of the three simulations, the mean ice radius could not grow beyond 10 µm, as too many ice crystals or ice-nucleating particles “overseeds” the cloud parcel and subsequently inhibits the formation of precipitating-size particles. In contrast, with Ni=1 cm−3, the parcel maintains a mixed phase much longer than the rest of the cases and sustains ice growth through the WBF process. Therefore, the formation of precipitating ice particles and the long-term persistence of mixed-phase conditions requires a relatively low ice number concentration (Ni≤ 1 cm−3) and a high LWC environment.
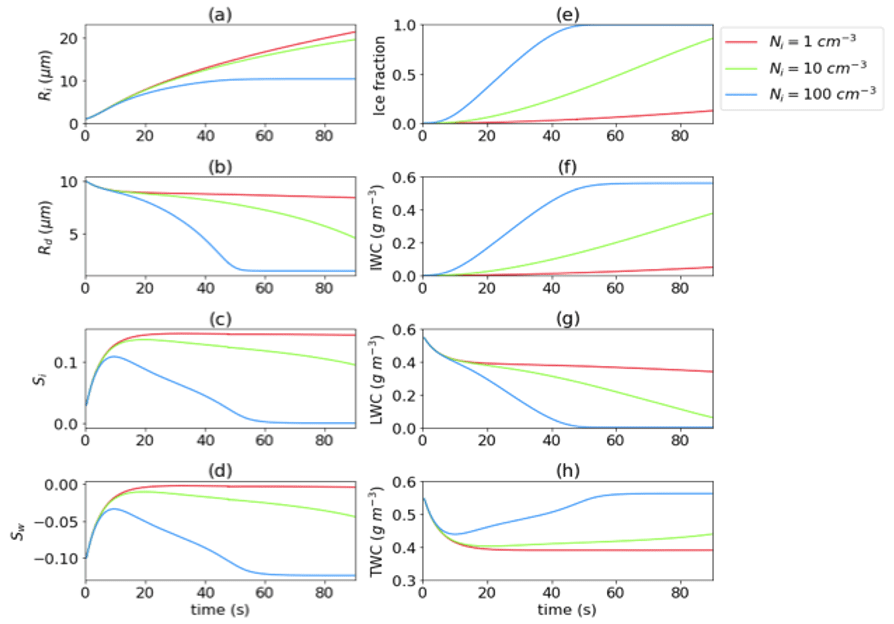
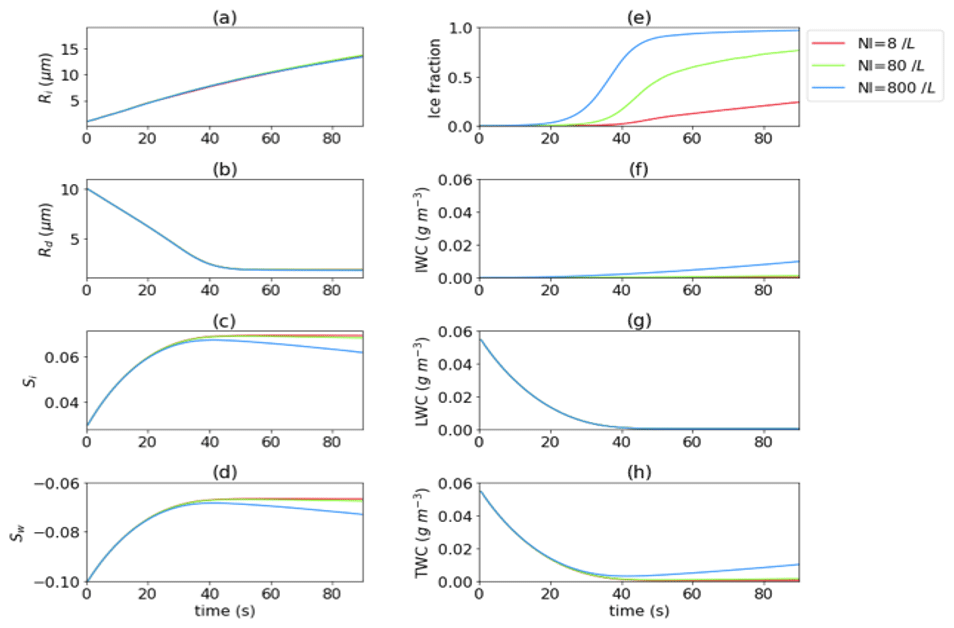
Figure 6Panels (a–d) are the same as Fig. 2 but for group High_IN. Panels (e–h) are the corresponding evolution of ice fraction, IWC, LWC, and total water content (TWC), respectively.
As is already demonstrated in High_IN above, for Ni≤ 1 cm−3 the parcel favors effective ice growth in a high LWC (0.55 g cm−3). In Low_IN experiments, the simulations were initiated with a lower LWC environment by reducing its droplet number concentration by a factor of 10 (LWC = 0.055 g cm−3, Nd=10 cm−3, Rd=10 µm, see also Table 2) to examine how ice number concentrations influence the ice growth in a low LWC. Unlike the High_IN, when Ni≤ 1 cm−3 the growth of ice and evaporation of droplets were insensitive to the ice number concentration (Fig. 7a–b) compared to High_IN. However, the higher number concentration can lead to a much higher glaciation rate (Fig. 6e). The mean supersaturation only starts to diverge after droplets nearly evaporate around 40 s (Fig. 7c–d). And ice growth in general is slower than in High_IN, shown in Fig. 6a, even though fewer ice particles are competing for water vapor. This implies that even if the ice number concentration is low (≪ 1 cm−3), a high LWC is necessary for rapid growth of big ice particles through diffusional growth.
4.3 Turbulent mixing impact
To further examine how turbulent-mixing-induced supersaturation fluctuations affect the ice growth and the glaciation process, we compare the results of the controlled experiment with the case without the turbulent mixing effects on the thermodynamic fluctuations. By comparing the two idealized simulations, we can isolate the impact of turbulent mixing on the microphysics at local scales (≪1 m).
The results show that local thermodynamic fluctuations generated by the turbulent mixing cascaded from larger scales have a negligible effect on the bulk (domain mean) properties, as seen in Fig. 8. The mean radius of the particles is almost identical except for a slightly smaller mean droplet radius in the thermodynamically forced case. The mean radius is calculated based on the arithmetic average; it is found that the volume-weighted mean radius is not altered by the fluctuation (not shown), substantiated by the identical LWC in Fig. 8g. As the small-scale fluctuations have a negligible effect on the bulk condensation, this implies that the microphysics parameterization on diffusional growth can neglect the effect from the sub-grid-scale fluctuations on the droplet mean property.
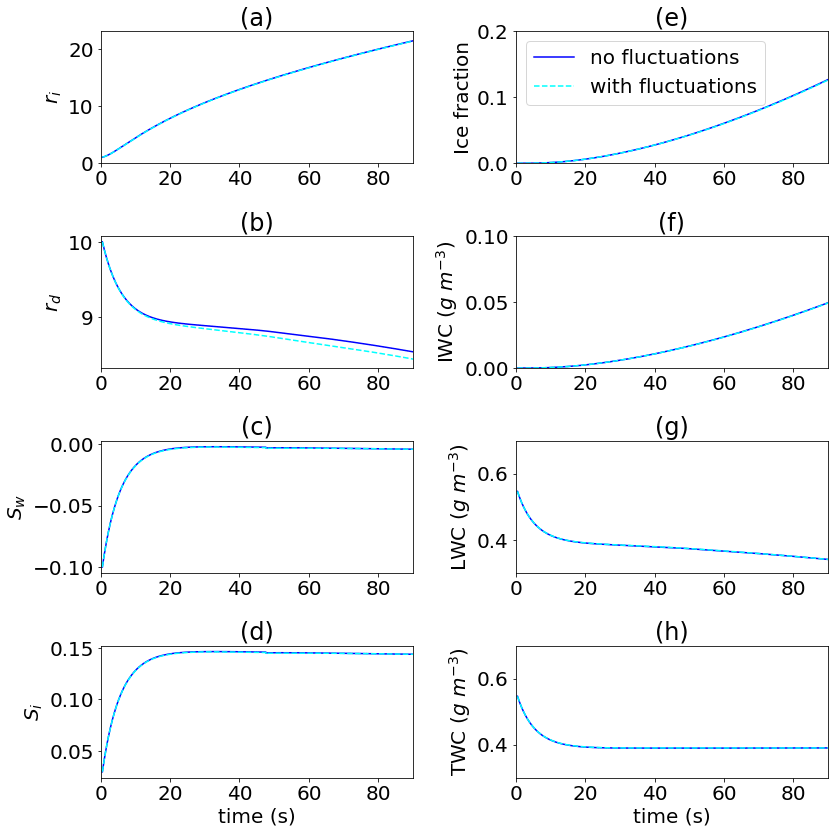
Figure 8Same as Fig. 6 but for group Turb with (dashed line) and without (solid line) turbulent mixing.
Albeit the same mean properties in both cases, the size distribution width broadening is significant. In our case, the particle distribution is monodispersed in the beginning. Therefore, the broadening is solely caused by the saturation fluctuations. We conducted another experiment without supersaturation fluctuations for comparison. It can be seen from the relative dispersion that no broadening happens in the case without supersaturation fluctuations (Fig. 9) because particles are exposed to a fluctuated supersaturation environment.
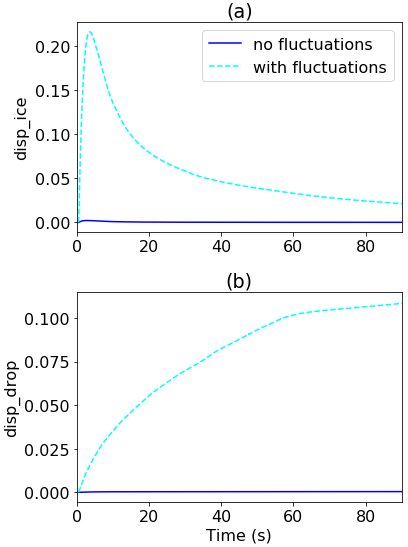
Figure 9The relative dispersion of (a) ice and (b) droplets varies with time for cases with and without thermodynamic fluctuations in the temperature and mixing ratio fields, and thus there are no supersaturation fluctuations.
This supersaturation-fluctuation-induced broadening can be further substantiated by looking at the spatial distribution of the supersaturation. Figure 10 displays the horizontal cross-section of the supersaturation fields at T= 41 s in the RH_GC for RH = 80 %. On average, this case manifests an active WBF process, with a mean negative supersaturation with respect to water ( %) and a mean positive supersaturation with respect to ice (∼15.0 %) (Fig. 2c–d). This leads to effective ice growth and droplet evaporation. However, Fig. 10 shows that turbulent mixing creates pockets of positive supersaturation with respect to water (with a maximum value of 2.3 % at this time point). This locally high supersaturation keeps the droplets from evaporation and even favors the droplet growth as shown in the PSD evolution in Fig. 4c. To quantitatively evaluate the spatial correlation between the droplet, ice, and supersaturation, Fig. 11a–b show the Pearson correlation between the particle radius and the supersaturation value at the particle's location (i.e., the Lagrangian supersaturation). For droplets, the correlation between the size and supersaturation field is always positive (with p value < 0.001). Correspondingly, the supersaturation fluctuations are strong in the first 10–20 s, leading to the strongest broadening. For ice particles, the correlation is positive before around 10 s (with p value < 0.001) and becomes insignificant afterwards. Therefore, compared to ice particles, droplet spectral broadening is more sensitive to the supersaturation fluctuation fields. This can also be substantiated by the evolution of size distributions in Fig. 4c–d: the ice spectral broadening due to supersaturation fluctuations is mostly significant in the first 10 s, while the droplet broadening is notable for the first 50 s. This effective broadening of ice and droplet particles within such a small domain again demonstrates the importance of small-scale fluctuations that could not be resolved by the commonly used cloud models or even large eddy simulations.

Figure 10Horizontal cross section of the simulation at t=41 s in the RH_GC group initialized with RH = 80 %. The filled color contour indicates the supersaturation with respect to water (%), and the contour lines refer to the supersaturation with respect to ice (%). The ice particles are marked as black dots and droplets as orange dots. The size of the particles reflects the relative difference in the radii of droplets and ice particles.
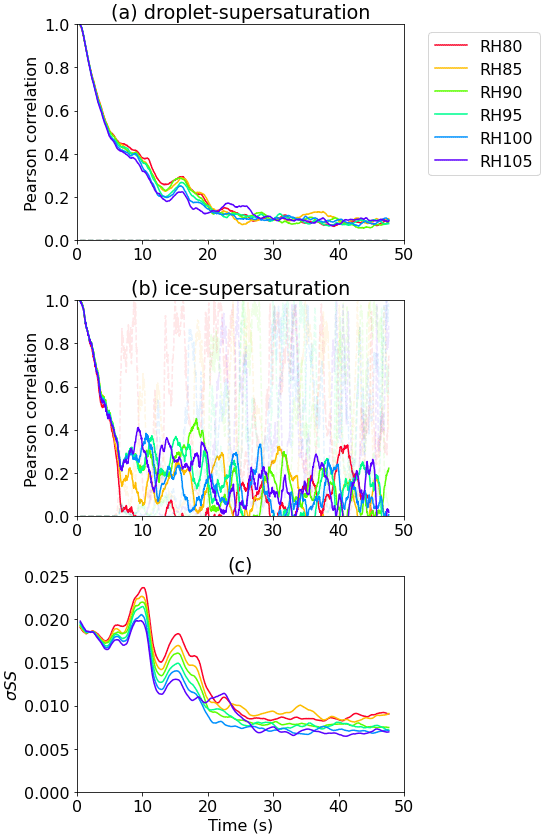
Figure 11The Pearson correlation coefficient (a) between the droplet size and the Lagrangian supersaturation and (b) between the ice radius and the Lagrangian supersaturation for the first 50 s in group RH_GC. The dashed pale-colored lines indicate the p value of the corresponding correlation coefficient. (c) The standard deviation of supersaturation fluctuation for the same period as in panels (a)–(b).
In this study, we developed the first DNS model capable of simulating mixed-phase cloud microphysics at its native scales and presented the first results of such a model. Six groups of experiments with initial conditions resembling the typical environments inside and outside of the cloud-top generating cells were conducted. By changing the environmental (macrophysical and turbulent) conditions and microphysical conditions, various potential factors affecting the ice growth are explored to unravel the favorable conditions for ice growth in GCs.
In summary, high LWC and high RH are critical to maintaining both effective ice growth and mixed-phase status. Generating cells with higher LWC and higher RH than the adjacent portion of the clouds provide ideal environments for efficient ice growth. In the meantime, solute effects from large aerosols can be important at the initial growth stage to maintain droplet growth and thus the increased LWC; this has an important implication for future cloud seeding operations to maintain high LWC for a more active WBF process.
The results show that in high LWC conditions the saturation field reaches quasi-stationary within 20 to 30 s. This quasi-stationarity is maintained through an unstable microphysical condition, in which the loss of water vapor from ice growth is continuously replenished through the evaporation of droplets (i.e., the WBF process), leading to a quasi-stationary RH. The timescale for reaching quasi-stationary in this mixed-phase environment is much slower than in a pure liquid environment. As a result, in a mixed-phase condition, where ice, droplets, and thermodynamic fields interact concurrently, the phase-relaxation timescale is not a reliable measure of the thermodynamic response time.
Sensitivity studies on ice number concentrations show that when the ice number concentration is below 1 cm−3, a typical range in the atmospheric clouds, a high LWC is needed for an efficient formation of big individual ice particles through diffusional growth. In addition, the ice radius growth rate is less sensitive to the ice number concentrations. However, a high ice number concentration > 10 cm−3 results in an early termination of the WBF process, fast glaciation of mixed-phase clouds, and suppression of the ice growth, which does not favor the formation of hydrometeors. This finding has an applicational implication on the winter-cloud seeding.
By comparing the cases with and without turbulent mixing, it is found that small-scale thermodynamic fluctuations substantially broaden the particle size spectra. It is found that droplet spectral broadening is in general more sensitive to turbulent fluctuations; ice spectral width remains very similar when it is supersaturated with respect to ice, and broadening of ice size distribution is mostly prominent when the environment is close to ice saturation. The effective broadening at a timescale as fast as a few seconds and at a length scale down to centimeter scales demonstrates the importance of small-scale fluctuations that could not be resolved by the commonly used cloud models or even large eddy simulations. However, the simulation also shows that the fluctuations have a negligible effect on the mean properties such as the mean radius and mean saturation ratio.
The current study represents the first attempt to use the DNS model to understand the mixed-phase cloud microphysics at local scales. This first result reveals the capability of such an ultra-fine-resolution model to address the outstanding problems in mixed-phase cloud research. It bears some limitations and requires future work to fill the gaps. Firstly, studies that consider collisions between droplets and ice particles are needed to further investigate the turbulent effect on the evolution of particle size distribution through collisions. Secondly, the mixing of air parcels of different properties not only affects the fluctuations but also influences the mean properties. In addition to the turbulent mixing effects on thermodynamic fluctuations, impacts on the mean temperature and mixing ratio also need to be considered to reflect the realistic entrainment-mixing process. Observations on the cooling rate, variation of mixing ratio at scales much larger than the DNS, and dynamical and microphysical information along the Lagrangian trajectory in a 3D high-resolution cloud model such as LES can help to better constrain the DNS for a more realistic investigation of the mixed-phase processes at the microscale. Thirdly, the ice geometry information is important to determine its fall velocity and diffusional growth rate and needs to be considered to better represent the evolution of ice particle size distribution (Korolev et al., 1999; Fukuta 1969; Avramov and Harrington, 2010; Chen and Lamb, 1994; Jensen et al., 2017; Jensen and Harrington, 2015; Morrison et al., 2020). Ongoing modification is conducted to improve the model.
With the current model capability and ongoing development, the future application of the DNS on ice and mixed-phase microphysics can also be promising in reproducing or comparing with the results in the laboratory experiments (Desai et al., 2019), which can provide process-level understanding of the experiments and help design new experiments and new laboratory facilities with the well-validated model (Shaw et al., 2020).
The data of this study are available to download in the Harvard Dataverse (https://doi.org/10.7910/DVN/BKYGWW, Chen, 2022a). Figures were made with matplotlib on the Jupyter Notebook. Part of the software for the visualization associated with this paper is also stored in the Harvard Dataverse (https://doi.org/10.7910/DVN/BKYGWW, Chen, 2022a). The code has been uploaded to Zenodo (https://doi.org/10.5281/zenodo.7226573, Chen, 2022b) and is available upon request.
SC and LX developed the idea and designed the experiments. SC performed the numerical simulation and data analyses and prepared the manuscript. KI collected and post-processed the observational data. ST, CW, RR, MK, DB, SP, MM, and ND provided constructive feedback on this research. All authors made substantial contributions to this work.
The contact author has declared that none of the authors has any competing interests.
Publisher’s note: Copernicus Publications remains neutral with regard to jurisdictional claims in published maps and institutional affiliations.
We would like to thank Jeff French, Wojciech Grabowski, and Anders Jensen for their valuable discussion. Lulin Xue thanks Paul Field for the inspirational discussion on this topic that led to the development of the mixed-phase DNS capability. Computing resources were provided by the Climate Simulation Laboratory at NCAR's Computational and Information Systems Laboratory (CISL).
This research has been supported by the National Science Foundation under cooperative agreement no. 1852977 and Idaho Power Company.
This paper was edited by Thijs Heus and reviewed by two anonymous referees.
Avramov, A. and Harrington, J. Y.: Influence of parameterized ice habit on simulated mixed phase Arctic clouds, J. Geophys. Res.-Atmos., 115, D03205, https://doi.org/10.1029/2009JD012108, 2010.
Ayala, O., Rosa, B., Wang, L.-P., and Grabowski, W. W.: Effects of turbulence on the geometric collision rate of sedimenting droplets. Part 1. Results from direct numerical simulation, New J. Phys., 10, 075015, https://doi.org/10.1088/1367-2630/10/7/075015, 2008.
Barrett, A. I., Hogan, R. J., and Forbes, R. M.: Why are mixed-phase altocumulus clouds poorly predicted by large-scale models? Part 1. Physical processes, J. Geophys. Res.-Atmos., 122, 9903–9926, https://doi.org/10.1002/2016JD026321, 2017.
Baumgardner, D, Abel, S. J., Axisa, D., Cotton, R., Crosier, J., Field, P., Gurganus, C., Heymsfield, A., Korolev, A., Kraemer, M., and Lawson, P.: Cloud Ice Properties: In Situ Measurement Challenges, Meteor. Mon., 58, 9.1–9.23, https://doi.org/10.1175/AMSMONOGRAPHS-D-16-0011.1, 2017.
Chen, J.-P., and Lamb, D.: The Theoretical Basis for the Parameterization of Ice Crystal Habits: Growth by Vapor Deposition, J. Atmospheric Sci., 51, 1206–1222, https://doi.org/10.1175/1520-0469(1994)051<1206:TTBFTP>2.0.CO;2, 1994.
Chen, S.: Replication Data for “Mixed-phase Direct Numerical Simulation: Ice Growth in Cloud-Top Generating Cells”, V1, Harvard Dataverse [data set], https://doi.org/10.7910/DVN/BKYGWW, 2022a.
Chen, S.: NCAR mixed-phase direct numerical simulation (DNS) (1.0), Zenodo [code], https://doi.org/10.5281/zenodo.7226573, 2022b.
Chen, S., Bartello, P., Yau, M. K., Vaillancourt, P. A., and Zwijsen, K.: Cloud Droplet Collisions in Turbulent Environment: Collision Statistics and Parameterization, J. Atmos. Sci., 73, 621–636, https://doi.org/10.1175/JAS-D-15-0203.1, 2016
Chen, S., Yau, M. K., and Bartello, P.: Turbulence Effects of Collision Efficiency and Broadening of Droplet Size Distribution in Cumulus Clouds, J. Atmos. Sci., 75, 203–217, https://doi.org/10.1175/JAS-D-17-0123.1, 2018a.
Chen, S., Yau, M.-K., Bartello, P., and Xue, L.: Bridging the condensation–collision size gap: a direct numerical simulation of continuous droplet growth in turbulent clouds, Atmos. Chem. Phys., 18, 7251–7262, https://doi.org/10.5194/acp-18-7251-2018, 2018b.
Chen, S., Xue, L., and Yau, M.-K.: Impact of aerosols and turbulence on cloud droplet growth: an in-cloud seeding case study using a parcel–DNS (direct numerical simulation) approach, Atmos. Chem. Phys., 20, 10111–10124, https://doi.org/10.5194/acp-20-10111-2020, 2020.
Chen, S., Yau, M. K., and Yau, M. K.: Hygroscopic Seeding Effects of Giant Aerosol Particles Simulated by the Lagrangian-Particle-Based Direct Numerical Simulation, Geophys. Res. Lett., 48, e2021GL094621, https://doi.org/10.1029/2021GL094621, 2021.
Desai, N., Chandrakar, K. K., Kinney, G., Cantrell, W., and Shaw, R. A.: Aerosol-Mediated Glaciation of Mixed-Phase Clouds: Steady-State Laboratory Measurements, Geophys. Res. Lett., 46, 9154–9162, https://doi.org/10.1029/2019GL083503, 2019.
Field, P. R., Lawson, R. P., Brown, P. R., Lloyd, G., Westbrook, C., Moisseev, D., Miltenberger, A., Nenes, A., Blyth, A., Choularton, T., and Connolly, P.: Secondary ice production: Current state of the science and recommendations for the future, Meteor. Mon., 58, 7–1, 2017.
Fridlind, A. M., van Diedenhoven, B., Ackerman, A. S., Avramov, A., Mrowiec, A., Morrison, H., Zuidema, P., and Shupe, M. D.: A FIRE-ACE/SHEBA Case Study of Mixed-Phase Arctic Boundary Layer Clouds: Entrainment Rate Limitations on Rapid Primary Ice Nucleation Processes, J. Atmos. Sci., 69, 365–389, https://doi.org/10.1175/JAS-D-11-052.1, 2012.
Fukuta, N.: Experimental Studies on the Growth of Small Ice Crystals, J. Atmospheric Sci., 26, 522–531, https://doi.org/10.1175/1520-0469(1969)026<0522:ESOTGO>2.0.CO;2, 1969.
Gotoh, T., Suehiro, T., and Saito, I.: Continuous growth of cloud droplets in cumulus cloud, New J. Phys., 18, 043042, https://doi.org/10.1088/1367-2630/18/4/043042, 2016.
Gotoh, T., Saito, I., and Watanabe, T.: Spectra of supersaturation and liquid water content in cloud turbulence, Phys. Rev. Fluids, 6, 110512, https://doi.org/10.1103/PhysRevFluids.6.110512, 2021.
Grabowski, W. W. and Wang, L.-P.: Growth of Cloud Droplets in a Turbulent Environment, Annu. Rev. Fluid Mech., 45, 293–324, https://doi.org/10.1146/annurev-fluid-011212-140750, 2013.
Grabowski, W. W., Andrejczuk, M., and Wang, L.-P.: Droplet growth in a bin warm-rain scheme with Twomey CCN activation, Atmos. Res., 99, 290–301, https://doi.org/10.1016/j.atmosres.2010.10.020, 2011.
Heymsfield, A. J., Krämer, M., Luebke, A., Brown, P., Cziczo, D. J., Franklin, C., Lawson, P., Lohmann, U., McFarquhar, G., Ulanowski, Z., and Van Tricht, K.: Cirrus Clouds, Meteor. Mon., 58, 2.1–2.26, https://doi.org/10.1175/AMSMONOGRAPHS-D-16-0010.1, 2017.
Hoffmann, F.: Effects of Entrainment and Mixing on the Wegener–Bergeron–Findeisen Process, J. Atmos. Sci., 77, 2279–2296, https://doi.org/10.1175/JAS-D-19-0289.1, 2020.
Jensen, A. A. and Harrington, J. Y.: Modeling Ice Crystal Aspect Ratio Evolution during Riming: A Single-Particle Growth Model, J. Atmos. Sci., 72, 2569–2590, https://doi.org/10.1175/JAS-D-14-0297.1, 2015.
Jensen, A. A., Harrington, J. Y., Morrison, H., and Milbrandt, J. A.: Predicting Ice Shape Evolution in a Bulk Microphysics Model, J. Atmos. Sci., 74, 2081–2104, https://doi.org/10.1175/JAS-D-16-0350.1, 2017.
Keeler, J. M., Jewett, B. F., Rauber, R. M., McFarquhar, G. M., Rasmussen, R. M., Xue, L., Liu, C., and Thompson, G.: Dynamics of Cloud-Top Generating Cells in Winter Cyclones. Part I: Idealized Simulations in the Context of Field Observations, J. Atmos. Sci., 73, 1507–1527, https://doi.org/10.1175/JAS-D-15-0126.1, 2016.
Khain, A., Pinsky, M., and Korolev, A.: Combined Effect of the Wegener-Bergeron-Findeisen Mechanism and Large Eddies on Microphysics of Mixed-Phase Stratiform Clouds, J. Atmos. Sci., 79, 383–407, https://doi.org/10.1175/JAS-D-20-0269.1, 2022.
Koop, T. and Mahowald, N.: The seeds of ice in clouds, Nature, 498, 302–303, https://doi.org/10.1038/nature12256, 2013.
Korolev, A.: Limitations of the Wegener–Bergeron–Findeisen Mechanism in the Evolution of Mixed-Phase Clouds, J. Atmos. Sci., 64, 3372–3375, https://doi.org/10.1175/JAS4035.1, 2007.
Korolev, A.: Rates of phase transformations in mixed-phase clouds, Q. J. Roy. Meteor. Soc., 134, 595–608, https://doi.org/10.1002/qj.230, 2008.
Korolev, A. and Field, P. R.: The Effect of Dynamics on Mixed-Phase Clouds: Theoretical Considerations, J. Atmos. Sci., 65, 66–86, https://doi.org/10.1175/2007JAS2355.1, 2008.
Korolev, A. and Isaac, G.: Roundness and Aspect Ratio of Particles in Ice Clouds. J. Atmos. Sci., 60, 1795–1808, https://doi.org/10.1175/1520-0469(2003)060<1795:RAAROP>2.0.CO;2, 2003.
Korolev, A. and Milbrandt, J.: How are mixed-phase clouds mixed?, Geophys. Res. Lett., 49, e2022GL099578, https://doi.org/10.1029/2022GL099578, 2022.
Korolev, A., Isaac, G. A., and Hallett, J.: Ice particle habits in Arctic clouds, Geophys. Res. Lett., 26, 1299–1302, https://doi.org/10.1029/1999GL900232, 1999.
Korolev, A., McFarquhar, G., Field, P. R., Franklin, C., Lawson, P., Wang, Z., Williams, E., Abel, S. J., Axisa, D., Borrmann, S., and Crosier, J.: Mixed-Phase Clouds: Progress and Challenges, Meteor. Mon., 58, 5.1–5.50, https://doi.org/10.1175/AMSMONOGRAPHS-D-17-0001.1, 2017.
Kumjian, M. R., Rutledge, S. A., Rasmussen, R. M., Kennedy, P. C., and Dixon, M.: High-Resolution Polarimetric Radar Observations of Snow-Generating Cells, J. Appl. Meteorol. Clim., 53, 1636–1658, https://doi.org/10.1175/JAMC-D-13-0312.1, 2014.
Lee, S. S., Ha, K.-J., Manoj, M. G., Kamruzzaman, M., Kim, H., Utsumi, N., Zheng, Y., Kim, B.-G., Jung, C. H., Um, J., Guo, J., Choi, K. O., and Kim, G.-U.: Midlatitude mixed-phase stratocumulus clouds and their interactions with aerosols: how ice processes affect microphysical, dynamic, and thermodynamic development in those clouds and interactions?, Atmos. Chem. Phys., 21, 16843–16868, https://doi.org/10.5194/acp-21-16843-2021, 2021.
Li, X.-Y., Brandenburg, A., Svensson, G., Haugen, N. E. L., Mehlig, B., and Rogachevskii, I.: Condensational and Collisional Growth of Cloud Droplets in a Turbulent Environment, J. Atmos. Sci., 77, 337–353, https://doi.org/10.1175/JAS-D-19-0107.1, 2020.
Morrison, H. and Pinto, J. O. : Intercomparison of Bulk Cloud Microphysics Schemes in Mesoscale Simulations of Springtime Arctic Mixed-Phase Stratiform Clouds, Mon. Weather Rev., 134, 1880–1900, https://doi.org/10.1175/MWR3154.1, 2006.
Morrison, H., de Boer, G., Feingold, G., Harrington, J., Shupe, M. D., and Sulia, K.: Resilience of persistent Arctic mixed-phase clouds, Nat. Geosci., 5, 11–17, https://doi.org/10.1038/ngeo1332, 2012.
Morrison, H., van Lier-Walqui, M., Fridlind, A. M., Grabowski, W. W., Harrington, J. Y., Hoose, C., Korolev, A., Kumjian, M. R., Milbrandt, J. A., Pawlowska, H., and Posselt, D. J.: Confronting the Challenge of Modeling Cloud and Precipitation Microphysics, J. Adv. Model. Earth Sy., 12, 8, https://doi.org/10.1029/2019MS001689, 2020.
Ovchinnikov, M., Ackerman, A. S., Avramov, A., Cheng, A., Fan, J., Fridlind, A. M., Ghan, S., Harrington, J., Hoose, C., Korolev, A., and McFarquhar, G. M.: Intercomparison of large-eddy simulations of Arctic mixed-phase clouds: Importance of ice size distribution assumptions, J. Adv. Model. Earth Sy., 6, 223–248, https://doi.org/10.1002/2013MS000282, 2014.
Petters, M. D. and Kreidenweis, S. M.: A single parameter representation of hygroscopic growth and cloud condensation nucleus activity, Atmos. Chem. Phys., 7, 1961–1971, https://doi.org/10.5194/acp-7-1961-2007, 2007.
Rauber, R. M., Plummer, D. M., Macomber, M. K., Rosenow, A. A., McFarquhar, G. M., Jewett, B. F., Leon, D., Owens, N., and Keeler, J. M.: The Role of Cloud-Top Generating Cells and Boundary Layer Circulations in the Finescale Radar Structure of a Winter Cyclone over the Great Lakes, Mon. Weather Rev., 143, 2291–2318, https://doi.org/10.1175/MWR-D-14-00350.1, 2015.
Rogers, R. R. and Yau, M. K.: A short course in cloud physics, 3rd ed., Butterworth-Heinemann, ISBN 0-7506-3215-1, 1989.
Saito, I., Gotoh, T., and Watanabe, T.: Broadening of Cloud Droplet Size Distributions by Condensation in Turbulence, J. Meteorol. Soc. Jpn., 97, 867–891, https://doi.org/10.2151/jmsj.2019-049, 2019.
Shaw, R. A., Cantrell, W., Chen, S., Chuang, P., Donahue, N., Feingold, G., Kollias, P., Korolev, A., Kreidenweis, S., Krueger, S., and Mellado, J. P.: Cloud–Aerosol–Turbulence Interactions: Science Priorities and Concepts for a Large-Scale Laboratory Facility, B. Am. Meteorol. Soc., 101, E1026–E1035, https://doi.org/10.1175/BAMS-D-20-0009.1, 2020.
Storelvmo, T. and Tan, I.: The Wegener-Bergeron-Findeisen process – Its discovery and vital importance for weather and climate, Meteorol. Z., 24, 455–461, https://doi.org/10.1127/metz/2015/0626, 2015.
Tessendorf, S. A., French, J. R., Friedrich, K., Geerts, B., Rauber, R. M., Rasmussen, R. M., Xue, L., Ikeda, K., Blestrud, D. R., Kunkel, M. L., and Parkinson, S.: A Transformational Approach to Winter Orographic Weather Modification Research: The SNOWIE Project, B. Am. Meteorol. Soc., 100, 71–92, https://doi.org/10.1175/BAMS-D-17-0152.1, 2019.
Vaillancourt, P. A., Yau, M. K., and Grabowski, W. W.: Microscopic Approach to Cloud Droplet Growth by Condensation. Part I: Model Description and Results without Turbulence, J. Atmos. Sci., 58, 1945–1964, https://doi.org/10.1175/1520-0469(2001)058<1945:MATCDG>2.0.CO;2, 2001.
Vaillancourt, P. A., Yau, M. K., Bartello, P., and Grabowski, W. W.: Microscopic Approach to Cloud Droplet Growth by Condensation. Part II: Turbulence, Clustering, and Condensational Growth, J. Atmos. Sci., 59, 3421–3435, https://doi.org/10.1175/1520-0469(2002)059<3421:MATCDG>2.0.CO;2, 2002.
Vowinckel, B., Biegert, E., Luzzatto-Fegiz, P., and Meiburg, E.: Consolidation of freshly deposited cohesive and noncohesive sediment: Particle-resolved simulations, Phys. Rev. Fluids, 4, 074305, https://doi.org/10.1103/PhysRevFluids.4.074305, 2019a.
Vowinckel, B., Withers, J., Luzzatto-Fegiz, P., and Meiburg, E.: Settling of cohesive sediment: particle-resolved simulations, J. Fluid Mech., 858, 5–44, https://doi.org/10.1017/jfm.2018.757, 2019b.
Wang, Y., McFarquhar, G. M., Rauber, R. M., Zhao, C., Wu, W., Finlon, J. A., Stechman, D. M., Stith, J., Jensen, J. B., Schnaiter, M., and Järvinen, E.: Microphysical Properties of Generating Cells Over the Southern Ocean: Results From SOCRATES, J. Geophys. Res.-Atmos., 125, e2019JD032237, https://doi.org/10.1029/2019JD032237, 2020.
Zhang, C. and Harrington, J. Y.: Including surface kinetic effects in simple models of ice vapor diffusion, J. Atmos. Sci., 71, 372–390, https://doi.org/10.1175/JAS-D-13-0153.1, 2014.