the Creative Commons Attribution 4.0 License.
the Creative Commons Attribution 4.0 License.
 | 05 May 2023
Impact of aerosol optics on vertical distribution of ozone in autumn over Yangtze River Delta
Shuqi Yan
Bin Zhu
Shuangshuang Shi
Wen Lu
Jinhui Gao
Hanqing Kang
Duanyang Liu
Tropospheric ozone, an important secondary pollutant, is greatly impacted by aerosols within boundary layer (BL). Previous studies have mainly attributed ozone variation to either aerosol–BL or aerosol–photolysis interactions at the near-surface level. In this study, we analyze the sensitivities of ozone response to aerosol mixing states (e.g., mixing behavior hypothesis of scattering and absorbing components) in the vertical direction and address the effects of aerosol–BL and aerosol–photolysis interactions on ozone profiles in autumn by Weather Research and Forecasting model coupled with Chemistry (WRF-Chem) simulations. The aerosol internal mixing state experiment reasonably reproduces the vertical distribution and time variation in meteorological elements and ozone. Sensitivity experiments show that aerosols lead to turbulent suppression, precursor accumulation, lower-level photolysis reduction, and upper-level photolysis enhancement. Consequently, ozone basically decreases within entire the BL during daytime (08:00–17:00 LT), and the decrease is the least in the external mixing state (2.0 %) when compared with internal (10.5 %) and core shell mixing states (8.6 %). The photolysis enhancement is the most significant in the external mixing state due to its strong scattering ability. By process analysis, lower-level ozone chemical loss is enhanced due to photolysis reduction and NOx accumulation under a volatile organic compound (VOC)-limited regime. Upper-level ozone chemical production is accelerated due to a higher photolysis rate resulting from aerosol backscattering. Therefore, the increased ozone entrainment from BL aloft to the surface induced by the boosted ozone vertical gradient outweighs the decreased ozone entrainment induced by turbulent suppression after 11:00 LT. Additional simulations support the finding that the aerosol effect on precursors, photolysis, and ozone is consistent under different underlying surface and pollution conditions.
- Article
(3902 KB) - Full-text XML
- BibTeX
- EndNote


Tropospheric ozone is an important secondary pollutant that is produced by the photochemistry of VOCs (volatile organic compounds) and NOx. The variation in ozone is determined by the highly variable interactions among meteorology, precursors, photochemistry, and aerosols. Tropospheric ozone, especially in the atmospheric boundary layer (BL), exerts side effects such as impairing human health, contributing to global warming, and aggravating air pollution (Fu et al., 2019). Since 2013, the severe PM2.5 pollution over East China has been mitigated, but the ozone concentration is increasing (Li et al., 2020). Therefore, the characteristic of ozone variation and its relationship with external factors need to be intensively studied.
The interactions between ozone and aerosols are complicated and have attracted wide concern in recent years. Aerosols can significantly affect ozone photochemistry by influencing photolysis process (herein called the aerosol–photolysis interaction). The weakened solar radiation reaching the ground, induced by aerosol extinction, can decrease the photolysis rate at the surface and within several hundred meters above the surface, thus inhibiting ozone production and resulting in lower ozone concentration (Gao et al., 2020; Jacobson, 1998; Li et al., 2011). Contrarily, scattering aerosols increase upward shortwave radiation, which may promote ozone formation at a higher altitude (J. Gao et al., 2021). Dickerson et al. (1997) and Shi et al. (2022) demonstrated that aerosol pollution can increase ultraviolet radiation remarkably at a few hundred meters above the aerosol layer, which accelerates photolysis and increases ozone concentration by about 3–20 ppb (parts per billion). Additionally, heterogeneous reactions on the aerosol surface can also influence ozone chemistry (Jacob, 2000; Li et al., 2019; Lou et al., 2014).
Aerosols affect BL thermodynamics and ultimately result in ozone change, which has attracted much attention in recent years. The perturbation in the radiation flux profile induced by aerosols can alter the BL structure, thus influencing vertical mixing and affecting ozone and precursor concentration (herein called aerosol–BL interaction). Aerosols stabilize BL and suppress turbulent mixing (Ding et al., 2016; Li et al., 2017), which can inhibit the vertical exchange of ozone. Gao et al. (2018) studied the effect of black carbon (BC) on ozone variation within the BL. BC weakens turbulent mixing and inhibits the higher ozone aloft from being entrained downward. Additionally, the suppression of BL leads to the accumulation of NOx, which promotes the formation of radicals and the chemical production of ozone. The weakening in ozone mixing outweighs the enhancement in the ozone chemical production, so the surface ozone is decreased during the daytime.
The effect of aerosols on BL is related to aerosol optics, which are determined by the aerosol morphology (Liu et al., 2019), hygroscopicity (Zeng et al., 2019), coating process (Bond et al., 2006), and chemical composition. The aerosol chemical composition in East China is dominated by SNA (sulfate, nitrate, and ammonium; larger than 50 %), followed by organic matter and BC (3 %–8 %; Yang et al., 2011; Tan et al., 2020, 2022). The contribution of SNA to the total aerosol scattering coefficient can reach up to 60 % (Tian et al., 2015), and BC accounts for more than 70 % of total aerosol absorbing coefficient (Yang et al., 2009). Furthermore, aerosol optics are strongly affected by aerosol mixing states. Since the real-world mixing state is highly variable and hard to be explicitly resolved (Riemer and West, 2013), three typical mixing states are generally hypothesized by previous works, namely internal mixing, core shell mixing, and external mixing. The mixing state is largely affected by the mixing behavior of BC with other aerosol species. The freshly emitted BC is commonly externally mixed with other species, but it will become more internally mixed due to coating process (Riemer et al., 2019). The BC light absorption can be amplified by a factor of 50 %–200 % after being coated with scattering aerosols (Cappa et al., 2012; Jacobson, 2001; Liu et al., 2017). Accordingly, the aerosol mixing state alters the aerosol optical properties and affects its interactions with BL and photolysis. M. Gao et al. (2021) found that aerosols result in a smaller planetary boundary layer height (PBLH) reduction in external mixing (11.6 m) than in core shell mixing (24 m), consequently leading to different changes in photolysis rates and ozone concentration.
Many studies reveal the aerosol effect on ozone at the near-surface level. Aerosols notably affect ozone photochemistry at all heights within BL and ultimately influence ozone vertical distribution and turbulent exchange. Therefore, the aerosol-induced ozone variation could have larger complexity and uncertainty in the vertical direction, which should be explored further. Additionally, previous studies explain ozone variation mainly by either aerosol–BL or aerosol–photolysis interaction, but relatively few of them consider these two mechanisms together. In this study, we aim to quantitatively reveal the impact of aerosols on the ozone profile through the two pathways (aerosol–BL and aerosol–photolysis interactions) used by the Weather Research and Forecasting model coupled with Chemistry (WRF-Chem) simulations and how aerosol effect varies with aerosol mixing states in autumn over the Yangtze River Delta (YRD) region in China. Heterogeneous chemistry is not included in this study. The paper is organized as follows: Sect. 2 introduces the data, model, and sensitivity experiments. Section 3.1 evaluates the model performances. Section 3.2 to 3.4 reveal the characteristics of aerosol–BL and aerosol–photolysis interactions and their impacts on ozone variation. Section 4 discusses the robustness of the simulation results under different conditions. Section 5 concludes the findings of this study.
2.1 Data
A field campaign was conducted at an industrial zone in the north Nanjing suburbs (118.71∘ E, 32.27∘ N) from 15 October to 15 November 2020 (Fig. 1). We collected the vertical profiles of meteorological elements (temperature, wind speed, and direction) and air pollutants (PM2.5, BC, and ozone). Meteorological elements are measured by an XLS II tethered balloon system, with a sounding balloon at 08:00 and 14:00 LT. The data are sampled at each second until it loses signal. Air pollutant observation instruments are mounted on a UAV platform. The UAV climbs vertically from the ground to about 1 km with a speed of 2 m s−1, and it descends along the same path at the same speed. The unmanned aerial vehicle (UAV) is launched four times a day at around 09:00, 11:00, 14:00, and 16:00 LT. The introduction of the observation instruments for PM2.5, BC, and ozone can be found in Shi et al. (2020, 2022). Meteorology and air pollutants profiles are averaged to 50 m intervals. These data are used to evaluate the model performance in the vertical direction.

Figure 1The model simulation domain (a) and the surrounding area of the observation site (b). The red point in panel (a) and the yellow symbol in panel (b) are the observation site in Nanjing (NJ). The four blue points in panel (a) are the Changzhou (CZ), Huainan (HN), Maanshan (MS), and Huaian (HA) sites.
The ground meteorology observation data are from the Meteorological Information Comprehensive Analysis Process System (MICAPS; Li et al., 2010) and include temperature, wind speed, and wind direction recorded every 3 h. The ground air quality data are from China National Environmental Monitoring Centre (http://www.aqistudy.cn/, last access: 22 April 2023) and include PM2.5, ozone, and other pollutants. We use the temperature, wind speed, wind direction, PM2.5, and ozone data to evaluate the model performance on the time series of meteorological elements and air pollutants.
2.2 Model configuration
The model used in this study is the WRF-Chem (V3.9.1.1) model (Fast et al., 2006; Grell et al., 2005). It is the state-of-the-art atmospheric model that couples meteorology and chemistry online. Two domains are set up, with the central point at the observation site (118.71∘ E, 32.27∘ N; Fig. 1). The parent domain has the size of 79 × 79 grids, with a grid spacing of 27 km. The inner domain has the size of 79 × 79 grids, with a grid spacing of 9 km, covering the majority of the YRD region. To better describe the turbulent process, the vertical level is refined to 38 layers, 12 of which are below 2 km. All the model results are calculated at the nearest grid close to the observation site if not otherwise specified.
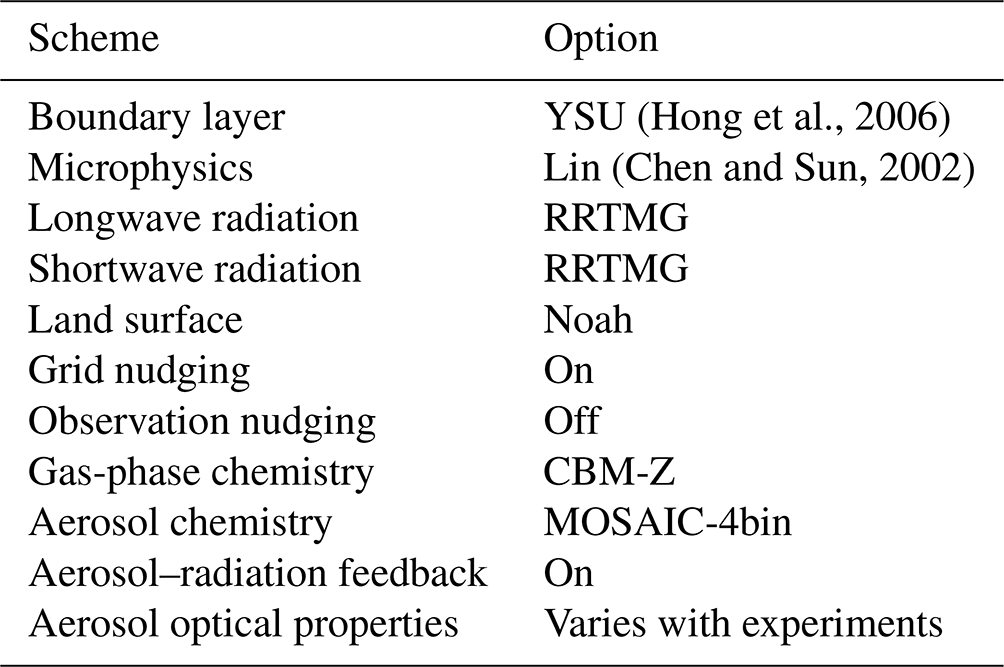
The anthropogenic emission inventory in the base year of 2020 is provided by the Multi-resolution Emission Inventory for China (MEIC) from Tsinghua University (Zheng et al., 2018; http://www.meicmodel.org/, last access: 22 April 2023). The MEIC includes major gaseous and aerosol species, e.g., SO2, NH3, VOCs, NOx, BC, PM2.5, and PM10. The gas chemical mechanism is Carbon Bond Mechanism Z (CBM-Z; Zaveri and Peters, 1999), and the aerosol chemical mechanism is the Model for Simulating Aerosol Interactions and Chemistry with four bins (MOSAIC-4bin; Zaveri et al., 2008). These two chemical mechanisms are widely used for studying ozone chemistry. Detailed physical and chemical schemes are listed in Table 1.
Table 1Physical and chemical parameterization schemes. Note that YSU stands for Yonsei University.
The initial and boundary fields of meteorology are provided by ERA5 0.25∘ × 0.25∘ reanalysis data (https://cds.climate.copernicus.eu/cdsapp#!/dataset/reanalysis-era5-pressure-levels?tab=form, last access: 22 April 2023). The chemical initial and boundary fields are provided by WACCM (https://www2.acom.ucar.edu/gcm/waccm, last access: 22 April 2023). They are all updated every 6 h. The simulation starts at 08:00 LT on 15 October and ends at 20:00 LT on 15 November, and the first 72 h is a spin-up period. All the times here are given in local time (UTC+8).
2.3 Aerosol optics and sensitivity experiments
In this work, the effect of aerosol optics on ozone profiles is addressed by its mixing states. We study three ideal types of mixing states, namely internal mixing, core shell mixing, and external mixing, which depend on the mixing behavior hypothesis of scattering and absorbing components. In the internal mixing state, the relative fractions of chemical species in one particle are the same as that of the bulk aerosols. The complex refractive index (RI) of bulk aerosols is calculated by the volume-averaged RI of all aerosol species, and then it is passed to the Mie optical module to calculate the required optical parameters (e.g., scattering coefficient, absorbing coefficient, and single-scattering albedo). The detailed formulas of aerosol optical parameters for the MOSAIC sectional scheme are documented by previous works (e.g., Fast et al., 2006; Grell et al., 2005). In core shell mixing, aerosol particles are hypothesized to be concentric spheres, with BC as the core and non-BC aerosols as the coating shell (Riemer et al., 2019). The RI of the shell is the volume-averaged RI of non-BC aerosols, and the optics of the core shell mixed particles can also be treated by the Mie optical module (Ackerman and Toon, 1981). In the external mixing state, each particle contains only one species with fixed optical characteristics. It is not included in the current WRF-Chem model, and the approximate treatment has been proposed by M. Gao et al. (2021). In general, the Mie optical module separates BC aerosols from the bulk aerosols and treats the optics of non-BC and BC aerosols individually.
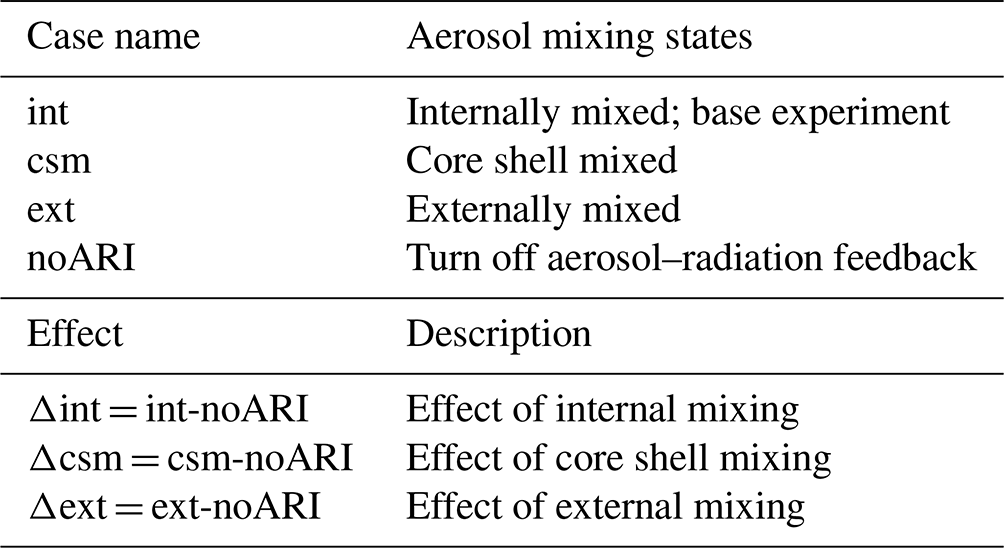
To study the aerosol effect on ozone, four experiments are conducted (Table 2). The case “int” is the base experiment (the default option in WRF-Chem), in which the aerosols are internally mixed. The cases “csm” and “ext” are core shell mixing and external mixing, respectively. The case “noARI” turns off aerosol–radiation feedback by setting aerosol optical depth as zero in radiation and photolysis modules. Therefore, the difference between noARI and three other experiments indicates the effect of aerosols in the corresponding mixing state.
One should note that the real-world aerosol mixing state varies with emission, meteorology, composition, and other factors. The dynamic evolution of the aerosol mixing state and its influencing factors have not been addressed in most current 3D models (Matsui et al., 2013). This work addresses aerosol optics with the three ideal mixing states, which will inevitably cause the simulated aerosol optics to deviate from observations.
It is an obvious pollution stage on 2 November 2020. The model evaluation on profiles (Sect. 3.1) and the mechanism of aerosols affecting ozone variation (Sect. 3.2 to 3.4) are presented at the Nanjing site during that day. The model evaluation on the time series (Sect. 3.1) and the aerosol effect under different pollution conditions (Sect. 4) are presented during the simulation period (15 October to 15 November).
3.1 Model evaluations
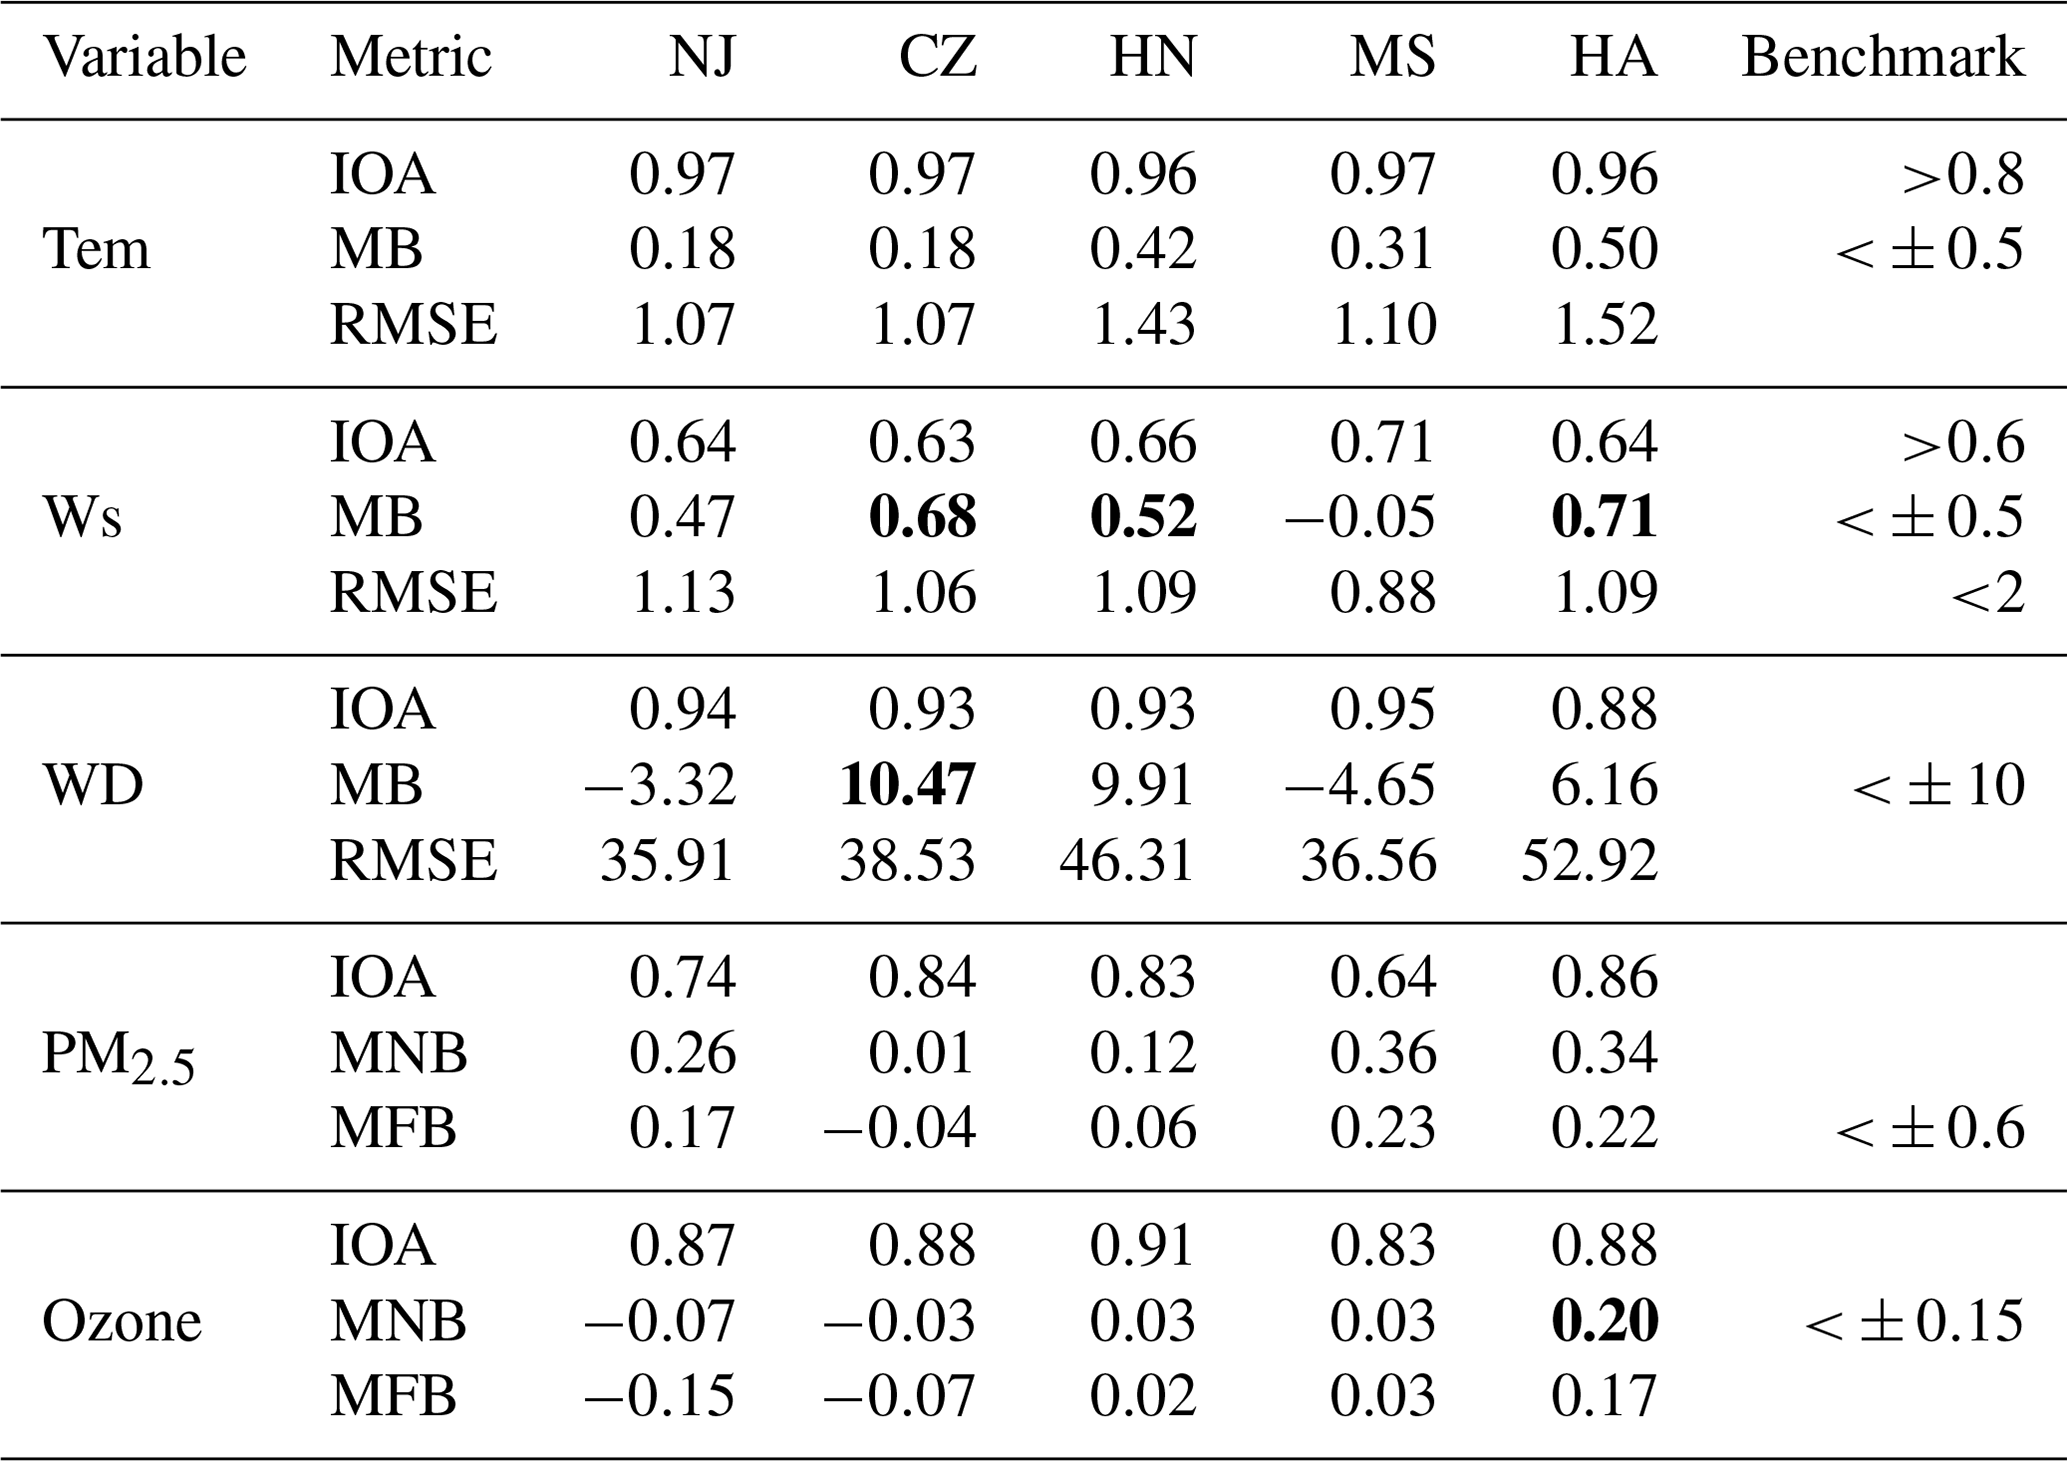
Four additional sites around Nanjing, i.e., Changzhou (CZ), Huainan (HN), Maanshan (MS), and Huaian (HA; Fig. 1) are chosen to evaluate the performance on the time variation in meteorological parameters (temperature, wind speed, and wind direction), PM2.5, and ozone in the base experiment (internal mixing). The statistical metrics include the index of agreement (IOA), mean bias (MB), root mean square error (RMSE), mean normalized bias (MNB), and mean fractional bias (MFB). The calculations are from Lu et al. (1997), and especially the IOA of the wind direction is from Kwok et al. (2010). Benchmark values of meteorology and air pollutants are derived from Emery et al. (2001) and the U.S. Environmental Protection Agency (U.S. EPA, 2005, 2007). The temporal variations in simulated meteorology and air pollutants are generally in good agreement with observations (Fig. 2). From Table 3, temperature presents the highest IOA, with a slightly large MB at the HA site. The simulated wind direction is similar to observation, and MB exceeds benchmark value at only one site. The simulated wind speed is a bit higher, which is because the WRF model tends to overestimate wind speed due to the description of surface roughness (Jia and Zhang, 2020, 2021; Jiménez and Dudhia, 2012). PM2.5 is moderately overestimated, but all the metrics are within the benchmarks. The IOA of ozone exceeds 0.8 at all sites, and only one site shows a MNB that is not in agreement with the benchmark. The model statistical metrics of PM2.5 and ozone are consistent with previous works (Chen et al., 2022; Hu et al., 2016; Singh et al., 2012; Zhang et al., 2014a). Generally, the base experiment simulations on the temporal variation in meteorology and air pollutants are acceptable, which reasonably reproduces the observations in the atmosphere.
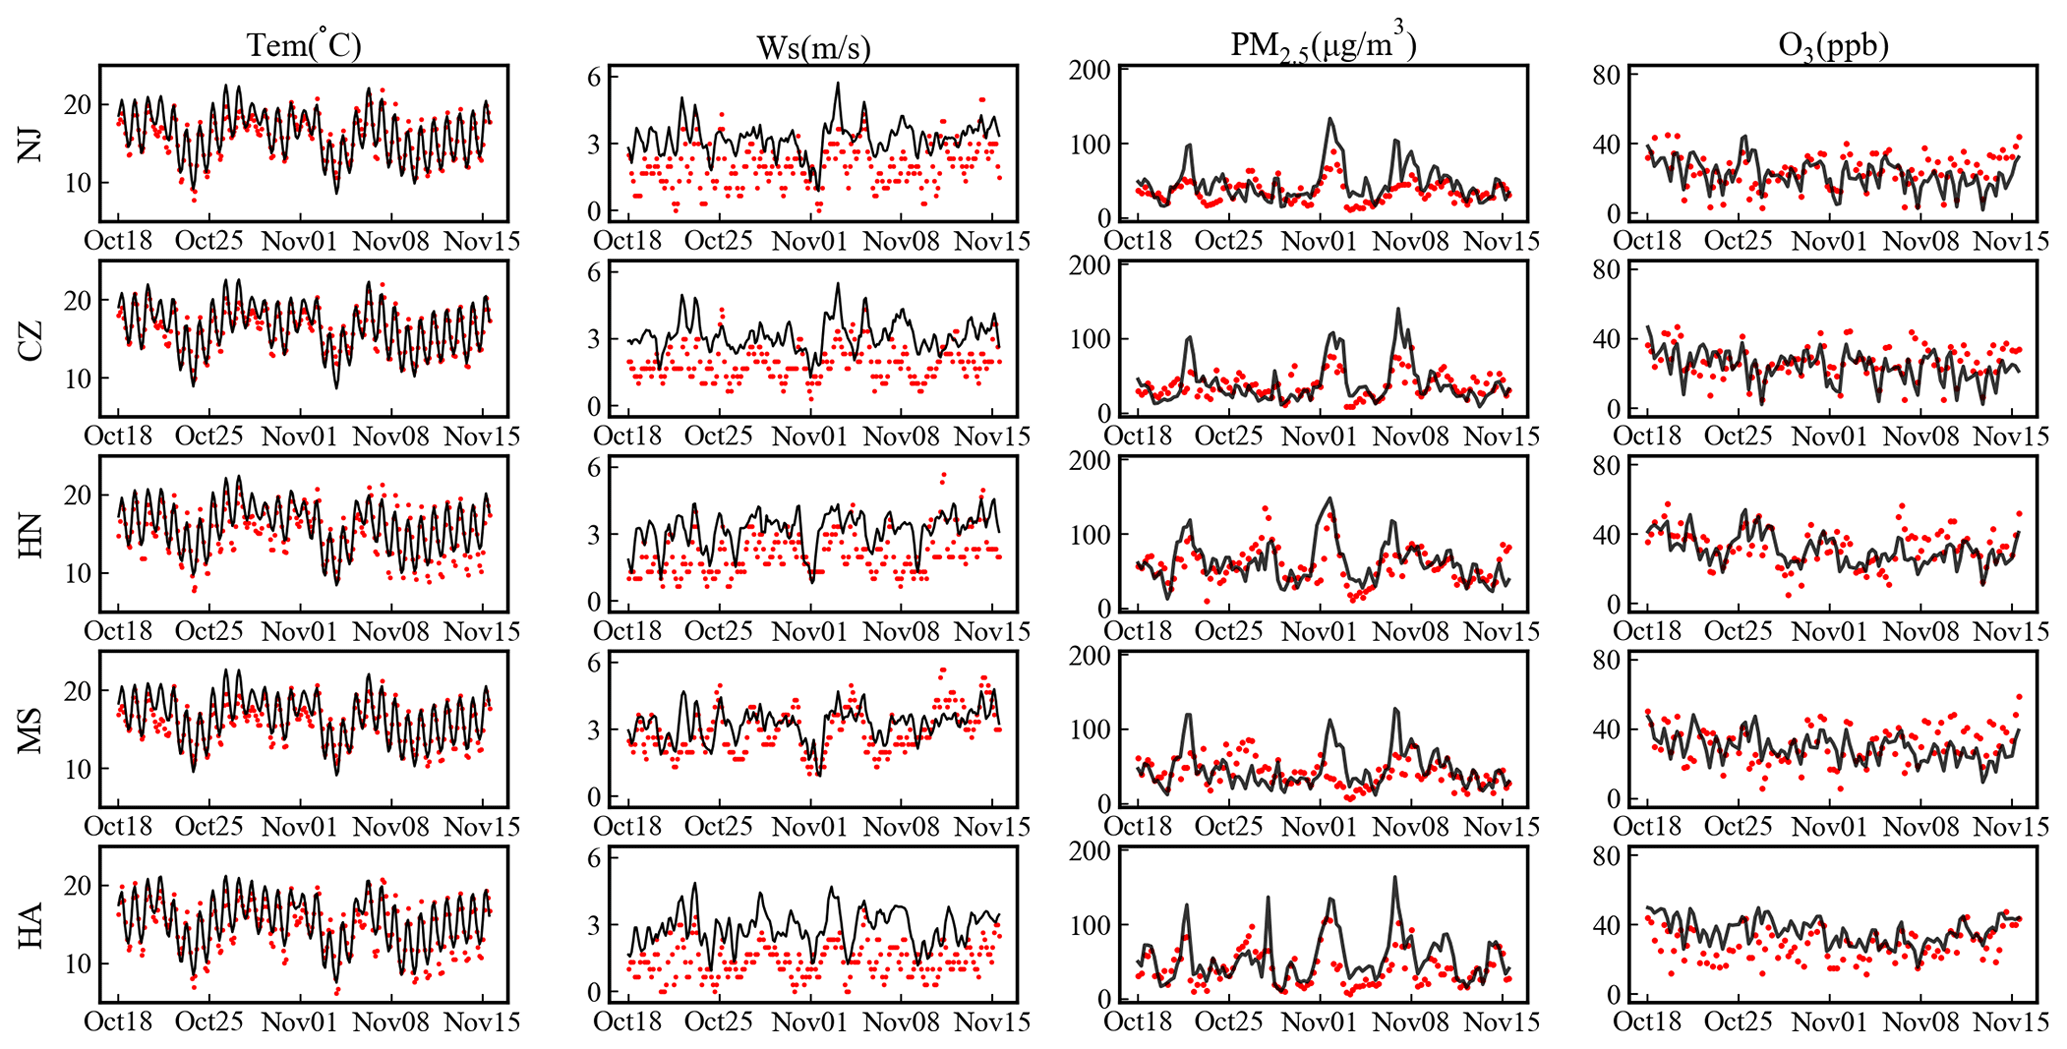
Figure 2Model evaluations on the time series on temperature (Tem), wind speed (Ws), PM2.5, and ozone at five sites. The Changzhou (CZ), Huainan (HN), Maanshan (MS), and Huaian (HA) sites are located to the east, west, south, and north of Nanjing, respectively. The red dots are observations and black lines are simulations (after a three-point running average). The time range is from 08:00 LT on 15 October to 20:00 LT on 15 November.
Table 3The statistic metrics of the model performance on time series of temperature (Tem), wind speed (Ws), wind direction (WD), PM2.5, and ozone. The benchmark values are from Emery et al. (2001) and U.S. EPA (2005, 2007). Metrics that are not in agreement with the benchmark values are marked in bold. Note that Nanjing is NJ, Changzhou is CZ, Huainan is HN, Maanshan is MS, and Huaian is HA.
It is an obvious pollution stage on 2 November 2020 (Fig. 2). We mainly evaluate the simulated profiles for that day. Figure 3 shows the model performance of meteorological parameters (temperature, wind speed, and wind direction) and air pollutants (ozone, PM2.5, and BC). As seen from the profiles, temperature shows a similar pattern between simulation and observation, with the mean bias of 0.7 K and the maximum bias of 1.6 K. The simulated wind direction and wind speed agree well with observation, except that wind speed is overestimated by 1.2–1.9 m s−1 at 14:00 LT. The ozone profile shows acceptable performance, with the concentration being underestimated by about 2–12 ppb at 14:00 and 16:00 LT. The simulated PM2.5 profile is generally consistent with observations. There is a moderate underestimation of 40–80 µg m−3 at 11:00 LT below 800 m. The BC profile is almost close to the observation, with the maximum bias of about 2–3 µg m−3. Overall, the model reasonably captures the vertical structure and temporal variation in meteorological elements, PM2.5, BC, and ozone, which is crucial for exploring the mechanism of aerosol–BL and aerosol–photolysis interactions and explaining their impacts on the ozone vertical profile.

Figure 3Model evaluations on the profiles of temperature, wind (vectors), ozone, PM2.5, and BC on 2 November 2020. The black color is the observation, and the red color is the simulation. The PM2.5 observation data at 09:00 LT are missing due to instrument failure.
3.2 Impact of aerosols on BL and NOx
The effects of aerosols are studied in detail at the Nanjing site on 2 November 2020. Figure 4a shows the effect of aerosols on the PBLH. Aerosols consistently decrease the PBLH in all mixing states, with a reduction of 152 m (15.5 %), 174 m (17.8 %), and 136 m (14.0 %) in the internal, core shell, and external mixing conditions, respectively. External mixing exerts the weakest PBLH reduction effect here, which is also reported by M. Gao et al. (2021). The mechanism of BL suppression by aerosols has been elucidated by many studies (e.g., Ding et al., 2016; Li et al., 2017). The suppression of BL can inhibit turbulent exchange (Fig. 4b) and favor the accumulation of precursor contents near the surface. NOx generally increases at all heights within BL (Fig. 4c), and this increase is significantly larger at lower heights than at upper heights. At the near-surface level, the increase is about 2 ppb for internal and core shell mixing and about 1 ppb for external mixing.
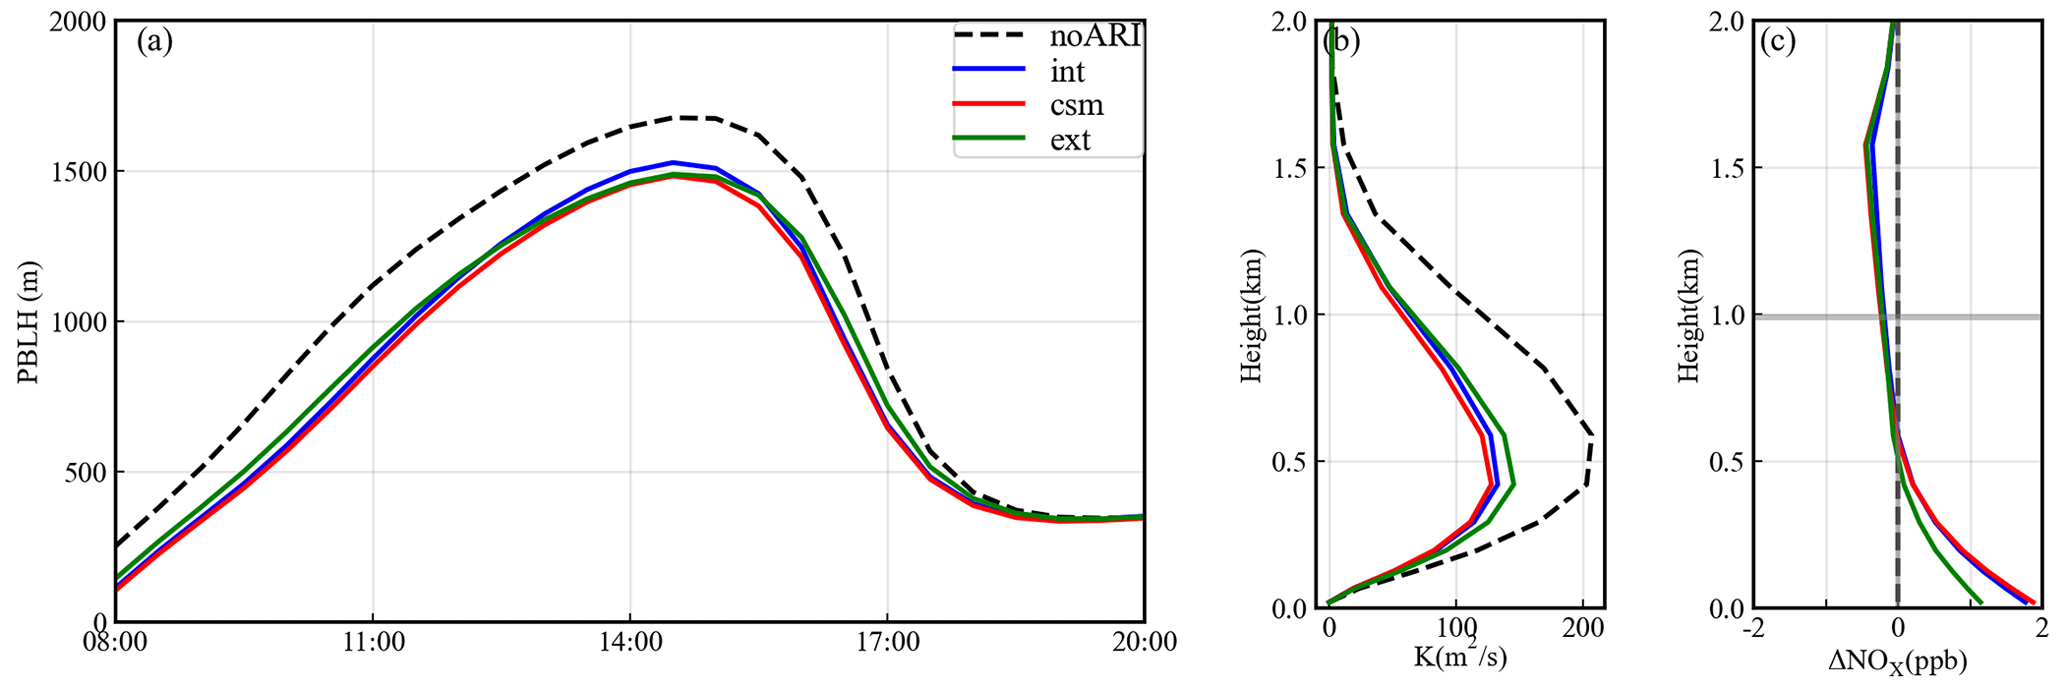
Figure 4Time series of PBLH (a), profile of turbulent exchange coefficient K (b), and aerosol-induced change in the NOx profile (c) under different mixing states. The horizontal line in panel (c) is the PBLH of the base experiment. The profiles and PBLH in panel (c) are averaged during 08:00–17:00 LT.
The change in NOx may alter the ozone chemical regime and influence the sensitivity of ozone to VOC and NOx. In this study, the ozone chemical regime is indicated by R= H2OHNO3. For the Yangtze River Delta region, ozone chemistry is in a NOx-limited regime if R>0.8, in a VOC-limited regime if R<0.6, or in a transition regime if 0.6<R<0.8 (Qu et al., 2021). The differences in R are small among various aerosol mixing states (Fig. 5). Below the height of about 400 m, ozone is NOx-limited during 08:00–10:00 LT and VOC-limited after 10:00 LT, while, at heights above 400 m, ozone is dominantly VOC-limited during the whole daytime of 2 November. It indicates that, despite the change in precursor concentrations, the ozone chemical regime almost remains unchanged, and it is mainly controlled by VOC. Therefore, the increase in NOx can enhance the NO titration effect and inhibit ozone production, which will be further discussed in Sect. 3.4. Statistics on the entire model region also show that the ozone chemical regime remains unchanged in most areas (>95 %), and the dominant type is a VOC-limited regime (>92 %). Such is the case in the areas with urban or rural surfaces and in the areas with high or low NOx emission rates.
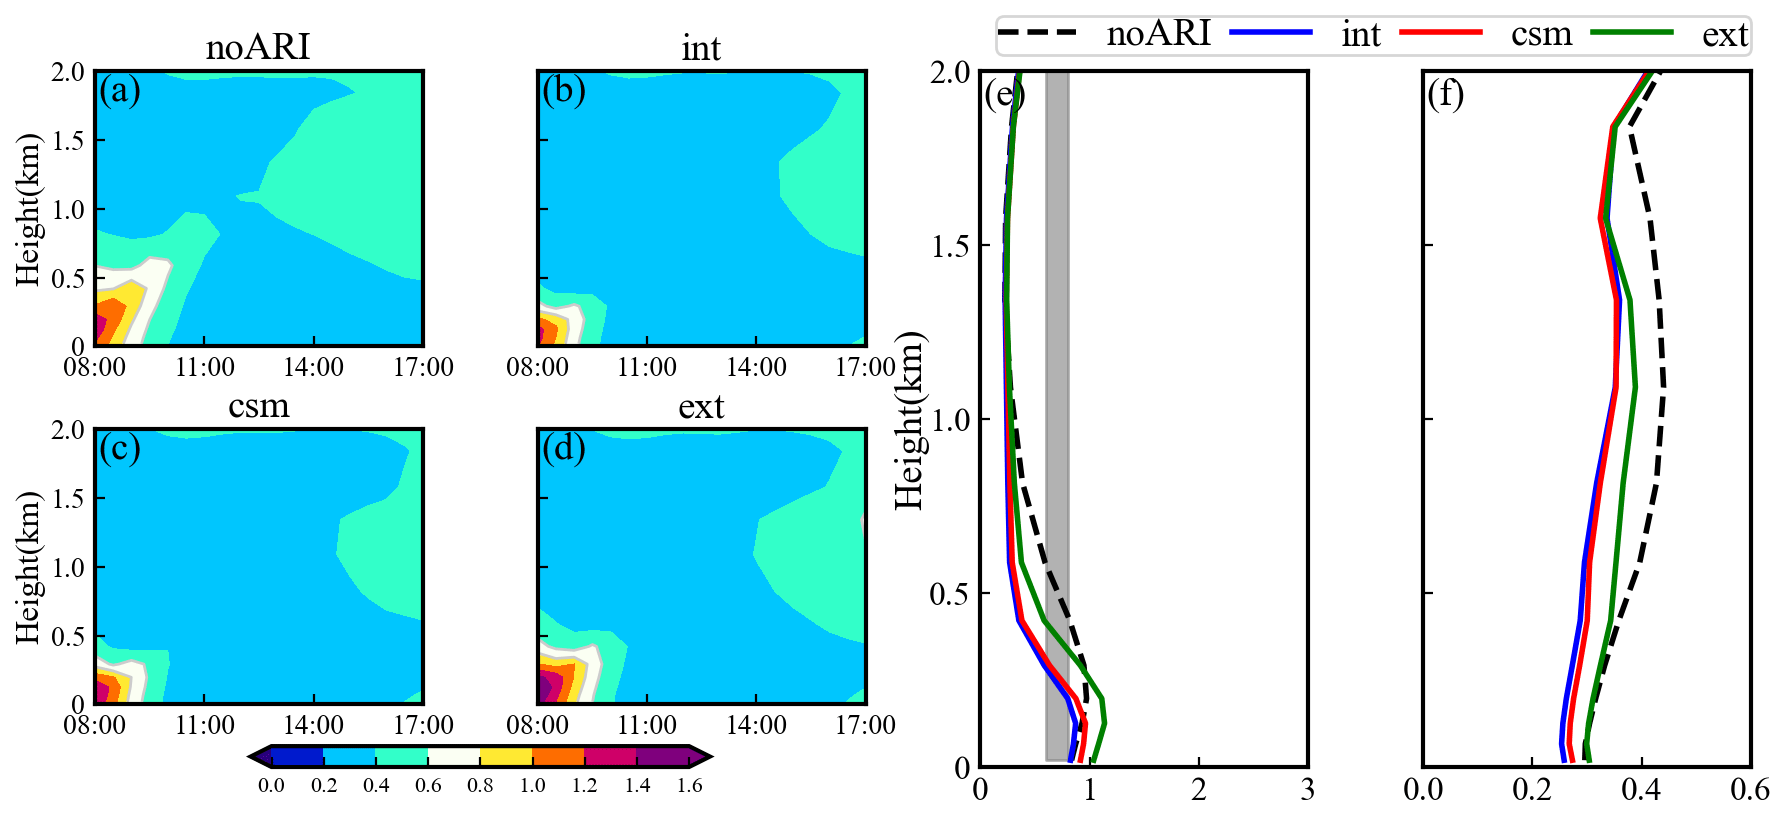
Figure 5(a–d) Time–height distribution of ozone chemical regime (indicated by R= H2OHNO3) in different aerosol mixing states. (e–f) Profiles of R averaged during 08:00–10:00 and 10:00–17:00 LT, respectively. The white contours in panels (a)–(d) and the gray strips in panels (e)–(f) represent the transition regime (0.6<R<0.8).
3.3 Impact of aerosols on photolysis
The photolysis of NO2 (JNO2) and ozone (JO1D) are two major reactions that contribute to ozone production. In the noARI condition, the photolysis rates increase with height due to atmospheric extinction (figure not shown). When the aerosol effect is included, the photolysis rates decrease sharply at the lower level but increase at the upper level in all mixing states (Fig. 6a and b). At the surface level, the relative change in JNO2 and JO1D in the internal mixing state is approximately −30 %, which is similar to the value of −22.6 % reported by Wu et al. (2020) and −23.0 % by Zhao et al. (2021) and conducted in autumn and winter seasons. Notably, in the external mixing state, the lower-level decrease is the smallest, and the upper-level increase is the largest, with a maximum increase of about 10 %. Also, the height at which the photolysis rate (e.g., JNO2) starts to increase is lower in the external mixing state (∼700 m) than in other mixing states (∼1200 m).
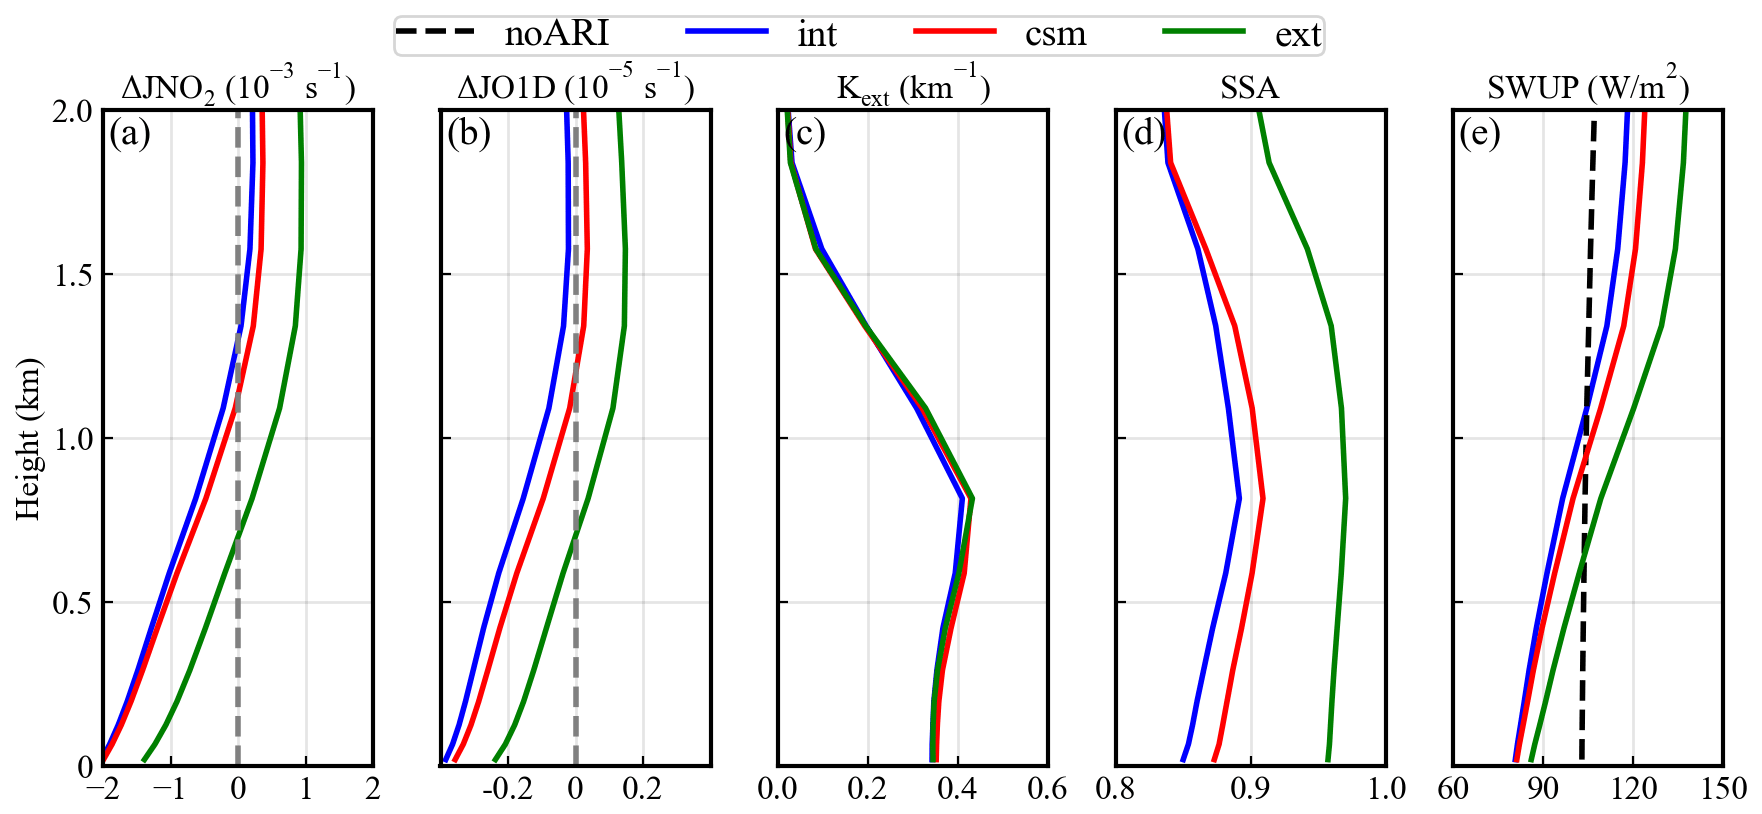
Figure 6Comparisons of JNO2 (a), JO1D (b), aerosol extinction coefficient (c), single-scattering albedo (d), and upwelling shortwave flux (e) profiles among different mixing states. For JNO2 and JO1D, the profiles are the changes with respect to the noARI condition. Profiles are the time averages during 11:00–17:00 LT.
The significant differences in photolysis change can be explained by aerosol optical properties and its impact on radiation transfer. The aerosol extinction coefficient shows no obvious differences under the three mixing states, with the maximum difference of about 0.05 km−1 (Fig. 6c). However, the single-scattering albedo (SSA) shows distinct differences (Fig. 6d). SSA is about 0.8–0.9 in the internal and core shell mixing conditions below 2000 m, and it is about 0.90–0.98 in the external mixing condition, which indicates a strong scattering ability. Zeng et al. (2019) also found that SSA is the largest in external mixing state compared with other mixing states. Therefore, it will backscatter more solar radiation to the upper level (Fig. 6e) and promote photolysis there (Fig. 6a and b). Shi et al. (2022) have provided observational evidence that aerosols can increase the upwelling shortwave radiation and promote photolysis at the upper level.
3.4 Impact of aerosols on ozone profile
Figure 7 shows the ozone profile in various mixing states. We focus on the ozone within BL in the daytime. During 08:00–11:00 LT, the BL is in increasing stage, and ozone increases with height within BL. The average changes in ozone under internal, core shell, and external mixing conditions are −9.7 ppb (−15.8 %), −8.5 ppb (−13.8 %), and −3.3 ppb (−5.4 %), respectively. As BL develops during 11:00–17:00 LT, ozone shows a strong positive gradient near the surface, uniform distribution above the surface, and negative gradient at the upper BL. The average change in ozone under internal, core shell, and external mixing conditions is −7.3 ppb (−9.3 %), −5.9 ppb (−7.5 %), and −1.0 ppb (−1.2 %), respectively. During the daytime (08:00–17:00 LT), the ozone reduction is larger in the internal (10.5 %) and core shell mixing states (8.6 %) and the smallest in external mixing state (2.0 %). The reduction (about 3 %–13 %) is the largest at the near-surface level, which is due to the NOx accumulation and photolysis inhibition being more profound at the near-surface level. Other studies also reveal that ozone reductions caused by aerosols are approximately in the range of 10 %–20 % (e.g., Gao et al., 2020; Qu et al., 2021; Yang et al., 2022). Above the surface, where the layer is more well-mixed, the ozone reduction is relatively weaker. It can be inferred that diurnal ozone concentration is generally reduced in all mixing states and at all heights within BL. The reduction is the smallest in external mixing state. It could be because the enhanced NO titration effect associated with NOx accumulation is weaker in external mixing than in other mixing states (Fig. 4c). Also, externally mixed aerosols lead to a smaller photolysis suppression in the lower level and a larger photolysis enhancement in the upper level (Fig. 6a and b), which will partly counteract the reduction in ozone concentration.
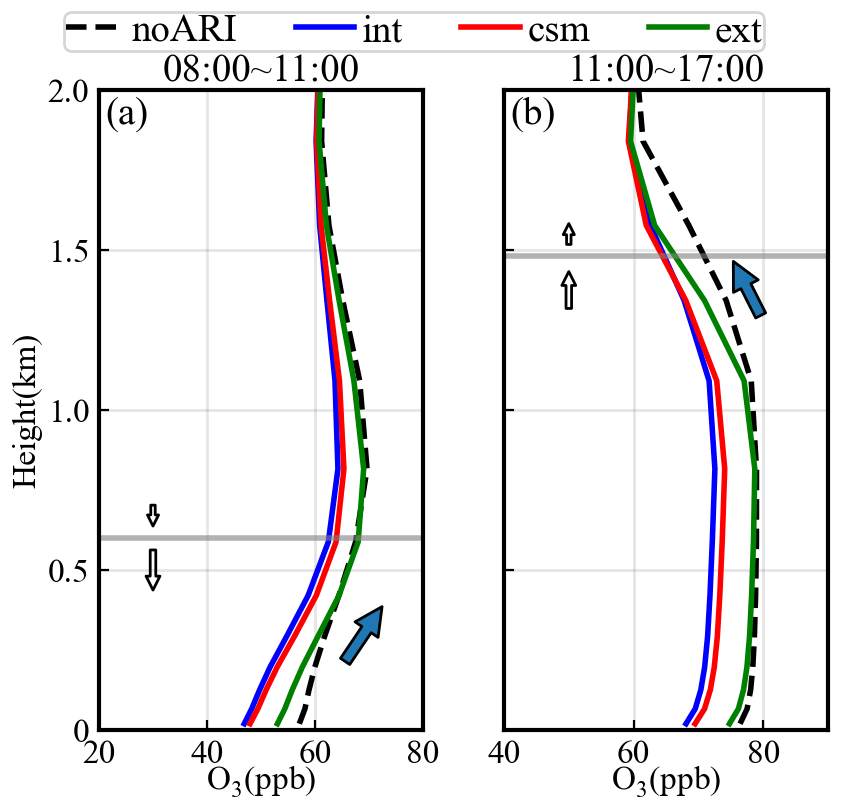
Figure 7Ozone profiles under different mixing states. (a) The 08:00–11:00 LT average. (b) The 11:00–17:00 LT average. The horizontal line is the PBLH. The blue arrows highlight the ozone vertical gradient at corresponding heights. The white arrows qualitatively describe the direction and magnitude of ozone turbulent exchange at the corresponding heights above or below PBLH.
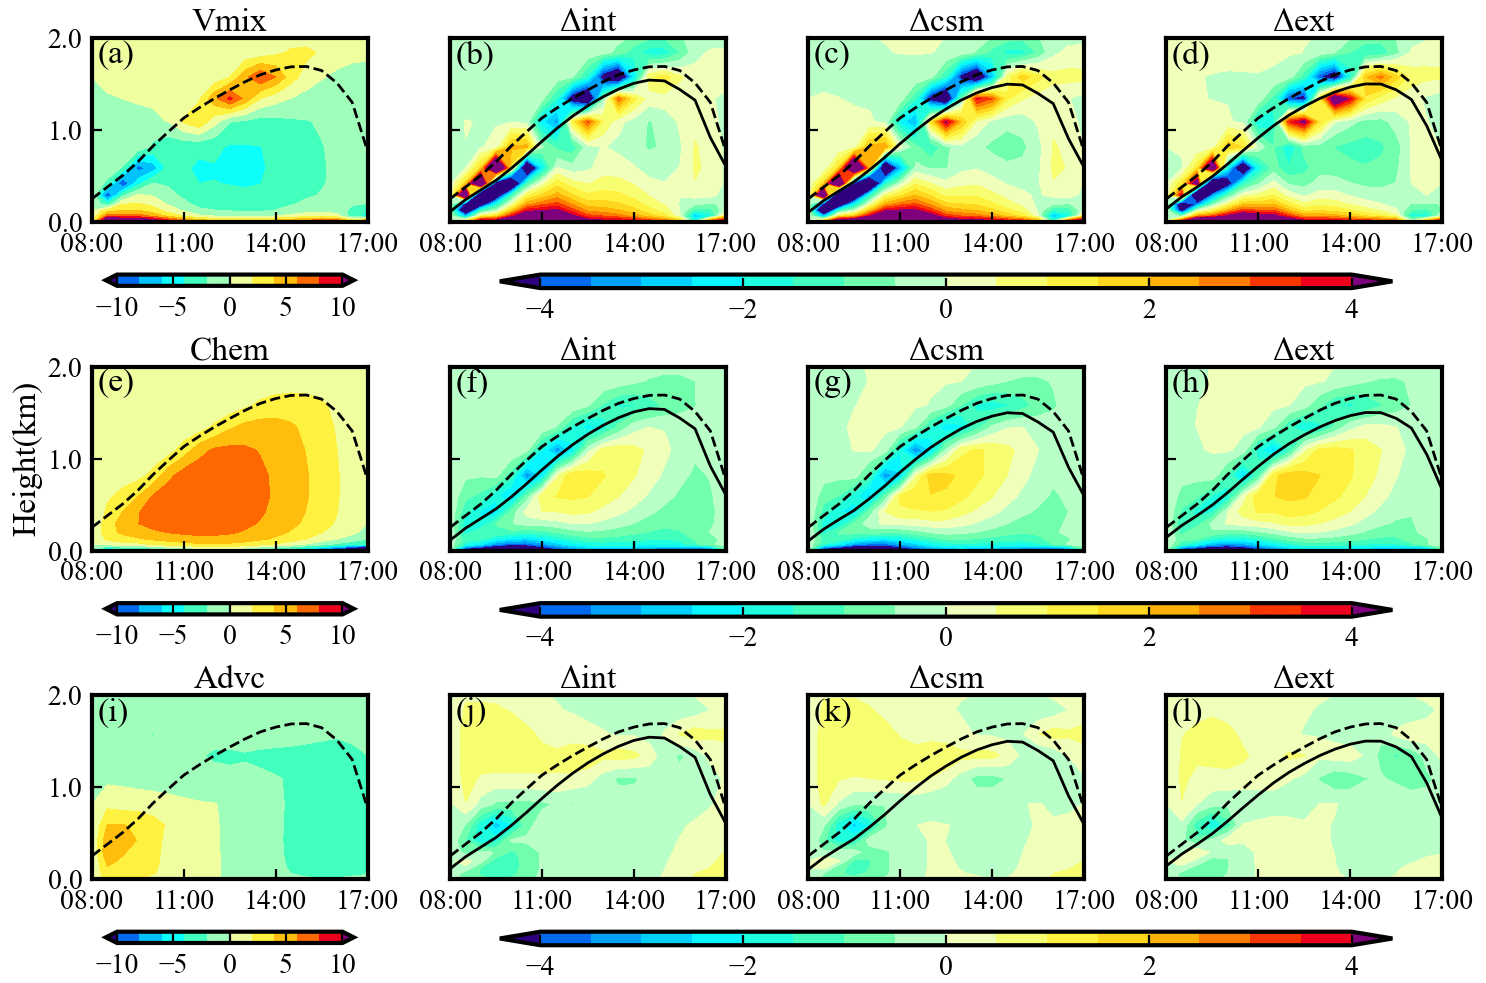
Figure 8The time–height distribution of process tendencies (ppb h−1) that contribute to ozone variation. The three rows are VMIX, CHEM, and ADVC, respectively. The first column is the ozone tendency under the noARI condition, and the remaining three columns are the changes in ozone tendency under different aerosol mixing states.
To illustrate the mechanism of aerosols affecting ozone variation, we perform process analysis on ozone (Zhang et al., 2014b). In this study, ozone is decomposed into vertical mixing (VMIX), net chemical production (CHEM), and advection (ADVC; including horizontal and vertical advection; Fig. 8). The sign of CHEM depends on the competition between ozone production and loss. Under the effect of aerosols, CHEM shows a negative change at the near-surface level and a positive change from the lower to the upper BL (Fig. 8f–h). The negative CHEM change can be explained by the decrease in the photolysis rate (Fig. 6a and b) and the increase in NO titration associated with NOx accumulation (Fig. 4c). Photolysis reduction may inhibit ozone production, and the increased NO titration consumes more ozone under a VOC-limited regime (Fig. 5f). From the lower to the upper BL, the positive CHEM change is dominantly contributed by the significant photolysis enhancement (Fig. 6a and b). Since photolysis enhancement is the strongest in external mixing state, the increase in CHEM is the largest compared with other mixing states (Fig. 8f–h). Above BL, especially between the solid and dashed lines, the change in CHEM is negative due to the inhibited turbulent transport of NOx from the BL.
The variation in ozone photochemistry indicated by CHEM can influence VMIX, which depends on the ozone vertical gradient and turbulent exchange. Under the noARI condition, VMIX presents three distinct entrainment zones according to its signs, with a positive zone near the surface, negative zone at lower-to-middle BL, and time-variant zone at upper BL (near PBLH). VMIX is positive near the surface and negative at the lower-to-middle BL (Fig. 8a) because the higher concentration of ozone aloft is entrained downward by turbulent mixing. The time-variant VMIX zone at the upper BL, specifically, with negative values during 08:00–11:00 LT and positive values during 11:00–16:00 LT (Fig. 8a), is determined by the relationship between the PBLH diurnal variation and the ozone vertical gradient below the PBLH. During 08:00–11:00 LT, the ozone gradient at the upper BL is positive (Fig. 7a), which causes an entrainment loss at that height. Above BL, where the ozone gradient and turbulent mixing are weak, the ozone vertical exchange is not significant. Consequently, VMIX is negative at the upper BL. During 11:00–16:00 LT, the ozone gradient at upper BL is negative (Fig. 7b), which causes an entrainment gain at that height and the positive VMIX at upper BL. Under the effect of aerosols, VMIX notably increases near the surface and basically decreases above the surface in all mixing states, especially after 11:00 LT (Fig. 8b–d). It is because that the reinforced NO titration effect at the near-surface level and the enhanced photolysis aloft strengthen the ozone vertical gradient. The increase in gradient promotes the ozone vertical exchange, compensating for the weakened ozone entrainment due to turbulent suppression, and instead, more ozone aloft are entrained to the near-surface region (J. Gao et al., 2020, 2021). At the upper BL, the change in VMIX is negative during 08:00–11:00 LT and positive during 11:00–16:00 LT. It is possibly due to that reason that the negative and positive VMIX zones in Fig. 8a move downward as the PBLH decreases. The contribution of ADVC is relatively unimportant when compared with VMIX and CHEM.
Table 4The diurnal averaged (08:00–17:00 LT) variations in ozone, NOx, and JNO2 variations caused by different aerosol mixing states at four sites around Nanjing (for urban areas and rural areas). The urban (rural) means are the averages over the urban (rural) surfaces of the model grids. The date is 2 November 2020. Note that Changzhou is CZ, Huainan is HN, Maanshan is MS, and Huaian is HA.
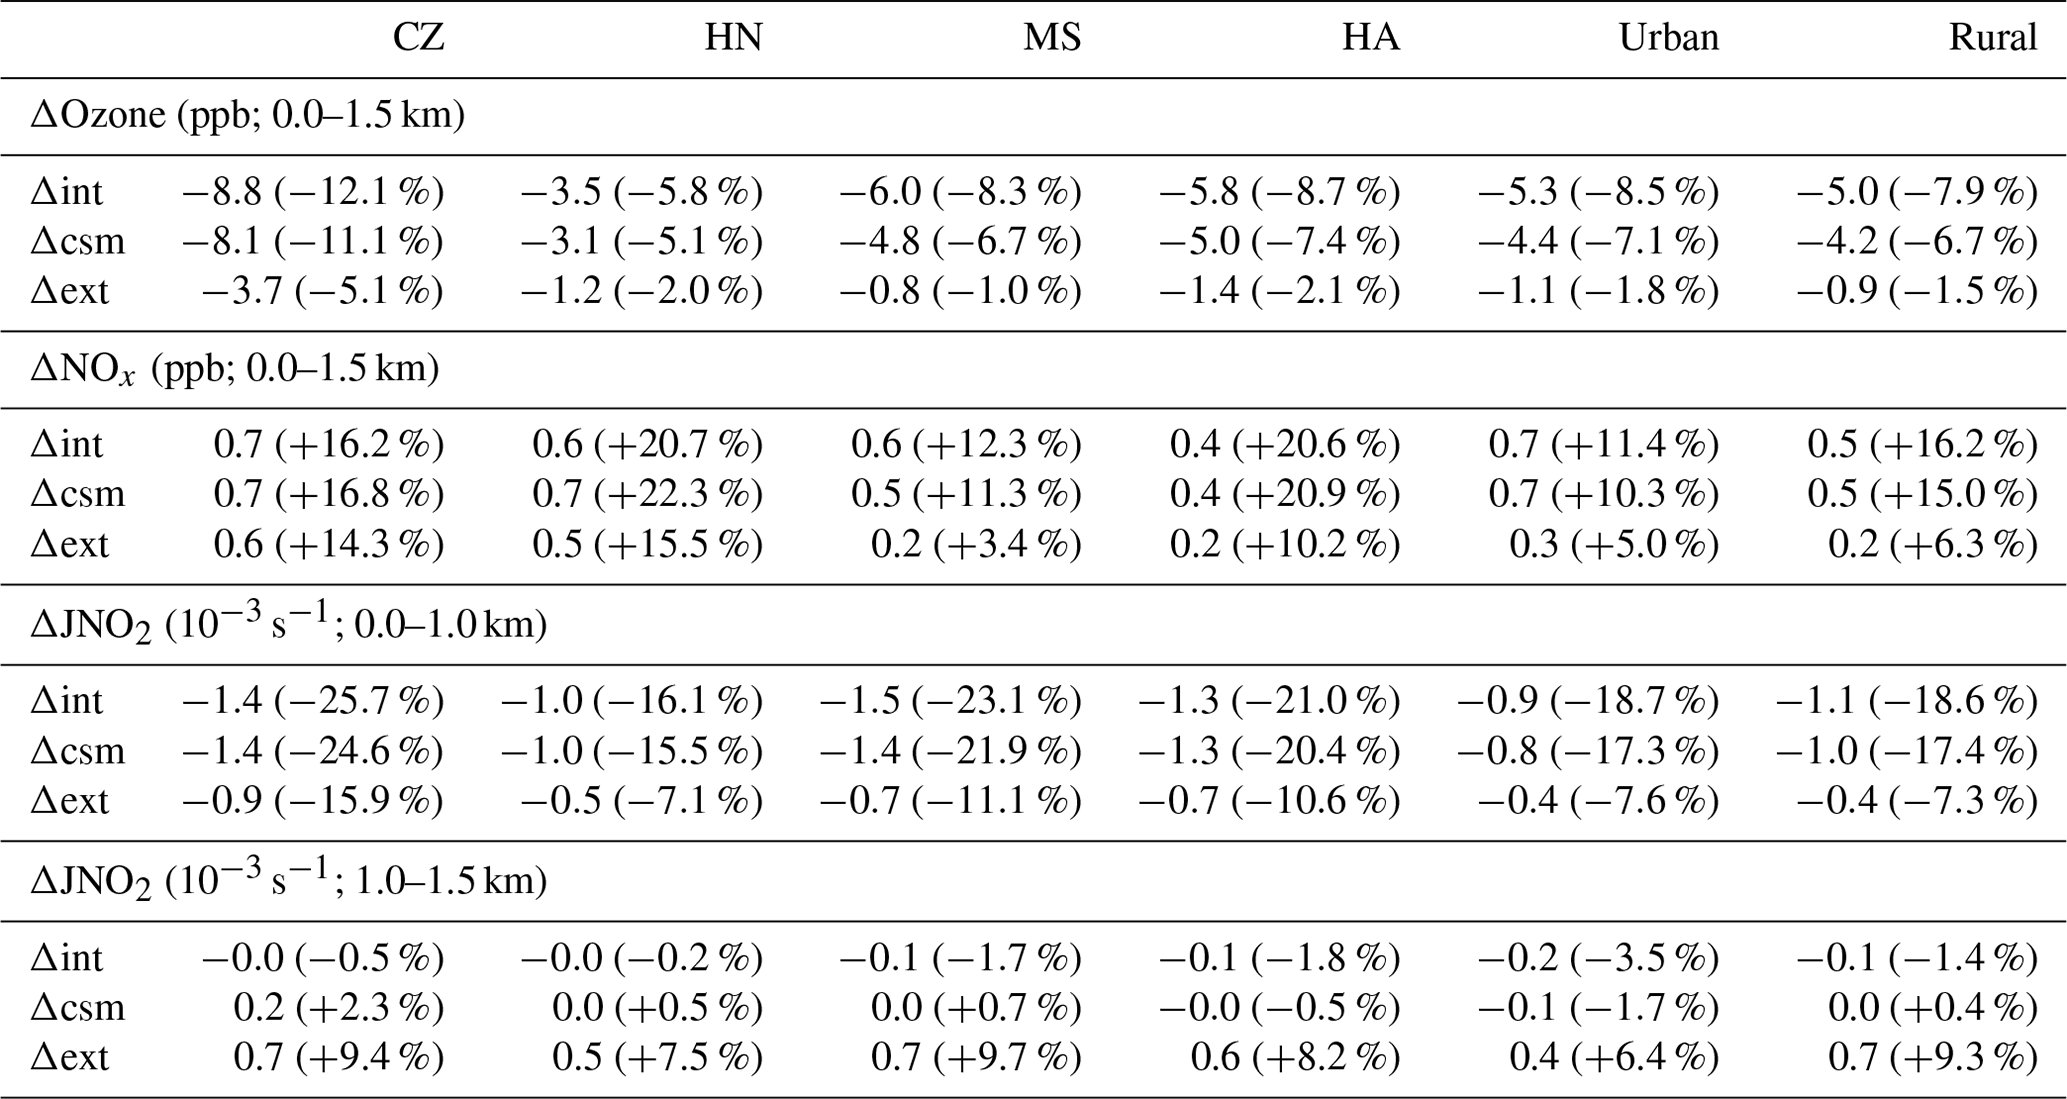
Above we have presented the variation in the photolysis rates, ozone precursors, and ozone concentration induced by aerosols in a polluted day. To make the results more convincing, we perform additional analysis and simulations. The effect of aerosols on ozone may depend on locations and underlying surface type, e.g., urban and rural surfaces (Zhu et al., 2015). From Table 4, the qualitative results are consistent among different sites and underlying surfaces. Ozone shows a consistent decreasing feature and NOx shows a consistent increasing feature under the effect of aerosols. The photolysis rate (e.g., JNO2) basically presents the dual change (i.e., lower level is decreasing and upper level is increasing). Comparing the three mixing types, the changes in the photolysis rates, ozone precursors, and ozone concentration caused by externally mixed aerosols are most favorable for mitigating ozone reduction. The mechanisms have been explained in previous sections.
Table 5The diurnal averaged (08:00–17:00 LT) quantities within the BL during some representative clean and polluted episodes. The PM2.5 (µg m−3) and ozone (ppb) are the values in the internal mixing state. The last three columns are the changes and relative changes in ozone under different mixing states.
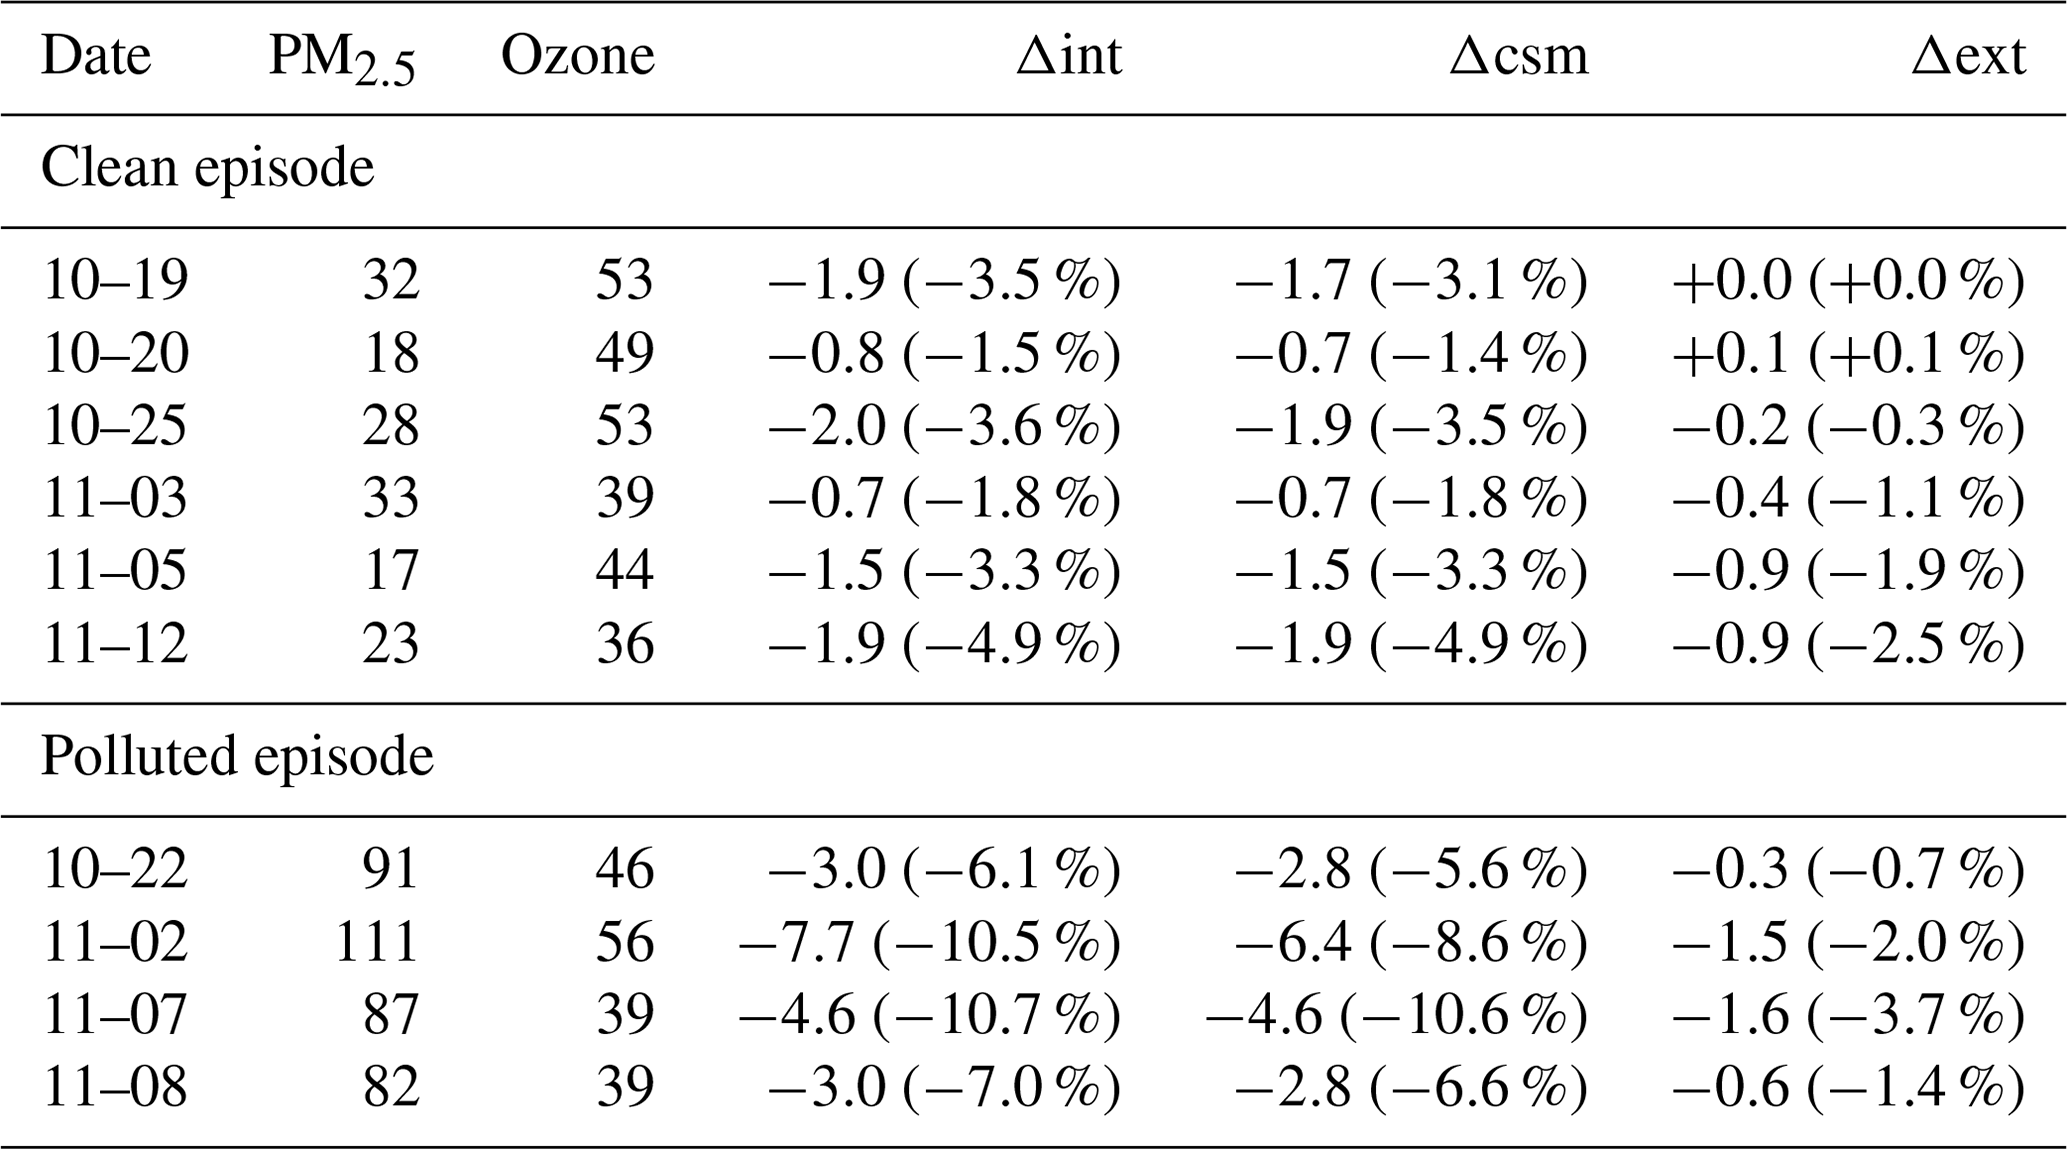
The ozone variations during representative clean and polluted episodes are shown in Table 5. The ozone concentrations within the BL in the internal mixing experiment are consistently reduced during all episodes. The core shell mixing state shows slightly lower reductions than the internal mixing, and the ozone reductions are the least in the external mixing state. The differences in ozone relative changes between clean and polluted episodes are distinct. For example, in the internal mixing state, the relative reductions are about 0 %–5 % in clean episodes and 6 %–11 % in polluted episodes, indicating that the aerosol effect is more profound under high aerosol contents. On 2 November, which is the highest pollution level episode during the study period, the relative changes in ozone are approximately −11 % to −2 % in three mixing states. It can be inferred that the aerosol effect on the photolysis rates, ozone precursors, and ozone concentration might be consistent under different underlying surface and pollution conditions, and it is more significant in high aerosol conditions.
Previous studies mainly focus on the relationship between aerosols and ozone at the near-surface level and attribute ozone variation to either aerosol–BL or aerosol–photolysis interactions. In this work, we explore the sensitivities of the ozone response to the aerosol mixing states in the vertical direction by WRF-Chem simulations from 15 October to 15 November 2020 over the Yangtze River Delta region. Generally, the model reasonably captures the vertical profiles and temporal variation in meteorological elements, ozone, PM2.5, and BC. Sensitivity experiments show the following:
-
Aerosols influence ozone vertical variation through aerosol–BL and aerosol–photolysis interactions.
-
Aerosol inhibits the BL development, resulting in more NOx accumulated within the BL and a stronger NO titration effect under a VOC-limited regime.
-
The PBLH reduction and NOx accumulation are the smallest in external mixing state.
-
Despite the change in precursor concentration, the ozone chemical regime is still dominantly controlled by VOCs (>95 %) under different underlying surface and emission conditions.
-
Aerosols inhibit photolysis at the lower level ( %) but enhance photolysis at the upper level (∼10 %) due to aerosol backscattering.
-
The enhanced photolysis is more obvious in external mixing state owing to its strong scattering ability.
Aerosols basically lead to ozone reduction (2 %–10 %) at all heights within the BL during the daytime (08:00–17:00 LT), with the smallest reduction (2.0 %) in the external mixing state. Such an ozone variation is attributed to the changes in VMIX, CHEM, and ADVC. CHEM decreases at the near-surface level due to photolysis reduction and NOx accumulation but increases from the lower to the upper BL due to photolysis enhancement. The photolysis reduction and NOx accumulation at the lower level lead to ozone depletion and a stronger vertical gradient, which promotes a higher concentration of ozone aloft being entrained downward. Therefore, VMIX increases at the near-surface level but decreases at the lower-to-middle BL. The VMIX variation at the upper BL (near PBLH) is complex, which is determined by the relationship between the PBLH diurnal variation and ozone gradient near the PBLH. Additional analyses indicate that aerosols could consistently cause precursor accumulation, dual change in photolysis, and ozone reduction under different underlying surface and pollution conditions.
The ground air quality data are from https://www.aqistudy.cn/ (China National Environmental Monitoring Center, 2014). The MEIC inventory is from http://www.meicmodel.org/ (MEIC Team, 2012). The ERA5 reanalysis data are from https://doi.org/10.24381/cds.bd0915c6 (Hersbach et al., 2018). The WACCM data are from https://www2.acom.ucar.edu/gcm/waccm (last access: 22 April 2023) (DOI: https://doi.org/10.5065/G643-Z138, Atmospheric Chemistry Observations and Modeling/National Center for Atmospheric Research/University Corporation for Atmospheric Research, 2020). The WRF-Chem source code is from https://www2.mmm.ucar.edu/wrf/users/download/get_source.html (Skamarock et al., 2008). The other data, model outputs, and codes can be accessed by contacting Bin Zhu (binzhu@nuist.edu.cn).
SY performed the model simulation, data analysis, and writing of the paper. BZ proposed the idea, supervised this work, and revised the paper. SS provided the data at the observation site. WL, JG, and HK offered to help with the model simulation. DL helped with the revision of the paper.
The contact author has declared that none of the authors has any competing interests.
Publisher’s note: Copernicus Publications remains neutral with regard to jurisdictional claims in published maps and institutional affiliations.
We thank the two anonymous reviewers for their constructive comments and suggestions.
This research has been supported by the National Natural Science Foundation of China (grant nos. 92044302, 42192512, and 42275115).
This paper was edited by Simone Tilmes and reviewed by two anonymous referees.
Ackerman, T. P. and Toon, O. B.: Absorption of visible radiation in atmosphere containing mixtures of absorbing and non-absorbing particles, Appl. Optics, 20, 3661–3662, https://doi.org/10.1364/AO.21.000758, 1981.
Atmospheric Chemistry Observations and Modeling/National Center for Atmospheric Research/University Corporation for Atmospheric Research: Whole Atmosphere Community Climate Model (WACCM) Model Output, Research Data Archive at the National Center for Atmospheric Research, Computational and Information Systems Laboratory [data set], https://doi.org/10.5065/G643-Z138, 2020.
Bond, T. C., Habib, G., and Bergstrom, R. W.: Limitations in the enhancement of visible light absorption due to mixing state, J. Geophys. Res., 111, D20211, https://doi.org/10.1029/2006JD007315, 2006.
Cappa, C. D., Onasch, T. B., Massoli, P., Worsnop, D. R., Bates, T. S., Cross, E. S., and Zaveri, R. A.: Radiative absorption enhancements due to the mixing state of atmospheric black carbon, Science, 337, 1078–1081, https://doi.org/10.1126/science.1223447, 2012.
Chen, S. H. and Sun, W. Y.: A one-dimensional time dependent cloud model, J. Meteor. Soc. Japan, 80, 99–118, https://doi.org/10.2151/jmsj.80.99, 2002.
Chen, Y., Fung, J. C., Huang, Y., Lu, X., Wang, Z., Louie, P. K., & Lau, A. K.:Temporal source apportionment of PM2.5 over the Pearl River Delta region in southern China, J. Geophys. Res.-Atmos., 127, e2021JD035271, https://doi.org/10.1029/2021JD035271, 2022.
China National Environmental Monitoring Center: National Air Quality Monitoring Data, China National Environmental Monitoring Center [data set], https://www.aqistudy.cn/ (last access: 22 April 2023), 2014.
Dickerson, R. R., Kondragunta, S., Stenchikov, G., Civerolo, K. L., Doddridge, B. G., and Holben, B. N.: The impact of aerosols on solar ultraviolet radiation and photochemical smog, Science, 278, 827–830, https://doi.org/10.1126/science.278.5339.827, 1997.
Ding, A. J., Huang, X., Nie, W., Sun, J. N., Kerminen, V. M., Petaja, T., Su, H., Cheng, Y. F., Yang, X. Q., Wang, M. H., Chi, X. G., Wang, J. P., Virkkula, A., Guo, W. D., Yuan, J., Wang, S. Y., Zhang, R. J., Wu, Y. F., Song, Y., Zhu, T., Zilitinkevich, S., Kulmala, M., and Fu, C. B.: Enhanced haze pollution by black carbon in megacities in China, Geophys. Res. Lett., 43, 2873–2879, https://doi.org/10.1002/2016GL067745, 2016.
Emery, C., Tai, E., and Yarwood, G.: Enhanced meteorological modeling and performance evaluation for two Texas ozone episodes, in: Prepared for the Texas Natural Resource Conservation Commission, Environ International Corporation, Novato, CA, USA, 2001.
Fast, J. D., Gustafson, W. I., Easter, R. C., Zaveri, R. A., Barnard, J. C., Chapman, E. G., Grell, G. A., and Peckham, S. E.: Evolution of ozone, particulates, and aerosol direct radiative forcing in the vicinity of Houston using a fully coupled meteorology-chemistry-aerosol model, J. Geophys. Res., 111, D21305, https://doi.org/10.1029/2005jd006721, 2006.
Fu, Y., Liao, H., and Yang, Y.: Interannual and decadal changes in tropospheric ozone in China and the associated chemistry–climate interactions: A review, Adv. Atmos. Sci., 36, 975–993, https://doi.org/10.1007/s00376-019-8216-9, 2019.
Gao, J., Zhu, B., Xiao, H., Kang, H., Pan, C., Wang, D., and Wang, H.: Effects of black carbon and boundary layer interaction on surface ozone in Nanjing, China, Atmos. Chem. Phys., 18, 7081–7094, https://doi.org/10.5194/acp-18-7081-2018, 2018.
Gao, J., Li, Y., Zhu, B., Hu, B., Wang, L., and Bao, F.: What have we missed when studying the impact of aerosols on surface ozone via changing photolysis rates?, Atmos. Chem. Phys., 20, 10831–10844, https://doi.org/10.5194/acp-20-10831-2020, 2020.
Gao, J., Li, Y., Xie, Z., Wang, L., Hu, B., and Bao, F.: Do Absorbing Aerosols or Scattering Aerosols Dominate the Impact of Aerosols on Ozone via Influencing Photolysis Rates?, Earth and Space Science Open Archive, https://doi.org/10.1002/essoar.10508565.1, 2021.
Gao, M., Yang, Y., Liao, H., Zhu, B., Zhang, Y., Liu, Z., Lu, X., Wang, C., Zhou, Q., Wang, Y., Zhang, Q., Carmichael, G. R., and Hu, J.: Reduced light absorption of black carbon (BC) and its influence on BC-boundary-layer interactions during “APEC Blue”, Atmos. Chem. Phys., 21, 11405–11421, https://doi.org/10.5194/acp-21-11405-2021, 2021.
Grell, G. A., Peckham, S. E., Schmitz, R., McKeen, S. A., Frost, G., Skamarock, W. C., and Eder, B.: Fully coupled “online” chemistry within the WRF model, Atmos. Environ., 39, 6957–6975, https://doi.org/10.1016/j.atmosenv.2005.04.027, 2005.
Hersbach, H., Bell, B., Berrisford, P., Biavati, G., Horányi, A., Muñoz Sabater, J., Nicolas, J., Peubey, C., Radu, R., Rozum, I., Schepers, D., Simmons, A., Soci, C., Dee, D., Thépaut, J.-N.: ERA5 hourly data on pressure levels from 1940 to present, Copernicus Climate Change Service (C3S) Climate Data Store (CDS) [data set], https://doi.org/10.24381/cds.bd0915c6, 2018.
Hong, S. Y., Noh, Y., and Dudhia, J.: A new vertical diffusion package with an explicit treatment of entrainment processes, Mon. Weather Rev., 134, 2318–2341, https://doi.org/10.1175/MWR3199.1, 2006.
Hu, J., Chen, J., Ying, Q., and Zhang, H.: One-year simulation of ozone and particulate matter in China using WRF/CMAQ modeling system, Atmos. Chem. Phys., 16, 10333–10350, https://doi.org/10.5194/acp-16-10333-2016, 2016.
Jacob, D. J.: Heterogeneous chemistry and tropospheric ozone, Atmos. Environ., 34, 2131–2159, https://doi.org/10.1016/S1352-2310(99)00462-8, 2000.
Jacobson, M. Z.: Studying the effects of aerosols on vertical photolysis rate coefficient and temperature profiles over an urban airshed, J. Geophys. Res.-Atmos., 103, 10593, https://doi.org/10.1029/98JD00287, 1998.
Jacobson, M. Z.: Strong radiative heating due to the mixing state of black carbon in atmospheric aerosols, Nature, https://doi.org/10.1038/35055518, 2001.
Jia, W. and Zhang, X.: The role of the planetary boundary layer parameterization schemes on the meteorological and aerosol pollution simulations: a review, Atmos. Res., 239, 104890, https://doi.org/10.1016/j.atmosres.2020.104890, 2020.
Jia, W. and Zhang, X.: Impact of modified turbulent diffusion of PM2.5 aerosol in WRF-Chem simulations in eastern China, Atmos. Chem. Phys., 21, 16827–16841, https://doi.org/10.5194/acp-21-16827-2021, 2021.
Jiménez, P. A. and Dudhia, J.: Improving the representation of resolved and unresolved topographic effects on surface wind in the WRF model, J. Appl. Meteorol. Climatol., 51, 300–316, https://doi.org/10.1175/JAMC-D-11-084.1, 2012.
Kwok, R. H. F., Fung, J. C. H., Lau, A. K. H., and Fu, J. S.: Numerical study on seasonal variations of gaseous pollutants and particulate matters in Hong Kong and Pearl River Delta Region, J. Geophys. Res., 115, D16308, https://doi.org/10.1029/2009JD012809, 2010.
Li, J., Wang, Z., Wang, X., Yamaji, K., Takigawa, M., and Kanaya, Y.: Impacts of aerosols on summertime tropospheric photolysis frequencies and photochemistry over central eastern china, Atmos. Environ., 45, 1817–1829, https://doi.org/10.1016/j.atmosenv.2011.01.016, 2011.
Li, K., Jacob, D. J., Liao, H., Zhu, J., Shah, V., Shen, L., Bates, K., Zhang, Q., and Zhai, S.: A two-pollutant strategy for improving ozone and particulate matter air quality in China, Nat. Geosci., 12, 906–910, https://doi.org/10.1038/s41561-019-0464-x, 2019.
Li, K., Jacob, D. J., Shen, L., Lu, X., De Smedt, I., and Liao, H.: Increases in surface ozone pollution in China from 2013 to 2019: anthropogenic and meteorological influences, Atmos. Chem. Phys., 20, 11423–11433, https://doi.org/10.5194/acp-20-11423-2020, 2020.
Li, Y., Cao, L., Gao, S., and Luo, B.: The Current Stage and Development of MICAPS, Meteorological Monthly, 36, 50–55, 2010 (in Chinese).
Li, Z. Q., Guo, J. P., Ding, A. J., Liao, H., Liu, J. J., Sun, Y. L., Wang, T. J., Xue, H. W., Zhang, H. S., and Zhu, B.: Aerosol and boundary-layer interactions and impact on air quality, Natl. Sci. Rev., 4, 810–833, https://doi.org/10.1093/nsr/nwx117, 2017.
Liu, C., Xu, X., Yin, Y., Schnaiter, M., and Yung, Y. L.: Black carbon aggregates: A database for optical properties, J. Quant. Spectrosc. Ra., 222, 170–179, https://doi.org/10.1016/j.jqsrt.2018.10.021, 2019.
Liu, D., Whitehead, J., Alfarra, M. R., Reyes-Villegas, E., Spracklen, D. V., Reddington, C. L., and Allan, J. D.: Black-carbon absorption enhancement in the atmosphere determined by particle mixing state, Nat. Geosci., 10, 184–188, https://doi.org/10.1038/ngeo2901, 2017.
Lou, S., Liao, H., and Zhu, B.: Impacts of aerosols on surface-layer ozone concentrations in China through heterogeneous reactions and changes in photolysis rates, Atmos. Environ., 85, 123–138, https://doi.org/10.1016/j.atmosenv.2013.12.004, 2014.
Lu, R., Turco, R. P., and Jacobson, M. Z.: An integrated pollution modeling system for urban and regional scales: 2. Simulations for SCAQS 1987, J. Geophys. Res., 102, 6081–6098, https://doi.org/10.1029/96JD03502, 1997.
Matsui, H., Koike, M., Kondo, Y., Moteki, N., Fast, J. D., and Zaveri, R. A.: Development and validation of a black carbon mixing state resolved three-dimensional model: Aging processes and radiative impact, J. Geophys. Res.-Atmos., 118, 2304–2326, https://doi.org/10.1029/2012JD018446, 2013.
MEIC Team: The Multi-resolution Emission Inventory Model for Climate and Air Pollution Research, MEICModel [data set], http://www.meicmodel.org/ (last access: 22 April 2023), 2012.
Qu, Y., Voulgarakis, A., Wang, T., Kasoar, M., Wells, C., Yuan, C., Varma, S., and Mansfield, L.: A study of the effect of aerosols on surface ozone through meteorology feedbacks over China, Atmos. Chem. Phys., 21, 5705–5718, https://doi.org/10.5194/acp-21-5705-2021, 2021.
Riemer, N. and West, M.: Quantifying aerosol mixing state with entropy and diversity measures, Atmos. Chem. Phys., 13, 11423–11439, https://doi.org/10.5194/acp-13-11423-2013, 2013.
Riemer, N., Ault, A. P., West, M., Craig, R. L., and Curtis, J. H.: Aerosol mixing state: Measurements, modeling, and impacts, Rev. Geophys., 57, 187–249, https://doi.org/10.1029/2018RG000615, 2019.
Shi, S., Zhu, B., Lu, W., Yan, S., Fang, C., Liu, H., Liu, D., Liu, C.: Estimation of radiative forcing and heating rate based on vertical observation of black carbon in Nanjing, China, Sci. Total Environ., 756, 144135, https://doi.org/10.1016/j.scitotenv.2020.144135, 2020.
Shi, S., Zhu, B., Tang, G., Liu, C., An, J., Liu, D., Xu, J., Xu, H., Liao, H., and Zhang, Y.: Observational evidence of aerosol radiation modifying photochemical ozone profiles in the lower troposphere, Geophys. Res. Lett., 49, e2022GL099274, https://doi.org/10.1029/2022GL099274, 2022.
Singh, H. B., Cai, C., Kaduwela, A., Weinheimer, A., and Wisthaler, A.: Interactions of fire emissions and urban pollution over California: Ozone formation and air quality simulations, Atmos. Environ., 56, 45–51, https://doi.org/10.1016/j.atmosenv.2012.03.046, 2012.
Skamarock, W. C., Klemp, J. B., Dudhia, J., Gill, D. O., Barker, D. M., Duda, M. G., Huang, X., Wang, W., and Powers, J. G.: A description of the advanced research WRF Version 3 (NCAR Technical Note NCAR/TN-475+STR), National Center for Atmospheric Research: Boulder, CO, USA, https://doi.org/10.5065/D68S4MVH, 2008 (data available at: https://www2.mmm.ucar.edu/wrf/users/download/get_source.html, last access: 22 April 2023).
Tan, Y., Wang, H., Shi, S., Shen, L., Zhang, C., Zhu, B., and Liu, A.: Annual variations of black carbon over the Yang-tze River Delta from 2015 to 2018, J. Environ. Sci., 96, 72–84, https://doi.org/10.1016/j.jes.2020.04.019, 2020.
Tan, Y., Wang, H., Zhu, B., Zhao, T., Shi, S., Liu, A., and Cao, L.: The interaction between black carbon and plane-tary boundary layer in the Yangtze River Delta from 2015 to 2020: Why O3 didn't decline so significantly as PM2.5, Environ. Res., 214, 114095, https://doi.org/10.1016/j.envres.2022.114095, 2022.
Tian, P., Wang, G., Zhang, R., Wu, Y., and Yan, P.: Impacts of aerosol chemical compositions on optical properties in urban Beijing, China, Particuology, 18, 155–164, https://doi.org/10.1016/j.partic.2014.03.014, 2015.
U.S. Environmental Protection Agency (U.S. EPA): Guidance on the Use of Models and Other Analyses in ttainment Demonstrations for the 8-hour Ozone NAAQS, EPA- 54/R-05-002, https://www3.epa.gov/ttn/naaqs/aqmguide/collection/cp2_old/20051001_oaqps_epa-454_r-05-002_guide_modeling_ozone_attain_demo.pdf (last access: 22 April 2023), 2005.
U.S. Environmental Protection Agency (U.S. EPA): Guidance on the Use of Models and Other Analyses or Demonstrating Attainment of Air Quality Goals for Ozone, PM2.5, and Regional Haze, EPA-454/B-07-002, https://www.epa.gov/sites/default/files/2020-10/documents/final-03-pm-rh-guidance.pdf (last access: 22 April 2023), 2007.
Wu, J., Bei, N., Hu, B., Liu, S., Wang, Y., Shen, Z., Li, X., Liu, L., Wang, R., Liu, Z., Cao, J., Tie, X., Molina, L. T., and Li, G.: Aerosol-photolysis interaction reduces particulate matter during wintertime haze events, P. Natl. Acad. Sci. USA, 117, 9755–9761, https://doi.org/10.1073/pnas.1916775117, 2020.
Yang, F., Tan, J., Zhao, Q., Du, Z., He, K., Ma, Y., Duan, F., Chen, G., and Zhao, Q.: Characteristics of PM2.5 speciation in representative megacities and across China, Atmos. Chem. Phys., 11, 5207–5219, https://doi.org/10.5194/acp-11-5207-2011, 2011.
Yang, H., Chen, L., Liao, H., Zhu, J., Wang, W., and Li, X.: Impacts of aerosol–photolysis interaction and aerosol–radiation feedback on surface-layer ozone in North China during multi-pollutant air pollution episodes, Atmos. Chem. Phys., 22, 4101–4116, https://doi.org/10.5194/acp-22-4101-2022, 2022.
Yang, M., Howell, S. G., Zhuang, J., and Huebert, B. J.: Attribution of aerosol light absorption to black carbon, brown carbon, and dust in China – interpretations of atmospheric measurements during EAST-AIRE, Atmos. Chem. Phys., 9, 2035–2050, https://doi.org/10.5194/acp-9-2035-2009, 2009.
Zaveri, R. A. and Peters, L. K.: A new lumped structure photochemical mechanism for large-scale applications, J. Geophys. Res., 104, 30387–30415, https://doi.org/10.1029/1999JD900876, 1999.
Zaveri, R. A., Easter, R. C., Fast, J. D., and Peters, L. K.: Model for simulating aerosol interactions and chemistry (MOSAIC), J. Geophys. Res., 113, D13204, https://doi.org/10.1029/2007JD008782, 2008.
Zeng, C., Liu, C., Li, J., Zhu, B., Yin, Y., and Wang, Y.: Optical Properties and Radiative Forcing of Aged BC due to Hygroscopic Growth: Effects of the Aggregate Structure, J. Geophys. Res. Atmos., 124, 4620–4633, https://doi.org/10.1029/2018JD029809, 2019.
Zhang, H., Chen, G., Hu, J., Chen, S. H., Wiedinmyer, C., Kleeman, M., and Ying, Q.: Evaluation of a seven-year air quality simulation using the Weather Research and Forecasting (WRF)/Community Multiscale Air Quality (CMAQ) models in the eastern United States, Sci. Total Environ., 473, 275–285, https://doi.org/10.1016/j.scitotenv.2013.11.121, 2014a.
Zhang, H., DeNero, S. P., Joe, D. K., Lee, H.-H., Chen, S.-H., Michalakes, J., and Kleeman, M. J.: Development of a source oriented version of the WRF/Chem model and its application to the California regional PM PM2.5 air quality study, Atmos. Chem. Phys., 14, 485–503, https://doi.org/10.5194/acp-14-485-2014, 2014b.
Zhao, S., Hu, B., Liu, H., Du, C., Xia, X., and Wang, Y.: The influence of aerosols on the NO2 photolysis rate in a suburban site in North China, Sci. Total Environ., 767, 144788, https://doi.org/10.1016/j.scitotenv.2020.144788, 2021.
Zheng, B., Tong, D., Li, M., Liu, F., Hong, C., Geng, G., Li, H., Li, X., Peng, L., Qi, J., Yan, L., Zhang, Y., Zhao, H., Zheng, Y., He, K., and Zhang, Q.: Trends in China's anthropogenic emissions since 2010 as the consequence of clean air actions, Atmos. Chem. Phys., 18, 14095–14111, https://doi.org/10.5194/acp-18-14095-2018, 2018.
Zhu, B., Kang, H. Q., Zhu, T., Su, J. F., Hou, X. W., and Gao, J. H.: Impact of Shanghai urban land surface forcing on downstream city ozone chemistry, J. Geophys. Res.-Atmos., 120, 4340–4351, https://doi.org/10.1002/2014JD022859, 2015.