the Creative Commons Attribution 4.0 License.
the Creative Commons Attribution 4.0 License.
 | 12 Jan 2023
A modeling study of an extreme rainfall event along the northern coast of Taiwan on 2 June 2017
Ting-Yu Yeh
Chih-Sheng Chang
Ming-Siang Li
Kazuhisa Tsuboki
Ching-Hwang Liu
In this study, the extreme rainfall event on 2 June 2017 along the northern coast of Taiwan is studied from a modeling perspective. While a peak amount of 645 mm was observed, two 1 km experiments produced about 400 and 541 mm, respectively, using different initial and boundary conditions, and thus are compared to isolate the key reasons for a higher total amount in the second run. While the conditions in the frontal intensity and its slow movement are similar in both runs, the frontal rainband remains stationary for a long period in this second run due to a frontal disturbance that acts to enhance the prefrontal southwesterly flow and focuses its convergence with the postfrontal flow right across the coastline. Identified as the key difference, this low-pressure disturbance is supported by the observation, and without it in the first run, multiple slow-moving rainbands pass through the coastal region and produce more widely spread but less concentrated rainfall, resulting in the lower peak amount by comparison.
To explore and test the effects of Taiwan's topography in this event, two additional 1 km runs are also used. It is found that the removal of the terrain in northern Taiwan allowed the postfrontal cold air to move more inland and the rainfall became less concentrated, in agreement with a recent study. Also, when the entire island topography of Taiwan is removed, the result showed significant differences. In this case, the blocking and deflecting effects on the prefrontal flow are absent, and the heavy rainfall in northern Taiwan does not occur.
- Article
(29434 KB) - Full-text XML
- BibTeX
- EndNote


During the transition period from the northeastern to southwestern monsoon, there exists an early summer rainy season in many regions in East Asia, including China, Taiwan, Japan, and Korea (e.g., Lau et al., 1988; Ding, 1992; Chen, 2004; Ding and Chan, 2005). Known as the Mei-yu (plum rain) season in Taiwan, it is defined as May and June by the Central Weather Bureau (CWB). During this season, the Mei-yu front often forms repeatedly between the cold continental and warm maritime air masses (located in China and the subtropical western North Pacific, respectively) and moves in to affect the region and subsequently becomes stationary in order to bring about the continuous rainy conditions (Chen and Chi, 1980; Chen, 1992; Ding and Chan, 2005). When a Mei-yu front develops or approaches Taiwan, the horizontal pressure gradient can strengthen at times, and the wind speed south of the front increases to form a low-level jet (LLJ; e.g., Chen et al., 1994; Chen and Chen, 1995). Coming from the southwest, the LLJ can often transport the moist and unstable air toward Taiwan and the Mei-yu front from the upstream ocean, and thus has long been recognized as an important feature for causing heavy rainfall in Taiwan in the literature (e.g., Chen and Yu, 1988; Kuo and Chen, 1990; Chen et al., 2005, 2008). Under such conditions, organized mesoscale convective systems (MCSs) such as squall lines (Rotunno et al., 1988; Houze et al., 1989; Lin et al., 1990; Jou and Deng, 1992; Chen and Chou, 1993; Wang et al., 2014a) can develop near the front and make landfall in Taiwan (e.g., Kuo and Chen, 1990; Chen, 1992, 2004; Chen et al., 1998; Wang et al., 2011; Xu et al., 2012). The steep topography of Taiwan, with the highest peak reaching almost 4 km (Fig. 1a), also acts to enhance the convection or trigger new convection by forced uplift (e.g., Kuo and Chen, 1990; Nagata and Ogura, 1991; Lin, 1993; Lin et al., 2001; Wang et al., 2022b). Therefore, the long-term Mei-yu rainfall climatology shows two prominent centers over the mountain interiors in central and southern Taiwan (Chi, 2006; Wang et al., 2022b), and they even also appear in total rainfall in most individual seasons (e.g., Yeh and Chen, 1998; Chien and Jou, 2004; Wang et al., 2017, 2022a). A third but less pronounced center (Chi, 2006) appears in northern Taiwan (and in some seasons) and is typically associated with the Mei-yu front.
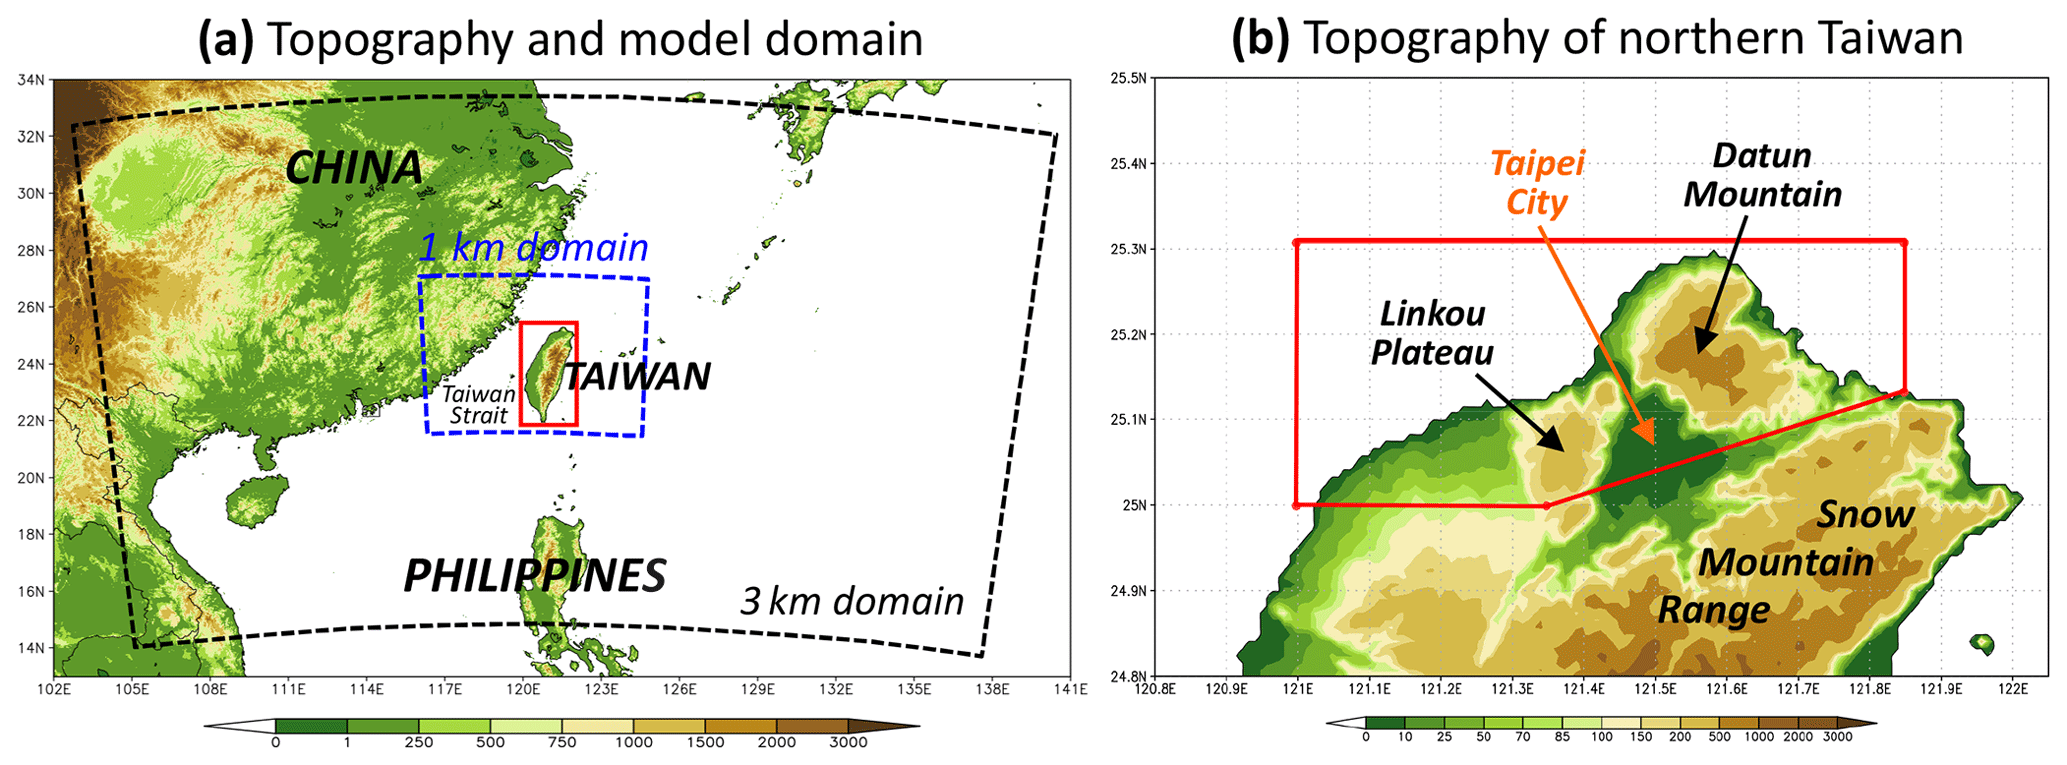
Figure 1(a) The topography of Taiwan and surrounding areas (m, color, scale at bottom) and the domains of 3 and 1 km Cloud-Resolving Storm Simulator (CReSS) experiments. The red box depicts the region of terrain removal in the F3-NT and F1-NT experiments. (b) Topography (m) and the region of terrain removal in northern Taiwan used in the F3-NNT and F1-NNT experiments (pentagon enclosed by red lines). See Sect. 2.3 for the meanings of experiments.
In addition to forced uplift, the topography of Taiwan also has thermodynamic effects and is an important contributor to the island circulation and diurnal cycle of rainfall during the Mei-yu season (e.g., Akaeda et al., 1995; Chen et al., 1999; Kerns et al., 2010; Johnson, 2011; Ruppert et al., 2013; Wang et al., 2014b, 2022b). It also exerts a significant blocking effect on the oncoming prevailing environmental flow (e.g., Pierrehumbert and Wyman, 1985; Banta, 1990; Yeh and Chen, 2002; Wang et al., 2005). In the latter situation, Yeh and Chen (2003) suggested that the deflection of southwesterly flow by the Central Mountain Range (CMR) of Taiwan can often produce a local barrier jet (BJ) off the northwestern coast of the island (also Li and Chen, 1998; Yeh and Chen, 2002). The low-level convergence induced by this BJ can lead to heavy rainfall in the area (Yeh and Chen, 2003) when a frontal rainband also arrives, thus contributing to the third rainfall center in northern Taiwan.

Figure 2The CWB surface weather charts, overlaid with the NAVGEM 925 hPa flow field, surrounding Taiwan every 6 h from (a) 12:00 UTC on 1 June to (d) 06:00 UTC on 2 June 2017. In the panels, the mean sea-level pressure (MSLP, hPa) is analyzed with isobars every 4 hPa (thickened at 1000 hPa), and the frontal position (and type) and closed high/low centers (labeled as H/L) are marked (source: CWB and the Databank for Atmospheric and Hydrologic Research – DBAHR).
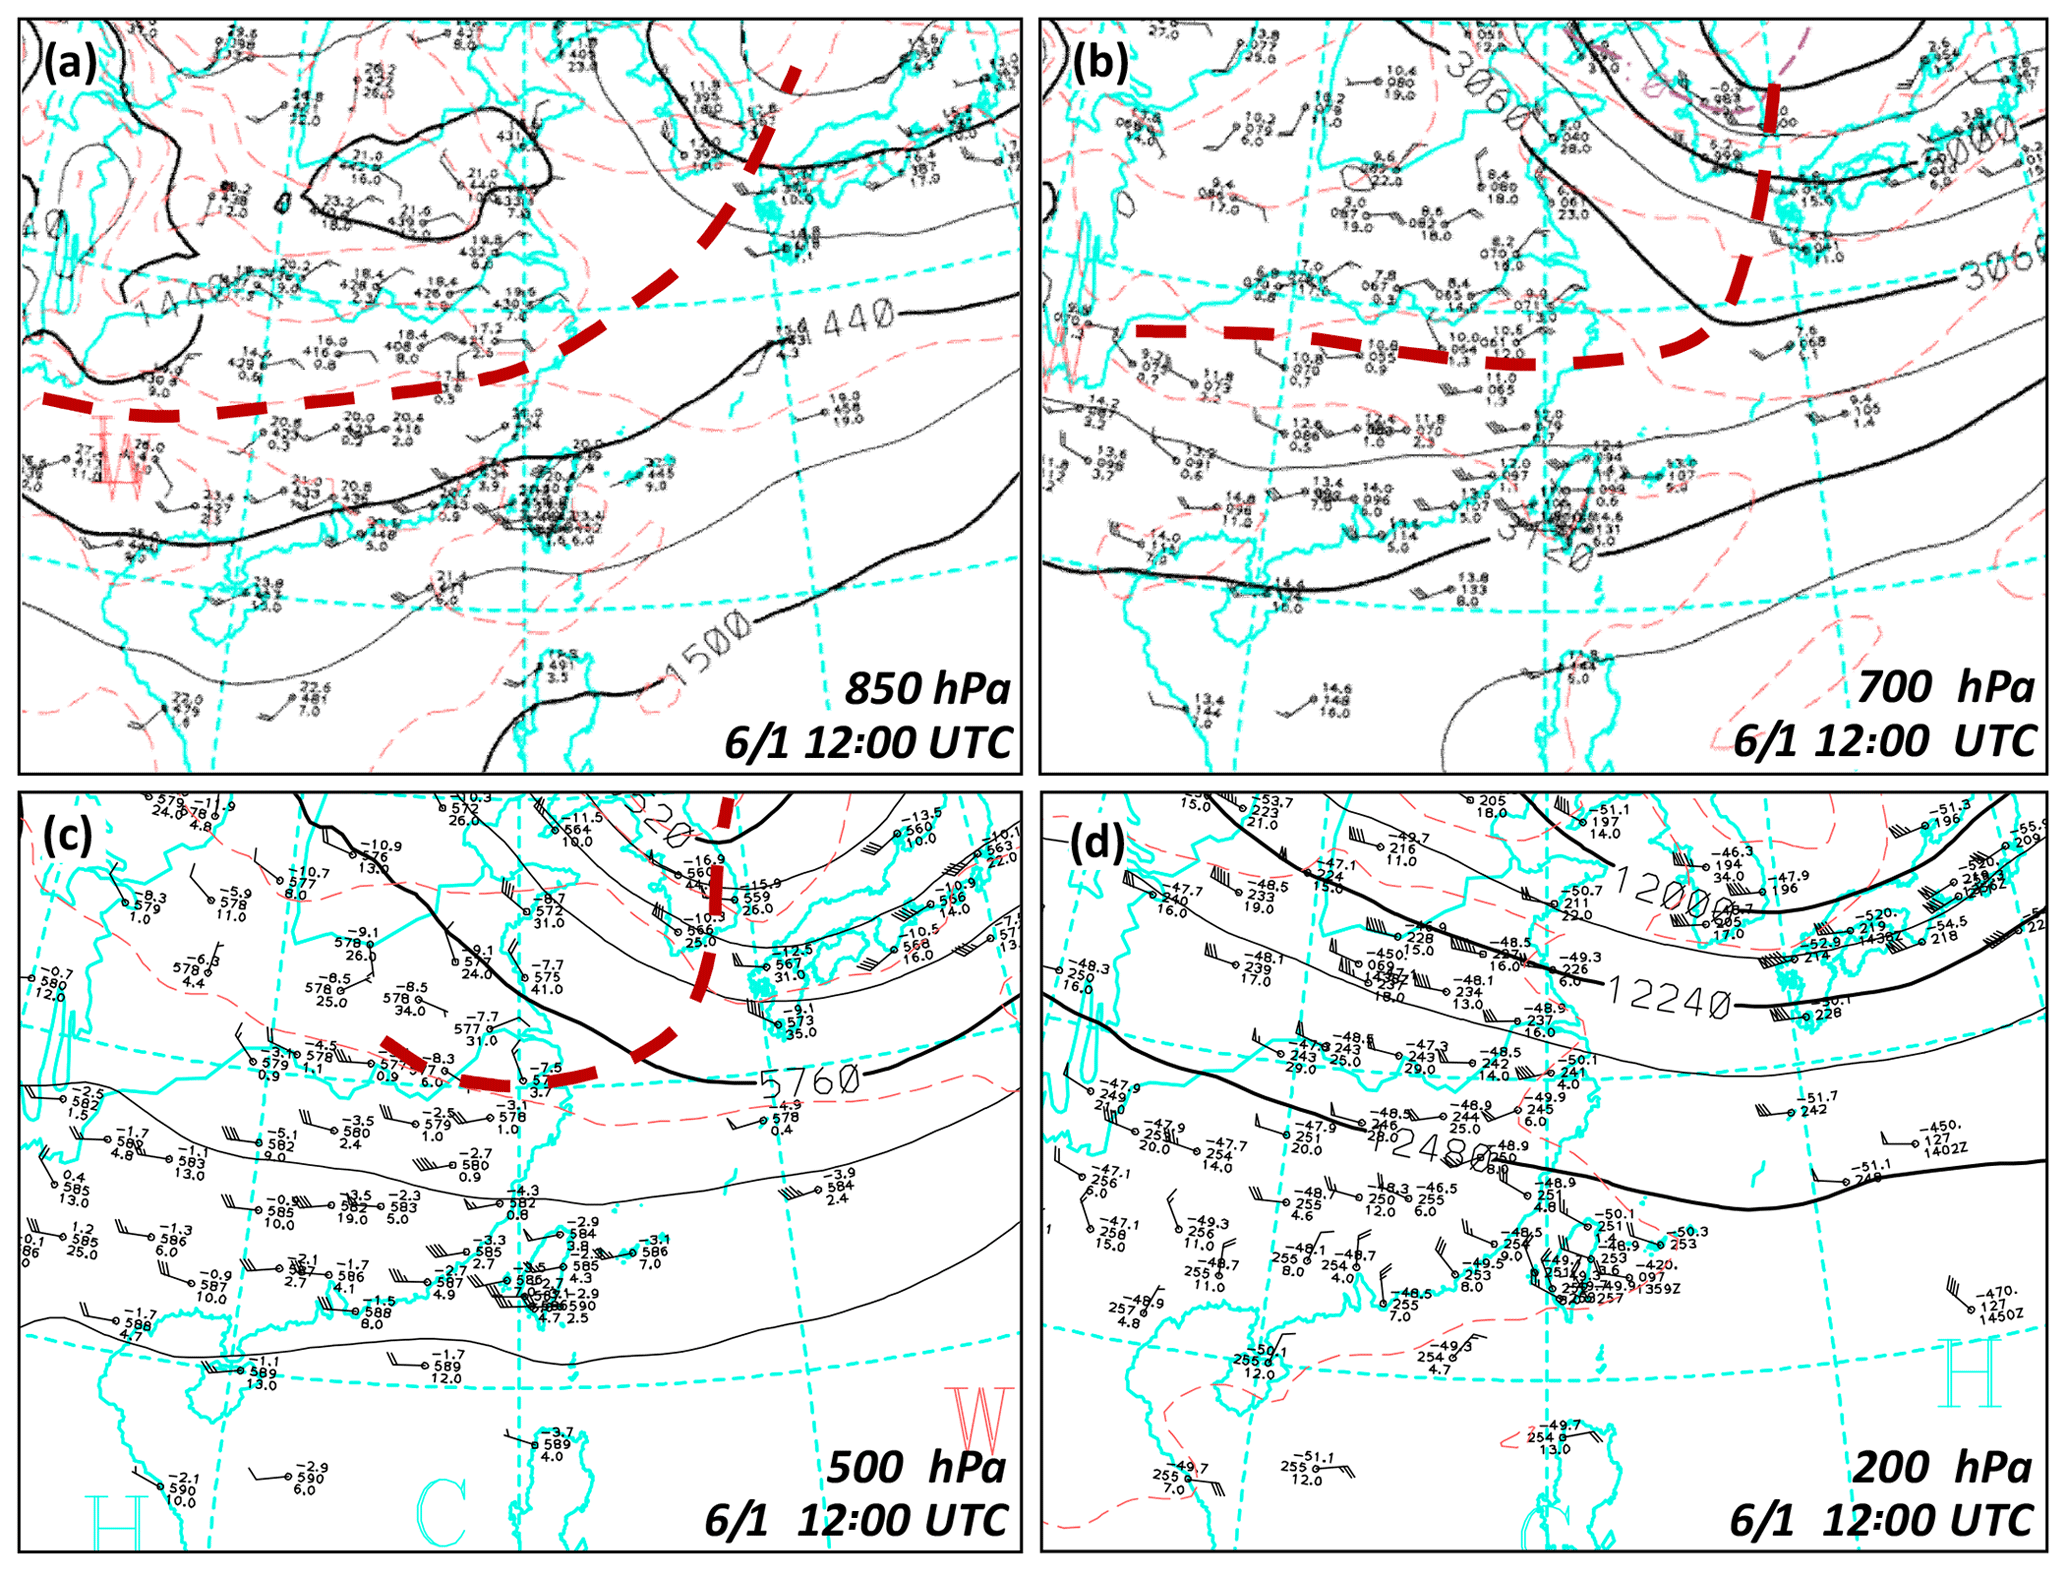
Figure 3The CWB upper-air charts surrounding Taiwan at (a) 850, (b) 700, (c) 500, and (d) 200 hPa at 12:00 UTC on 1 June 2017. In the panels, geopotential height (gpm, solid isopleths) and temperature (∘C, thin red dashed isotherms) are analyzed at intervals of 30, 30, 60, and 120 gpm and 3, 3, 5, and 5 ∘C, respectively, following the order (source: CWB). The thick red dashed lines mark troughs or wind-shift lines.
During the past two decades or so, only two events reached 500 mm in 24 h (defined as “extremely torrential rainfall” by the CWB) in northern Taiwan in the Mei-yu season, on 11–12 June 2012 and on 2 June 2017, respectively. With serious flooding in or close to the populous Taipei metropolitan area (Fig. 1b), each event caused severe property damage and economic loss, and thus demand particular attention from the research community. In the 11–12 June event in 2012, Taipei received a peak rainfall of 510 mm in 24 h, caused by two successive rainbands overnight: a prefrontal squall line and a stationary rainband that formed in the northern Taiwan Strait and extended into northern Taiwan (Wang et al., 2016). While each rainband lasted for about 6 h, the second one was studied in detail and found to form ahead (south) of the surface front over the northern Taiwan Strait, along the convergence zone between the southwesterly flow deflected by the topography and the unblocked west-southwesterly flow farther offshore in the environment (Wang et al., 2016). Contributing toward the vigor of the convection and thus total rainfall, the back-building process occurring inside the rainband without the presence of the cold pool was also studied. On the other hand, Chen et al. (2018) emphasized the high moisture content and moisture flux inside the marine boundary layer in this event. In their sensitivity test with the topography of Taiwan removed, the BJ did not form offshore of northwestern Taiwan (also Ke et al., 2019). Consequently, without the rainband between the BJ and the environmental flow, only a fraction of the observed rainfall was produced in northern Taiwan (Chen et al., 2018).
In the second event on 2 June 2017, the rainfall amount was even higher (645 mm in 24 h) and was maximized along the coast at the northern tip of Taiwan, caused by a single intense, quasi-stationary and long-lasting rainband along the Mei-yu front (more details in Sect. 3). This event was responsible for much of the local economic loss of around USD 9 million in the 2017 season (Huang et al., 2019). For this event, Wang et al. (2021, hereafter referred to as WLC21) performed an ensemble-based sensitivity analysis (ESA, Ancell and Hakim, 2007; Torn and Hakim, 2008; Bednarczyk and Ancell, 2015) using 45 forecast members at grid sizes (Δx) of 2.5–5 km. In a quantitative way, the study identified several factors influencing the areal-mean rainfall amount over a 6 h period inside an area (roughly 80×55 km2 in size) centered at the northern tip of Taiwan. Expressed as their impact on rainfall every increase in one standard deviation (SD), these factors are: (1) surface frontal position and moving speed (−16.00 mm per 5 km h−1), (2) position of 700 hPa wind-shift line (+12.59 mm per 0.4∘ latitude), (3) environmental moisture amount (mixing ratio) near the surface front (+11.73 mm per 0.92 g kg−1), (4) timing and location of frontal low-pressure disturbance (+11.03 mm per 1.38∘ longitude), and (5) frontal intensity (+9.58 mm per 3 K in equivalent potential temperature difference across 0.5∘). While many of these factors are interconnected, the local rainfall tended to be higher in ensemble members if the duration of heavier rainfall is longer and the near-surface convergence across the front and over the upstream area (along the northwestern coast of Taiwan) is stronger, as expected (WLC21). Among the 45 members, the best one (named M18) produced 360 mm in 12 h at the northern coast. More recently, Tu et al. (2022) also studied this 2017 event and attributed the heavy coastal rainfall to the postfrontal cold air being too shallow to climb over the mountain in northern Taiwan (∼ 1.1 km in peak elevation; see Fig. 1b) for the first 8 h. While the maximum value is not explicitly noted, their 3 km control simulation likely produced around 450 mm in 24 h (for 2 June in LST) at the northern coast (their Fig. 18b), compared to 645 mm in the observation. When the terrain in northern Taiwan was removed (lowered to ≤ 150 m) in their sensitivity test, the local rainfall center shifted to the northwestern coast and the peak amount reduced to below 400 mm, likely around 350 mm (their Fig. 18c), thus perhaps by around 100 mm or 25 %.
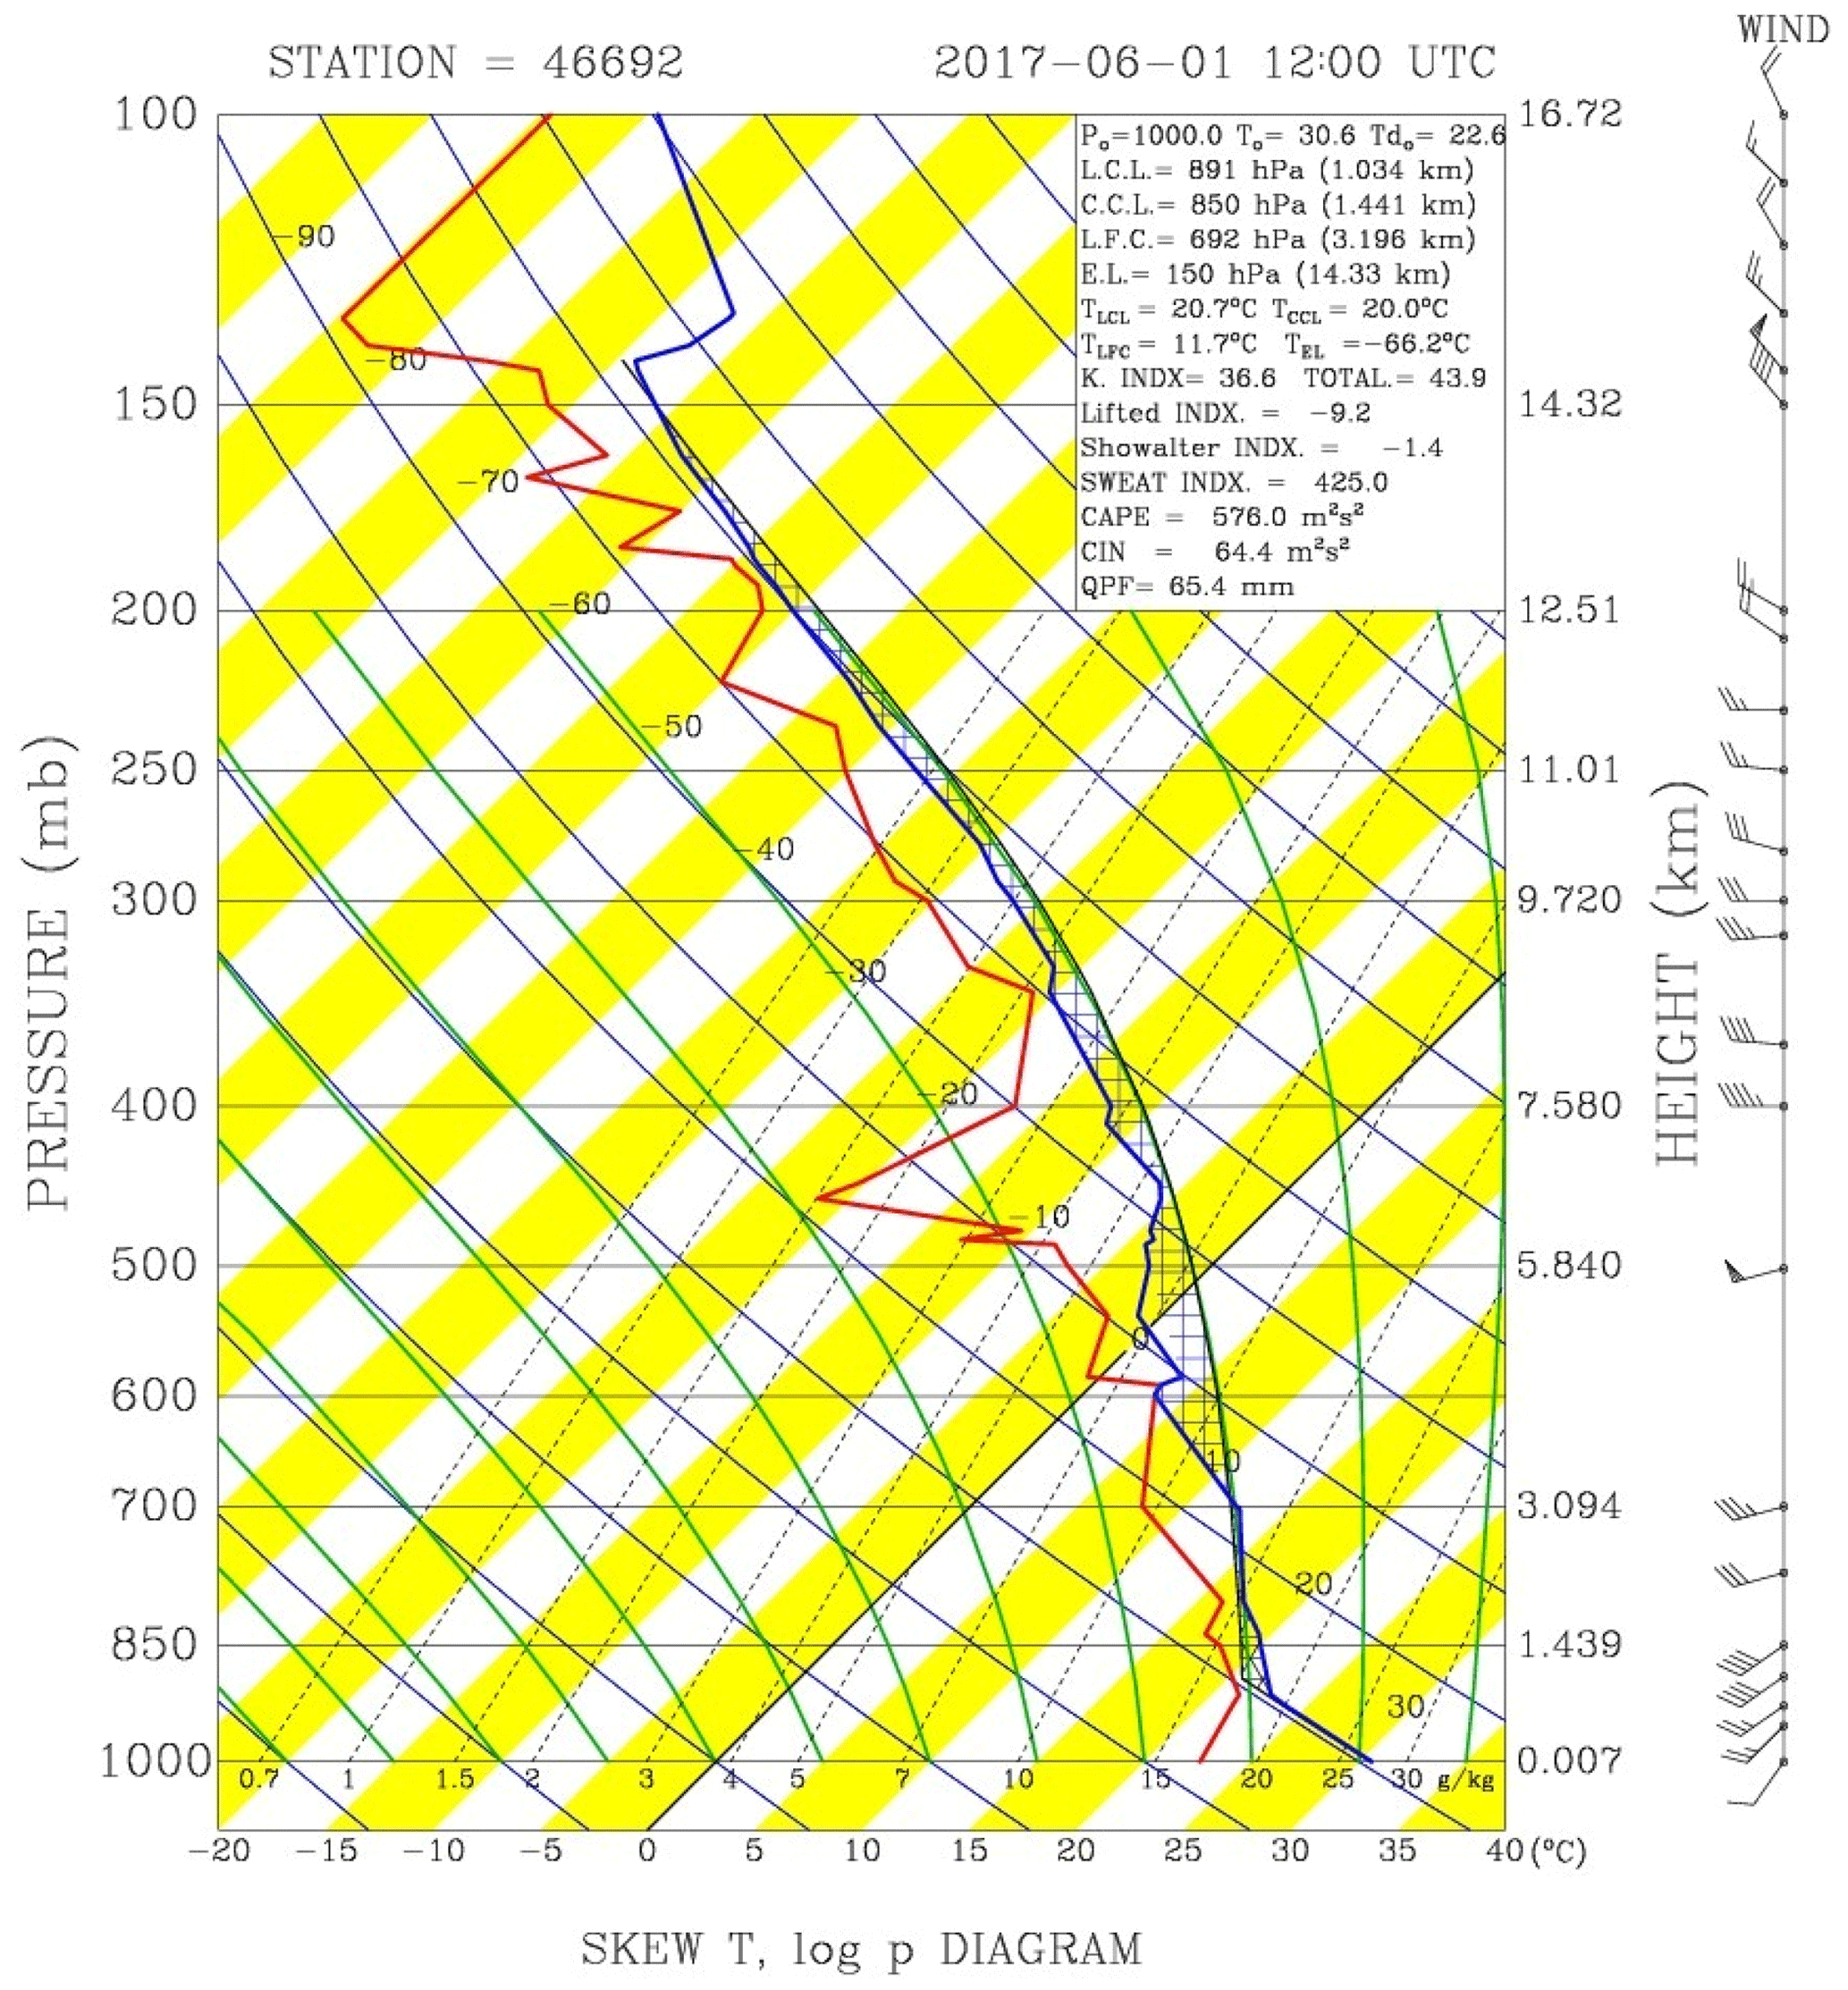
Figure 4The sounding and horizontal wind profiles at Panchiao, Taipei (46692), launched at 12:00 UTC on 1 June 2017. Some relevant parameters are given at the top right.
A few questions remain regarding this event on 2 June 2017. First, it appears quite challenging to reproduce a peak amount close to the observation (645 mm) at the correct location at Δx of 2.5–3 km, including for Lupo et al. (2020) and Chung et al. (2020), especially in forecasts. In WLC21, all ensemble members had 12 h peak rainfall of 360 mm or less, and a relatively low ensemble mean value (∼ 130 mm) and a large spread suggest a low predictability for the extreme rainfall in the northern coast of Taiwan in this event. So, can a rainfall distribution closer to the observation be obtained, say, reaching extremely torrential rainfall (≥ 500 mm), perhaps using a higher resolution? Second, the five factors identified by WLC21 using ESA are important to differentiate the more rainy members (with peak 12 h amounts of about 150–350 mm) from less rainy ones (below 150 mm) in northern Taiwan. Obviously, such peak amounts still differ quite a lot from the observation, and thus lead to our second question: do certain factors among the five become dominant over the others, if the model is to produce a peak amount of over 500 mm at the northern coast? In this study, we seek answers to the above questions, and both will be shown to be affirmative. In one of our 1 km experiments, a peak 24 h rainfall of 541 mm is captured along the northern coast, while another experiment only has close to 400 mm. Thus, these two model runs are compared in detail to isolate the reasons for the considerably higher peak amount in the former experiment. Additional tests on topography were also carried out in this study using a 1 km grid size, and the results are in general agreement with Tu et al. (2022). In contrast, however, other key differences in the evolution of rainbands are also found herein, and the related aspects are discussed and elaborated on later.
The remaining part of this paper is arranged as follows. The data, numerical model and experiments are described in Sect. 2. In Sect. 3, an overview of the case on 2 June 2017 is given. The results of our 1 km tests on topographic effects are discussed in Sect. 4. In Sect. 5, the 1 km experiments are presented and contrasted to isolate the key differences in the model for a peak rainfall amount approaching the observed value along the northern coast. Further discussion is given in Sect. 6, followed by the conclusion and summary in Sect. 7.
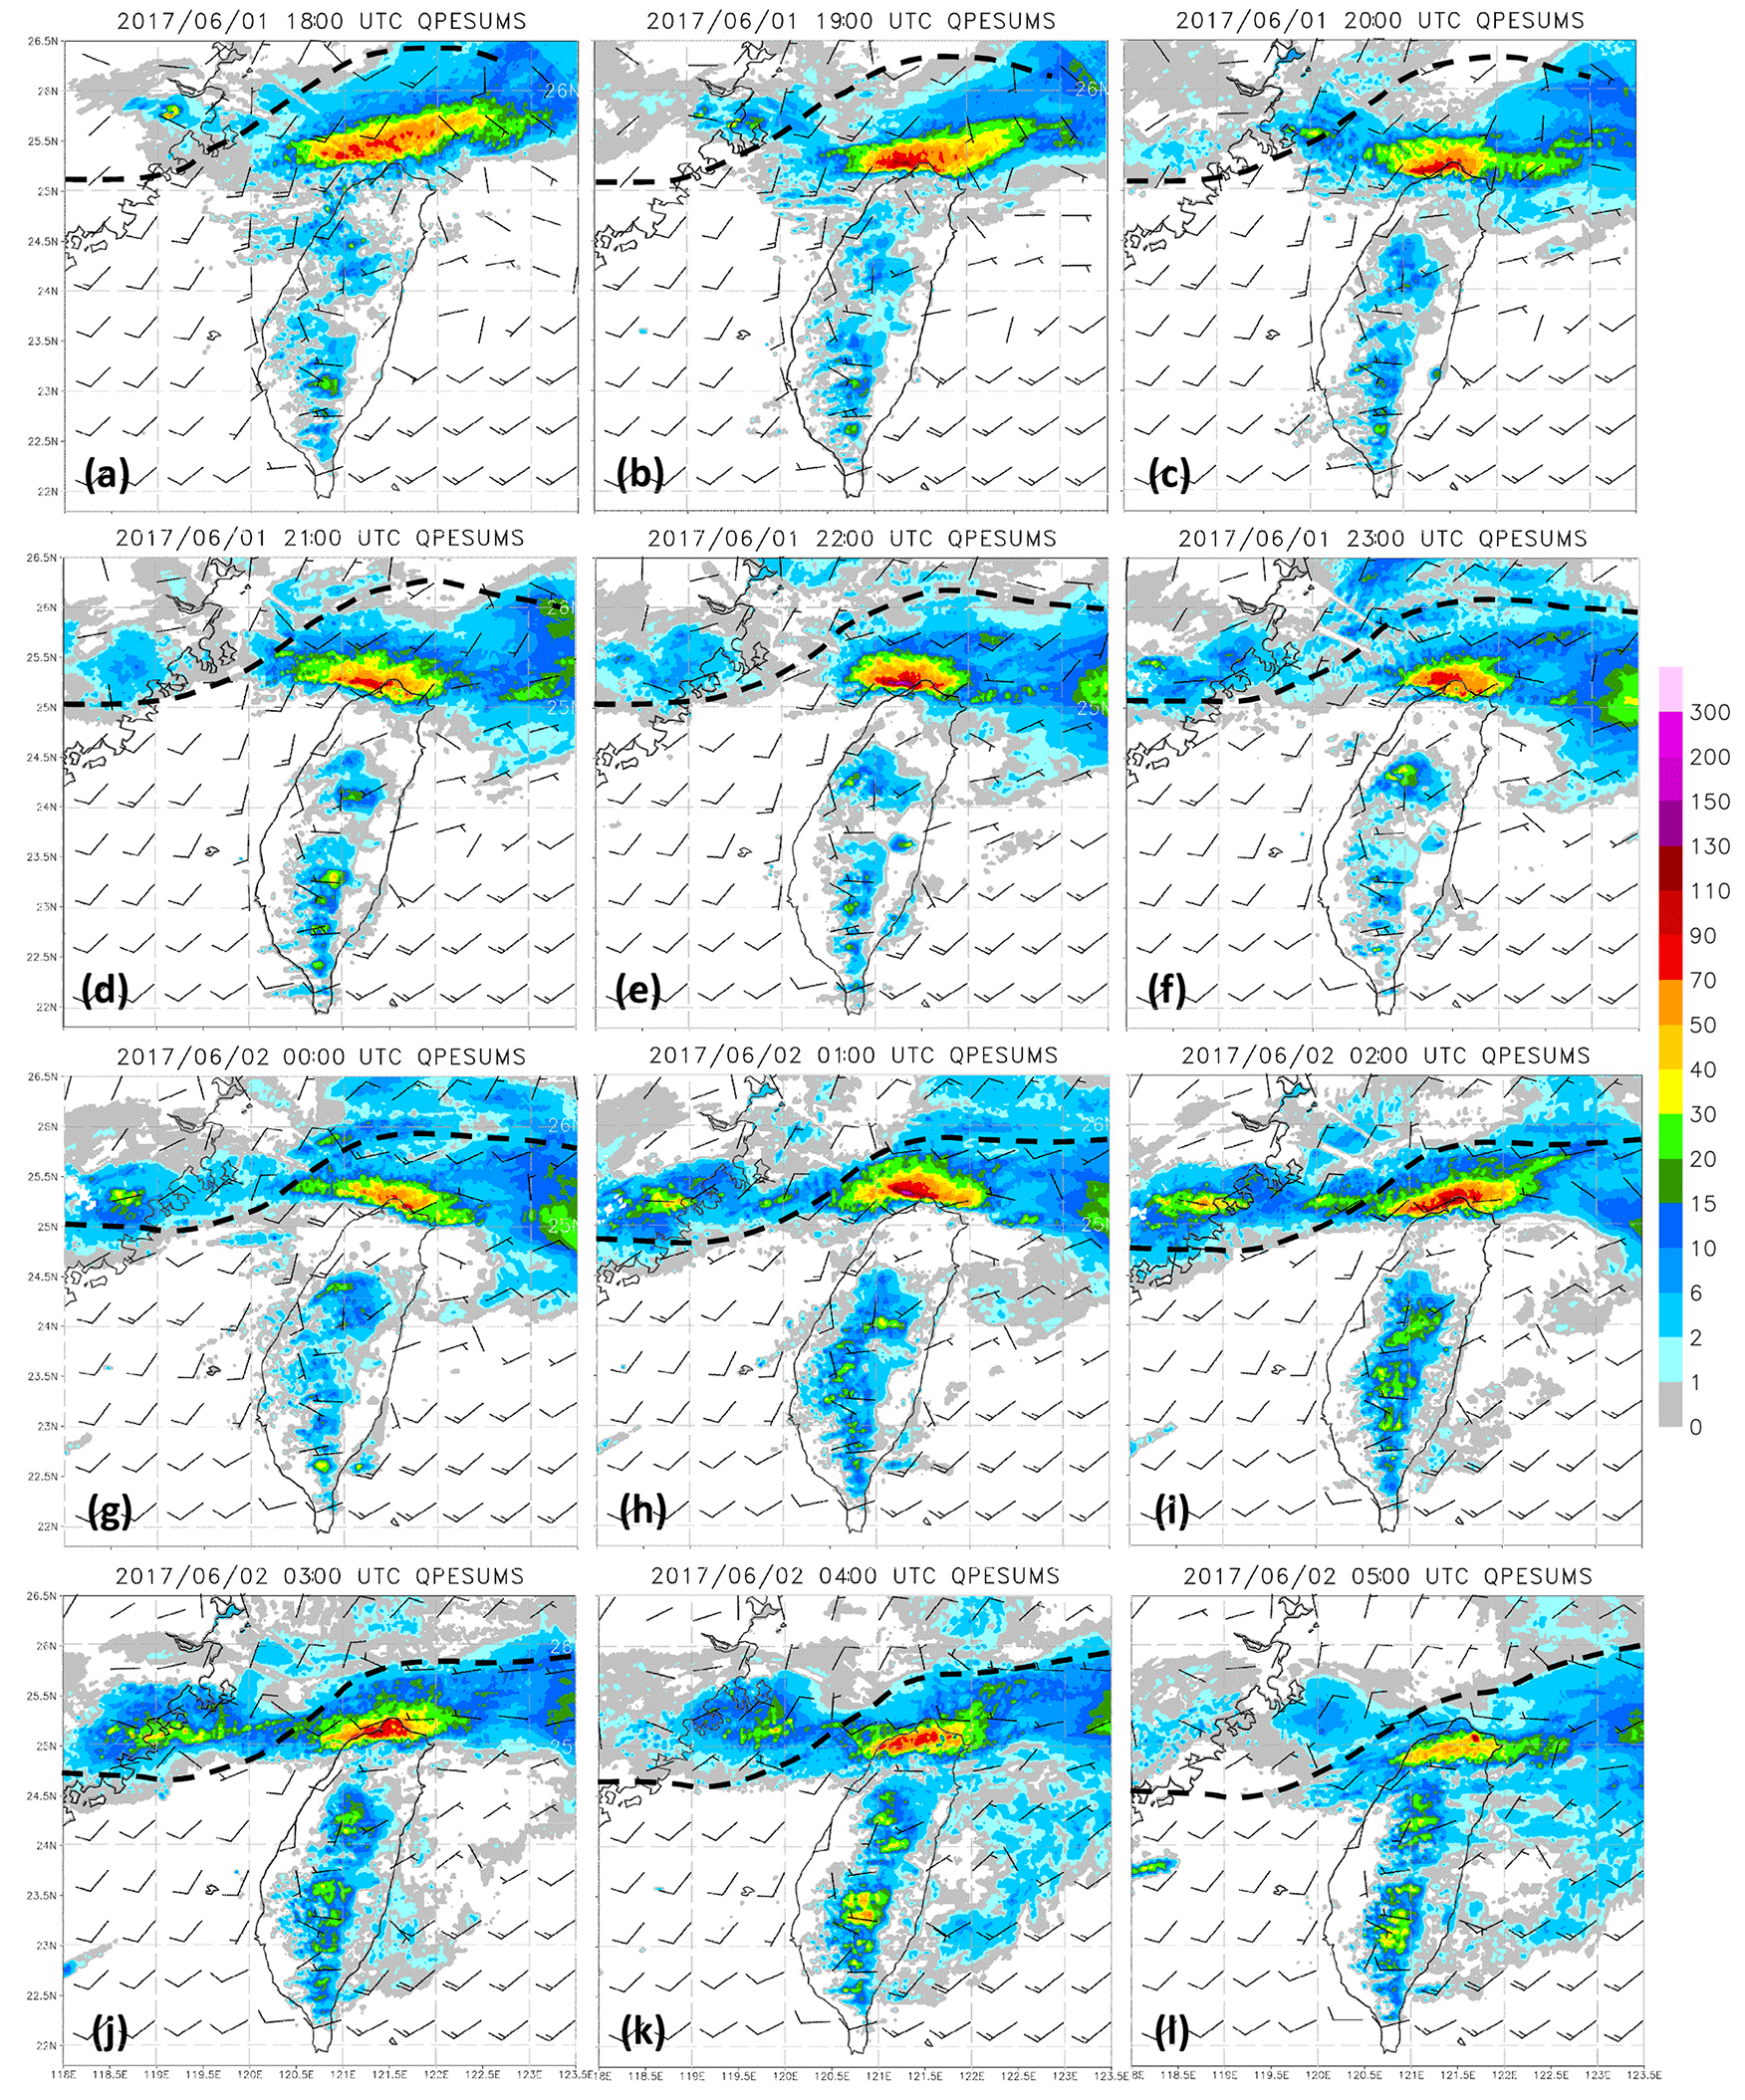
Figure 5Hourly rainfall (mm) from the Quantitative Precipitation Estimation and Segregation using Multiple Sensors (QPESUMS), a radar-derived product merged with rain-gauge observations (source: CWB and the National Science and Technology Center for Disaster Reduction (NCDR) of Taiwan), overlaid with surface horizontal winds (barbs, 1 full barb = 10 m s−1) in the NCEP FNL analyses, surrounding Taiwan from (a) 18:00 UTC on 1 June to (l) 05:00 UTC on 2 June 2017. The wind fields between the 6-hourly FNL analyses are linearly interpolated in time.
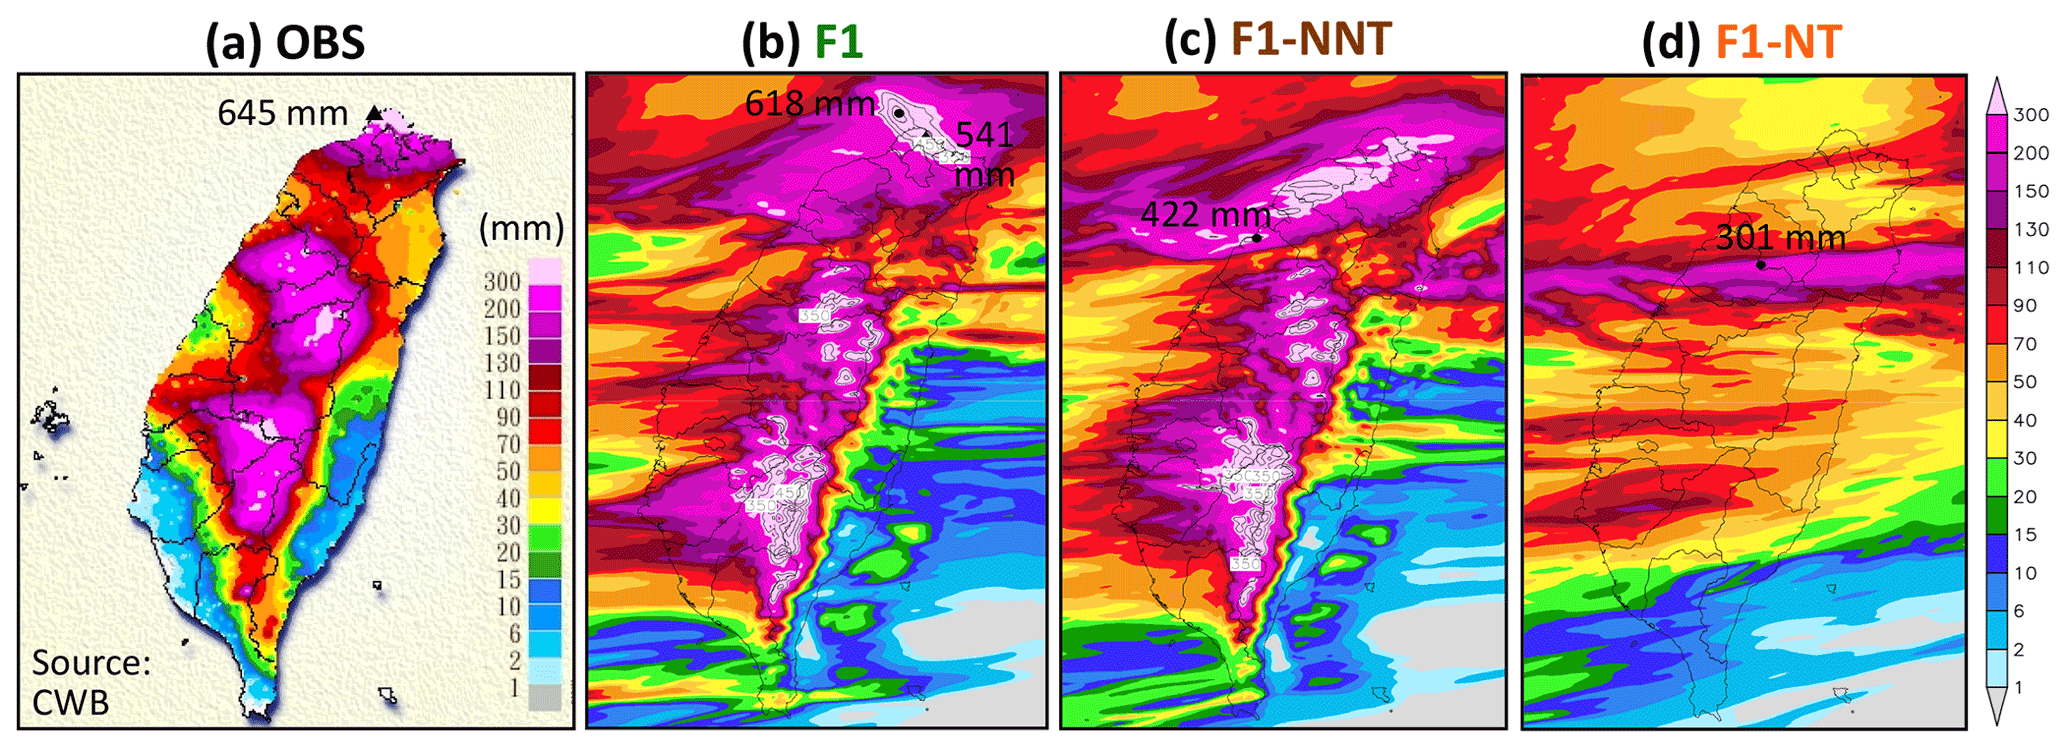
Figure 6Distribution of 24 h accumulated rainfall (mm, color) in Taiwan (a) from the rain-gauge observations from 16:00 UTC on 1 June to 16:00 UTC on 2 June 2017 (source: CWB) and from three model experiments of (b) F1, (c) F1-NNT, and (d) F1-NT, respectively, all for the same 24 h period. The maximum values in the northern coast (triangles) and those near northern Taiwan in model experiments (dots) are labeled.
2.1 Data
The observational data used in this study include weather maps, sounding data, rain-gauge data, merged rainfall estimates from radar, and gauge observations from the Central Weather Bureau (CWB) of Taiwan, as well as the gridded analyses from the National Centers for Environmental Prediction (NCEP), the Navy Global Environmental Model (NAVGEM), and the Naval Research Laboratory of the USA. The weather maps and sounding data at Panchiao (near Taipei) are used for the discussion in synoptic environments and thermodynamic conditions, and the hourly rainfall data (Hsu, 1998) and the Quantitative Precipitation Estimation and Segregation using Multiple Sensors (QPESUMS), a radar-derived estimates calibrated by rain gauges over land (Gourley et al., 2001), at 10 min intervals are used for the overview of the stationary rainband and extreme rainfall in the present event.
The analysis and discussion in this study are also aided by the use of gridded global analyses during our case period. These datasets include the final (FNL) analyses from the NCEP Global Forecast System (GFS) every 6 h, at 0.25∘ × 0.25∘ and 26 levels (at surface and from 1000 to 10 hPa, Kalnay et al., 1990; Moorthi et al., 2001; Kleist et al., 2009), as well as the NAVGEM (version 1.4, T425L50; Metzger et al., 2013). Both analyses include all the important variables, such as pressure (p), temperature (T), geopotential height (zΦ), horizontal wind components (u and v), and moisture content, and the former is also used to drive our 3 km experiments (described later in Sect. 2.3). Where needed, both the observational data and gridded analyses are used to compare and validate the model results.
Table 1The physical package used by all CReSS experiments (with references) in this study.
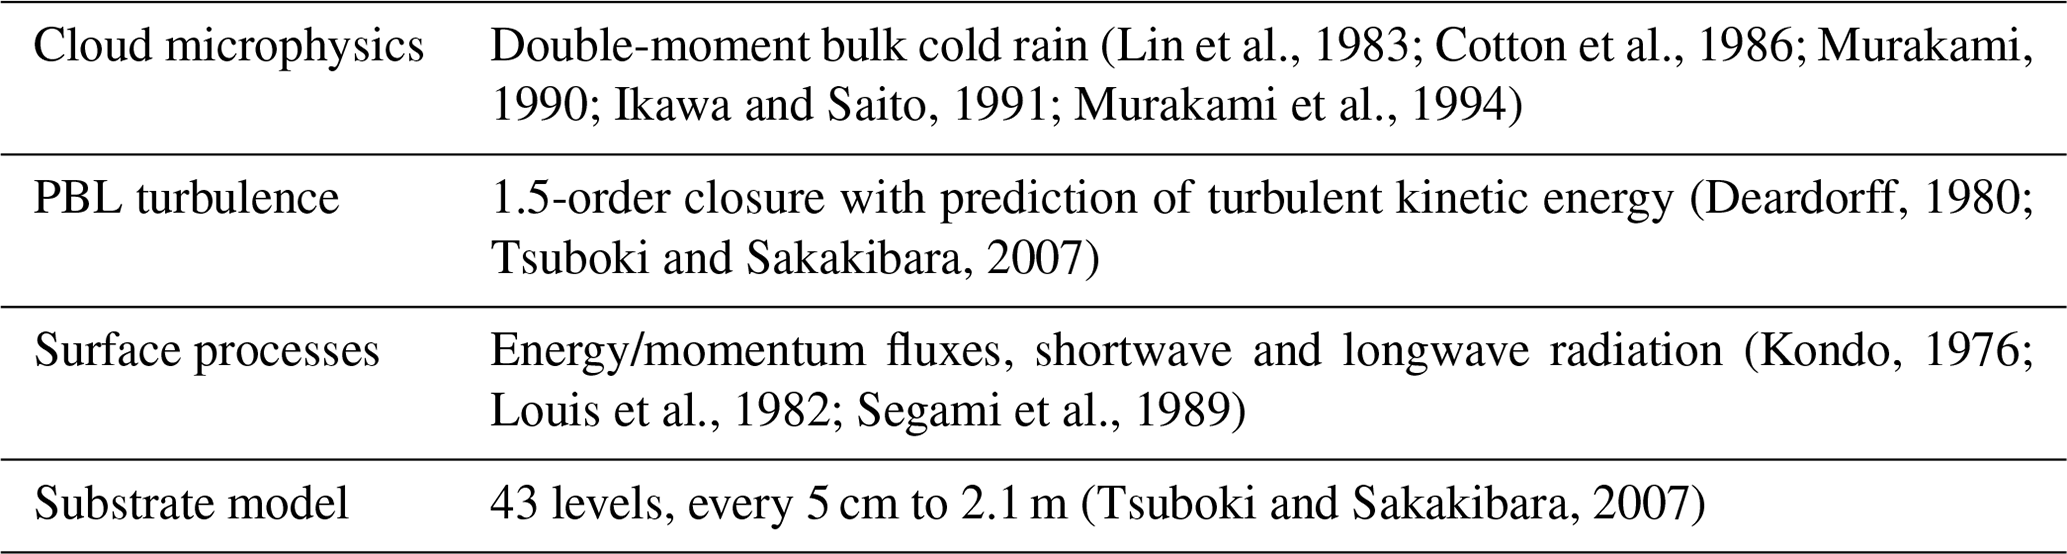
Table 2The domain configuration, initial and boundary conditions, simulation period (UTC), and other relevant settings of four CReSS experiments (F3, F1, S3, and F1) to investigate the heavy rainfall mechanism in this study. For grid configuration, the numbers are in . The F3 experiment is the same as M18 in WLC21.
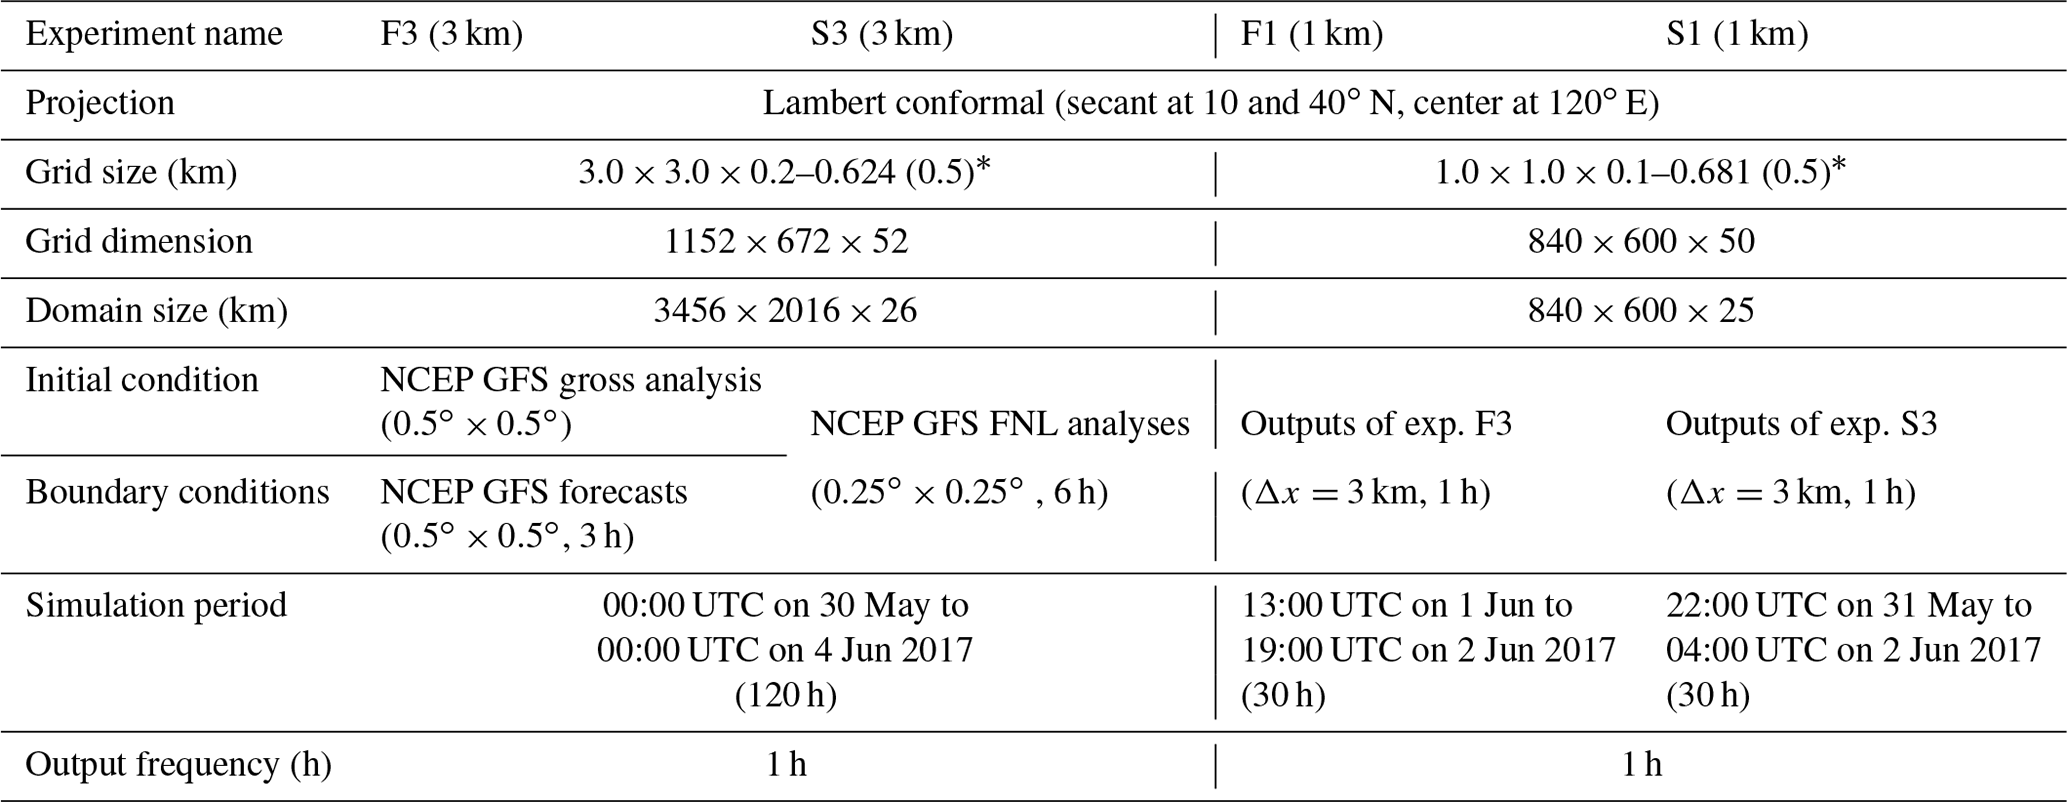
* The vertical grid spacing of CReSS is stretched (smallest at bottom), and the parentheses give the averaged value.
2.2 The CReSS model
The numerical model used in this study is the Cloud-Resolving Storm Simulator (CReSS, version 3.4.2) developed at Nagoya University, Japan (Tsuboki and Sakakibara, 2002, 2007). This is a single-domain cloud model that employs a nonhydrostatic and compressible equation set and a terrain-following vertical coordinate system. As shown in Table 1, all clouds are explicitly simulated in CReSS using a double-moment bulk cold rain microphysical scheme with six species of vapor, cloud water, cloud ice, rain, snow, and graupel. While other more simple schemes (1.5- or single-moment or warm rain only) are also available, this scheme is the most complete and sophisticated one available and thus was chosen here as in WLC21. Parameterized sub-grid scale processes include turbulent mixing in the planetary boundary layer, radiation, and surface momentum and energy fluxes with a substrate model (Table 1). In all our experiments, the above physical options are all kept the same. Further details regarding the CReSS model can be found in some earlier studies (e.g., Wang et al., 2012; 2014a, b, 2016, WLC21) or online (http://www.rain.hyarc.nagoya-u.ac.jp/~tsuboki/cress_html/index_cress_eng.html, last access: 15 March 2019).
Table 3Design and brief description of the CReSS experiments included in this study to test the effects of topography. The control experiments of F3 and F1 are the same as those given in Table 2.
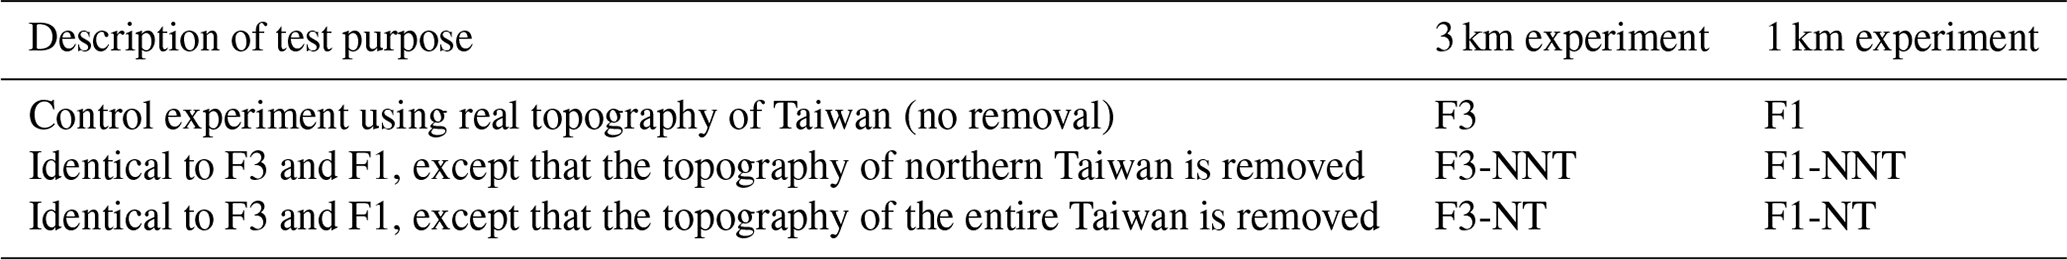
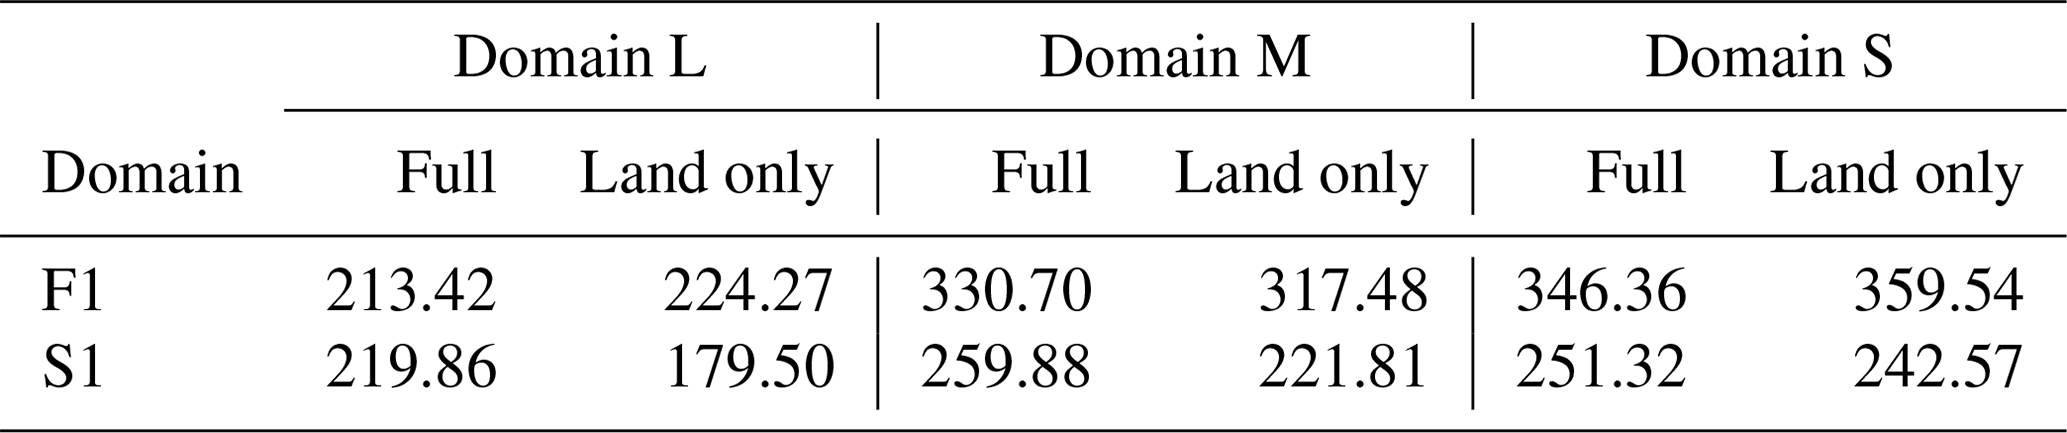
Table 4Comparison of areal-averaged 24 h rainfall (mm) inside the three domains, denoted as large (L) domain (24.85–25.65∘ N, 120.75–122.15∘ E), middle (M) domain (25.05–25.45∘ N, 121.1–121.8∘ E), and small (S) domain (25.1–25.3∘ N, 121.35–121.8∘ E), respectively, in experiments S1 and F1 during their selected 24 h period (starting from 00:00 UTC on 1 June for S1 and 16:00 UTC on 1 June for F1). The three domains are depicted in Fig. 9, and the mean rainfall values are given for the full domain and land only.
2.3 Numerical experiments
A total of eight experiments were performed and used in this study. Four of them are at a horizontal grid size (Δx) of 3 km with a fairly large domain and employed the NCEP GFS real-time gross analyses and forecasts, or FNL analyses, as their initial and boundary conditions (IC/BCs) for the 5 d period starting from 00:00 UTC on 30 May 2017 (Tables 2 and 3). Then, these 3 km outputs were used as IC/BCs to drive corresponding 1 km experiments for a 30 h period which are presented for discussion. The first pair is the 3 km simulation (S3), which employed the NCEP GFS FNL analyses as IC/BCs and also real topography data on a ()∘ grid (about 900 m), then downscaled to Δx=1 km in the S1 experiment (Table 2). This S1 run only had 393 mm along the coast and was about 250 mm below the observation. Interestingly, another F1 experiment that was downscaled from the best forecast member in M18 of WLC21 (called F3 here), with otherwise identical setting (Table 2), was able to produce a peak amount of 541 mm along the northern coast, much closer to the observation. Since the F3–F1 pair produced the best rainfall results in northern Taiwan, they are designated as the control experiments in this study. Furthermore, both with real topography, F1 and S1 experiments are examined and compared in more detail in Sect. 5 to isolate the key differences between them that lead to the considerably different amounts of peak rainfall accumulation along the northern coast.
Based on the F3–F1 pair, two additional 3 and 1 km pairs of experiments were designed to test the impact of topography in the present event: the F3-NNT–F1-NNT pair where only the terrain in northern Taiwan is removed and the F3-NT–F1-NT pair in which the topography of the entire Taiwan is removed (Table 3). These runs were identical to the F3–F1 pair in all other aspects. In Fig. 1a and b, the respective regions of terrain removal are shown, and any topography exceeding 1 m is set to 1 m inside them. For each type of tests, the topography was removed in both the 3 and 1 km runs, so there is no lingering effects in the latter. In S3-NNT, both the Datun Mountain and Linkou Plateau are removed (Fig. 1b).

Figure 7Model surface winds at 10 m height (m s−1, reference vector at bottom), frontal position (thick dashed line), and column-maximum mixing ratio of precipitating hydrometeors (rain + snow + graupel, g kg−1, color) near Taiwan in the F1 experiment at (a) 18:00, (b) 22:00 on 1 June and (c) 01:00 UTC on 2 June 2017. As in (a)–(c), except in experiment (d)–(f) F1-NNT and (g)–(i) F1-NT, respectively. The model time (h) is also labeled in each panel.
3.1 Synoptic and prefrontal environment
The extreme rainfall event in northern Taiwan during 1–2 June in the Mei-yu season of 2017 is briefly reviewed in this section. First, the CWB surface weather maps overlaid with the NAVGEM 925 hPa flow fields surrounding Taiwan every 6 h from 12:00 UTC on 1 June to 06:00 UTC on 2 June 2017 are shown in Fig. 2. A stationary surface Mei-yu front, with roughly an east–west alignment, was located about 150 km north of Taiwan at 12:00 UTC (or 20:00 LST, where LST = UTC + 8 h) on 1 June (Fig. 2a). Near the commencement of heavy rainfall, it approached the northern coast of Taiwan around 18:00 UTC (02:00 LST on 2 June, Fig. 2b). Afterward, the front slowly moved through the northern part of the island during 00:00–06:00 UTC (08:00–14:00 LST) on 2 June (Fig. 2c, d). Thus, the surface front remained in the vicinity of northern Taiwan for about 12 h. To the south of the front, persistent southwesterly flow appeared at 925 hPa throughout this period (Fig. 2).
Figure 3 shows the synoptic conditions aloft in the troposphere at 12:00 UTC on 1 June. Extending from the low pressure over the Sea of Japan, the front (or trough) over the East China Sea and South China was at about 27.5∘ N at 850 hPa (Fig. 3a) and further north near 28.5∘ N at 700 hPa (Fig. 3b), with clearly easterly flow to its north. Further up at 500 hPa, the wind-shift line became less apparent (Fig. 3c). Nonetheless, a baroclinic structure of the front was evident in Fig. 3, with a northwestward tilt with height. Associated with this, a veering of the strong flow (roughly 30 kn) near Taiwan existed, from west-southwesterly flow at 850 and 700 hPa to westerlies at 500 hPa, and further to west-northwesterlies at 200 hPa, indicating warm air advection as well.
The sounding observation made at Panchiao (near Taipei) in northern Taiwan at 12:00 UTC on 1 June (Fig. 4) showed a prefrontal environment that was well mixed in the PBL below 900 hPa in the early evening (20:00 LST), consistent with the strong vertical wind shear near the surface (Figs. 2a and 3). Also with gradual veering, the flow south of the surface front increased to 40 kn in speed at 900–850 hPa and further to 50 kn at 500 hPa, clearly reaching the criteria of the LLJ (Jou and Deng, 1992; Wang et al., 2014a). Above the PBL, the temperature lapse rate suggested conditional instability of up to about 540 hPa (Fig. 4). The convective available potential energy (CAPE) of a surface air parcel was 576 J kg−1 and the convective inhibition (CIN) was about 64 J kg−1, while the level of free convection (LFC) was relatively high, near 3.2 km at 692 hPa (Fig. 4). These parameters and the overall thermodynamic structure were very similar to those prior to the event on 11–12 June 2012 (583 and 78 J kg−1 and 780 hPa) reviewed in Sect. 1 (Wang et al., 2016) and sufficient to support deep convection with enough forcing to trigger free ascent. Thus, with instability and forcing provided by the approaching Mei-yu front, deep convection developed and organized into a severe rainband, as described below in the next subsection.
3.2 Stationary rainband and extreme rainfall along the northern coast of Taiwan
In Fig. 5, hourly QPESUMS data (Gourley et al., 2001) near Taiwan, overlaid with the NCEP FNL surface horizontal winds, are shown from 18:00 UTC on 1 June to 05:00 UTC on 2 June 2017 to depict the evolution of the intense rainband associated with the Mei-yu front. The frontal rainband first reached the northern tip of Taiwan around 18:00 UTC on 1 June (Fig. 5a) but remained stationary until at least 02:00 UTC on 2 June 2017 (Fig. 5i). Only afterward did it start to move slowly inland toward the south (Fig. 5j–l). Therefore, the rainband stayed along the northern coast of Taiwan for some 9–10 h overall, with roughly an east–west orientation throughout this period. The rain rate estimates along the northern coast were often 50–90 mm h−1 and intense, thus leading to the extreme rainfall. During the heavy rainfall period, the QPESUMS also indicated that there were a few other rainbands near northern Taiwan, while the mountain regions in central and southern Taiwan also received persistent rainfall (Fig. 5). The ERA5 analyses at 1000 hPa revealed a steady southwesterly flow of around 10 kn in the upstream region over the period, and the flow was deflected by the steep terrain of Taiwan at the windward side. The front (or wind-shift line) in the FNL analyses mostly lagged the rainband in the QPESUMS by about 50–100 km and thus was likely too far north.
Produced by the rainband seen in Fig. 5, the observed 24 h accumulated rainfall over Taiwan from 16:00 UTC on 1 June to 16:00 UTC on 2 June (00:00–24:00 LST) reached 645 mm right along the northern coast (Fig. 6a). Two other rainfall centers also appeared along the CMR in central and southern Taiwan, each exceeding 300 mm. In fact, out of the 645 mm in northern Taiwan, 635 mm of rainfall occurred within 12 h between 16:00 UTC on 1 June and 04:00 UTC on 2 June (see Fig. 5, also WLC21), causing serious inundation and economic loss along the northern coast.
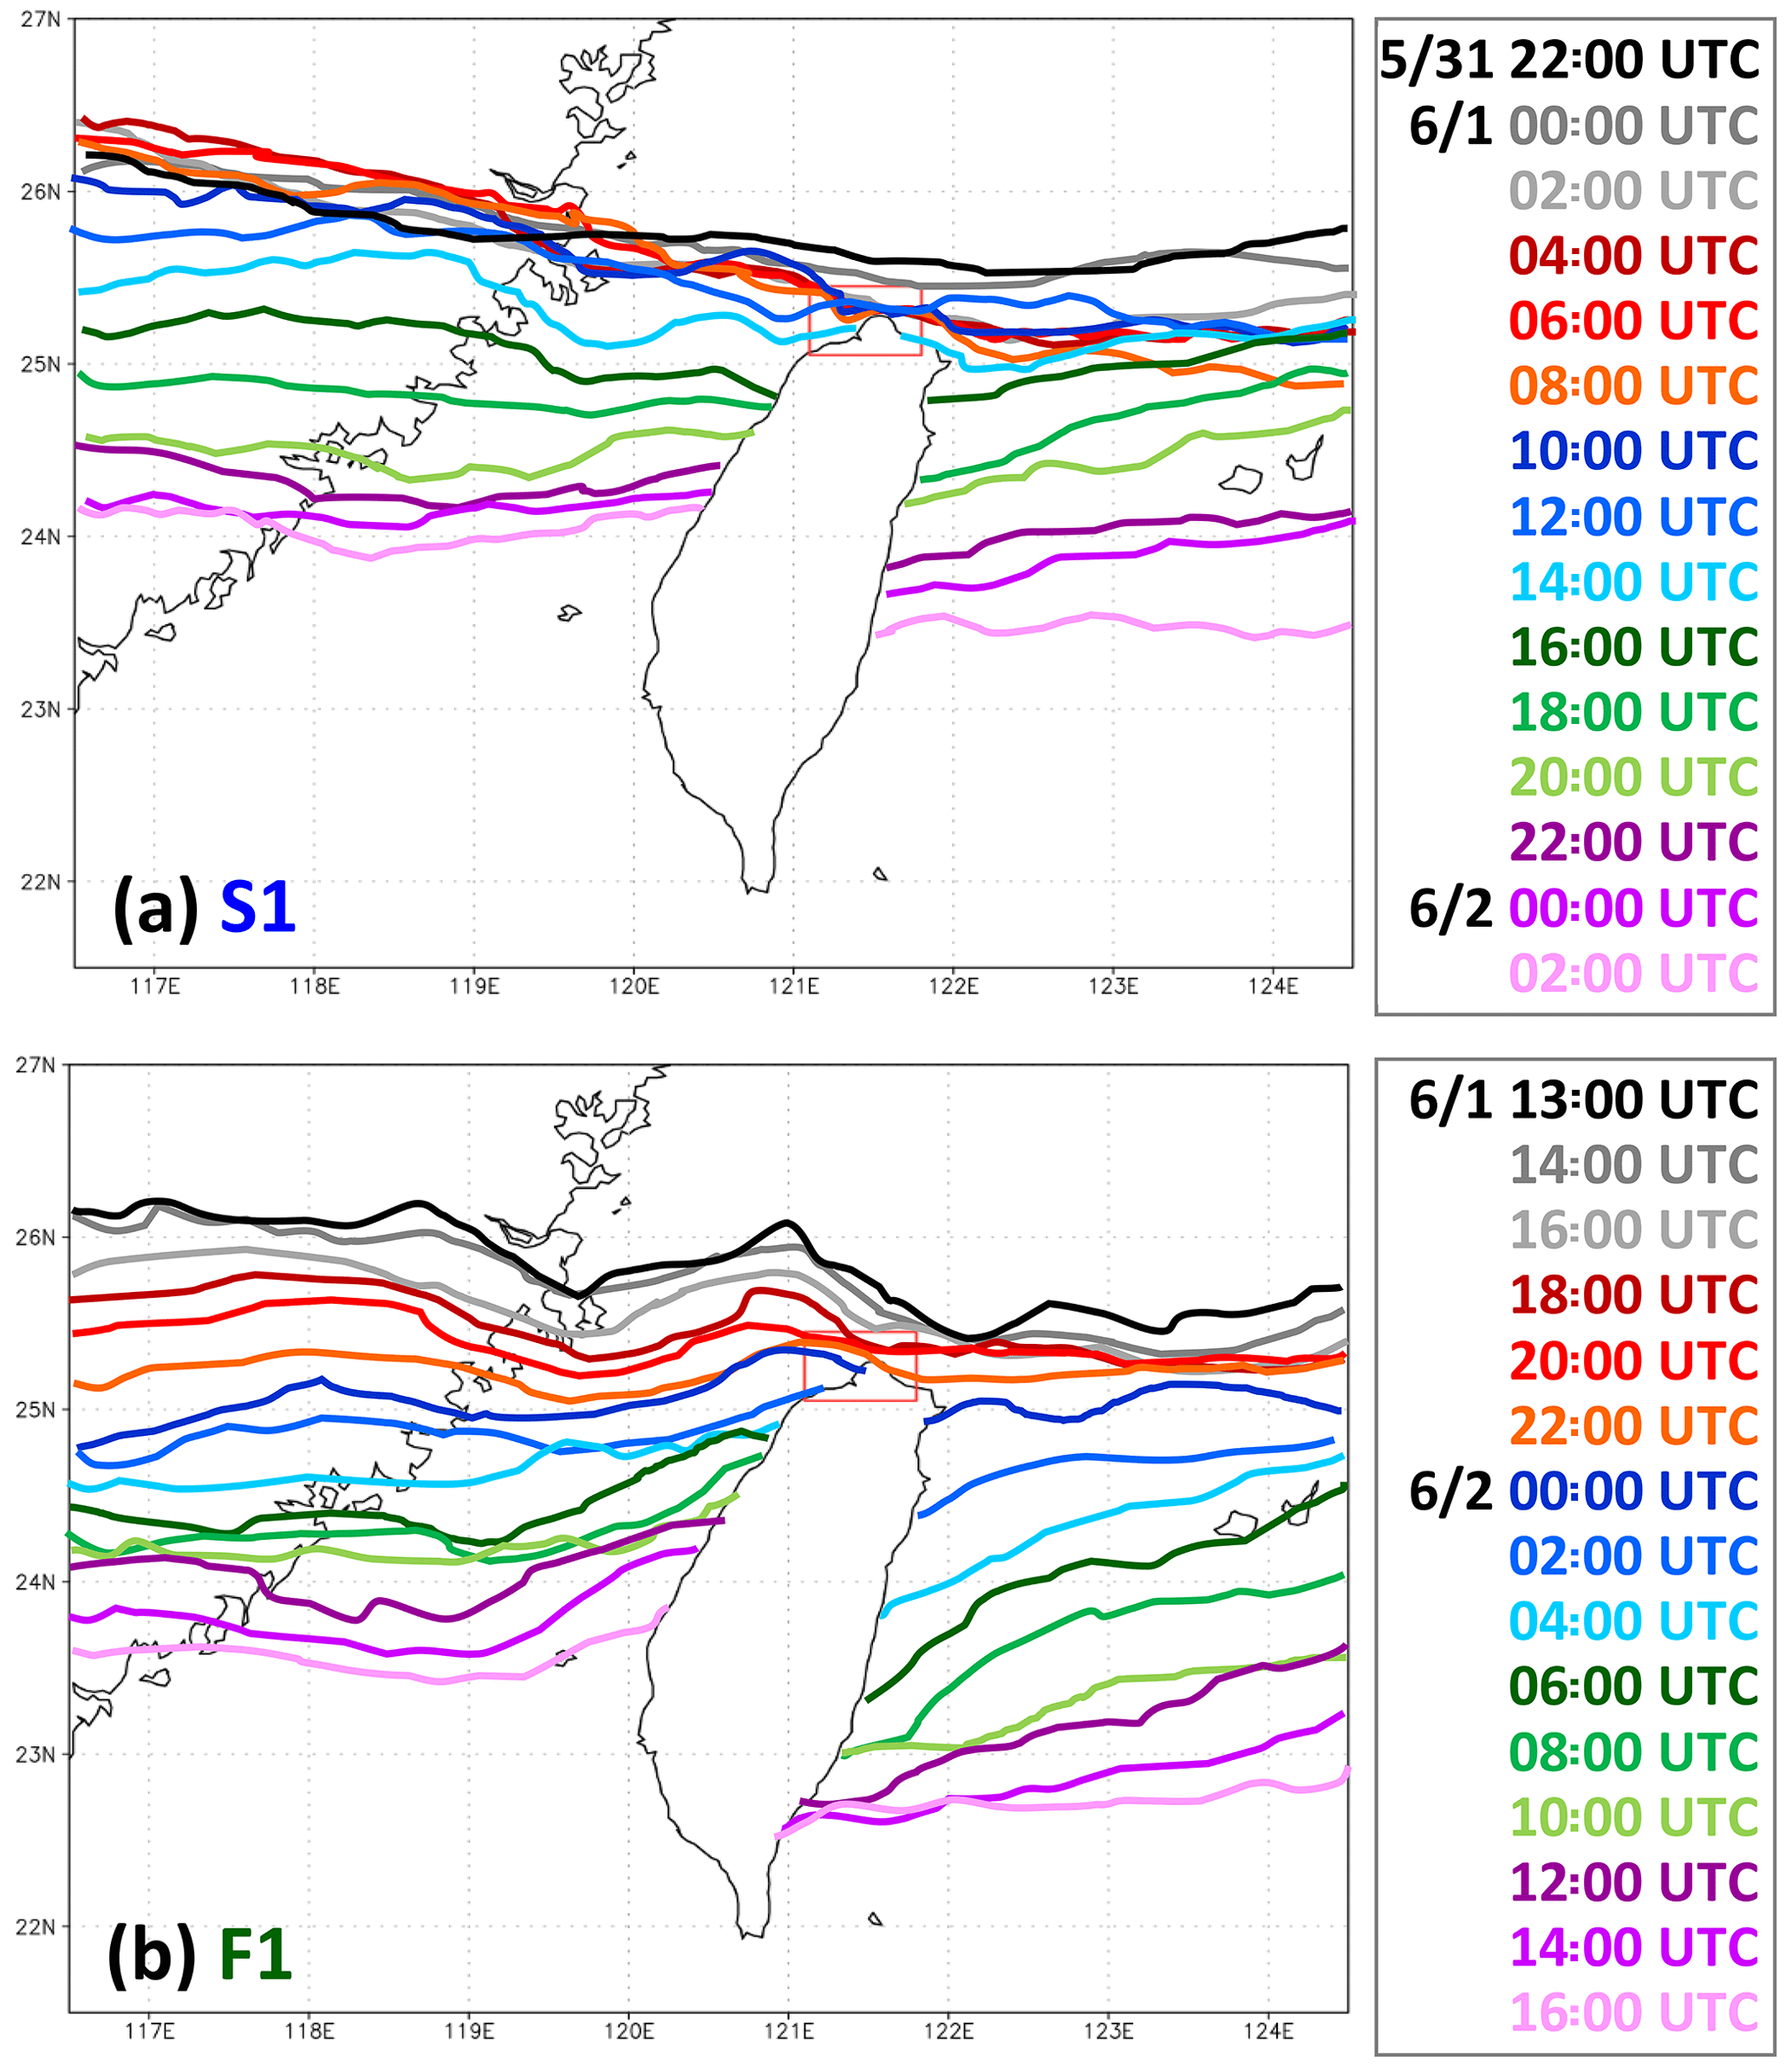
Figure 8Model-simulated surface frontal positions every 2 h (a) from 22:00 UTC on 31 May to 02:00 UTC on 2 June in experiment S1 and (b) from 13:00 UTC on 1 June to 16:00 UTC on 2 June 2017 in experiment F1 (additional position at 13:00 UTC on 1 June), respectively.

Figure 9Distribution of 24 h accumulated rainfall (mm, color) around northern Taiwan in experiment (a) S1 (from 00:00 UTC on 1 June to 00:00 UTC on 2 June) and (b) F1 (from 16:00 UTC on 1 June to 16:00 UTC on 2 June 2017), respectively. Above 300 mm, additional contours are drawn at 350, 450, and 550 mm. The maximum values overland in northern Taiwan (triangles) and those offshore (dots) are labeled, and the three averaging domains used in Fig. 10 are also plotted.
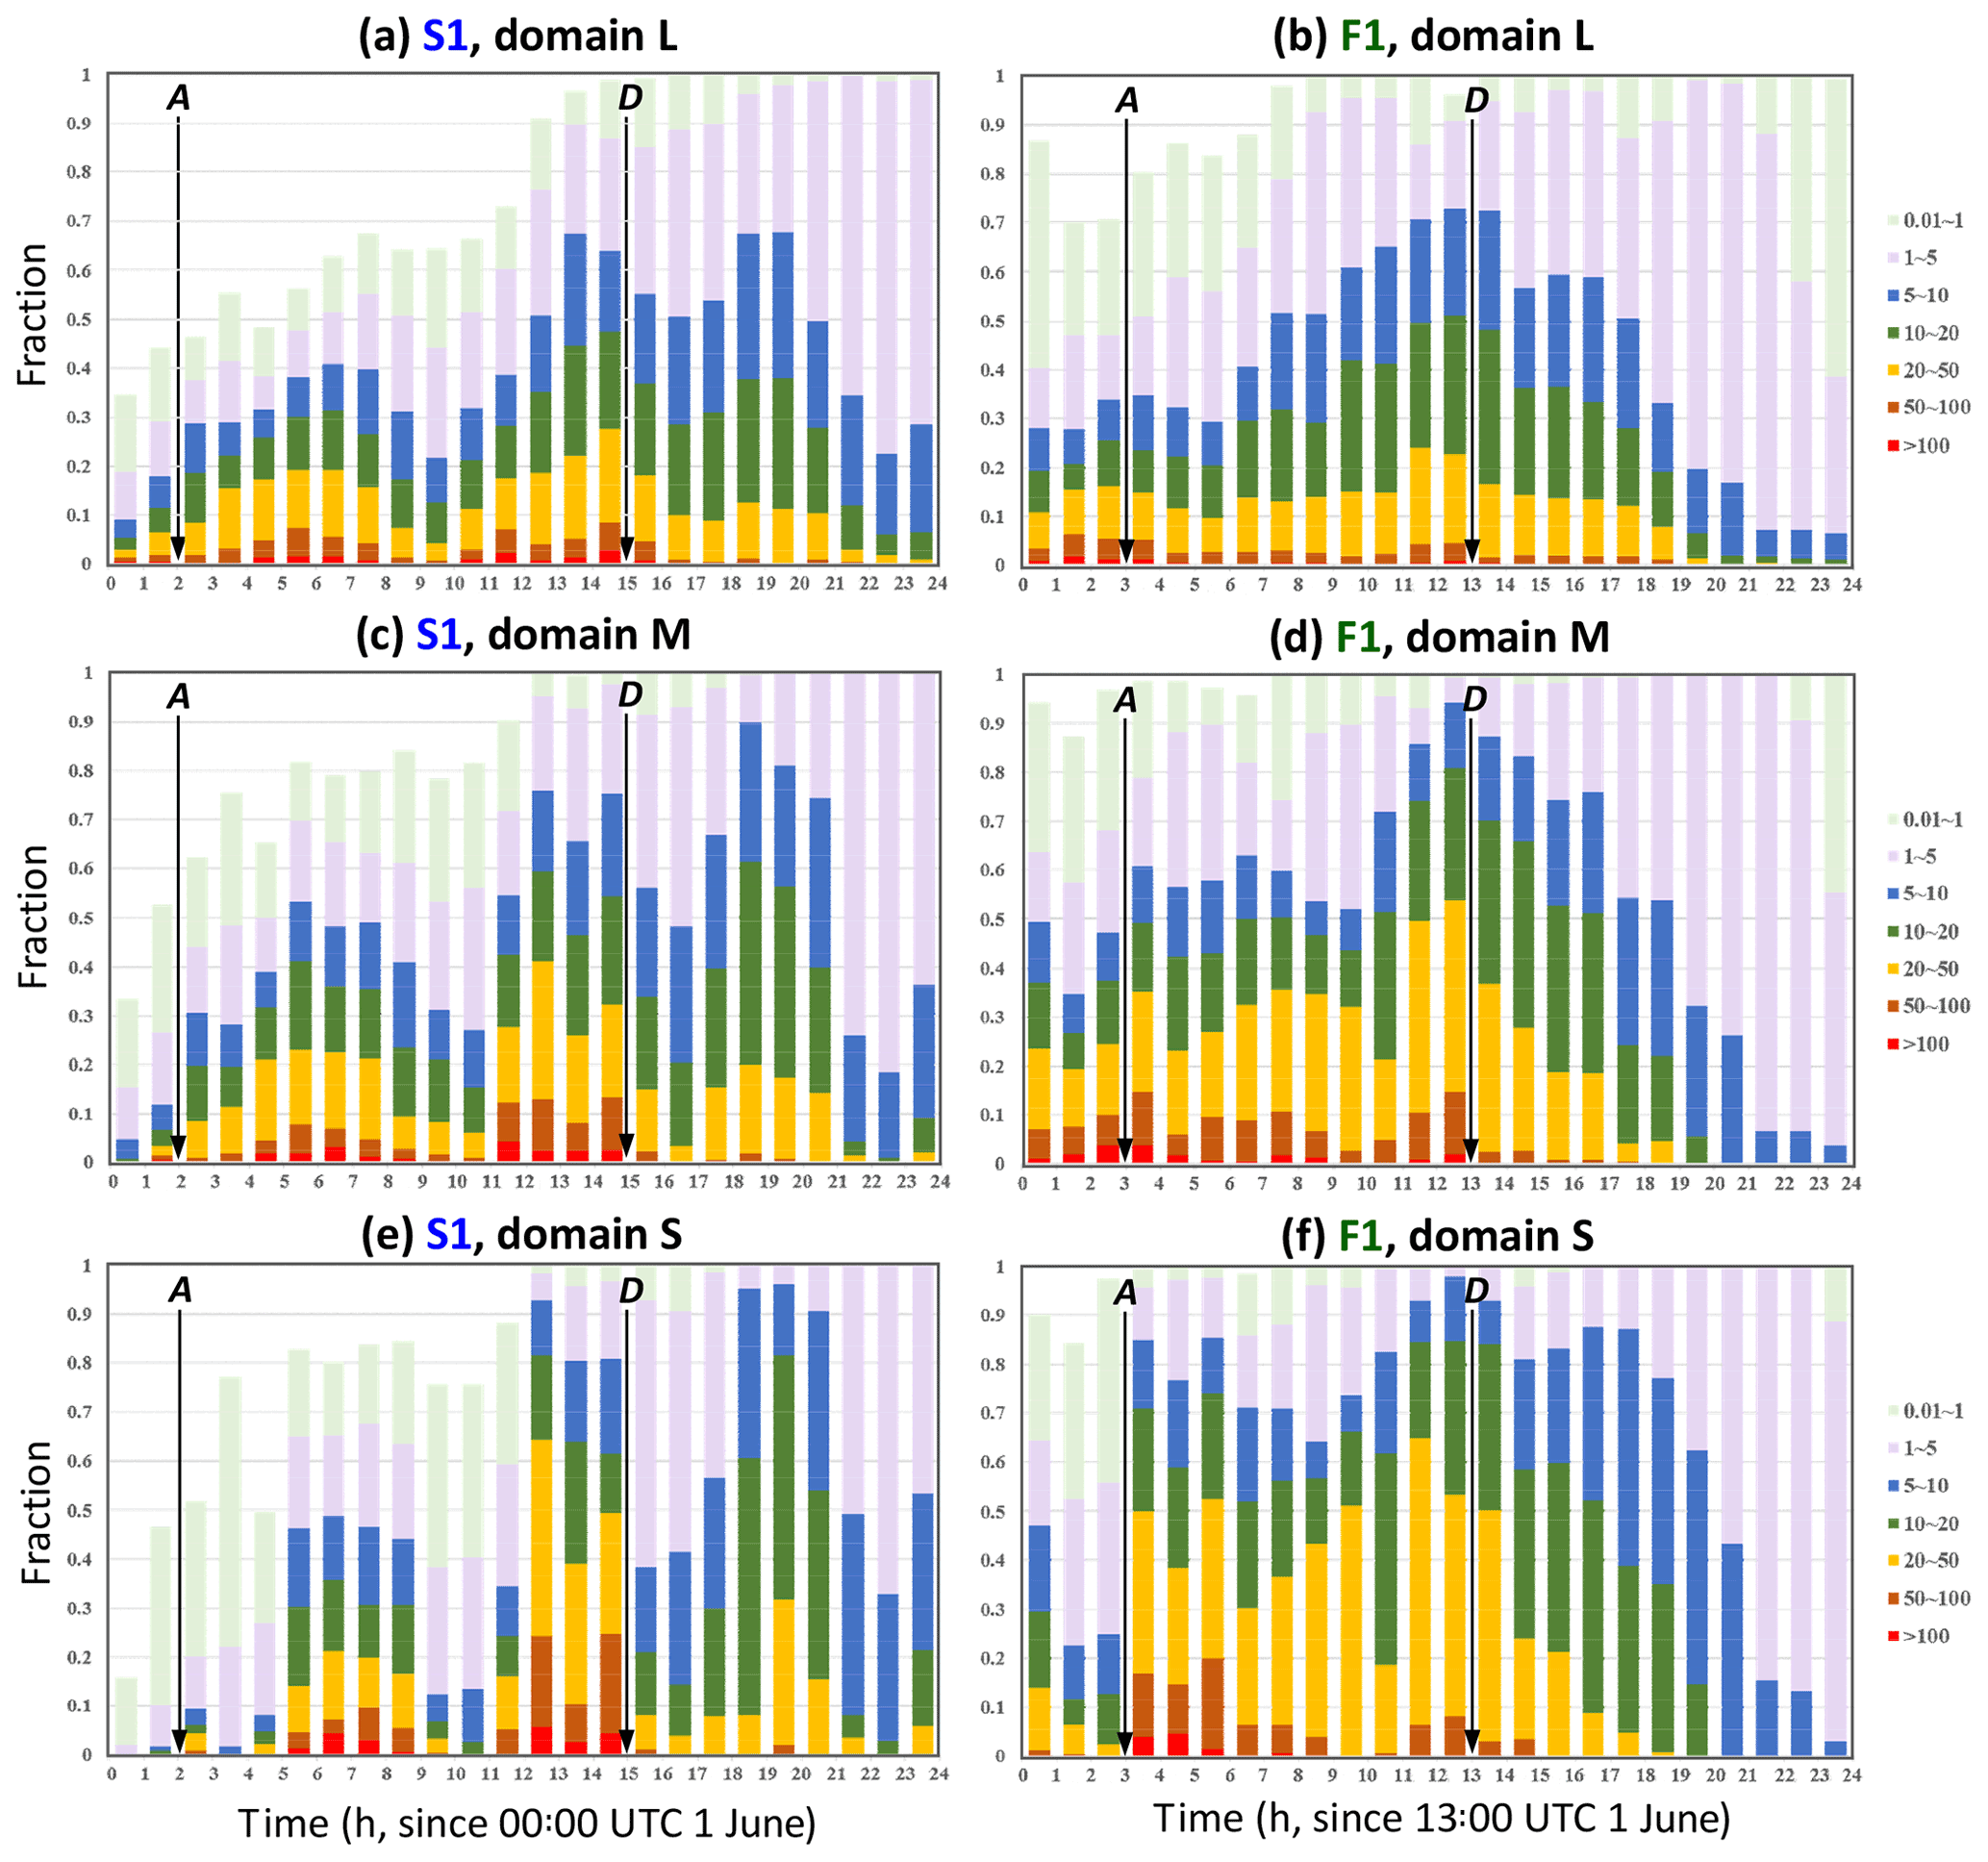
Figure 10Fractional distributions of different rain rate ranges (mm h−1, see legend) inside the large (L) domain (24.85–25.65∘ N, 120.75–122.15∘ E) in experiment (a) S1 and (b) F1, respectively, during their selected 24 h period (starting from 00:00 UTC on 1 June for S1 and 13:00 UTC on 1 June for F1). (c–f) As in (a), (b), except for (c), (d) the middle (M) domain (25.05–25.45∘ N, 121.1–121.8∘ E) and (e), (f) the small (S) domain (25.1–25.3∘ N, 121.35–121.8∘ E), respectively. The three domains are shown in Fig. 9, and the arrival (A) and departure time (D) of the surface front in the northernmost part of Taiwan (determined using Fig. 8) are marked by vertical arrows.
As described in Sect. 2.3, three pairs of 3 km–1 km experiments driven by the NCEP GFS real-time analyses and forecasts were performed to test the effects of the topography of Taiwan, including the two control experiments of F3 and F1. Using the real topography of Taiwan, the high-resolution 1 km run (F1) was able to produce a maximum 24 h rainfall of 618 mm just offshore of northern Taiwan, with a peak amount of 541 mm at the northern coast over land (Fig. 6b) from the initial time (t0) at 13:00 UTC on 1 June 2017 (Table 2), considerably higher compared to the simulation of Tu et al. (2022). In this experiment, the surface front arrived at northern Taiwan at about the correct time and remained stationary for roughly 10 h, in close agreement with the observations. These aspects will be further examined and discussed in Sect. 5 in detail; here we first focus mainly on the rainfall and clarify the role played by the topography of Taiwan in this event.
Also downscaled from their respective 3 km runs but without the topography (or the northern part of it), results of two sensitivity experiments with otherwise identical settings, the F1-NNT and F1-NT (Table 3), are compared with F1. When the topography in northern Taiwan was removed in F1-NNT (see Fig. 1b), the peak 24 h rainfall was reduced to 422 mm and occurred near the coast of northwestern Taiwan, while significant rainfall also appeared along the northern slopes of the Snow Mountain Range (SMR) (Fig. 6c). In this case, the postfrontal cold air and the areas of heavy rainfall were able to move into the Taipei Basin, but there still existed a local maximum (about 350 mm) near the northern coast. Detailed comparison shows that the differences in F1 and F1-NNT are mostly minor, except in the precise location of the rainband near the northern coast of Taiwan (Fig. 7a–f). Thus, while the Linkou Plateau is also removed in F1-NNT, the topography in northern Taiwan did act to help concentrate the rainfall, and our 1 km test results are in general agreement with those of Tu et al. (2022) using 3 km models.
When the entire topography of Taiwan was removed, significant differences were obtained in F1-NT relative to F1 (Table 3). In this test, the peak 24 h rainfall near the northern coast of Taiwan is not even 100 mm (Fig. 6d), similar to the result of Chen et al. (2018) for the event on 11–12 June 2012. Not only is the rainfall surrounding northern Taiwan greatly reduced, but the rainfall centers in the mountains also disappear. This is because without the terrain, the near-surface (and low-level) southwesterly winds can blow across the flattened island without the blocking effect (Fig. 7g–i). Without deflection and convergence, the southwesterly flow over the Taiwan Strait during the event is weaker, thereby allowing the northerly flow to advance more rapidly. As a result, the surface front in F1-NT moves across northern Taiwan more rapidly by comparison. Also, the damming and southward intrusion of postfrontal cold air along the eastern coast of Taiwan in F1-NT does not occur (Fig. 7g–i), in contrast to both F1 and F1-NNT. The above result suggests that the local convergence at the front (and rainband) between the southwesterly and northeasterly flow, with the former being enhanced by the blocking effect of the island, was important to bring the rainfall along the northern coast up to a value over 350 mm, i.e., the amount attained in the F1-NNT experiment.
5.1 Two contrasting experiments of F1 and S1
The two experiments at a grid size of 1 km with real topography (F1 and S1) are contrasted in this section. The first one is the control experiment F1 that used the hourly outputs of F3 (i.e., M18 of WLC21) as IC/BCs and started from 13:00 UTC on 1 June for 30 h (Table 2), and it produced 24 h rainfall reaching 541 mm at the northern coast of Taiwan. As mentioned, M18 (Δx=3 km) yielded 360 mm of rainfall (in 12 h), the most among all 45 members in WLC21. The second one is S1, driven by the outputs of simulation S3 at 1 h intervals and starting from 22:00 UTC on 31 May 2017 for 30 h (Table 2), and it produced only 393 mm (to be discussed in Sects. 5.2 to 6 below) in 24 h along the northern coast, and therefore represents a less rainy but yet realistic scenario in the model. These two 3 km runs are identical in model configuration and physical package (including cloud microphysics) and differed only in their IC/BCs: the NCEP GFS real-time gross analysis and forecasts (0.5∘, every 3 h) were used in F3, while the GFS FNL analyses (0.25∘, every 6 h) were used in S3 (see Table 2). Also, the integration periods were subsequently different. Nevertheless, F1 produced almost 150 mm more rainfall than S1 at the northern coast of Taiwan, and to our knowledge, the value of 541 mm is also the closest to the observation from any model result for this event. Thus, to investigate and clarify the reasons between the considerably different peak amounts of accumulated rainfall along the northern coast, the two experiments of F1 and S1 are examined and compared in detail in this section.

Figure 11Model surface winds at 10 m height (m s−1, reference vector at bottom) and hourly rainfall (mm, color) near northern Taiwan every 2 h from (a) 06:00 to (i) 22:00 UTC on 1 June 2017 in the S1 experiment.
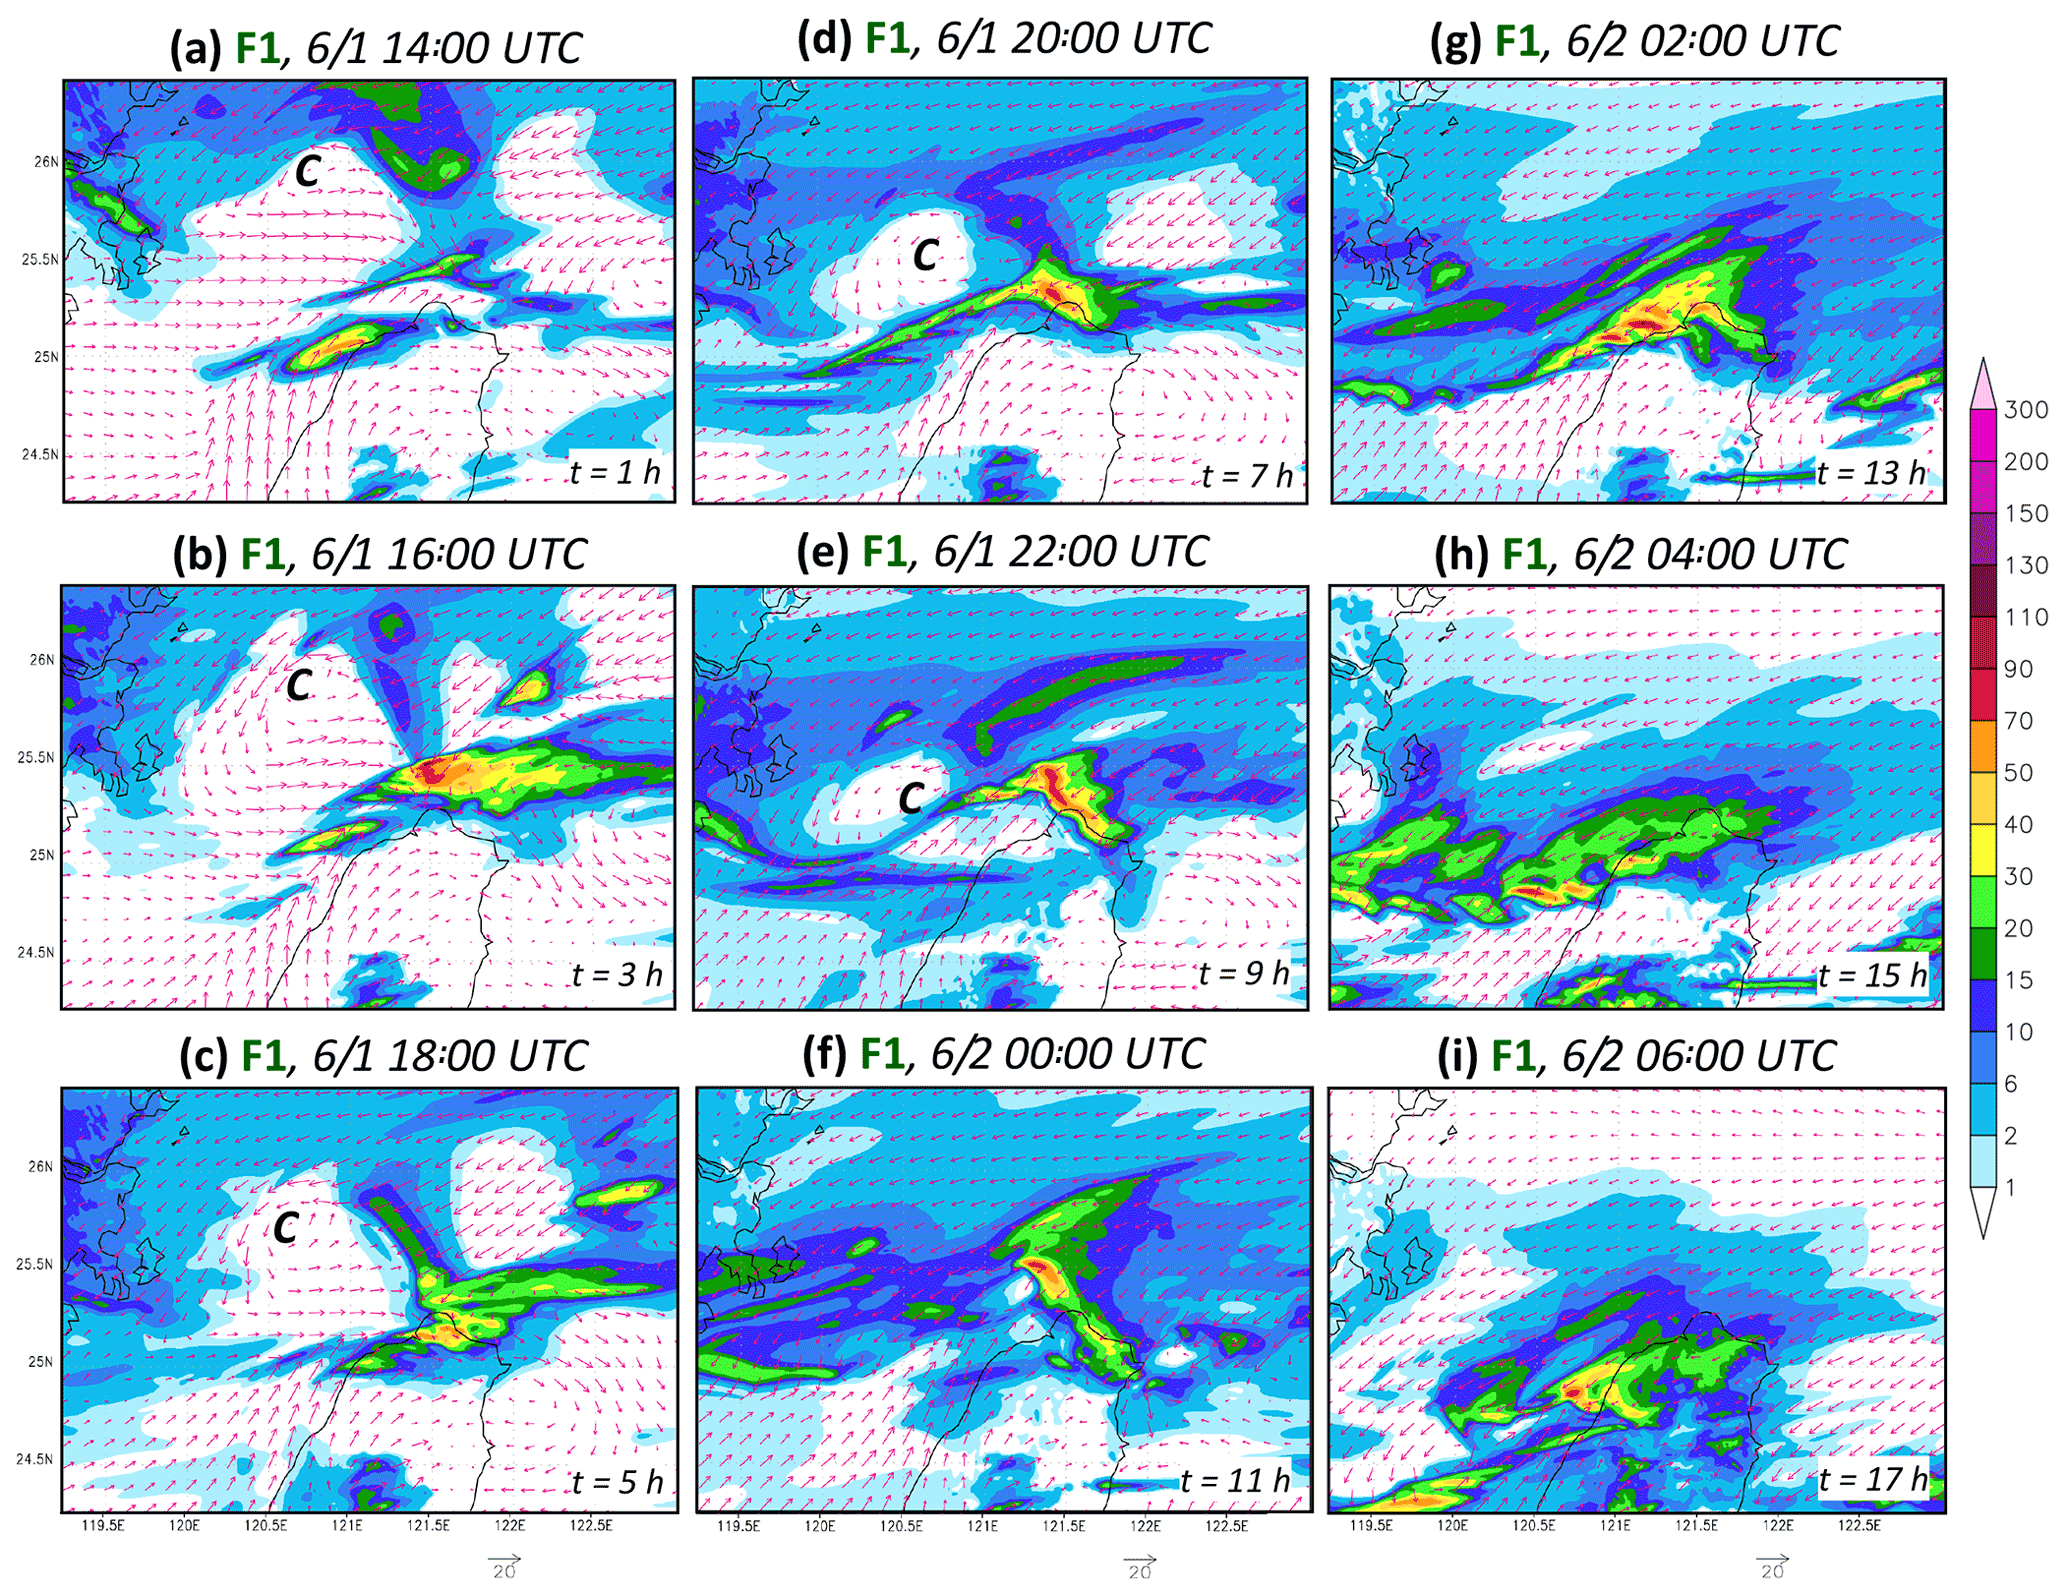
Figure 12Model surface winds at 10 m height (m s−1, reference vector at bottom) and hourly rainfall (mm, color) near northern Taiwan every 2 h from (a) 06:00 to (i) 22:00 UTC on 1 June 2017 in the F1 experiment.
5.2 Frontal movement and difference in rainfall characteristics
The model-simulated surface frontal positions at 2 h intervals are first shown in Fig. 8 to examine whether there are significant differences in the frontal moving speed between the two 1 km experiments. To illustrate the key differences, the less rainy case of S1 is chosen to be presented first. Linked to a faster frontal moving speed in S3 (by about 9 h too early), the surface front in S1 reached the northern tip of Taiwan at around 02:00 UTC and remained at the northernmost part of the island until about 15:00 UTC (Fig. 8a), and thus was stationary for around 13 h in total. On the other hand, the surface front in F1 moved through the same short distance near the northern coast in about 10 h, roughly from 16:00 UTC on 1 June to 02:00 UTC on 2 June (Fig. 8b), in close agreement with Fig. 5. Even though somewhat shorter in duration of frontal stagnation, F1 produced more rainfall along the northern coast of Taiwan than S1. Thus, while WLC21 identified the timing and speed of frontal movement as an important factor to an increased mean rainfall in northern Taiwan from their ESA, it does not appear to be as critical here when the peak rainfall reaches around 400 mm in both runs.
The modeled 24 h rainfall distributions in S1 and F1 are plotted and compared in Fig. 9, with the accumulation period starting from 00:00 UTC on 1 June for S1 and 16:00 UTC on 1 June for F1, respectively. Immediately apparent is that the rainfall in S1 is more widespread, with much larger areas offshore and to the northwest of northern Taiwan receiving over 150–200 mm (Fig. 9a) but a lower peak amount overland at 393 mm. On the contrary, the rainfall in F1 is much more concentrated right around the northernmost part of the island (Fig. 9b), with a much smaller area receiving over 200 mm but higher peak amounts, reaching 541 mm overland as mentioned and 618 mm over the ocean about 15 km offshore from the northern tip. As shown in Sect. 4, the topography in northern Taiwan helped to concentrate the rainfall (also Tu et al., 2022). If 12 h is used for accumulation, then the peak values are 576 mm (offshore) and 457 mm (on land) in F1 and 269 mm (on land) in S1, respectively. As depicted in Fig. 9, three rectangular domains are chosen to compute the areal-mean rainfall, with a size of (x×y, domain L), (domain M), and (domain S), respectively, and the value computed for the full domain and only the land portion (inside the domain) are given in Table 4. In domain L, overall the S1 run produced slightly more total rainfall (219.86 mm) than F1 (213.42 mm), but the opposite is true as the averaging domain is decreased in size and more focused on the northernmost part of Taiwan (Table 4). Inside the smallest domain (domain S), F1 had significantly more total rainfall (346.36 mm) than S1 (251.32 mm). If only the land portions are considered, then F1 consistently yielded more rainfall than S1 inside the three selected domains, but the difference becomes increasingly large as the domain becomes smaller. Outside domain L, it is evident in Fig. 9 that S1 produced considerably more rainfall than F1 around the northern Taiwan Strait. Thus, Fig. 9 and Table 4 confirm that the rainfall in F1 is more concentrated over a smaller region right at the northernmost part of Taiwan, but this is not the case in S1.
Next, the hourly rainfall at all model grid points in S1 and F1 inside each of the three domains is classified, based on their intensity, into seven groups of 0.01–1, 1–5, 5–10, 10–20, 20–50, 50–100, and ≥ 100 mm h−1, respectively, and their fractions against time are plotted in Fig. 10 to allow for an inspection of the temporal evolution of rainfall at different intensity ranges between the two experiments. In domain L, except for a higher fraction (larger region) of little or no rainfall (<0.01 mm h−1) in S1 during the first 12 h of the period shown (Fig. 10a), the intensity groups (higher ones toward the bottom) appear to be comparable in terms of their fraction (percentage) and evolution in time between the two runs (Fig. 10a, b). As the domain size decreased, it becomes increasingly apparent that a higher fraction of more intense rainfall (≥ 20 mm h−1) existed in F1 compared to S1 during the heavy rainfall period (Fig. 10c, d), especially inside the smallest domain that focuses on the northernmost part of Taiwan (Fig. 10e, f). Also, the heavy rainfall in domain S is more persistent in F1 but tends to be intermittent and only concentrated in a few periods of about 3–4 h in S1. In other words, the intense rainfall occurs in S1 in pulsation but continuous in F1 over the northern coast and therefore allows for a considerably higher local accumulation amount in the latter model experiment (see Fig. 9). The underlying reasons for this difference is further explored and discussed below.
5.3 Location and evolution of rainbands
In order to examine the location and evolution of rainbands associated with the front near northern Taiwan in the two 1 km model experiments, hourly rainfall (ending at the indicated time) every 2 h in S1 and F1 is shown in Figs. 11 and 12, respectively. In Fig. 11 for S1, the three more intense rainfall periods over the northern coast of Taiwan in Fig. 10e can be identified: approximately during 05:00–09:00 UTC (Fig. 11a, b), 11:00–15:00 UTC (Fig. 11d, e), and around 19:00–20:00 UTC (Fig. 11h) on 1 June. While their moving speed may be slow, these rainbands indeed move continuously with time, across the northern coast of Taiwan in a successive manner (Fig. 11). At almost all the instances shown in Fig. 11, multiple rainbands near the front appear in S1 (see Fig. 8a), including the northern Taiwan Strait. In Fig. 12, on the other hand, a different scenario is seen in the F1 experiment: the northern coast of Taiwan receives heavy rainfall more or less continuously, roughly from 16:00 UTC on 1 June (Fig. 12b) to 04:00 UTC on 2 June (Fig. 12h) over a period of 12 h, consistent with Fig. 10f. This is because a local rainband in Fig. 12 forms between the prefrontal westerly or southwesterly winds (immediately offshore of northwestern Taiwan) and the cold northeasterly winds (north and northeast of Taiwan), right across the northern coast, and persists through much of this 12 h period in F1 (Fig. 12b–g).
Using plots like those in Figs. 11 and 12, hourly positions of rainbands around northern Taiwan in S1 and F1 were identified and contrasted in Fig. 13. Again, as old rainbands gradually move south after passing through the northern coast in S1, new bands form over the northern Taiwan Strait or north of Taiwan, and then approach and produce rainfall along the coastal region again (Fig. 13a–c). Between 06:00 and 22:00 UTC on 1 June, at least three different rainbands affect the northern coast in Fig. 13a–c with gaps in between (see Fig. 10e), thus producing widespread rainfall but a lower peak amount in S1 (see Fig. 9a). On the other hand, a single stationary rainband persists for a long time (of over 10 h) right across the northern tip of the island in F1 (Figs. 12 and 13d), roughly from 16:00 UTC on 1 June to 03:00 UTC on 2 June. Thus, the intense rainfall is more concentrated in a smaller area, and a considerably higher 24 h peak amount of 541 mm is achieved at the northern coast of Taiwan in F1. Note also that in Fig. 12, only a few other rainbands exist with comparable intensity nearby than the one responsible for the coastal rainfall in northern Taiwan.
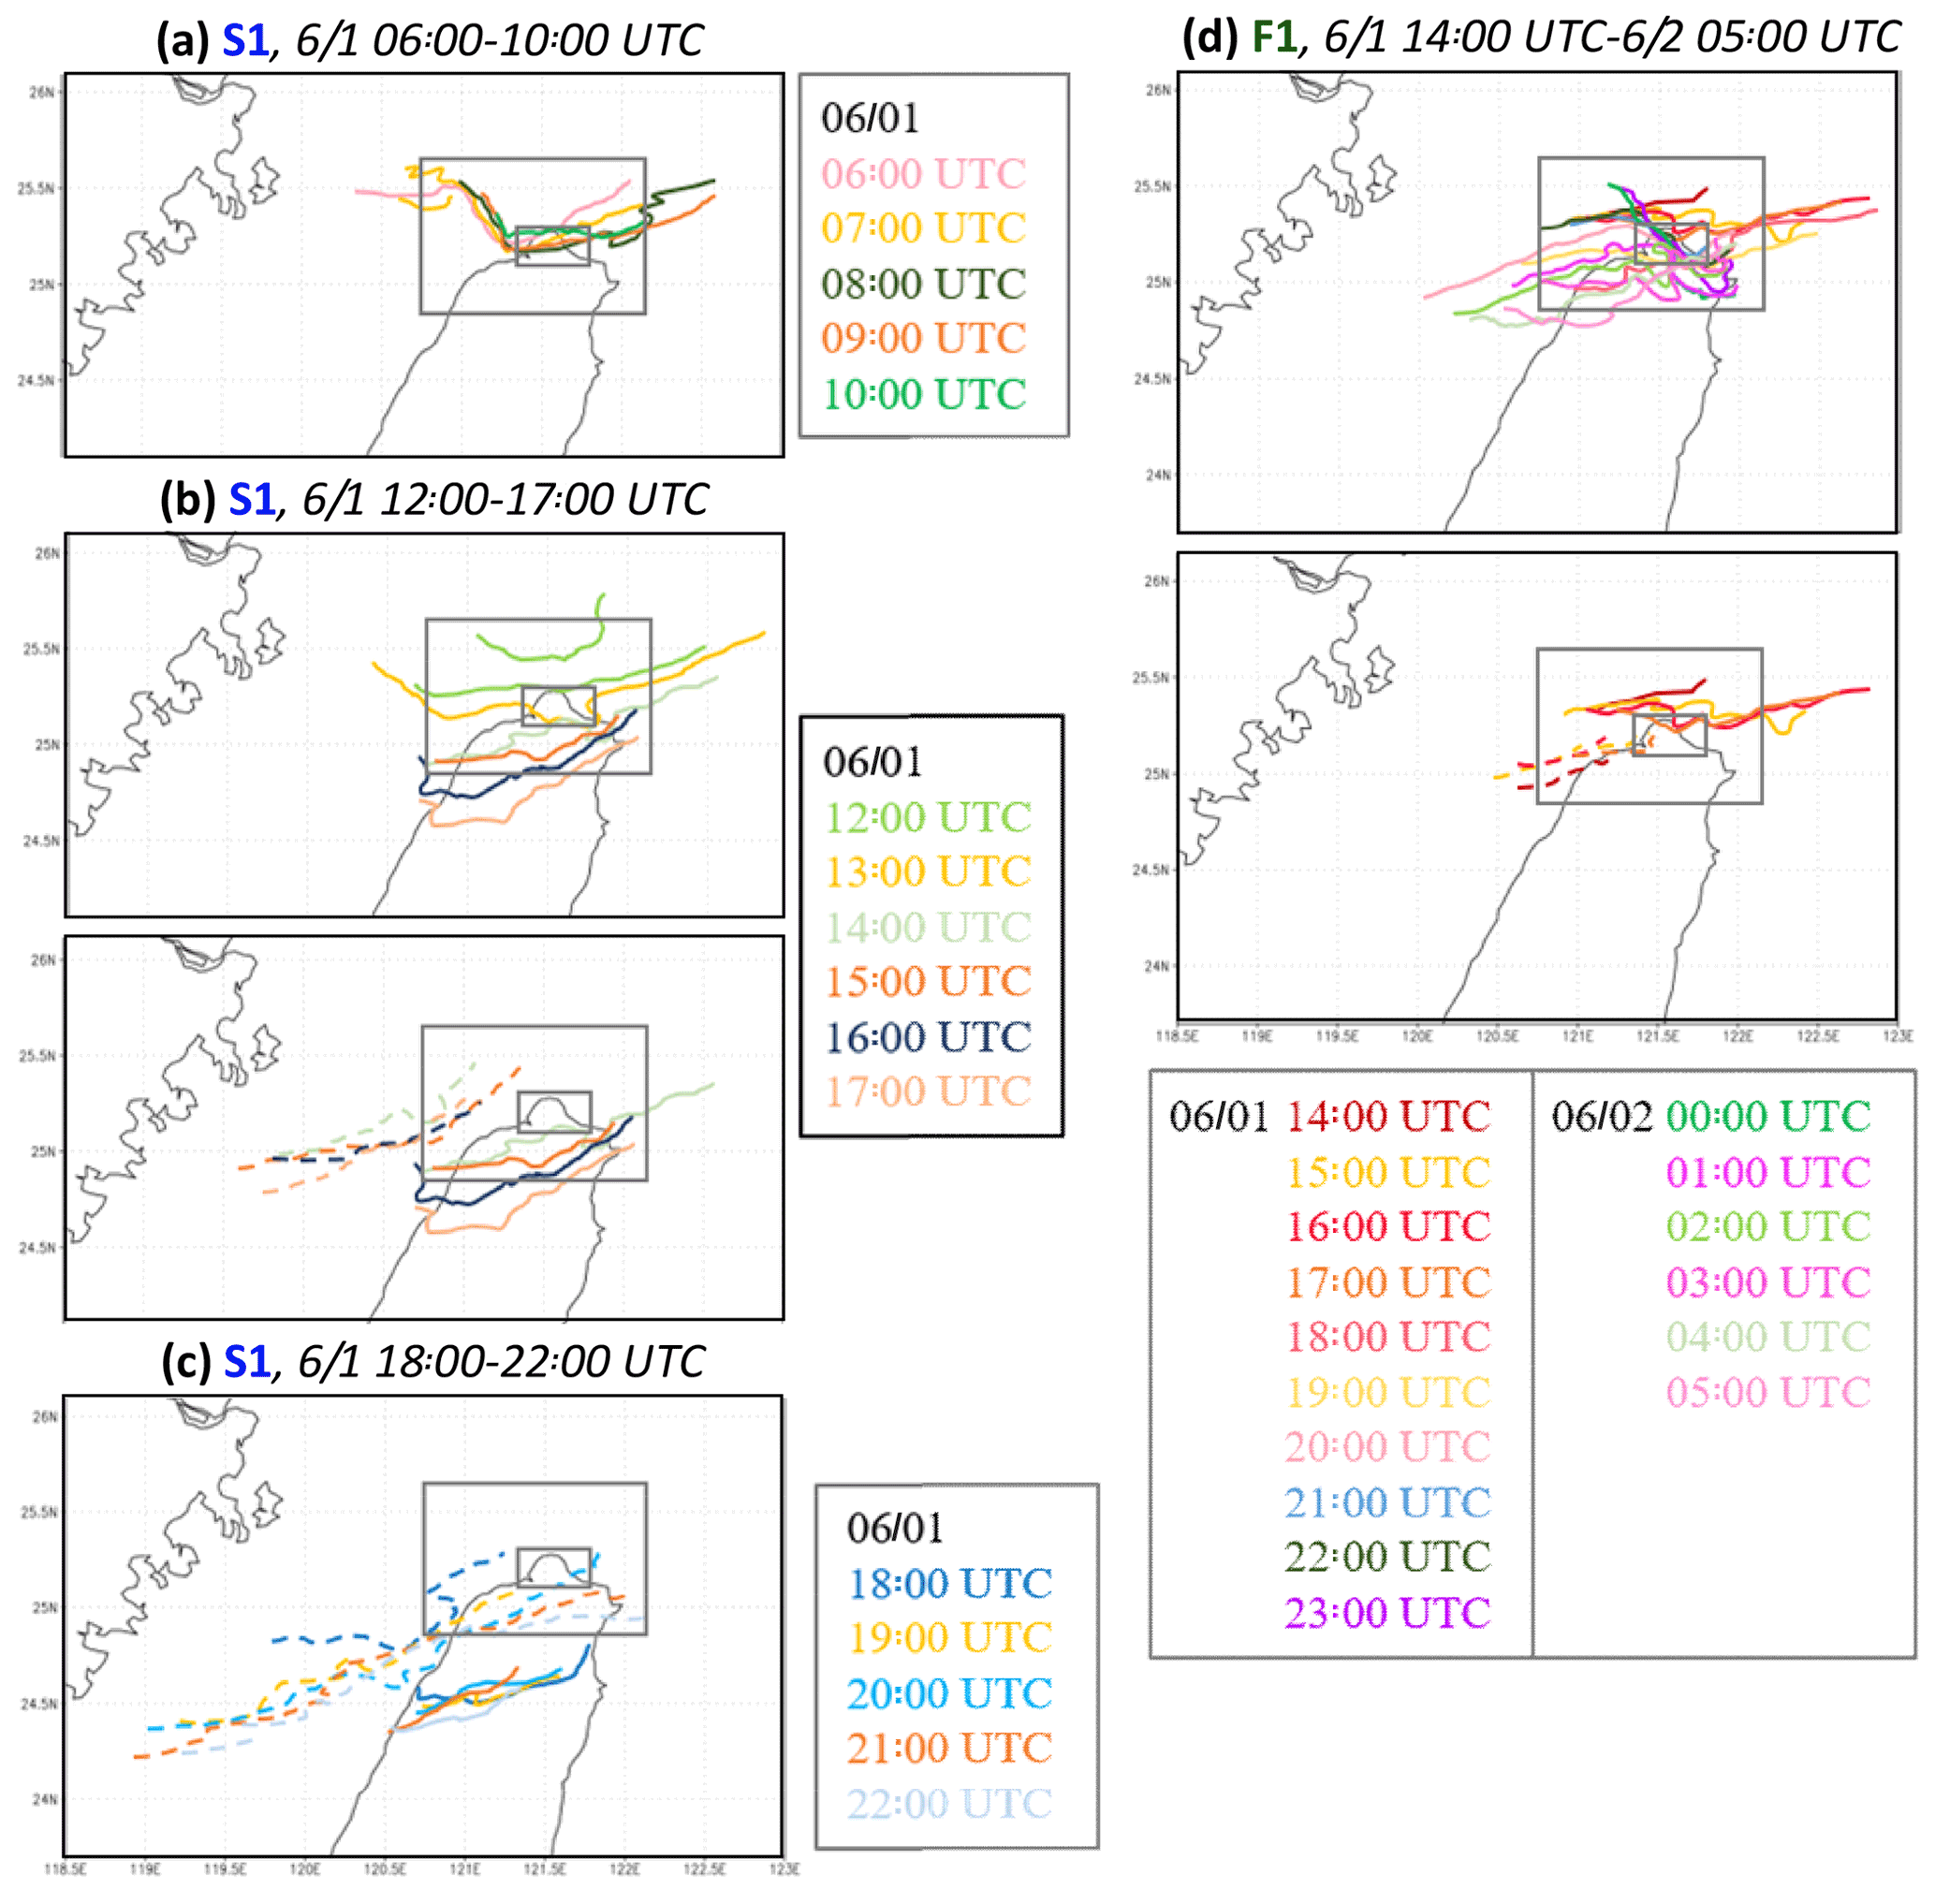
Figure 13Model-simulated surface rainband positions (at leading edge) around northern Taiwan at 1 h intervals during (a) 06:00–10:00 UTC, (b) 12:00–17:00 UTC, and (c) 18:00–22:00 UTC on 1 June in the S1 experiment, and (d) from 14:00 UTC on 1 June to 05:00 UTC on 2 June 2017 in the F1 experiment, respectively. In (c) and the second panels of (b), (d) dashed lines represent other rainbands nearby during the same time period.
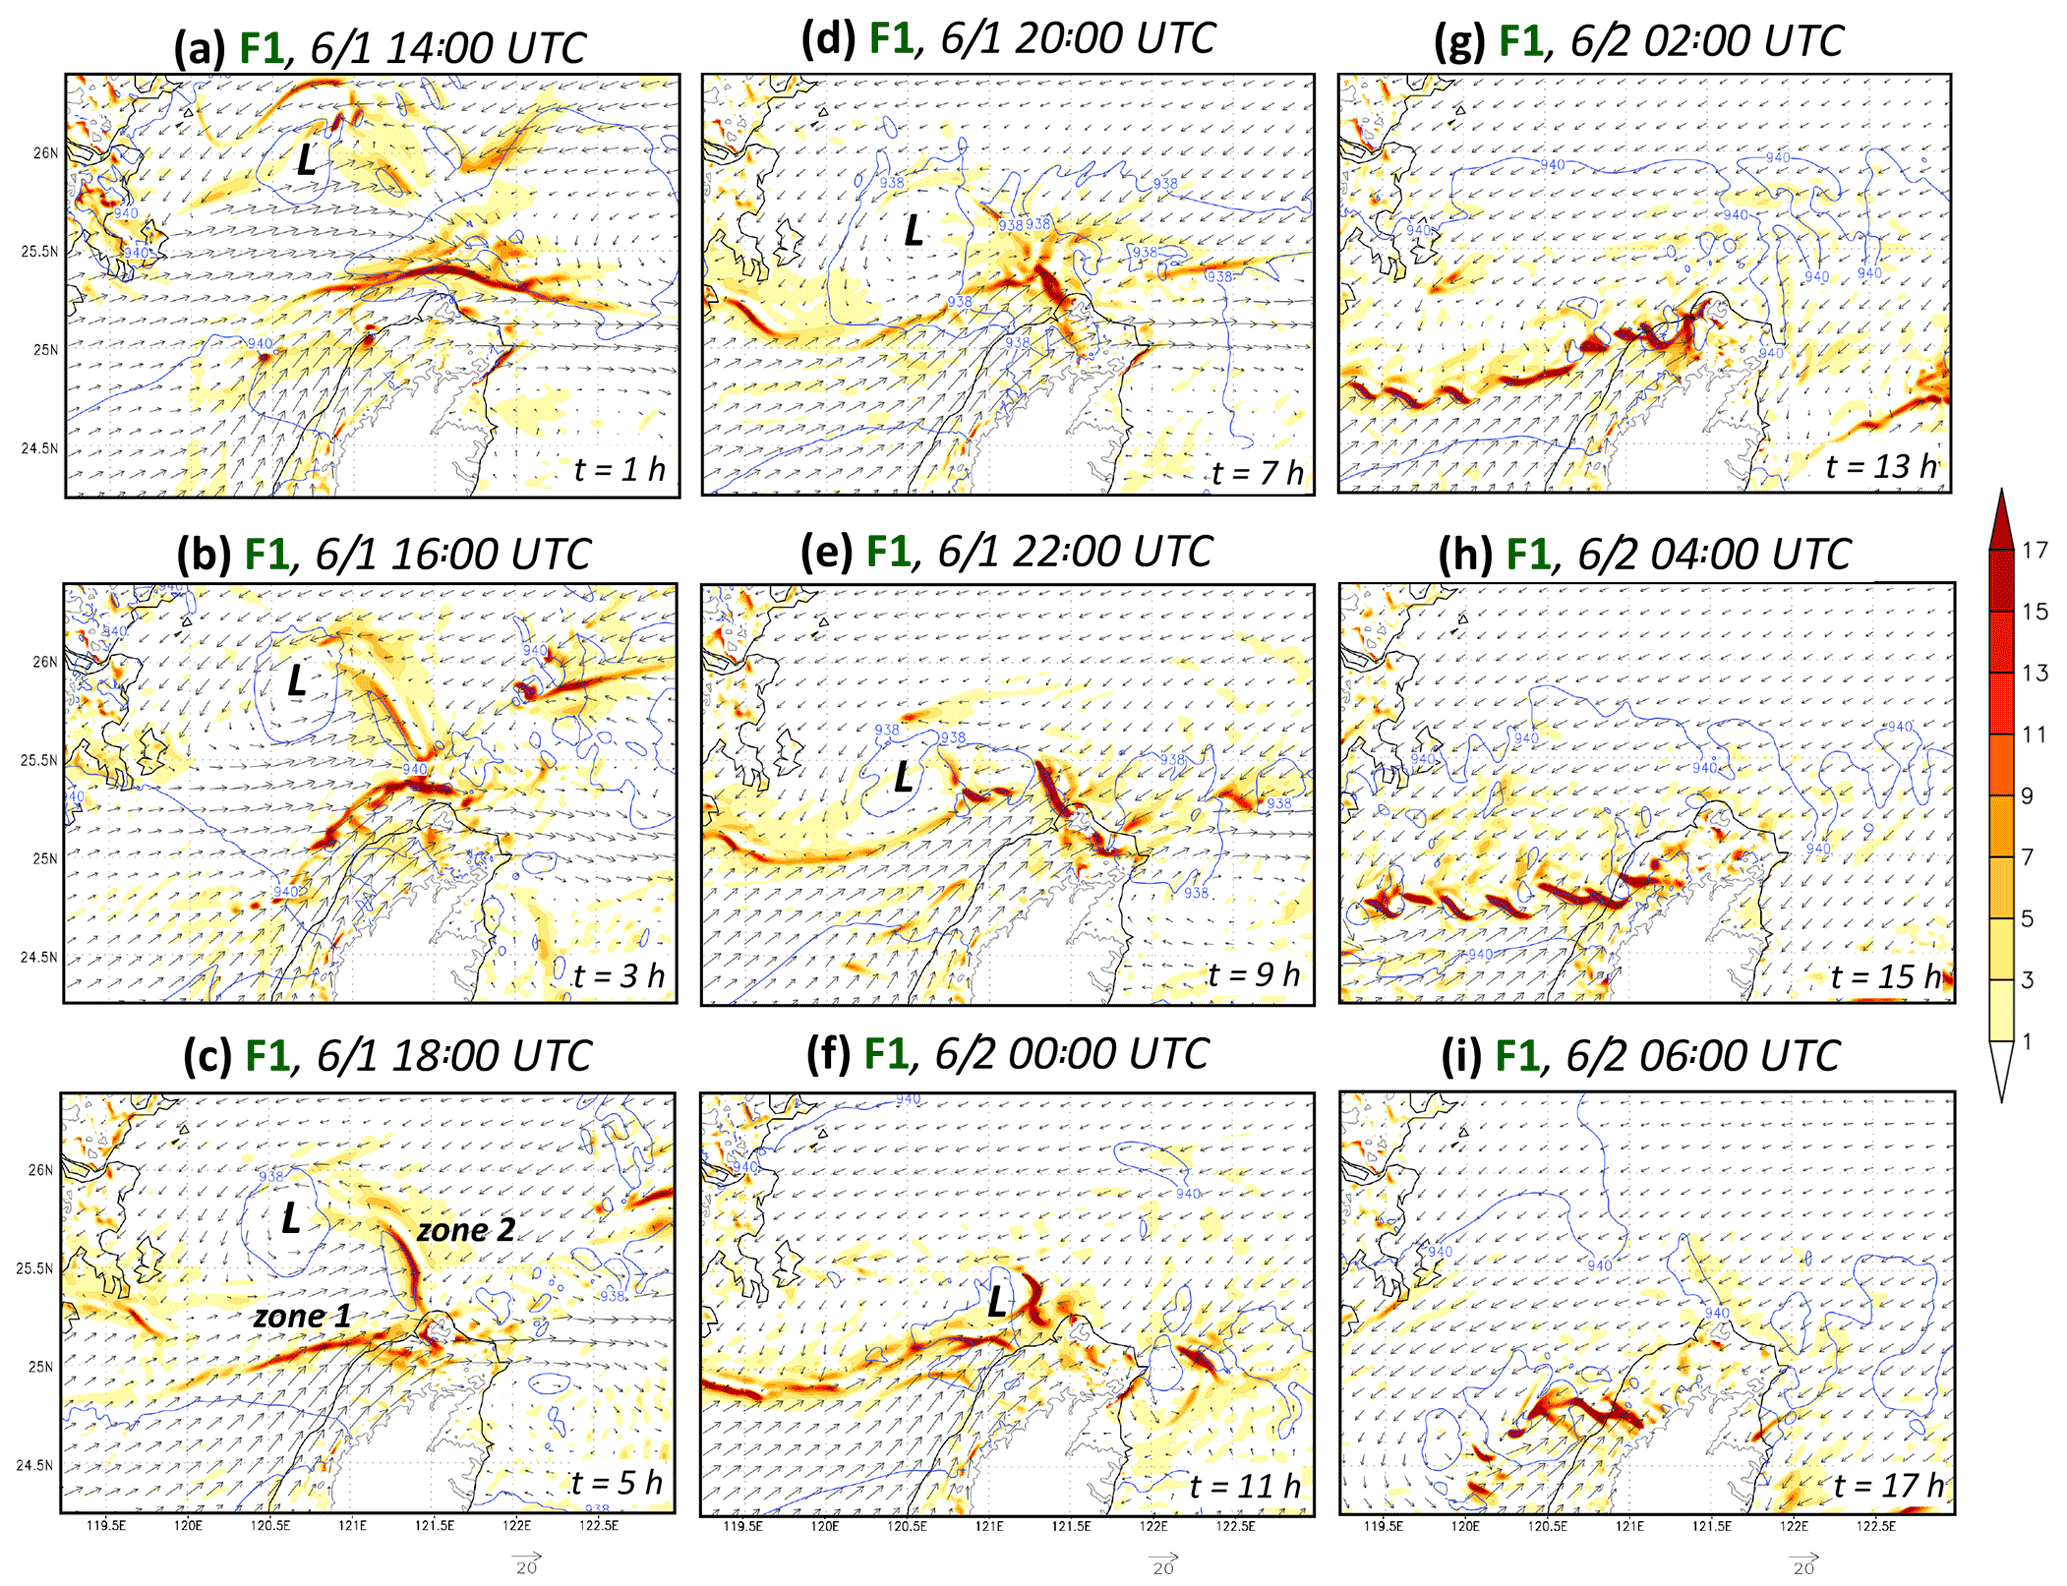
Figure 14Model pressure (hPa, isobars every 2 hPa), horizontal winds (m s−1, reference vector at bottom), and convergence (10−4 s−1, color, divergence omitted) at the height of 575 m near northern Taiwan every 2 h from (a) 14:00 UTC on 1 June to (i) 06:00 UTC on 2 June 2017 in the F1 experiment. The height contours at 575 m are also plotted over land (gray), and convergence zone 1 and 2 (see text for details) are also marked in (c).
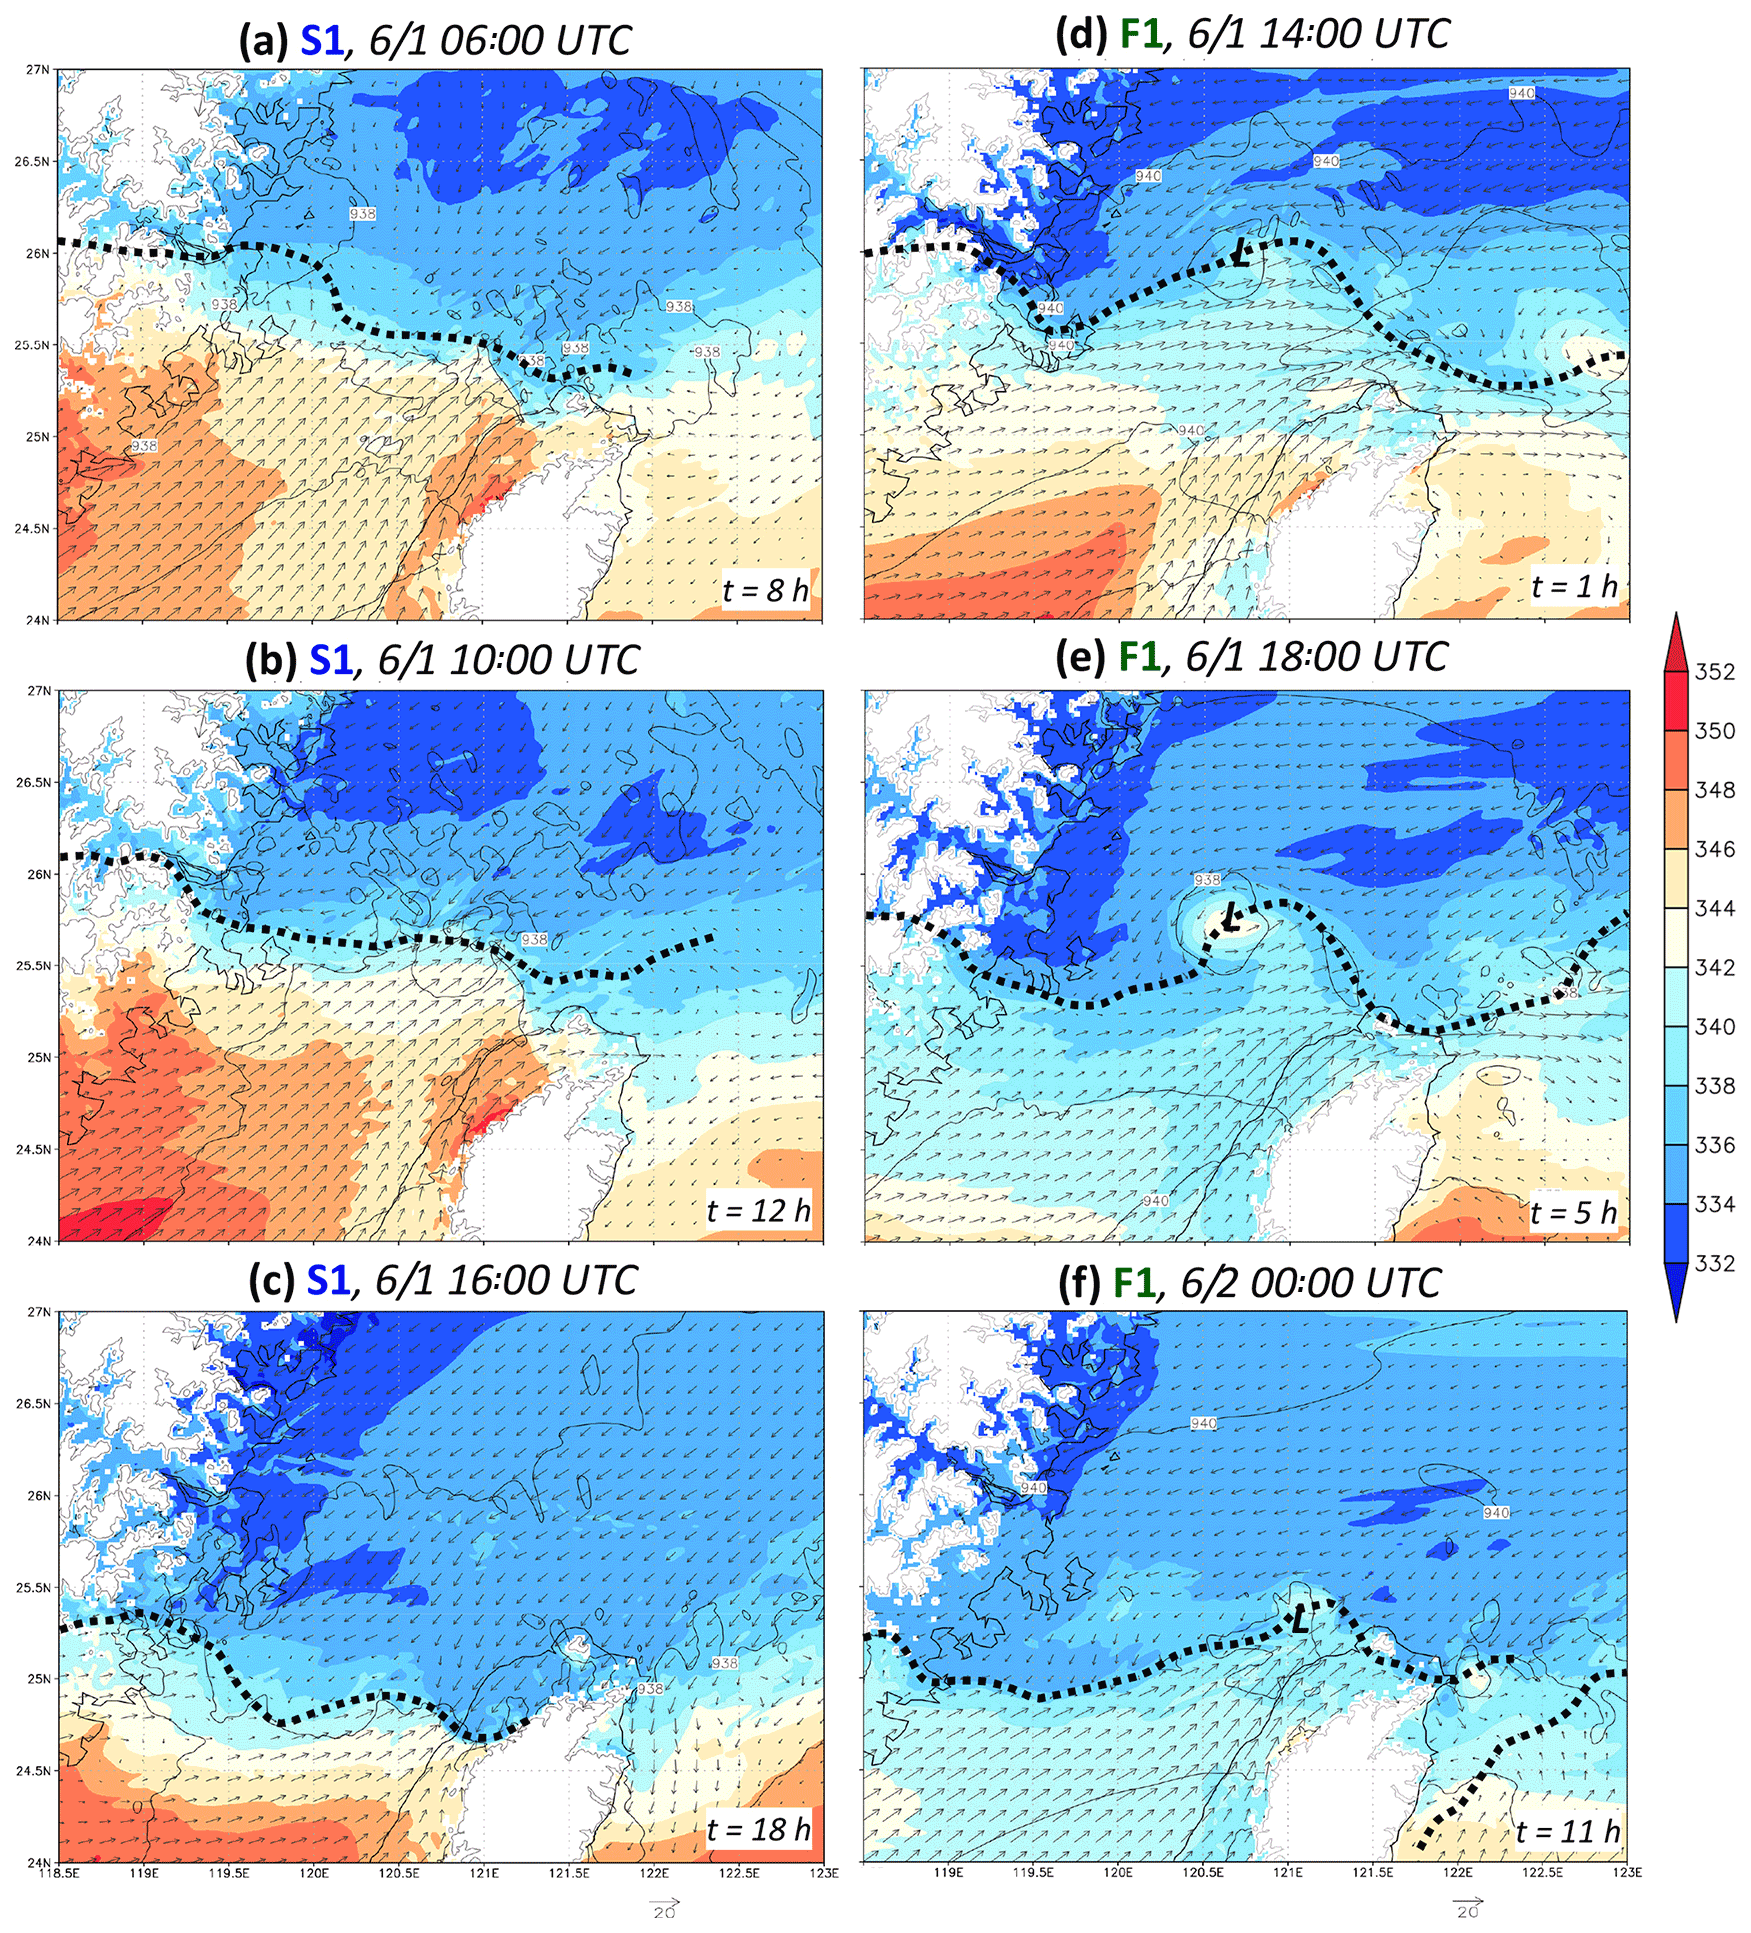
Figure 15Model pressure (hPa, isobars every 2 hPa), horizontal winds (m s−1, reference vector at bottom), and equivalent potential temperature (θe, K, color) at the height of 575 m near northern Taiwan at (a) 06:00, (b) 10:00, and (c) 16:00 UTC on 1 June 2017 in the S1 experiment. (d–f) As in (a)–(c), except at (d) 14:00 and (e) 18:00 UTC on 1 June and (f) 00:00 UTC on 2 June in the F1 experiment. The height contours at 575 m are plotted over land (gray), and the wind-shift lines are also depicted (thick dashed lines).

Figure 16The CWB surface regional weather charts near Taiwan every 3 h from (a) 06:00 UTC on 1 June to (i) 06:00 UTC on 2 June 2017. In the panels, the mean sea-level pressure (MSLP, hPa) is analyzed with isobars every 2 hPa with closed high/low centers labeled (source: CWB), and the surface frontal position is also marked (thick dashed lines).
5.4 Frontal disturbance and its relation to rainbands
In Fig. 12 where the rainband is fixed in location for many hours, a slow-moving frontal disturbance is also visible to develop over the northern Taiwan Strait to the northwest of Taiwan since 14:00 UTC and until at least 22:00 UTC on 1 June (Fig. 12a–e). As the westerly flow to the south of its cyclonic center is enhanced, it appears to produce stronger near-surface convergence with the southwesterly flow off northwestern Taiwan and subsequently with the northeasterly flow off northern and northeastern Taiwan in F1. To further examine this linkage, the pressure, horizontal wind, and convergence fields in F1 at the height of 575 m are shown in Fig. 14 at the same times as in Fig. 12 for comparison.
In Fig. 14, the low-pressure disturbance along the Mei-yu front forms before 14:00 UTC on 1 June and is still identifiable at 00:00 UTC on 2 June (Fig. 14a–f). From 14:00 to at least 18:00 UTC (Fig. 14a–c), narrow but intense convergence lines (over 10−3 s−1 in magnitude) near the surface develop not only near the northwestern coast over the northern Taiwan Strait (zone 1) between the westerly flow in the southern quadrant of the low and the southwesterly flow deflected and enhanced by the topography of Taiwan further south but also off the northern tip of the island, in a northwest–southeast orientation (zone 2) between the westerly flow and the postfrontal northeasterly winds. After 18:00 UTC, as the low moves south together with the front in F1, the westerly and southwesterly flows merge together and form the convergence with the northeasterly flow as a continuation of zone 2 for about 6 h until 00:00 UTC on 2 June (Fig. 14d–f). Note that throughout this time, especially after 18:00 UTC, zone 2 is stationary (in its southern part) with the help from local terrain and extends right into the northern coast of Taiwan, near the location of maximum rainfall in the observation (see Fig. 6a). Its location corresponds well with the persistent rainband (see Fig. 12) and clearly contributed to the maximum rainfall, which is also aligned from northwest to southeast across the northern coast (see Fig. 9b). Little rainfall exists near the low center so that the offshore region to the northwest of northern Taiwan receives much less rainfall in F1 compared to S1 (see Figs. 9 and 12). After 00:00 UTC on 2 June, the low disturbance in F1 weakens and the convergence zone also slowly moves south (Fig. 14g–i), gradually away from the northern coast of Taiwan, and so does the rainband shortly thereafter (Fig. 12). Therefore, in F1, this frontal low-pressure disturbance is identified as the key feature that enhanced the westerly or southwesterly flow, and more importantly, produced a stationary near-surface convergence zone with the postfrontal flow right across the northern coast of Taiwan for several hours, thus leading to the persistent rainband also fixed in location. Both the frontal disturbance and a stationary convergence zone like zone 2 do not appear in S1 even with the presence of the local topography, and subsequently its rainbands are all migratory and the rainfall is not as concentrated (see Figs. 11 and 13a–c).
While the near-surface convergence associated with the rainbands in S1 (figure omitted) does not appear to be weaker than those in F1 (Fig. 14) by comparison; the frontal intensity is the only factor yet to be discussed among the five features identified in WLC21, and thus perhaps should be addressed here. In Fig. 15, the equivalent potential temperature (θe) fields at 575 m at three selected times during the heavy rainfall period in S1 and F1 are shown and compared. In S1, the convergence near the wind-shift line is only directly between the southwesterly flow over the Taiwan Strait and the postfrontal northeasterly flow farther to the north as discussed but often possesses a θe difference of at least 10–12 K across a distance of about 0.5∘ (∼ 55 km) near northern Taiwan (Fig. 15a–c). On the other hand, with the appearance of the frontal low in F1, the westerly flow to its south that converges and later merges with the southwesterly flow is typically colder in θe (Fig. 15d–f), as it is partially circulated from the colder air to the west of the low center. As the θe south of the wind-shift line is lower in value (typically below 342 K), the contrast across the line is also less and only about 5–6 K. Therefore, the low-pressure disturbance in F1 does not bring about a larger θe contrast across the front (and rainband), and the higher peak rainfall amount along the northern coast of Taiwan can be confirmed to be mainly due to the persistent rainband fixed in location in our 1 km experiment.
The near-surface frontal disturbance over the northern Taiwan Strait in F1 is identified to be the key feature that leads to the persistent convergence zone and rainband fixed in location across the northern coast of Taiwan and thus the considerably higher peak amount there (541 mm in 24 h), compared to the S1 experiment (393 mm). One may ask if there is any observational evidence to support the presence of this low. To address this point, the CWB regional weather charts every 3 h during the heavy rainfall period are presented in Fig. 16. While the frontal position (analyzed in this study) in the regional chart often differs from the synoptic map (see Fig. 2) as expected, a frontal low of about 999–1001 hPa in mean sea-level pressure (MSLP) is seen to appear about 150 km north of Taiwan as early as 06:00 UTC (Fig. 16a) and moves slowly eastward along the front as the latter gradually approached Taiwan until 1 d later (Fig. 16b–i). Throughout this period, the MSLP at its center was consistently about 1–3 hPa lower than the surrounding, and the only time at least one enclosed isobar could not be identified is 03:00 UTC on 2 June (Fig. 16h). Thus, the near-surface low along the front, during the entire time when it is captured in F1 (see Fig. 14), is confirmed to exist in the observation and quite persistent as well. In Fig. 14, the spatial scale and amplitude of the low (∼ 2 hPa) in F1 are also comparable to those in the observation (Fig. 16).
In this study, the extreme rainfall event on 2 June 2017 in northern Taiwan, where the peak 24 h amount of 645 mm was observed over the coast, is studied through numerical modeling. In an earlier study, WLC21 employed ensemble sensitivity analysis to identify some factors important to differentiate more rainy (around 150–350 mm) from less rainy (<150 mm) members at grid sizes of 2.5–5 km, including the moving speed of the surface front (and 700 hPa wind-shift line), moisture amount near the front, location and timing of frontal disturbance, and frontal intensity. Following WLC21, two experiments in this study at a finer grid size of 1 km produced a peak amount of 541 (exp. F1) and 393 mm (exp. S1), respectively, and therefore are compared to isolate the reasons in F1 for its considerably higher peak amount at the northern coast of Taiwan, if and when an amount in better agreement with the observation is to be captured. The F1 run also confirms that it is possible to reproduce the extreme torrential rainfall of ≥ 500 mm at the northern coast for this event. Besides the main objectives stated above, the topographic effects of Taiwan on rainfall in this event are also examined and tested using two other 1 km experiments.
In S1 where the peak 24 h rainfall is less (nearly 400 mm) at the northern coast, the surface front has a stronger contrast in θe and moves slightly slower, and the convergence is of similar strength compared to F1, so these factors are not crucial in raising the peak rainfall to beyond 400 mm. Its rainfall is more widespread over a larger area, produced by several slow-moving yet migratory rainbands through the northernmost part of Taiwan. On the contrary, in F1 where the peak rainfall is higher and reaches 541 mm overland (and 618 mm nearshore), the responsible rainband remains stationary across the coastline over an extended period, in good agreement with the observation, and is caused by the convergence between the southwesterly flow and the colder northeasterly flow behind the front. A frontal low-pressure disturbance to the northwest of northern Taiwan is identified in F1 to lead to westerly flow to its south that combines with the topographically deflected southwesterly flow and the subsequent convergence (at the leading edge) with the postfrontal flow for much of the heavy rainfall period. With the rainband fixed in location, the rainfall is more concentrated, and a higher peak amount is achieved. Confirmed in observation, this near-surface frontal disturbance does not exist in S1.
For the topographic effect, our sensitivity tests indicate significant differences when the entire island topography of Taiwan is removed. Without the blocking and deflecting effects on the prefrontal flow, there is no heavy rainfall in northern Taiwan. However, the Datun Mountain and Linkou Plateau in northern Taiwan, when removed, produce heavy rainfall areas that are located more inland along the northern slopes of the SMR with a lowered peak amount (422 mm), and thus the response is in general agreement with Tu et al. (2022), where the reduction in peak rainfall is estimated to be around 25 %.
Although the peak amount in the S1 simulation is less, the F1 does produce 541 mm on land and only about 100 mm below the observation, driven by a 3 km forecast (M18 of WLC21) that was completed well before the occurrence of the actual event (roughly 60 h prior). Thus, the 1 km forecast offers some hope to successfully predict the event in advance in real time. Some related work is currently underway and will be reported in the future.
The CReSS model and the user's guide are available at http://www.rain.hyarc.nagoya-u.ac.jp/~tsuboki/cress_html/index_cress_eng.html (last access: 15 March 2019). The NCEP GFS analysis/forecast data are from http://rda.ucar.edu/datasets/ds335.0/#!description (last access: 20 June 2020), and the NAVGEM data are from https://www.hycom.org/dataserver/navgem (last access: 1 April 2021). The observational data in Taiwan are from the CWB (https://www.cwb.gov.tw/eng/, last access: 5 August 2021) and the DBAHR (https://dbar.pccu.edu.tw/, last access: 5 May 2021).
CCW contributed to conceptualization, methodology, investigation, formal analysis, resources, writing (original draft, review, and editing) supervision, project administration, and funding acquisition. TYY contributed to methodology, software, formal analysis, investigation, data curation, visualization, and writing (original draft, review, and editing). CSC contributed to data curation, formal analysis, visualization, and writing (review and editing). MSL contributed to software, data curation, and writing (review and editing). KT contributed to software and writing (review and editing). CHL contributed to data curation and writing (review and editing).
The contact author has declared that none of the authors has any competing interests.
Publisher's note: Copernicus Publications remains neutral with regard to jurisdictional claims in published maps and institutional affiliations.
The authors thank the reviewers for their constructive comments that helped improve the paper. Useful discussions with Yu-Chieng Liou (National Central University) and Ben Jong-Dao Jou (National Taiwan University) are appreciated. Help from Ms. Yi-Wen Wang and Shin-Yi Huang is also acknowledged. The various data used in this study are provided by the CWB, the DBAHR, the National Science and Technology Center for Disaster Reduction (NCDR) of Taiwan, the NCEP, and the Center for Ocean–Atmospheric Prediction Studies (COAPS) of the USA.
This research has been supported by the National Science and Technology Council (NSTC), Taiwan (grant nos. MOST 108-2111-M-003-005-MY2, MOST 110-2111-M-003-004, MOST 111-2111-M-003-005, and MOST 111-2625-M-003-001).
This paper was edited by Heini Wernli and reviewed by two anonymous referees.
Akaeda, K., Reisner, J., and Parsons, D.: The role of mesoscale and topographically induced circulations initiating a flash flood observed during the TAMEX project, Mon. Weather Rev., 123, 1720–1739, 1995.
Ancell, B. and Hakim, G. J.: Comparing adjoint- and ensemble-sensitivity analysis with applications to observation targeting, Mon. Weather Rev., 135, 4117–4134, 2007.
Banta, R. M.: The Role of Mountain Flows in Making Clouds, in: Atmospheric Processes over Complex Terrain, edited by: Blumen, W., Meteorological Monographs, 23, Boston, Massachusetts, US, Am. Meteorol. Soc., 229–284, https://doi.org/10.1007/978-1-935704-25-6_9, 1990.
Bednarczyk, C. N. and Ancell, B. C.: Ensemble sensitivity analysis applied to a southern plains convective event, Mon. Weather Rev., 143, 230–249, 2015.
Chen, G. T.-J.: Mesoscale features observed in Taiwan Mei-Yu season, J. Meteor. Soc. Jpn., 70, 497–516, 1992.
Chen, G. T.-J.: Research on the phenomena of Meiyu during the past quarter century: an overview, in: World Scientific Series on Meteorology of East Asia, Vol. 2, East Asian Monsoon, edited by: Chang, C.-P., World Scientific, Singapore, 357–403, ISBN: 981-238-769-2, https://doi.org/10.1142/9789812701411_0010, 2004.
Chen, G. T.-J. and Chi, S.-S.: On the frequency and speed of mei-yu front over southern China and the adjacent areas, Pap. Meteor. Res., 3, 31–42, 1980.
Chen, G. T.-J. and Chou, H.-C.: General characteristics of squall lines observed in TAMEX, Mon. Weather Rev., 121, 726–733, 1993.
Chen, G. T.-J. and Yu, C.-C.: Study of low-level jet and extremely heavy rainfall over northern Taiwan in the mei-yu season, Mon. Weather Rev., 116, 884–891, 1988.
Chen, G.T.-J., Wang, C.-C., and Lin, D. T.-W.: Characteristics of low-level jets over northern Taiwan in mei-yu season and their relationship to heavy rain events, Mon. Weather Rev. 133, 20–43, 2005.
Chen, G. T.-J., Wang, C.-C., and Chang, S.-W.: A diagnostic case study of meiyu frontogenesis and development of wavelike frontal disturbances in the subtropical environment, Mon. Weather Rev., 136, 41–61, 2008.
Chen, S.-J., Kuo, Y.-H., Wang, W., Tao, Z.-Y., and Cui, B.: A modeling case study of heavy rainstorms along the mei-yu front, Mon. Weather Rev., 126, 2330–2351, 1998.
Chen, T.-C., Yen, M.-C., Hsieh, J.-C., and Arritt, R. W.: Diurnal and seasonal variations of the rainfall measured by the automatic rainfall and meteorological telemetry system in Taiwan, B. Am. Meteorol. Soc., 80, 2299–2312, 1999.
Chen, X.-A. and Chen, Y.-L.: Development of low-level jets during TAMEX, Mon. Weather Rev., 123, 1695–1719, 1995.
Chen, Y.-L., Chen, X. A., and Zhang, Y.-X.: A diagnostic study of the low-level jet during TAMEX IOP 5, Mon. Weather Rev., 122, 2257–2284, 1994.
Chen, Y.-L., Chu, Y.-J., Chen, C.-S., Tu, C.-C., Teng, J.-H., and Lin, P.-L.: Analysis and simulations of a heavy rainfall event over northern Taiwan during 11–12 June 2012, Mon. Weather Rev., 146, 2697–2715, 2018.
Chi, S.-S.: The Mei-Yu in Taiwan, SFRDEST E-06-MT-03-4, Chung-Shin Engineering Technology Research and Development Foundation, Taipei, Taiwan, 65 pp., ISBN: 986-7142-22-5, 2006.
Chien, F.-C. and Jou, B. J.-D.: MM5 ensemble mean precipitation in the Taiwan area for three early summer convective (Mei-Yu) seasons, Weather Forecast., 19, 735–750, 2004.
Chung, K.-S., Chiu, H.-J., Liu, C.-Y., and Lin, M.-Y.: Satellite observation for evaluating cloud properties of the microphysical schemes in Weather Research and Forecasting simulation: A case study of the Mei-yu front precipitation system, Remote Sens., 12, 3060, https://doi.org/10.3390/rs12183060, 2020.
Cotton, W. R., Tripoli, G. J., Rauber, R. M., and Mulvihill, E. A.: Numerical simulation of the effects of varying ice crystal nucleation rates and aggregation processes on orographic snowfall, J. Appl. Meteorol. Climatol., 25, 1658–1680, 1986.
Ding, Y. and Chan, J. C.-L.: The East Asian summer monsoon: an overview, Meteor. Atmos. Phys., 89, 117–142, 2005.
Ding, Y.-H.: Summer monsoon rainfalls in China, J. Meteorol. Soc. Jpn., 70, 337–396, 1992.
Deardorff, J. W.: Stratocumulus-capped mixed layers derived from a three-dimensional model, Bound.-Lay. Meteorol., 18, 495–527, 1980.
Gourley, J. J., Zhang, J., Maddox, R. A., Calvert, C. M., and Howard, K. W.: A real-time precipitation monitoring algorithm – Quantitative Precipitation Estimation Using Multiple Sensors (QPE-SUMS), in: Preprints, Symposium on Precipitation Extremes: Prediction, Impacts, and Responses, Albuquerque, NM, Am. Meteorol. Soc., 57–60, 2001.
Houze Jr., R. A., Rutledge, S. A., Biggerstaff, M. I., and Smull, B. F.: Interpretation of Doppler radar displays of mid-latitude mesoscale convective systems, B. Am. Meteorol. Soc., 70, 608–619, 1989.
Hsu, J.: ARMTS up and running in Taiwan, Väisälä News, Väisälä, 146, 24–26, 1998.
Ikawa, M. and Saito, K.: Description of a nonhydrostatic model developed at the Forecast Research Department of the MRI, MRI Tech., Rep. 28, Meteorological Research Institute, Tsukuba, Japan, 238 pp., https://doi.org/10.11483/mritechrepo.28, 1991.
Huang, W.-R. Liu, P.-Y., Chen, J.-H., and Deng, L.: Impact of Boreal Summer Intra-Seasonal Oscillations on the heavy rainfall events in Taiwan during the 2017 Meiyu season, Atmosphere, 10, 205, 18 pp., https://doi.org/10.3390/atmos10040205, 2019.
Johnson, R. H.: Diurnal cycle of monsoon convection, in: The Global Monsoon System: Research and Forecast, 2nd Edition, edited by: Chang, C.-P., Ding, Y., Lau, N.-C., Johnson, R. H., Wang, B., and Yasunari, T., World Scientific, Toh Tuck Link, Singapore, 257–276, https://doi.org/10.1142/9789814343411_0015, 2011.
Jou, B. J.-D. and Deng, S.-M.: Structure of a low-level jet and its role in triggering and organizing moist convection over Taiwan: a TAMEX case study, Terr. Atmos. Ocean. Sci., 3, 39–58, 1992.
Kalnay, E., Kanamitsu, M., and Baker, W. E.: Global numerical weather prediction at the National Meteorological Center, B. Am. Meteorol. Soc., 71, 1410–1428, 1990.
Ke, C.-Y., Chung, K.-S., Chen Wang, T.-C., and Liou, Y.-C.: Analysis of heavy rainfall and barrier-jet evolution during Mei-Yu season using multiple Doppler radar retrievals: a case study on 11 June 2012, Tellus A, 71, 1571369, https://doi.org/10.1080/16000870.2019.1571369, 2019.
Kerns, B. W. J., Chen, Y.-L., and Chang, M.-Y.: The diurnal cycle of winds, rain, and clouds over Taiwan during the mei-yu, summer, and autumn rainfall regimes, Mon. Weather Rev., 138, 497–516, https://doi.org/10.1175/2009MWR3031.1, 2010.
Kleist, D. T., Parrish, D. F., Derber, J. C., Treadon, R., Wu, W. S., and Lord, S.: Introduction of the GSI into the NCEP global data assimilation system, Weather Forecast., 24, 1691–1705, 2009.
Kondo, J.: Heat balance of the East China Sea during the air mass transformation experiment, J. Meteorol. Soc. Jpn., 54, 382–398, 1976.
Kuo, Y.-H. and Chen, G. T.-J.: The Taiwan Area Mesoscale Experiment (TAMEX): an overview, B. Am. Meteorol. Soc., 71, 488–503, 1990.
Lau, K.-M., Yang, G. J., and Shen, S. H.: Seasonal and intraseasonal climatology of summer monsoon rainfall over East Asia, Mon. Weather Rev., 116, 18–37, 1988.
Li, J. and Chen, Y.-L.: Barrier jets during TAMEX, Mon. Weather Rev., 126, 959–971, 1998.
Lin, Y.-J., Wang, T.-C. C., Pasken, R. W., Shen, H., and Deng, Z.-S.: Characteristics of a subtropical squall line determined from TAMEX dual-Doppler data, Part II: Dynamic and thermodynamic structures and momentum budgets, J. Atmos. Sci., 47, 2382–2399, 1990.
Lin, Y.-L.: Orographic effects on airflow and mesoscale weather systems over Taiwan, Terr. Atmos. Ocean. Sci., 4, 381–420. 1993.
Lin, Y.-L., Farley, R. D., and Orville, H. D.: Bulk parameterization of the snow field in a cloud model, J. Appl. Meteorol. Climatol., 22, 1065–1092, 1983.
Lin, Y.-L., Chiao, S., Wang, T.-A., and Kaplan, M. L.: Some common ingredients for heavy orographic rainfall, Weather Forecast., 16, 633–660, 2001.
Louis, J. F., Tiedtke, M., and Geleyn, J. F.: A short history of the operational PBL – parameterization at ECMWF, in: Proceedings, ECMWF Workshop on Planetary Boundary Layer Parameterization, 25–27 November 1981, ECMWF, Reading, UK, 59–79, https://www.ecmwf.int/en/elibrary/75473-short-history-pbl-parameterization-ecmwf (last access: 21 April 2021), 1982.
Lupo, K. M., Torn, R. D., and Yang, S.-C.: Evaluation of stochastic perturbed parameterization tendencies on convective-permitting ensemble forecasts of heavy rainfall events in New York and Taiwan, Weather Forecast., 35, 5–24, 2020.
Metzger, E. J., Wallcraft, A. J., Posey, P. G., Smedstad, O. E., and Franklin, D. S.: The switchover from NOGAPS to NAVGEM 1.1 Atmospheric Forcing in GOFS and ACNFS, NRL/MR/7320–13-9486, Naval Research Laboratory, Oceanography Division, Stennis Space Center, MS, USA, 13 pp., https://www.hycom.org/attachments/377_NRL MR-9486.pdf (last access: 1 April 2021), 2013.
Moorthi, S., Pan, H. L., and Caplan, P.: Changes to the 2001 NCEP operational MRF/AVN global analysis/forecast system, Tech. Procedures Bull. 484, Office of Meteorology, National Weather Service, Silver Spring, MD, USA, 14 pp., https://rda.ucar.edu/datasets/ds093.0/docs/484.pdf (last access: 20 June 2020), 2001.
Murakami, M.: Numerical modeling of dynamical and microphysical evolution of an isolated convective cloud – The 19 July 1981 CCOPE cloud, J. Meteorol. Soc. Jpn., 68, 107–128, 1990.
Murakami, M., Clark, T. L., and Hall, W. D.: Numerical simulations of convective snow clouds over the Sea of Japan: two-dimensional simulations of mixed layer development and convective snow cloud formation, J. Meteorol. Soc. Jpn., 72, 43–62, 1994.
Nagata, M. and Ogura, Y.: A modeling case study of interaction between heavy precipitation and a low-level jet over Japan in the baiu season, Mon. Weather Rev., 119, 1309–1336, 1991.
Pierrehumbert, R. T. and Wyman, B.: Upstream effects of mesoscale mountains, J. Atmos. Sci., 42, 977–1003, 1985.
Rotunno, R., Klemp, J. B., and Weisman, M. L.: A theory for strong, long-lived squall lines, J. Atmos. Sci., 45, 463–485, 1988.
Ruppert, J. H., Jr., Johnson, R. H., and Rowe, A. K.: Diurnal circulations and rainfall in Taiwan during SoWMEX/TiMREX (2008), Mon. Weather Rev., 141, 3851–3872, 2013.
Segami, A., Kurihara, K., Nakamura, H., Ueno, M., Takano, I., and Tatsumi, Y.: Operational mesoscale weather prediction with Japan Spectral Model, J. Meteorol. Soc. Jpn., 67, 907–924, 1989.
Torn, R. D. and Hakim, G. J.: Ensemble-based sensitivity analysis, Mon. Weather Rev., 136, 663–677, 2008.
Tsuboki, K. and Sakakibara, A.: Large-scale parallel computing of cloud resolving storm simulator, in: High Performance Computing, ISHPC 2002, Lecture Notes in Computer Science, Vol. 2327, edited by: Zima, H. P., Joe, K., Sato, M., Seo, Y., and Shimasaki, M., Springer-Verlag, Berlin and Heidelberg, Germany, 243–259, ISBN: 978-3-540-43674-4, https://doi.org/10.1007/3-540-47847-7_21, 2002.
Tsuboki, K. and Sakakibara, A.: Numerical Prediction of High-Impact Weather Systems: The Textbook for the Seventeenth IHP Training Course in 2007, Hydrospheric Atmospheric Research Center, Nagoya University, and UNESCO, Nagoya, Japan, 273 pp., ISBN: 978-4-9980619-8-4, 2007.
Tu, C.-C., Chen, Y.-L., Lin, P.-L., and Huang, M.-Q.: Analysis and simulations of a heavy rainfall event associated with the passage of a shallow front over northern Taiwan on 2 June 2017, Mon. Weather Rev., 150, 505–528, 2022.
Wang, C.-C., Chen, G. T.-J., Chen, T.-C., and Tsuboki, K.: A numerical study on the effects of Taiwan topography on a convective line during the mei-yu season, Mon. Weather Rev., 133, 3217–3242, 2005.
Wang, C.-C., Chen, G. T.-J., and Huang, S.-Y.: Remote trigger of deep convection by cold outflow over the Taiwan Strait in the mei-yu season: A modeling study of the 8 June 2007 case, Mon. Weather Rev., 139, 2854–2875, 2011.
Wang, C.-C., Kuo, H.-C., Chen, Y.-H., Huang, H.-L., Chung, C.-H., and Tsuboki, K.: Effects of asymmetric latent heating on typhoon movement crossing Taiwan: The case of Morakot (2009) with extreme rainfall, J. Atmos. Sci., 69, 3172–3196, 2012.
Wang, C.-C., Hsu, J. C.-S., Chen, G. T.-J., and Lee, D.-I.: A study of two propagating heavy-rainfall episodes near Taiwan during SoWMEX/TiMREX IOP-8 in June 2008, Part I: Synoptic evolution, episode propagation, and model control simulation, Mon. Weather Rev., 142, 2619–2643, 2014a.
Wang, C.-C., Hsu, J. C.-S., Chen, G. T.-J., and Lee, D.-I.: A study of two propagating heavy-rainfall episodes near Taiwan during SoWMEX/TiMREX IOP-8 in June 2008, Part II: Sensitivity tests on the roles of synoptic conditions and topographic effects, Mon. Weather Rev., 142, 2644–2664, 2014b.
Wang, C.-C., Chiou, B.-K., Chen, G. T.-J., Kuo, H.-C., and Liu, C.-H.: A numerical study of back-building process in a quasistationary rainband with extreme rainfall over northern Taiwan during 11–12 June 2012, Atmos. Chem. Phys., 16, 12359–12382, doi.org/10.5194/acp-16-12359-2016, 2016.
Wang, C.-C., Paul, S., Chien, F.-C., Lee, D.-I., and Chuang, P.-Y.: An evaluation of WRF rainfall forecasts in Taiwan during three mei-yu seasons of 2008–2010, Weather Forecast., 32, 1329–1351, https://doi.org/10.1175/WAF-D-16-0190.1, 2017.
Wang, C.-C., Li, M.-S., Chang, C.-S., Chuang, P.-Y., Chen, S.-H., and Tsuboki, K.: Ensemble-based sensitivity analysis and predictability of an extreme rainfall event over northern Taiwan in the Mei-yu season: The 2 June 2017 case, Atmos. Res., 259, 105684, https://doi.org/10.1016/j.atmosres.2021.105684, 2021.
Wang, C.-C., Chuang, P.-Y., Chang, C.-S., Tsuboki, K., Huang, S.-Y., and Leu, G.-C.: Evaluation of Mei-yu heavy-rainfall quantitative precipitation forecasts in Taiwan by a cloud-resolving model for three seasons of 2012–2014, Nat. Hazards Earth Syst. Sci., 22, 23–40, https://doi.org/10.5194/nhess-22-23-2022, 2022a.
Wang, C.-C., Chuang, P.-Y., Chen, S.-T., Lee, D.-I., and Tsuboki, K.: Idealized simulations of Mei-yu rainfall in Taiwan under uniform southwesterly flow using a cloud-resolving model, Nat. Hazards Earth Syst. Sci., 22, 1759–1817, https://doi.org/10.5194/nhess-22-1795-2022, 2022b.
Yeh, H.-C. and Chen, Y.-L.: Characteristics of the rainfall distribution over Taiwan during TAMEX, J. Appl. Meteorol. Clim., 37, 1457–1469, https://doi.org/10.1175/1520-0450(1998)037<1457:CORDOT>2.0.CO;2, 1998.
Yeh, H.-C. and Chen, Y.-L.: The role of offshore convergence on coastal rainfall during TAMEX IOP 3, Mon. Weather Rev., 130, 2709–2730, 2002.
Yeh, H.-C. and Chen, Y.-L.: Numerical simulations of the barrier jet over northwestern Taiwan during the Mei-Yu Season, Mon. Weather Rev., 131, 1396–1407, 2003.
Xu, W., Zipser, E. J., Chen, Y.-L., Liu, C., Liou, Y.-C., Lee, W.-C., and Jou, B. J.-D.: An orography-associated extreme rainfall event during TiMREX: initiation, storm evolution, and maintenance, Mon. Weather Rev., 140, 2555–2574, 2012.
- Abstract
- Introduction
- Data and methodology
- Case overview
- Sensitivity tests on effects of topography
- Mechanisms for the extreme rainfall along the northern coast of Taiwan
- Discussion
- Conclusion and summary
- Data availability
- Author contributions
- Competing interests
- Disclaimer
- Acknowledgements
- Financial support
- Review statement
- References