the Creative Commons Attribution 4.0 License.
the Creative Commons Attribution 4.0 License.
 | 28 Apr 2023
Measurement report: High Arctic aerosol hygroscopicity at sub- and supersaturated conditions during spring and summer
Andreas Massling
Robert Lange
Jakob Boyd Pernov
Ulrich Gosewinkel
Lise-Lotte Sørensen
Henrik Skov
Aerosol hygroscopic growth and cloud droplet formation influence the radiation transfer budget of the atmosphere and thereby the climate. In the Arctic, these aerosol properties may have a more pronounced effect on the climate compared to the midlatitudes. Hygroscopic growth and cloud condensation nuclei (CCN) concentrations of high Arctic aerosols were measured during two field studies in the spring and summer of 2016. The study site was the Villum Research Station (Villum) at Station Nord in the northeastern region of Greenland. Aerosol hygroscopic growth was measured with a hygroscopic tandem differential mobility analyzer (HTDMA) over a total of 23 d, and CCN concentrations were measured over a period of 95 d. Continuous particle number size distributions were recorded, facilitating calculations of aerosol CCN activation diameters and aerosol κ values. In spring, average CCN concentrations, at supersaturations (SSs) of 0.1 % to 0.3 %, ranged from 53.7 to 85.3 cm−3, with critical activation diameters ranging from 130.2 to 80.2 nm and κCCN ranging from 0.28–0.35. In summer, average CCN concentrations were 20.8 to 47.6 cm−3, while critical activation diameters and κCCN were from 137.1 to 76.7 nm and 0.23–0.35, respectively. Mean particle hygroscopic growth factors ranged from 1.60 to 1.75 at 90 % relative humidity in spring, while values between 1.47 and 1.67 were observed in summer depending on the initial dry size. Although the summer aerosol number size distributions were characterized by frequent new particle formation events, the CCN population at cloud-relevant supersaturations was determined by accumulation-mode aerosols.
- Article
(6001 KB) - Full-text XML
-
Supplement
(1923 KB) - BibTeX
- EndNote


In the Arctic region, the average temperature is rising about 3 times as fast as the global average (Lenssen et al., 2019). Aerosols influence the radiation balance of the atmosphere and the surface and thus play a key role in the climatic changes observed in the Arctic (Bellouin et al., 2011; Yang et al., 2014; Chylek et al., 2016). During sunlit seasons, the climatic effects of Arctic aerosols are diverse. Through aerosol–radiation interactions, aerosols scatter incoming shortwave radiation and absorb outgoing longwave radiation (Twomey, 1974). Arctic aerosols also impact clouds by altering cloud lifetime, precipitation rate, and cloud albedo (Zhao and Garrett, 2015). These aerosol–cloud interactions also influence the radiation balance. It has been shown that the Arctic atmosphere is limited in cloud condensation nuclei (CCN) (Mauritsen et al., 2011). This means that a relatively small increase in the concentration of aerosol particles that can function as CCN can have a comparably large effect on clouds and thus the radiation balance. The radiative forcing (RF) of aerosol–radiation interactions in the Arctic is not well quantified but appears to be a net cooling of the surface (Quinn et al., 2008; Breider et al., 2017).
Aerosol light scattering is highly dependent on particle size and refractive index (Moffet and Prather, 2009; Raut et al., 2009). Particles interact with atmospheric water vapor and potentially grow due to hygroscopicity, which is the ability to uptake water (Pilat and Charlson, 1966; Carrico et al., 2000; Fierz-Schmidhauser et al., 2010). This water uptake at subsaturated conditions changes their light-scattering behavior (Liu et al., 2013; Titos et al., 2016). Burgos et al. (2019) found through direct measurements of the aerosol enhancement factor that the effect of water uptake on light scattering is higher for Arctic aerosols compared to other atmospheric reservoirs, which is based on the special interplay between size and hygroscopicity in the Arctic (Zieger et al., 2010). One parameter to deduct from hygroscopicity measurements of aerosols is the κ value, which provides a theoretical framework for deriving the hygroscopicity for bulk aerosols, assuming an internal mixture (Petters and Kreidenweis, 2007). Knowledge about the hygroscopic growth of Arctic aerosols is crucial for determining the effects of their aerosol–radiation and aerosol–cloud interactions.
Ambient Arctic aerosol size, chemical composition, and number concentrations undergo a strong seasonal cycle (Tunved et al., 2013; Nguyen et al., 2016; Freud et al., 2017). Very few anthropogenic aerosol sources exist within the Arctic. During summer, the Arctic lower troposphere is a largely isolated system (Iversen and Joranger, 1985; Stohl, 2006). Anthropogenic influence from long-range transport is mostly absent, although intrusion from high-latitude regions, introducing anthropogenic aerosols, does occur. In summer, the ambient aerosol is mainly of biogenic origin, consisting mostly of biogenic sulfate and organic compounds (Willis et al., 2017). The aerosol is characterized by low particle number concentrations (50–200 cm−3), interrupted by relatively frequent new particle formation (NPF) events, which strongly increase the particle number concentration on timescales of hours to days (Nguyen et al., 2016; Freud et al., 2017; Collins et al., 2017; Dall'Osto et al., 2017). During autumn months, the occurrence of NPF decreases, and particle number concentrations reach a minimum. During winter, the polar front moves southward, extending the Arctic lower-tropospheric system to include midlatitude regions with anthropogenic emissions (Shaw et al., 2010). During the winter, inefficient wet deposition coupled with a stably stratified atmosphere allows pollution to build up, forming an increasingly prominent accumulation-mode fraction of aerosols. This accumulation mode reaches its maximum number concentration in late spring (March–April) (Matsui et al., 2011; Freud et al., 2017; Lange et al., 2018), a phenomenon known as Arctic haze (Barrie et al., 1981; Shaw, 1995; Quinn et al., 2007). During the Arctic winter and early spring, when sunlight is absent or scarce, it has been demonstrated that especially anthropogenic aerosols have a warming effect due to resulting increases in cloud longwave emissivity (Garrett et al., 2004; Garrett and Zhao, 2006). During this period, sulfate is the dominating particle component (Heidam et al., 1999, 2004; Nielsen et al., 2019). Recent findings indicate that sulfate, sea spray aerosol, and organic carbon might also be internally mixed in the submicron size range (Kirpes et al., 2018). When temperatures increase around May, the polar dome recedes and wet scavenging becomes an important aerosol sink, consequently removing the Arctic haze (Engvall et al., 2008; Browse et al., 2012; Croft et al., 2016). This leads to the reestablishment of clean summer conditions.
Concentrations and temporal development of CCN in the Arctic are characterized in several previous studies. Jung et al. (2018) evaluated a multiyear CCN dataset from Zeppelin Mountain, Svalbard, and found CCN concentrations at 0.2 % SS of 70–133 cm−3 for the late spring–early summer and 16–57 cm−3 for the late summer–early autumn period. Silvergren et al. (2014) evaluated a full CCN seasonal cycle (2007–2008) on Zeppelin Mountain, Svalbard, from re-aerosolized filter sampled aerosol. For supersaturations (SSs) between 0.2 % and 0.5 %, they found low CCN concentrations of <40 cm−3 for September–October, ∼40–80 cm−3 for November–February, 80–160 cm−3 for March–June, and 40–110 cm−3 for July–August, with the highest variation between supersaturations in the latter period. In contrast, Zabori et al. (2015) directly determined κ values from size-resolved CCN measurements on Svalbard to be between 0.4 and 0.3 at 0.4 % SS on separate occasions in June and August 2008, respectively. A review of long-term studies from around the world, including Utqiaġvik (formerly Barrow), Alaska, from 2007 to 2008, was published by Schmale et al. (2018). CCN concentrations at 0.2 % SS were between 20 and 200 cm−3, and CCN particle critical activation diameters (Dpcrit) showed a bimodal distribution, with a smaller mode at 70–100 nm and a larger one at 100–140 nm. The location showed the highest CCN number concentrations and lowest Dpcrit from February to June. In a study conducted in northwestern Canada in May 2014, Herenz et al. (2018) found CCN concentrations between 10 and 200 cm−3 at 0.1 %–0.78 % SS, a κ value of 0.19 at 0.1 % SS, and κ values of 0.21–0.28 at 0.2 %–0.7 % SS. They detected both well-aged Arctic haze aerosols and more recently formed aerosols, characteristic of the Arctic summer period. It should be mentioned here that these studies concentrated on remote locations in the high Arctic. Properties of Arctic aerosols can be quite diverse depending on the exact location and time of the year (Schmale et al., 2021, 2022; Schmale and Baccarini, 2021). Certain parts of the Arctic, e.g., Siberian and North American Arctic, are exposed to high levels of anthropogenic and industrial activities, while the high Arctic and central Arctic often show different seasonality of aerosol properties compared to the lower Arctic. The exact location and seasonality also have consequences for the precursor gases of new particle formation (Schmale and Baccarini, 2021) and their subsequent growth to CCN-relevant sizes.
From late spring to summer, the Arctic aerosol organic fraction changes from having a strong anthropogenic influence to being mainly biogenic (Nielsen et al., 2019; Willis et al., 2017). Likewise, the total organic fraction increases during summer as well (Chang et al., 2011; Breider et al., 2014). The origin and influence of these organic components on aerosol CCN ability (Leck et al., 2002) and hygroscopic behavior are currently not well understood and are still the subject of intense research (Myriokefalitakis et al., 2010; Fu et al., 2013; Willis et al., 2016). An organic marine source has been proposed to be an important source for primary aerosols, NPF, and secondary growth (Leck and Bigg, 2005; Burkart et al., 2017; Willis et al., 2017), which contributes significantly to the summertime aerosol mass load. Methanesulfonic acid (MSA) (Nielsen et al., 2019; Dall'Osto et al., 2018b) and organic acids (Mungall et al., 2017), high-molecular-weight compounds like proteins (Fu et al., 2015), and polymeric gels (Orellana et al., 2011) likewise play a role. Further, inorganic non-sea-salt sulfate from the oxidation of dimethyl sulfide (DMS) contributes importantly to aerosol mass during summer and autumn (Rempillo et al., 2011; Leaitch et al., 2013). Surface-active organics potentially increase aerosol CCN activity by lowering droplet surface tension (Lohmann and Leck, 2005). However, studies on non-Arctic marine aerosols at Mace Head have suggested complex behavior, with biogenic marine particles with low hygroscopic growth featuring high CCN activity (Ovadnevaite et al., 2011). This behavior can potentially be explained by liquid-phase separation, whereby less-hygroscopic but surface-active components are located in an outer shell, limiting hygroscopic growth at subsaturated conditions. During CCN activation, the phase separation breaks down and the surface-active compounds enhance CCN activity (Ovadnevaite et al., 2017). This process could also be relevant for Arctic aerosols. However, Lange et al. (2018) found indications that surface activity is not necessary to explain κ values of Arctic accumulation-mode aerosols.
Longer field studies reporting hygroscopic growth measured by HTDMA instruments in the Arctic are scarce. Zhou et al. (2001) conducted a shipboard campaign in the Arctic Ocean up to 87∘30′ N during the summer of 1996. They reported hygroscopic growth factors (HGFs) of 1.4–1.9 at 90 % relative humidity (RH) to be most prominent; however, cases of HGF > 1.9 and HGF < 1.4 were also observed. The higher HGFs probably result from sea salt aerosol, while the lower HGF could originate from an organic sea surface source. Using the same measurement series, Silvergren et al. (2014) determined HGF-derived κHTDMA values to be 0.35–0.5 in March–August and 0.6–0.9 in September–January. During a ship cruise in July–August 2013, Allan et al. (2015) observed that a possible contribution from iodine oxides lowered the HGF of 50 nm particles at 90 % RH to 1.34, whereas HGF was otherwise consistently >1.5.
The present study evaluates measurements from two field studies in 2016, during which CCN concentrations and HGFs were measured at the high Arctic site Villum Research Station (Villum). We present the measurement results and evaluate which aerosol sources could be responsible for the observed findings at subsaturated and supersaturated conditions. Our results can directly be used in models of Arctic aerosol–cloud–climate interactions, while simultaneously adding to the understanding of which aerosol sources are important for Arctic CCN concentrations.
2.1 Sampling site
All measurements presented in this study were recorded at the Villum Research Station (81∘36′ N, 16∘40′ W) in northeastern Greenland. Its location is shown in Fig. 1. Villum is located at the Danish military station of Station Nord on the Princess Ingeborg Peninsula, about 750 m from the coast of Denmark Fjord, close to the Wandel Sea. This coastal site is within the polar dome year-round and is in close proximity to the Arctic pack ice during both spring and summer (Fig. 1). Currently, the entrance from the Wandel Sea into the Denmark Fjord is covered by sea ice year-round, although in recent years, the waters near the station have been unfrozen from August to September. The sampling took place 2 km southwest of the station's main facilities in the “Air Observatory”, which provides controlled laboratory conditions for instrument operation. The location is upwind of the main station premises > 95 % of the time, and pollution influx from the station itself is therefore minimal. Polar sunrise occurs on 25 February, polar day prevails from 5 April to 3 September, and polar sunset occurs on 16 October. From 16 October to 25 February, the station experiences polar night. A further description of the station can be found elsewhere (Nguyen et al., 2016; Lange et al., 2018).
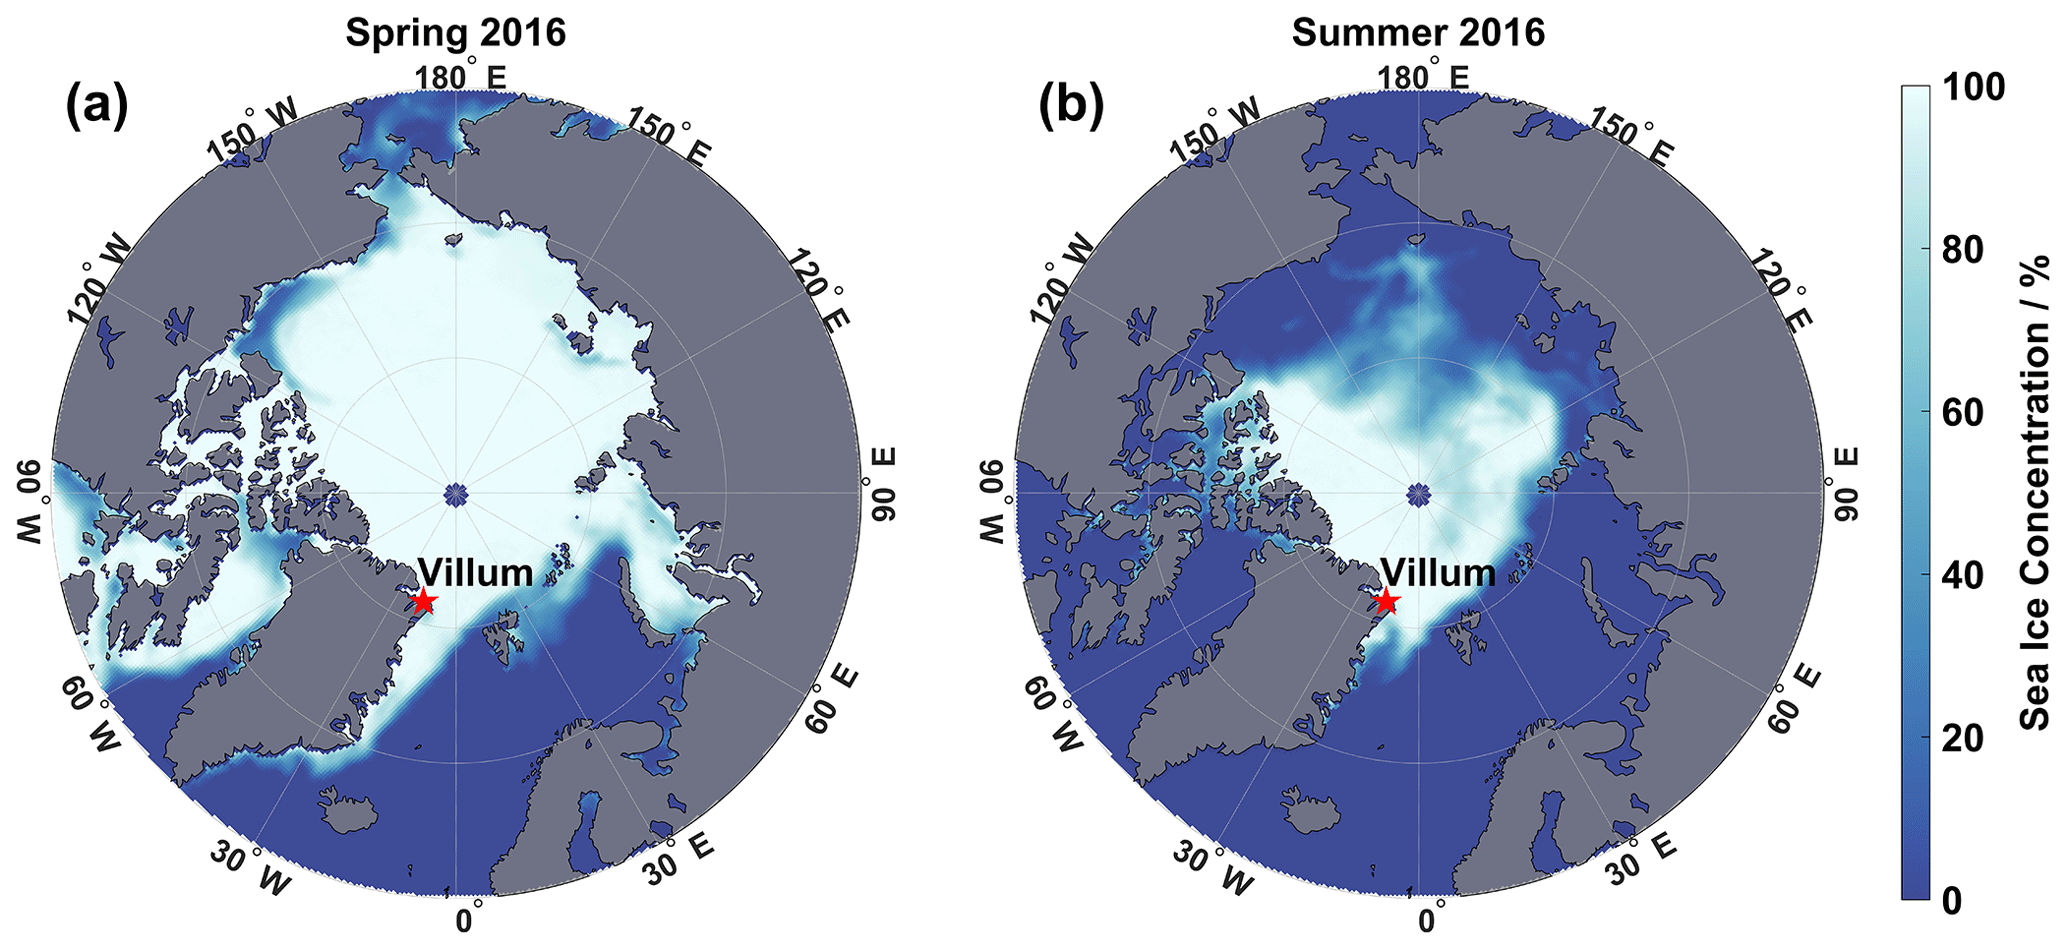
Figure 1Location of Villum Research Station at Station Nord. Villum is shown with a red star. Average sea ice concentration is included for the spring campaign (a) and summer campaign (b). Sea ice concentrations were taken from the National Sea & Ice Data Center (https://nsidc.org/home, last access: 21 October 2021).
The field studies described in this work were conducted in 2016 over two campaigns, one in spring and one in summer. The exact periods when the field studies were carried out are listed in Table 1. Basic meteorological parameters (temperature, wind speed and direction, atmospheric pressure, RH, and solar radiation) are monitored at Villum.
Table 1Measurement periods during spring and summer field studies.
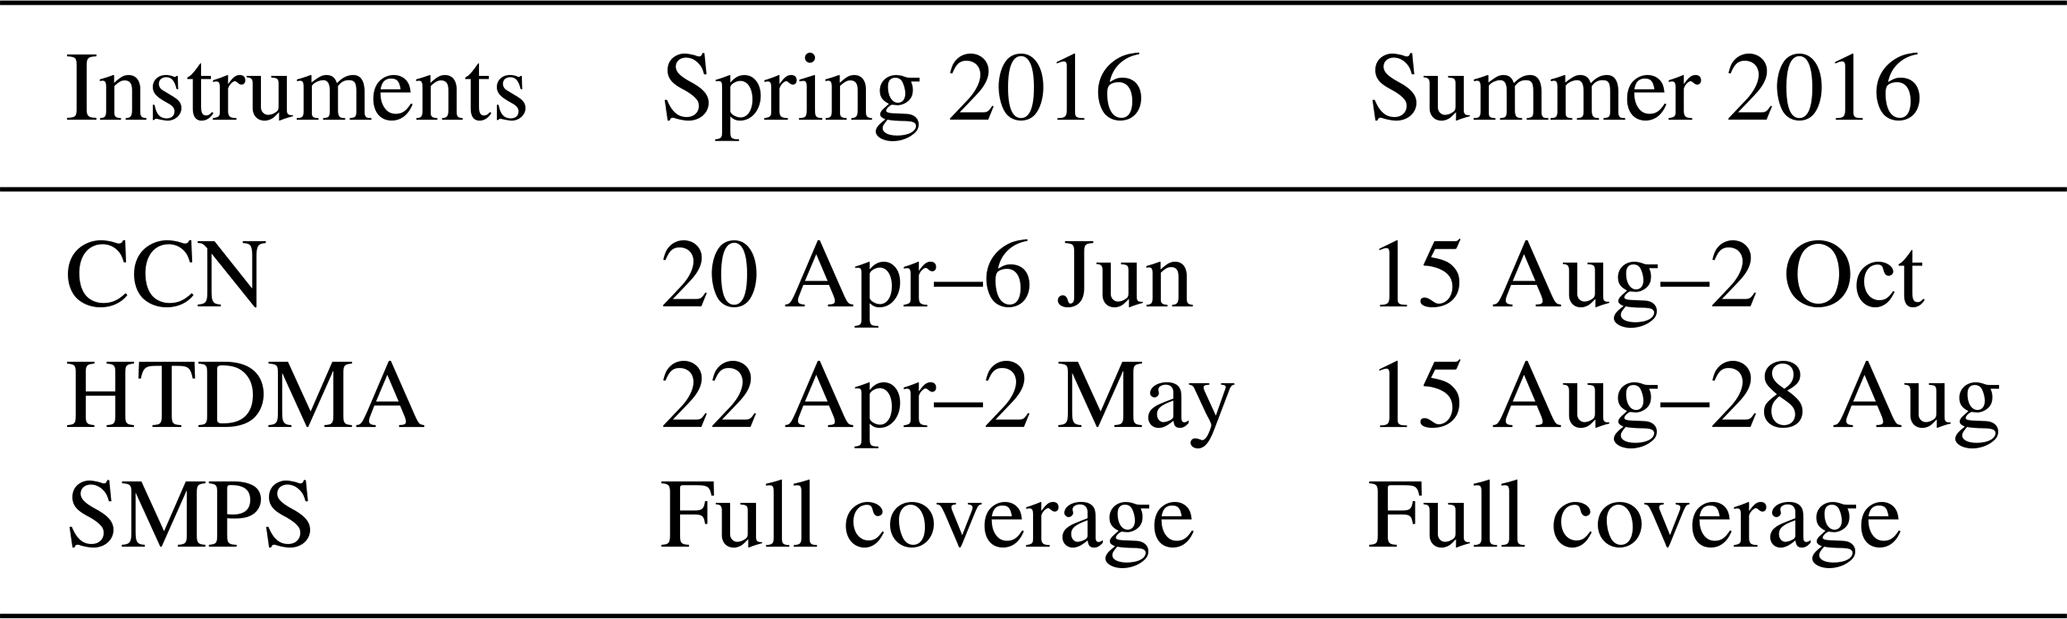
Although the duration of the spring field study arguably extends into the meteorological summer and the summer field study extends into the meteorological autumn, the naming is kept for convenience.
2.2 Aerosol number size distributions
A scanning mobility particle sizer (SMPS) has been operated continuously at Villum since 2010. Studies of aerosol physical properties at Villum, including the measurement setup, have been published elsewhere (Nguyen et al., 2016; Freud et al., 2017; Lange et al., 2018, 2019). In brief, the SMPS system measures size distributions of particles with electrical mobility diameters in the range from 9 to 915 nm, with 5 min time resolution. It consists of a custom-built electrostatic classifier with a Vienna-type medium DMA column, operating with a 5:1 sheath-to-sample flow ratio (Wiedensohler et al., 2012), either with a TSI 3010 condensation particle counter (CPC) or TSI 3772 CPC for particle detection. Ambient aerosol is sampled through a specially designed heated inlet for total suspended particles, with laminar flow to minimize losses. There is no additional drying of the sample air prior to entering the analytical instruments, as the transition from the cold outside temperatures to >20 ∘C inside the Air Observatory ensures sufficient particle drying. The aerosol sample flow RH is below 35 % more than 99 % of the time. Raw SMPS measurements are inverted offline by an algorithm as described in Pfeifer et al. (2014).
All measurements recorded by the SMPS were quality-controlled by inspection of instrument flows, temperatures, and RHs as well as by visual inspection of size distribution plots. Measurements influenced by local pollution from, e.g., nearby vehicles, or when the instrument was malfunctioning were removed from further consideration.
2.3 Cloud condensation nuclei properties
Concentrations of CCN were measured by a Droplet Measurement Technologies CCN-100 CCN counter, cycling 10 supersaturations of 0.1 %–1.0 % SS. The highest reachable supersaturation (typically ∼1.8 % SS) was also included in the measurement protocol. CCN concentrations at the highest SS (CCNmax) were used as a reference against the number concentration of particles larger than 25 nm (N25) inferred from SMPS measurements. For all settings of SS, the temperature gradient in the CCN column was allowed to stabilize for 5 min, before acquiring data for 5 min. An exception to this procedure was the return from ∼1.8 % SS to 0.1 % SS, with a 15 min stabilization time allowed. The resulting cycling time for all 11 supersaturations was 120 min. Measurements at 0.25 %, 0.35 %, and 0.40 % SS were shown to be largely redundant with measurements at other SSs and are therefore not presented further here. The SS setting of the instrument was calibrated with monodisperse ammonium sulfate (AS) aerosol, produced by an atomizer and a scanning electrical mobility spectrometer (SEMS), both from Brechtel. By varying AS aerosol particle diameter (Dp), Dpcrit was determined for 0.1 %–0.47 % SS at the sampling site four times during the field studies. Subsequently, calibrations were made at 0.1 %–1.0 % SS in a more rigorous procedure in our laboratory at the Department of Environmental Science at Aarhus University, Risø Campus, Roskilde, Denmark. The combined experimentally obtained values for Dpcrit were compared with the corresponding calculated values obtained using the Köhler equation (Köhler, 1936) and AS bulk solution properties derived from the Extended Aerosol Inorganics Model (E-AIM) (Clegg et al., 1992; Wexler and Clegg, 2002). Hereby, a linear relationship between the SS set on the CCN counter (SSset) and the real SS value (SSreal) based on theory was established in the full range of 0.1 %–1.0 % SS (least-squares fit: , SDSS=0.031 %, r2=0.995) by applying a method similar to that used by Kristensen et al. (2012) and Nakao et al. (2014). The linear calibration curve is shown in Supplement 1 (Fig. S1). For convenience, the reported SS values in this paper are the SSset values. Quality control of CCN data was based on the achievement and stability of the CCN column temperature gradient and the stability of the instrument temperatures and flows. Additionally, CCN measurements recorded simultaneously with SMPS measurements that were discarded during quality control were removed from further consideration.
Aerosol Dpcrit was determined by sequential integration of simultaneously measured particle number size distributions and CCN concentrations at a given SS, decreasing Dpcrit until the following relationship was satisfied.
Here nN (Dp) is the particle number size distribution and Dpmax its upper limit, and CCNSS is the measured CCN concentration at a given SS. Particle losses inside the CCN counter were accounted for by applying a size-dependent transmission function (Rose et al., 2010) to particle number size distributions. With the obtained Dpcrit, the κ hygroscopicity parameter (κCCN value) was calculated according to Petters and Kreidenweis (2007):
where S is the saturation ratio, related to SS as . The above-described linear SS calibration curve was applied hereto. The constant A is defined as
where J m−2 is the surface tension of the air–water interface, T=298.15 ∘C is the standard temperature, ρw is the density of water at temperature T, R is the gas constant, and Mw is the molecular weight of water.
We found a discrepancy between the total particle number concentration measured by the CCN counter and the SMPS during the first 10 d of the spring study that we could not explain. We found that CCNmax was significantly higher than the simultaneous number concentration of particles larger than 25 nm (N25) measured with the SMPS. This could not be explained by non-isokinetic sampling conditions in the duct from which the CCN sample air was drawn (Supplement 2), decreased SMPS sample flow, or other irregularities. We suspect the discrepancy to be caused by conditions in the sampling duct, possibly turbulence, as a change in the position of the CCN sampling port in the duct remedied the situation. The discrepancy was observed during 20–30 April. As the SMPS serves as a long-term monitoring device, we choose to accept it as our reference instrument. The ratio serves as a tool for assessing the behavior of the CCN counter against the SMPS measurements. The ratio was on average 1.614 in the period 20–30 April, whereas it was 0.939 for the rest of the CCN measurement period. We observed a strong linear correlation between CCNmax and N25 for the period after 30 April. By plotting N25 as a function of CCNmax we observed that CCNmax increased by a constant factor during the period of discrepancy and that there seemed to be no patterns in the offset. Thus, we have chosen to include this period of discrepancy, as it contains highly valuable measurements. We corrected all measured CCN concentrations within this period with a constant factor so that matches that of the rest of the measurement period. A plot showing N25 as a function of CCNmax for both the uncorrected and corrected measurements before 30 April, as well as the remaining measurements after 30 April, is included in Supplement 3 (Fig. S2).
2.4 Particle hygroscopic growth factor
The particle hygroscopic growth factor was measured with a humidified tandem differential mobility analyzer (HTDMA) model 3100 from Brechtel (Lopez-Yglesias et al., 2014). The instrument measured HGF of particles with 30, 60, 120, and 240 nm dry diameter (Dpdry) at 85 % and 90 % RH. The HTDMA has a built-in aerosol dryer in the upstream classification unit. Due to the low ambient particle number concentrations in the high Arctic environment, the humidified size scans at each Dpdry were conducted over 10 min; also, scans with increasing and decreasing DMA voltage were averaged. This procedure ensured sufficient particle counts in most instances. Data inversion was done by an Igor® algorithm based on the principles in Stolzenburg and McMurry (2008) provided by Brechtel. As in the case of the CCN measurements, HGF measurements coinciding with polluted or faulty SMPS measurements were discarded. Moreover, maximum temperature changes of 1 ∘C h−1 during a humidified scan and minimum total particle concentrations of 1 cm−1 in the classified and humidified aerosol size spectra were used as quality control criteria.
The HTDMA system was fitted with an automatic atomizer setup, allowing for regular HGF control measurements of AS aerosol. Control measurements of 100 nm AS particles at 85 % and 90 % RH were conducted twice daily. Also, the consistency of the two particle sizing stages of the HTDMA was verified with size-certified polystyrene latex (PSL) spheres against a TSI 3080 SMPS system. We found that the set RH was reached within <2 % RH (absolute value) accuracy (Supplement 4). We used κ–Köhler theory to correct for these deviations (Petters and Kreidenweis, 2007). The κHTDMA value can be inferred from HTDMA measurements by
In this procedure, the actual operating RH, determined from AS control measurements, was used to calculate the κHTDMA value. The HGF at 85 % or 90 % RH was found by applying this κHTDMA value to the formula and determining HGF at the specific RH through an iterative approach described in Supplement 5. Ideally, the κ value of a multispecies aerosol can be determined by the κ-mixing rule:
where εi is the respective particle volume fraction of component i, and κi is the κ value for that component. This relationship can be used for κ values determined by both CCN and HGF measurements.
2.5 Determination of uncertainties
An iterative Monte Carlo approach was used to determine Dpcrit, κHTDMA, and the associated uncertainty of these parameters. The method is similar in concept to that used in Kristensen et al. (2016) and Herenz et al. (2018).
The counting process of the CCN counter was assumed to be Poisson. Hence, the standard deviation (SD) of the CCN concentration within the 5 min of data acquisition is related to the square root of total counts within that period. Even though the CCN concentration was generally low, the long data acquisition time resulted in counting SD rarely exceeding 1 %. The uncertainty of SMPS sizing and concentration was assumed to be normally distributed. When determining Dpcrit, the SD of the particle diameter was estimated to be 2.5 %, while an SD of 5 % was estimated for the particle number concentration. The value of Dpcrit was calculated according to Eq. (1), with the parameter values drawn randomly from normal distributions centered at the given value with the above-stated standard deviations. Each calculation was iterated 1000 times, and the final Dpcrit and its associated SD were determined by an automatic fit of a normal distribution to the obtained set of results. An example histogram from this procedure is given in Supplement 6 (Fig. S5).
To determine κHTDMA a similar approach as for Dpcrit was applied. The SD of RH found during the monitoring of the HTDMA RH was used, together with the same estimate of particle sizing uncertainty as above 2.5 %. Again, fitting normal distributions to the obtained set of results yielded values of κHTDMA with associated SD. The HGF at exactly 85 % and 90 % was then recalculated in accordance with Eq. (4), along with low and high estimates by subtracting from or adding the SD to κHTDMA.
Meaningful uncertainty intervals could not be determined for κCCN as Eq. (2) is highly sensitive to deviations in Dpcrit, resulting in skewed result distributions and unrealistic uncertainty intervals. Values of κCCN are therefore reported without an uncertainty interval, but it is noted that these quantities are inherently associated with large uncertainties.
2.6 Sampling setup
The SMPS sampled aerosols through a total air inlet designed and manufactured by TROPOS (Leipzig, Germany). The inlet was made of stainless steel, which sampled aerosols about 7 m a.g.l. (above ground level) and was heated to +5 ∘C to smoothly condition the aerosol to room air temperature where the aerosol instrumentation was placed. The total air inlet had an inner diameter of about 75 mm and was connected to an isokinetic flow splitter where the instruments were connected with in. conductive tubing. The SMPS sampled from this inlet for both campaigns, while the HTDMA and the CCN counter sampled from a stainless-steel inlet that was designed for gases but fulfilled the requirements for particle sampling during the spring field study. For the summer field study they sampled from a second total air inlet as described above. The SMPS was operated without a pre-impactor. Losses for the in. tubing downstream of the flow splitter and in the SMPS were accounted for in the inversion routine from TROPOS (Leipzig, Germany). The SMPS was running in parallel to a total CPC continuously for the spring field study; the measurements originating from the SMPS (integration) and total CPC agreed reasonably well (mean ratio of CPC to SMPS was 0.85). CPC measurements were unavailable for the summer field study. Meteorological parameters were measured at a 10 m mast next to the measurement hut and originated from an average of two sensors at each height (9 m height and 3 m height).
3.1 Meteorology
Figures 2 and 3 show the evolution of meteorological parameters during the two field studies. We use UVA radiation as a proxy for solar radiation, gas-phase photo-oxidation of organic compounds, and thus new particle formation and growth. Precipitation measurements were not available for 4–27 May. A power outage caused measurements of temperature, RH, radiation, wind speed, and pressure to fail from 25 August to 28 September. During this period, backup measurements of temperature, RH, wind speed, and pressure were available; however, a noticeable offset is seen for the pressure measurements.
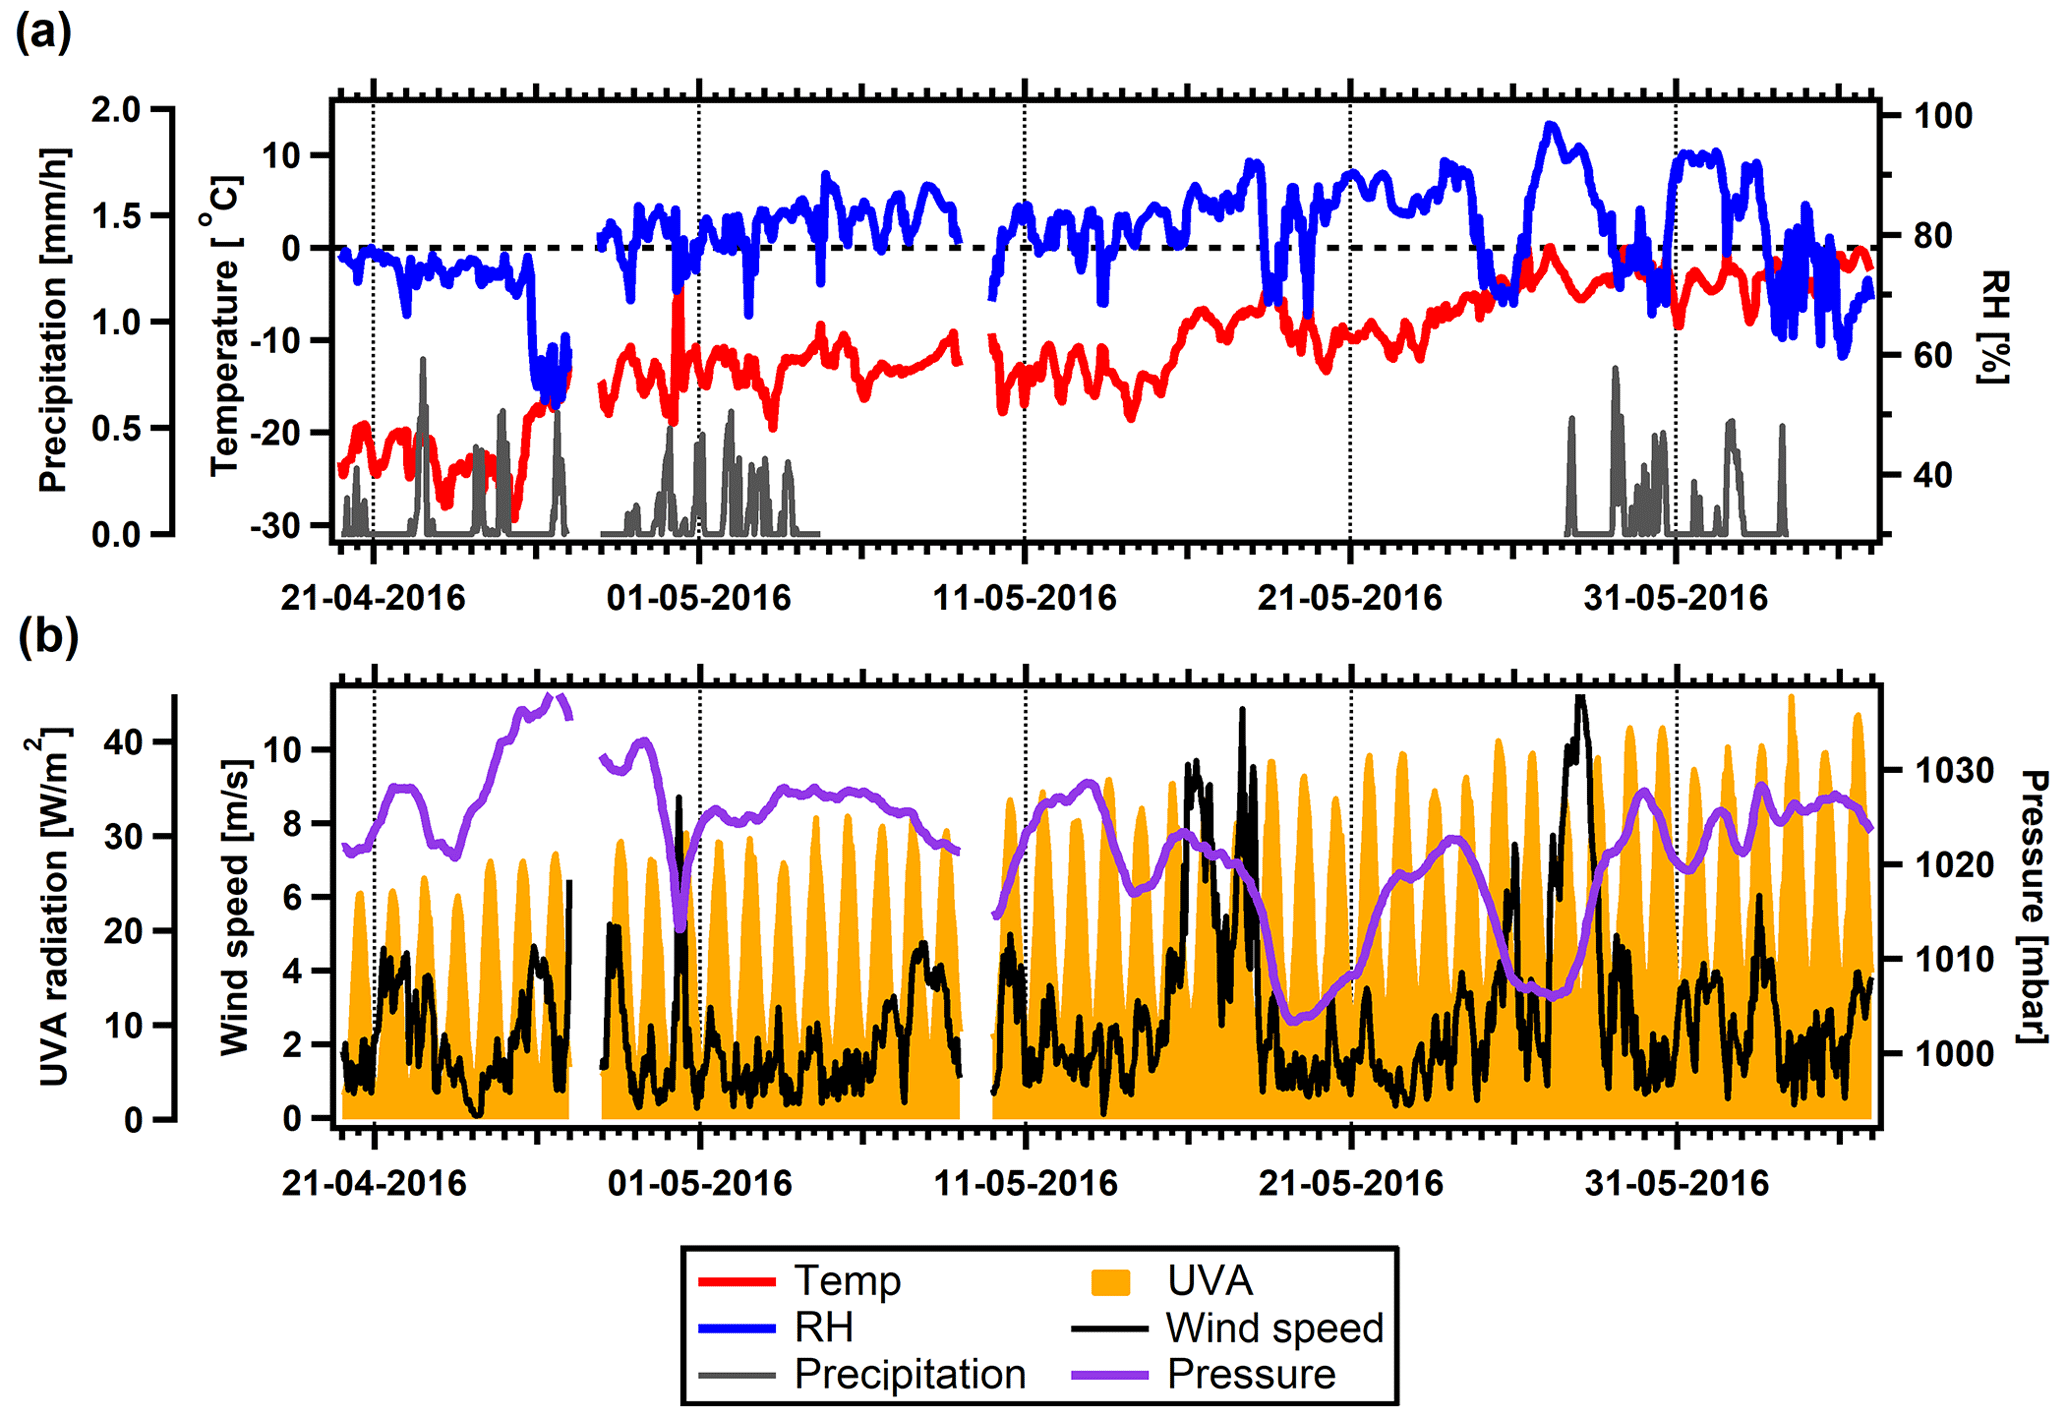
Figure 2Overview of meteorological conditions during the spring field study. (a) Temperature, RH, and precipitation. The dashed line indicates 0 ∘C. (b) UVA radiation, wind speed, and atmospheric pressure.
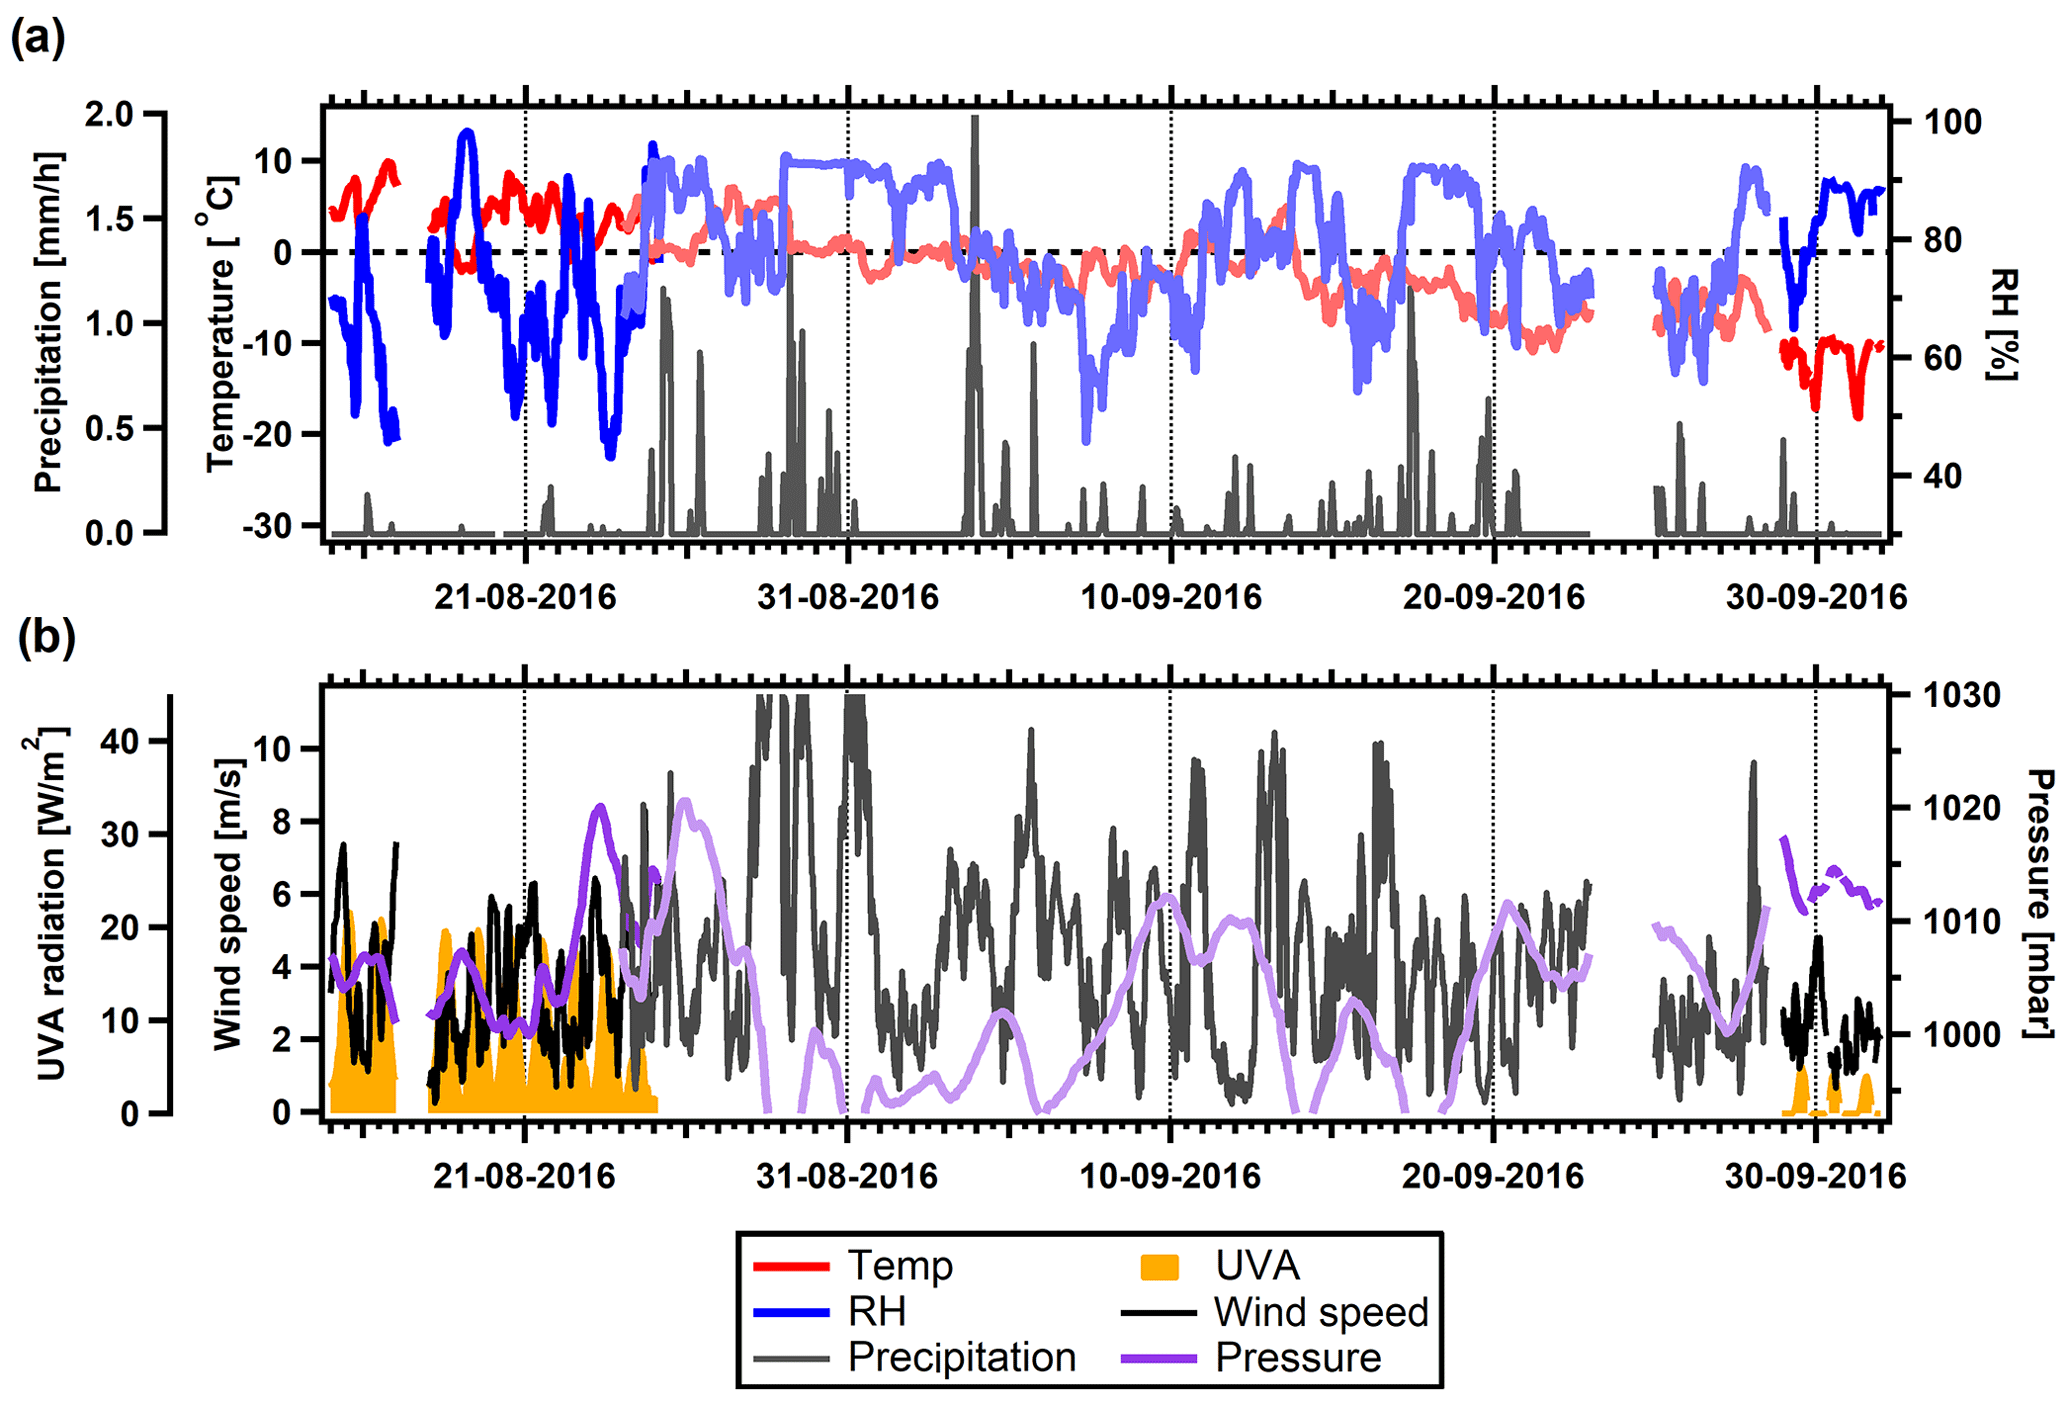
Figure 3Overview of meteorological conditions during the summer field study. Lighter shaded lines are backup measurements. (a) Temperature, RH, and precipitation. The dashed line indicates 0 ∘C. (b) UVA radiation, wind speed, and atmospheric pressure.
During the first weeks of the spring study (Fig. 2a) temperatures were low at about −30 to −10 ∘C, with occasional snowfall. Later in the study, the temperature increased to just below the freezing point, and the composition of the concurrent precipitation was probably a snow–rain mixture. RH ranged mostly between 70 % and 90 % with a short decrease on 26 April and occasional peaks later in the study. Time-lapse photography revealed that these peaks were associated with fog, and concurrent removal of accumulation-mode particles was also observed. The entire spring study occurred during polar day (Fig. 2b). Correspondingly, UVA radiation was present, with an increasing trend during the study. Atmospheric pressure was high, especially during the first period until 13 May, but occasions with air pressure drops and high wind speeds appeared several times in the latter half of this first study period.
During the summer field study, temperatures were mostly above freezing in August (Fig. 3a). Thereafter they decreased to −10 ∘C towards the end of the summer study period. RH was more variable in this period compared to spring, ranging from 50 % to 90 % RH. The beginning of the summer study was still conducted during polar day; however, the UVA radiation was decreasing and almost disappeared at the end of this study period. This is expected, as polar sunset occurred about 2 weeks after the conclusion of the study. Atmospheric pressure was lower in summer compared to spring, with several occasions of strong decreases in pressure and high wind speeds, especially the period of 28–31 August, which featured higher wind speeds.
3.2 Ambient particle number size distributions
The average ambient particle number size distributions during the two measurement periods shown in Fig. 4 are typical for Arctic conditions during spring and summer. During the first part of the spring period (20 April–8 May), a distinct accumulation mode is visible at approximately 100–300 nm. This is the characteristic Arctic haze mode, which predominantly consists of anthropogenic aerosols that are built up during winter and spring. In the second part of the spring period (9 May–2 June), the haze mode largely disappeared, and in turn, a nucleation mode appeared.
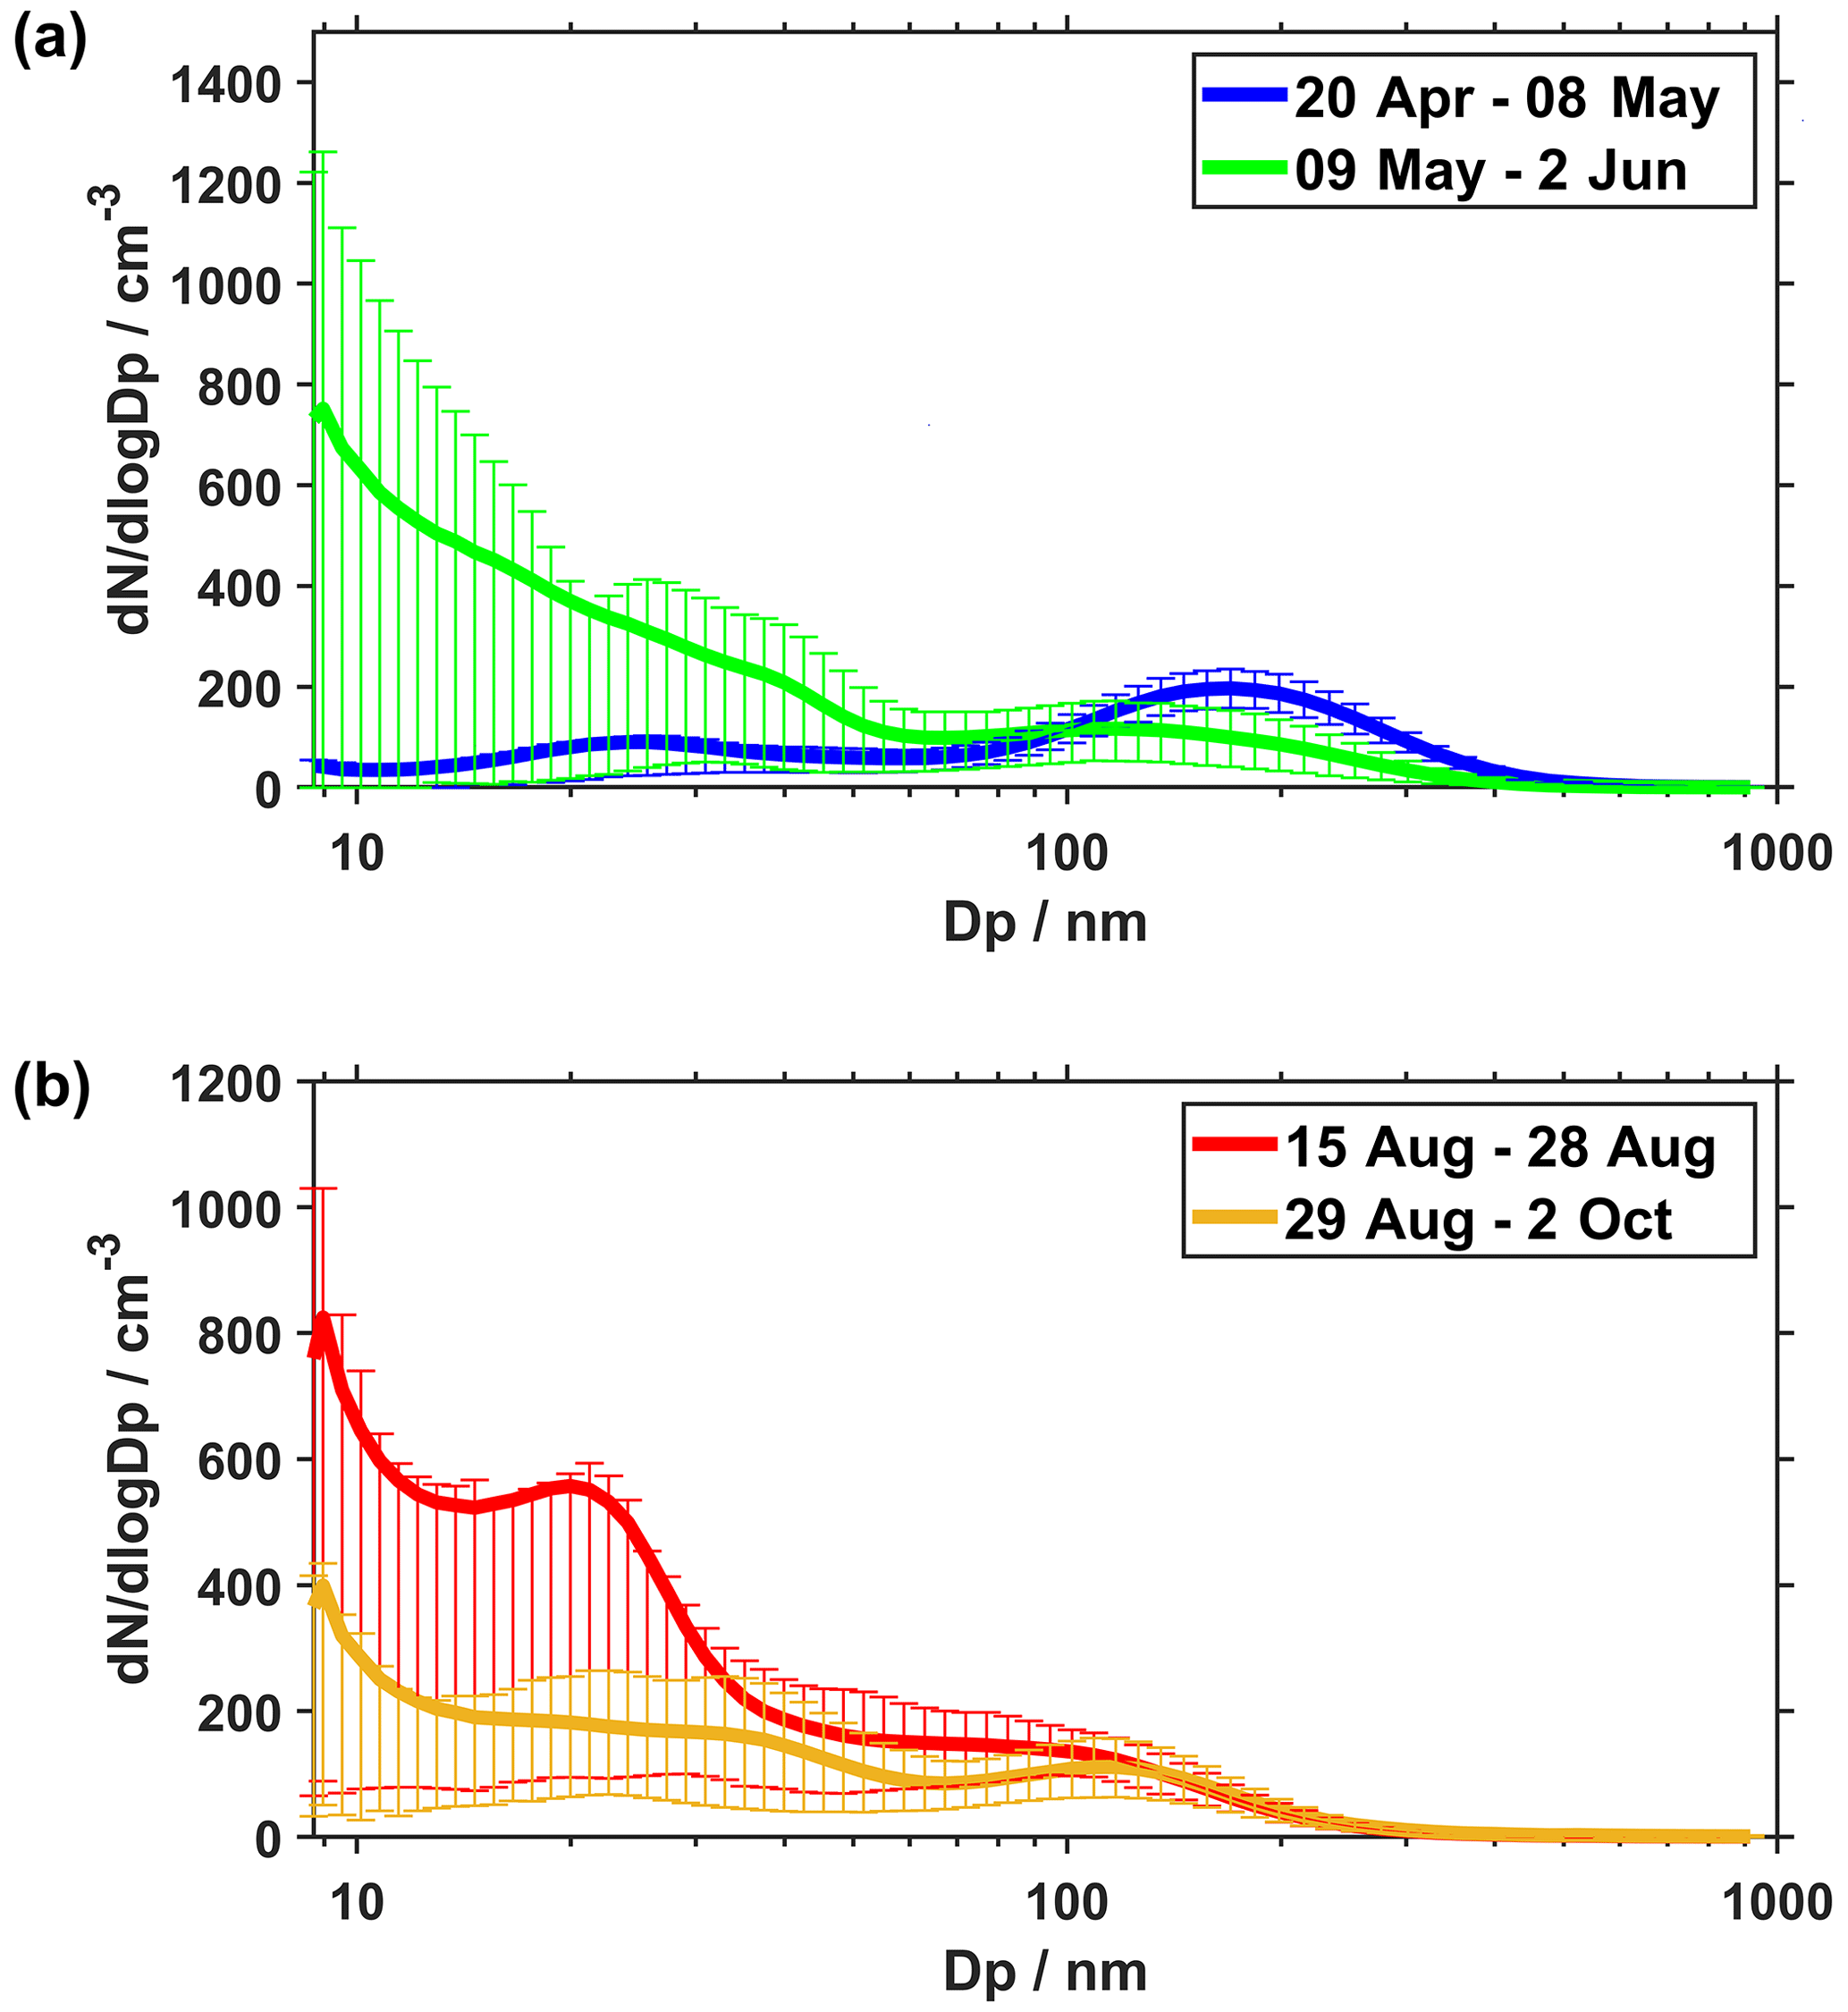
Figure 4Mean particle number size distributions during (a) the spring measurement period and (b) the summer measurement period. Error bars show 25th and 75th percentiles in each SMPS size bin over the respective period.
In the first part of the summer period (15–28 August), the nucleation mode had grown compared to the latter part of the spring study. An Aitken mode at around 20–30 nm can also be identified. This signifies that secondarily formed particles succeeded in growing into the Aitken mode. In the latter part of the summer period, the number of freshly formed particles decreased, and as an accumulation mode had not yet significantly developed, the total particle number concentration became low. The large uncertainty bars on the graphs show that deviations from the average distributions are quite large. For example, new particle formation still happened in the latter part of September, but on fewer occasions.
3.3 Cloud condensation nuclei
The time series of CCN concentration, Dpcrit, and κCCN for 0.1 %–1.0 % SS are shown for the spring period in Fig. 5 and the summer period in Fig. 6. In less than 0.1 % of all measurements at 1.0 % SS, a Dpcrit<25 nm can be identified. The average Dpcrit at ∼1.8 % SS was 33.7 nm, while the average activation fraction (), as mentioned in Sect. 2.3, was 0.939, which gives credibility to our CCN measurements.
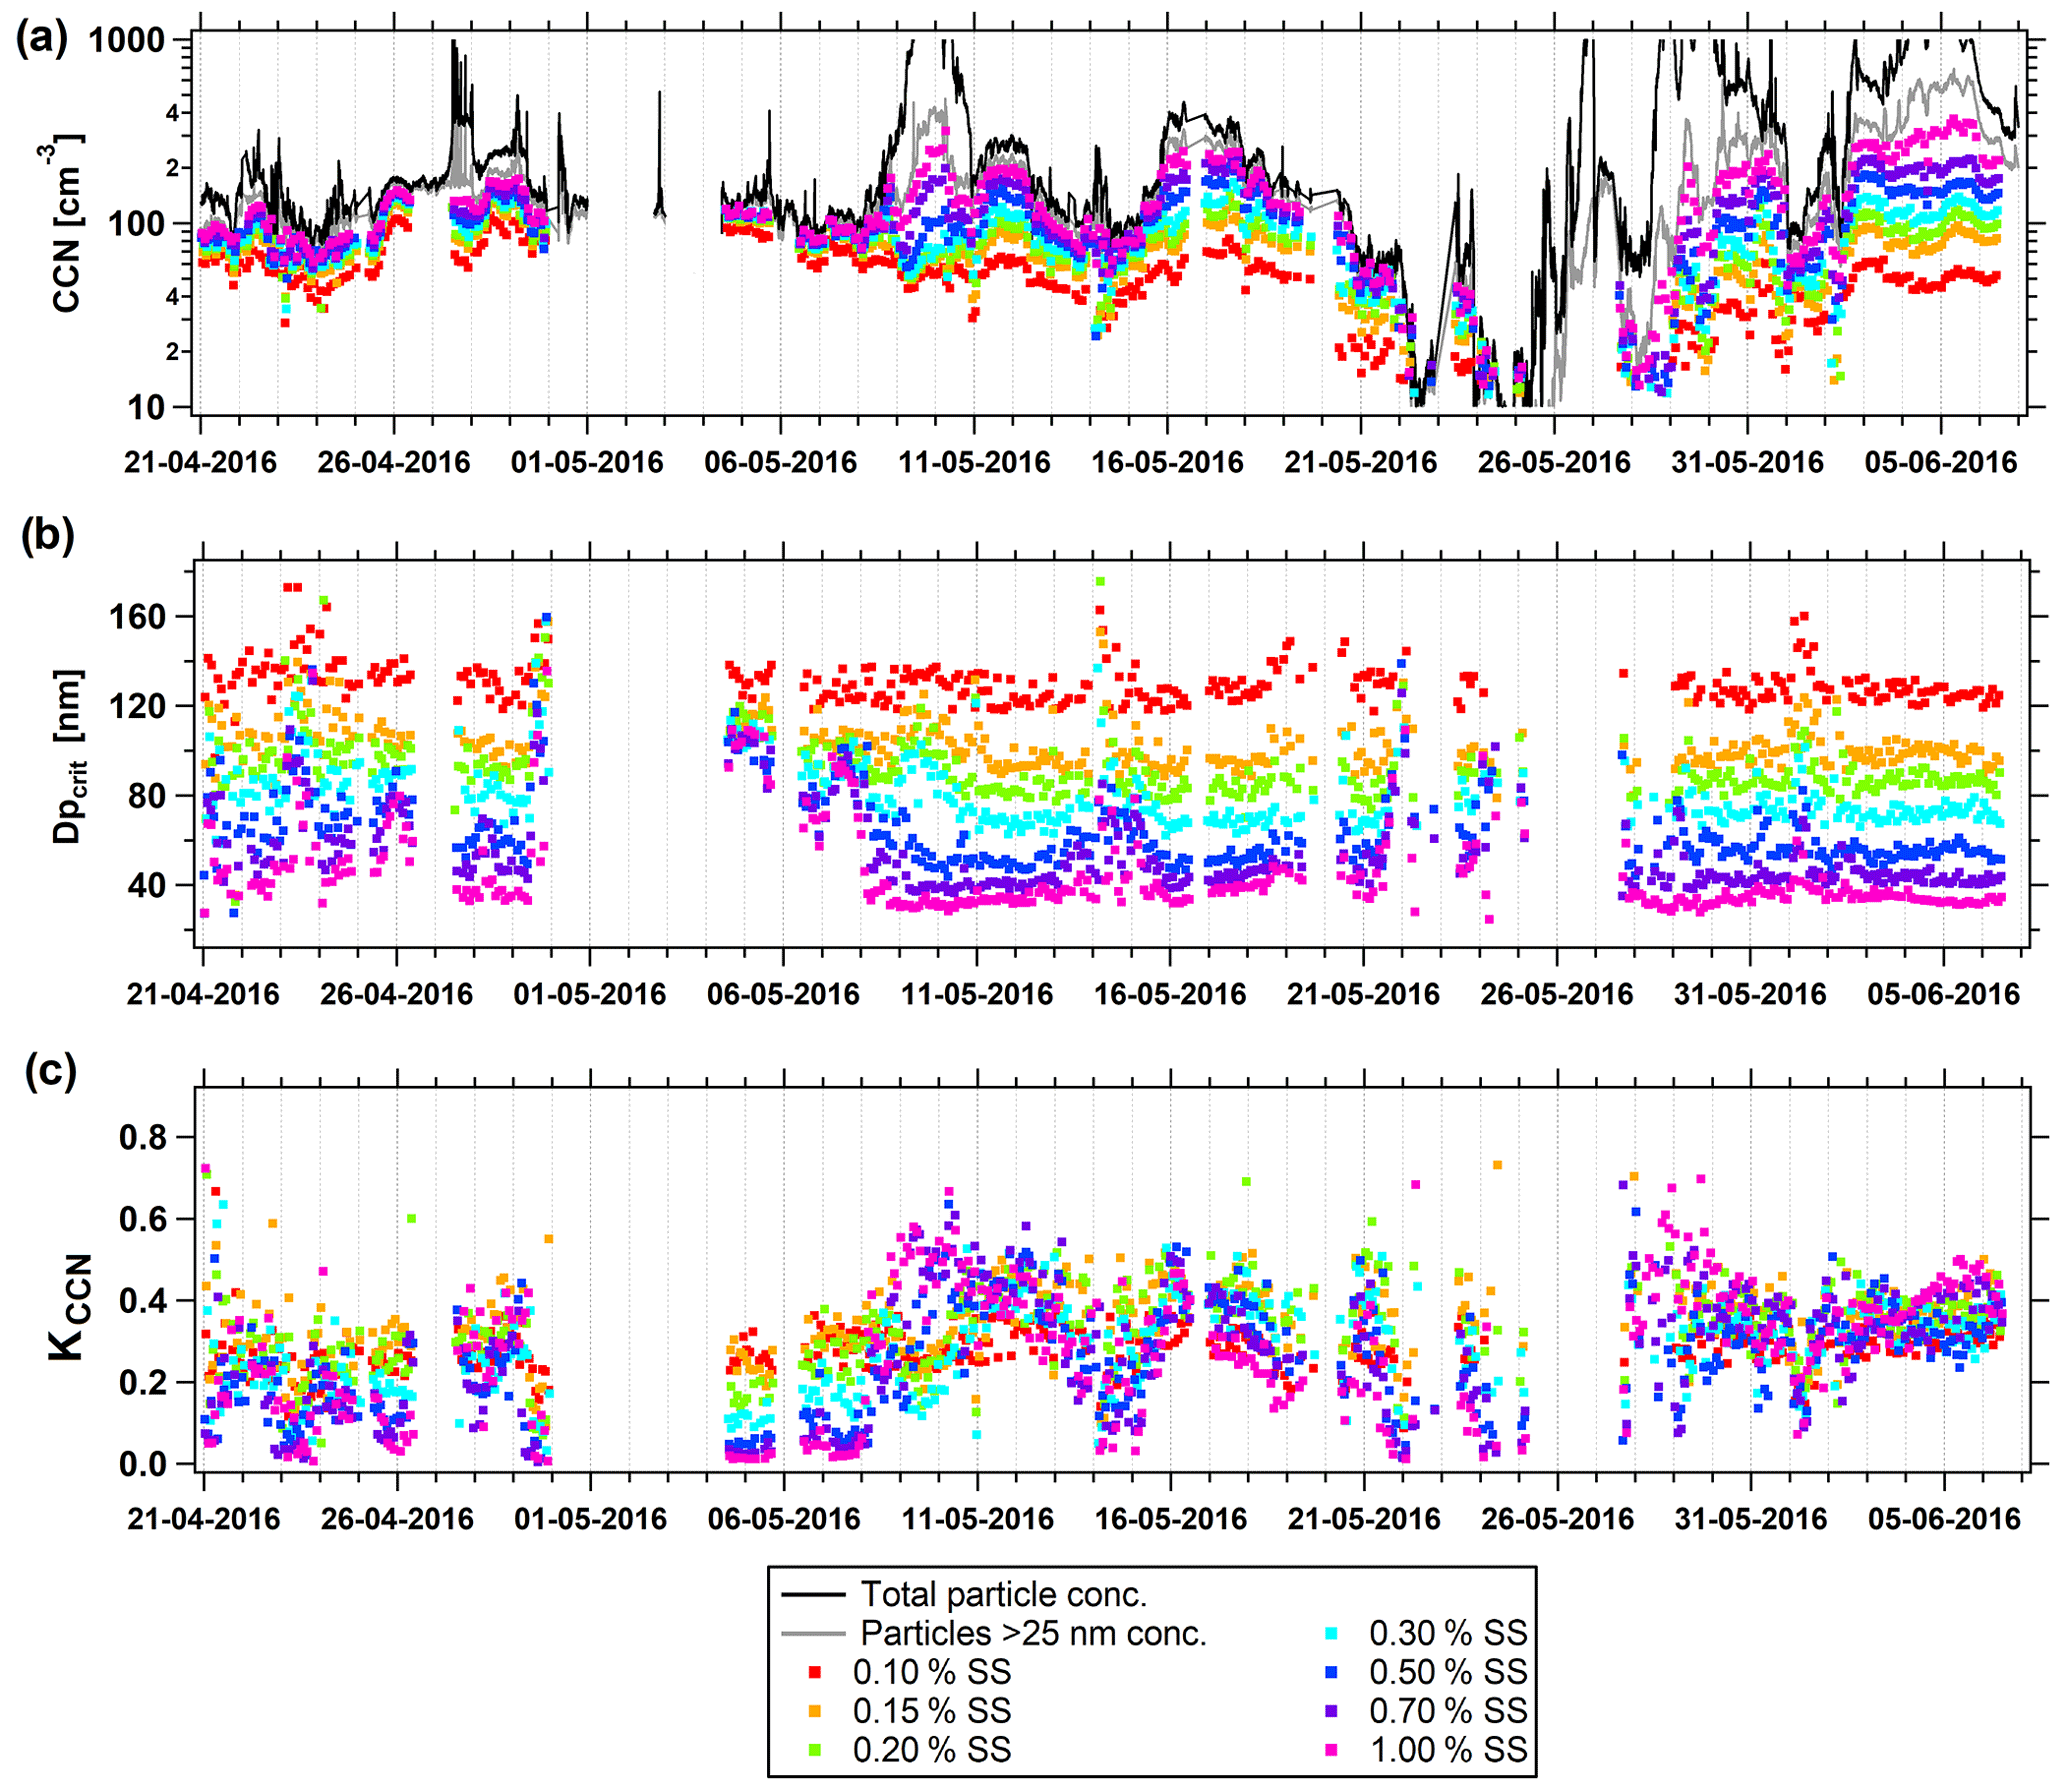
Figure 5CCN properties at various SSs during the spring measurement period. (a) Particle and CCN number concentration, (b) critical activation diameter (Dpcrit), and (c) κCCN value. Black line: total particle number concentration inferred from SMPS measurements (Ntot), gray line: number concentration of particles > 25 nm (N25), colored symbols: CCN measurements at 0.1 %–1.0 % SS.
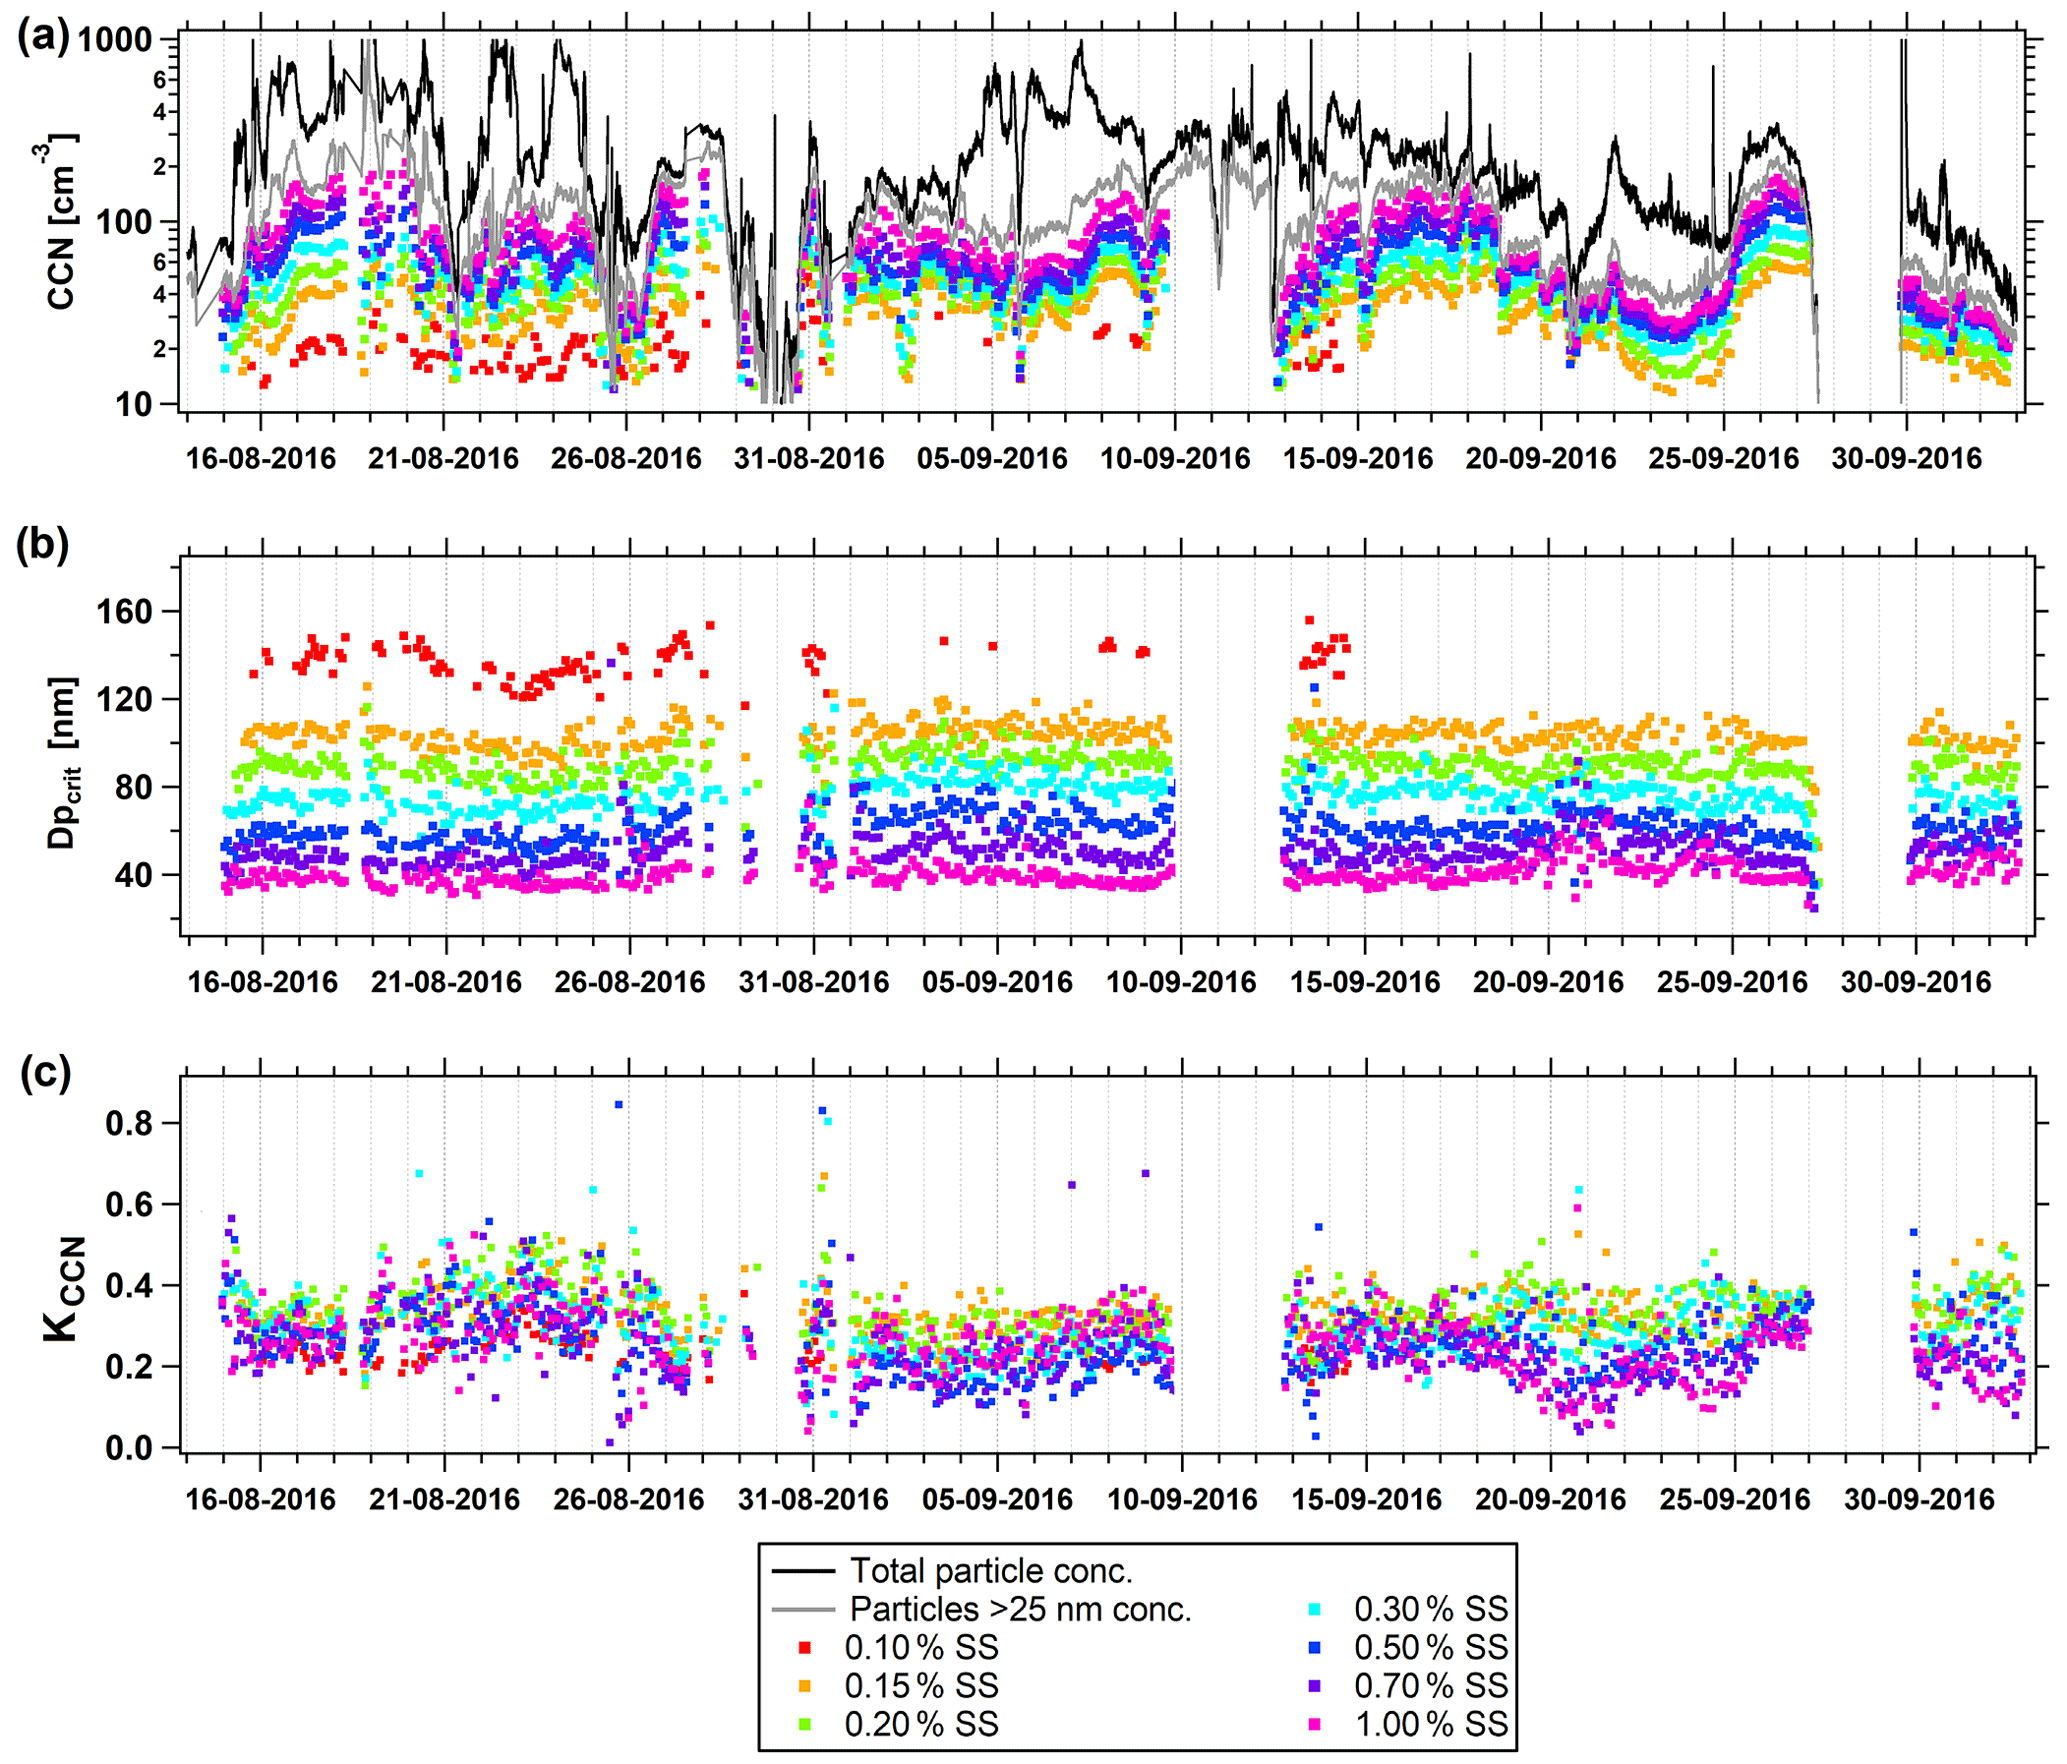
Figure 6CCN properties at various SSs during the summer measurement period. (a) Particle and CCN number concentration, (b) critical activation diameter (Dpcrit), and (c) κCCN value. Black line: total particle number concentration inferred from SMPS measurements (Ntot), gray line: number concentration of particles > 25 nm (N25), colored symbols: CCN measurements at 0.1 %–1.0 % SS.
Up to 8 May, CCN concentrations at varying SSs follow a similar pattern and differences between the values are relatively small (Fig. 5). From then and ongoing, differences for measured CCN concentrations are much larger across all SSs. This indicates that before 8 May a quite homogenous aerosol was observed, with the activation of particles with smaller diameters at higher SS not appreciably changing the total number of activated particles because accumulation-mode particles dominated during this period. In contrast, during the latter period (9 May–2 June), applied SS played a more critical role with respect to the total number of activated particles. While there was little difference between CCN0.1 and CCN1.0 at the beginning of the spring field study, the difference between these two parameters was larger towards its end (Fig. 5). A subsequent increase in SS led to more activated particles in the Aitken-mode range, identifying the importance of Aitken-mode aerosol during this period. The days around 8 May seem to mark a transition from the typical Arctic haze period in late winter–early spring to the late spring–summer regime wherein transport of air masses from midlatitudes to the high Arctic is minimized. This is supported by a significant decrease in non-sea-salt sulfate concentrations measured at Villum during the same period (see Skov et al., 2017, for further details and filter pack data from the EBAS database, https://ebas.nilu.no/, last access: 21 October 2021).
It is interesting to note that while Dpcrit varies at the higher supersaturations, it appears almost constant at 0.1 % and 0.15 % SS (Fig. 5b). Correspondingly, Dpcrit and κCCN values at 0.1 and 0.15 % SS show the smallest temporal variation throughout the spring field study from all the listed supersaturations (Table 2). This behavior could be explained by a relatively unchanged chemical composition of the larger accumulation-mode particles that activated at these lower SSs. A general trend is that the spread of CCN concentrations seen at different SSs increased during the second part of the spring field study (Fig. 5a). Further CCN property statistics are given in Tables 2 and 3.
Table 2Statistics of CCN measurements for the spring field study. The uncertainty values stated with CCN mean, CCN median, Dpcrit mean, and Dpcrit median are the respective statistics of the associated uncertainty found in the fitting procedure. The values of SD are the standard deviations of the parameter distributions over the temporal evolution of the study. The asterisk (*) signifies a significant difference between spring and summer field studies (Wilcoxon rank sum test, p<0.05). CCN measurements for the spring field study were obtained from 20 April to 6 June.
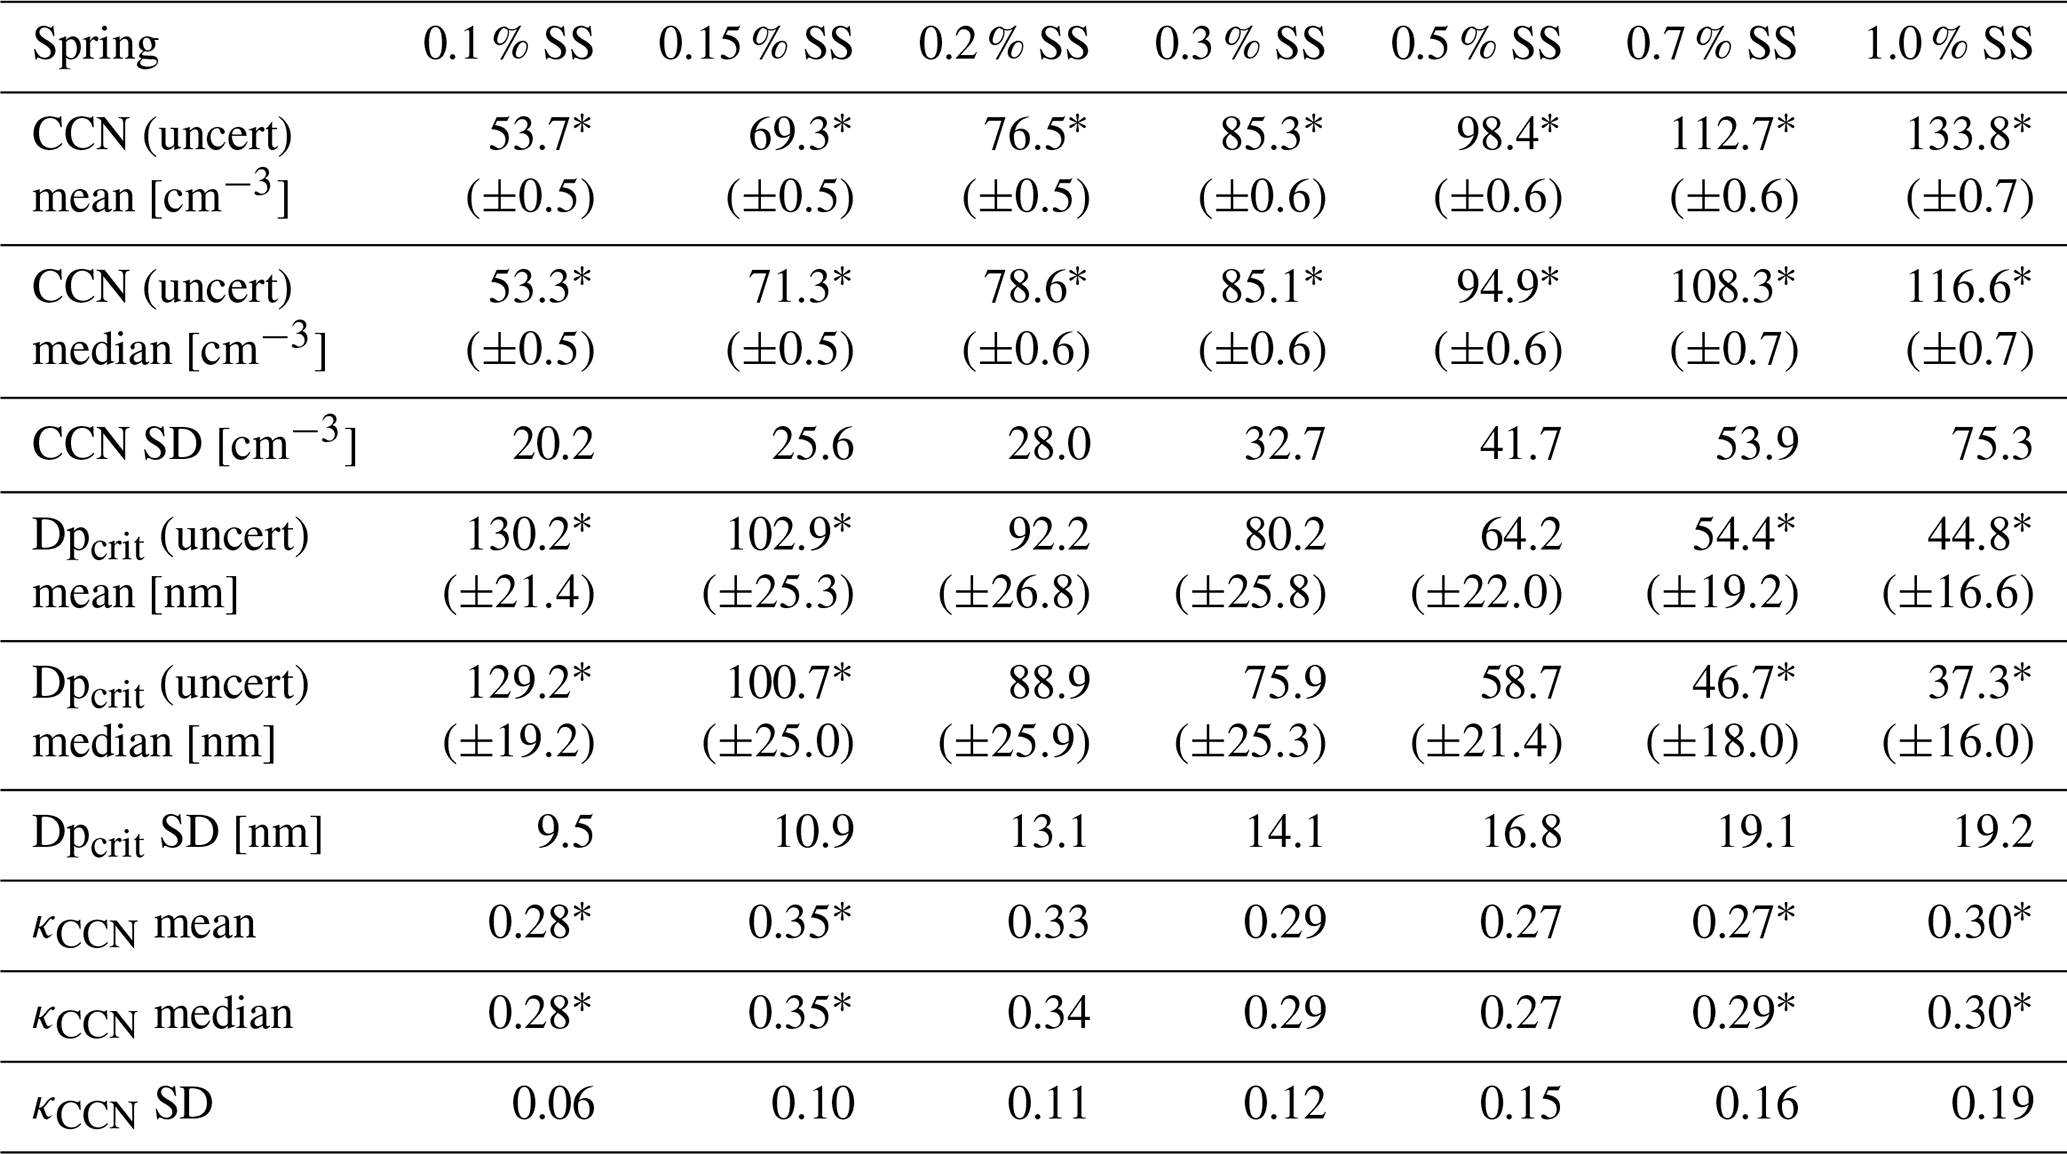
Table 3Statistics of CCN measurements for the summer field study. The uncertainty values stated with CCN mean, CCN median, Dpcrit mean, and Dpcrit median are the respective statistics of the associated uncertainty found in the fitting procedure. The values of SD are the standard deviations of the parameter distributions over the temporal evolution of the study. The asterisk (*) signifies a significant difference between spring and summer field studies (Wilcoxon rank sum test, p<0.05). CCN measurements for the summer field study were obtained from 15 August to 2 October.
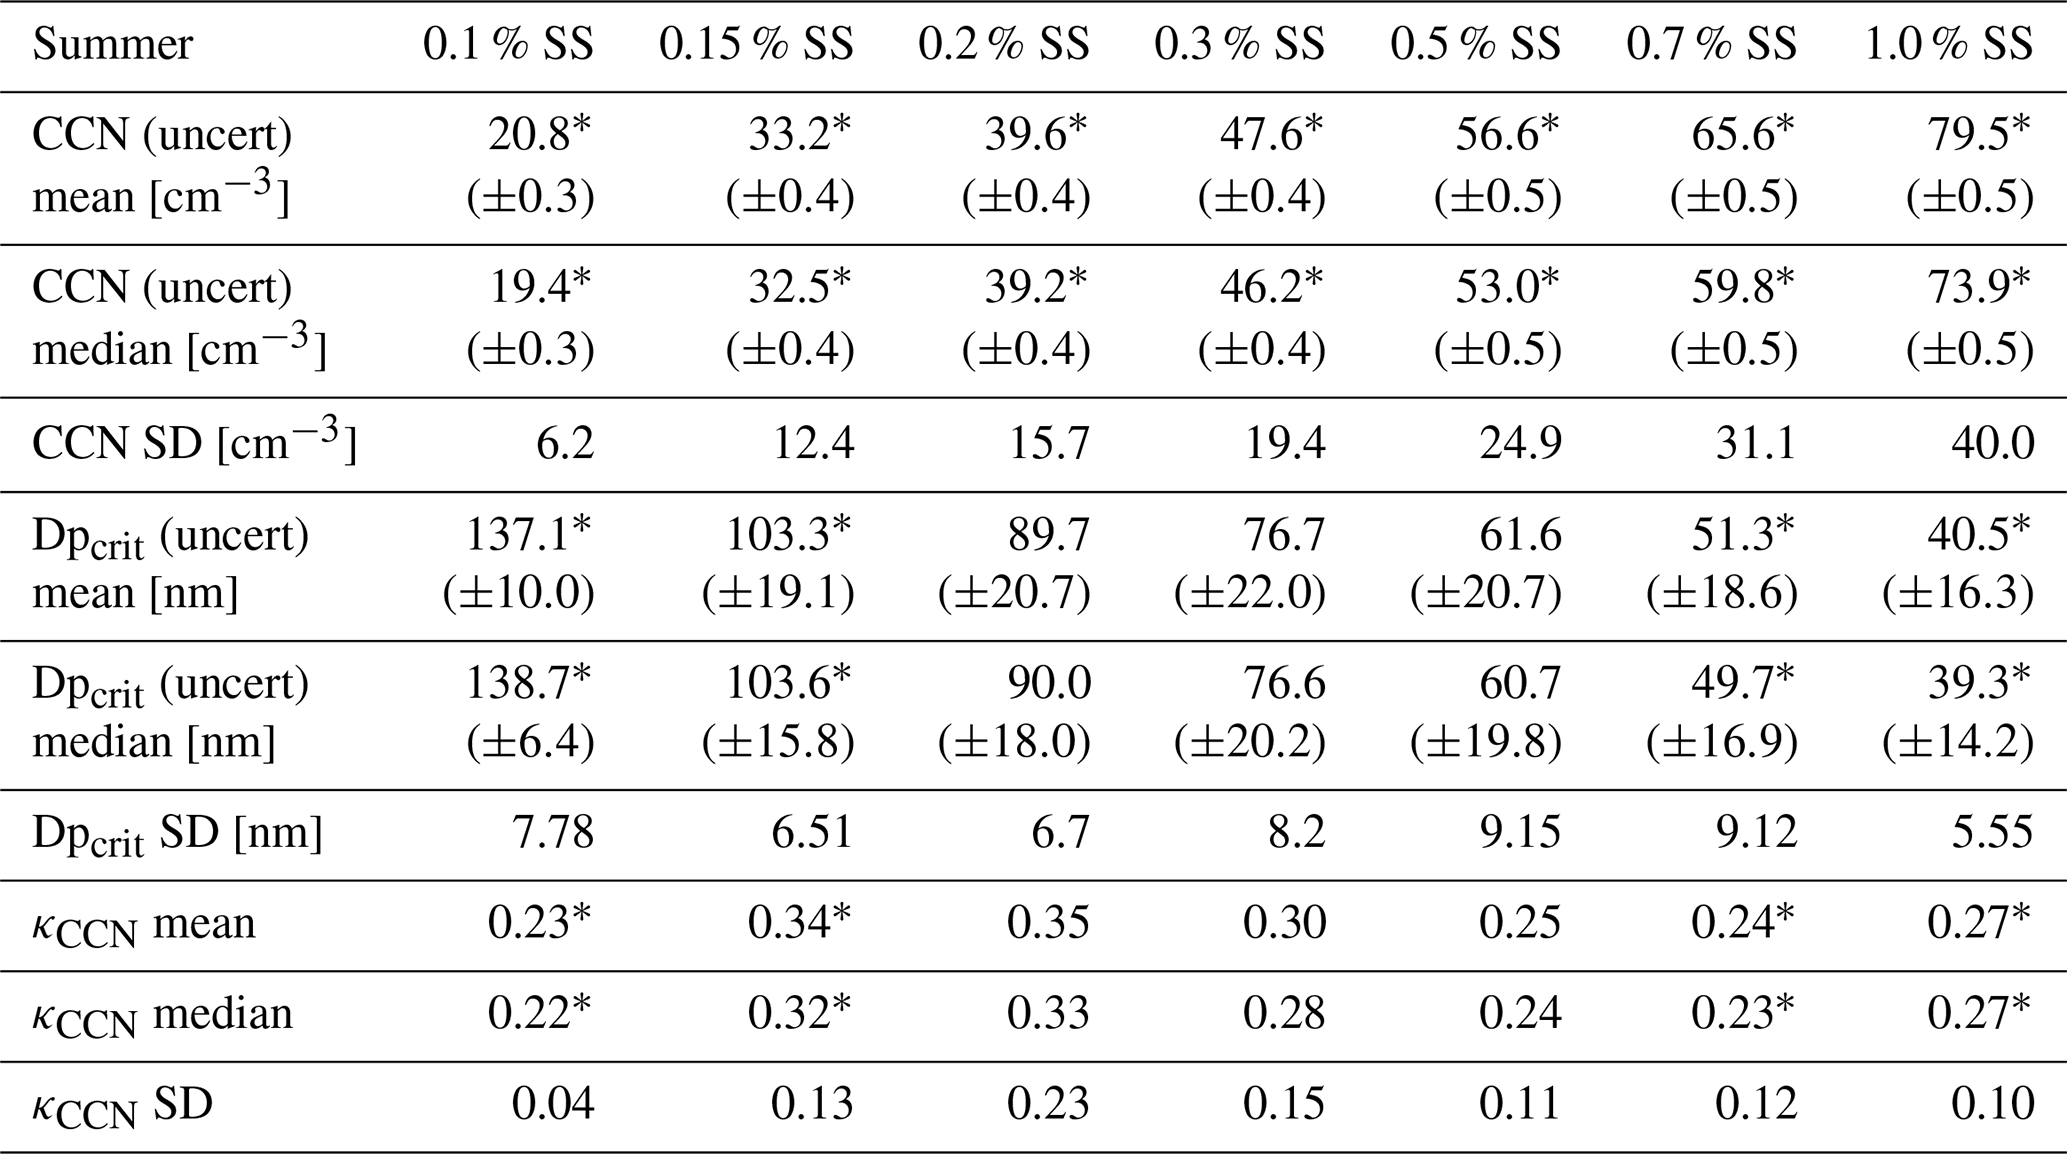
The summer field study is characterized by relatively small variations of the observed critical diameters and corresponding κ values. This finding indicates a relatively stable and homogeneous chemical composition over the whole summer period of observations, which is not surprising as the high Arctic summer aerosol is dominated by local and regional emissions. Simultaneously, relatively high variations are observed in the number of total activated particles, with all SSs showing similar patterns. An explanation for this finding might be relatively stable emission sources and processing pathways, with the emission source strength varying, which results in a stable shape of the particle number size distribution with varying total particle number concentration. As observed during the second period of the spring field study, differences in activated particle numbers at different applied SSs are still relatively large. This indicates a dominating Aitken mode with higher SSs activating larger fractions (lower Dpcrit) of this aerosol mode, which predominantly originates from local and regional emissions.
The difference between the mean and median values in Tables 2 and 3 illustrates to what extent extreme values influence the respective parameters. Symmetric distributions have equal values of mean and median, and hence differences are caused by skewed distributions. The mean CCN concentration was influenced by low concentrations during the spring study for 0.15 %–0.2 % SS, while higher concentrations elevated the mean above the median for 0.5 %–1.0 % SS. Elevated mean CCN concentrations were observed for all supersaturations during the summer field study, although mean and median values were within the uncertainty range for 0.15 %–0.3 % SS. Given the low aerosol concentrations during the summer, any perturbation in the CCN burden will elevate the mean. The stated standard deviation for CCN, Dpcrit, and κCCN signifies the temporal variation of these properties. For Dpcrit, the standard deviation was smaller for the summer study compared to spring. Meanwhile, Dpcrit median was consistently larger during summer compared to spring. Median and mean κCCN values were consistently larger in spring compared to summer. The standard deviation of κCCN was larger at 0.15 %–0.3 % SS during summer but larger at 0.5 %–1.0 % SS during spring. This indicates that particles in the accumulation-mode range, with Dpcrit of about 70–100 nm, had a more variable chemical composition during summer, while Aitken-mode particles, with Dpcrit∼35–60 nm, had a more variable chemical composition during the spring measurement period. Thus, it can be concluded that sources of accumulation-mode particles were more stable and consistent in spring, while they were more variable and diverse in summer. Conversely, sources of Aitken-mode particles were more variable in spring and more stable and confined in summer.
Except for the total CCN measured at different supersaturations, significant differences for the retrieved hygroscopicity parameters Dpcrit and κCCN (mean and median) were observed only for the two lowest and the two highest supersaturations. As low supersaturations – based on our cumulative approach to retrieve Dpcrit and therewith κCCN – are mostly affected by the larger particles, we conclude that there are substantial differences in the chemical composition of the larger particles between the two seasons. As high supersaturations are mostly affected by the whole size distribution including the very small particles, we can also conclude that there are differences in the chemical composition of the smallest particles between the two seasons. This is supported by the chemical composition of nucleating vapors at Villum (Beck et al., 2021), which showed that during the spring iodic acid is the main precursor vapor, while in the summer sulfuric acid and ammonium become the dominant precursor species. These differences between the seasons for different sizes are somewhat expected as the spring particle number size distribution is mostly affected by processed and larger particles compared to the summer when freshly and locally formed particles affect the particle number size distribution.
We deliberately choose to report the total mean and median values of the entire set of calculated uncertainties, rather than combining the uncertainties by dividing the standard deviation by the square root of the number of samples. This is because the individual sample points cannot be assumed to sample the same quantity. As the aerosol changed with time, the CCN measurement process sampled a changing variable. Hence, the individual measurements did not sample identical probability distribution functions, and the traditional approach for finding the error of the mean is not valid.
During late summer, on 31 August, an increased κCCN of 0.79 at 0.3 % occurred with high wind speeds from the direction of the unfrozen fjord, linking this measurement with hygroscopic sea spray aerosols (Martensson et al., 2003; de Leeuw et al., 2011). This is further supported by the concurrent ambient number size distributions (Fig. S6), which showed a bimodal appearance that is indicative of sea spray aerosol (Quinn et al., 2017).
3.4 Particle hygroscopic growth factor
To compensate for RH deviations inside the HTDMA, we determined the κHTDMA according to the method described in Sect. 2.4 and recalculated the HGF at exact values of 85 % and 90 % RH. The time series of these recalculated particle hygroscopic growth factors are presented for the spring study in Fig. 7 and the summer study in Fig. 8. In only very rare cases did we observe bimodal HGF distributions (2.4 % in spring, 0.2 % in summer), signifying a predominantly internally mixed aerosol for both study periods. These instances are neglected, and an internal mixture is assumed at all times.
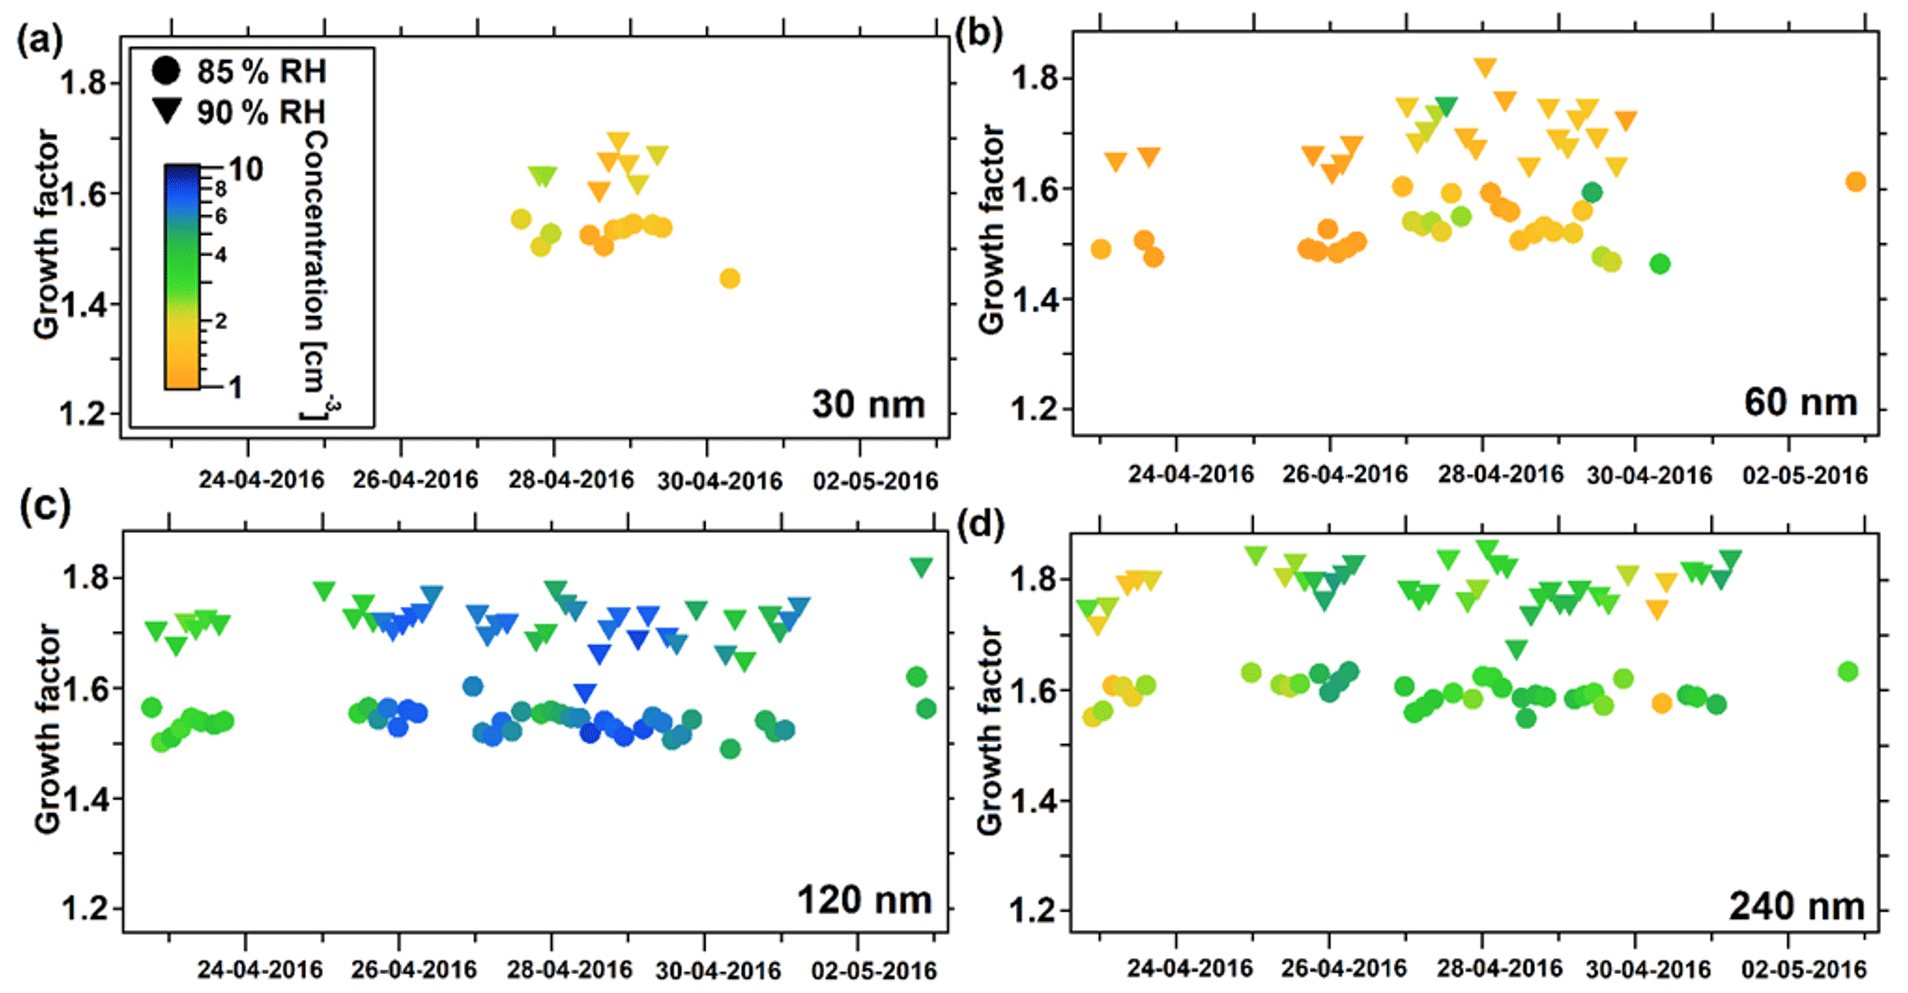
Figure 7Particle hygroscopic growth factors during the spring study. (a) Growth factors at 30 nm Dpdry, (b) at 60 nm Dpdry, (c) at 120 nm Dpdry, and (d) at 240 nm Dpdry. Dots represent values at 85 % RH and triangles at 90 % RH. The color indicates the raw particle number concentration measured at that certain Dpdry, downstream of the first and upstream of the second DMA.
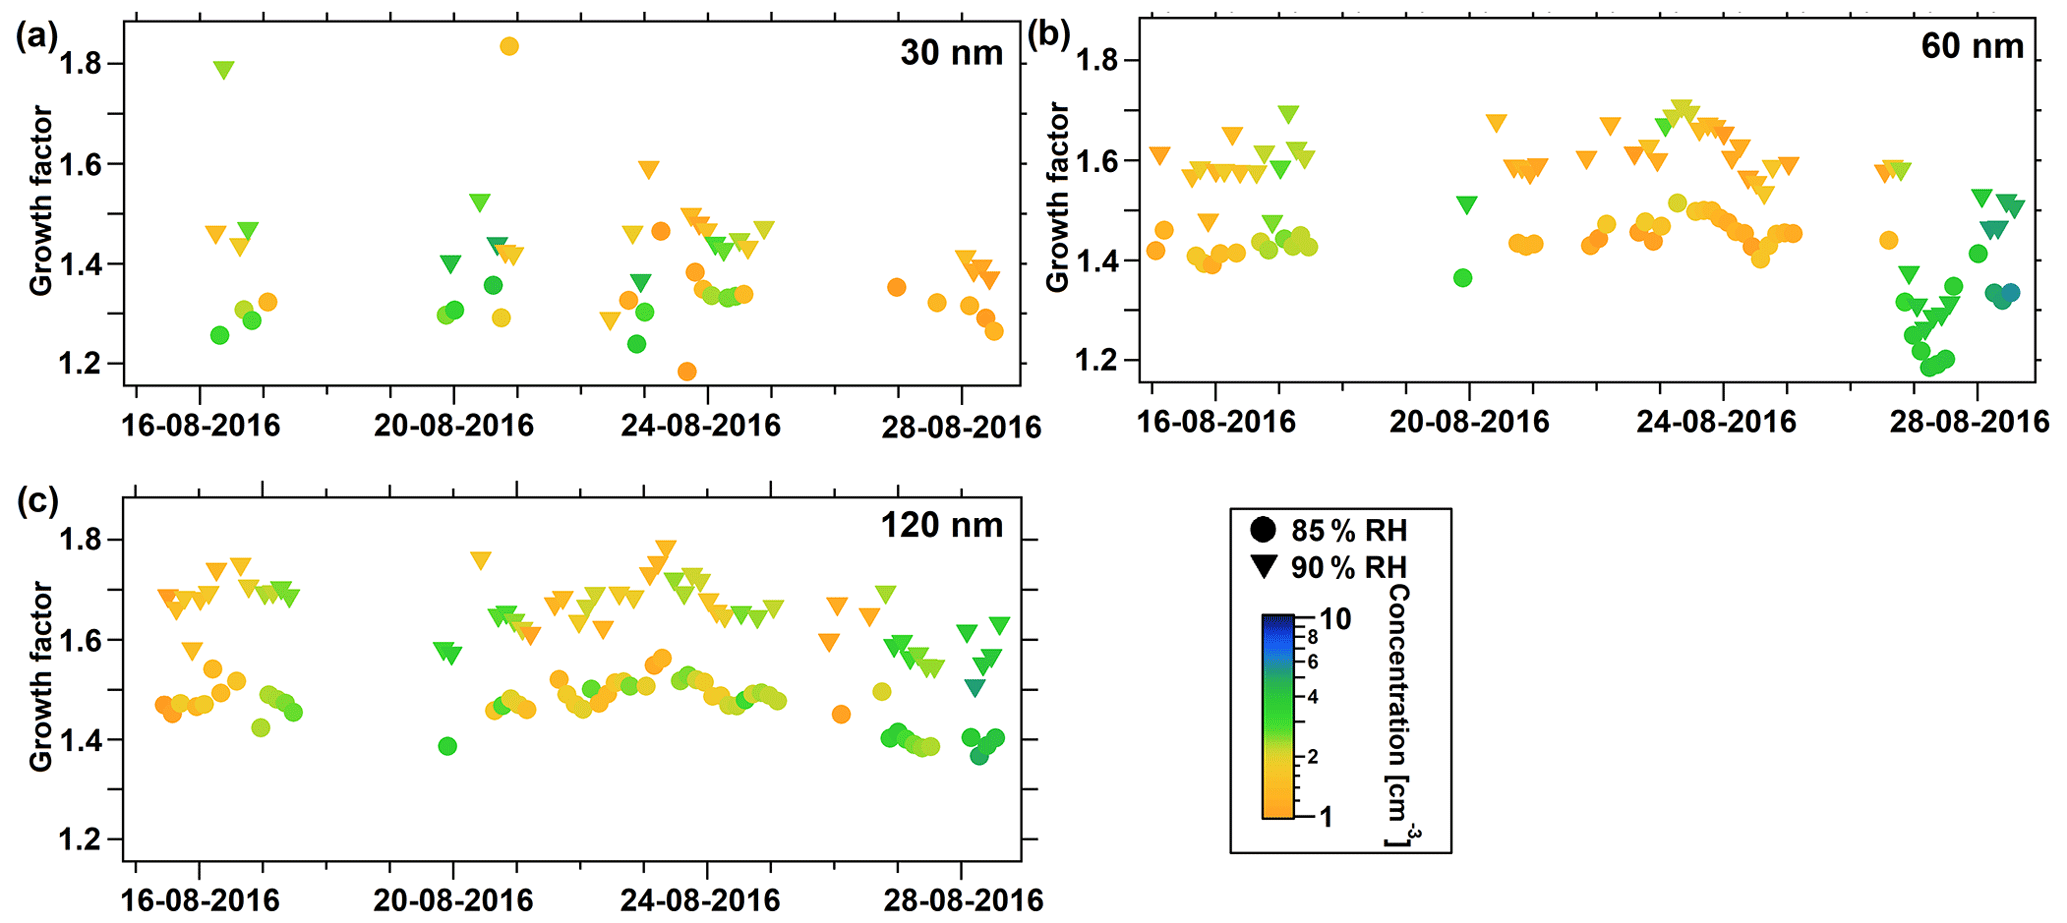
Figure 8Particle hygroscopic growth factors during the summer study. (a) Growth factor at 30 nm Dpdry, (b) at 60 nm Dpdry, and (c) at 120 nm Dpdry. Dots represent values at 85 % RH and triangles at 90 % RH. The color indicates the raw particle number concentration measured at that certain Dpdry, downstream of the first and upstream of the second DMA.
Figure 7a contains fewer data points than the other panels. This was caused by the particle concentrations observed at 30 nm Dpdry during the spring study period that were often too low. The HGFs at 85 and 90 % followed similar trends for all selected dry particle diameters. Generally, hygroscopic growth factors did not vary greatly during the spring study, but it appears that variations were slightly stronger at 90 % compared to 85 % RH as expected. There was a general increase in HGF with increasing Dpdry, which is further shown in Table 4. In general, relatively high HGFs were found for the spring campaign, assuming ammonium sulfate or ammonium bisulfate to be a major compound of the observed aerosol. While κHTDMA mean values range between 0.54 and 0.60 at 85 % RH and between 0.46 and 0.51 at 90 % RH (Table 4), for comparison a theoretical value for ammonium sulfate is calculated as 0.49 at 89.7 % RH and 0.53 at 84.8 % RH using the E-AIM (Clegg et al., 1998). Calculated values using the same model for ammonium bisulfate are 0.56 at 89.8 % RH and 0.61 at 84.9 % RH. The occurrence of partly un-neutralized aerosols was found earlier by Nielsen et al. (2019) during a spring study in 2015 using a soot particle–aerosol mass spectrometer (SP-AMS), which is in accordance with our findings here. The overall HGF timeline shows a relatively stable aerosol, especially for accumulation-mode particles with respect to subsaturated hygroscopic growth, which might be related to a transport period including predominantly haze aerosol with little variation. This finding can be confirmed by the small dependence of total CCN on different SSs, implying that the majority of the particles are linked to an accumulation mode.
Table 4Statistics of HTDMA measurements during the spring study. The stated uncertainties are the respective statistics of the associated uncertainty retrieved from the fitting procedure as described in Sect. 2.5. The values of SD are the standard deviations of the parameter distributions over the temporal evolution of the studies. The asterisk (*) signifies a significant difference between spring and summer field studies (Wilcoxon rank sum test, p<0.05). HTDMA measurements for the spring field study were obtained from 22 April to 2 May.
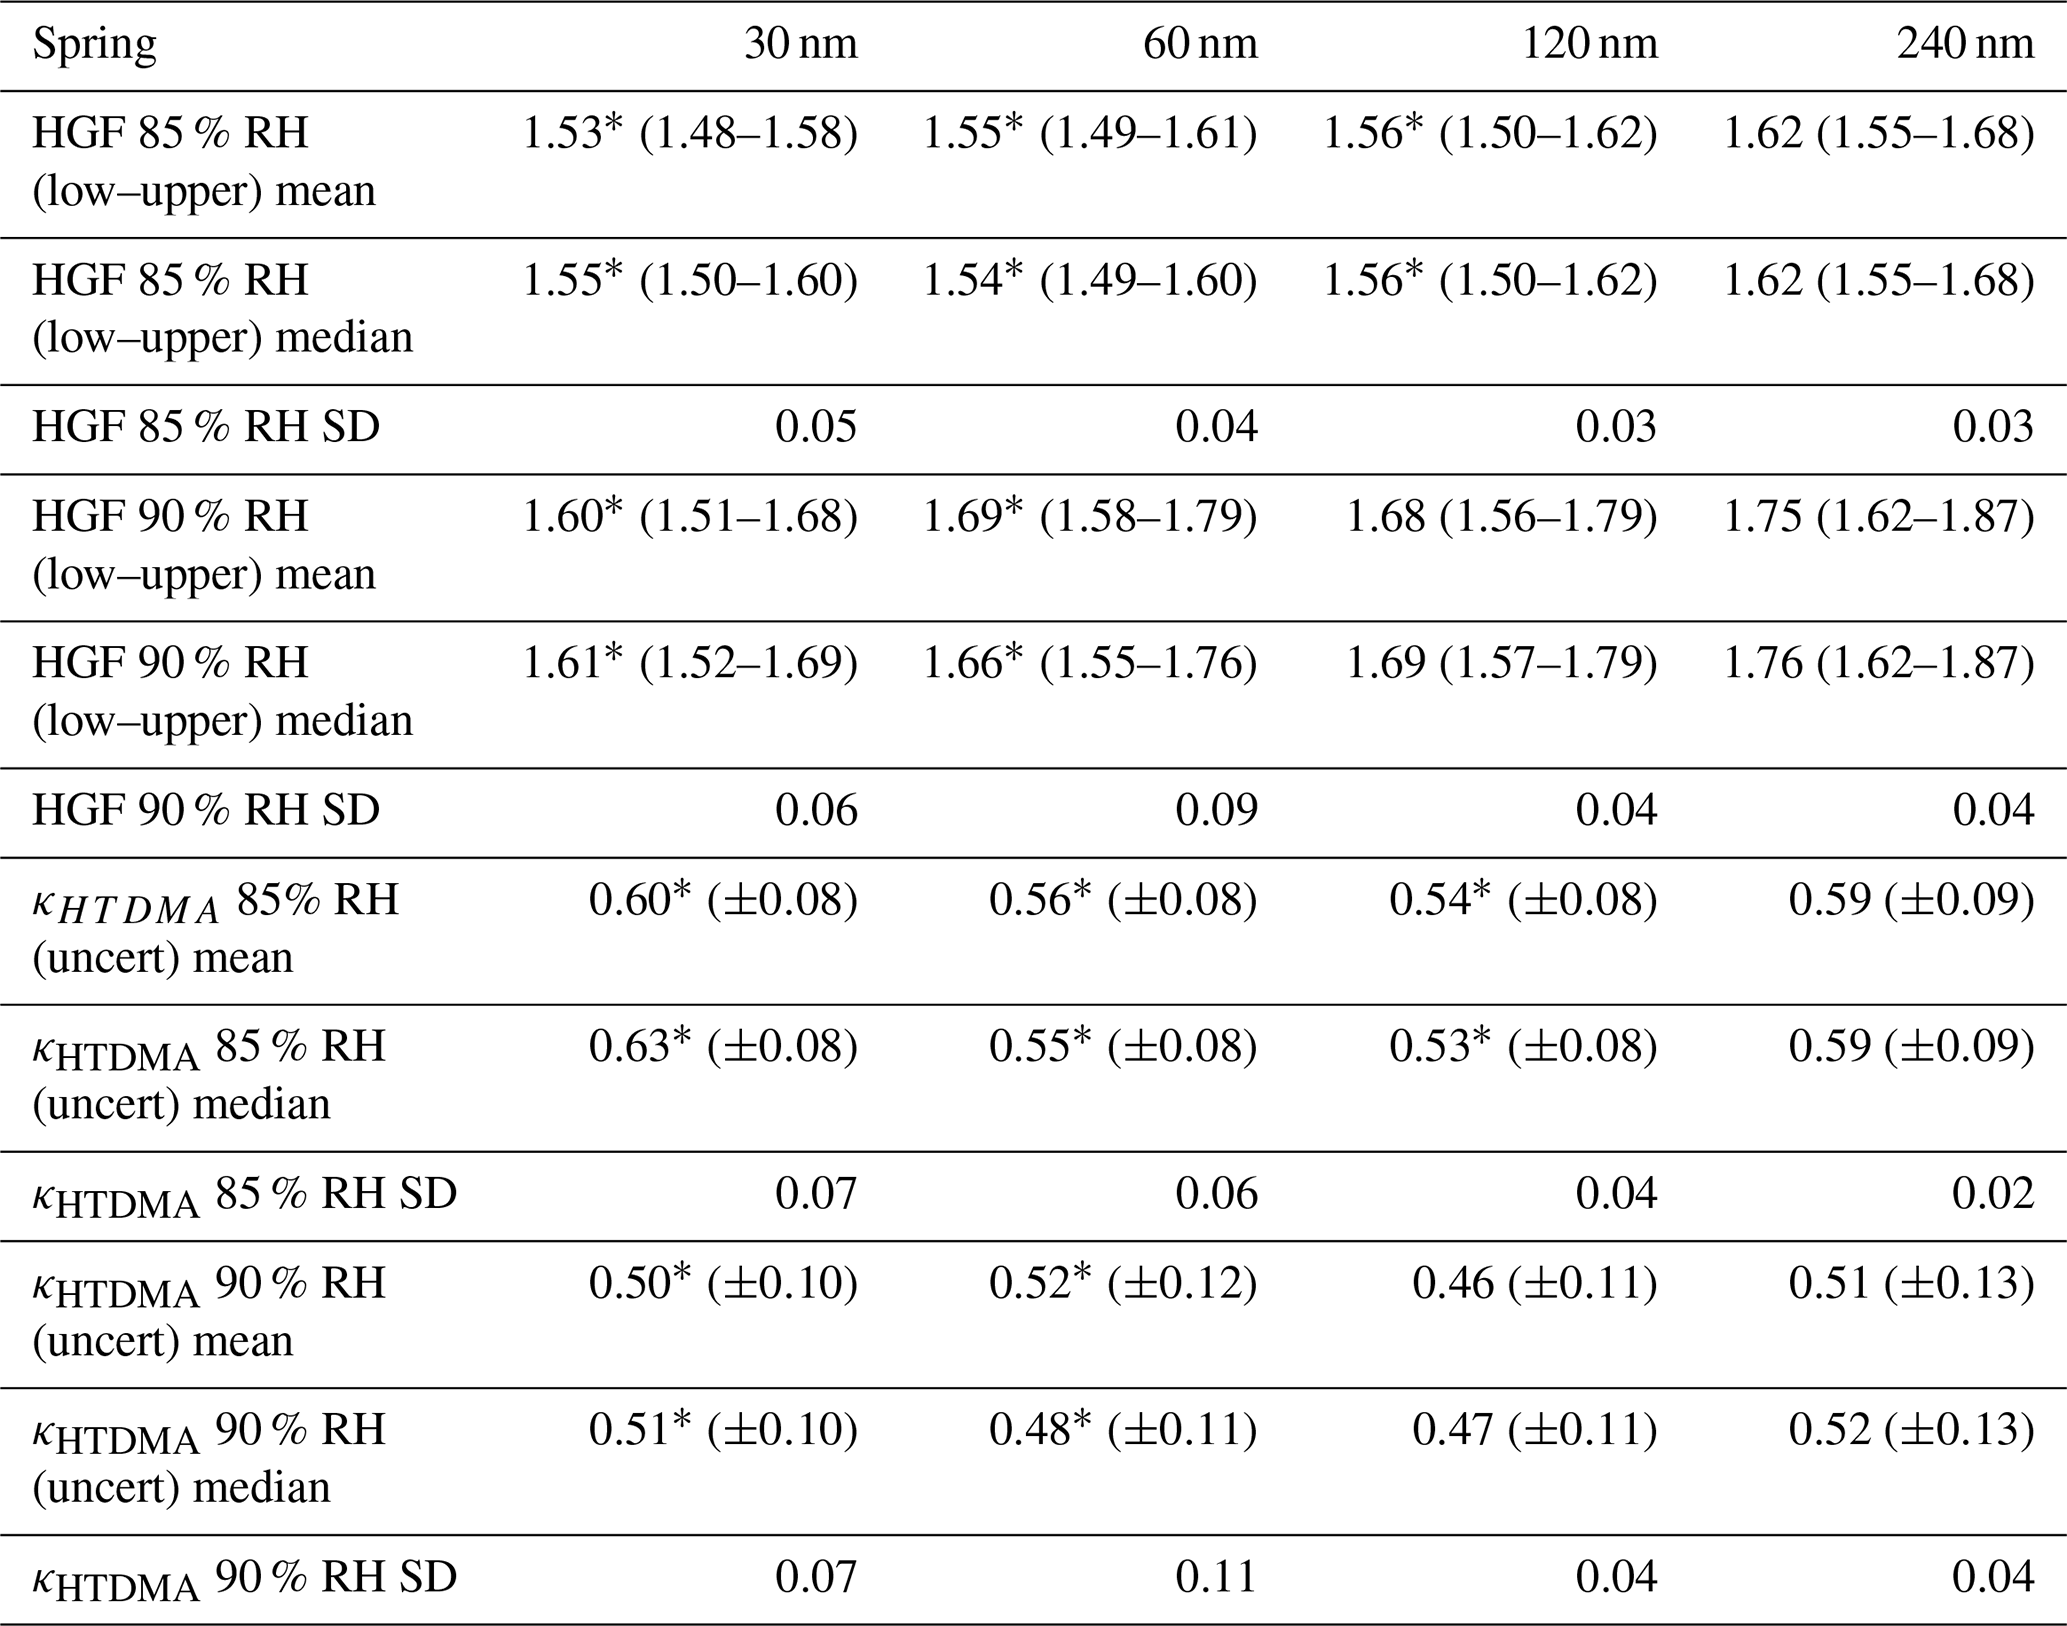
However, fluctuations of individual values in HGF around the mean values can be explained well by a variation in the degree of neutralization of the aerosol. The distribution of HGF over the size regime as well as the corresponding calculated κHTDMA imply little change in the chemical composition over the size range of the Arctic aerosol investigated at Villum during this spring study.
Stronger variations of HGF were observed during the summer study period compared to the spring study. Also, a larger number of measurements were carried out at 30 nm Dpdry, but no valid measurements could be obtained at 240 nm. In general, the patterns of HGF at 60 and 120 nm appear to covary, while measurements at 30 nm Dpdry are inconsistent with those at larger sizes, indicating a different chemical composition for the smallest particle size range. As an overall finding, HGF during the summer study was lower compared to the spring study. These differences are statistically significant for the mean and median values measured at 85 % RH for all sizes and at 90 % RH for 30 and 60 nm Dpdry. Correspondingly, κHTDMA mean values range from 0.37 to 0.45 (85 % RH) and from 0.36 to 0.45 (90 % RH), which no longer reflect a pure chemical inorganic composition of ammonium sulfate or ammonium bisulfate but rather imply that the observed aerosol might be composed, to a substantial extent, of organic compounds mixed with inorganic species. This finding reflects the overall theory that the summer Arctic aerosol is predominantly of local and regional origin with microbial activity in marginal ice zones and phytoplankton sea surface emissions delivering the inorganic as well as the organic ingredients for particle growth. Organic aerosol precursors, which partly condense onto existing aerosol, might be an explanation for this finding by lowering the overall hygroscopicity of the observed particles, leading to lower κHTDMA mean values. Low-level transport of anthropogenic pollution is to a large extent very limited during this time of the year. Statistics of measured particle hygroscopic growth factors and associated κHTDMA values for both study periods are listed in Tables 4 and 5.
Table 5Statistics of HTDMA measurements during the summer field study. The stated uncertainties are the respective statistics of the associated uncertainty retrieved from the fitting procedure as described in Sect. 2.5. The values of SD are the standard deviations of the parameter distributions over the temporal evolution of the studies. The asterisk (*) signifies a significant difference between spring and summer field studies (Wilcoxon rank sum test, p<0.05); there are no measurements at 240 nm Dpdry for the summer field study. HTDMA measurements for the summer field study were obtained from 15 August to 28 August.
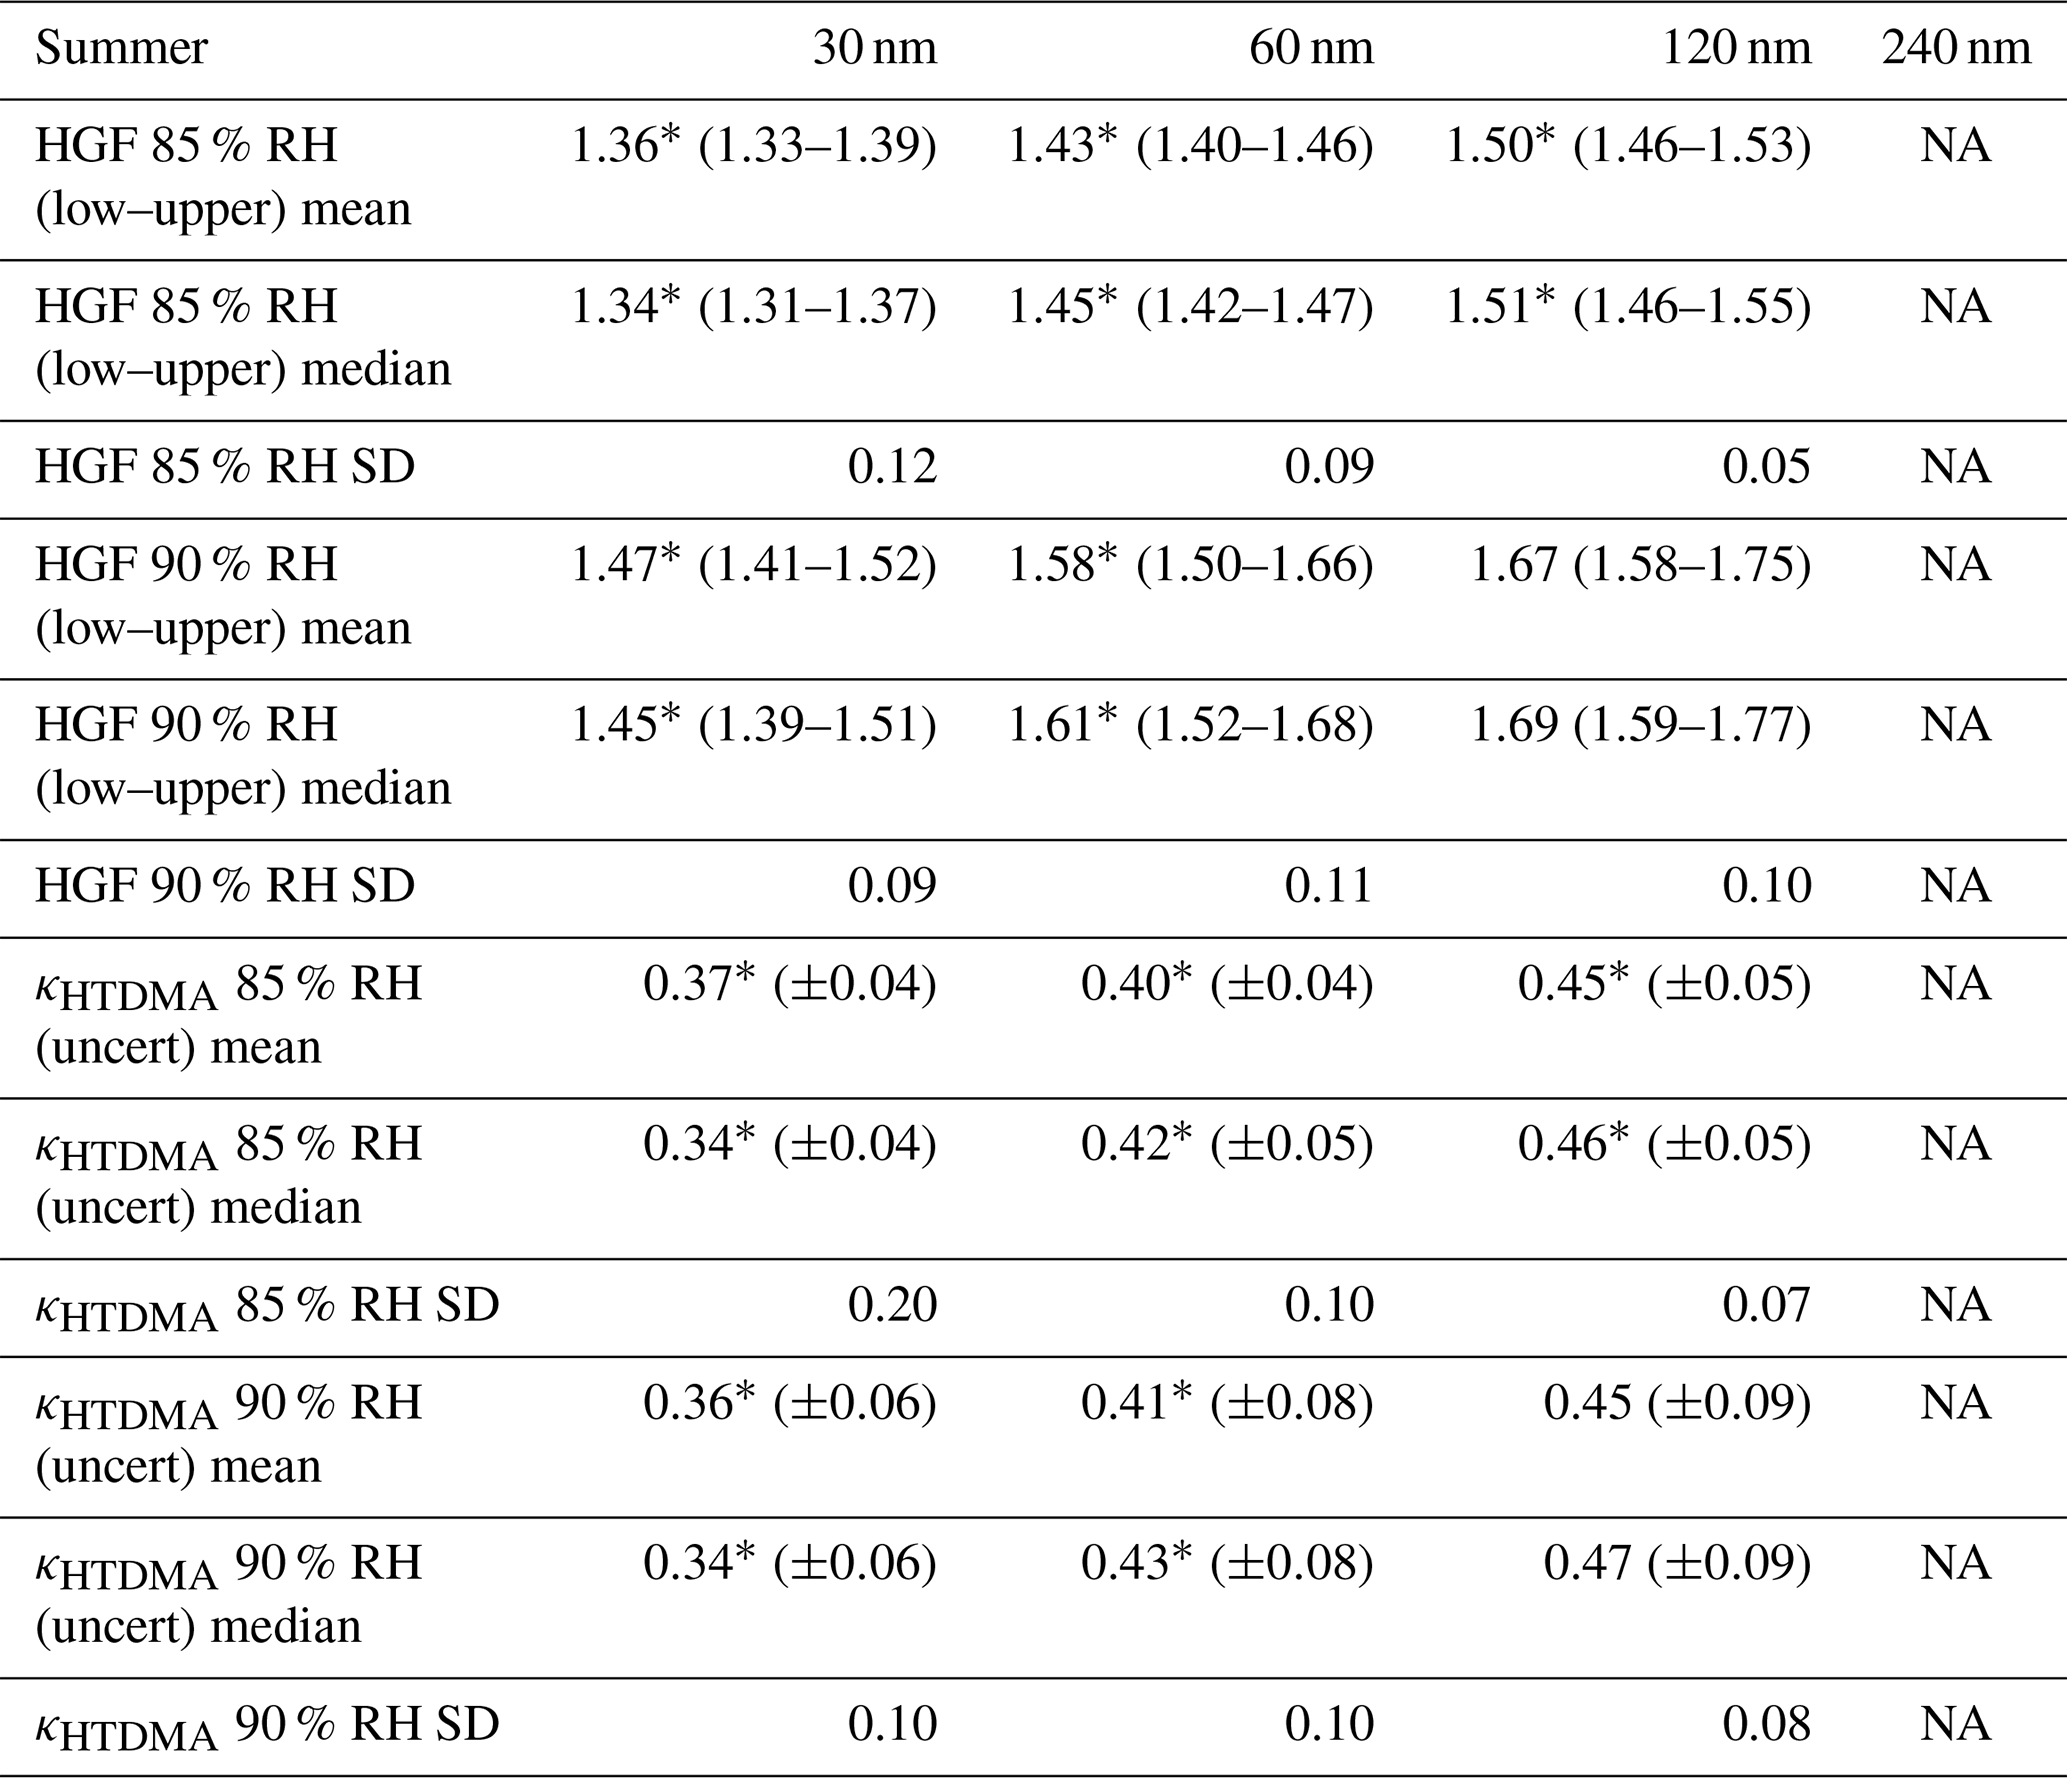
NA stands for not available.
The HGF low and upper values in Tables 4 and 5 were derived by either subtracting or adding the uncertainty of κHTDMA in the recalculation procedure, as described in Sect. 2.5. The uncertainty of κHTDMA, in turn, is the standard deviation of the normal distribution fit applied to the iteratively obtained set of κHTDMA values. As noted for the CCN dataset, it cannot be assumed that the HTDMA measurements probe identical probability density functions, and thus the combination of the standard deviation with a standard error is not a valid procedure. Again, here we instead state the mean and median values of the κHTDMA and the corresponding uncertainties.
In summary, we can see that for all smaller diameters (30 and 60 nm Dpdry) the HGF values (mean and median) at 85 % RH and 90 % RH are significantly different between the two field studies. This is also valid for the retrieved κHTDMA values. The two periods showed no significant difference at 120 nm Dpdry at 90 % RH. Similarly, κHTDMA had a larger temporal variability in the summer period. κHTDMA at 30 nm, in particular, had a comparably high temporal variability in summer. This indicated that as the hygroscopicity of 30 nm particles was on average lower during summer compared to spring, these particles had a more variable hygroscopicity and correspondingly a more variable chemical composition. As these particles are expected to originate from nucleation processes in the region, this indicates that various processes and thus different chemical compounds were responsible for the aerosol formation and/or further growth processes of these 30 nm particles during the summer study period (Beck et al., 2021). It has to be noted that there is also evidence for Aitken-mode particles of primary origin. Several hypotheses exist which propose different production mechanisms for these particles. This could be, for example, the breakup of larger particles or the collapse of marine gel particles in droplets to a nanoparticle state (Lawler et al., 2021). It was also found that sea spray aerosols can contribute to the Aitken-mode population down to sizes of 35 nm (Xu et al., 2022). Contributions from such sources to the Aitken-mode aerosol at Villum cannot be fully excluded, at least during summertime, when open waters are closer to the station compared to wintertime.
3.5 Comparison of particle hygroscopicity derived based on CCN and HTDMA measurements
The comparison of κ values determined simultaneously (within 2 h) by HTDMA and CCN measurements revealed differing patterns between the two study periods. The differing pattern was observed at all SSs, but here results from 0.3 % SS and both 85 % and 90 % RH are shown, as this illustration presents the clearest picture. Spring and summer κHTDMA versus κCCN datasets are displayed in Fig. 9. In general, only weak correlations were found between κHTDMA and κCCN. Earlier studies also found different values between the two techniques (e.g., Petters and Kreidenweis, 2007; Rastak et al., 2017; Rosati et al., 2020).
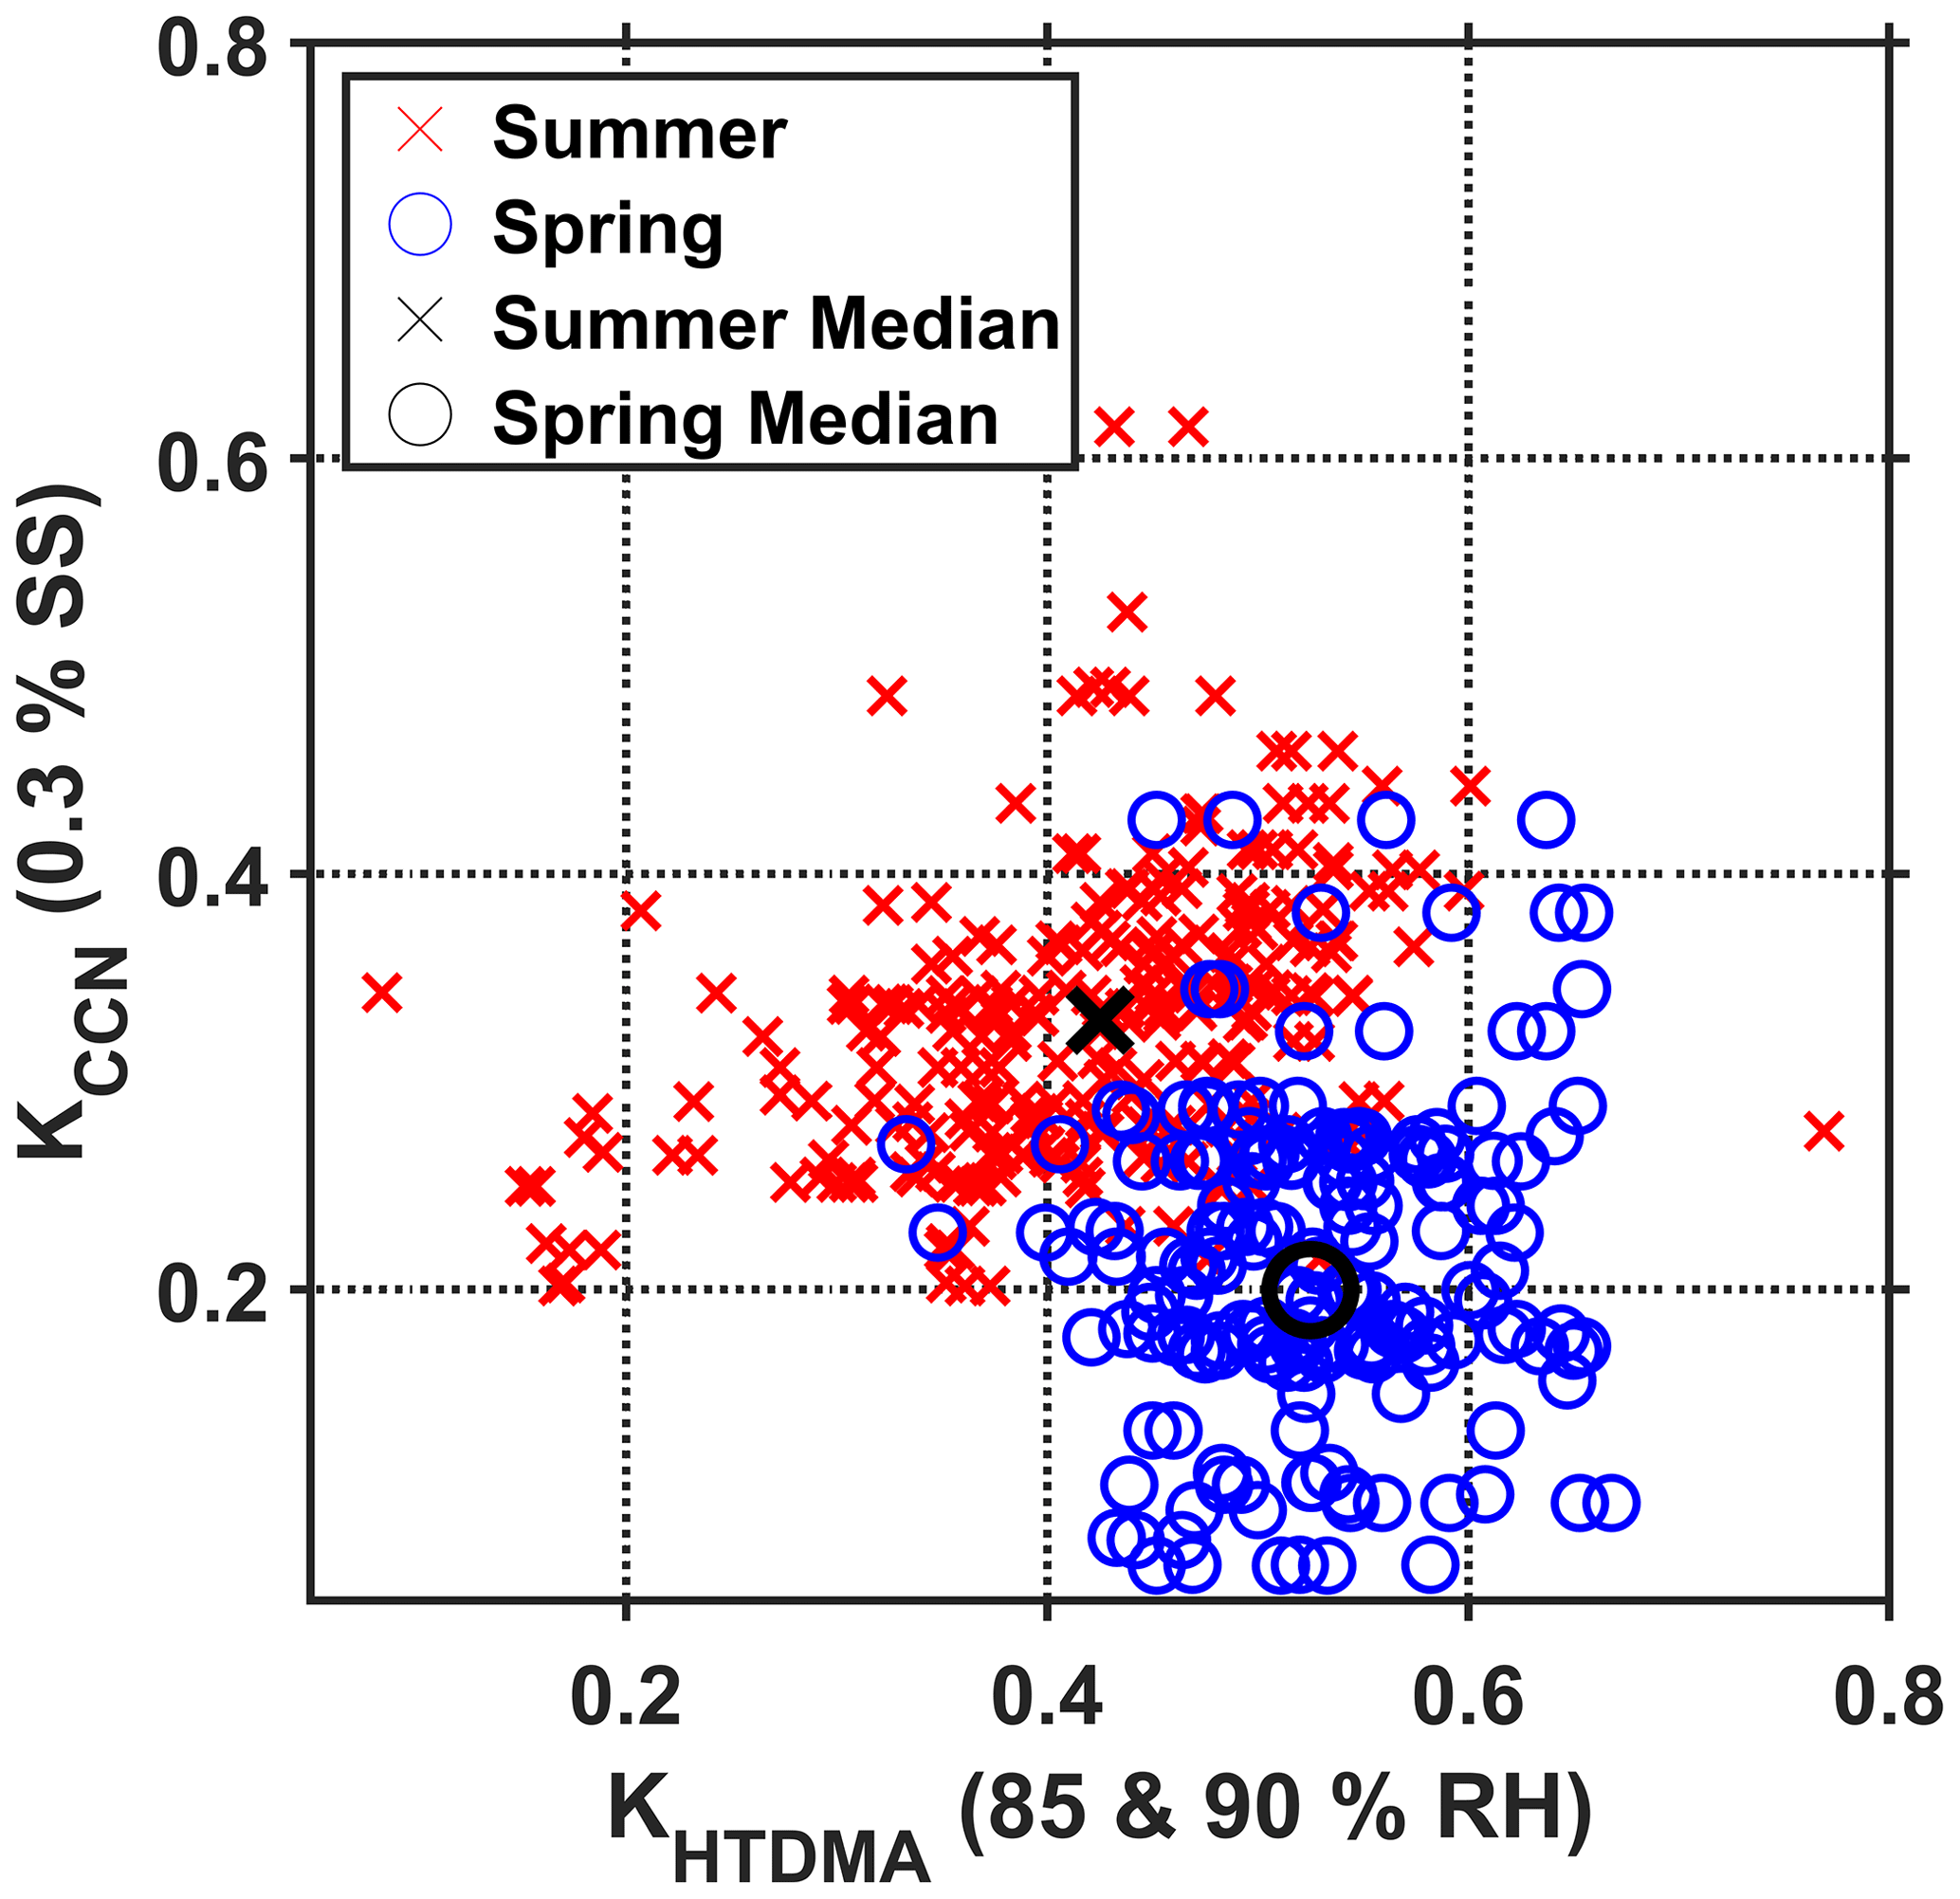
Figure 9Correlation of κHTDMA and κCCN. The κHTDMA values include measurements at both 85 % and 90 % RH of 30, 60, 120, and 240 nm Dpdry. κCCN was recorded at 0.3 % SS. Blue circles are spring measurements, and red crosses are summer measurements. The black circle (cross) indicates the median for κHTDMA and κCCN during the summer (spring) field study. This figure is adopted from the supplementary material in Lange et al. (2019).
Particles composed of partly neutralized sulfates or sulfuric acid are expected to exhibit similar hygroscopic behavior compared to that observed for the spring measurements (Petters and Kreidenweis, 2007; Biskos et al., 2009), i.e., comparably higher hygroscopic growth at subsaturated conditions and lower CCN activity at supersaturation. This corresponds to other findings from Villum, where the haze aerosol was found to be acidic, containing a large fraction of non-neutralized sulfates (Nielsen et al., 2019). However, as the κ values of un-neutralized sulfates are quite high (e.g., κHTDMA(H2SO4) = 1.19, κCCN(H2SO4) = 0.90), additional less-hygroscopic species, e.g., biogenic or anthropogenic organics, other inorganic components, and/or black carbon, need to be a significant fraction of the observed internally mixed aerosol as well to explain our observations.
During the summer period, it appears that the aerosol was less acidic. Ammonium sulfate exhibits lower κ values compared to sulfuric acid and gives better agreement between the two techniques (κHTDMA(AS) = 0.53, κCCN(AS) = 0.61). Basically, a ratio larger than 1 was found between median κHTDMA and κCCN for both seasons in our study. Reasons why an increase for median κCCN was found from spring to summer compared to a decrease for median κHTDMA for the same period in our study remain unresolved and need further investigation, likely requiring a longer dataset. A possible explanation is stated in the following paragraph.
The full-year study from Svalbard by Silvergren et al. (2014) shows an increase in κCCN from April to August, from about 0.39 to 0.54, and an increase in κHTDMA from about 0.38 to 0.52 (both ranges originate from Fig. 9 in the referenced study). While we observe a corresponding increase in κCCN, we also observe a general decrease in κHTDMA over the corresponding period. This difference might be caused by a smaller relative contribution of sea salt components to the aerosol composition at Villum compared to Svalbard. Also, a smaller contribution from DMS-derived sulfate aerosol is expected at Villum compared to Svalbard based on the larger distance to open waters at Villum during summer. Marine microgel aerosols have been described to feature efficient CCN properties while showing low hygroscopic growth at subsaturated conditions (Ovadnevaite et al., 2011; Leck and Svensson, 2015; Hodas et al., 2016). As the coastline in the immediate proximity of Villum was ice-free during the summer study period and the Arctic pack ice extent was close to a minimum during August, areas of open water and open pack ice were available as potential sources for marine aerosols and gels from the sea surface microlayer. However, we only see a very limited indication of these properties in our data.
Our measurements show that aerosols of the Arctic atmosphere demonstrate relatively high CCN activity and hygroscopic growth at subsaturated conditions. This is noteworthy as organic compounds make up a significant mass fraction (Leck et al., 2002; Chang et al., 2011; Lange et al., 2018; Nielsen et al., 2019) in Arctic aerosols. Correspondingly, the organic mass fraction must be assumed to contribute significantly to the hygroscopicity of the observed aerosol at Villum. For the spring and the summer measurement period, we determined average κCCN values of 0.27–0.35 and 0.23–0.35, respectively. These values are mainly the result of the combined hygroscopicity of the main aerosol sulfate and organic components. Nielsen et al. (2019) determined the organic mass component in PM1 to be on average 24 % over the period February–May at Villum. However, the organic component of the aerosol mass in the Arctic is highly size-dependent in the particle size range probed by both the CCN counter and HTDMA in this study (Croft et al., 2019). Croft et al. (2019) performed model calculations for Arctic aerosols during summertime, showing that about 50 % of the mass fraction around 100 nm in diameter can be of organic origin. Also, the atmospheric aging of Arctic aerosols, which during summer to a large extent originated from local or regional sources, supports the fact that biogenic precursors can largely contribute to the organic mass fraction of Arctic aerosols that were investigated by HTDMA and CCN counter techniques in this study. Tremblay et al. (2019) found large organic mass fractions compared to sulfate during particle formation events in the submicrometer and even ultrafine size range at Eureka station using AMS techniques. Despite the relatively high κCCN values, average CCN concentrations were quite low in our study, especially during summer. For supersaturations ≤ 0.3 %, the spring period featured average CCN concentrations of 53.7–85.3 cm−3, while average concentrations of 20.8–47.6 cm−3 were observed during the summer period. For SS ≥ 0.5 %, CCN concentrations in spring were 98.4–133.8 cm−3, while CCN concentrations of 56.6–79.5 cm−3 were observed in summer. This shows that even when frequent NPF events take place in summer, the atmosphere contains few potential CCN, and increases in anthropogenic emissions, either by industrial activities or increased ship traffic, may have a correspondingly large impact.
The CCN properties determined in this study compare, to a varying extent, with previous findings from other parts of the Arctic. Our mean CCN concentrations at 0.7 % SS of 112.7 and 65.6 cm−3 in spring and summer, respectively, are somewhat higher than those of 14–47 cm−3 determined in the central Arctic Ocean by Martin et al. (2011). Oppositely, the summer median CCN concentration at 0.55 % SS of 247 cm−3 determined by aircraft in Arctic air masses by Lathem et al. (2013) is significantly higher than the median CCN concentration at 0.50 % SS of 53.0–95.0 cm−3 that was found during both our field studies. Martin et al. (2011) and Lathem et al. (2013) determined κCCN (mean ± SD) to be 0.33±0.13 and 0.32±0.21, respectively, which compares well to our study even if they are slightly higher than our total field study (mean ± SD) κCCN of 0.30±0.21. A study by Jung et al. (2018) evaluated a several-year CCN dataset from Zeppelin Mountain, Svalbard. They found CCN concentrations at 0.2 % SS of 70–133 cm−3 in April–June and 16–57 cm−3 in August–September. This compares well to the CCN concentrations at 0.2 % SS of 76.5±28.0 and 39.6±15.7 cm−3 we determined in spring and summer, respectively. Overall, the aerosol at Villum appears to be slightly less hygroscopic compared to that of the central Arctic Ocean and the Canadian Arctic. However, the measured CCN concentrations at Villum are higher than those measured in the Arctic Ocean by Martin et al. (2011) but lower than those found over the Canadian Arctic (Lathem et al., 2013) and at Zeppelin Mountain (Jung et al., 2018). This highlights the fact that within the Arctic region, aerosol CCN activity, and therewith probably the aerosol sources, is somewhat heterogeneous in both time and space. Additionally, the aircraft measurements, as well as Zeppelin Mountain measurements, originate in the free troposphere, while Villum measurements represent boundary layer sampling, making the local origin of observed aerosol more likely.
During summer, we observed the above-described heterogeneity of aerosol hygroscopicity. This was likely to be caused by the numerous and diverse active aerosol sources during the course of the summer measurement period. These sources are mostly of local and regional origin, including open waters, sea ice edges, or snow- and ice-covered surfaces.
Dall'Osto et al. (2017) demonstrated the influence of partially open sea ice on NPF frequency with a quantitative analysis combining air mass history and sea ice coverage. A similar approach, including the time spent over different types of Arctic surface areas combined with meteorological parameters and potential biological activity, could potentially determine individual sources of CCN-relevant aerosols in the case that a substantially long dataset of CCN measurements is available.
The actual supersaturation that develops during the atmospheric updraft of an air parcel is critically important for determining which fraction of the ambient aerosol acts as CCN. Yet little is known about this process in the Arctic atmosphere. Peak supersaturations (SSpeak) were calculated by Earle et al. (2011), based on aircraft measurements of cloud properties and characterization of aerosols below cloud, over the Beaufort Sea in April. For a bimodal aerosol, which is also representative of our data, and under unpolluted conditions, they determined SSpeak of 0.33 %–0.44 % for updraft velocities of 30–40 cm s−1 and reported calculated κ values of 0.2–0.3. Lower κ values delay the onset of liquid water condensation during updraft, resulting in the aerosol population being exposed to higher SSpeak, which partly offsets the importance of κ values. Oppositely, polluted aerosols, characterized by higher number concentrations, deplete available water vapor faster during condensation, which lowers the effective SSpeak. Values of 0.12 %–0.18 % SS are presented in the abovementioned study for polluted cases. At the subarctic station Pallas in northern Finland SSpeak of 0.27 %–0.63 % was determined in September–October (Anttila et al., 2012), though generally lower κ values were observed compared to our studies at Villum, which could be explained by proximity to anthropogenic emission sources.
Based on these peak supersaturations, the ambient Dpcrit at Villum would be approximately 68–80 nm, yielding actual ambient CCN concentrations of about 85–92 and 48–53 cm−3 during the spring and summer period, respectively. These critical activation diameters are between the Aitken and accumulation mode (Fig. 2), indicating that even if newly formed particles grow into the lower Aitken mode, which is an established phenomenon in the Arctic atmosphere (Nguyen et al., 2016; Willis et al., 2016; Burkart et al., 2017; Dall'Osto et al., 2018a, b), significant condensational growth will be required for these particles to reach cloud-relevant sizes. Consequently, sources of accumulation-mode aerosols could be more relevant for the CCN population compared to sources of new particle formation. This underlines the relevance of biogenic primary marine sources because these could emit CCN-relevant aerosols directly during summer when Arctic haze accumulation-mode aerosol is absent. Marine gels and water-insoluble organic material from the sea surface microlayer have been shown to be directly emitted as particles in the CCN-relevant size ranges (Facchini et al., 2008; Orellana et al., 2011; Karl et al., 2013). Hamacher-Barth et al. (2016) found gel particles at Dp of predominantly >45 nm within a morphological analysis. A chemical analysis of gel polysaccharide monomers showed that pentoses and hexoses, associated with cellular material of phytoplankton, as well as deoxy sugars from microbial exudates were present in the Aitken- and accumulation-mode ranges of Arctic marine aerosols (Leck et al., 2013). A similar targeted chemical and morphological analysis of aerosol filter samples from Villum could therefore clarify the role of marine gels for late spring and summertime CCN and is proposed here for further studies.
The average RH during the spring period at Villum was 80.3±7.9 %, while it was 77.3±11.6 % during the summer period. For our HTDMA measurements, we found average HGFs of 1.56 and 1.62 at 85 % RH for 120 and 240 nm particles in spring, respectively, and 1.50 at 85 % RH for 120 nm particles during summer (no valid measurements of HGFs for 240 nm were obtained in summer). The ambient RH was similar to the RH measured at Ny-Ålesund, Svalbard, reported by Rastak et al. (2014). They used calculated HGFs for 200 nm particles at 85 % RH to determine the direct radiative forcing exerted by hygroscopic aerosols. For the months of April and May, they used HGFs with an average of about 1.56, and for August, they used HGFs of about 1.59. They determined an average annual aerosol-scattering enhancement factor of 4.30±2.26, resulting in an aerosol–radiation RF of −0.83 to −2.60 W m−2. Similarly, we expect particle hygroscopic growth at Villum at the ambient RH to yield a negative impact on radiative transfer as well. As we observed both higher RH and HGFs in spring compared to summer, the direct scattering effect should be more pronounced in spring and early summer compared to periods later in the year. Hygroscopic growth appears to be more pronounced in spring, whereas CCN processes seem to be relatively more important during summer. In spring, aerosols of anthropogenic origin, dominated by acidic sulfate particles and carbonaceous aerosols, exhibit high hygroscopic growth, and aerosol–radiation effects are potentially the dominating RF mechanisms during this time of year. In summer, accumulation-mode aerosol concentrations are smaller, and aerosol hygroscopic growth is generally lower. In this period, natural CCN active marine aerosols could be the dominating aerosol climate forcing agent through aerosol–cloud effects. Detailed modeling studies of the climatic influence of Arctic aerosols through aerosol–radiation and aerosol–cloud interactions could clarify this hypothesis. It must be noted that the Arctic cloud regime is very susceptible to small changes in CCN concentrations (Mauritsen et al., 2011). During the summertime, particle number concentrations in Arctic environments can show values below 10 cm−3 (Freud et al., 2017). This is why detailed measurements of subsaturated hygroscopicity and CCN ability are needed to understand the role of Arctic aerosols in aerosol–cloud–climate interactions.
Ongoing nephelometer measurements at Villum will provide a basis for further investigations of the impacts of aerosol hygroscopic growth on aerosol–radiation interactions in the nearer future. Furthermore, measurement series of hygroscopic properties of longer duration at Villum would be highly valuable, as a full yearly cycle of CCN and HGF measurements would be a leap forward in the understanding of Arctic climate-relevant aerosol properties.
Arctic aerosols, and their radiation and cloud interactions, are key factors in the changing Arctic climate. Still though, many details about their sources, hygroscopic properties, and cloud interactions are not well understood. In this work, we provide results from two field studies conducted at the high Arctic site Villum Research Station. One field study was carried out in the spring to early summer of 2016, while the other study was conducted from summer to autumn of the same year. During these field studies, particle hygroscopic growth factors and CCN properties were measured. Based on other studies, we expect peak supersaturations of about 0.3 %–0.4 % to occur in Arctic clouds. This yields actual ambient average CCN concentrations of 85–92 and 48–53 cm−3 during the spring and summer measurement period, respectively. The corresponding Dpcrit at 0.3 %–0.4 % SS was approximately 68–80 nm, showing that accumulation-mode aerosols are more important for the CCN population compared to nucleation- and Aitken-mode aerosols. These results can be used directly in model parameterization. During spring, accumulation-mode aerosols originated mostly from long-range transport and Arctic haze. During summer, the concentration of accumulation-mode aerosols was generally low, and we cannot present a clear indication of their origin. Sea salt influences seem to be low, and only weak indications of primary marine organic particles were observed in the combined analysis of HGF and CCN measurements.
The ambient aerosol appears to be influenced by a multitude of sources during summer. Based on other studies of the impact of hygroscopic properties on radiative forcing in the high Arctic, the hygroscopic properties at Villum very likely result in direct aerosol–radiation interactions that lead to atmospheric cooling, especially in the spring period. Future studies, combining several additional methods, could further clarify the role of marine gels from the sea surface microlayer in CCN concentration and aerosol hygroscopic growth in the radiation balance in the high Arctic atmosphere. Targeted chemical and morphological analysis for marine gels on aerosol filter samples, aerosol scattering, or online aerosol composition measurements of the submicrometer aerosol could be relevant tools to further clarify open questions about the climate-relevant role of Arctic aerosols.
All data used in this paper can be found at https://doi.org/10.5281/zenodo.7307293 (Pernov et al., 2022). Sea ice concentrations were taken from https://doi.org/10.7265/efmz-2t65 (Meier at al., 2021).
The supplement related to this article is available online at: https://doi.org/10.5194/acp-23-4931-2023-supplement.
RL, AM, and LLS carried out the measurements. RL and JBP processed the data. RL, JBP, AM, and LLS analyzed the data. RL, JBP, and AM wrote the paper. HSK, AM, UG, and LLS provided the initial project funding. All co-authors proofread and commented on the paper.
The contact author has declared that none of the authors has any competing interests.
Publisher's note: Copernicus Publications remains neutral with regard to jurisdictional claims in published maps and institutional affiliations.
Robert Lange and Ulrich Gosewinkel were funded by the Independent Research Fund Denmark, grant DFF-4005-00482B-FTP “NUMEN”. The overall study was financially supported by the “Energi-, Forsynings- og Klimaministeriet” (grant no. 2016-3025). We greatly acknowledge the Danish Center for the Environment for funding a grant to write this article. In addition, we want to thank our technician Bjarne Jensen and IT expert Keld Mortensen for their great support within this study. The military staff at Station Nord are highly acknowledged for their excellent logistical help as is the Villum Foundation for providing the station infrastructure and corresponding applied instrumentation.
This research has been supported by the Villum Fonden (grant no. project no. VKR023001), the Ministeriet for Forskning Innovation og Videregående Uddannelser (grant no. DFF-FTP-4005-00485B), and the Energi-, Forsynings- og Klimaministeriet (grant no. 2016-3025).
This paper was edited by Barbara Ervens and reviewed by two anonymous referees.
Allan, J. D., Williams, P. I., Najera, J., Whitehead, J. D., Flynn, M. J., Taylor, J. W., Liu, D., Darbyshire, E., Carpenter, L. J., Chance, R., Andrews, S. J., Hackenberg, S. C., and McFiggans, G.: Iodine observed in new particle formation events in the Arctic atmosphere during ACCACIA, Atmos. Chem. Phys., 15, 5599–5609, https://doi.org/10.5194/acp-15-5599-2015, 2015.
Anttila, T., Brus, D., Jaatinen, A., Hyvarinen, A. P., Kivekas, N., Romakkaniemi, S., Komppula, M., and Lihavainen, H.: Relationships between particles, cloud condensation nuclei and cloud droplet activation during the third Pallas Cloud Experiment, Atmos. Chem. Phys., 12, 11435–11450, https://doi.org/10.5194/acp-12-11435-2012, 2012.
Barrie, L. A., Hoff, R. M., and Daggupaty, S. M.: The Influence of Mid-Latitudinal Pollution Sources on Haze in the Canadian Arctic, Atmos. Environ., 15, 1407–1419, https://doi.org/10.1016/0004-6981(81)90347-4, 1981.
Beck, L. J., Sarnela, N., Junninen, H., Hoppe, C. J. M., Garmash, O., Bianchi, F., Riva, M., Rose, C., Peräkylä, O., Wimmer, D., Kausiala, O., Jokinen, T., Ahonen, L., Mikkilä, J., Hakala, J., He, X.-C., Kontkanen, J., Wolf, K. K. E., Cappelletti, D., Mazzola, M., Traversi, R., Petroselli, C., Viola, A. P., Vitale, V., Lange, R., Massling, A., Nøjgaard, J. K., Krejci, R., Karlsson, L., Zieger, P., Jang, S., Lee, K., Vakkari, V., Lampilahti, J., Thakur, R. C., Leino, K., Kangasluoma, J., Duplissy, E.-M., Siivola, E., Marbouti, M., Tham, Y. J., Saiz-Lopez, A., Petäjä, T., Ehn, M., Worsnop, D. R., Skov, H., Kulmala, M., Kerminen, V.-M., and Sipilä, M.: Differing Mechanisms of New Particle Formation at Two Arctic Sites, Geophys. Res. Lett., 48, e2020GL091334, https://doi.org/10.1029/2020GL091334, 2021.
Bellouin, N., Rae, J., Jones, A., Johnson, C., Haywood, J., and Boucher, O.: Aerosol forcing in the Climate Model Intercomparison Project (CMIP5) simulations by HadGEM2-ES and the role of ammonium nitrate, J. Geophys. Res.-Atmos., 116, D20206, https://doi.org/10.1029/2011jd016074, 2011.
Biskos, G., Buseck, P. R., and Martin, S. T.: Hygroscopic growth of nucleation-mode acidic sulfate particles, J. Aerosol Sci., 40, 338–347, https://doi.org/10.1016/j.jaerosci.2008.12.003, 2009.
Breider, T. J., Mickley, L. J., Jacob, D. J., Wang, Q. Q., Fisher, J. A., Chang, R. Y. W., and Alexander, B.: Annual distributions and sources of Arctic aerosol components, aerosol optical depth, and aerosol absorption, J. Geophys. Res.-Atmos., 119, 4107-4124, https://doi.org/10.1002/2013jd020996, 2014.
Breider, T. J., Mickley, L. J., Jacob, D. J., Ge, C., Wang, J., Sulprizio, M. P., Croft, B., Ridley, D. A., McConnell, J. R., Sharma, S., Husain, L., Dutkiewicz, V. A., Eleftheriadis, K., Skov, H., and Hopke, P. K.: Multidecadal trends in aerosol radiative forcing over the Arctic: Contribution of changes in anthropogenic aerosol to Arctic warming since 1980, J. Geophys. Res.-Atmos., 122, 3573–3594, https://doi.org/10.1002/2016jd025321, 2017.
Browse, J., Carslaw, K. S., Arnold, S. R., Pringle, K., and Boucher, O.: The scavenging processes controlling the seasonal cycle in Arctic sulphate and black carbon aerosol, Atmos. Chem. Phys., 12, 6775–6798, https://doi.org/10.5194/acp-12-6775-2012, 2012.
Burgos, M., Andrews, E., Titos, G., Alados-Arboledas, L., Baltensperger, U., Day, D., Jefferson, A., Kalivitis, N., Mihalopoulos, N., Sherman, J., Sun, J., Weingartner, E., and Zieger, P.: A global view on the effect of water uptake on aerosol particle light scattering, Scient. Data, 6, 157, https://doi.org/10.1038/s41597-019-0158-7, 2019.
Burkart, J., Hodshire, A. L., Mungall, E. L., Pierce, J. R., Collins, D. B., Ladino, L. A., Lee, A. K. Y., Irish, V., Wentzell, J. J. B., Liggio, J., Papakyriakou, T., Murphy, J., and Abbatt, J.: Organic Condensation and Particle Growth to CCN Sizes in the Summertime Marine Arctic is Driven by Materials More Semivolatile Than at Continental Sites, Geophys. Res. Lett., 44, 10725–10734, https://doi.org/10.1002/2017gl075671, 2017.
Carrico, C. M., Rood, M. J., Ogren, J. A., Neususs, C., Wiedensohler, A., and Heintzenberg, J.: Aerosol optical properties at Sagres, Portugal during ACE-2, Tellus B, 52, 694–715, 2000.
Chang, R. Y. W., Leck, C., Graus, M., Muller, M., Paatero, J., Burkhart, J. F., Stohl, A., Orr, L. H., Hayden, K., Li, S. M., Hansel, A., Tjernstrom, M., Leaitch, W. R., and Abbatt, J. P. D.: Aerosol composition and sources in the central Arctic Ocean during ASCOS, Atmos. Chem. Phys., 11, 10619–10636, https://doi.org/10.5194/acp-11-10619-2011, 2011.
Chylek, P., Vogelsang, T. J., Klett, J. D., Hengartner, N., Higdon, D., Lesins, G., and Dubey, M. K.: Indirect Aerosol Effect Increases CMIP5 Models' Projected Arctic Warming, J. Climate, 29, 1417–1428, https://doi.org/10.1175/Jcli-D-15-0362.1, 2016.
Clegg, S. L., Pitzer, K. S., and Brimblecombe, P.: Thermodynamics of Multicomponent, Miscible, Ionic-Solutions. 2. Mixtures Including Unsymmetrical Electrolytes, J. Phys. Chem., 96, 9470–9479, https://doi.org/10.1021/j100202a074, 1992.
Clegg, S. L., Brimblecombe, P., Wexler, A. S.: A thermodynamic model of the system H+––Na+–––Cl−–H2O at 298.15 K, J. Phys. Chem. A, 102, 2155–2171, https://doi.org/10.1021/jp973043j, 1998.
Collins, D. B., Burkart, J., Chang, R. Y. W., Lizotte, M., Boivin-Rioux, A., Blais, M., Mungall, E. L., Boyer, M., Irish, V. E., Masse, G., Kunkel, D., Tremblay, J. E., Papakyriakou, T., Bertram, A. K., Bozem, H., Gosselin, M., Levasseur, M., and Abbatt, J. P. D.: Frequent ultrafine particle formation and growth in Canadian Arctic marine and coastal environments, Atmos. Chem. Phys., 17, 13119–13138, https://doi.org/10.5194/acp-17-13119-2017, 2017.
Croft, B., Martin, R. V., Leaitch, W. R., Tunved, P., Breider, T. J., D'Andrea, S. D., and Pierce, J. R.: Processes controlling the annual cycle of Arctic aerosol number and size distributions, Atmos. Chem. Phys., 16, 3665–3682, https://doi.org/10.5194/acp-16-3665-2016, 2016.
Croft, B., Martin, R. V., Leaitch, W. R., Burkart, J., Chang, R. Y.-W., Collins, D. B., Hayes, P. L., Hodshire, A. L., Huang, L., Kodros, J. K., Moravek, A., Mungall, E. L., Murphy, J. G., Sharma, S., Tremblay, S., Wentworth, G. R., Willis, M. D., Abbatt, J. P. D., and Pierce, J. R.: Arctic marine secondary organic aerosol contributes significantly to summertime particle size distributions in the Canadian Arctic Archipelago, Atmos. Chem. Phys., 19, 2787–2812, https://doi.org/10.5194/acp-19-2787-2019, 2019.
Dall'Osto, M., Beddows, D. C. S., Tunved, P., Krejci, R., Strom, J., Hansson, H. C., Yoon, Y. J., Park, K. T., Becagli, S., Udisti, R., Onasch, T., O'Dowd, C. D., Simo, R., and Harrison, R. M.: Arctic sea ice melt leads to atmospheric new particle formation, Sci. Rep.-UK, 7, 3318, https://doi.org/10.1038/s41598-017-03328-1, 2017.
Dall'Osto, M., Geels, C., Beddows, D. C. S., Boertmann, D., Lange, R., Nojgaard, J. K., Harrison, R. M., Simo, R., Skov, H., and Massling, A.: Regions of open water and melting sea ice drive new particle formation in North East Greenland, Sci. Rep.-UK, 8, 6109, https://doi.org/10.1038/s41598-018-24426-8, 2018a.
Dall'Osto, M., Simo, R., Harrison, R. M., Beddows, D. C. S., Saiz-Lopez, A., Lange, R., Skov, H., Nøjgaard, J. K., Nielsen, I. E., and Massling, A.: Abiotic and biotic sources influencing spring new particle formation in North East Greenland, Atmos. Environ., 190, 126–134, https://doi.org/10.1016/j.atmosenv.2018.07.019, 2018b.
de Leeuw, G., Andreas, E. L., Anguelova, M. D., Fairall, C. W., Lewis, E. R., O'Dowd, C., Schulz, M., and Schwartz, S. E.: Production Flux of Sea Spray Aerosol, Rev. Geophys., 49, RG2001, https://doi.org/10.1029/2010rg000349, 2011.
Earle, M. E., Liu, P. S. K., Strapp, J. W., Zelenyuk, A., Imre, D., McFarquhar, G. M., Shantz, N. C., and Leaitch, W. R.: Factors influencing the microphysics and radiative properties of liquid-dominated Arctic clouds: Insight from observations of aerosol and clouds during ISDAC, J. Geophys. Res.-Atmos., 116, D00T09, https://doi.org/10.1029/2011jd015887, 2011.
Engvall, A. C., Krejci, R., Strom, J., Treffeisen, R., Scheele, R., Hermansen, O., and Paatero, J.: Changes in aerosol properties during spring-summer period in the Arctic troposphere, Atmos. Chem. Phys., 8, 445–462, https://doi.org/10.5194/acp-8-445-2008, 2008.
Facchini, M. C., Rinaldi, M., Decesari, S., Carbone, C., Finessi, E., Mircea, M., Fuzzi, S., Ceburnis, D., Flanagan, R., Nilsson, E. D., de Leeuw, G., Martino, M., Woeltjen, J., and O'Dowd, C. D.: Primary submicron marine aerosol dominated by insoluble organic colloids and aggregates, Geophys. Res. Lett., 35, L17814, https://doi.org/10.1029/2008gl034210, 2008.
Fierz-Schmidhauser, R., Zieger, P., Wehrle, G., Jefferson, A., Ogren, J. A., Baltensperger, U., and Weingartner, E.: Measurement of relative humidity dependent light scattering of aerosols, Atmos. Meas. Tech., 3, 39–50, https://doi.org/10.5194/amt-3-39-2010, 2010.
Freud, E., Krejci, R., Tunved, P., Leaitch, R., Nguyen, Q. T., Massling, A., Skov, H., and Barrie, L.: Pan-Arctic aerosol number size distributions: seasonality and transport patterns, Atmos. Chem. Phys., 17, 8101–8128, https://doi.org/10.5194/acp-17-8101-2017, 2017.
Fu, P. Q., Kawamura, K., Chen, J., Charriere, B., and Sempere, R.: Organic molecular composition of marine aerosols over the Arctic Ocean in summer: contributions of primary emission and secondary aerosol formation, Biogeosciences, 10, 653–667, https://doi.org/10.5194/bg-10-653-2013, 2013.
Fu, P. Q., Kawamura, K., Chen, J., Qin, M. Y., Ren, L. J., Sun, Y. L., Wang, Z. F., Barrie, L. A., Tachibana, E., Ding, A. J., and Yamashita, Y.: Fluorescent water-soluble organic aerosols in the High Arctic atmosphere, Sci. Rep.-UK, 5, 9845, https://doi.org/10.1038/srep09845, 2015.
Garrett, T. J. and Zhao, C. F.: Increased Arctic cloud longwave emissivity associated with pollution from mid-latitudes, Nature, 440, 787–789, https://doi.org/10.1038/nature04636, 2006.
Garrett, T. J., Zhao, C., Dong, X., Mace, G. G., and Hobbs, P. V.: Effects of varying aerosol regimes on low-level Arctic stratus, Geophys. Res. Lett., 31, L17105, https://doi.org/10.1029/2004gl019928, 2004.
Hamacher-Barth, E., Leck, C., and Jansson, K.: Size-resolved morphological properties of the high Arctic summer aerosol during ASCOS-2008, Atmos. Chem. Phys., 16, 6577–6593, https://doi.org/10.5194/acp-16-6577-2016, 2016.
Heidam, N. Z., Wåhlin, P., and Christensen, J. H.: Tropospheric gases and aerosols in northeast Greenland, J. Atmos. Sci., 56, 261–278, https://doi.org/10.1175/1520-0469(1999)056<0261:Tgaain>2.0.Co;2, 1999.
Heidam, N. Z., Christensen, J., Wåhlin, P., and Skov, H.: Arctic atmospheric contaminants in NE Greenland: levels, variations, origins, transport, transformations and trends 1990–2001, Sci. Total Environ., 331, 5–28, https://doi.org/10.1016/j.scitotenv.2004.03.033, 2004.
Herenz, P., Wex, H., Henning, S., Kristensen, T. B., Rubach, F., Roth, A., Borrmann, S., Bozem, H., Schulz, H., and Stratmann, F.: Measurements of aerosol and CCN properties in the Mackenzie River delta (Canadian Arctic) during spring-summer transition in May 2014, Atmos. Chem. Phys., 18, 4477–4496, https://doi.org/10.5194/acp-18-4477-2018, 2018.
Hodas, N., Zuend, A., Schilling, K., Berkemeier, T., Shiraiwa, M., Flagan, R. C., and Seinfeld, J. H.: Discontinuities in hygroscopic growth below and above water saturation for laboratory surrogates of oligomers in organic atmospheric aerosols, Atmos Chem Phys, 16, 12767–12792, https://doi.org/10.5194/acp-16-12767-2016, 2016.
Iversen, T. and Joranger, E.: Arctic Air-Pollution and Large-Scale Atmospheric Flows, Atmos. Environ., 19, 2099–2108, https://doi.org/10.1016/0004-6981(85)90117-9, 1985.
Jung, C. H., Yoon, Y. J., Kang, H. J., Gim, Y., Lee, B. Y., Ström, J., Krejci, R., and Tunved, P.: The seasonal characteristics of cloud condensation nuclei (CCN) in the arctic lower troposphere, Tellus B, 70, 1–13, https://doi.org/10.1080/16000889.2018.1513291, 2018.
Karl, M., Leck, C., Coz, E., and Heintzenberg, J.: Marine nanogels as a source of atmospheric nanoparticles in the high Arctic, Geophys. Res. Lett., 40, 3738–3743, https://doi.org/10.1002/grl.50661, 2013.
Kirpes, R. M., Bondy, A. L., Bonanno, D., Moffet, R. C., Wang, B. B., Laskin, A., Ault, A. P., and Pratt, K. A.: Secondary sulfate is internally mixed with sea spray aerosol and organic aerosol in the winter Arctic, Atmos. Chem. Phys., 18, 3937–3949, https://doi.org/10.5194/acp-18-3937-2018, 2018.
Köhler, H.: The nucleus in and the growth of hygroscopic droplets, T. Faraday Soc., 32, 1152–1161, https://doi.org/10.1039/tf9363201152, 1936.
Kristensen, T. B., Wex, H., Nekat, B., Nojgaard, J. K., van Pinxteren, D., Lowenthal, D. H., Mazzoleni, L. R., Dieckmann, K., Koch, C. B., Mentel, T. F., Herrmann, H., Hallar, A. G., Stratmann, F., and Bilde, M.: Hygroscopic growth and CCN activity of HULIS from different environments, J. Geophys. Res.-Atmos., 117, D22203, https://doi.org/10.1029/2012jd018249, 2012.
Kristensen, T. B., Muller, T., Kandler, K., Benker, N., Hartmann, M., Prospero, J. M., Wiedensohler, A., and Stratmann, F.: Properties of cloud condensation nuclei (CCN) in the trade wind marine boundary layer of the western North Atlantic, Atmos. Chem. Phys., 16, 2675–2688, https://doi.org/10.5194/acp-16-2675-2016, 2016.
Lange, R., Dall'Osto, M., Skov, H., Nojgaard, J. K., Nielsen, I. E., Beddowse, D. C. S., Simob, R., Harrison, R. M., and Massling, A.: Characterization of distinct Arctic aerosol accumulation modes and their sources, Atmos. Environ., 183, 1–10, https://doi.org/10.1016/j.atmosenv.2018.03.060, 2018.
Lange, R., Dall'Osto, M., Skov, H., and Massling, A.: Large summer contribution of organic biogenic aerosols to Arctic cloud condensation nuclei, Geophys. Res. Lett., 46, 11500–11509, https://doi.org/10.1029/2019GL084142, 2019.
Lathem, T. L., Beyersdorf, A. J., Thornhill, K. L., Winstead, E. L., Cubison, M. J., Hecobian, A., Jimenez, J. L., Weber, R. J., Anderson, B. E., and Nenes, A.: Analysis of CCN activity of Arctic aerosol and Canadian biomass burning during summer 2008, Atmos Chem Phys, 13, 2735–2756, https://doi.org/10.5194/acp-13-2735-2013, 2013.
Lawler, M. J., Saltzman, E. S., Karlsson, L., Zieger, P., Salter, M., Baccarini, A., Schmale, J., and Leck, C.: New insights into the composition and origins of ultrafine aerosol in the summertime high Arctic, Geophys. Res. Lett., 48, 1–11, https://doi.org/10.1029/2021GL094395, 2021.
Leaitch, W. R., Sharma, S., Huang, L., Toom-Sauntry, D., Chivulescu, A., Macdonald, A. M., von Salzen, K., Pierce, J. R., Bertram, A. K., Schroder, J. C., Shantz, N. C., Chang, R. Y. W., and Norman, A. L.: Dimethyl sulfide control of the clean summertime Arctic aerosol and cloud, Elementa, 1, 000017, https://doi.org/10.12952/journal.elementa.000017, 2013.
Leck, C. and Bigg, E. K.: Biogenic particles on the surface microlayer and overlaying atmosphere in the central Arctic Ocean during summer, Tellus B, 57, 305–316, https://doi.org/10.1111/j.1600-0889.2005.00148.x, 2005.
Leck, C. and Svensson, E.: Importance of aerosol composition and mixing state for cloud droplet activation over the Arctic pack ice in summer, Atmos. Chem. Phy, 15, 2545–2568, https://doi.org/10.5194/acp-15-2545-2015, 2015.
Leck, C., Norman, M., Bigg, E. K., and Hillamo, R.: Chemical composition and sources of the high Arctic aerosol relevant for cloud formation, J. Geophys. Res.-Atmos., 107, 4135, https://doi.org/10.1029/2001jd001463, 2002.
Leck, C., Gao, Q., Rad, F. M., and Nilsson, U.: Size-resolved atmospheric particulate polysaccharides in the high summer Arctic, Atmos. Chem. Phys., 13, 12573–12588, https://doi.org/10.5194/acp-13-12573-2013, 2013.
Lenssen, N. J. L., Schmidt, G. A., Hansen, J. E., Menne, M. J., Persin, A., Ruedy, R., and Zyss, D.: Improvements in the GISTEMP Uncertainty Model, J. Geophys. Res.-Atmos., 124, 12, 6307–6326, https://doi.org/10.1029/2018JD029522, 2019.
Liu, X. G., Gu, J. W., Li, Y. P., Cheng, Y. F., Qu, Y., Han, T. T., Wang, J. L., Tian, H. Z., Chen, J., and Zhang, Y. H.: Increase of aerosol scattering by hygroscopic growth: Observation, modeling, and implications on visibility, Atmos. Res., 132, 91–101, https://doi.org/10.1016/j.atmosres.2013.04.007, 2013.
Lohmann, U. and Leck, C.: Importance of submicron surface-active organic aerosols for pristine Arctic clouds, Tellus B, 57, 261–268, https://doi.org/10.1111/j.1600-0889.2005.00144.x, 2005.
Lopez-Yglesias, X. F., Yeung, M. C., Dey, S. E., Brechtel, F. J., and Chan, C. K.: Performance Evaluation of the Brechtel Mfg. Humidified Tandem Differential Mobility Analyzer (BMI HTDMA) for Studying Hygroscopic Properties of Aerosol Particles, Aerosol Sci. Tech., 48, 969–980, https://doi.org/10.1080/02786826.2014.952366, 2014.
Martensson, E. M., Nilsson, E. D., de Leeuw, G., Cohen, L. H., and Hansson, H. C.: Laboratory simulations and parameterization of the primary marine aerosol production, J. Geophys. Res.-Atmos., 108, 4297, https://doi.org/10.1029/2002jd002263, 2003.
Martin, M., Chang, R. Y. W., Sierau, B., Sjogren, S., Swietlicki, E., Abbatt, J. P. D., Leck, C., and Lohmann, U.: Cloud condensation nuclei closure study on summer arctic aerosol, Atmos. Chem. Phys., 11, 11335–11350, https://doi.org/10.5194/acp-11-11335-2011, 2011.
Matsui, H., Kondo, Y., Moteki, N., Takegawa, N., Sahu, L. K., Koike, M., Zhao, Y., Fuelberg, H. E., Sessions, W. R., Diskin, G., Anderson, B. E., Blake, D. R., Wisthaler, A., Cubison, M. J., and Jimenez, J. L.: Accumulation-mode aerosol number concentrations in the Arctic during the ARCTAS aircraft campaign: Long-range transport of polluted and clean air from the Asian continent, J. Geophys. Res.-Atmos., 116, D20217, https://doi.org/10.1029/2011jd016189, 2011.
Mauritsen, T., Sedlar, J., Tjernstrom, M., Leck, C., Martin, M., Shupe, M., Sjogren, S., Sierau, B., Persson, P. O. G., Brooks, I. M., and Swietlicki, E.: An Arctic CCN-limited cloud-aerosol regime, Atmos. Chem. Phys., 11, 165–173, https://doi.org/10.5194/acp-11-165-2011, 2011.
Meier, W. N., Fetterer, F., Windnagel, A. K., and Stewart, S.: NOAA/NSIDC Climate Data Record of Passive Microwave Sea Ice Concentration, Version 4, NSIDC: National Snow and Ice Data Center, Boulder, Colorado, USA [data set], https://doi.org/10.7265/efmz-2t65, 2021.
Moffet, R. C. and Prather, K. A.: In-situ measurements of the mixing state and optical properties of soot with implications for radiative forcing estimates, P. Natl. Acad. Sci. USA, 106, 11872–11877, https://doi.org/10.1073/pnas.0900040106, 2009.
Mungall, E. L., Abbatt, J. P. D., Wentzell, J. J. B., Lee, A. K. Y., Thomas, J. L., Blais, M., Gosselin, M., Miller, L. A., Papakyriakou, T., Willis, M. D., and Liggio, J.: Microlayer source of oxygenated volatile organic compounds in the summertime marine Arctic boundary layer, P. Natl. Acad. Sci. USA, 114, 6203–6208, https://doi.org/10.1073/pnas.1620571114, 2017.
Myriokefalitakis, S., Vignati, E., Tsigaridis, K., Papadimas, C., Sciare, J., Mihalopoulos, N., Facchini, M. C., Rinaldi, M., Dentener, F. J., Ceburnis, D., Hatzianastasiou, N., O'Dowd, C. D., van Weele, M., and Kanakidou, M.: Global Modeling of the Oceanic Source of Organic Aerosols, Adv. Meteorol., 10, 939171, https://doi.org/10.1155/2010/939171, 2010.
Nakao, S., Suda, S. R., Camp, M., Petters, M. D., and Kreidenweis, S. M.: Droplet activation of wet particles: development of the Wet CCN approach, Atmos. Meas. Tech., 7, 2227–2241, https://doi.org/10.5194/amt-7-2227-2014, 2014.
Nguyen, Q. T., Glasius, M., Sorensen, L. L., Jensen, B., Skov, H., Birmili, W., Wiedensohler, A., Kristensson, A., Nojgaard, J. K., and Massling, A.: Seasonal variation of atmospheric particle number concentrations, new particle formation and atmospheric oxidation capacity at the high Arctic site Villum Research Station, Station Nord, Atmos. Chem. Phys., 16, 11319–11336, https://doi.org/10.5194/acp-16-11319-2016, 2016.
Nielsen, I. E., Skov, H., Massling, A., Eriksson, A. C., Dall'Osto, M., Junninen, H., Sarnela, N., Lange, R., Collier, S., Zhang, Q., Cappa, C. D., and Nojgaard, J. K.: Biogenic and anthropogenic sources of aerosols at the High Arctic site Villum Research Station, Atmos. Chem. Phys., 19, 10239–10256, https://doi.org/10.5194/acp-19-10239-2019, 2019.
Orellana, M. V., Matrai, P. A., Leck, C., Rauschenberg, C. D., Lee, A. M., and Coz, E.: Marine microgels as a source of cloud condensation nuclei in the high Arctic, P. Natl. Acad. Sci. USA, 108, 13612–13617, https://doi.org/10.1073/pnas.1102457108, 2011.
Ovadnevaite, J., Ceburnis, D., Martucci, G., Bialek, J., Monahan, C., Rinaldi, M., Facchini, M. C., Berresheim, H., Worsnop, D. R., and O'Dowd, C.: Primary marine organic aerosol: A dichotomy of low hygroscopicity and high CCN activity, Geophys. Res. Lett., 38, L21806, https://doi.org/10.1029/2011gl048869, 2011.
Ovadnevaite, J., Zuend, A., Laaksonen, A., Sanchez, K. J., Roberts, G., Ceburnis, D., Decesari, S., Rinaldi, M., Hodas, N., Facchini, M. C., Seinfeld, J. H., and Dowd, C. O.: Surface tension prevails over solute effect in organic-influenced cloud droplet activation, Nature, 546, 637–641, https://doi.org/10.1038/nature22806, 2017.
Pernov, J., Lange, R., and Massling, A.: Datasets for `High Arctic aerosol hygroscopicity at sub- and supersaturated conditions during spring and summer', Zenodo [data set], https://doi.org/10.5281/zenodo.7307293, 2022.
Petters, M. D. and Kreidenweis, S. M.: A single parameter representation of hygroscopic growth and cloud condensation nucleus activity, Atmos. Chem. Phys., 7, 1961–1971, https://doi.org/10.5194/acp-7-1961-2007, 2007.
Pfeifer, S., Birmili, W., Schladitz, A., Muller, T., Nowak, A., and Wiedensohler, A.: A fast and easy-to-implement inversion algorithm for mobility particle size spectrometers considering particle number size distribution information outside of the detection range, Atmos. Meas. Tech., 7, 95–105, https://doi.org/10.5194/amt-7-95-2014, 2014.
Pilat, J. and Charlson, J.: Theoretical and optical studies of humidity effects on the size distribution of a hygroscopic aerosol, J. Rech. Atmos., 1, 165–170, 1966.
Quinn, P. K., Shaw, G., Andrews, E., Dutton, E. G., Ruoho-Airola, T., and Gong, S. L.: Arctic haze: current trends and knowledge gaps, Tellus B, 59, 99–114, https://doi.org/10.1111/j.1600-0889.2006.00238.x, 2007.
Quinn, P. K., Bates, T. S., Baum, E., Doubleday, N., Fiore, A. M., Flanner, M., Fridlind, A., Garrett, T. J., Koch, D., Menon, S., Shindell, D., Stohl, A., and Warren, S. G.: Short-lived pollutants in the Arctic: their climate impact and possible mitigation strategies, Atmos. Chem. Phys., 8, 1723–1735, https://doi.org/10.5194/acp-8-1723-2008, 2008.
Quinn, P. K., Coffman, D. J., Johnson, J. E., Upchurch, L. M., and Bates, T. S.: Small fraction of marine cloud condensation nuclei made up of sea spray aerosol, Nat. Geosci., 10, 674–679, https://doi.org/10.1038/Ngeo3003, 2017.
Rastak, N., Silvergren, S., Zieger, P., Wideqvist, U., Strom, J., Svenningsson, B., Maturilli, M., Tesche, M., Ekman, A. M. L., Tunved, P., and Riipinen, I.: Seasonal variation of aerosol water uptake and its impact on the direct radiative effect at Ny-Ålesund, Svalbard, Atmos. Chem. Phys., 14, 7445–7460, https://doi.org/10.5194/acp-14-7445-2014, 2014.
Rastak, N., Pajunoja, A., Acosta Navarro, J. C., Ma, J., Song, M., Partridge, D. G., Kirkevåg, A., Leong, Y., Hu, W. W., Taylor, N. F., Lambe, A., Cerully, K., Bougiatioti, A., Liu, P., Krejci, R., Petäjä, T., Percival, C., Davidovits, P., Worsnop, D. R., Ekman, A. M. L., Nenes, A., Martin, S., Jimenez, J. L., Collins, D. R., Topping, D. O., Bertram, A. K., Zuend, A., Virtanen, A., and Riipinen, I.: Microphysical explanation of the RH-dependent water affinity of biogenic organic aerosol and its importance for climate, Geophys. Res. Lett., 44, 5167–5177, https://doi.org/10.1002/2017GL073056, 2017.
Raut, J. C., Chazette, P., and Fortain, A.: Link between aerosol optical, microphysical and chemical measurements in an underground railway station in Paris, Atmos. Environ., 43, 860–868, https://doi.org/10.1016/j.atmosenv.2008.10.038, 2009.
Rempillo, O., Seguin, A. M., Norman, A. L., Scarratt, M., Michaud, S., Chang, R., Sjostedt, S., Abbatt, J., Else, B., Papakyriakou, T., Sharma, S., Grasby, S., and Levasseur, M.: Dimethyl sulfide air-sea fluxes and biogenic sulfur as a source of new aerosols in the Arctic fall, J. Geophys. Res.-Atmos., 116, D00S04, https://doi.org/10.1029/2011jd016336, 2011.
Rosati, B., Paul, A., Iversen, E. M., Massling, A., and Bilde, M.: Reconciling atmospheric water uptake by hydrate forming salts, Environ. Sci.: Process. Imp., 22, 1759–1767, https://doi.org/10.1039/D0EM00179A, 2020.
Rose, D., Nowak, A., Achtert, P., Wiedensohler, A., Hu, M., Shao, M., Zhang, Y., Andreae,M.O., and Pöschl, U.: Cloud condensation nuclei in polluted air and biomass burning smoke near the mega-city Guangzhou, China – Part 1: size-resolved measurements and implications for the modeling of aerosol particle hygroscopicity and CCN activity, Atmos. Chem. Phys., 10, 3365–3383, https://doi.org/10.5194/acp-10-3365-2010, 2010.
Schmale, J. and Baccarini, A.: Progress in unraveling atmospheric new particle formation and growth across the Arctic, Geophys. Res. Lett., 48, e2021GL094198l, https://doi.org/10.1029/2021GL094198, 2021.
Schmale, J., Henning, S., Decesari, S., Henzing, B., Keskinen, H., Sellegri, K., Ovadnevaite, J., Pohlker, M. L., Brito, J., Bougiatioti, A., Kristensson, A., Kalivitis, N., Stavroulas, I., Carbone, S., Jefferson, A., Park, M., Schlag, P., Iwamoto, Y., Aalto, P., Aijala, M., Bukowiecki, N., Ehn, M., Frank, G., Frohlich, R., Frumau, A., Herrmann, E., Herrmann, H., Holzinger, R., Kos, G., Kulmala, M., Mihalopoulos, N., Nenes, A., O'Dowd, C., Petaja, T., Picard, D., Pohlker, C., Poschl, U., Poulain, L., Prevot, A. S. H., Swietlicki, E., Andreae, M. O., Artaxo, P., Wiedensohler, A., Ogren, J., Matsuki, A., Yum, S. S., Stratmann, F., Baltensperger, U., and Gysel, M.: Long-term cloud condensation nuclei number concentration, particle number size distribution and chemical composition measurements at regionally representative observatories, Atmos. Chem. Phys., 18, 2853–2881, https://doi.org/10.5194/acp-18-2853-2018, 2018.
Schmale, J., Zieger, P., and Ekman, A. M. L.: Aerosols in current and future Arctic climate, Nat. Clim. Change, 11, 95–105, https://doi.org/10.1038/s41558-020-00969-5, 2021.
Schmale, J., Sharma, S., Decesari, S., Pernov, J., Massling, A., Hansson, H.-C., von Salzen, K., Skov, H., Andrews, E., Quinn, P. K., Upchurch, L. M., Eleftheriadis, K., Traversi, R., Gilardoni, S., Mazzola, M., Laing, J., and Hopke, P.: Pan-Arctic seasonal cycles and long-term trends of aerosol properties from 10 observatories, Atmos. Chem. Phys., 22, 3067–3096, https://doi.org/10.5194/acp-22-3067-2022, 2022.
Shaw, G. E.: The arctic haze phenomenon, B. Am. Meteorol. Soc., 76, 2403–2413, https://doi.org/10.1175/1520-0477(1995)076<2403:TAHP>2.0.CO;2, 1995.
Shaw, P. M., Russell, L. M., Jefferson, A., and Quinn, P. K.: Arctic organic aerosol measurements show particles from mixed combustion in spring haze and from frost flowers in winter, Geophys. Res. Lett., 37, L10803, https://doi.org/10.1029/2010gl042831, 2010.
Silvergren, S., Wideqvist, U., Strom, J., Sjogren, S., and Svenningsson, B.: Hygroscopic growth and cloud forming potential of Arctic aerosol based on observed chemical and physical characteristics (a 1 year study 2007–2008), J. Geophys. Res.-Atmos., 119, 14080–14097, https://doi.org/10.1002/2014JD021657, 2014.
Skov, H., Massling, A., Nielsen, I. E., Nordstrøm, C., Bossi, R., Vorkamp, K., Christensen, J., Larsen, M. M., Hansen, K. M., Liisberg, J. B., and Poulsen, M. B.: AMAP CORE – ATMOSPHERIC PART. Results from Villum Research Station, Technical Report from DCE – Danish Centre for Environment and Energy No. 101, Aarhus University, 77 pp., http://dce2.au.dk/pub/TR101.pdf (last access: 12 April 2023), 2017.
Stohl, A.: Characteristics of atmospheric transport into the Arctic troposphere, J. Geophys. Res.-Atmos., 111, D11306, https://doi.org/10.1029/2005jd006888, 2006.
Stolzenburg, M. R. and McMurry, P. H.: Equations governing single and tandem DMA configurations and a new lognormal approximation to the transfer function, Aerosol Sci. Tech., 42, 421–432, https://doi.org/10.1080/02786820802157823, 2008.
Titos, G., Cazorla, A., Zieger, P., Andrews, E., Lyamani, H., Granados-Munoz, M. J., Olmo, F. J., and Alados-Arboledas, L.: Effect of hygroscopic growth on the aerosol light-scattering coefficient: A review of measurements, techniques and error sources, Atmos. Environ., 141, 494–507, https://doi.org/10.1016/j.atmosenv.2016.07.021, 2016.
Tremblay, S., Picard, J. C., Bachelder, J. O., Lutsch, E., Strong, K., Fogal, P., Leaitch, W. R., Sharma, S, Kolonjari, F., Cox, C. J., Chang, R. Y. W., and Hayes, P. L.: Characterization of aerosol growth events over Ellesmere Island during the summers of 2015 and 2016, Atmos. Chem. Phys., 19, 5589–5604, https://doi.org/10.5194/acp-19-5589-2019, 2019.
Tunved, P., Strom, J., and Krejci, R.: Arctic aerosol life cycle: linking aerosol size distributions observed between 2000 and 2010 with air mass transport and precipitation at Zeppelin station, Ny-Ålesund, Svalbard, Atmos. Chem. Phys., 13, 3643–3660, https://doi.org/10.5194/acp-13-3643-2013, 2013.
Twomey, S.: Pollution and the Planetary Albedo, Atmos. Environ., 8, 1251–1256, https://doi.org/10.1016/0004-6981(74)90004-3, 1974.
Wexler, A. S. and Clegg, S. L.: Atmospheric aerosol models for systems including the ions H+, , Na+, , , Cl−, Br−, and H2O, J. Geophys. Res.-Atmos., 107, ACH 14-1–ACH 14-14, https://doi.org/10.1029/2001jd000451, 2002.
Wiedensohler, A., Birmili, W., Nowak, A., Sonntag, A., Weinhold, K., Merkel, M., Wehner, B., Tuch, T., Pfeifer, S., Fiebig, M., Fjaraa, A. M., Asmi, E., Sellegri, K., Depuy, R., Venzac, H., Villani, P., Laj, P., Aalto, P., Ogren, J. A., Swietlicki, E., Williams, P., Roldin, P., Quincey, P., Huglin, C., Fierz-Schmidhauser, R., Gysel, M., Weingartner, E., Riccobono, F., Santos, S., Gruning, C., Faloon, K., Beddows, D., Harrison, R. M., Monahan, C., Jennings, S. G., O'Dowd, C. D., Marinoni, A., Horn, H. G., Keck, L., Jiang, J., Scheckman, J., McMurry, P. H., Deng, Z., Zhao, C. S., Moerman, M., Henzing, B., de Leeuw, G., Loschau, G., and Bastian, S.: Mobility particle size spectrometers: harmonization of technical standards and data structure to facilitate high quality long-term observations of atmospheric particle number size distributions, Atmos. Meas. Tech., 5, 657–685, https://doi.org/10.5194/amt-5-657-2012, 2012.
Willis, M. D., Burkart, J., Thomas, J. L., Kollner, F., Schneider, J., Bozem, H., Hoor, P. M., Aliabadi, A. A., Schulz, H., Herber, A. B., Leaitch, W. R., and Abbatt, J. P. D.: Growth of nucleation mode particles in the summertime Arctic: a case study, Atmos. Chem. Phys., 16, 7663–7679, https://doi.org/10.5194/acp-16-7663-2016, 2016.
Willis, M. D., Köllner, F., Burkart, J., Bozem, H., Thomas, J. L., Schneider, J., Aliabadi, A. A., Hoor, P. M., Schulz, H., Herber, A. B., Leaitch, W. R., and Abbatt, J. P. D.: Evidence for marine biogenic influence on summertime Arctic aerosol, Geophys. Res. Lett., 44, 6460–6470, https://doi.org/10.1002/2017gl073359, 2017.
Xu, W., Ovadnevaite, J., Fossum, K.N., Lin, C, Huang, R.-J., Ceburnis, D., and O'Dowd, C: Sea spray as an obscured source for marine cloud nuclei, Nat. Geosci., 15, 282–286, https://doi.org/10.1038/s41561-022-00917-2, 2022.
Yang, Q., Bitz, C. M., and Doherty, S. J.: Offsetting effects of aerosols on Arctic and global climate in the late 20th century, Atmos. Chem. Phys., 14, 3969–3975, https://doi.org/10.5194/acp-14-3969-2014, 2014.
Zabori, J., Rastak, N., Yoon, Y. J., Riipinen, I., and Strom, J.: Size-resolved cloud condensation nuclei concentration measurements in the Arctic: two case studies from the summer of 2008, Atmos. Chem. Phys., 15, 13803–13817, https://doi.org/10.5194/acp-15-13803-2015, 2015.
Zhao, C. F. and Garrett, T. J.: Effects of Arctic haze on surface cloud radiative forcing, Geophys. Res. Lett., 42, 557–564, https://doi.org/10.1002/2014gl062015, 2015.
Zhou, J. C., Swietlicki, E., Berg, O. H., Aalto, P. P., Hameri, K., Nilsson, E. D., and Leck, C.: Hygroscopic properties of aerosol particles over the central Arctic Ocean during summer, J. Geophys. Res.-Atmos., 106, 32111–32123, https://doi.org/10.1029/2000jd900426, 2001.
Zieger, P., Fierz-Schmidhauser, R., Gysel, M., Ström, J., Henne, S., Yttri, K. E., Baltensperger, U., and Weingartner, E.: Effects of relative humidity on aerosol light scattering in the Arctic, Atmos. Chem. Phys., 10, 3875–3890, https://doi.org/10.5194/acp-10-3875-2010, 2010.