the Creative Commons Attribution 4.0 License.
the Creative Commons Attribution 4.0 License.
 | 24 Apr 2023
An attribution of the low single-scattering albedo of biomass burning aerosol over the southeastern Atlantic
Amie Dobracki
Steven G. Howell
Pablo Saide
Steffen Freitag
Allison C. Aiken
Sharon P. Burton
Arthur J. Sedlacek III
Jens Redemann
Robert Wood
Aerosol over the remote southeastern Atlantic is some of the most sunlight-absorbing aerosol on the planet: the in situ free-tropospheric single-scattering albedo at the 530 nm wavelength (SSA530 nm) ranges from 0.83 to 0.89 within ORACLES (ObseRvations of Aerosols above CLouds and their intEractionS) aircraft flights from late August–September. Here we seek to explain the low SSA. The SSA depends strongly on the black carbon (BC) number fraction, which ranges from 0.15 to 0.4. Low organic aerosol (OA)-to-BC mass ratios of 8–14 and modified combustion efficiency values >0.975 point indirectly to the dry, flame-efficient combustion of primarily grass fuels, with back trajectories ending in the miombo woodlands of Angola. The youngest aerosol, aged 4–5 d since emission, occupied the top half of a 5 km thick plume sampled directly west of Angola with a vertically consistent BC:ΔCO (carbon monoxide) ratio, indicating a homogenization of the source emissions. The younger aerosol, transported more quickly off of the continent by stronger winds, overlaid older, slower-moving aerosol with a larger mean particle size and fraction of BC-containing particles. This is consistent with ongoing gas condensation and the coagulation of smaller non-BC particles upon the BC-containing particles. The particle volumes and OA:BC mass ratios of the older aerosol were smaller, attributed primarily to evaporation following fragmentation, instead of dilution or thermodynamics. The CLARIFY (CLoud–Aerosol–Radiation Interaction and Forcing: Year 2017) aircraft campaign sampled aerosols that had traveled further to reach the more remote Ascension Island. CLARIFY reported higher BC number fractions, lower OA:BC mass ratios, and lower SSA yet larger mass absorption coefficients compared to this study's. Values from one ORACLES 2017 flight, held midway to Ascension Island, are intermediate, confirming the long-range changes. Overall the data are most consistent with continuing oxidation through fragmentation releasing aerosols that subsequently enter the gas phase, reducing the OA mass, rather than evaporation through dilution or thermodynamics. The data support the following best fit: SSA (r=0.84). The fires of southern Africa emit approximately one-third of the world's carbon; the emitted aerosols are distinct from other regional smoke emissions, and their composition needs to be represented appropriately to realistically depict regional aerosol radiative effects.
- Article
(8817 KB) - Full-text XML
-
Supplement
(6569 KB) - BibTeX
- EndNote


Biomass burning, the largest source of carbon to the atmosphere globally, is fundamental to the Earth's global carbon cycle (Bowman et al., 2009; Bond et al., 2013). The emissions include carbon monoxide, carbon dioxide, methane, and carbonaceous aerosols, significantly altering the atmospheric composition over large regions of the globe (Andreae, 2019). This in turn influences all of the gaseous, aerosol, and aerosol–cloud interaction radiative forcing terms considered within the IPCC Assessments. Despite the importance of biomass burning events for climate, smoke properties after long-range transport are still poorly characterized. These include the effluent from northern European and Russian forest fires reaching the Arctic basin (Cubison et al., 2011), wildfire smoke from western continental North America observed over Europe (Zheng et al., 2020; Baars et al., 2021), and aerosols from fires in southern Africa reaching South America (Holanda et al., 2020). Without wet or dry scavenging, the aerosol’s areal coverage is increased through transport, increasing the aerosol's radiative impact.
The southern Africa region produces approximately one-third of the world's fire-emitted carbon (van der Werf et al., 2010). The global maximum of absorbing aerosol above cloud occurs above the southeastern Atlantic (Waquet et al., 2013), a combination that produces a direct radiative warming of the regional climate (Keil and Haywood, 2003; Graaf et al., 2014; Zuidema et al., 2016; Mallet et al., 2021; Doherty et al., 2022). Biomass burning aerosol (BBA) from this region is unusual for being highly absorbing of sunlight, with single-scattering albedo (SSA) values of 0.85 or less at the green wavelength (Zuidema et al., 2018; Chylek et al., 2019; Pistone et al., 2019; Holanda et al., 2020; Taylor et al., 2020; Denjean et al., 2020b; Mallet et al., 2020; Shinozuka et al., 2020; Carter et al., 2021; Brown et al., 2021). More absorbing aerosol will reduce the need for latent heat release as a balance to longwave radiative cooling within the world's energy distribution (Pendergrass and Hartmann, 2012) and alters regional circulation and precipitation patterns (Mallet et al., 2020; Solmon et al., 2021; Chaboureau et al., 2022). While climate models discern an ensemble mean direct radiative warming, individual models disagree strongly on magnitude and even sign (Myhre et al., 2013; Zuidema et al., 2016; Haywood et al., 2021; Mallet et al., 2021). In addition, the direct aerosol radiative effect estimated from satellites typically exceeds model estimates (de Graaf et al., 2020). That the measured SSAs are lower than what is currently implemented in many models (Shinozuka et al., 2020; Mallet et al., 2021; Doherty et al., 2022) suggests that one cause for an underestimated modeled direct radiative warming is a model SSA that is too high.
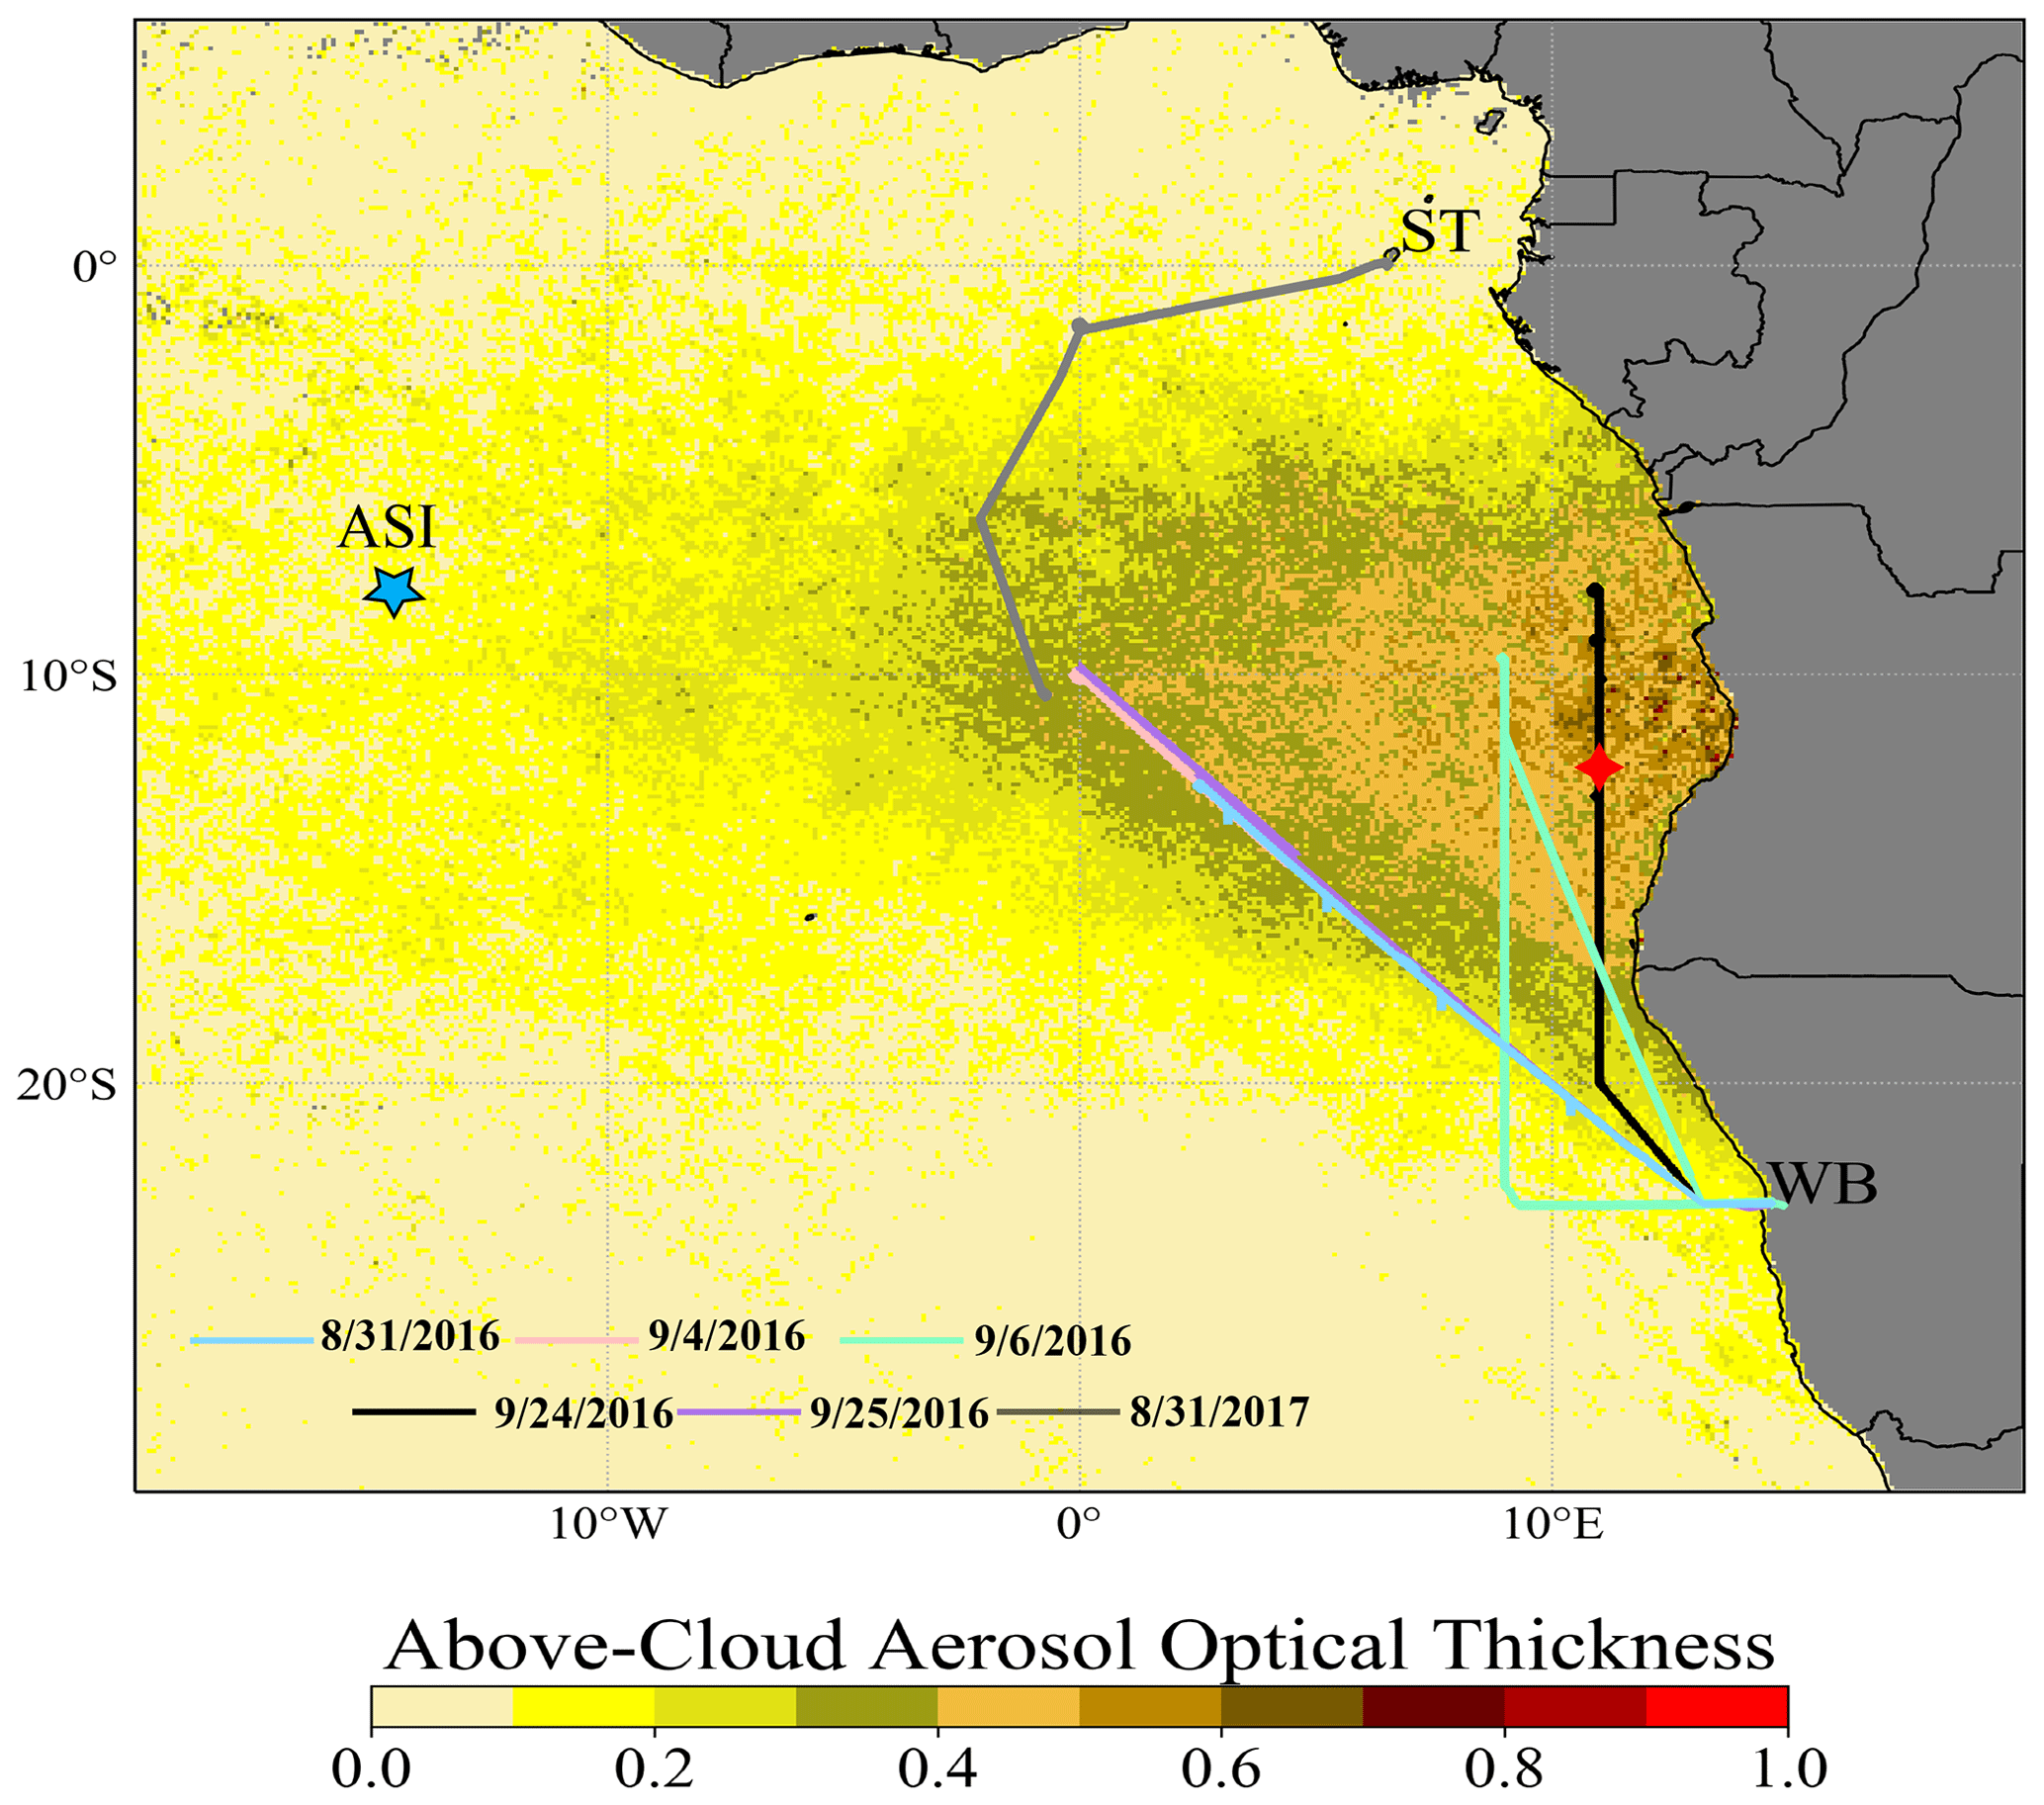
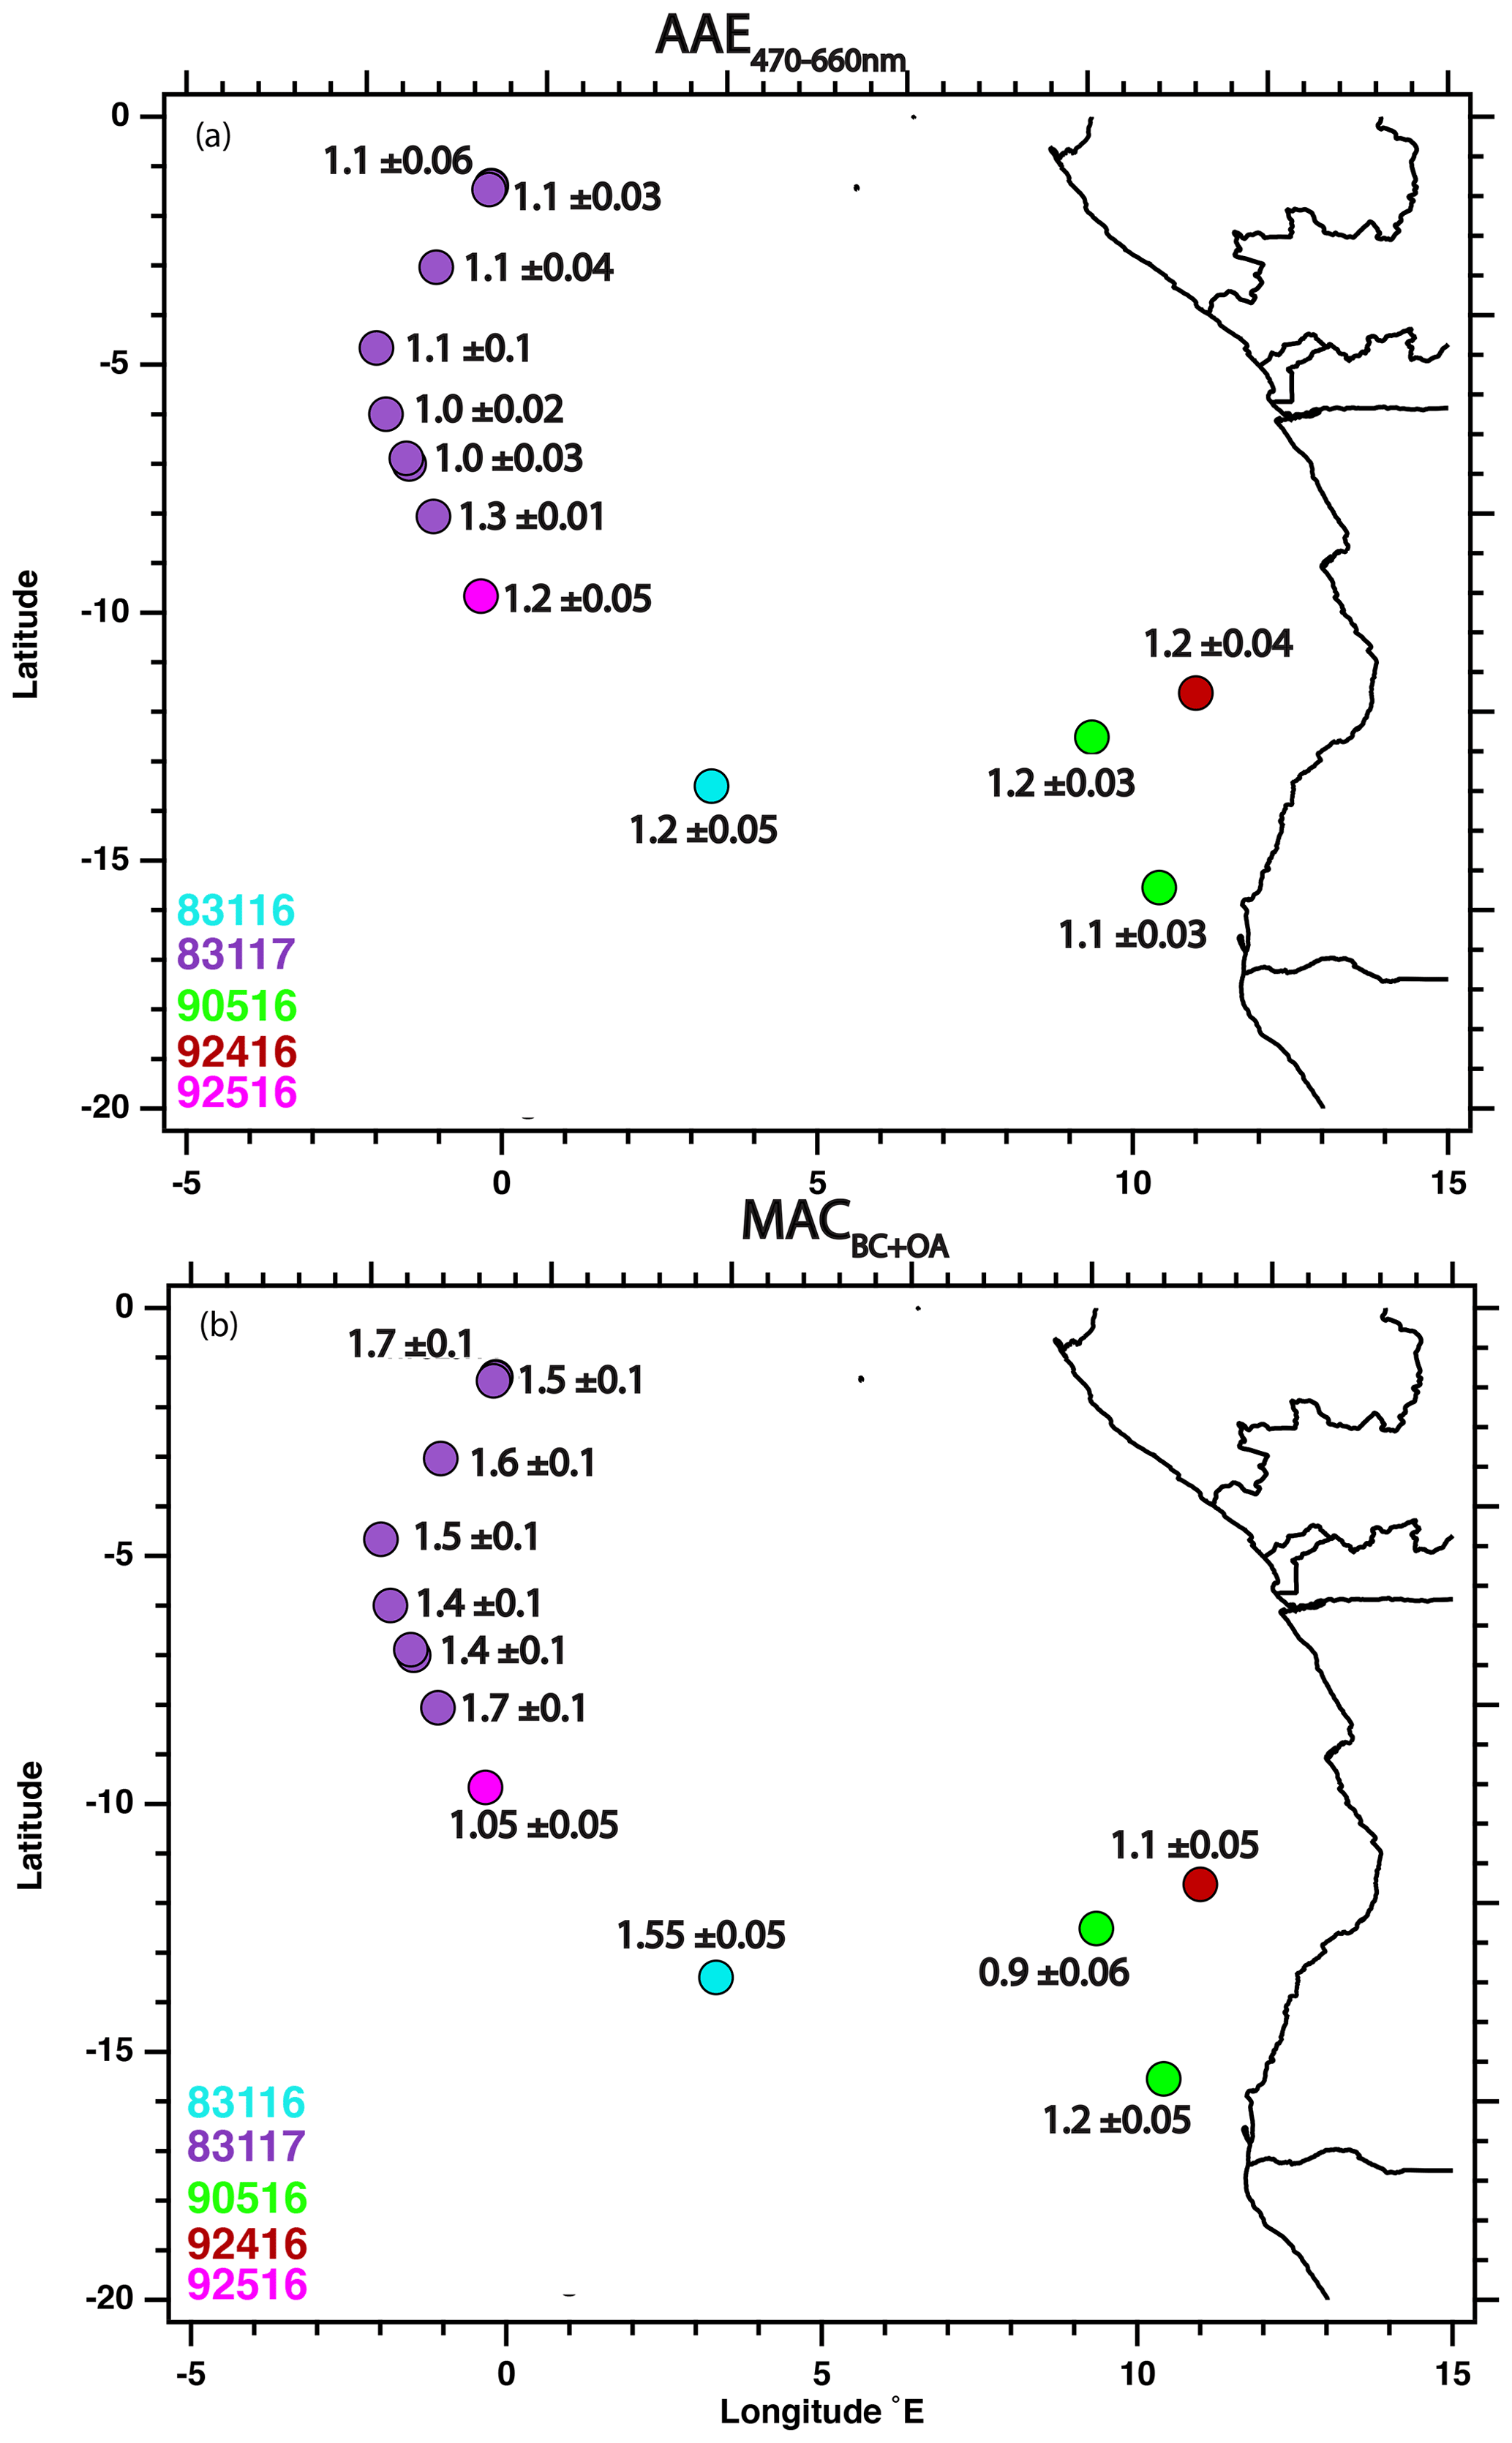
Figure 1Terra MODIS above-cloud aerosol optical depth (Meyer et al., 2015) for September 2016 overlaid with the tracks of the six flights selected for this study. The location of the profile shown in Fig. 12 is indicated with red diamonds. ST: São Tomé; WB: Walvis Bay; ASI: Ascension Island.
This study's goal is to examine the optical properties and composition of in situ smoke sampled in the free troposphere during six flights of the NASA Earth Venture Suborbital-2 ORACLES (ObseRvations of Aerosols above CLouds and their intEractionS; Redemann et al., 2021) deployment, primarily from September 2016 (Fig. 1). Complementary observations were taken in this region by the UK CLARIFY (CLoud–Aerosol–Radiation Interaction and Forcing: Year 2017) aircraft campaign (Haywood et al., 2021) on Ascension Island (8∘ S, 14.5∘ W) from 17 August–7 September 2017 and the DACCIWA (Dynamics–Aerosol–Chemistry–Clouds Interactions in West Africa) airborne campaign over southern West Africa during June–July 2016 (Knippertz et al., 2015). Both campaigns have already revealed that southern African biomass burning aerosol (BBA) is highly absorbing of sunlight because the fractional black carbon content is high in both number and mass of total particles (Taylor et al., 2020; Denjean et al., 2020b), with loss of particle coating also contributing (Sedlacek et al., 2022). We further strengthen the attribution to aerosol composition, fire source characteristics, and indicators of chemical aging and seek to place the ORACLES data within the context of these other measurements. The aerosol sampled during the Southern African Regional Science Initiative (SAFARI) campaign (Haywood et al., 2003) held in 2002 near Namibia was less than 3 d of age, while the CLARIFY 2017 campaign over Ascension sampled aerosol approximately a week old (Wu et al., 2020; Taylor et al., 2020). The ORACLES 2016 model-derived age estimates place the flights uniquely within the time record available on chemical aging over the southeastern Atlantic.
The paper is organized as follows: Sect. 2 describes the methodology, including a description of the flights and relevant details about the datasets, with the more technical details relegated to the Supplement. Section 3 presents the chemical characterization, including the aerosol age estimates. Section 4 discusses the chemical optical and physical properties of the smoke plumes, including the likelihood of brown carbon. Section 5 investigates how the organic aerosol component varies between the flights and whether OA differences can be explained as a aging process, with Sect. 6 incorporating a comparison to measurements made at Ascension. Section 7 provides a summary and discussion.
Six flights were selected, based on the availability of at least 20 min of organic aerosol (OA) masses exceeding >20 µg m−3 (a threshold justified in Sect. 2.4.2), at altitudes above 1.5 km and relative humidity (RH) <80 %. The latter is applied to reduce the likelihood of aqueous-phase reactions. The flights occur within 30 d of each other in the seasonal cycle, spanning 31 August through all of September, to preferentially select for similar composition of the fire source emissions. Five flights come from 2016 and one from 2017, with their tracks shown relative to the satellite-derived above-cloud aerosol optical depths for September 2016 in Fig. 1. Spatial maps of the aerosol forecasts used to guide the flight planning are shown overlaid with each flight's track, along with measured OA mass concentrations and a model-estimated aerosol age based on CO tracers (explained further in Sect. 2.2) on individual altitude–latitude flight-track projections in the Supplement (Figs. S1 and S2).
A further description of the flights is followed by descriptions of the datasets that are more central to the results (listed in Table 1), with the more technical details provided in the Supplement.
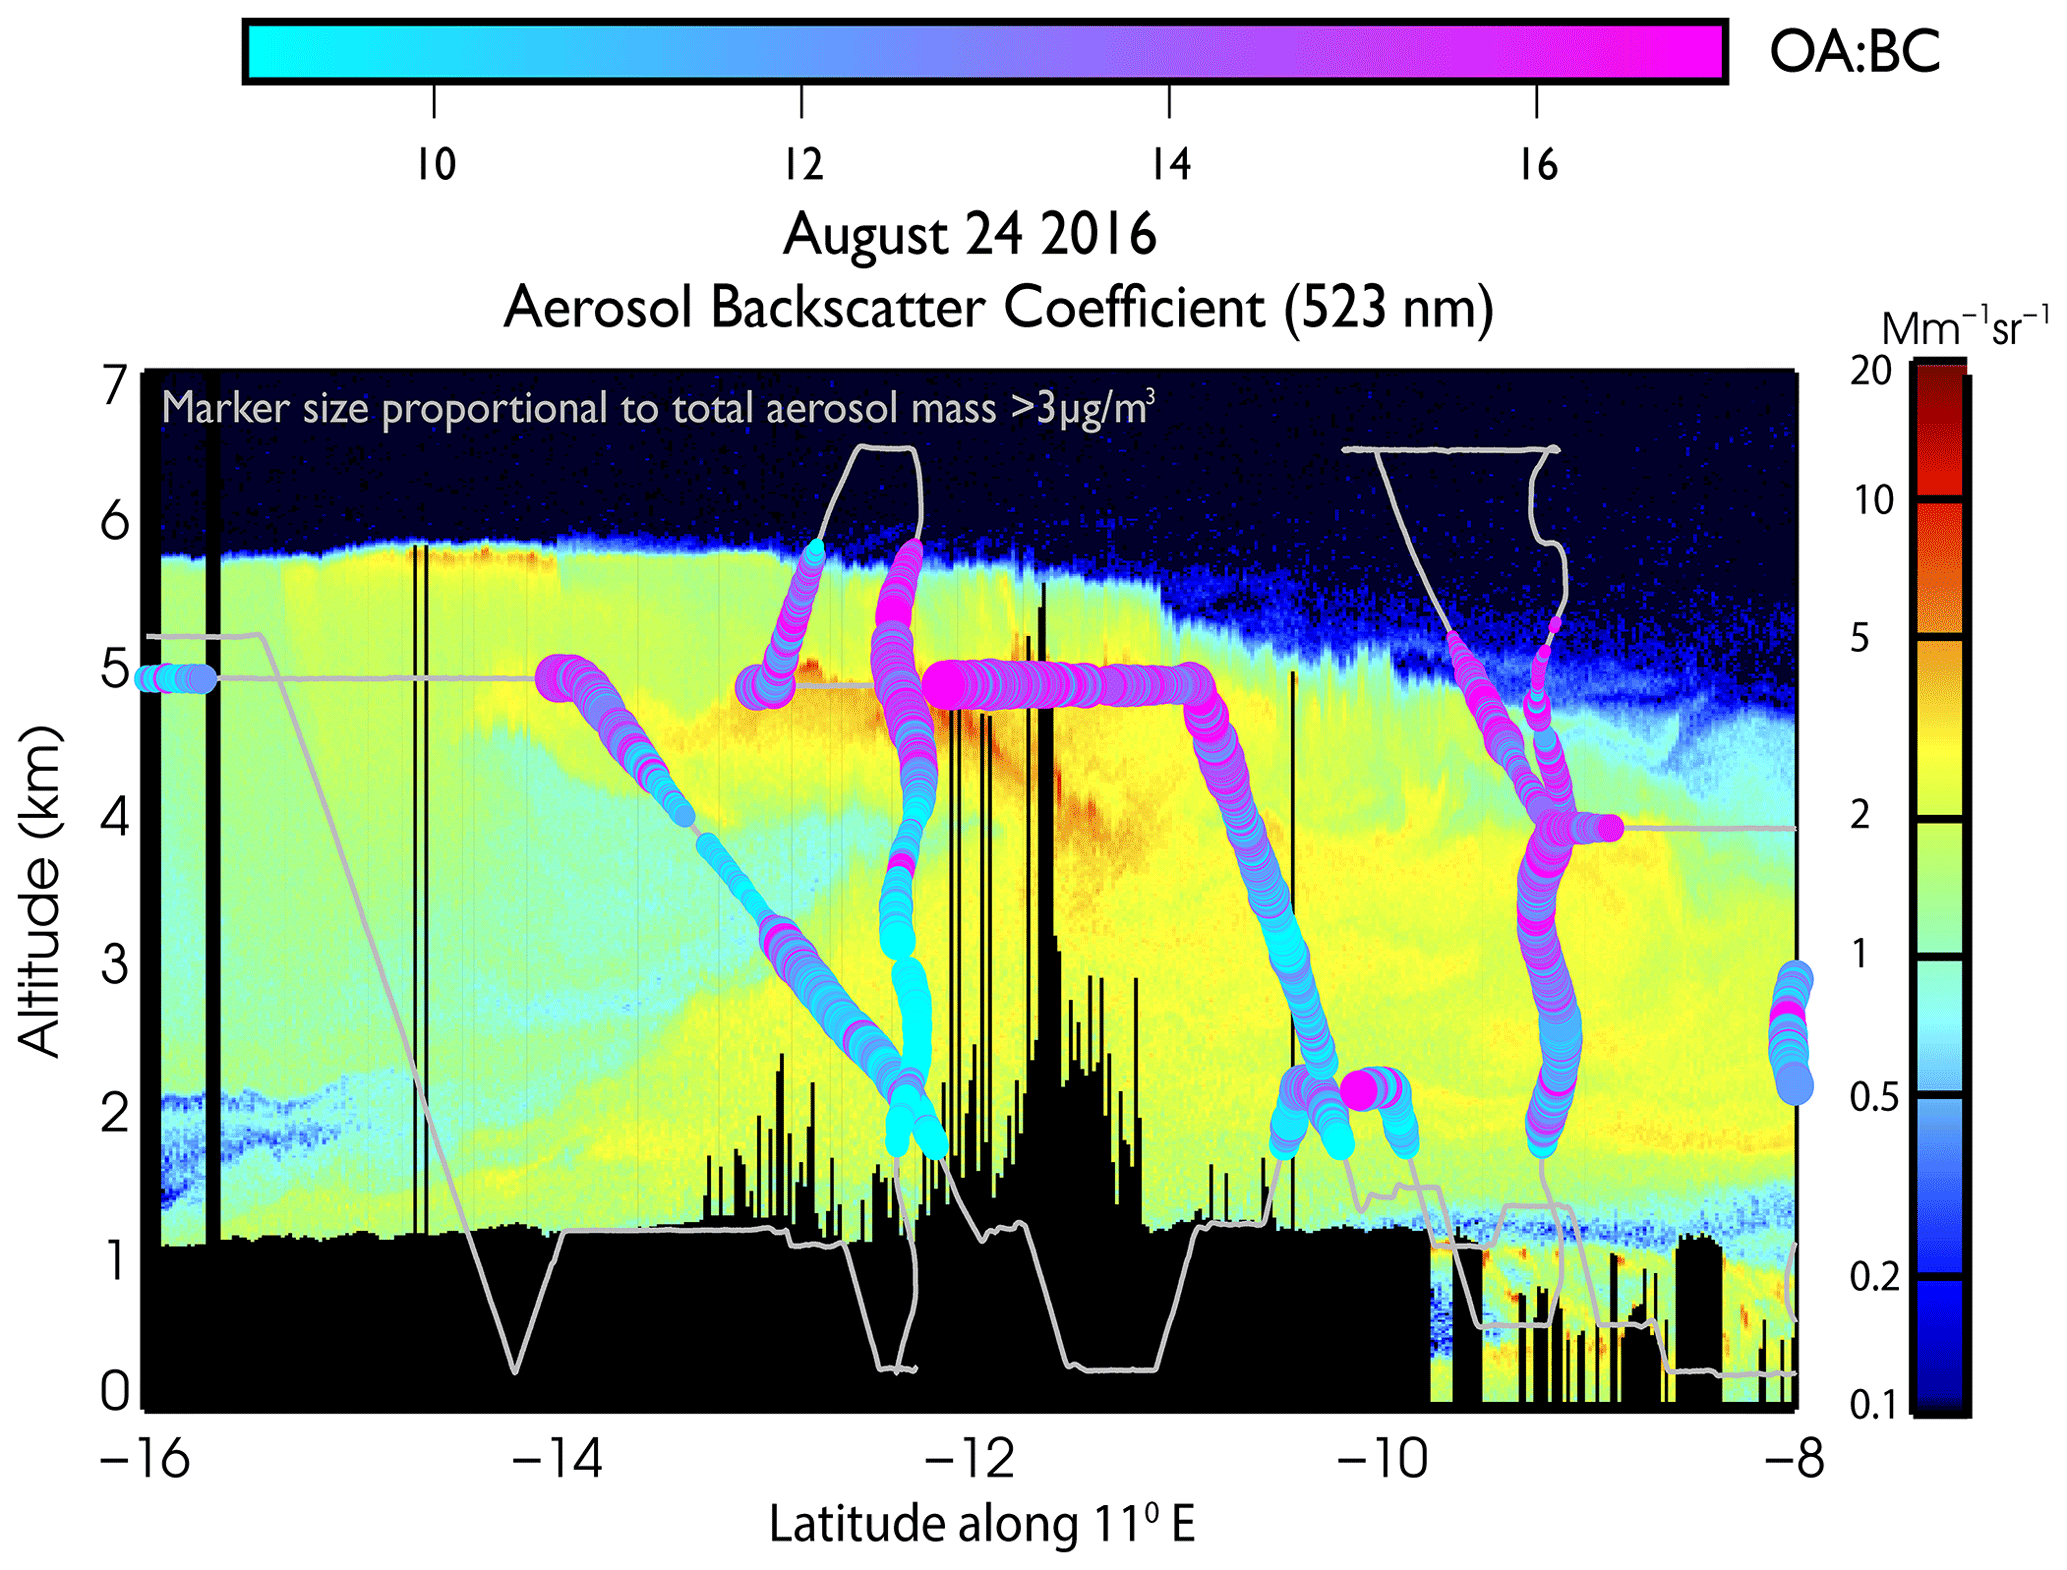
Figure 224 September 2016 flight track with colorized OA:BC mass ratios superimposed on High-Spectral-Resolution Lidar – Generation 2 (HSRL-2) 523 nm aerosol backscatter imagery collected along 11∘ E by the overflying ER-2 plane, near in time to the P-3 plane's location at 10∘ S.
2.1 Flight description
The aircraft flew along a routine southeast to northwest track on three flights (31 August, 4 and 25 September 2016) and performed three target-of-opportunity flights sampling more aerosol-rich locations (6 and 24 September 2016, 31 August 2017), all shown in Figs. S1 and S2. The flight tracks make clear that the aircraft sampled widely, but never near the fire emission sources, with the 24 September 2016 flight coming closest (Fig. 2). The aerosol spatial distribution is strongly influenced by the strength of the free-tropospheric easterly winds, with the aerosol either constrained to be near the coast when the winds are weak or elongated zonally along 10∘ S when the winds are strong. On the 24–25 September 2016 and 31 August 2017 flights, the zonal easterly winds exceeded 6 m s−1 along ∼10∘ S at altitudes between 3 and 5 km, forming a wind isotach known as the African Easterly Jet South (Nicholson and Grist, 2003; Adebiyi and Zuidema, 2016). Overall, September 2016 was climatologically representative (Ryoo et al., 2021), with more synoptic detail on individual flight days available in Ryoo et al. (2022).
An aerosol forecast model was used to seek out smoke layers to sample during the target-of-opportunity flights. The six flights intersect aerosol of different ages, but all model-estimated ages exceed 4 d. Table S1 lists all of the ORACLES 2016 flights and includes comments on their flight pattern, the number of seconds with OA >20 µg m−3, and other selection considerations. We highlight two flights further: one from 24 September 2016 because it sampled a thick, younger smoke plume as close as possible to a fire emission source (Fig. 2) and the 31 September 2017 flight, which sampled an aerosol layer of significant mass and extremely stable OA:BC halfway between Ascension and the African continent and helps connect interpretations of ORACLES to CLARIFY aerosol characteristics. The focus on these two flights has been added since (Dobracki et al., 2022). Optical properties were primarily examined for data from level legs, for which further time averaging could reduce the measurement uncertainty. Table S2 provides flight dates, location, time span, and altitude of the level-leg data we analyze further, ranging 4 to 10 min in length.
2.2 Determination of physical aerosol age
Model-released tracers tagged to CO at the fire source for each day of the campaign's operational 2-week aerosol forecast, made using the Weather Research Forecasting–Aerosol Aware Microphysics (WRF-AAM) model (Thompson and Eidhammer, 2014), were used to estimate the physical age of the aerosol. The regional model has a 12 km spatial resolution and encompasses a domain (41∘ S–14∘ N, 34∘ W–51∘ E) sufficiently large to capture almost all contributing fires (Saide et al., 2016). The model is driven by the National Center for Environmental Prediction Global Forecasting System (NCEP GFS) meteorology, using daily smoke emissions from the Quick Fire Emissions Dataset (Darmenov and da Silva, 2013) released into the model surface layer. These are advected thereafter according to the model physics, with their spatial distribution constrained in near-real time with satellite-derived optical depths. Most fires in southern Africa occur during the day, and the satellite constraint captures this diurnal cycle. The model fire emissions rely on a burned-area product of 500 m spatial resolution from the Moderate Resolution Imaging Spectrometer (Giglio et al., 2006). This may miss up to ∼40 % of the total burned area coming from smaller fires (Ramo et al., 2021). Larger fires, with more protected cores, contribute more to the emissions reaching higher altitudes for the boreal Northern Hemisphere (Martin et al., 2010). We are unsure how well this same vertical selection applies for the smaller agricultural fires of southern Africa, although stronger zonal winds aloft will aid lofting of the smoke underneath (Adebiyi and Zuidema, 2016). The tracer-derived estimates tend to keep the smoke emissions near the surface until the aerosol is eventually carried aloft, shown for 24 September 2016 in Fig. S3. The time lag allows the emissions from nearby fire sources to mix, homogenizing local differences in, e.g., grass versus leaf litter, moisture content, and surface burn history. Conditions can nevertheless still change from day to day.
Back trajectories based on the HYSPLIT model (Stein et al., 2015), also driven by the NCEP GFS meteorology, further illuminate the pathway the BBA traveled prior to its sampling on 24 September 2016 (shown later in Fig. 12d). These back trajectories reach the location of the fire emission source after approximately 3 d, at higher altitudes than where the aerosol was sampled. The aerosol age estimate is younger than the WRF-AAM aerosol forecasts would suggest. This is because the time needed for the aerosol to travel from the surface to the higher altitude is not accounted for in the HYSPLIT age estimate. The vertical advection timescale is highly model-dependent on boundary layer parameterizations, and we merely note the difference in the two age estimates here.
2.3 Modified combustion efficiency
CO and carbon dioxide (CO2) are used to infer fire emission conditions through the modified combustion efficiency (MCE) metric (Collier et al., 2016; Yokelson et al., 1997).
An MCE of 0.9 marks the 50 % threshold between flaming and smoldering combustion (Akagi et al., 2011), a threshold that is largely insensitive to fuel type (May et al., 2014). Higher values of MCE (>0.9), more associated with flaming combustion, preferentially produce more BC, whereas an MCE <0.9 is more typical of a smoldering fire that emits more organic aerosol for the same amount of fuel (Yokelson et al., 2009; Vakkari et al., 2018). A regression is used to estimate the with ΔCO and ΔCO2 calculated from the measured CO and CO2 amounts, in moles, relative to background values. Adopted background values were 65 (77) ppbv for CO and 397 (404) ppmv for CO2 in September 2016 (August 2017) based on measurements in the free troposphere taken above the smoke plumes (∼7000 m).
2.4 Aerosol composition
2.4.1 Black carbon
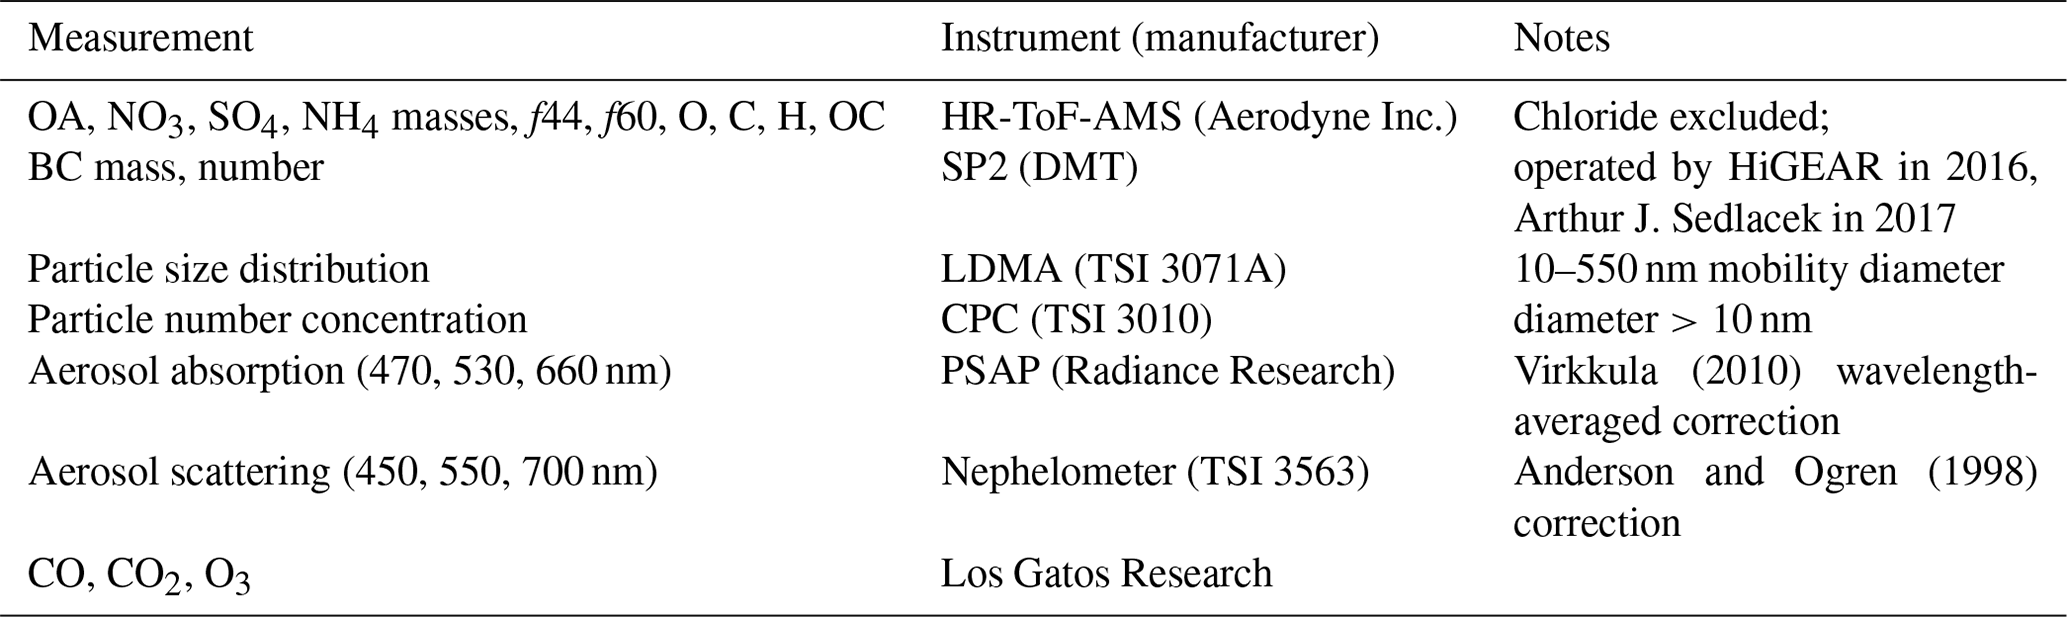
The refractory black carbon (rBC) size distributions are derived from a four-channel single particle soot photometer (SP2, Droplet Measurement Technology) deployed by the Hawaii Group for Environmental Aerosol Research HiGEAR in 2016 and an eight-channel SP2, of which only the incandescent channels were functional for the 31 August 2017 flight, deployed by Art Sedlacek of Brookhaven National Laboratory. No scattering data are available, precluding information on coating thicknesses. The intensity of laser-induced incandescent emission at 1064 nm can be quantitatively related to the mass of the rBC particles for mass-equivalent diameters between approximately 0.08 and 0.5 µm. The SP2 was calibrated using fullerene soot using effective density estimates from Gysel et al. (2011). Calibration uncertainty dominates the nominal mass uncertainty of ±17 % (Laborde et al., 2012).
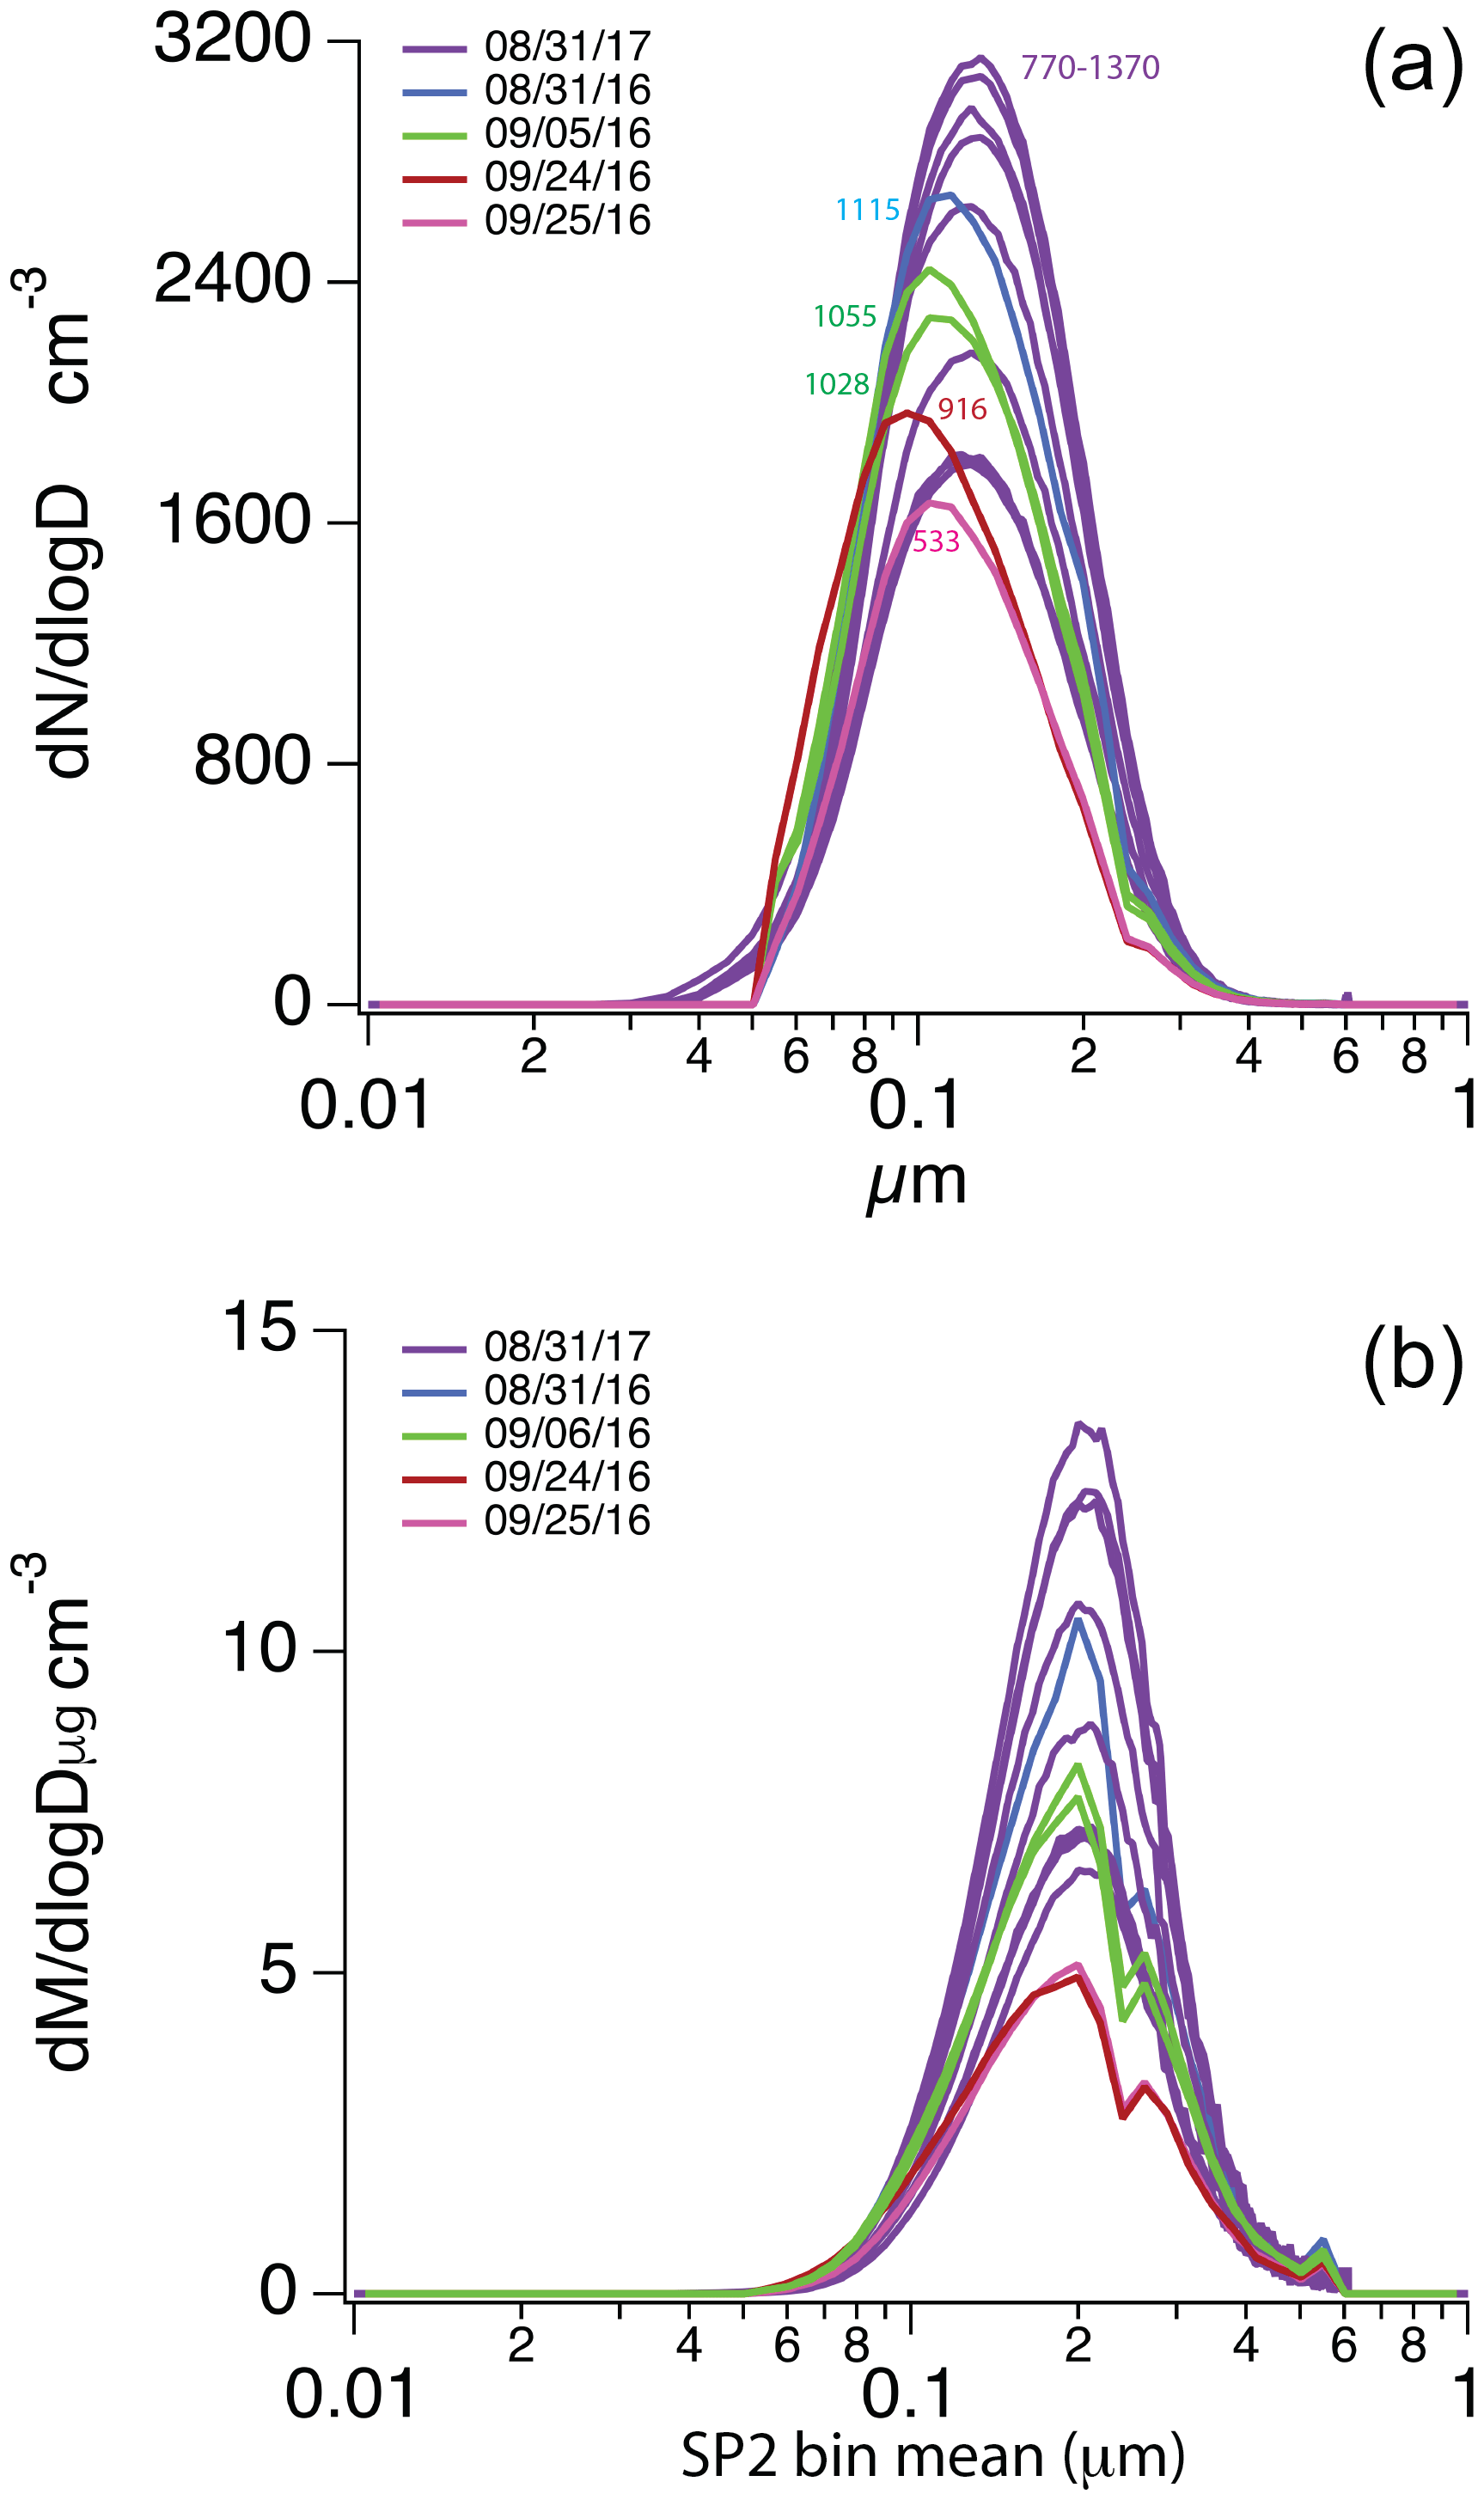
Figure 3Leg-averaged SP2 size by number (a) and mass (b) distributions for the level legs detailed in Table S2. Total leg-averaged SP2 number concentrations are included in the top plot. The kink at 2.5 µm mass mean diameter for the 2016 data is an instrument artifact.
Size distributions by number and mass (assuming a BC density of 1.8 g cm−3, Bond and Bergstrom, 2006) for the level legs detailed in Table S2 indicate that particle diameters remain well below the upper SP2 detection limit (Fig. 3). Lognormal fits help visualize a drop-off in detection efficiency for diameters <0.08 µm for the samples weighted towards the smaller sizes (Fig. S4, for 24 September 2016 and 25 September 2016). The SP2 size range nevertheless captures almost all of the black carbon mass, close to the 99 % value reported for CLARIFY (Taylor et al., 2020). The rBC total number concentrations vary between 530 and 1370 cm−3 (Fig. 3a), and undercounting of the mass and number through coincidence is estimated to be less than 3 % based on Taylor et al. (2020). Throughout, we use BC to refer to the SP2-derived refractory black carbon, following other literature, although the two are not entirely the same (Petzold et al., 2013).
Ratios of , reducing to because the background BC is zero in clean conditions, serve to assess homogeneity of the aerosol composition at the emission source. The ratios are non-dimensionalized by using the ideal gas law at standard temperature (273 K) and pressure (1000 hPa) (STP) to convert the CO concentrations from parts per billion (ppb) to nanograms per cubic meter (ng m−3).
2.4.2 Aerosol mass spectrometer measurements
HiGEAR operated an Aerodyne high-resolution time-of-flight aerosol mass spectrometer (HR-ToF-AMS, referred to as AMS), building on previous experience in the southeastern Pacific (Yang et al., 2011; Shank et al., 2012) and the Arctic (Howell et al., 2014). This measured masses of organic aerosol (OA), nitrate (NO3), sulfate (SO4), and ammonium (NH3). Chloride, a small component of the total aerosol mass in the free troposphere, was not considered because of its inconsistent ionization signature. The native time resolution is approximately 5 s, with the data interpolated onto a 1 s temporal grid to facilitate integration with other datasets. The overall uncertainty in the reported aerosol mass concentrations is estimated at 33 % to 37 % at a 1 min time resolution based on Bahreini et al. (2009), generating a combined uncertainty in the OA-to-BC mass ratio close to 40 % (since the background OA in clean conditions is also zero, reduces to OA:BC).
Means over the level legs listed in Table S2 further reduce OA mass uncertainties to 19 %–10 % and to 25 %–19 % for the OA:BC mass ratio. The instrument intercomparison flight with CLARIFY sampled a clean troposphere but a polluted boundary layer (BC of ∼300 ng m−3); the ORACLES OA and nitrate mass concentrations were 80 % of those measured by the UK plane, within each other's standard deviations (Barrett et al., 2022).
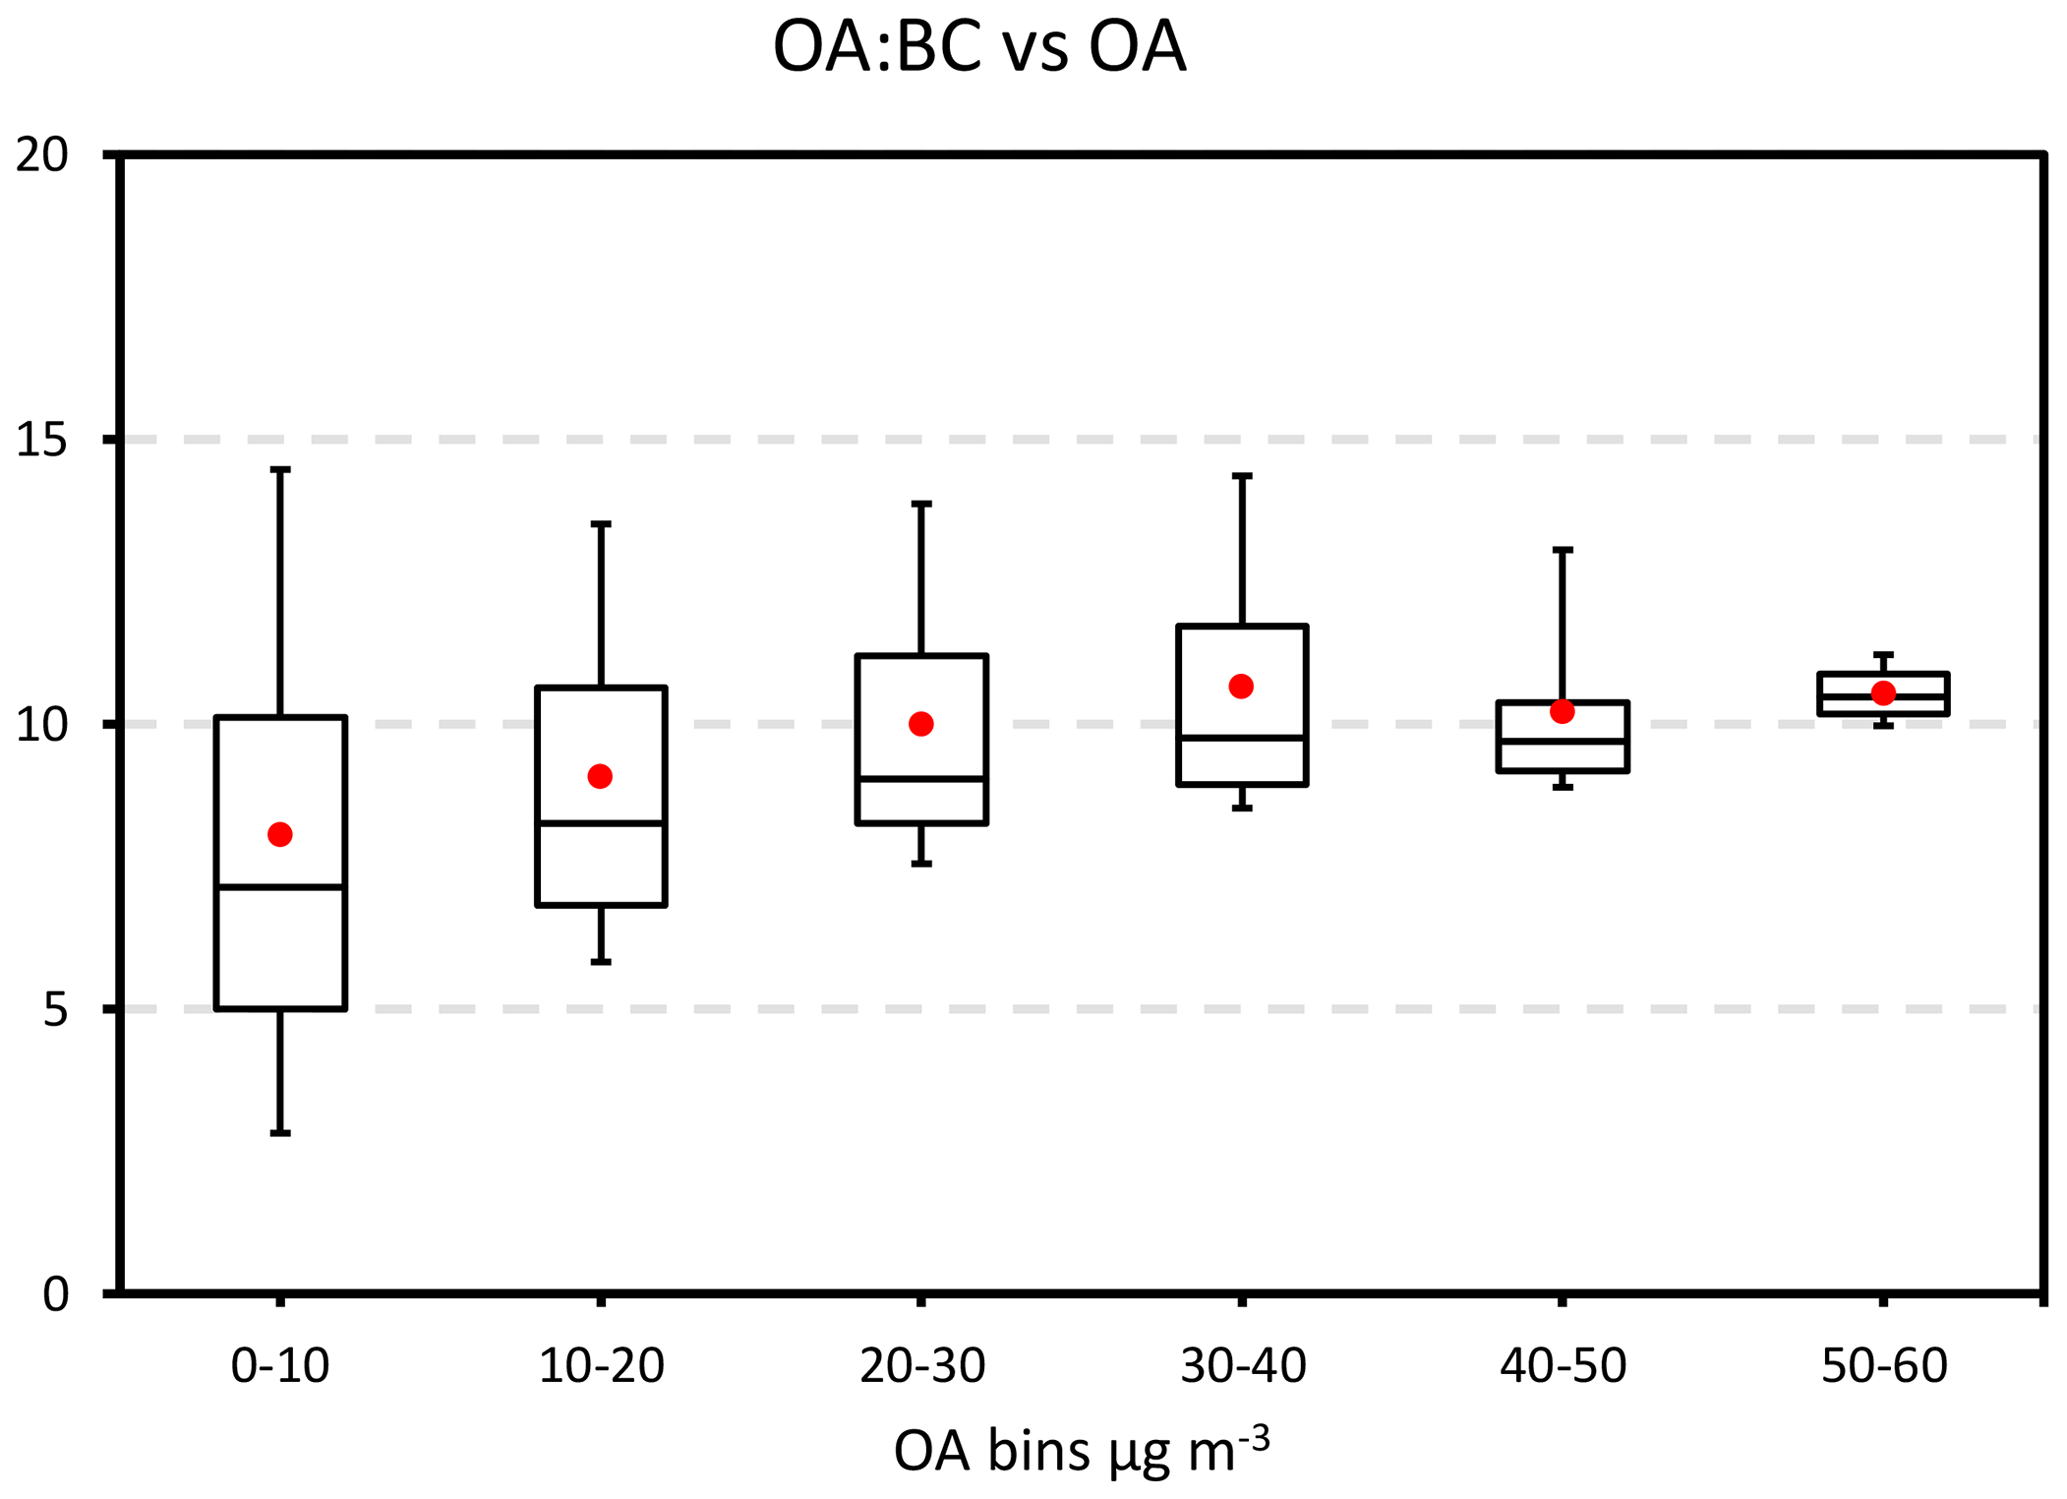
Figure 4OA:BC mass ratio, shown using 10, 25, 50, 75, and 90th percentiles with means in red, composited by OA mass.
A threshold of 20 µg m−3 is applied to the OA mass to select for the heart of the smoke plumes. This is one approach to minimizing dilution effects, by which OA evaporates through mixing with cleaner environmental air (e.g., Hodshire et al., 2021). This threshold was selected based on when a stabilization of the OA:BC mass ratio occurs as a function of the OA mass concentrations (Fig. 4). The OA:BC mass ratio is significantly less for air with OA >3 µg m−3 than for air with OA >20 µg m−3, particularly for younger aerosol (Fig. S5), consistent with evaporation through dilution. The choice of threshold is inherently arbitrary, and some analysis is repeated using an OA >10 µg m−3 threshold to make sure our findings are not sensitive to the choice of OA mass threshold. The BC:ΔCO and OA:BC ratios are shown for individual flights as a function of f44 for both thresholds in Figs. S11–S14 in the interest of full documentation. We also account for dilution effects by normalizing OA with respect to BC or ΔCO, two quantities that do not change with dilution. We stress that the aerosol plumes over the southeastern Atlantic, termed “rivers of smoke” in Swap et al. (2003), are typically much larger and homogeneous than the fire plumes sampled in the western Northern Hemisphere, which are often linked to named, individual fires and sampled close to the source. The plume sampled on 31 August 2017, halfway to Ascension Island, is an example of a wide, homogeneous smoke plume (Fig. 3). OA mass concentrations often remained highly stable over level legs (see Fig. S2, bottom row, for an example). Further justification for a threshold is that the OA mass uncertainty is smaller at higher signal-to-noise ratios. Additionally, model–observational disparities in the smoke plume locations have less impact on further aging-related analyses if based on the plume centers. For the same reason we exclude aerosol with physical ages >10 d as the model skill in predicting smoke age is likely poorer by then.
Other AMS measurements include the fraction of the OA mass spectrum signal at 44, 43, and 60 relative to the total OA mass concentration, termed f44, f43, and f60, as well as hydrogen (H), oxygen (O), and organic carbon (OC). f44 indicates the presence of the CO ion, a form of oxidation resulting from chemical aging (Canagaratna et al., 2015). f43 indicates the presence of C2H3O+ and C3H, also representative of oxygenated OA. f60 indicates C2H4O2, a fragment of levoglucosan and a known tracer for biomass burning aerosol (Cubison et al., 2011). Elemental analyses yielding H, O, and OC rely on algorithms from Aiken et al. (2007). The calibration constants differ between the 2 years, but this change does not quantitatively impact any differences shown here.
2.5 Determination of organic and inorganic nitrate contribution
Farmer et al. (2011) provide an approach for estimating the contribution to the total nitrate signal from organic nitrate (ON) using the ratio, building on the observation that organic nitrates typically fragment into larger proportions of NO+ than inorganic nitrates. In their study, organic NO+ ratios vary between 1.8 and 4.6 for different organonitrates compared to 1.5 for NH4NO3. Their Eq. (1), reproduced below, provides an estimate of the ON fraction that can be readily applied to the ORACLES AMS data, assuming enough ON is present that it can be resolved. The success of this approach also assumes that the inorganic nitrates capable of providing a large NO+ ratio, such as mineral nitrates, are not present. Both assumptions are justified for the southeastern Atlantic (SEA) free troposphere.
Robs is the ORACLES ratio of ion fragments 30 to 46, is the ionization efficiency (IE) calibration-derived ratio (1.26 for 2016 and 1.545 for 2017), and an RON value of 3.41 is a reference ratio based on the average fragmentation pattern into the ratios for the OIA-HN, OIA-CN, and OIA-olig standards evaluated in Table S1 of Farmer et al. (2011). The inorganic nitrate (IN) fraction is 1-ON. We use this approach to estimate the inorganic nitrate (IN, primarily NH4NO3) fraction, keeping in mind that it is an indirect inference. The CLARIFY campaign relied on assessing 30 and 46 (primarily NO+ and NO) to assess the organic to inorganic nitrate contribution.
2.6 Aerosol sizing
Total aerosol number concentrations from a condensation particle counter (CPC; TSI 3010, marked “ACN” in Fig. S8) establish the fraction of BC-containing particles. The CPC applies a size threshold of 10 nm with no upper bound. Aerosol size distribution measurements rely on a long differential mobility analyzer (LDMA; heavily modified from a TSI 3071A). The aerosol sizing from an LDMA and a thermal DMA (TDMA) are preferred to those from an ultrahigh-sensitivity aerosol spectrometer (UHSAS; DMT) because of UHSAS sizing uncertainties (Howell et al., 2021). A correction for a known undersizing by the UHSAS, put forward in Howell et al. (2021), is evaluated in Fig. S7, in which the LDMA and UHSAS median diameters are compared for the level-leg plumes (Table S2) with OA µg m−3. Two particle populations emerge: one with diameters between 0.15 and 0.2 µm that is more likely to contain black carbon (see Fig. 3) and another with median diameters <0.1 µm, speculated to consist mostly of OA. For the larger particles containing BC, the UHSAS correction reduces the undersizing bias to 15 % compared to LDMA median diameters >150 nm, but for the smaller particles that are less likely to contain BC, the UHSAS particle sizes are now overcorrected. For this reason, and because a particle cavity aerosol spectrometer probe (PCASP) underperformed, we only show aerosol sizes based on the LDMA data. Analysis duplicated using UHSAS data did not contradict our findings.
The LDMA measures mostly singly charged particles between 10 and 550 nm in mobility diameter, with multiply charged particles occurring at diameters >200 nm (Howell et al., 2021). The inversions include a size-dependent charging efficiency that accounts for the multiple charges and for size-dependent losses (Zhou, 2001). The HiGEAR LDMA operated in a scanning mode at ambient temperature and pressure, drawing in desiccated air (RH <30 %) from an aluminum lagged-aerosol grab chamber for 60 s. The total number uncertainty is estimated to be ±30 % due to errors in sizing of non-spherical particles along with uncertainties of flow rate. All size distributions and concentrations are corrected to STP (T=25 ∘C, p=1000 hPa).
The black carbon core mass median diameter is used to infer fire conditions at the source. Larger BC sizes correspond to more woody fuels than grasses in Holder et al. (2016), while larger BC cores are associated with more flaming conditions in Pan et al. (2017), attributed to less oxygen reaching the interior flame zone. An estimate of the fraction of total particles containing black carbon (FrBC) is also constructed from the total number of SP2-derived BC particles divided by the total CPC particles.
2.7 Optical measurements
Scattering from all particles is measured continuously by a nephelometer (TSI 3563) at the 450, 550, and 700 nm wavelengths (λ), from which scattering coefficients (σs) are retrieved. The spectral light absorption coefficients (σa) of the total aerosol are estimated from particle soot absorption photometer (PSAP; Radiance Research) measurements at the 470, 530, and 660 nm wavelengths. The nephelometer scattering measurements are interpolated to the PSAP wavelengths. The extinction (scattering+absorption) and absorption measurements compare well at the blue and green wavelengths to the more sophisticated measurements made by the CLARIFY EXtinction SCattering and Absorption of Light for AirBorne Aerosol Research (EXSCALABAR) instrument (Davies et al., 2019; Barrett et al., 2022). More detail on the algorithmic treatment of the filter-based measurements is provided in Sect. S7 of the Supplement.
The absorption Ångström exponents (AAEs) are calculated from the linear fit of log(σa) to log(λ). The mass absorption cross-section at 660 nm (MACBC,660) is based on σa,660 divided by the BC mass concentration. Following Carter et al. (2021), we also evaluate the MAC relative to the BC+OA mass concentration at λ=470 nm (MAC), to assess absorption contributions from both OA-induced brown carbon and other wavelength-dependent absorbers (Zhang et al., 2022). The single-scattering albedo is examined at 530 nm (SSA530; =) to support comparisons to other published values.
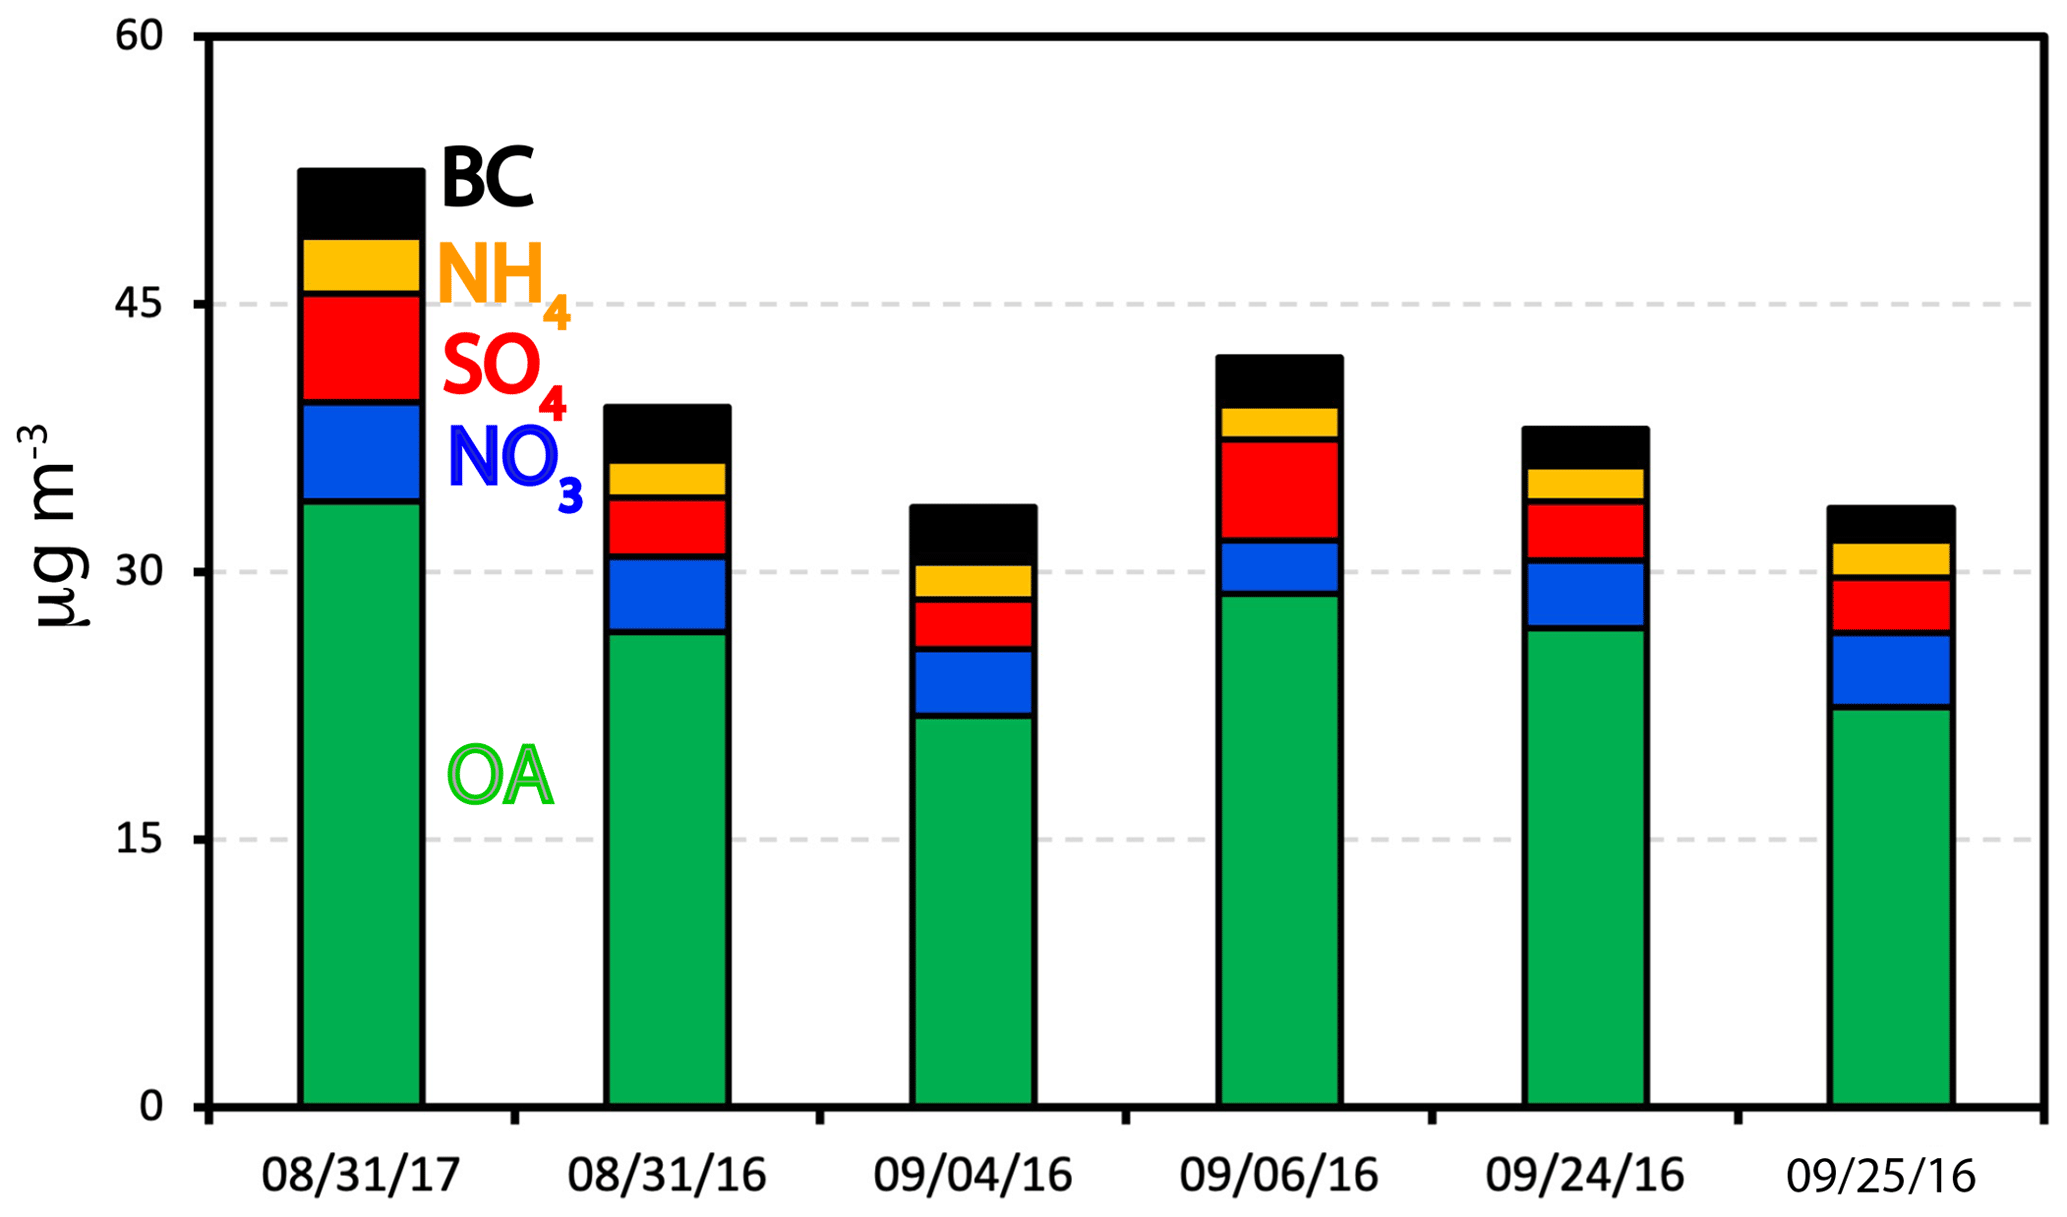
Figure 5Distribution of the bulk chemical species masses for each flight for 5 s samples with OA >20 µg m−3.
The mean submicron mass fractions of the six flights combined are 66 % OA, 10 % nitrate (NO3), 11 % sulfate (SO4), 5 % ammonium (NH4), and 8 % BC, with the masses for each species and flight in Fig. 5, thresholded for OA >20 g m−3. Flight mean submicron mass totals typically exceed 35 µg m−3. This is much more than measured in the free troposphere above Ascension during CLARIFY (Wu et al., 2020), although the OA mass fraction during CLARIFY still remained >50 % of the total aerosol mass.
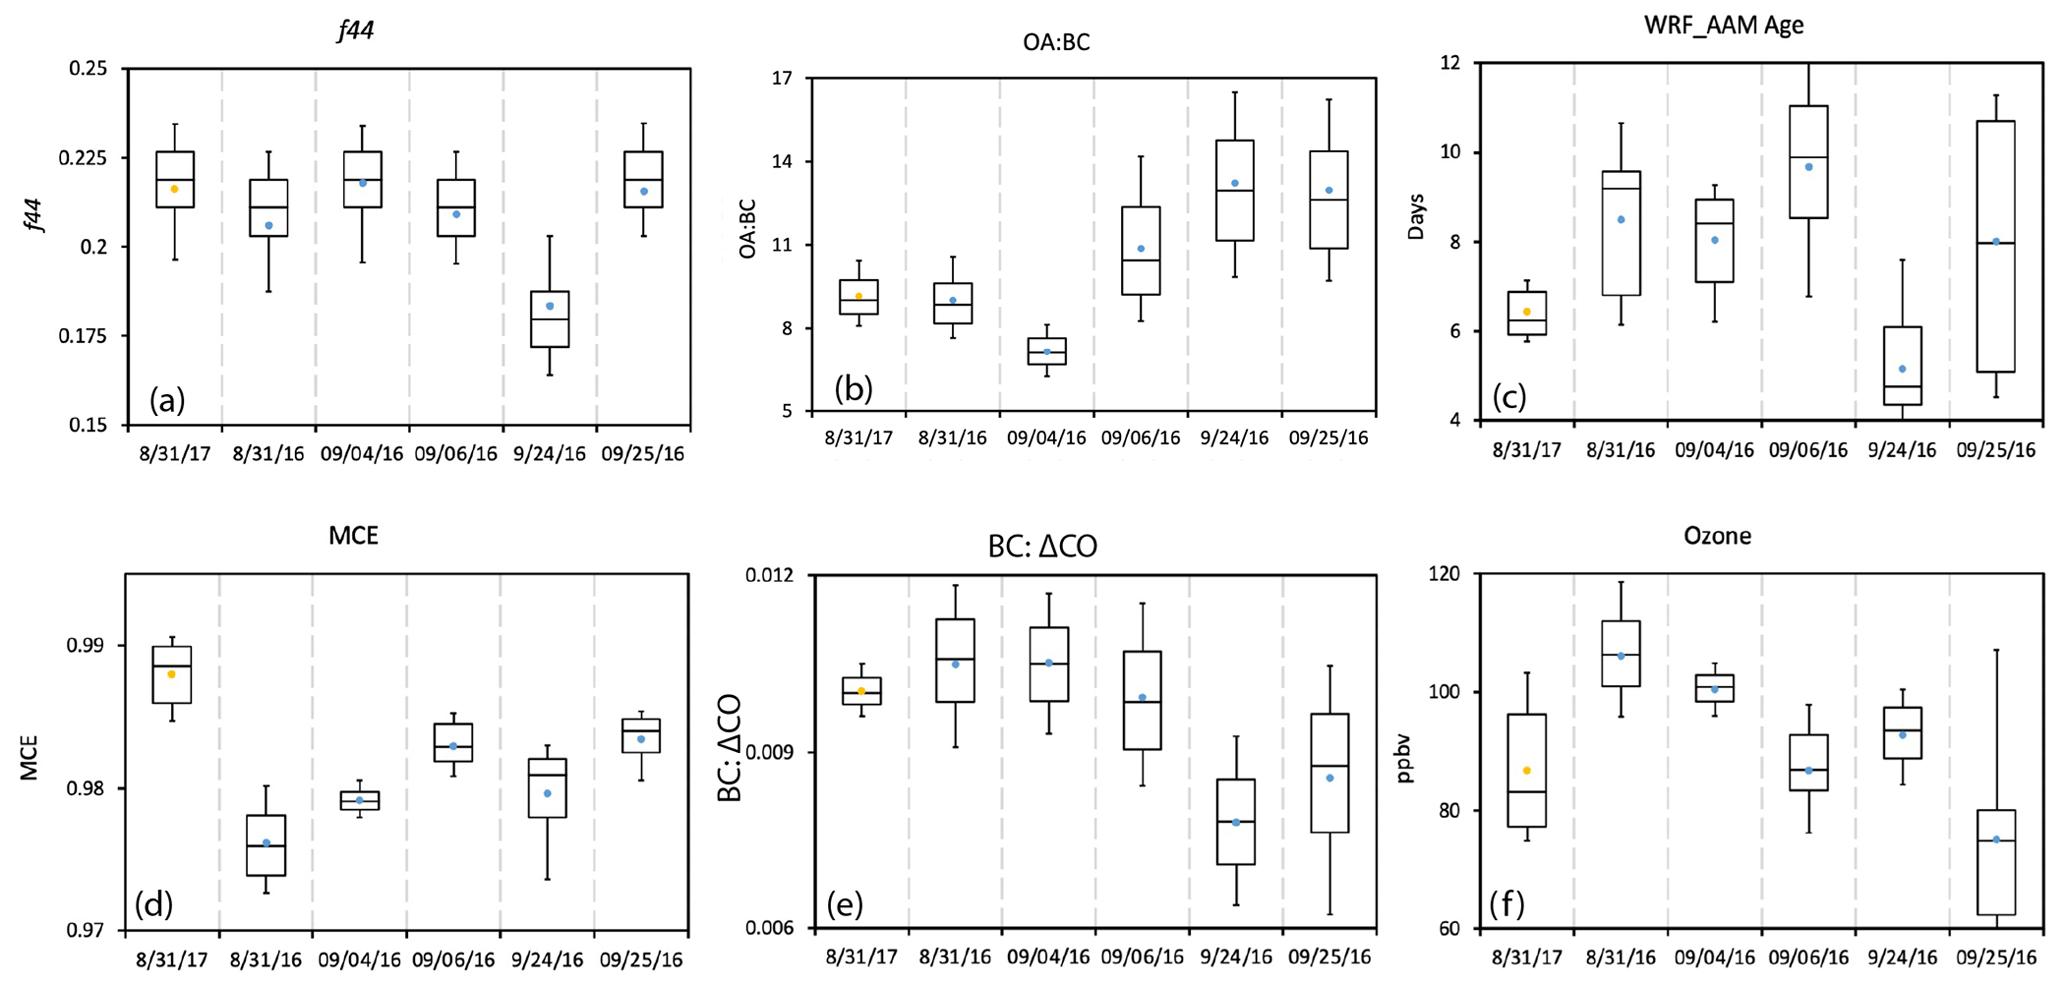
Figure 6The (a) f44, (b) OA:BC mass ratio, (c) model-derived time since emission (age), (d) MCE, (e) as a non-dimensionalized ratio, and (f) ozone, all for each indicated flight. Whiskers represent the 10th and 90th percentiles, and boxes illustrate the 75th and 25th percentiles, with a line indicating the median and yellow (2017) and blue (2016) filled circles representing the mean. OA >20 µg m−3 only.
Figure 6 provides an overview of the f44, OA-to-BC mass ratio, model-derived time since emission (age), MCE, non-dimensionalized ratios, and ozone values for each flight. f44 flight mean values range from 0.18 to 0.22, on par with f44 values of Asian and Siberian smoke after a 2-week transport to Alaska (Cubison et al., 2011). They are also similar to CLARIFY values (Wu et al., 2020), suggesting a maximum f44 value of ∼0.22 for this aerosol regime. The f44 values indicate highly oxidized aerosol, but their range may still contain information on the relative aerosol age: the lowest flight mean f44 value from the 24 September 2016 flight corresponds to the youngest aerosol (Fig. 6c), although the other flight mean aerosol ages since emission do not correlate well with f44.
Flight mean OA:BC mass ratios range from 7 to 13. MCE values are above 0.97 for each flight. These clearly indicate flame-efficient fires (Collier et al., 2016; Zhou et al., 2017), whose emissions can also more easily reach higher altitudes than emissions from smoldering fires (Kondo et al., 2011). This may explain why the ORACLES 2016 MCE values exceed the September mean estimate of ∼0.89 from a source-emission-based model (Zheng et al., 2018). Mean non-dimensionalized ratios vary between 0.007 and 0.011, with a minimum on 24 September. These ratios are among the highest surveyed in the literature (Table 2). Overall, ratios do not increase with increasing MCE as expected based on Kondo et al. (2011), but this likely reflects our study's small range of MCE values, for which Vakkari et al. (2018) also do not find a correlation. The mean values hint at a decrease throughout September, with the flight mean OA:BC mass ratios also increasing to 13 later in September. The flight mean ozone levels range from 80–105 ppbv, possibly decreasing as September progresses. Flights with more ozone correspond to flights with lower MCEs: less flaming fires will emit more ozone along with more OA. The changes over the course of the month are consistent with more combustible fuel being ignited earlier (Eck et al., 2013), but none of the trends are statistically insignificant.
Vakkari et al. (2018)Vakkari et al. (2018)Andreae (2019)Andreae (2019)Akagi et al. (2011)Akagi et al. (2011)Capes et al. (2008)Formenti et al. (2003)Wu et al. (2020)Table 2Comparison to other published ratios.
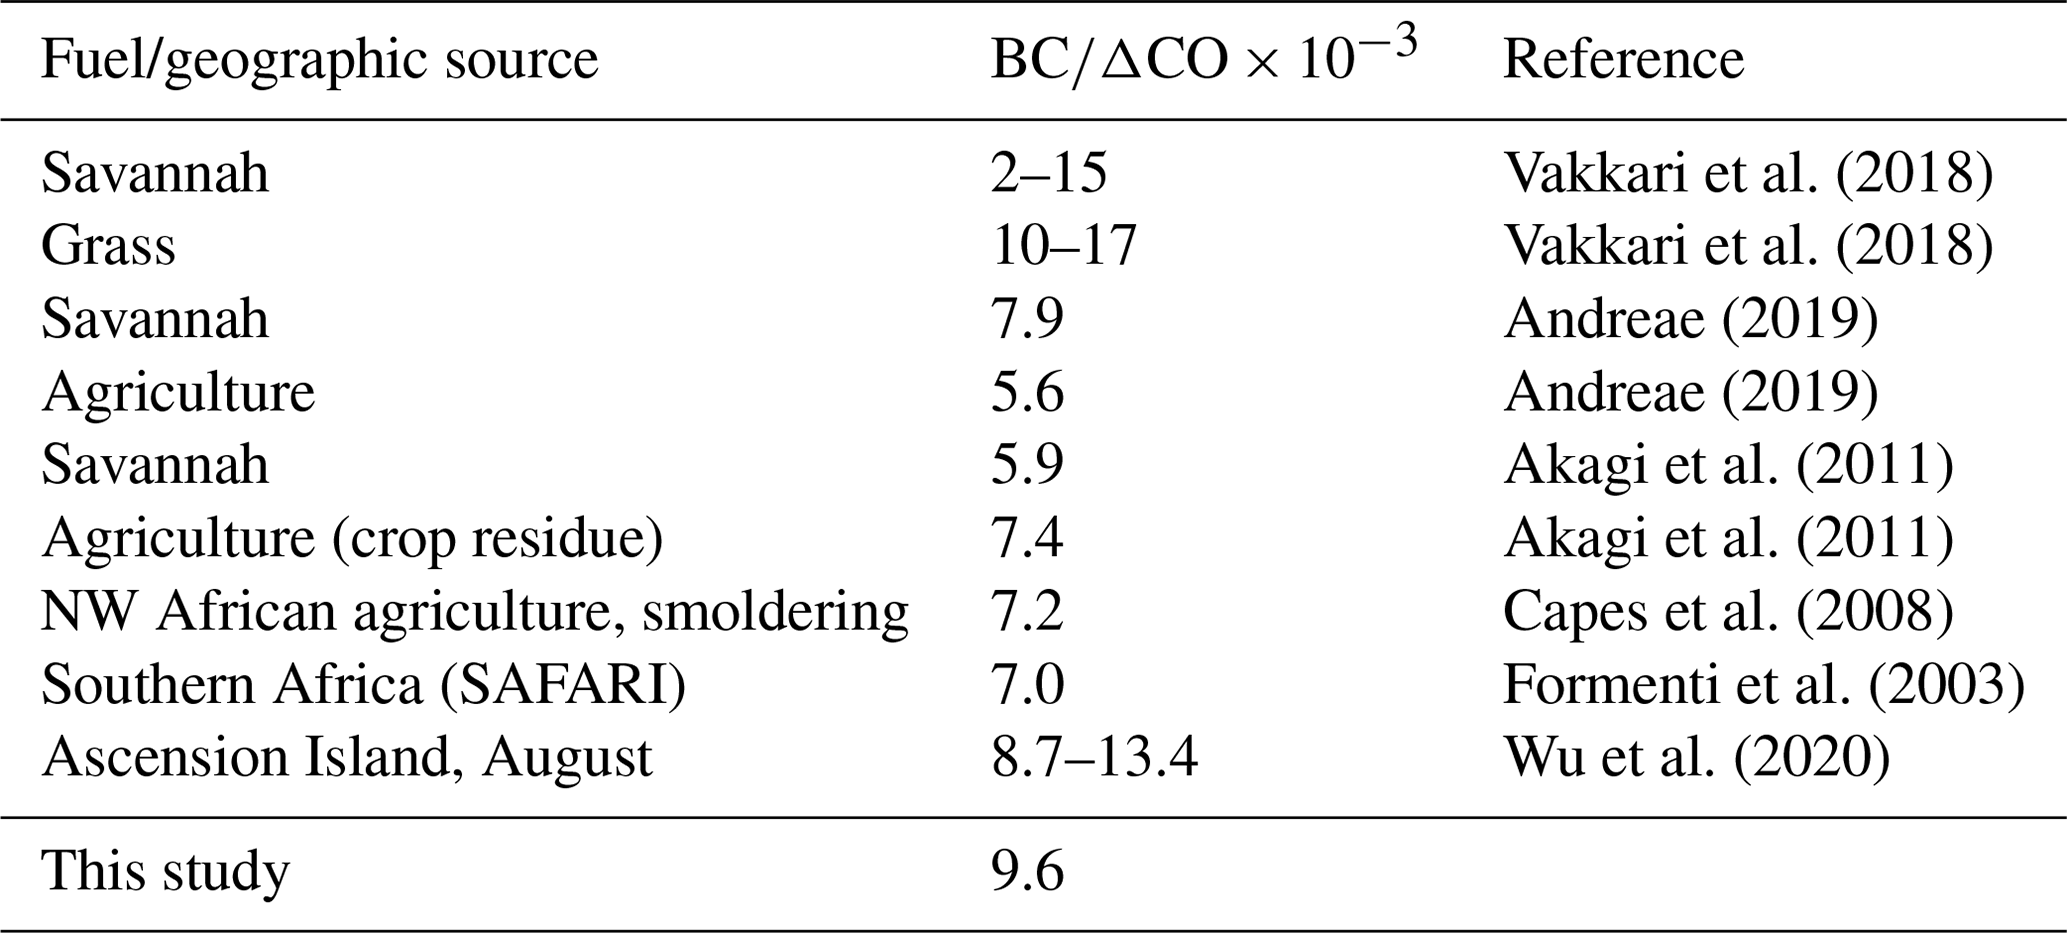
All values are dimensionless. Methods for deriving the BC mass concentration may vary between the studies. Most CMIP6 models rely on the Akagi et al. (2011) emission factors.
We interpret the high MCE values to reflect a large contribution from dry and dead grasses, rather than green grass or more woody materials, for the following reasons. MCE varies inversely with the moisture content for grasses (Korontzi et al., 2003), with leaf litter and woody fuels tending to dry more slowly than grasses. For this reason woody fuels are more prone to smoldering than flaming combustion. The burning of dry grass produces relatively low emissions of carbon monoxide (Scholes et al., 1996) and higher emissions of black carbon than agricultural or woodland fires (Andreae, 2019), elevating the ratios, as seen here (Table 2). That the values measured at offshore locations exceed those measured previously over land (Table 2) could be because emissions from more intense, larger, flaming fires can more easily reach higher altitudes (Martin et al., 2010; Holder et al., 2016), where they can be dispersed further afield through the stronger winds aloft.
Daily maps of fire locations for the flight days (not shown; see Redemann et al., 2021, for the monthly mean distributions) indicate that BBA sources are primarily fire emissions from miombo woodlands, which contain a significant fraction of savanna grasses and some agricultural fields (Shea et al., 1996; Christian et al., 2003; Korontzi et al., 2003; Vakkari et al., 2018; Huntley, 2019), distributed over a broad geographic region encompassing Angola, Zambia, and the Congo. The miombo shrubbery is fire-adapted and less likely to burn than the grass. A survey of the published emission factors for the vegetation types typical of southern Africa – savannahs, grasslands, agricultural fields, and at times tropical forest – indicates that the high ratios reported in Table 1 and Fig. 6 are primarily representative of grass fires. Overall, these metrics indicate aged, oxidized aerosol emanating from flame-efficient fires, without any strong outliers amongst the flights (flight mean ratios vary from 7–), and typical values for grasslands and savannahs (Janhäll et al., 2010; Vakkari et al., 2018).
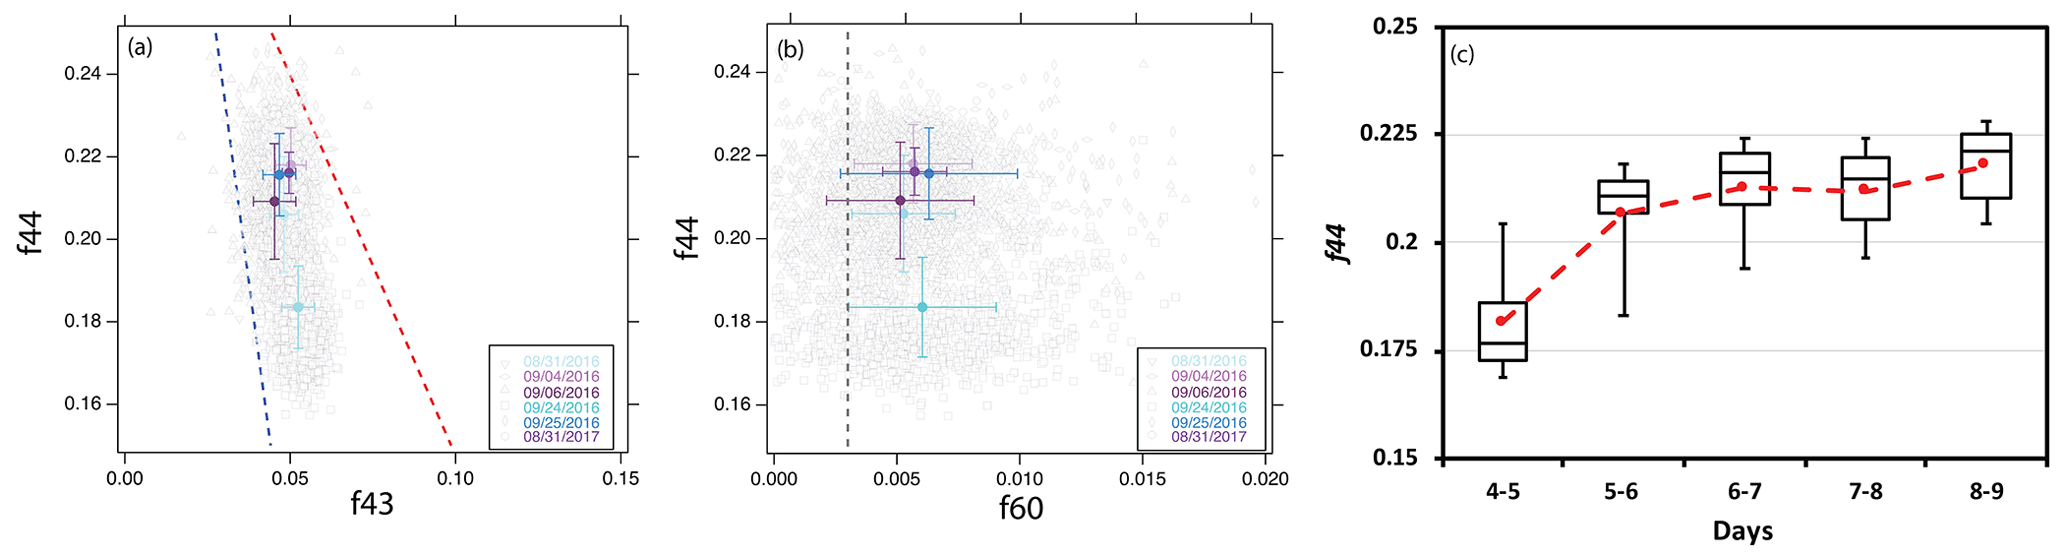
Figure 7(a) The f44 versus f43 for the six flights during which OA >20 µg m−3. Averages (± standard deviation) are colored by flight date, and grey boxes indicate individual data points. Panel (b) is similar to (a), for f44 vs. f60. Blue and red dashed lines define the parameters for ambient oxygenated OA, following Ng et al. (2010). (c) The f44 versus the model-derived physical age for the six flights combined.
Southern African fires can still produce significant near-source secondary organic aerosol (SOA), depending on the burning conditions (Vakkari et al., 2018; Pokhrel et al., 2021). The comparison of f44 to f43 for all the flights (Fig. 7a) indicates a mixture of semi-volatile and low-volatility oxygenated organic aerosol (Ng et al., 2011). A peak integration by key analysis (PIKA) reveals that the dominant peak at f43 is from C2H3O+, representative of oxygenated organic aerosol (Ng et al., 2011). f60 values are relatively constant and below 0.005 (Fig. 7b), and f44 values lie between 0.2 and 0.22. Chamber studies report lifetimes for f44 and f60 of approximately 20 d and 10 h, respectively (George and Abbatt, 2010; Hodshire et al., 2019), but little change is evident in f44 after 6 d since emission (Fig. 7c), with f44 values of 0.2–0.22 also reported at Ascension (Wu et al., 2020), suggesting a steady state has been reached.
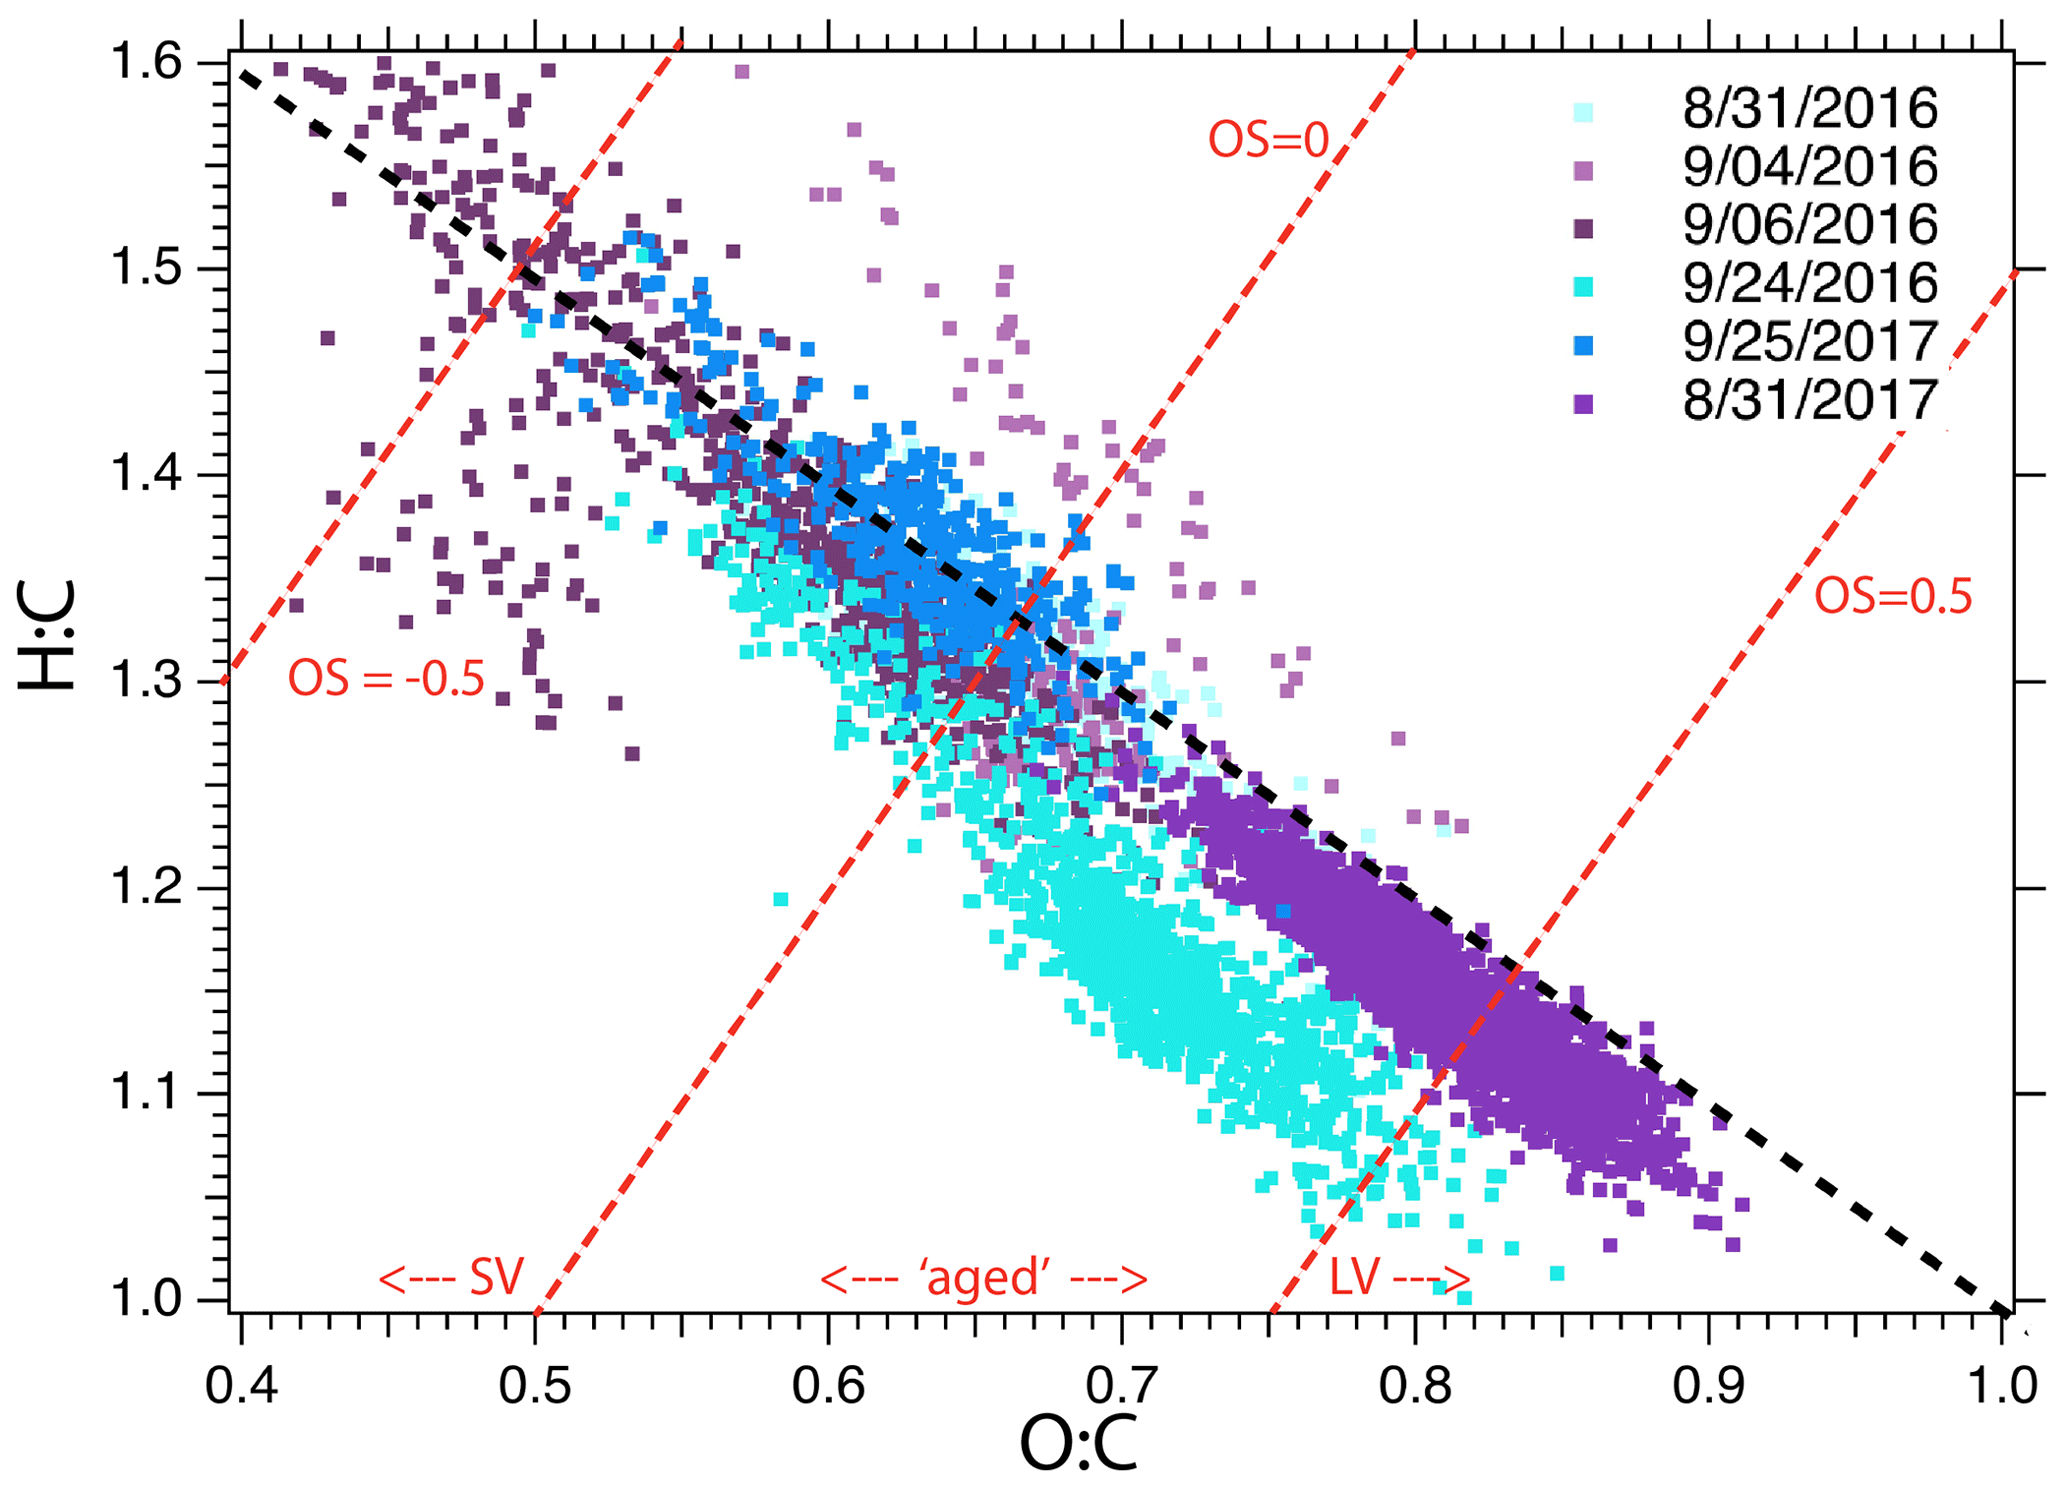
Figure 8Hydrogen-to-carbon (H:C) molar ratio versus oxygen-to-carbon (O:C) molar ratio, colored by flight date, shown at the native 5 s time resolution. Superimposed are lines of constant oxidation state (OS, defined as ; Kroll et al., 2011), used to define semi-volatile (SV), aged, and low-volatility (LV) oxidized organic aerosol (OOA) regimes.
The H:C versus O:C mass ratios occur close to the −1 slope line (Fig. 8; based on vanKrevelen, 1950), also inferred at Ascension (Wu et al., 2020). This slope relationship is common to many laboratory and field studies (Heald et al., 2010), with the narrow distribution, particularly within individual flights, suggesting either a limit to the number of oxidation pathways and molecular structures or a dominant few. Most of the oxidation states (OSs), defined as -H:C (Kroll et al., 2011), lie between −0.2 and 0.5, which Kroll et al. (2011) categorize as “aged” and semi-volatile oxygenated OA (OS between −0.5 and 0). Only the 31 August 2017 flight has some aerosol that is oxidized enough to be considered low-volatility (OS >0.5). We are only able to report the end product of the aerosol chemical properties, and different SOA precursors may also contribute to the range of observed H:C and O:C ratios (Jimenez et al., 2009; Ng et al., 2011). Nevertheless, Kroll et al. (2009) show that aerosol with O:C >0.4 is dominated by fragmentation pathways, in which further oxidation occurs through the loss of a carbon atom (as opposed to functionalization, which adds an oxygen atom). Fragmentation generates relatively small changes in H:C. The fragmentation process releases small amounts of volatile aerosol, and we speculate that this pathway is suggested by Fig. 8 for the continuing oxidation of ORACLES 2016 BBA.
Flight mean O:C mass ratios range between 0.61 and 0.69 for the 2016 flights, with small within-flight standard deviations (0.03–0.06, not shown). Overall, the average (± standard deviation) plume values of H:C, O:C, and the organic-aerosol-to-organic-carbon mass ratio (OA:OC) are 1.2±0.1, 0.7±0.1, and 2.2±0.1, respectively, over all six flights. The OA:OC mass ratio, a measure of the oxygen content that is useful for model evaluation (Hodzic et al., 2020; Lou et al., 2020), is on par with measurements from the Atmospheric Tomography (ATom) campaign made in the same region (Hodzic et al., 2020) and during CLARIFY (Wu et al., 2020). The mean value of 2.2 is substantially higher than common model-applied values of 1.4–1.8 (Aiken et al., 2008; Tsigaridis et al., 2014; Hodzic et al., 2020) and primary near-source OA:OC ratios of 1.6 (Andreae, 2019).
Here we discuss relationships of the aerosol optical properties to their chemical and physical composition, and we examine their spatial distribution using the more statistically robust level-leg mean (± standard deviations) values (Figs. 9–11).
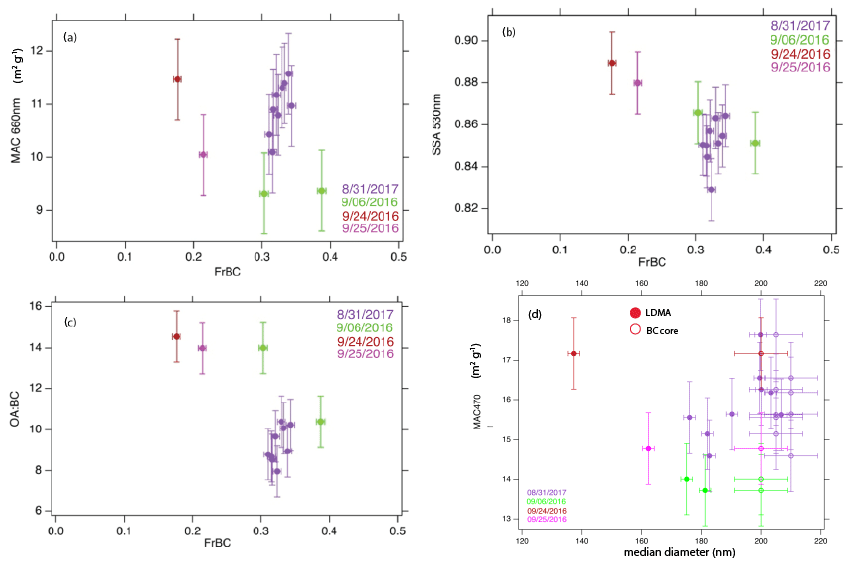
Figure 9(a) Mass absorption coefficient (MACBC,660; units of m2 g−1) at 660 nm wavelength versus the fraction of black-carbon-containing particles (FrBC), colored by flight day. Panel (b) is the same as (a) but for SSA530 versus FrBC. Panel (c) is the same as (a) but for OA:BC mass versus FrBC. (d) MAC (m2 g−1) versus LDMA median and mass median BC core diameter. All for the level legs listed in Table S2.
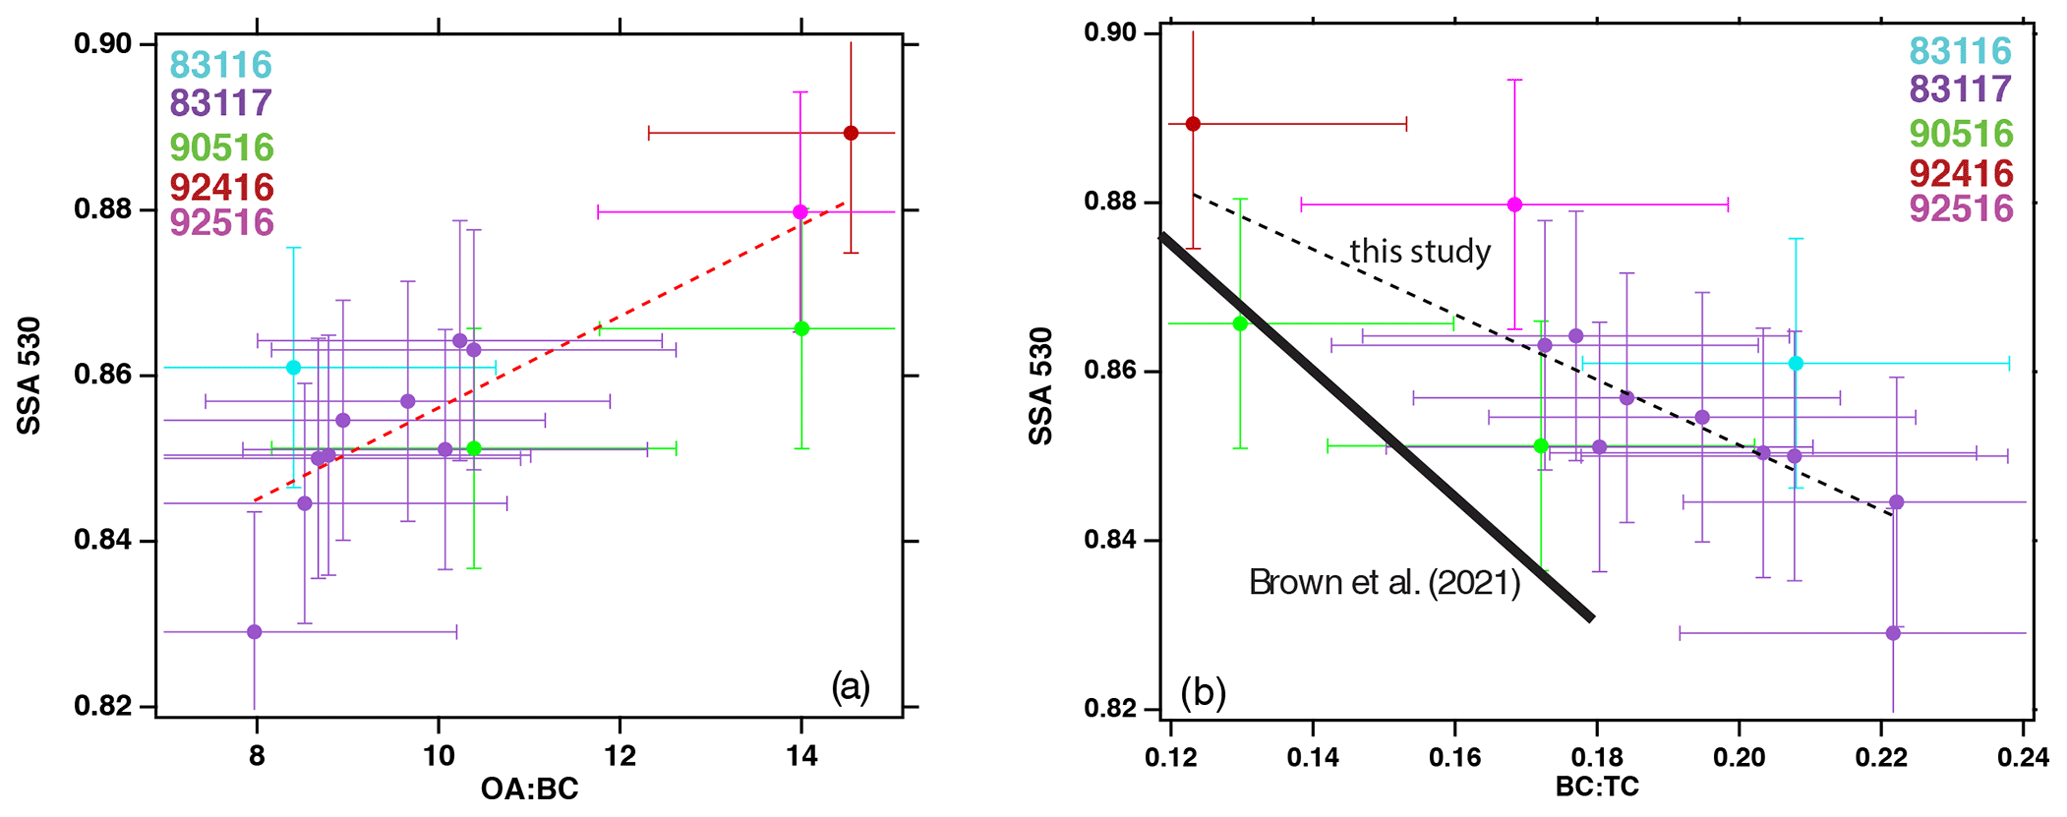
Figure 10(a) Level-leg mean ± standard deviation values for SSA530 nm versus the OA:BC mass ratio, colored by flight. The best-fit line is represented by SSA (r=0.84). Panel (b) is the same as (a) but for SSA530 nm versus the BC:TC mass ratio, where TC=BC+organic carbon. The best-fit line is SSA , (). Times and spatial ranges of the level legs are provided in Table S1. Also shown is the SSA parameterization put forth in Brown et al. (2021), namely SSA.
4.1 Mean relationships
The bulk mass absorption coefficients (MACBC,660) decrease with the estimate of the fraction of particles containing black carbon (FrBC) for the ORACLES 2016 flights (Fig. 9a), with the SSA values decreasing more systematically with FrBC for all four flights (Fig. 9b). The BC-containing particle fraction varies from 0.2 to 0.4, which is more than the 0.1–0.2 range shown for July south of remote western Africa (Denjean et al., 2020b) and less than the 0.3–0.45 range at Ascension (Taylor et al., 2020). The total particle number was drawn from the full aerosol size distribution within Denjean et al. (2020b) and by a PCASP (0.1–3 µm) at Ascension. These size ranges are comparable enough to support the comparison across the three campaigns.
Independent electron microscopy on 2017 filter samples found that almost all BC is at least partially coated, meaning the BC particles are dominated by internal mixing (Dang et al., 2022). Nevertheless, the majority of particles cannot include BC, since FrBC <0.5. As the fraction of BC-containing particles increases, the bulk OA:BC mass ratio tends to decrease. MACBC,660 ranges from 9–12 m2 g−1 and MAC from 13–18 m2 g−1, corresponding to absorption enhancement factors of 1.2–1.6 (1.7–2.4) at the 660 nm (470 nm) wavelengths, assuming MAC of 7.5 m2 g−1 for uncoated black carbon (Bond and Bergstrom, 2006) (and greatly exceeding the MAC value of 6.25 m2 g−1 for strongly light-absorbing carbon; Bond and Bergstrom, 2006). The mean MACBC,660 of 10.8 m2 g−1 is slightly higher than the median value of 9.3 m2 g−1 reported in Carter et al. (2021), likely because the BC-enriched 31 August 2017 flight contributes strongly to the mean value reported here. Median LDMA-inferred particle diameters range from 120–210 nm, with no clear relationship to MAC. This indicates that the absorption enhancements are governed more by composition than particle size, similar to Denjean et al. (2020a) for June–July BBA close to the near-equatorial African coast. The 31 August 2017 flight, for an FrBC of 0.3, has a higher MACBC,660 nm (by ∼2 m2 g−1), lower OA:BC mass ratio, and larger LDMA-inferred particle and mass median BC core size compared to values from the 6 September 2016 flight of comparable FrBC. The larger BC core size for 31 August 2017 may come from a woodier fuel, supported by back trajectories emanating from further north (not shown). Woodier material has been shown to generate larger BC sizes irrespective of MCE within Holder et al. (2016).
The single-scattering albedos (SSAs) at λ=530 nm range from 0.83 to 0.89, consistent with the ORACLES 2016 mean SSA of 0.86 (interquartile range of ∼0.028) based on all the flight data (Pistone et al., 2019). These SSA values are lower than previously documented in situ values over land or coastal areas (Haywood et al., 2003; Formenti et al., 2003; Dubovik et al., 2002), on par with AERONET September mean values at Mognu (Eck et al., 2013) and higher than those reported at Ascension Island (Zuidema et al., 2018; Wu et al., 2020). An SSA best-fit regression on OA:BC provides a straightforward connection between the BBA chemical and optical properties: SSA (Fig. 10a, correlation coefficient r of 0.84). The dependence on BC:TC (total carbon) following Brown et al. (2021) is SSA (Fig. 10b; , where TC=BC+organic carbon (OC) and OC is estimated from ; Aiken et al., 2008). The dependence on BC:TC is not as pronounced as in Brown et al. (2021), primarily because our dataset has a smaller SSA range, with no SSAs >0.9. The variance in SSA is explained slightly better by OA:BC than BC:TC.
4.2 Is there evidence of brown carbon?
Taylor et al. (2020) place an upper estimate of 11 % on shortwave absorption by brown carbon (BrC) at 405 nm wavelength by the time the BBA plume reaches Ascension Island. Zhang et al. (2022) indicate that other non-BrC materials such as iron oxides absorb sunlight over the southeastern Atlantic so that BrC may contribute even less than <10 % of the total absorption at sub-500 nm wavelengths. By 4 d since emission, the primary organic aerosol has mostly converted to secondary OA (SOA), which typically absorbs little light (Bond and Bergstrom, 2006; Laskin et al., 2015). Nevertheless, if oxidation can continue to produce new chromophrores (O'Brien and Kroll, 2019) that absorb differently based on wavelength, that could be interpreted as SOA-induced BrC. Ozone Monitoring Instrument ultraviolet aerosol index values do suggest that OA-produced brown carbon should be present east of the prime meridian (Carter et al., 2021), however. Laboratory studies find more BrC absorption for lower OA:BC mass ratios (Saleh et al., 2014; Holder et al., 2016; McClure et al., 2020) because more intense fires also produce more primary OA and BrC. One important difference is that the reported primary OA fraction and AAEs are much higher in Saleh et al. (2014) than we would expect over the southeastern Atlantic.
Motivated by Carter et al. (2021) we examine if distance from the continent has a detectable influence on the absorption Ångström exponents (AAEs) calculated over the 470–660 nm wavelength range for the level-leg data (Fig. 11a), recognizing that the 470 nm wavelength may already be too long to be responsive to additional absorption by OA-produced BrC (Zhang et al., 2022). The AAEs span 1.1–1.3 south of 8∘ S irrespective of distance from the coast and are close to 1 further north for the more remote 31 August 2017 flight (Fig. 11a). Such AAE values typically indicate a lack of BrC (e.g., Forrister et al., 2015). AAE is weakly positively correlated with OA:BC (r=0.27; not shown), but the relationship is statistically insignificant. Brown carbon absorption is also assessed using MAC following Carter et al. (2021) (Fig. 11b). This ranges from 0.94–1.2 m2 g−1 south of 8∘ S (with one exception) to 1.4–1.7 m2 g−1 further north. MAC is anticorrelated with OA:BC (). Although consistent with Saleh et al. (2014), the small sample size, dominated by one flight north of 8∘ S with less OA:BC, precludes much interpretation. We primarily conclude a lack of a longitudinal dependence, although the sample size is too small to say this with confidence. Other work has found that co-emitted sulfate can contribute to increasing overall absorption (Christian et al., 2003), but we do not find a correlation between either MAC estimate and the sulfate fraction (not shown).
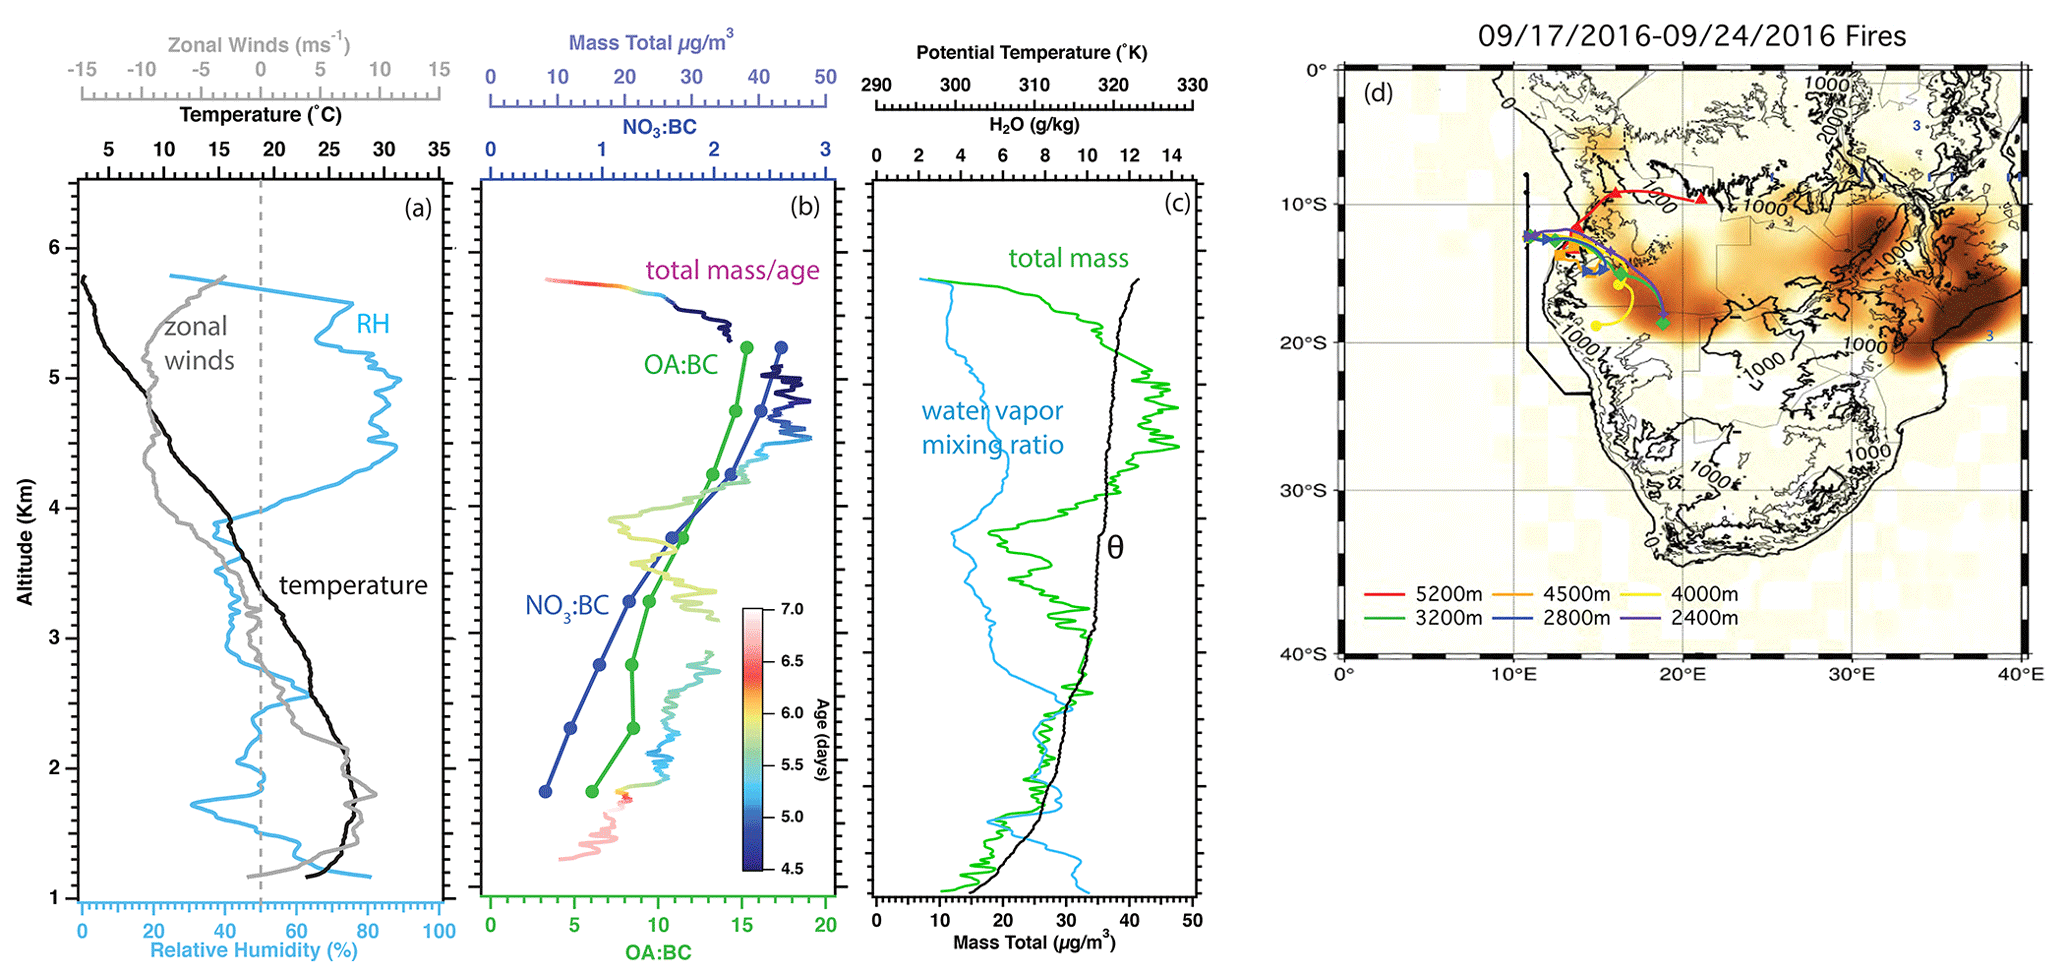
Figure 12The 24 September 2016 (12.34∘ S, 11∘ E) vertical profiles of (a) relative humidity (%; blue), zonal winds (m s−1; grey), and temperature (∘C), as well as (b) the organic-aerosol-to-black-carbon mass ratio (OA:BC; green), total nitrate-to-black-carbon ratio (NO3:BC; blue) averaged every 500 m (approximately 2 min of data), and (c) total mass concentration (OA + BC + SO4 + NO3 + NH4 in µg m−3; 1 Hz resolution) colored by aerosol age. (d) HYSPLIT trajectories, initialized on 12:00 UTC of 24 September 2016 with markers placed at 00:00 UTC of preceding days, superimposed on a map of fires detected between 17 and 24 September 2016.
The data for the youngest aerosol, aged 4–5 d since emission, stem from the 24 September 2016 flight (Fig. 2). Since this aerosol may be more susceptible to aging we examine its features more closely. Back trajectories from the profile at 12.3∘ S, 11∘ E show that the aerosols are coming from similar source regions (Fig. 12d) and become distributed vertically primarily by variations in the advection speed. One main aerosol layer is centered on 5 km, aged ∼4 d since emission, and a slightly older smoke layer of ∼5 d in age is centered on 3 km (Fig. 12b and c). The younger aerosol aloft is connected to stronger upper-altitude winds also transporting moisture (Fig. 12a), consistent with climatological expectations (Adebiyi et al., 2015; Adebiyi and Zuidema, 2016; Pistone et al., 2021). These generate relative humidities exceeding 80 % above 4 km when combined with the cooler high-altitude temperatures (Fig. 12a). Although there are two main aerosol plumes, the potential temperature profile is of a thermally stratified atmosphere containing many thinner seemingly well-mixed layers separated by discrete stability jumps (Fig. 12c). The water vapor mixing ratio profile (Fig. 12c) indicates that there is only one truly well-mixed layer, capping the upper aerosol plume between 5.3 and 5.8 km with slackening winds. The lack of vertical mixing indicates that the smoke plume heights are likely set above land. The upper-level aerosol plume registered both the highest OA:BC mass ratio and the highest SSA of the ORACLES 2016 campaign. More intense fires, with lower OA:BC, are typically able to reach higher altitudes (Martin et al., 2010), but the higher OA:BC and NO3:BC mass ratios aloft (Fig. 12b) may instead indicate more condensation of the emitted vapors aloft, aided by cooler temperatures and higher relative humidities (Li et al., 2018).
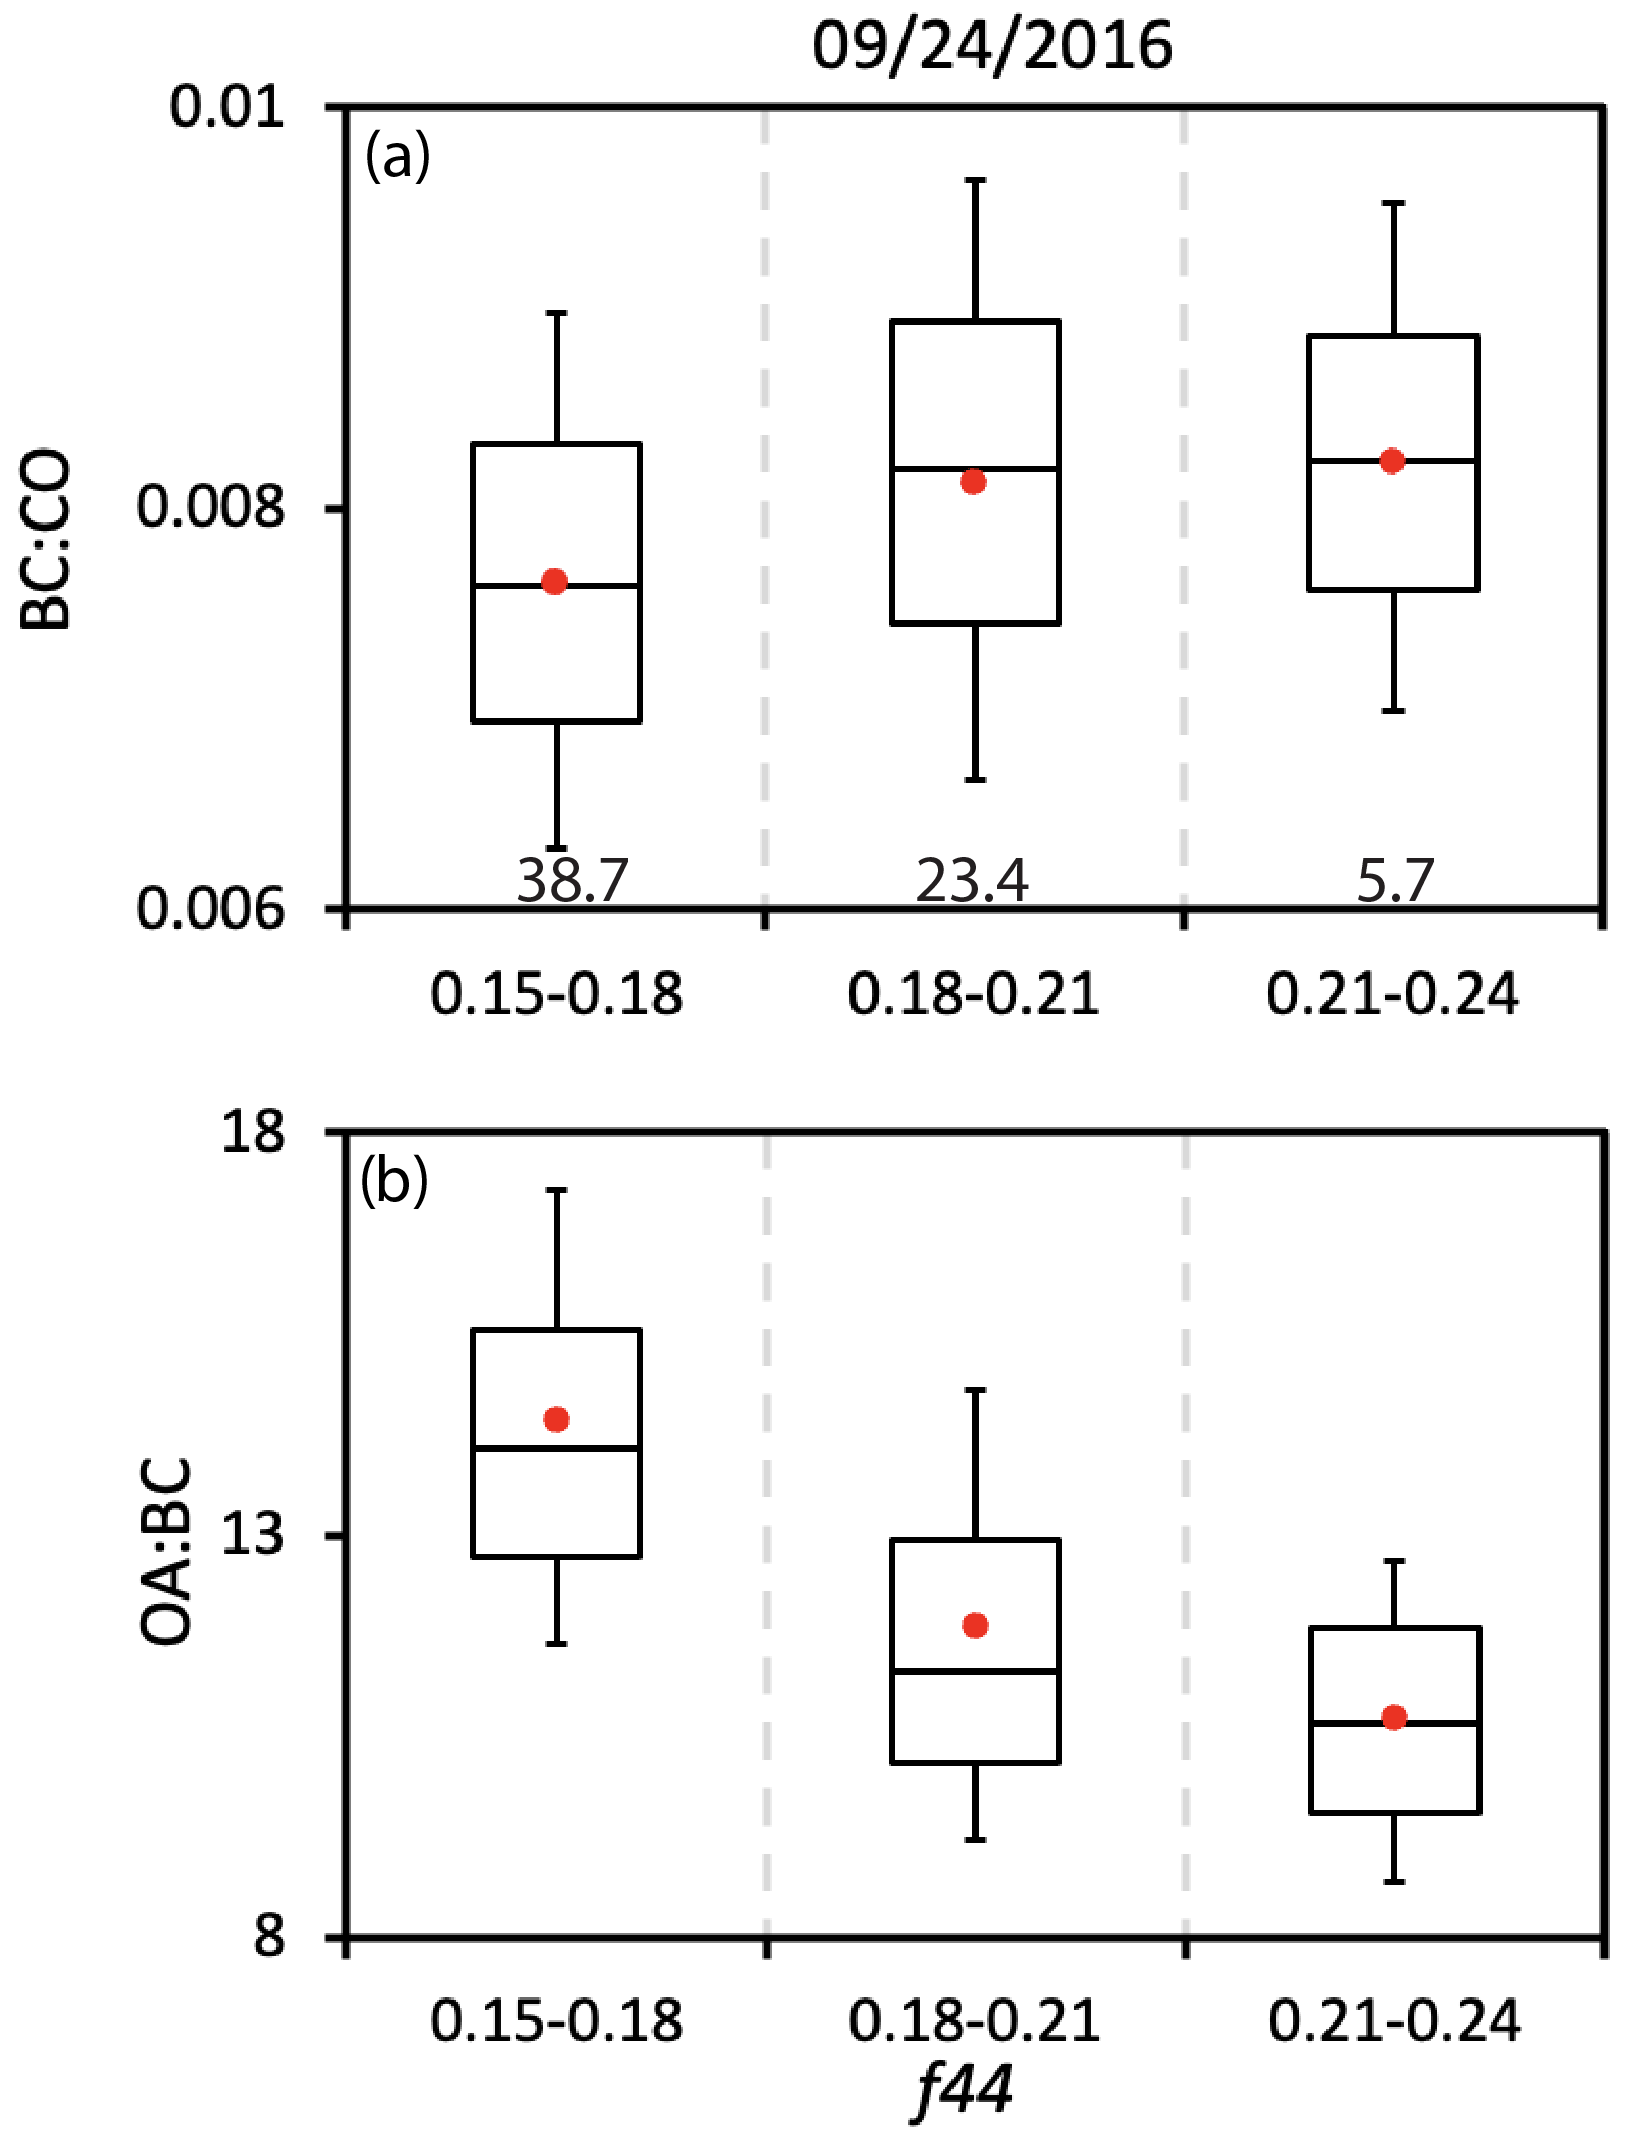
Figure 13(a) ratios (dimensionless) as a function of f44 for the 24 September 2016 flight. The number of minutes contributing to each f44 bin is stated at the bottom of the panel. Panel (b) is the same for OA:BC. Whiskers represent the 10th and 90th percentiles, and boxes illustrate the 75th and 25th percentiles, with a line indicating the median and a red filled circle the mean. OA >20 µg m−3 only.
Secondary aerosol formation is expected to proceed more quickly when ratios are lower (Vakkari et al., 2018) because the precursor gases needed for nucleation may be more available (Yokelson et al., 2009). We first confirm that the flight's values remain statistically similar as a function of f44: these remain within 7.5– independent of f44 (Fig. 13a; see Figs. S10 and S11 for the same analysis for the other flights). We interpret this to mean that the aerosol is emitted from similar sources over a 2 d time span, with no wet deposition throughout. The corresponding OA:BC mass ratio decreases from 14.2 to 9.8 (Fig. 13b) – an approximate 35 % decline in OA:BC over a span of 1–2 d. The corresponding SSA is reduced from 0.89 to 0.865. The mean AAE470−660 decreases from 1.25 to 1.21 (±0.07–0.08) as a function of the three f44 bins, a statistically insignificant decline.
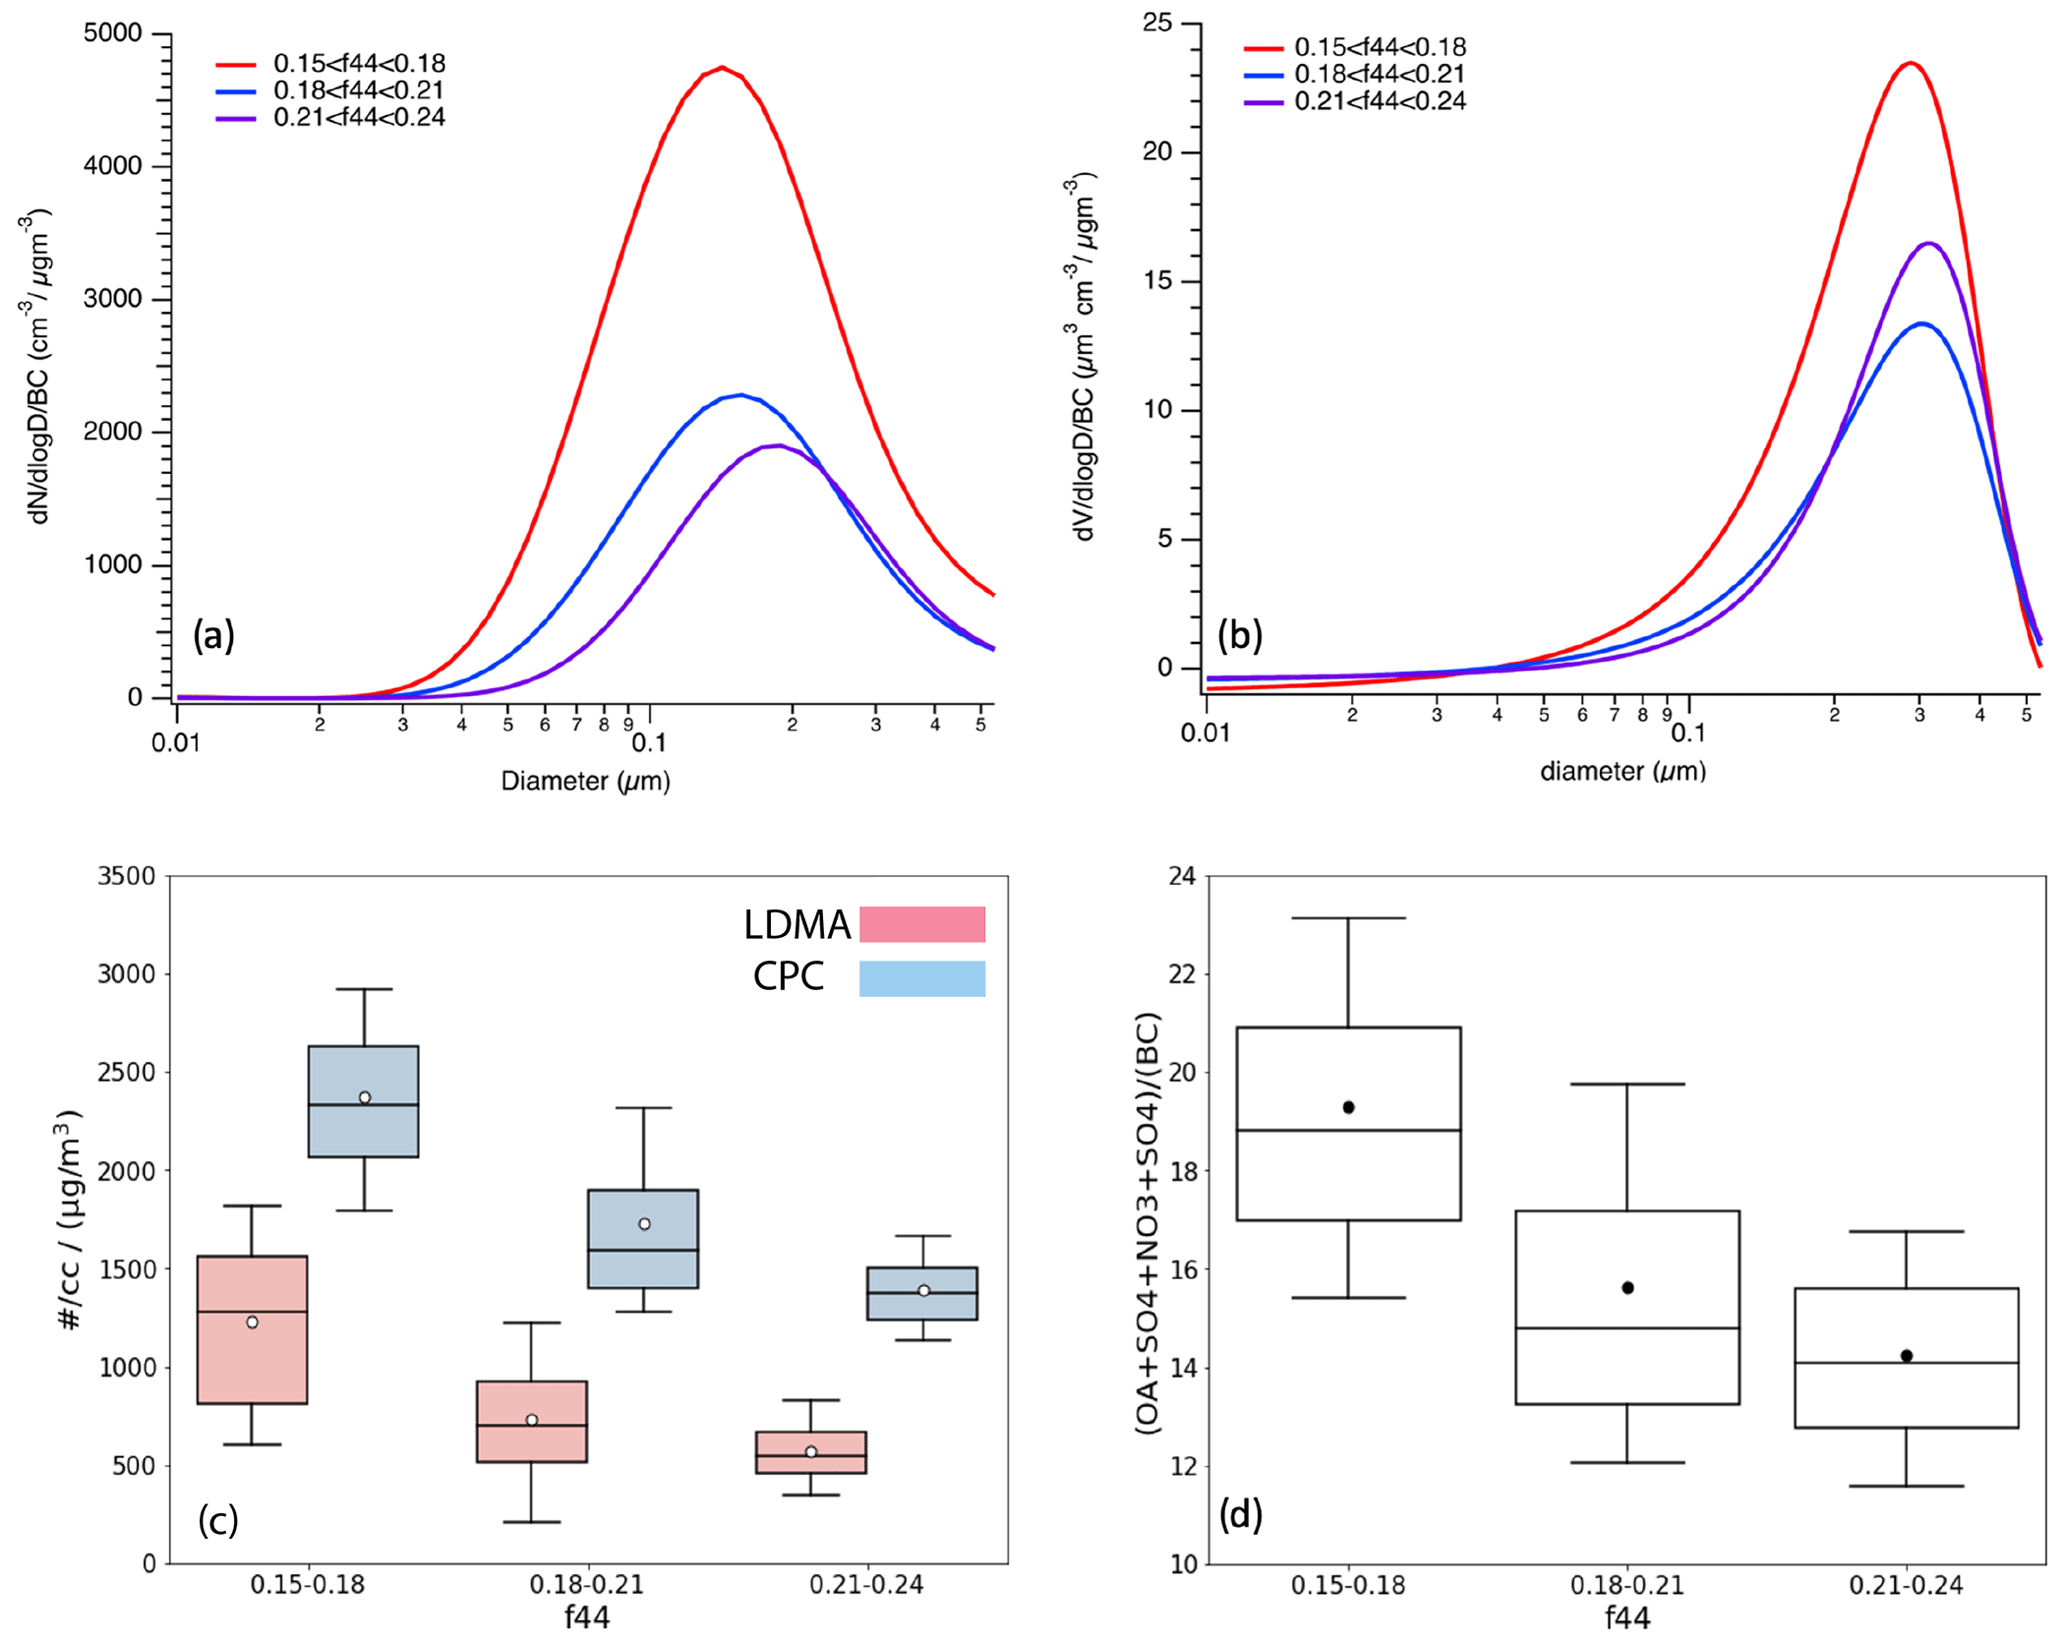
Figure 14(a) The 24 September 2016 LDMA-derived number particle size distribution for three f44 bins (0.15–0.18 – red; 0.18–0.21 – blue; 0.21–0.24 – purple), divided by the BC mass. Panel (b) is the same as (a) but for the LDMA-derived particle size distribution. Panel (c) shows the LDMA and CPC particle number concentration as a function of f44 and the (d) ratio of non-BC total mass (OA + SO4 + NO3 + NH4) to BC as a function of the three f44 bins. All data are selected from OA >20 µg m−3.
An evaluation of the changes to the particle size distribution with f44, normalized with respect to BC as a control for dilution, indicates the processes of condensation and coagulation as well as volume loss consistent with the mass loss. As the aerosol ages chemically, the LDMA median diameter increases from ∼170 to ∼205 nm (Fig. 14a), mostly because the number of particles with diameters <100 nm declines. BC particles are typically larger than OA particles (e.g., Fig. S6), and the reduction in the number of small particles indicates coagulation of the OA particles upon the larger BC particles. It also indicates that most of the vapors are condensing on the larger BC particles, as opposed to forming new particles by nucleation. The total LDMA and CPC particle number concentrations are reduced from approximately 1200 to 500 cm−3 with respect to BC and 2400 to 1500 cm−3, respectively (Fig. 14c). The large difference in the two number concentrations likely reflects an instrument difference; both instruments agree there is no net production of the smaller particles. The combined effect of condensation and coagulation results in an increase in the fraction of BC-containing particles from 0.18 to 0.23 and then 0.27 as f44 increases. The evolution towards larger sizes would increase the SSA, all else being equal. Instead, the SSA decreases in response to the decrease in OA, again indicating that changes in particle size do not dominate the SSA changes.
At the same time, the LDMA-determined particle volume decreases (Fig. 14b), indicating genuine particle mass loss that is consistent with the decrease in OA:BC. One mechanism for the mass loss could be evaporation through dilution. The selection for data samples with OA >20 µg m−3 focuses the analysis on the aerosol plume center, and a normalization by BC provides an additional control, leading us to discount this mechanism. Aqueous-phase reactions and mid-level cloud processing could potentially also contribute to the oxidation increase and loss of free-tropospheric OA mass concentration. This is partially controlled for by only selecting free-tropospheric data samples with RH <80 %. Mid-level clouds, produced by dry convection saturating the top of the land boundary layer, can occur (Adebiyi et al., 2020), but are not a dominant presence on this day or other ORACLES flight days. This suggests to us that the reduction of free-tropospheric OA through aqueous-phase reactions is of secondary importance (becoming even more so with distance from the continent).
Instead, we speculate that the dominant loss mechanism can be increasing oxidation through fragmentation, which can release higher-volatility particles that can then be subsequently removed (e.g., Jimenez et al., 2009). Figure 14c and d support that interpretation: both the LDMA and CPC total particle number concentrations decrease with f44, consistent with processes occurring at the surface of the larger particles – either coagulation or surface reactions. The oxidative environment, inferred from , remains constant with f44, but these measures for oxidation may have reached their upper limit. The reduction in the total non-BC aerosol mass, which reflects a reduction in the combined OA + NH4 + NO3 mass but not SO4, is nevertheless in concert with the OA:BC decrease. The constancy of SO4:BC with f44 (not shown) confirms that the aerosol is aged, as the lifetime of SO2 is 1–2 d, after which its conversion to SO4 will have ended. In summary we interpret Fig. 14 to reflect changes in the particle size distribution induced by condensation, coagulation, and mass loss through fragmentation.
The back trajectories do not show lower-level westerlies, in contrast to the in situ profiles. We conjecture that the daytime aircraft sampling sampled a land breeze below 4 km that is converging above a warming continental surface and is not represented in the GFS meteorology. The ERA5 dataset, which has an hourly temporal resolution, might be able to address this hypothesis. The marine boundary layer top is at 1 km (not shown), and the boundary layer did not include any BC, consistent with a slow entrainment timescale for aerosols (Diamond et al., 2018).
Table 3Comparison of level-leg mean values to CLARIFY.
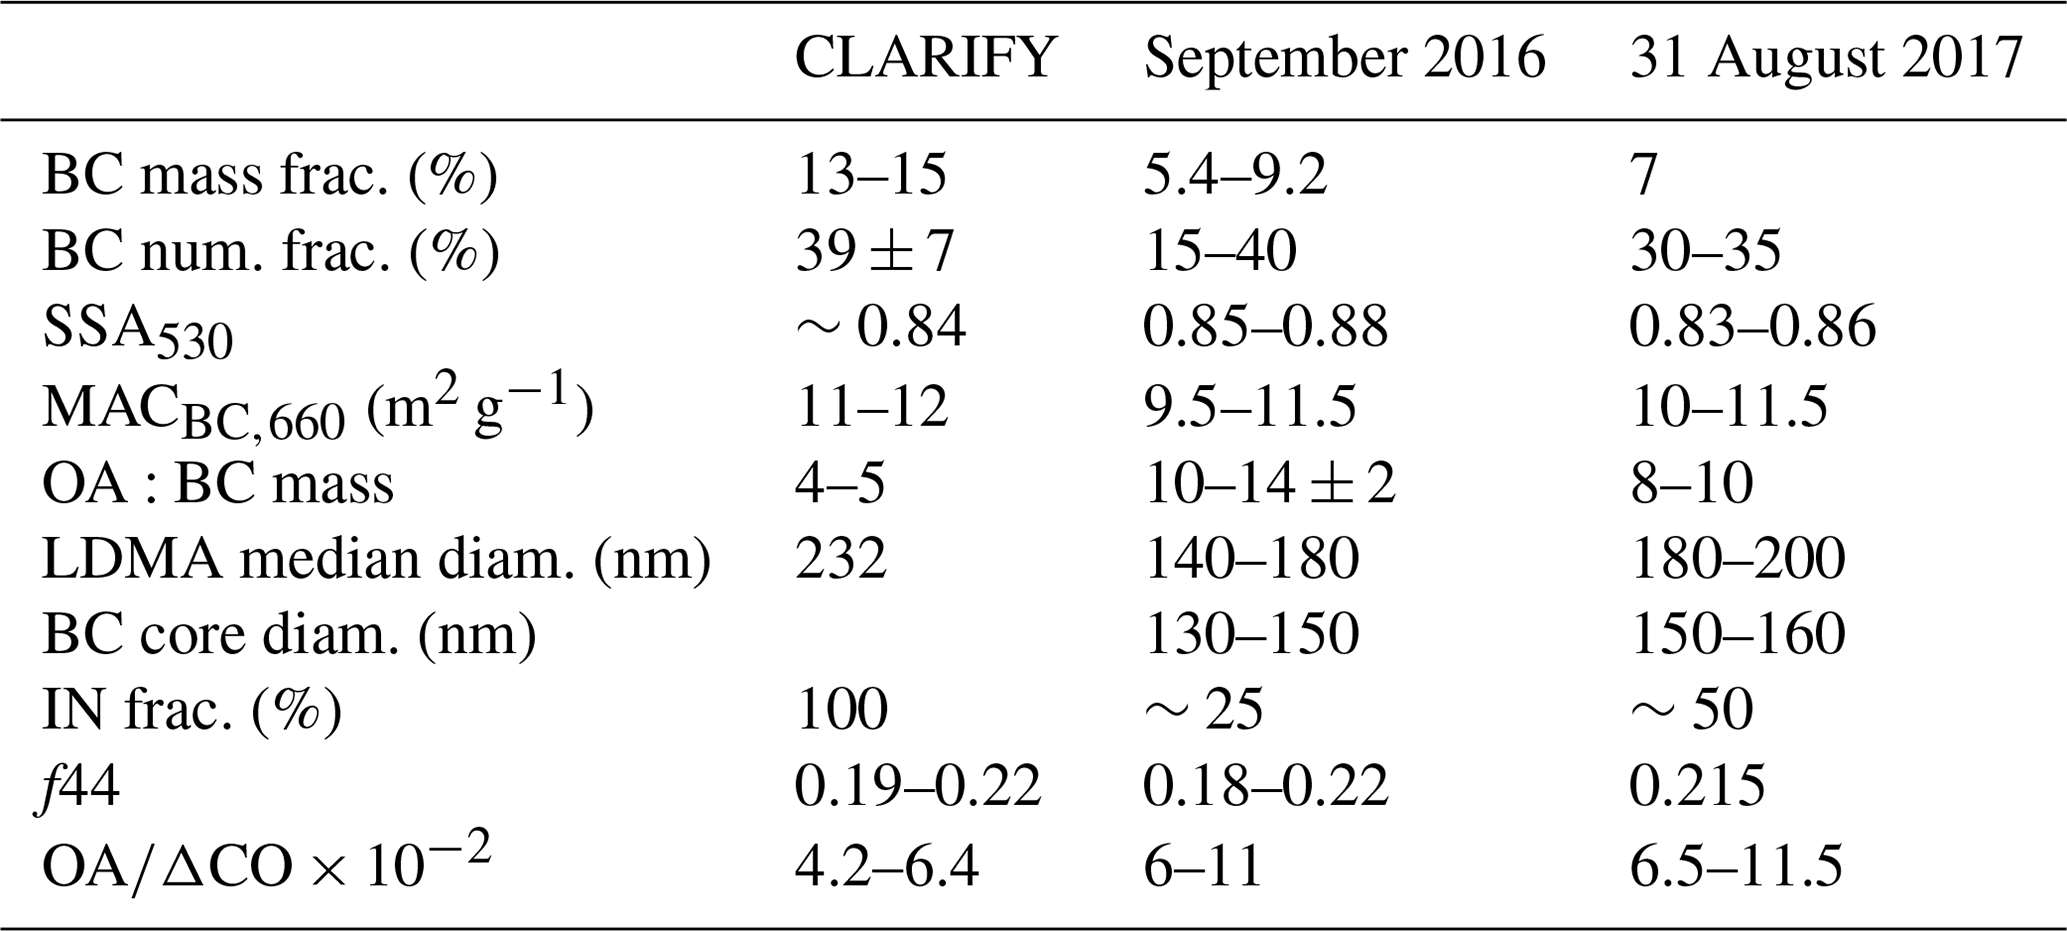
CLARIFY free-tropospheric values taken from Wu et al. (2020) and Taylor et al. (2020), based on CLARIFY 033-039 and 045-051 flights. CLARIFY BC number fraction calculated relative to PCASP-derived total number concentrations.
A third possible mechanism for the loss of the overall particle mass could be through thermodynamics, consistent with the increase in NO3:BC with altitude (Fig. 12b). A comparison to the aerosol properties measured at the more remote location of Ascension Island by CLARIFY (Table 3) supports the speculation that fragmentation of oxidized aerosol may be contributing to mass loss by ultimately releasing some aerosol that can evaporate through photochemistry, similar to the younger aerosol sampled on 24 September 2016. Table 3 compares values for the aerosol parameters derived from the six ORACLES flights to the free-tropospheric values reported within Wu et al. (2020) and Taylor et al. (2020). The ORACLES 31 August 2017 flight coincided with CLARIFY and occurred halfway to the island (Fig. 1). It is important to this comparison that the ORACLES and CLARIFY , BC, and SSA values compared well on the intercomparison flight held on 18 August 2017 (Barrett et al., 2022). Their similar ratios (Table 2) also equal the maximum values inferred from the surface-based measurements at Ascension between June and October (Che et al., 2022).
Overall, CLARIFY sampled more BC-enriched particles in the free troposphere above Ascension in both number and mass, with slightly lower SSA, higher MAC660s, and larger particle sizes. The OA:BC mass ratios are lower, mostly because the OA masses themselves are much lower, typically <4 µg m−3 (Wu et al., 2020). Interestingly, September African BBA sampled near the Amazon Tall Tower Observatory indicated BC mass and number fractions on par with CLARIFY, with OA:BC mass ratios between 2.5 and 5.0, although the sampling is only from one aircraft flight (Holanda et al., 2020). The H:C, O:C and OA:OC CLARIFY values (1.2–1.4, 0.7–0.8, 2.3) indicate slightly more oxidized aerosol at Ascension (Wu et al., 2020) than for ORACLES, with the exception of 31 August 2017 (Fig. 8). ORACLES 31 August 2017 flight values tend to be intermediate compared to the CLARIFY and ORACLES 2016 numbers.
Other prior field campaigns have highlighted a small net OA loss as BBA ages beyond a day (e.g., Capes et al., 2008; Jolleys et al., 2012, 2015; Hodzic et al., 2015; Konovalov et al., 2019; Farley et al., 2022), attributed to evaporation through dilution in Jolleys et al. (2012). The extent of the OA reduction reported here – a factor of at least 2 between ORACLES and CLARIFY OA masses – suggests that a different process must be dominant. Nevertheless, we examine if dilution could be factor by comparing the number and volume size distributions measured by the TDMA during the 31 August 2017 flight at STP and at 150 ∘C (Fig. S7). The heating is used as a proxy for dilution because processes respond to aerosol volatility. Although the TDMA size distribution does not extend beyond 0.2 µm at most, missing the bulk of the aerosol mass, the size distributions change little between the temperatures, supporting the inference that evaporation through dilution does not explain differences in OA:BC between the two campaigns.
Another significant difference between ORACLES 2016 and CLARIFY is the inorganic nitrate (IN) fraction. Nitrate only contributes 10 % to the total aerosol mass analyzed here and only 8 % of the total free-tropospheric aerosol mass during CLARIFY (Wu et al., 2020). The fraction that is inorganic nitrate is even smaller. Interestingly, the 31 August 2017 inorganic nitrate fraction was 51 % – intermediate compared to the ORACLES 2016 and CLARIFY values (Table 3). This suggests that organic nitrate may become converted to inorganic nitrate as the aerosol ages. The air sampled during ORACLES was mildly acidic (Fig. S10) based on a simplification of the relationship put forth in Zhang et al. (2007). A mild acidity will slow the rate of inorganic acid formation and may help explain the lower IN fraction for ORACLES (20 %–25 %). Inorganic ammonium nitrate is held responsible for an increase in SSA with height at Ascension (Wu et al., 2020), as thermodynamic partitioning favors the particle phase at higher altitudes. The nitrate fraction is never large, and the coating on the BC will be dominated by OA by mass, so that the IN fraction may be more valuable as an indicator of ongoing oxidation that is also capable of increasing the MAC (Shrivastava et al., 2017). The sulfate fraction is similar between the two campaigns, including the 31 August 2017 flight, and seems unlikely to explain the differences in the MAC between the campaigns. Increasing coagulation of smaller particles upon the BC particles could help explain why the particle diameters are larger at Ascension compared to ORACLES 2016 at the same time that evaporation through photochemistry increases the fraction of BC-containing particles while decreasing the overall OA:BC mass ratio. It is also possible that the non-Lagrangian sampling is introducing a bias. A Lagrangian analysis of filter samples did find increased aerosol volatility and continued OA loss in ORACLES–CLARIFY resampled aerosol (Dang et al., 2022).
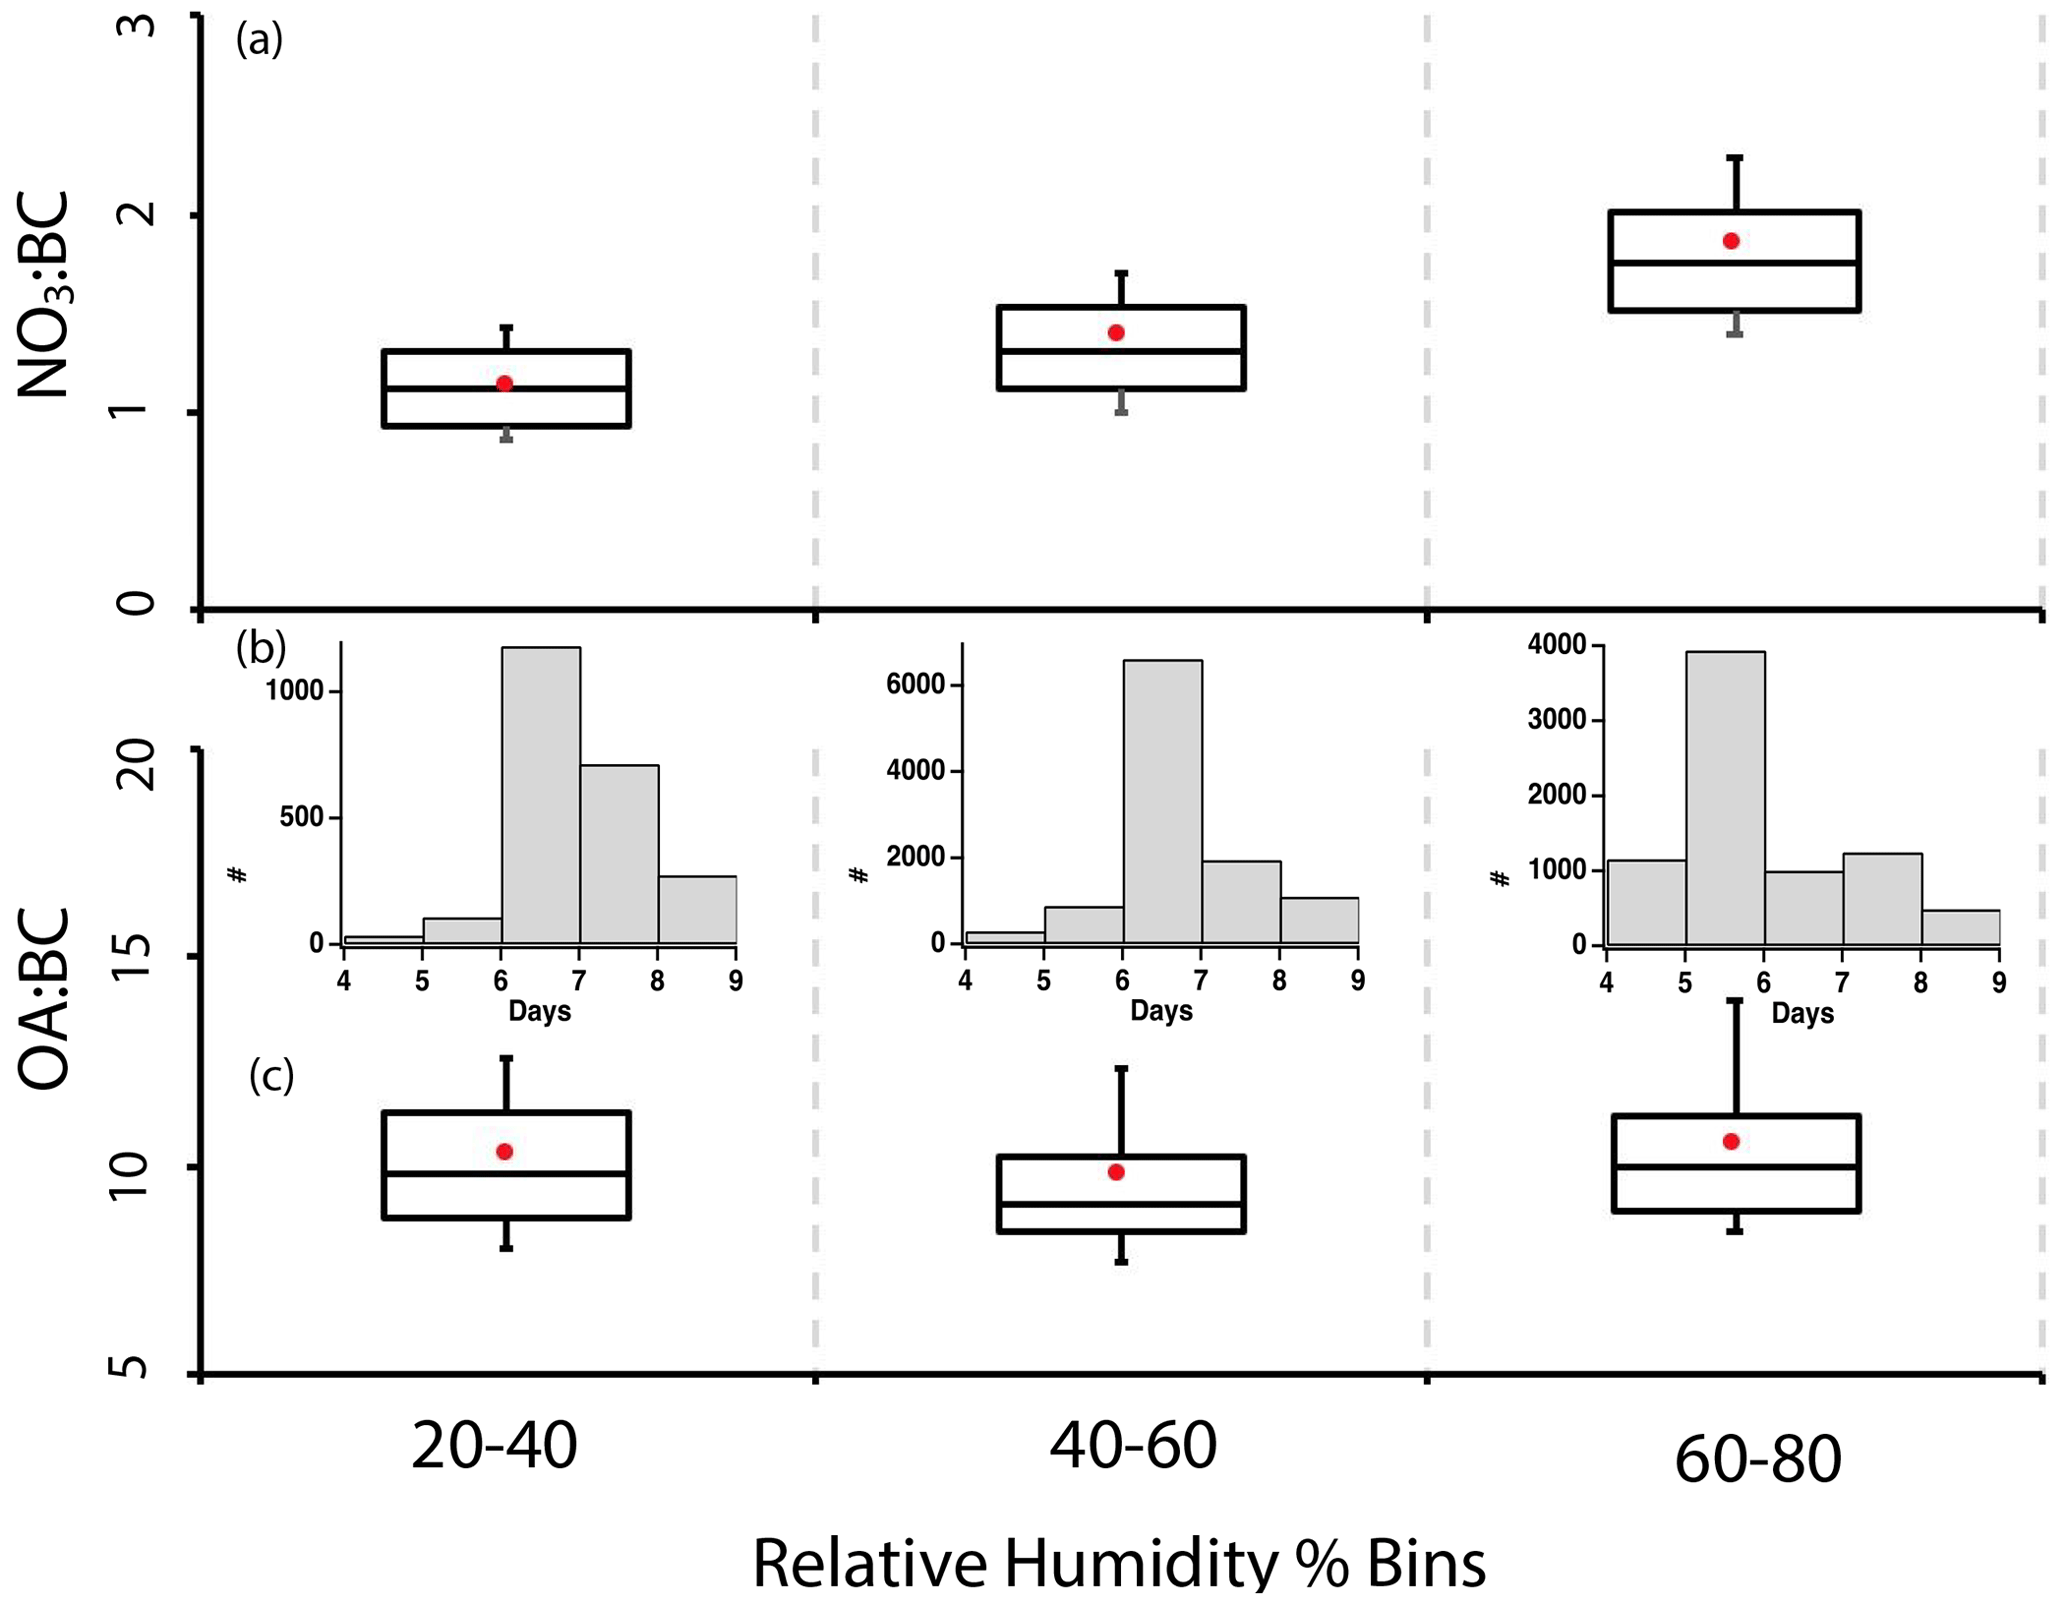
Figure 15(a) NO3:BC and (c) OA:BC mass ratios for the six selected flights as a function of relative humidity for OA >20 µg m−3 at STP. The 10th, 25th, median, 75th, and 90th percentiles are indicated using box whiskers and the mean with a solid red circle and marker. (b) Corresponding distribution of aerosol ages within each relative humidity range, with the y axis indicating the number of 1 s samples.
We also examine if a portion of the OA can thermodynamically repartition. We composite OA:BC, NO3:BC, and aerosol age by the free-tropospheric RH for all six flights to illuminate how much thermodynamical partitioning by altitude may be occurring. The higher altitudes in the free troposphere are also often more humid (e.g., Fig. 12, shown more statistically in Adebiyi et al., 2015, and Pistone et al., 2021). Physically younger aerosol is more likely to occupy a more (relatively) humid, colder free troposphere at higher altitudes than older aerosol (e.g., Fig. 12). The mean NO3:BC ratio decreases by almost 50 % as the free troposphere RH decreases from 70 % to 30 % (Fig. 15a), consistent with a thermodynamic repartitioning to the gas phase.
The mean OA:BC mass ratio only reduces from 10.5±2.6 for RH =60 %–80 % to 9.9±2.1 for 20 % < RH < 40 %, a statistically insignificant decrease. A thermodynamical repartition can only explain a relative change in OA:BC of less than 10 %, if that. The small change in OA:BC, if real, may also reflect moisture contributing to the OA mass loss through increasing OH uptake and/or fragmentation (Li et al., 2018) or because at higher altitudes, less-oxidized material is continuing to condense upon the pre-existing organics, ultimately favoring the evaporation of OA into the gas phase.
This study extends and strengthens an earlier analysis begun within Dobracki et al. (2022). One flight, on 24 September 2016, has consistent BC:CO ratios as a function of the f44 chemical aging marker, interpreted to mean emissions from similar sources over a few days with no wet deposition. At the lower altitudes with weaker offshore winds, condensation and coagulation explain an increased particle size for the slightly older aerosol. Increasing oxidation through fragmentation, which can then release higher-volatility particles through photochemistry, can explain the reduced overall mass. Dilution is not considered to be as influential as for Northern Hemisphere boreal fires because the smoke distribution is so broad and loadings so large, composed of many small continental fires that become homogenized before the smoke is advected offshore. An increase in SSA with height is primarily explained by more OA aloft. This contrasts with the increase in SSA with height at Ascension attributed to an increase in ammonium nitrate (Wu et al., 2020), which may reflect changes in the aerosol composition occurring with further transport offshore. Level-leg measurements from six flights demonstrate how optical properties relate to chemical and physical composition and can be compared to values from Wu et al. (2020) and Taylor et al. (2020) made at Ascension Island. Further focus on data from the 31 August 2017 flight helps connect interpretations of ORACLES versus CLARIFY aerosol characteristics.
The total aerosol concentration exceeds the total SP2-derived BC number by a factor of 2.5 to 7, from which we infer that at least one-half of the non-BC aerosol remains externally mixed with the BC. The BC itself, because of its transport within multiple days within broad, dense smoke plumes, is most likely internally mixed with other aerosols, confirmed by independent electron microscopy measurements (Dang et al., 2022). Because the BBA is at least 4 d old, and as already shown within Taylor et al. (2020) and Denjean et al. (2020b), the BC can be treated as compacted. Taylor et al. (2020) find a better fit to the CLARIFY MAC measurements using the semi-empirical models of Liu et al. (2017) and Chakrabarty and Heinson (2018) than to a core–shell Mie model, but Lee et al. (2022) conclude that a core–shell model can be successfully applied once particle-by-particle differences are accounted for. The 2016 data from ORACLES lack an SP2 mixing state date with which to better evaluate optical fits, but an independent assessment could be pursued using the SP2 coating-resolved ORACLES data from 2017 and 2018 (Sedlacek et al., 2022).
A highlight of this study is its SSA530 best-fit regression on OA:BC: SSA. The range of OA:BC of 7 through 14 equates to an SSA variability of 0.83 to 0.89. This provides a straightforward connection between the BBA chemical and optical properties that is useful for the modeling of the direct aerosol radiative effect. Of course, use of such a best fit is only effective if the model OA:BC mass ratios are realistic. Given that OA:BC mass ratios are often too low in models, their absorption of sunlight will also be overestimated (Brown et al., 2021). This study adds to literature indicating that OA model estimates made by multiplying the organic carbon by a factor of 1.4 will underestimate OA in this (and other) regions (Aiken et al., 2008; Tsigaridis et al., 2014; Shinozuka et al., 2020; Doherty et al., 2022). This study's OA:OC mass ratios of 2.2±0.1 are also shown for the Atomic Tomography mission (Hodzic et al., 2020).
More sophisticated aerosol schemes can, in contrast, overestimate OA:BC mass ratios over the southeastern Atlantic (Chylek et al., 2019), suggesting that the loss of OA with aging or slower SOA production processes (Kroll and Seinfeld, 2008; McFiggans et al., 2019) may also be under-accounted for. For the southeastern Atlantic region, far removed from urban and industrial sources of pollution, continued production of SOA after 1–2 d is expected to remain minor (e.g., O'Brien and Kroll, 2019). This contrasts with Northern Hemisphere fire emission sources. Brown carbon production has been linked to low OA:BC ratios (Saleh et al., 2014; McClure et al., 2020), but this does not seem supported by the admittedly limited ORACLES measurements of AAE and MAC, perhaps because brown carbon is typically more closely linked to primary than to secondary organic aerosol. Many prior studies find continuing oxidation of OA (see review by Shrivastava et al., 2017). This will be more important for remote environments containing thick smoke layers lacking additional pollution sources producing the precursor gases for additional SOA. Further work is needed to better support the process conclusion of this study, namely that evaporation through fragmentation and/or photochemistry is the dominant chemical aging process over the southeastern Atlantic, but nevertheless this study indicates the importance of developing sophisticated SOA schemes (e.g., Lou et al., 2020) for this regional climate.
September is unique in that meteorology and fire processes conspire to accentuate the direct radiative warming of the southeastern Atlantic. August is likely the month with the most fires in southern Africa (Scholes et al., 1996), but the upper-level winds that transport the aerosol depend on a strong heat low over southern Africa and do not become well-established until September (Adebiyi and Zuidema, 2016; Kuete et al., 2020). The winds occur to the north of the heat low, and only dry convection lofts the aerosols to their altitude. The winds distribute aerosol as far away as South America (Holanda et al., 2020) so that the entire South Atlantic is covered by a blanket of highly absorptive aerosol, with submicron BC mass fractions far exceeding the 2 %–10 % estimated for western North America (Garofalo et al., 2019). The strong September upper-level winds also discourage subsidence (Chaboureau et al., 2022), and the cloud cover and height are also directly affected by meteorology during this month (Adebiyi and Zuidema, 2018; Zhang and Zuidema, 2021). Less of the aerosol reaches the cloud top, reducing aerosol entrainment into the cloud layer (Zuidema et al., 2018; Shinozuka et al., 2020; Doherty et al., 2022) and the ability to influence the cloud-top inversion strength (Herbert et al., 2020). The net radiative impact will primarily be the direct aerosol radiative effect of the aerosol aloft then, lending further weight to model representation of SSA (Mallet et al., 2021). The remaining ORACLES data from 2017 and 2017, for which SP2 mixing state data are available, will be used to support further investigation of SSA–aerosol composition relationships in a follow-up study.
The data are available through
https://doi.org/10.5067/Suborbital/ORACLES/P3/2016_V2 (NASA ORACLES Science Team, 2017a) and
https://doi.org/10.5067/Suborbital/ORACLES/P3/2017_V2 (NASA ORACLES Science Team, 2017b).
The supplement related to this article is available online at: https://doi.org/10.5194/acp-23-4775-2023-supplement.
The present work was conceived by PZ, AD, PS, and SGH. SF contributed to the HiGEAR data analysis, AJS III provided the BC datasets, and PS the WRF-AAM model age estimates. Portions of this work first appeared in the MS thesis of AD at the University of Hawaii. PZ led the writing with AD providing most of the figures. All authors contributed to the final writing.
At least one of the (co-)authors is a guest member of the editorial board of Atmospheric Chemistry and Physics for the special issue “New observations and related modelling studies of the aerosol–cloud–climate system in the Southeast Atlantic and southern Africa regions (ACP/AMT inter-journal SI)”. The peer-review process was guided by an independent editor, and the authors also have no other competing interests to declare.
Publisher's note: Copernicus Publications remains neutral with regard to jurisdictional claims in published maps and institutional affiliations.
This article is part of the special issue “New observations and related modelling studies of the aerosol–cloud–climate system in the Southeast Atlantic and southern Africa regions (ACP/AMT inter-journal SI)”. It is not associated with a conference.
ORACLES is a NASA Earth Venture Suborbital-2 investigation, funded by the US National Aeronautics and Space Administration (NASA) Earth Sciences Division and managed through the Earth System Science Pathfinder Program Office (grant no. NNH13ZDA001N-EVS2). This work was further supported by the US Department of Energy (grant no. DE-SC0018272 to Paquita Zuidema and Pablo Saide and DE-SC0021250 to Paquita Zuidema). We thank Hugh Coe, Huihiu Wu, and Jonathan Taylor for interesting initial conversations that in particular encouraged us to examine the inorganic nitrate fraction.
This research has been supported by the National Aeronautics and Space Administration, Earth Sciences Division (grant no. NNH13ZDA001N-EVS2), and the U.S. Department of Energy, Office of Science (grant no. DESC0021250).
This paper was edited by Andreas Petzold and reviewed by Müller Thomas and one anonymous referee.
Adebiyi, A. A. and Zuidema, P.: The role of the southern African easterly jet in modifying the southeast Atlantic aerosol and cloud environments, Q. J. Roy. Meteor.Soc., 142, 1574–1589, https://doi.org/10.1002/qj.2765, 2016. a, b, c, d
Adebiyi, A. A. and Zuidema, P.: Low cloud sensitivity to biomass-burning aerosols and meteorology over the southeast Atlantic, J. Climate, 31, 4329–4346, https://doi.org/10.1175/JCLI-D-17-0406.1, 2018. a
Adebiyi, A. A., Zuidema, P., and Abel, S. J.: The Convolution of Dynamics and Moisture with the Presence of Shortwave Absorbing Aerosols over the Southeast Atlantic, J. Climate, 28, 1997–2024, https://doi.org/10.1175/JCLI-D-14-00352.1, 2015. a, b
Adebiyi, A. A., Zuidema, P., Chang, I., Burton, S. P., and Cairns, B.: Mid-level clouds are frequent above the southeast Atlantic stratocumulus clouds, Atmos. Chem. Phys., 20, 11025–11043, https://doi.org/10.5194/acp-20-11025-2020, 2020. a
Aiken, A. C., DeCarlo, P. F., and Jimenez, J. L.: Elemental analysis of organic species with electron ionization high-resolution mass spectrometry, Anal. Chem., 79, 8350–8358, 2007. a
Aiken, A. C., DeCarlo, P. F., Kroll, J. H., Worsnop, D. R., Huffman, J. A., Docherty, K. S., Ulbrich, I. M., Mohr, C., Kimmel, J. R., Sueper, D.,Sun, Y., Zhang, Q., Trimborn, A., Northway, M., Ziemann, P. J., Canagaratna, M. R., Onasch, T. B., Alfarra, M. R., Prevot, A. S. H., Dommen, J., Duplissy, J., Metzger, A., Baltensperger, U., and Jimenez, J. L.: and ratios of primary, secondary, and ambient organic aerosols with high-resolution time-of-flight aerosol mass spectrometry, Environ Sci Technol., 42, 4478–4485, 2008. a, b, c
Akagi, S. K., Yokelson, R. J., Wiedinmyer, C., Alvarado, M. J., Reid, J. S., Karl, T., Crounse, J. D., and Wennberg, P. O.: Emission factors for open and domestic biomass burning for use in atmospheric models, Atmos. Chem. Phys., 11, 4039–4072, https://doi.org/10.5194/acp-11-4039-2011, 2011. a, b, c, d
Anderson, T. L. and Ogren, J. A.: Determining Aerosol Radiative Properties Using the TSI 3563 Integrating Nephelometer, Aer. Sci. Tech., 29, 57–69, https://doi.org/10.1080/02786829808965551, 1998. a
Andreae, M. O.: Emission of trace gases and aerosols from biomass burning – an updated assessment, Atmos. Chem. Phys., 19, 8523–8546, https://doi.org/10.5194/acp-19-8523-2019, 2019. a, b, c, d, e
Baars, H., Radenz, M., Floutsi, A., Engelmann, R., Althausen, D., Ansmann, A., Flament, T., Dabas, A., Trapon, D., Reitebuch, O., Bley, S., and Wandinger, U.: Californian wildfire smoke over Europe: A first example of the aerosol observing capabilities of Aeolus compared to ground‐based lidar, Geophys. Res. Lett., 48, e2020GL092194, https://doi.org/10.1029/2020GL092194, 2021. a
Bahreini, R., Ervens, B., Middlebrook, A. M., Warneke, C., de Gouw, J. A., DeCarlo, P. F., Jimenez, J., Brock, C., Neuman, J., Ryerson, T., Stark, H., Atlas, E., Brioude, J., Fried, A., Holloway, J., Peischl, J., Richter, D., Walega, J., Weibring, P., Wollny, A., and Fehsenfeld, F.: Organic aerosol formation in urban and industrial plumes near Houston and Dallas, Texas, J. Geophys. Res., 114, D00F16, https://doi.org/10.1029/2008jd011493, 2009. a
Barrett, P. A., Abel, S. J., Coe, H., Crawford, I., Dobracki, A., Haywood, J., Howell, S., Jones, A., Langridge, J., McFarquhar, G. M., Nott, G. J., Price, H., Redemann, J., Shinozuka, Y., Szpek, K., Taylor, J. W., Wood, R., Wu, H., Zuidema, P., Bauguitte, S., Bennett, R., Bower, K., Chen, H., Cochrane, S., Cotterell, M., Davies, N., Delene, D., Flynn, C., Freedman, A., Freitag, S., Gupta, S., Noone, D., Onasch, T. B., Podolske, J., Poellot, M. R., Schmidt, S., Springston, S., Sedlacek III, A. J., Trembath, J., Vance, A., Zawadowicz, M. A., and Zhang, J.: Intercomparison of airborne and surface-based measurements during the CLARIFY, ORACLES and LASIC field experiments, Atmos. Meas. Tech., 15, 6329–6371, https://doi.org/10.5194/amt-15-6329-2022, 2022. a, b, c
Bond, T. C. and Bergstrom, R. W.: Light absorption by carbonaceous particles: an investigative review, Aerosol Sci. Technol., 40, 27–67, https://doi.org/10.1080/02786820500421521, 2006. a, b, c, d
Bond, T. C., Doherty, S. J., Fahey, D. W., Forster, P. M., Berntsen, T., DeAngelo, B. J., Flanner, M. G., Ghan, S., Kärcher, B., Koch, D., Kinne, S., Kondo, Y., Quinn, P. K., Sarofim, M. C., Schultz, M. G., Schulz, M., Venkataraman, C., Zhang, H., Zhang S., Bellouin, N., Guttikunda, S. K., Hopke, P. K., Jacobson, M. Z., Kaiser, J. W., Klimont, Z., Lohmann, U., Schwarz, J. P., Shindell, D., Storelvmo, T., Warren, S. G., and Zender, C. S.: Bounding the role of black carbon in the climate system: A scientific assessment, J. Geophys. Res., 118, 5380–5552, https://doi.org/10.1002/jgrd.50171, 2013. a
Bowman, D. M., Balch, J. K., Artaxo, P., Bond, W. J., Carlson, J. M., Cochrane, M. A., D'Antonio, C. M., DeFries, R., Doyle, J., Harrison, S., Johnston, F., Keeley, J., Krawchuk, M., Kull, C., Marston, B., Moritz, M., Prentice, C., Roos, C., Scott, A., Swetnam, T., van der Werf, G., and Pyne, S.: Fire in the Earth System, Science, 324, 481–484, https://doi.org/10.1126/science.1163886, 2009. a
Brown, H., Liu, X., Pokhrel, R., Murphy, S., Lu, Z., Saleh, R., Mielonen, T., Kokkola, H., Bergman, T., Myhre, G., Skeie, R. B., Watson-Paris, D., Stier, P., Johnson, B., Bellouin, N., Schulz, M., Vakkari, V., Beukes, J. P., vanZyl, P. G., Liu, S., and Chand, D.: Biomass burning aerosols in most climate models are too absobing, Nat. Commun., 12, 277, https://doi.org/10.1038/s41467-020-20482-9, 2021. a, b, c, d, e
Canagaratna, M. R., Jimenez, J. L., Kroll, J. H., Chen, Q., Kessler, S. H., Massoli, P., Hildebrandt Ruiz, L., Fortner, E., Williams, L. R., Wilson, K. R., Surratt, J. D., Donahue, N. M., Jayne, J. T., and Worsnop, D. R.: Elemental ratio measurements of organic compounds using aerosol mass spectrometry: characterization, improved calibration, and implications, Atmos. Chem. Phys., 15, 253–272, https://doi.org/10.5194/acp-15-253-2015, 2015. a
Capes, G., B.Johnson, McFiggans, G., Williams, P. I., Haywood, J., and Coe, H.: Aging of biomass burning aerosols over West Africa: Aircraft measurements of chemical composition, microphysical properties, and emission ratios, J. Geophys. Res., 113, D00C15, https://doi.org/10.1029/2008jd009845, 2008. a, b
Carter, T. S., Heald, C. L., Cappa, C. D., Kroll, J. H., Campos, T. L., Coe, H., Cotterel, M. I., Davies, N. W., Farmer, D. K., Fox, C., Garofalo, L. A., Hu, L., Langridge, J. M., Levin, E. J. T., Murphy, S. M., Pokhrel, R. P., Shen, Y., Szpek, K., Taylor, J. W., and Wu, H.: Investigating Carbonaceous Aerosol and its Absorption Properties from Fires in the western US (WE-CAN) and southern Africa (ORACLES and CLARIFY), J. Geophys. Res., 126, e2021JD034984, https://doi.org/10.1029/2021JD034984, 2021. a, b, c, d, e, f
Chaboureau, J.-P., Labbouz, L., Flamant, C., and Hodzic, A.: Acceleration of the southern African easterly jet driven by the radiative effect of biomass burning aerosols and its impact on transport during AEROCLO-sA, Atmos. Chem. Phys., 22, 8639–8658, https://doi.org/10.5194/acp-22-8639-2022, 2022. a, b
Chakrabarty, R. K. and Heinson, W. R.: Scaling Laws for Light Absorption Enhancement Due to Nonrefractory Coating of Atmospheric Black Carbon Aerosol, Phys. Rev. Lett., 121, 218701, https://doi.org/10.1103/PhysRevLett.121.218701, 2018. a
Che, H., Segal-Rozenhaimer, M., Zhang, L., Dang, C., Zuidema, P., Sedlacek III, A. J., Zhang, X., and Flynn, C.: Seasonal variations in fire conditions are important drivers in the trend of aerosol optical properties over the south-eastern Atlantic, Atmos. Chem. Phys., 22, 8767–8785, https://doi.org/10.5194/acp-22-8767-2022, 2022. a
Christian, T. J., Kleiss, B., Yokelson, R. J., Holzinger, R., Crutzen, P. J., Hao, W. M., Saharjo, B. H., and Ward, D. E.: Comprehensive laboratory measurements of biomass-burning emissions: 1. Emissions from Indonesian, African, and other fuels, J. Geophys. Res., 108, 4719, https://doi.org/10.1029/2003JD003704, 2003. a, b
Chylek, P., Lee, J. E., Romonosky, D. E., Gallo, F., Lou, S., Shrivastava, M., Carrico, C., Aiken, A., and Dubey, M.: Mie Scattering Captures Observed Optical Properties of Ambient Biomass Burning Plumes Assuming Uniform Black, Brown, and Organic Carbon Mixtures, J. Geophys. Res., 124, 11406–11427, https://doi.org/10.1029/2019jd031224, 2019. a, b
Collier, S., Zhou, S., Onasch, T. B., Jaffe, D. A., Kleinman, L., A. J. Sedlacek, I., Briggs, N. L., Hee, J., Fortner, E., Shilling, J. E., Worsnop, D., Yokelson, R. J., Parworth, C., Ge, X., Xu, J., Butterfield, Z., Chand, D., Dubey, M. K., Pekour, M., Springston, S. R., and Zhang, Q.: Regional Influence of Aerosol Emissions from Wildfires Driven by Combustion Efficiency: Insights from the BBOP Campaign, Environ. Sci. Technol., 50, 8613–8622, https://doi.org/10.1021/acs.est.6b01617, 2016. a, b
Cubison, M. J., Ortega, A. M., Hayes, P. L., Farmer, D. K., Day, D., Lechner, M. J., Brune, W. H., Apel, E., Diskin, G. S., Fisher, J. A., Fuelberg, H. E., Hecobian, A., Knapp, D. J., Mikoviny, T., Riemer, D., Sachse, G. W., Sessions, W., Weber, R. J., Weinheimer, A. J., Wisthaler, A., and Jimenez, J. L.: Effects of aging on organic aerosol from open biomass burning smoke in aircraft and laboratory studies, Atmos. Chem. Phys., 11, 12049–12064, https://doi.org/10.5194/acp-11-12049-2011, 2011. a, b, c
Dang, C., Segal-Rozenhaimer, M., Che, H., Zhang, L., Formenti, P., Taylor, J., Dobracki, A., Purdue, S., Wong, P.-S., Nenes, A., Sedlacek III, A., Coe, H., Redemann, J., Zuidema, P., Howell, S., and Haywood, J.: Biomass burning and marine aerosol processing over the southeast Atlantic Ocean: a TEM single-particle analysis, Atmos. Chem. Phys., 22, 9389–9412, https://doi.org/10.5194/acp-22-9389-2022, 2022. a, b, c
Darmenov, A. and da Silva, A.: The Quick Fire Emissions Dataset (QFED) – Documentation of Versions 2.1, 2.2, and 2.4, 32, NASA Technical Report Series on Global Modeling and Data Assimilation, NASA TM-2013-104606,32, 183, 2013. a
Davies, N. W., Fox, C., Szpek, K., Cotterell, M. I., Taylor, J. W., Allan, J. D., Williams, P. I., Trembath, J., Haywood, J. M., and Langridge, J. M.: Evaluating biases in filter-based aerosol absorption measurements using photoacoustic spectroscopy, Atmos. Meas. Tech., 12, 3417–3434, https://doi.org/10.5194/amt-12-3417-2019, 2019. a
de Graaf, M., Schulte, R., Peers, F., Waquet, F., Tilstra, L. G., and Stammes, P.: Comparison of south-east Atlantic aerosol direct radiative effect over clouds from SCIAMACHY, POLDER and OMI–MODIS, Atmos. Chem. Phys., 20, 6707–6723, https://doi.org/10.5194/acp-20-6707-2020, 2020. a
Denjean, C., Bourrianne, T., Burnet, F., Mallet, M., Maury, N., Colomb, A., Dominutti, P., Brito, J., Dupuy, R., Sellegri, K., Schwarzenboeck, A., Flamant, C., and Knippertz, P.: Overview of aerosol optical properties over southern West Africa from DACCIWA aircraft measurements, Atmos. Chem. Phys., 20, 4735–4756, https://doi.org/10.5194/acp-20-4735-2020, 2020a. a
Denjean, C., Brito, J., Libois, Q., Mallet, M., Bourrianne, T., Burnet, F., Dupuy, R., Flamant, C., and Knippertz, P.: Unexpected Biomass Burning Aerosol Absorption Enhancement Explained by Black Carbon Mixing State, Geophys. Res. Lett., 47, e2020GL089055, https://doi.org/10.1029/2020gl089055, 2020b. a, b, c, d, e
Diamond, M. S., Dobracki, A., Freitag, S., Small Griswold, J. D., Heikkila, A., Howell, S. G., Kacarab, M. E., Podolske, J. R., Saide, P. E., and Wood, R.: Time-dependent entrainment of smoke presents an observational challenge for assessing aerosol–cloud interactions over the southeast Atlantic Ocean, Atmos. Chem. Phys., 18, 14623–14636, https://doi.org/10.5194/acp-18-14623-2018, 2018. a
Dobracki, A., Zuidema, P., Howell, S., Saide, P., Freitag, S., Aiken, A. C., Burton, S. P., Sedlacek III, A. J., Redemann, J., and Wood, R.: Non-reversible aging can increase solar absorption in African biomass burning aerosol plumes of intermediate age, Atmos. Chem. Phys. Discuss. [preprint], https://doi.org/10.5194/acp-2021-1081, 2022. a, b
Doherty, S. J., Saide, P. E., Zuidema, P., Shinozuka, Y., Ferrada, G. A., Gordon, H., Mallet, M., Meyer, K., Painemal, D., Howell, S. G., Freitag, S., Dobracki, A., Podolske, J. R., Burton, S. P., Ferrare, R. A., Howes, C., Nabat, P., Carmichael, G. R., da Silva, A., Pistone, K., Chang, I., Gao, L., Wood, R., and Redemann, J.: Modeled and observed properties related to the direct aerosol radiative effect of biomass burning aerosol over the southeastern Atlantic, Atmos. Chem. Phys., 22, 1–46, https://doi.org/10.5194/acp-22-1-2022, 2022. a, b, c, d
Dubovik, O., Holben, B. N., Eck, T. F., Smirnov, A., Kaufman, Y. J., King, M. D., Tanre, D., and Slutsker, I.: Variability of absorption and optical properties of key aerosol types observed in worldwide locations, J. Atmos. Sci., 59, 590–608, 2002. a
Eck, T. F., Holben, B. N., Reid, J. S., Mukelabai, M. M., Piketh, S. J., Torres, O., Jethva, H. T., Hyer, E. J., Ward, D. E., Dubovik, O., Sinyuk, A., Schafer, J. S., Giles, D. M., Sorokin, M., Smirnov, A., and Slutsker, I.: A seasonal trend of single scattering albedo in southern African biomass-burning particles: Implications for satellite products and estimates of emissions for the world.s largest biomass-burning source, J. Geophys. Res., 118, 1–19, https://doi.org/10.1002/jgrd.50500, 2013. a, b
Farley, R., Bernays, N., Jaffe, D. A., Ketcherside, D., Hu, L., Zhou, S., Collier, S., and Zhang, Q.: Persistent influence of wildfire emissions in the western United States and characteristics of aged biomass burning organic aerosols under clean air conditios, Environ. Sci. Technol., 56, 3645–3657, https://doi.org/10.1021/acs.est.1c07301, 2022. a
Farmer, D., Matsunaga, A., Docherty, K. S., Surratt, J. D., Seinfeld, J. H., Ziemann, P. J., and Jimenez, J. L.: Response of an aerosol mass spectrometer to organonitrates and organosulfates and implications for atmospheric chemistry, P. Natl. Acad. Sci. USA, 107, 6670–6675, https://doi.org/10.1073/pnas.0912340107, 2011. a, b
Formenti, P., Elbert, W., Maenhaut, W., Haywood, J., Osborne, S., and Andreae, M. O.: Inorganic and carbonaceous aerosols during the Southern African Regional Science Initiative (SAFARI 2000) experiment: Chemical characteristics, physical properties, and emission data for smoke from African biomass burning, J. Geophys. Res., 108, 8488, https://doi.org/10.1029/2002JD002408, 2003. a, b
Forrister, H., Liu, J., Scheuer, E., Dibb, J., Ziemba, L., Thornhill, K. L., Anderson, B., Diskin, G., Perring, A. E., Schwarz, J. P., Campuzano-Jost, P., Day, D. A., Palm, B. B., Jimenez, J. L., Nenes, A., and Weber, R. J.: Evolution of brown carbon in wildfire plumes, Geophys. Res. Lett., 42, 4623–4630, https://doi.org/10.1002/2015GL063897, 2015. a
Garofalo, L. A., Pothier, M. A., Levin, E. J., Campos, T., Kreidenweis, S. M., and Farmer, D. K.: Emission and Evolution of Submicron Organic Aerosol in Smoke from Wildfires in the Western United States, ACS Earth Space Chem., 3, 1237–1247, https://doi.org/10.1021/acsearthspacechem.9b00125, 2019. a
George, I. J. and Abbatt, J. P. D.: Chemical evolution of secondary organic aerosol from OH-initiated heterogeneous oxidation, Atmos. Chem. Phys., 10, 5551–5563, https://doi.org/10.5194/acp-10-5551-2010, 2010. a
Giglio, L., van der Werf, G. R., Randerson, J. T., Collatz, G. J., and Kasibhatla, P.: Global estimation of burned area using MODIS active fire observations, Atmos. Chem. Phys., 6, 957–974, https://doi.org/10.5194/acp-6-957-2006, 2006. a
Graaf, M. D., Bellouin, N., Tilstra, L. G., Haywood, J., and Stammes, P.: Aerosol direct radiative effect of smoke over clouds over the southeast Atlantic Ocean from 2006 to 2009, Geophys. Res. Lett., 41, 7723–7730, https://doi.org/10.1002/2014GL061103, 2014. a
Gysel, M., Laborde, M., Olfert, J. S., Subramanian, R., and Gröhn, A. J.: Effective density of Aquadag and fullerene soot black carbon reference materials used for SP2 calibration, Atmos. Meas. Tech., 4, 2851–2858, https://doi.org/10.5194/amt-4-2851-2011, 2011. a
Haywood, J. M., Osborne, S. R., Francis, P. N., Keil, A., Andreae, P. F. M. O., and Kaye, P. H.: The mean physical and optical properties of regional haze dominated by biomass burning aerosol measured from the C-130 aircraft during SAFARI 2000, J. Geophys. Res., 108, 8473–8481, https://doi.org/10.1029/2002JD002226, 2003. a, b
Haywood, J. M., Abel, S. J., Barrett, P. A., Bellouin, N., Blyth, A., Bower, K. N., Brooks, M., Carslaw, K., Che, H., Coe, H., Cotterell, M. I., Crawford, I., Cui, Z., Davies, N., Dingley, B., Field, P., Formenti, P., Gordon, H., de Graaf, M., Herbert, R., Johnson, B., Jones, A. C., Langridge, J. M., Malavelle, F., Partridge, D. G., Peers, F., Redemann, J., Stier, P., Szpek, K., Taylor, J. W., Watson-Parris, D., Wood, R., Wu, H., and Zuidema, P.: The CLoud–Aerosol–Radiation Interaction and Forcing: Year 2017 (CLARIFY-2017) measurement campaign, Atmos. Chem. Phys., 21, 1049–1084, https://doi.org/10.5194/acp-21-1049-2021, 2021. a, b
Heald, C. L., Kroll, J. H., Jimenez, J. L., Docherty, K. S., DeCarlo, P. F., Aiken, A. C., Chen, Q., Martin, S. T., Farmer, D. K., and Artaxo, P.: A simplified description of the evolution of organic aerosol composition in the atmosphere, Geophys. Res. Lett., 37, L08803, https://doi.org/10.1029/2010gl042737, 2010. a
Herbert, R. J., Bellouin, N., Highwood, E. J., and Hill, A. A.: Diurnal cycle of the semi-direct effect from a persistent absorbing aerosol layer over marine stratocumulus in large-eddy simulations, Atmos. Chem. Phys., 20, 1317–1340, https://doi.org/10.5194/acp-20-1317-2020, 2020. a
Hodshire, A. L., Akherati, A., Alvarado, M., Brown-Steiner, B., Jathar, S., Jimenez, J. L., Kreidenweis, S., Lonsdale, C., Onasch, T., Ortega, A., and Pierce, J.: Aging Effects on Biomass Burning Aerosol Mass and Composition: A Critical Review of Field and Laboratory Studies, Environ. Sci. Technol., 53, 10007–10022, https://doi.org/10.1021/acs.est.9b02588, 2019. a
Hodshire, A. L., Ramnarine, E., Akherati, A., Alvarado, M. L., Farmer, D. K., Jathar, S. H., Kreidenweis, S. M., Lonsdale, C. R., Onasch, T. B., Springston, S. R., Wang, J., Wang, Y., Kleinman, L. I., Sedlacek III, A. J., and Pierce, J. R.: Dilution impacts on smoke aging: evidence in Biomass Burning Observation Project (BBOP) data, Atmos. Chem. Phys., 21, 6839–6855, https://doi.org/10.5194/acp-21-6839-2021, 2021. a
Hodzic, A., Madronich, S., Kasibhatla, P. S., Tyndall, G., Aumont, B., Jimenez, J. L., Lee-Taylor, J., and Orlando, J.: Organic photolysis reactions in tropospheric aerosols: effect on secondary organic aerosol formation and lifetime, Atmos. Chem. Phys., 15, 9253–9269, https://doi.org/10.5194/acp-15-9253-2015, 2015. a
Hodzic, A., Campuzano-Jost, P., Bian, H., Chin, M., Colarco, P. R., Day, D. A., Froyd, K. D., Heinold, B., Jo, D. S., Katich, J. M., Kodros, J. K., Nault, B. A., Pierce, J. R., Ray, E., Schacht, J., Schill, G. P., Schroder, J. C., Schwarz, J. P., Sueper, D. T., Tegen, I., Tilmes, S., Tsigaridis, K., Yu, P., and Jimenez, J. L.: Characterization of organic aerosol across the global remote troposphere: a comparison of ATom measurements and global chemistry models, Atmos. Chem. Phys., 20, 4607–4635, https://doi.org/10.5194/acp-20-4607-2020, 2020. a, b, c, d
Holanda, B. A., Pöhlker, M. L., Walter, D., Saturno, J., Sörgel, M., Ditas, J., Ditas, F., Schulz, C., Franco, M. A., Wang, Q., Donth, T., Artaxo, P., Barbosa, H. M. J., Borrmann, S., Braga, R., Brito, J., Cheng, Y., Dollner, M., Kaiser, J. W., Klimach, T., Knote, C., Krüger, O. O., Fütterer, D., Lavrič, J. V., Ma, N., Machado, L. A. T., Ming, J., Morais, F. G., Paulsen, H., Sauer, D., Schlager, H., Schneider, J., Su, H., Weinzierl, B., Walser, A., Wendisch, M., Ziereis, H., Zöger, M., Pöschl, U., Andreae, M. O., and Pöhlker, C.: Influx of African biomass burning aerosol during the Amazonian dry season through layered transatlantic transport of black carbon-rich smoke, Atmos. Chem. Phys., 20, 4757–4785, https://doi.org/10.5194/acp-20-4757-2020, 2020. a, b, c, d
Holder, A. L., Hagler, G. S., Aurell, J., Hays, M. D., and Gullett, B. K.: Particulate matter and black carbon optical properties and emission factors from prescribed fires in the southeastern United States, J. Geophys. Res., 121, 3465–3483, https://doi.org/10.1002/2015JD024321, 2016. a, b, c, d
Howell, S. G., Clarke, A. D., Freitag, S., McNaughton, C. S., Kapustin, V., Brekovskikh, V., Jimenez, J.-L., and Cubison, M. J.: An airborne assessment of atmospheric particulate emissions from the processing of Athabasca oil sands, Atmos. Chem. Phys., 14, 5073–5087, https://doi.org/10.5194/acp-14-5073-2014, 2014. a
Howell, S. G., Freitag, S., Dobracki, A., Smirnow, N., and Sedlacek III, A. J.: Undersizing of aged African biomass burning aerosol by an ultra-high-sensitivity aerosol spectrometer, Atmos. Meas. Tech., 14, 7381–7404, https://doi.org/10.5194/amt-14-7381-2021, 2021. a, b, c
Huntley, B. J.: Angola in outline: physiography, climate and patters of biodiversity, chap. 2, 15–42, Springer, https://doi.org/10.1007/978-3-030-03083-4, 2019. a
Janhäll, S., Andreae, M. O., and Pöschl, U.: Biomass burning aerosol emissions from vegetation fires: particle number and mass emission factors and size distributions, Atmos. Chem. Phys., 10, 1427–1439, https://doi.org/10.5194/acp-10-1427-2010, 2010. a
Jimenez, J. L., Canagaratna, M. R., Donahue, N. M., Prevot, A. S. H., Zhang, Q., Kroll, J. H., DeCarlo, P. F., and al., J. D. A.: Evolution of organic aerosols in the atmosphere, Science, 326, 1525–1529, https://doi.org/10.1126/science.1180353, 2009. a, b
Jolleys, M. D., Coe, H., McFiggans, G., Capes, G., Allan, J. D., Crosier, J., Williams, P. I., Allen, G., Bower, K. N., Jimenez, J. L., Russell, L. M., Grutter, M., and Baumgardner, D.: Characterizing the aging of biomass burning organic aerosol by use of mixing ratios: a meta-analysis of four regions, Environ. Sci. Technol., 46, 13093–13102, 2012. a, b
Jolleys, M. D., Coe, H., McFiggans, G., Taylor, J. W., O'Shea, S. J., Le Breton, M., Bauguitte, S. J.-B., Moller, S., Di Carlo, P., Aruffo, E., Palmer, P. I., Lee, J. D., Percival, C. J., and Gallagher, M. W.: Properties and evolution of biomass burning organic aerosol from Canadian boreal forest fires, Atmos. Chem. Phys., 15, 3077–3095, https://doi.org/10.5194/acp-15-3077-2015, 2015. a
Keil, A. and Haywood, J. M.: Solar radiative forcing by biomass burning aerosol particles during SAFARI 2000: A case study based on measured aerosol and cloud properties, J. Geophys. Res., 108, 8467, https://doi.org/10.1029/2002JD002315, 2003. a
Knippertz, P., Coe, H., Chiu, J. C., Evans, M. J., Fink, A. H., Kalthoff, N., Liousse, C., Mari, C., Allan, R. P., Brooks, B., Danour, S., Flamant, C., Jegede, O. O., Lohou, F., and Marsham, J. H.: The DACCIWA project: Dynamics-Aerosol-Chemistry-Cloud Interactions in West Africa, B. Am. Meteorol. Soc., 96, 1451–1460, https://doi.org/10.1175/BAMS-D-14-00108.1, 2015. a
Kondo, Y., Matsui, H., Moteki, N., Sahu, L., Takegawa, N., Kajino, M., Zhao, Y., Cubison, M. J., Jimenez, J. L., Vay, S., Diskin, G. S., Anderson, B., Wisthaler, A., Mikoviny, T., Fuelberg, H. E., Blake, D. R., Huey, G., Weinheimer, A. J., Knapp, D. J., and Brune, W. H.: Emissions of black carbon, organic, and inorganic aerosols from biomass burning in North America and Asia in 2008, J. Geophys. Res., 116, D08204, https://doi.org/10.1029/2010JD015152, 2011. a, b
Konovalov, I. B., Beekmann, M., Golovushkin, N. A., and Andreae, M. O.: Nonlinear behavior of organic aerosol in biomass burning plumes: a microphysical model analysis, Atmos. Chem. Phys., 19, 12091–12119, https://doi.org/10.5194/acp-19-12091-2019, 2019. a
Korontzi, S., Ward, D. E., Susott, R. A., Yokelson, R. J., Justice, C. O., Hobbs, P. V., Smithwick, E. A. H., and Hao, W. M.: Seasonal variation and ecosystem dependence of emission factors for selected trace gases and PM2.5 for southern African savanna fires, J. Geophys. Res., 108, 758, https://doi.org/10.1029/2003JD003730, 2003. a, b
Kroll, J., Smith, J. D., Che, D. L., Kessler, S. H., Worsnop, D. R., and Wilson, K. R.: Measurement of fragmentation and functionalization pathways in the heterogeneous oxidation of oxidized organic aerosol, Phys. Chem. Chem. Phys., 11, 8005–8014, https://doi.org/10.1039/B905289E, 2009. a
Kroll, J. H. and Seinfeld, J. H.: Chemistry of secondary organic aerosol: Formation and evolution of low-volatility organics in the atmosphere, Atmos. Environ., 42, 3593–3624, 2008. a
Kroll, J. H., Donahue, N. M., Jimenez, J. L., Kessler, S. H., Canagaratna, M. R., Wilson, K. R., et al.: Carbon oxidation state as a metric for describing the chemistry of atmospheric organic aerosol, Nat. Chem., 3, 133–139, https://doi.org/10.1038/nchem.948, 2011. a, b, c
Kuete, G., Mba, W. P., and Washington, R.: African Easterly Jet South: control, maintenance mechanisms and link with Southern subtropical waves, Clim. Dynam., 54, 1539–1552, https://doi.org/10.1007/s00382-019-05072-w, 2020. a
Laborde, M., Schnaiter, M., Linke, C., Saathoff, H., Naumann, K.-H., Möhler, O., Berlenz, S., Wagner, U., Taylor, J. W., Liu, D., Flynn, M., Allan, J. D., Coe, H., Heimerl, K., Dahlkötter, F., Weinzierl, B., Wollny, A. G., Zanatta, M., Cozic, J., Laj, P., Hitzenberger, R., Schwarz, J. P., and Gysel, M.: Single Particle Soot Photometer intercomparison at the AIDA chamber, Atmos. Meas. Tech., 5, 3077–3097, https://doi.org/10.5194/amt-5-3077-2012, 2012. a
Laskin, A., Laskin, J., and Nizkorodov, S. A.: Chemistry of atmospheric brown carbon, Chem. Rev., 155, 4335–4382, https://doi.org/10.1021/cr5006167, 2015. a
Lee, J. E., Gorkowski, K., Meyer, A., Benedict, K., Aiken, A. C., and Dubey, M. K.: Wildfire smoke demonstrates significant and predictable black carbon light absorption enhancements, Geophys. Res. Lett., 49, e2022GL099334, https://doi.org/10.1029/2022GL099334, 2022. a
Li, Z., Smith, K. A., and Cappa, C. D.: Influence of relative humidity on the heterogeneous oxidation of secondary organic aerosol, Atmos. Chem. Phys., 18, 14585–14608, https://doi.org/10.5194/acp-18-14585-2018, 2018. a, b
Liu, D., Whitehead, J., Alfarra, M. R., Reyes-Villegas, E., Spracklen, D. V., Reddington, C. L., Kong, S., Williams, P. I., , Ting, Y.-C., Haslett, S., Taylor, J., Flynn, M. J., Morgan, W. T., McFiggans, G., Coe, H., and Allan, J. D.: Black-carbon absorption enhancement in the atmosphere determined by particle mixing state, Nat. Geosci., 10, 184–188, https://doi.org/10.1038/ngeo2901, 2017. a
Lou, S., Shrivastava, M., Easter, R. C., Yang, Y., Ma, P.-L., Wang, H., Cubison, M., Campuzano-Jost, P., Jimenez, J. L., Zhang, Q., Rasch, P. J., Shilling, J. E., Zelenyuk, A., Dubey, M., Cameron-Smith, P., Martin, S. T., Schneider, J., and Schulz, C.: New SOA Treatments Within the Energy Exascale Earth System Model (E3SM): Strong Production and Sinks Govern Atmospheric SOA Distributions and Radiative Forcing, J. Adv. Model. Earth Sy., 12, e2020MS002266, https://doi.org/10.1029/2020ms002266, 2020. a, b
Mallet, M., Solmon, F., Nabat, P., Elguindi, N., Waquet, F., Bouniol, D., Sayer, A. M., Meyer, K., Roehrig, R., Michou, M., Zuidema, P., Flamant, C., Redemann, J., and Formenti, P.: Direct and semi-direct radiative forcing of biomass-burning aerosols over the southeast Atlantic (SEA) and its sensitivity to absorbing properties: a regional climate modeling study, Atmos. Chem. Phys., 20, 13191–13216, https://doi.org/10.5194/acp-20-13191-2020, 2020. a, b
Mallet, M., Nabat, P., Johnson, B., Michou, M., Haywood, J. M., Chen, C., and Dubovik, O.: Climate models generally underrepresent the warming by Central Africa biomass-burning aerosols over the Southeast Atlantic, Sci. Adv., 7, eabg9998, https://doi.org/10.1126/sciadv.abg9998, 2021. a, b, c, d
Val Martin, M., Logan, J. A., Kahn, R. A., Leung, F.-Y., Nelson, D. L., and Diner, D. J.: Smoke injection heights from fires in North America: analysis of 5 years of satellite observations, Atmos. Chem. Phys., 10, 1491–1510, https://doi.org/10.5194/acp-10-1491-2010, 2010. a, b, c
May, A. A., McMeeking, G. R., Lee, T., Taylor, J. W., Craven, J. S., Burling, I., Sullivan, A. P., Akagi, S., Collett, J. L., and Flynn, M.: Aerosol emissions from prescribed fires in the United States: A synthesis of laboratory and aircraft measurements, J. Geophys. Res., 119, 11826–11849, https://doi.org/10.1002/2014JD021848, 2014. a
McClure, C. D., Lim, C. Y., Hagan, D. H., Kroll, J. H., and Cappa, C. D.: Biomass-burning-derived particles from a wide variety of fuels – Part 1: Properties of primary particles, Atmos. Chem. Phys., 20, 1531–1547, https://doi.org/10.5194/acp-20-1531-2020, 2020. a, b
McFiggans, G., Mentel, T. F., and Wildt, J.: Secondary organic aerosol reduced by mixture of atmospheric vapours, Nature, 565, 587–593, https://doi.org/10.1038/s41586-018-0871-y, 2019. a
Meyer, K., Platnick, S., and Zhang, Z.: Simultaneously inferring above-cloud absorbing aerosol optical thickness and underlying iquid phase cloud optical and microphysical properties using MODIS, J. Geophys. Res.-Atmos., 120, 2015JD023128, https://doi.org/10.1002/2015JD023128, 2015. a
Myhre, G., Samset, B. H., Schulz, M., Balkanski, Y., Bauer, S., Berntsen, T. K., Bian, H., Bellouin, N., Chin, M., Diehl, T., Easter, R. C., Feichter, J., Ghan, S. J., Hauglustaine, D., Iversen, T., Kinne, S., Kirkevåg, A., Lamarque, J.-F., Lin, G., Liu, X., Lund, M. T., Luo, G., Ma, X., van Noije, T., Penner, J. E., Rasch, P. J., Ruiz, A., Seland, Ø., Skeie, R. B., Stier, P., Takemura, T., Tsigaridis, K., Wang, P., Wang, Z., Xu, L., Yu, H., Yu, F., Yoon, J.-H., Zhang, K., Zhang, H., and Zhou, C.: Radiative forcing of the direct aerosol effect from AeroCom Phase II simulations, Atmos. Chem. Phys., 13, 1853–1877, https://doi.org/10.5194/acp-13-1853-2013, 2013. a
NASA ORACLES Science Team: Suite of Aerosol, Cloud, and Related Data Acquired Aboard P3 During ORACLES 2016, Version 2, Earth Science Project Office Data Archive [data set], https://doi.org/10.5067/Suborbital/ORACLES/P3/2016_V2, 2017a. a
NASA ORACLES Science Team: Suite of Aerosol, Cloud, and Related Data Acquired Aboard P3 During ORACLES 2017, Version 2, Earth Science Project Office Data Archive Data Archive [data set], https://doi.org/10.5067/Suborbital/ORACLES/P3/2017_V2, 2017b. a
Ng, N. L., Canagaratna, M. R., Zhang, Q., Jimenez, J. L., Tian, J., Ulbrich, I. M., Kroll, J. H., Docherty, K. S., Chhabra, P. S., Bahreini, R., Murphy, S. M., Seinfeld, J. H., Hildebrandt, L., Donahue, N. M., DeCarlo, P. F., Lanz, V. A., Prévôt, A. S. H., Dinar, E., Rudich, Y., and Worsnop, D. R.: Organic aerosol components observed in Northern Hemispheric datasets from Aerosol Mass Spectrometry, Atmos. Chem. Phys., 10, 4625–4641, https://doi.org/10.5194/acp-10-4625-2010, 2010. a
Ng, N. L., Canagaratna, M. R., Jimenez, J. L., Chhabra, P. S., Seinfeld, J. H., and Worsnop, D. R.: Changes in organic aerosol composition with aging inferred from aerosol mass spectra, Atmos. Chem. Phys., 11, 6465–6474, https://doi.org/10.5194/acp-11-6465-2011, 2011. a, b, c
Nicholson, S. E. and Grist, J. P.: The seasonal evolution of the atmospheric circulation over West Africa and equatorial Africa, J. Climate, 16, 1013–1030, 2003. a
O'Brien, R. E. and Kroll, J. H.: Photolytic Aging of Secondary Organic Aerosol: Evidence for a Substantial Photo-Recalcitrant Fraction, J. Phys. Chem. Lett., 10, 4003–4009, https://doi.org/10.1021/acs.jpclett.9b01417, 2019. a, b
Pan, X., Kanaya, Y., Taketani, F., Miyakawa, T., Inomata, S., Komazaki, Y., Tanimoto, H., Wang, Z., Uno, I., and Wang, Z.: Emission characteristics of refractory black carbon aerosols from fresh biomass burning: a perspective from laboratory experiments, Atmos. Chem. Phys., 17, 13001–13016, https://doi.org/10.5194/acp-17-13001-2017, 2017. a
Pendergrass, A. G. and Hartmann, D. L.: Global-mean precipitation and black carbon in AR4 simulations, Geophys. Res. Lett., 39, l01703, https://doi.org/10.1029/2011GL050067, 2012. a
Petzold, A., Ogren, J. A., Fiebig, M., Laj, P., Li, S.-M., Baltensperger, U., Holzer-Popp, T., Kinne, S., Pappalardo, G., Sugimoto, N., Wehrli, C., Wiedensohler, A., and Zhang, X.-Y.: Recommendations for reporting “black carbon” measurements, Atmos. Chem. Phys., 13, 8365–8379, https://doi.org/10.5194/acp-13-8365-2013, 2013. a
Pistone, K., Redemann, J., Doherty, S., Zuidema, P., Burton, S., Cairns, B., Cochrane, S., Ferrare, R., Flynn, C., Freitag, S., Howell, S. G., Kacenelenbogen, M., LeBlanc, S., Liu, X., Schmidt, K. S., Sedlacek III, A. J., Segal-Rozenhaimer, M., Shinozuka, Y., Stamnes, S., van Diedenhoven, B., Van Harten, G., and Xu, F.: Intercomparison of biomass burning aerosol optical properties from in situ and remote-sensing instruments in ORACLES-2016, Atmos. Chem. Phys., 19, 9181–9208, https://doi.org/10.5194/acp-19-9181-2019, 2019. a, b
Pistone, K., Zuidema, P., Wood, R., Diamond, M., da Silva, A. M., Ferrada, G., Saide, P. E., Ueyama, R., Ryoo, J.-M., Pfister, L., Podolske, J., Noone, D., Bennett, R., Stith, E., Carmichael, G., Redemann, J., Flynn, C., LeBlanc, S., Segal-Rozenhaimer, M., and Shinozuka, Y.: Exploring the elevated water vapor signal associated with the free tropospheric biomass burning plume over the southeast Atlantic Ocean, Atmos. Chem. Phys., 21, 9643–9668, https://doi.org/10.5194/acp-21-9643-2021, 2021. a, b
Pokhrel, R. P., Gordon, J., Fiddler, M., and Bililign, S.: Determination of emission factors of pollutants from biomass burning of African fuels in laboratory measurements, J. Geophys. Res., 126, e2021JD034731, https://doi.org/10.1029/2021JD034731, 2021. a
Ramo, R., Roteta, E., Bistinas, I., van Wees, D., Bastarrika, A., Chuvieco, E., and der Werf, G. R.: African burned area and fire carbon emissions are strongly impacted by small fires undetected by coarse resolution satellite data, P. Natl. Acad. Sci. USA, 118, e2011160118, https://doi.org/10.1073/pnas.2011160118, 2021. a
Redemann, J., Wood, R., Zuidema, P., Doherty, S. J., Luna, B., LeBlanc, S. E., Diamond, M. S., Shinozuka, Y., Chang, I. Y., Ueyama, R., Pfister, L., Ryoo, J.-M., Dobracki, A. N., da Silva, A. M., Longo, K. M., Kacenelenbogen, M. S., Flynn, C. J., Pistone, K., Knox, N. M., Piketh, S. J., Haywood, J. M., Formenti, P., Mallet, M., Stier, P., Ackerman, A. S., Bauer, S. E., Fridlind, A. M., Carmichael, G. R., Saide, P. E., Ferrada, G. A., Howell, S. G., Freitag, S., Cairns, B., Holben, B. N., Knobelspiesse, K. D., Tanelli, S., L'Ecuyer, T. S., Dzambo, A. M., Sy, O. O., McFarquhar, G. M., Poellot, M. R., Gupta, S., O'Brien, J. R., Nenes, A., Kacarab, M., Wong, J. P. S., Small-Griswold, J. D., Thornhill, K. L., Noone, D., Podolske, J. R., Schmidt, K. S., Pilewskie, P., Chen, H., Cochrane, S. P., Sedlacek, A. J., Lang, T. J., Stith, E., Segal-Rozenhaimer, M., Ferrare, R. A., Burton, S. P., Hostetler, C. A., Diner, D. J., Seidel, F. C., Platnick, S. E., Myers, J. S., Meyer, K. G., Spangenberg, D. A., Maring, H., and Gao, L.: An overview of the ORACLES (ObseRvations of Aerosols above CLouds and their intEractionS) project: aerosol–cloud–radiation interactions in the southeast Atlantic basin, Atmos. Chem. Phys., 21, 1507–1563, https://doi.org/10.5194/acp-21-1507-2021, 2021. a, b
Ryoo, J.-M., Pfister, L., Ueyama, R., Zuidema, P., Wood, R., Chang, I., and Redemann, J.: A meteorological overview of the ORACLES (ObseRvations of Aerosols above CLouds and their intEractionS) campaign over the southeastern Atlantic during 2016–2018: Part 1 – Climatology, Atmos. Chem. Phys., 21, 16689–16707, https://doi.org/10.5194/acp-21-16689-2021, 2021. a
Ryoo, J.-M., Pfister, L., Ueyama, R., Zuidema, P., Wood, R., Chang, I., and Redemann, J.: A meteorological overview of the ORACLES (ObseRvations of Aerosols above CLouds and their intEractionS) campaign over the southeastern Atlantic during 2016–2018: Part 2 – Daily and synoptic characteristics, Atmos. Chem. Phys., 22, 14209–14241, https://doi.org/10.5194/acp-22-14209-2022, 2022. a
Saide, P., Thompson, G., Eidhammer, T., da Silva, A. M., and Carmichael, R. B. P. G. R.: Assessment of biomass burning smoke influence on environmental conditions for multi-year tornado outbreaks by combining aerosol-aware microphysics and fire emission constraints, J Geophys. Res., 121, 10294–10311, https://doi.org/10.1002/2016JD025056, 2016. a
Saleh, R., Robinson, E. S., Tkacik, D. S., Ahern, A. T., Liu, S., Aiken, A. C., Sullivan, R. C., Presto, A. A., Dubey, M. K., Yokelson, R. J., Donahue, N. M., and Robinson, A. L.: Brownness of organics in aerosols from biomass burning linked to their black carbon content, Nat. Geosci., 7, 647–650, https://doi.org/10.1038/ngeo2220, 2014. a, b, c, d
Scholes, R. J., Ward, D. E., and Justice, C. O.: Emissions of trace gases and aerosol particles due to vegetation burning in southern hemisphere Africa, J. Geophys. Res., 101, 23677–23682, https://doi.org/10.1029/95JD02049, 1996. a, b
Sedlacek, A., Lewis, E., Onasch, T., Zuidema, P., Redemann, J., Jaffee, D., and Kleinman, L.: Using the black carbon particle mixing state to characterize the lifecyle of biomass burn aerosols, Environ. Sci. Technol., 56, 14315–14325, https://doi.org/10.1021/acs.est.2c03851, 2022. a, b
Shank, L. M., Howell, S., Clarke, A. D., Freitag, S., Brekhovskikh, V., Kapustin, V., McNaughton, C., Campos, T., and Wood, R.: Organic matter and non-refractory aerosol over the remote Southeast Pacific: oceanic and combustion sources, Atmos. Chem. Phys., 12, 557–576, https://doi.org/10.5194/acp-12-557-2012, 2012. a
Shea, R. W., Shea, B. W., Kauffman, J. B., Ward, D. E., Haskins, C. I., and Scholes, M. C.: Fuel biomass and combustion factors associated with fires in savanna ecosystems of South Africa and Zambia, J. Geophys. Res., 101, 23551–23568, 1996. a
Shinozuka, Y., Saide, P. E., Ferrada, G. A., Burton, S. P., Ferrare, R., Doherty, S. J., Gordon, H., Longo, K., Mallet, M., Feng, Y., Wang, Q., Cheng, Y., Dobracki, A., Freitag, S., Howell, S. G., LeBlanc, S., Flynn, C., Segal-Rosenhaimer, M., Pistone, K., Podolske, J. R., Stith, E. J., Bennett, J. R., Carmichael, G. R., da Silva, A., Govindaraju, R., Leung, R., Zhang, Y., Pfister, L., Ryoo, J.-M., Redemann, J., Wood, R., and Zuidema, P.: Modeling the smoky troposphere of the southeast Atlantic: a comparison to ORACLES airborne observations from September of 2016, Atmos. Chem. Phys., 20, 11491–11526, https://doi.org/10.5194/acp-20-11491-2020, 2020. a, b, c, d
Shrivastava, M., Cappa, C. D., Fan, J., Goldstein, A. H., Guenther, A. B., Jimenez, J. L., Kuang, C., Laskin, A., Martin, S. T., Ng, N. L., Petaja, T., Pierce, J. R., Rasch, P. J., Roldin, P., Seinfeld, J. H., Shilling, J., Smith, J. N., Thornton, J. A., Volkamer, R., Wang, J., Worsnop, D. R., Zaveri, R. A., Zelenyuk, A., and Zhang, Q.: Recent advances in understanding secondary organic aerosol: Implications for global climate forcing, Rev. Geophys., 55, 509–559, https://doi.org/10.1002/2016RG000540, 2017. a, b
Solmon, F., Elguindi, N., Mallet, M., Flamant, C., and Formenti, P.: West African monsoon precipitation impacted by the South Eastern Atlantic biomass burning aerosol outflow, npj Clim. Atmos. Sci., 4, 54, https://doi.org/10.1038/s41612-021-00210-w, 2021. a
Stein, A. F., Draxler, R. R., Rolph, G. D., Stunder, B. J. B., Cohen, M. D., and Ngan, F.: NOAA’s HYSPLIT Atmospheric Transport and Dispersion Modeling System, B. Am. Meteorol. Soc., 96, 2059–2077, https://doi.org/10.1175/BAMS-D-14-00110.1, 2015. a
Swap, R. J., Annegarn, H. J., Suttles, J. T., King, M. D., Platnick, S., Privette, J. L., and Scholes, R. J.: Africa burning: A thematic analysis of the Southern African Regional Science Initiative (SAFARI 2000), J. Geophys. Res., 108, 8465, https://doi.org/10.1029/2003JD003747, 2003. a
Taylor, J. W., Wu, H., Szpek, K., Bower, K., Crawford, I., Flynn, M. J., Williams, P. I., Dorsey, J., Langridge, J. M., Cotterell, M. I., Fox, C., Davies, N. W., Haywood, J. M., and Coe, H.: Absorption closure in highly aged biomass burning smoke, Atmos. Chem. Phys., 20, 11201–11221, https://doi.org/10.5194/acp-20-11201-2020, 2020. a, b, c, d, e, f, g, h, i, j, k, l
Thompson, G. and Eidhammer, T.: A study of aerosol impacts on clouds and precipitation development in a large winter cyclone, J. Atmos. Sci., 71, 3636–3658, https://doi.org/10.1175/JAS-D-13-0305.1, 2014. a
Tsigaridis, K., Daskalakis, N., Kanakidou, M., Adams, P. J., Artaxo, P., Bahadur, R., Balkanski, Y., Bauer, S. E., Bellouin, N., Benedetti, A., Bergman, T., Berntsen, T. K., Beukes, J. P., Bian, H., Carslaw, K. S., Chin, M., Curci, G., Diehl, T., Easter, R. C., Ghan, S. J., Gong, S. L., Hodzic, A., Hoyle, C. R., Iversen, T., Jathar, S., Jimenez, J. L., Kaiser, J. W., Kirkevåg, A., Koch, D., Kokkola, H., Lee, Y. H., Lin, G., Liu, X., Luo, G., Ma, X., Mann, G. W., Mihalopoulos, N., Morcrette, J.-J., Müller, J.-F., Myhre, G., Myriokefalitakis, S., Ng, N. L., O'Donnell, D., Penner, J. E., Pozzoli, L., Pringle, K. J., Russell, L. M., Schulz, M., Sciare, J., Seland, Ø., Shindell, D. T., Sillman, S., Skeie, R. B., Spracklen, D., Stavrakou, T., Steenrod, S. D., Takemura, T., Tiitta, P., Tilmes, S., Tost, H., van Noije, T., van Zyl, P. G., von Salzen, K., Yu, F., Wang, Z., Wang, Z., Zaveri, R. A., Zhang, H., Zhang, K., Zhang, Q., and Zhang, X.: The AeroCom evaluation and intercomparison of organic aerosol in global models, Atmos. Chem. Phys., 14, 10845–10895, https://doi.org/10.5194/acp-14-10845-2014, 2014. a, b
Vakkari, V., Beukes, J. P., Maso, M. D., Aurela, M., Josipovic, M., and van Zyl, P. G.: Major secondary aerosol formation in southern African open biomass burning plumes, Nat. Geosci., 11, 580–583, https://doi.org/10.1038/s41561-018-0170-0, 2018. a, b, c, d, e, f, g, h
van der Werf, G. R., Randerson, J. T., Giglio, L., Collatz, G. J., Mu, M., Kasibhatla, P. S., Morton, D. C., DeFries, R. S., Jin, Y., and van Leeuwen, T. T.: Global fire emissions and the contribution of deforestation, savanna, forest, agricultural, and peat fires (1997–2009), Atmos. Chem. Phys., 10, 11707–11735, https://doi.org/10.5194/acp-10-11707-2010, 2010. a
vanKrevelen, D. W.: Graphical‐statistical method for the study of structure and reaction processes of coal, Fuel, 24, 269–284, 1950. a
Virkkula, A.: Correction of the Calibration of the 3-wavelength Particle Soot Absorption Photometer (3 PSAP), Aerosol Sci. Technol., 44, 706–712, 2010. a
Waquet, F., Peers, F., Ducos, F., Goloub, P., Platnick, S., Riedi, J., Tanré, D., and Thieuleux, F.: Global analysis of aerosol properties above clouds, Geophys. Res. Lett., 40, 5809–5814, https://doi.org/10.1002/2013GL057482, 2013. a
Wu, H., Taylor, J. W., Szpek, K., Langridge, J. M., Williams, P. I., Flynn, M., Allan, J. D., Abel, S. J., Pitt, J., Cotterell, M. I., Fox, C., Davies, N. W., Haywood, J., and Coe, H.: Vertical variability of the properties of highly aged biomass burning aerosol transported over the southeast Atlantic during CLARIFY-2017, Atmos. Chem. Phys., 20, 12697–12719, https://doi.org/10.5194/acp-20-12697-2020, 2020. a, b, c, d, e, f, g, h, i, j, k, l, m, n, o, p
Yang, M., Huebert, B. J., Blomquist, B. W., Howell, S. G., Shank, L. M., McNaughton, C. S., Clarke, A. D., Hawkins, L. N., Russell, L. M., Covert, D. S., Coffman, D. J., Bates, T. S., Quinn, P. K., Zagorac, N., Bandy, A. R., de Szoeke, S. P., Zuidema, P. D., Tucker, S. C., Brewer, W. A., Benedict, K. B., and Collett, J. L.: Atmospheric sulfur cycling in the southeastern Pacific – longitudinal distribution, vertical profile, and diel variability observed during VOCALS-REx, Atmos. Chem. Phys., 11, 5079–5097, https://doi.org/10.5194/acp-11-5079-2011, 2011. a
Yokelson, R. J., Susot, R. A., Ward, D. E., Reardon, J., and Griffith, D. W. T.: Emissions from Smoldering Combustion of Biomass Measured by Open-Path Fourier Transform Infrared Spectroscopy, J. Geophys. Res., 102, 865–877, 1997. a
Yokelson, R. J., Crounse, J. D., DeCarlo, P. F., Karl, T., Urbanski, S., Atlas, E., Campos, T., Shinozuka, Y., Kapustin, V., Clarke, A. D., Weinheimer, A., Knapp, D. J., Montzka, D. D., Holloway, J., Weibring, P., Flocke, F., Zheng, W., Toohey, D., Wennberg, P. O., Wiedinmyer, C., Mauldin, L., Fried, A., Richter, D., Walega, J., Jimenez, J. L., Adachi, K., Buseck, P. R., Hall, S. R., and Shetter, R.: Emissions from biomass burning in the Yucatan, Atmos. Chem. Phys., 9, 5785–5812, https://doi.org/10.5194/acp-9-5785-2009, 2009. a, b
Zhang, J. and Zuidema, P.: Sunlight-absorbing aerosol amplifies the seasonal cycle in low-cloud fraction over the southeast Atlantic, Atmos. Chem. Phys., 21, 11179–11199, https://doi.org/10.5194/acp-21-11179-2021, 2021. a
Zhang, L., Segal-Rozenhaimer, M., Che, H., Dang, C., Sedlacek III, A. J., Lewis, E. R., Dobracki, A., Wong, J. P. S., Formenti, P., Howell, S. G., and Nenes, A.: Light absorption by brown carbon over the South-East Atlantic Ocean, Atmos. Chem. Phys., 22, 9199–9213, https://doi.org/10.5194/acp-22-9199-2022, 2022. a, b, c
Zhang, Q., Jimenez, J. L., Worsnop, D. R., and Canagaranta, M.: A Case Study of Urban Particle Acidity and Its Influence on Secondary Organic Aerosol, Environ Sci. Technol., 41, 3213–3219, https://doi.org/10.1021/es061812j, 2007. a
Zheng, B., Chevallier, F., Ciais, P., Yin, Y., and Wang, Y.: On the role of the flaming to smoldering transition in the seasonal cycle of African fire emissions, Geophys. Res. Lett., 45, 11998–12007, https://doi.org/10.1029/2018GL079092, 2018. a
Zheng, G., Sedlacek, A. J., Aiken, A. C., Feng, Y., B.Watson, T., Raveh-Rubine, S., Uin, J., R.Lewis, E., and Wang, J.: Long-range transported north American wildfire aerosols observed in marine boundary layer of eastern North Atlantic, Env. Inter., 139, 105680, https://doi.org/10.1016/j.envint.2020.105680, 2020. a
Zhou, J.: Hygroscopic properties of atmospheric aerosol particles in various environments, PhD thesis, ISBN 91-7874-120-3, LUTFD2/(TFKF-1025)/1-166/, 166 pp., Lund University, Lund, Sweden, 2001. a
Zhou, S., Collier, S., Jaffe, D. A., Briggs, N. L., Hee, J., Sedlacek III, A. J., Kleinman, L., Onasch, T. B., and Zhang, Q.: Regional influence of wildfires on aerosol chemistry in the western US and insights into atmospheric aging of biomass burning organic aerosol, Atmos. Chem. Phys., 17, 2477–2493, https://doi.org/10.5194/acp-17-2477-2017, 2017. a
Zuidema, P., Redemann, J., Haywood, J., Wood, R., Piketh, S., Hipondoka, M., and Formenti, P.: Smoke and Clouds above the Southeast Atlantic: Upcoming Field Campaigns Probe Absorbing Aerosol’s Impact on Climate, B. Am. Meteorol. Soc., 97, 1131–1135, https://doi.org/10.1175/bams-d-15-00082.1, 2016. a, b
Zuidema, P., Sedlacek III, A. J., Flynn, C., Springston, S., Delgadillo, R., Zhang, J., Aiken, A. C., Koontz, A., and Muradyan, P.: The Ascension Island Boundary Layer in the Remote Southeast Atlantic is Often Smoky, Geophys. Res. Lett., 45, 4456–4465, https://doi.org/10.1002/2017gl076926, 2018. a, b, c
- Abstract
- Introduction
- Methodology
- Chemical composition and age distribution within the six flights
- Optical and physical properties
- Is there evidence for ongoing loss of organic aerosol? 24 September 2016 case study
- Does comparing to aerosol measured at Ascension Island indicate ongoing compositional changes?
- Discussion
- Data availability
- Author contributions
- Competing interests
- Disclaimer
- Special issue statement
- Acknowledgements
- Financial support
- Review statement
- References
- Supplement