the Creative Commons Attribution 4.0 License.
the Creative Commons Attribution 4.0 License.
 | 20 Apr 2023
Transport pathways of carbon monoxide from Indonesian fire pollution to a subtropical high-altitude mountain site in the western North Pacific
Saginela Ravindra Babu
Chang-Feng Ou-Yang
Stephen M. Griffith
Shantanu Kumar Pani
Steven Soon-Kai Kong
Neng-Huei Lin
Dry conditions associated with the El Niño–Southern Oscillation (ENSO) and a positive Indian Ocean Dipole (IOD) are known to have caused major fire pollution events and intense carbon emissions over a vast spatial expanse of Indonesia in October 2006 and 2015. During these two events, a substantial increase in the carbon monoxide (CO) mixing ratio was detected by in situ measurements at Lulin Atmospheric Background Station (LABS; 23.47∘ N 120.87∘ E; 2862 ) in Taiwan, which is the only background station in the subtropical western North Pacific region. Compared to the long-term October mean (2006–2021), CO was elevated by ∼ 47.2 ppb (parts per billion; 37.2 %) and ∼ 36.7 ppb (28.9 %) in October 2006 and 2015, respectively. This study delineates plausible pathways for the CO transport from Indonesia to LABS using Measurement of Pollution in the Troposphere (MOPITT) CO observations and Modern-Era Retrospective analysis for Research and Applications, version 2 (MERRA-2) reanalysis products (winds and geopotential height – GpH). Two simultaneously occurring transport pathways were identified, namely (i) horizontal transport in the free troposphere and (ii) vertical transport through the Hadley circulation (HC). The GpH analysis of both events revealed the presence of a high-pressure anticyclone over the northern part of the South China Sea (SCS), which played an important role in the free-tropospheric horizontal transport of CO. In this scenario, CO in the free troposphere is transported on the western edge of the high-pressure system and then driven by subtropical westerlies to LABS. Simultaneously, uplifted CO over Indonesia can enter the HC and be transferred to subtropical locations such as LABS. The vertical cross section of the MOPITT CO and MERRA-2 vertical pressure velocity supported the transport of CO through the HC. Furthermore, the results revealed a distinct HC strength in two events (higher in 2006 compared to 2015) due to the different ENSO conditions. Overall, the present findings can provide some insights into understanding the regional transport of pollution over Southeast Asia and the role of climate conditions on transport pathways.
- Article
(13102 KB) - Full-text XML
-
Supplement
(1020 KB) - BibTeX
- EndNote


Fire activity over Southeast Asia (SEA), particularly over the Maritime Continent (MC; including Indonesia), is a severe environmental problem that causes widespread regional pollution in the lower troposphere and impacts atmospheric chemistry, air quality, and climate at regional to global scales. Over the MC, fires occur predominately in the dry season (August to October) and particularly during the periods of drought, which is often associated with the positive phase of El Niño–Southern Oscillation (ENSO) events (Duncan et al., 2003a; van der Werf et al., 2008, 2017; Field et al., 2009, 2016). A recent study has also highlighted the role of the Indian Ocean Dipole (IOD) on MC fire activity (Pan et al., 2018). For example, dry conditions associated with the positive IOD during the 2015/2016 and 2006/2007 El Niño events led to increased fire activity over Indonesia and the wider MC (van der Werf et al., 2008; Chandra et al., 2009; Nassar et al., 2009; Huijnen et al., 2016; Field et al., 2016). Due to these intense fires, an enormous amount of carbon emissions was released into the atmosphere in the form of carbon dioxide (CO2), carbon monoxide (CO), and methane (CH4; Huijnen et al., 2016; Field et al., 2016; Parker et al., 2016; Heymann et al., 2017). The impact of these two Indonesian fire events on carbon emissions, tropospheric trace gases, aerosol composition, and air quality has been extensively discussed in the literature (Chandra et al., 2009; Logan et al., 2008; Nassar et al., 2009; Huijnen et al., 2016; Field et al., 2016; Heymann et al., 2017; Ravindra Babu et al., 2019). For example, the fire carbon emissions during September–October 2015 over maritime SEA were the largest since 1997 (Huijnen et al., 2016). By using Greenhouse gases Observing SATellite (GOSAT) data, Parker et al. (2016) reported the strong enhancement of CO2 and CH4 over the Indonesian region.
CO is a significant emission from the combustion of fossil fuels and biomass (forest and savanna fires, biofuel use, and waste burning) and is widely used as a tropospheric tracer for these sources (Ou-Yang et al., 2014; Pani et al., 2019). Interannual variability in CO in the tropics and subtropics is largely linked to year-by-year changes in biomass burning (BB) emissions. Indonesian fires often emit large quantities of CO by incomplete combustion associated with the occurrence of peat fire pollution. Although CO is not a direct greenhouse gas (GHG), it does have global warming potential due to its chemical reactions in the atmosphere. CO is also an ozone (O3) precursor in the troposphere and indirectly increases radiative forcing (0.23 ± 0.05 W m−2) through the production of O3 and CO2 and depletion of hydroxyl radical, which is the primary chemical reactant with CH4 in the atmosphere (IPCC, 2013). The lifetime of CO in the free troposphere is ∼ 2 months and can thus be a tracer from polluted upwind regions to remote downwind areas (Cooper et al., 2012). Some of the studies reported the influence of Indonesian fire activity and the transport of CO from Indonesia to the Indian Ocean, Southern Pacific, and western Pacific Ocean (Matsueda and Inoue, 1999; Pochanart et al., 2003; Nara et al., 2011; Matsueda et al., 2002, 2019). However, the underlying transport mechanisms sending this fire pollution to downwind Northern Hemisphere subtropical locations, particularly in the form of transport to high-altitude background locations in the western North Pacific are still unclear.
Taiwan is located downwind of East Asia and Southeast Asia, which are major air pollutant source regions. As a result,the Lulin Atmospheric Background Station (LABS; 23.47∘ N 120.87∘ E; 2862 ), was constructed in 2006 to study the transboundary transport of these air pollutants and their impact on Taiwan. LABS is not affected by local sources (i.e., industrial and traffic emissions), making it an ideal site for measuring long-range transport of air pollutants, which complements the global network of the Global Atmospheric Watch (GAW) Programme in the East Asia region, where no other high-altitude background station is available (Ou-Yang et al., 2014, 2022). In the framework of Seven SouthEast Asian Studies (7-SEAS; Reid et al., 2013; Lin et al., 2013; Wang et al., 2015), several studies at LABS have reported on the long-range transport of northern Peninsular Southeast Asia (PSEA) BB pollutants to Taiwan through the low-level jet (LLJ) and the related impacts on air quality and chemistry over Taiwan (Ou-Yang et al., 2012, 2014; Lin et al., 2009, 2013; Chuang et al., 2016; Chi et al., 2016; Tsay et al., 2016; Hsiao et al., 2016; Lin et al., 2017; Park et al., 2019; Pani et al., 2016, 2019; Huang et al., 2019; Huang et al., 2020; Ravindra Babu et al., 2022a). However, to date, no studies have shown the potential influence of Indonesian fire activities on LABS measurements and the BB pollution from Indonesian fires reaching LABS. Surprisingly, the extensive fire events in 2006 and 2015 allowed us to track CO concentrations from the Indonesian peat fires to LABS in Taiwan. By combining in situ and satellite CO measurements and large-scale circulation parameters from reanalysis products, we identified plausible transport pathways from Indonesia to LABS.
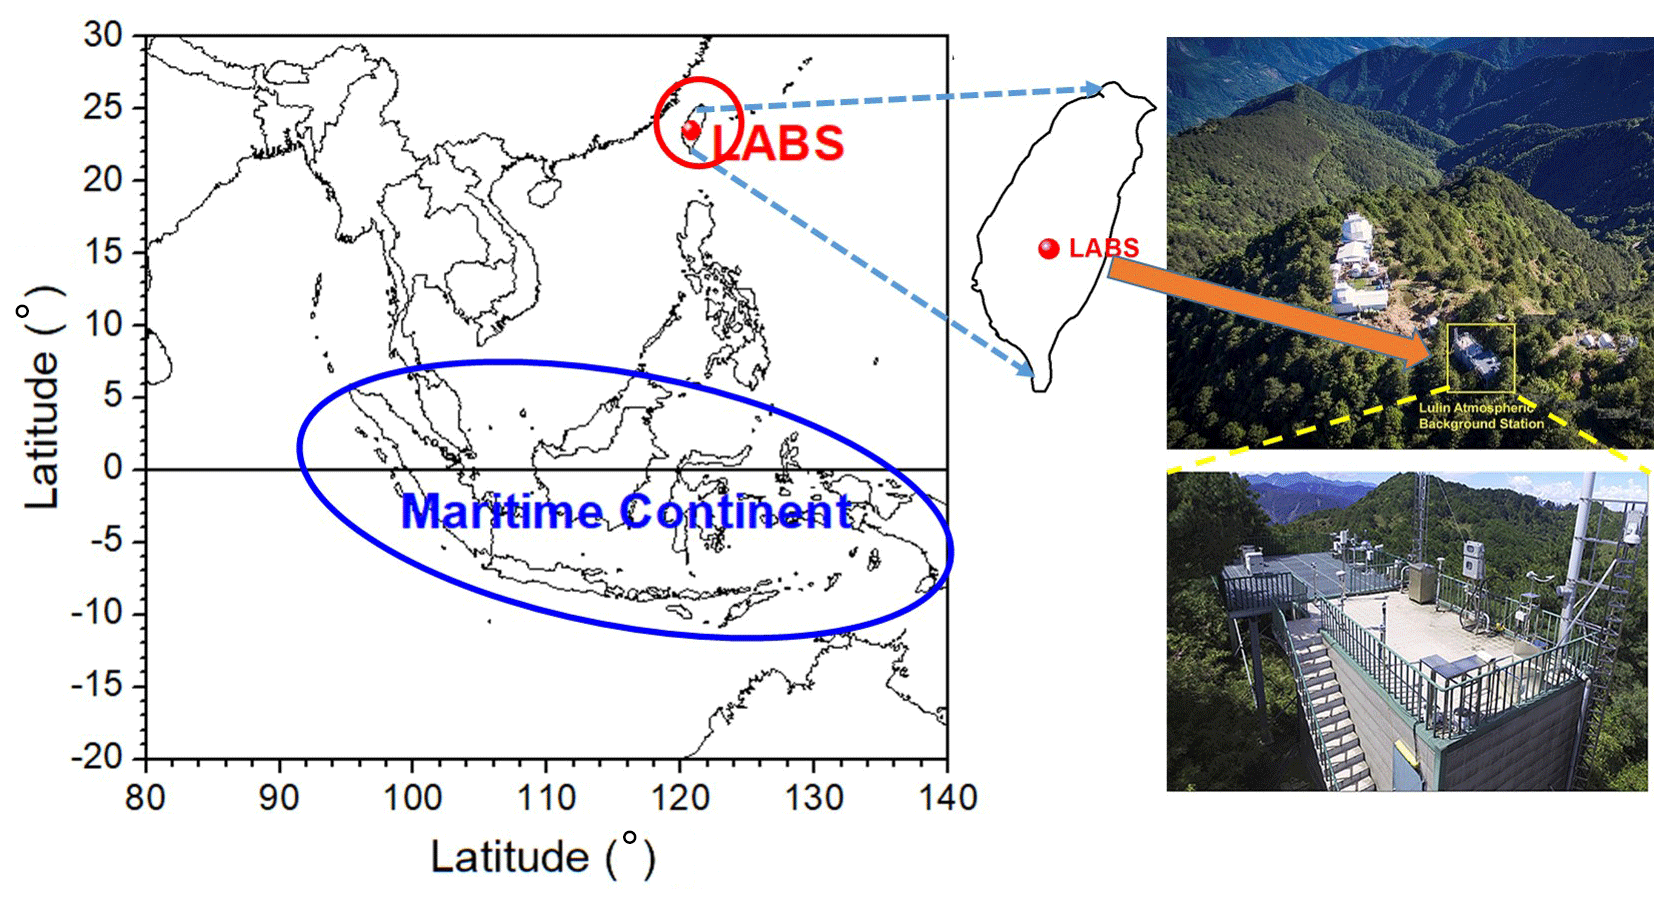
Figure 1Geographic location of the Maritime Continent (MC) and Lulin Atmospheric Background Station (LABS; 23.47∘ N 120.87∘ E; 2862 ), Taiwan.
2.1 Site description
LABS is located on the summit of Mount Lulin and is shown in Fig. 1, along with the location of the Maritime Continent. Hiking to the site is the only way to access LABS, and this takes about 30 min from the nearest parking lot. There are no known point emission sources at the summit or in the surrounding area, with the exception of the occasional maintenance activity at the Lulin Observatory. Because of the high altitude of LABS, measurements there are not affected by local pollution from factories, traffic, and other domestic sources; rather, it is strategically located to monitor long-range transported air pollutants from the Asian continent. More details about the instruments and their specifications can be found in Sheu et al. (2009).
2.2 In situ measurements
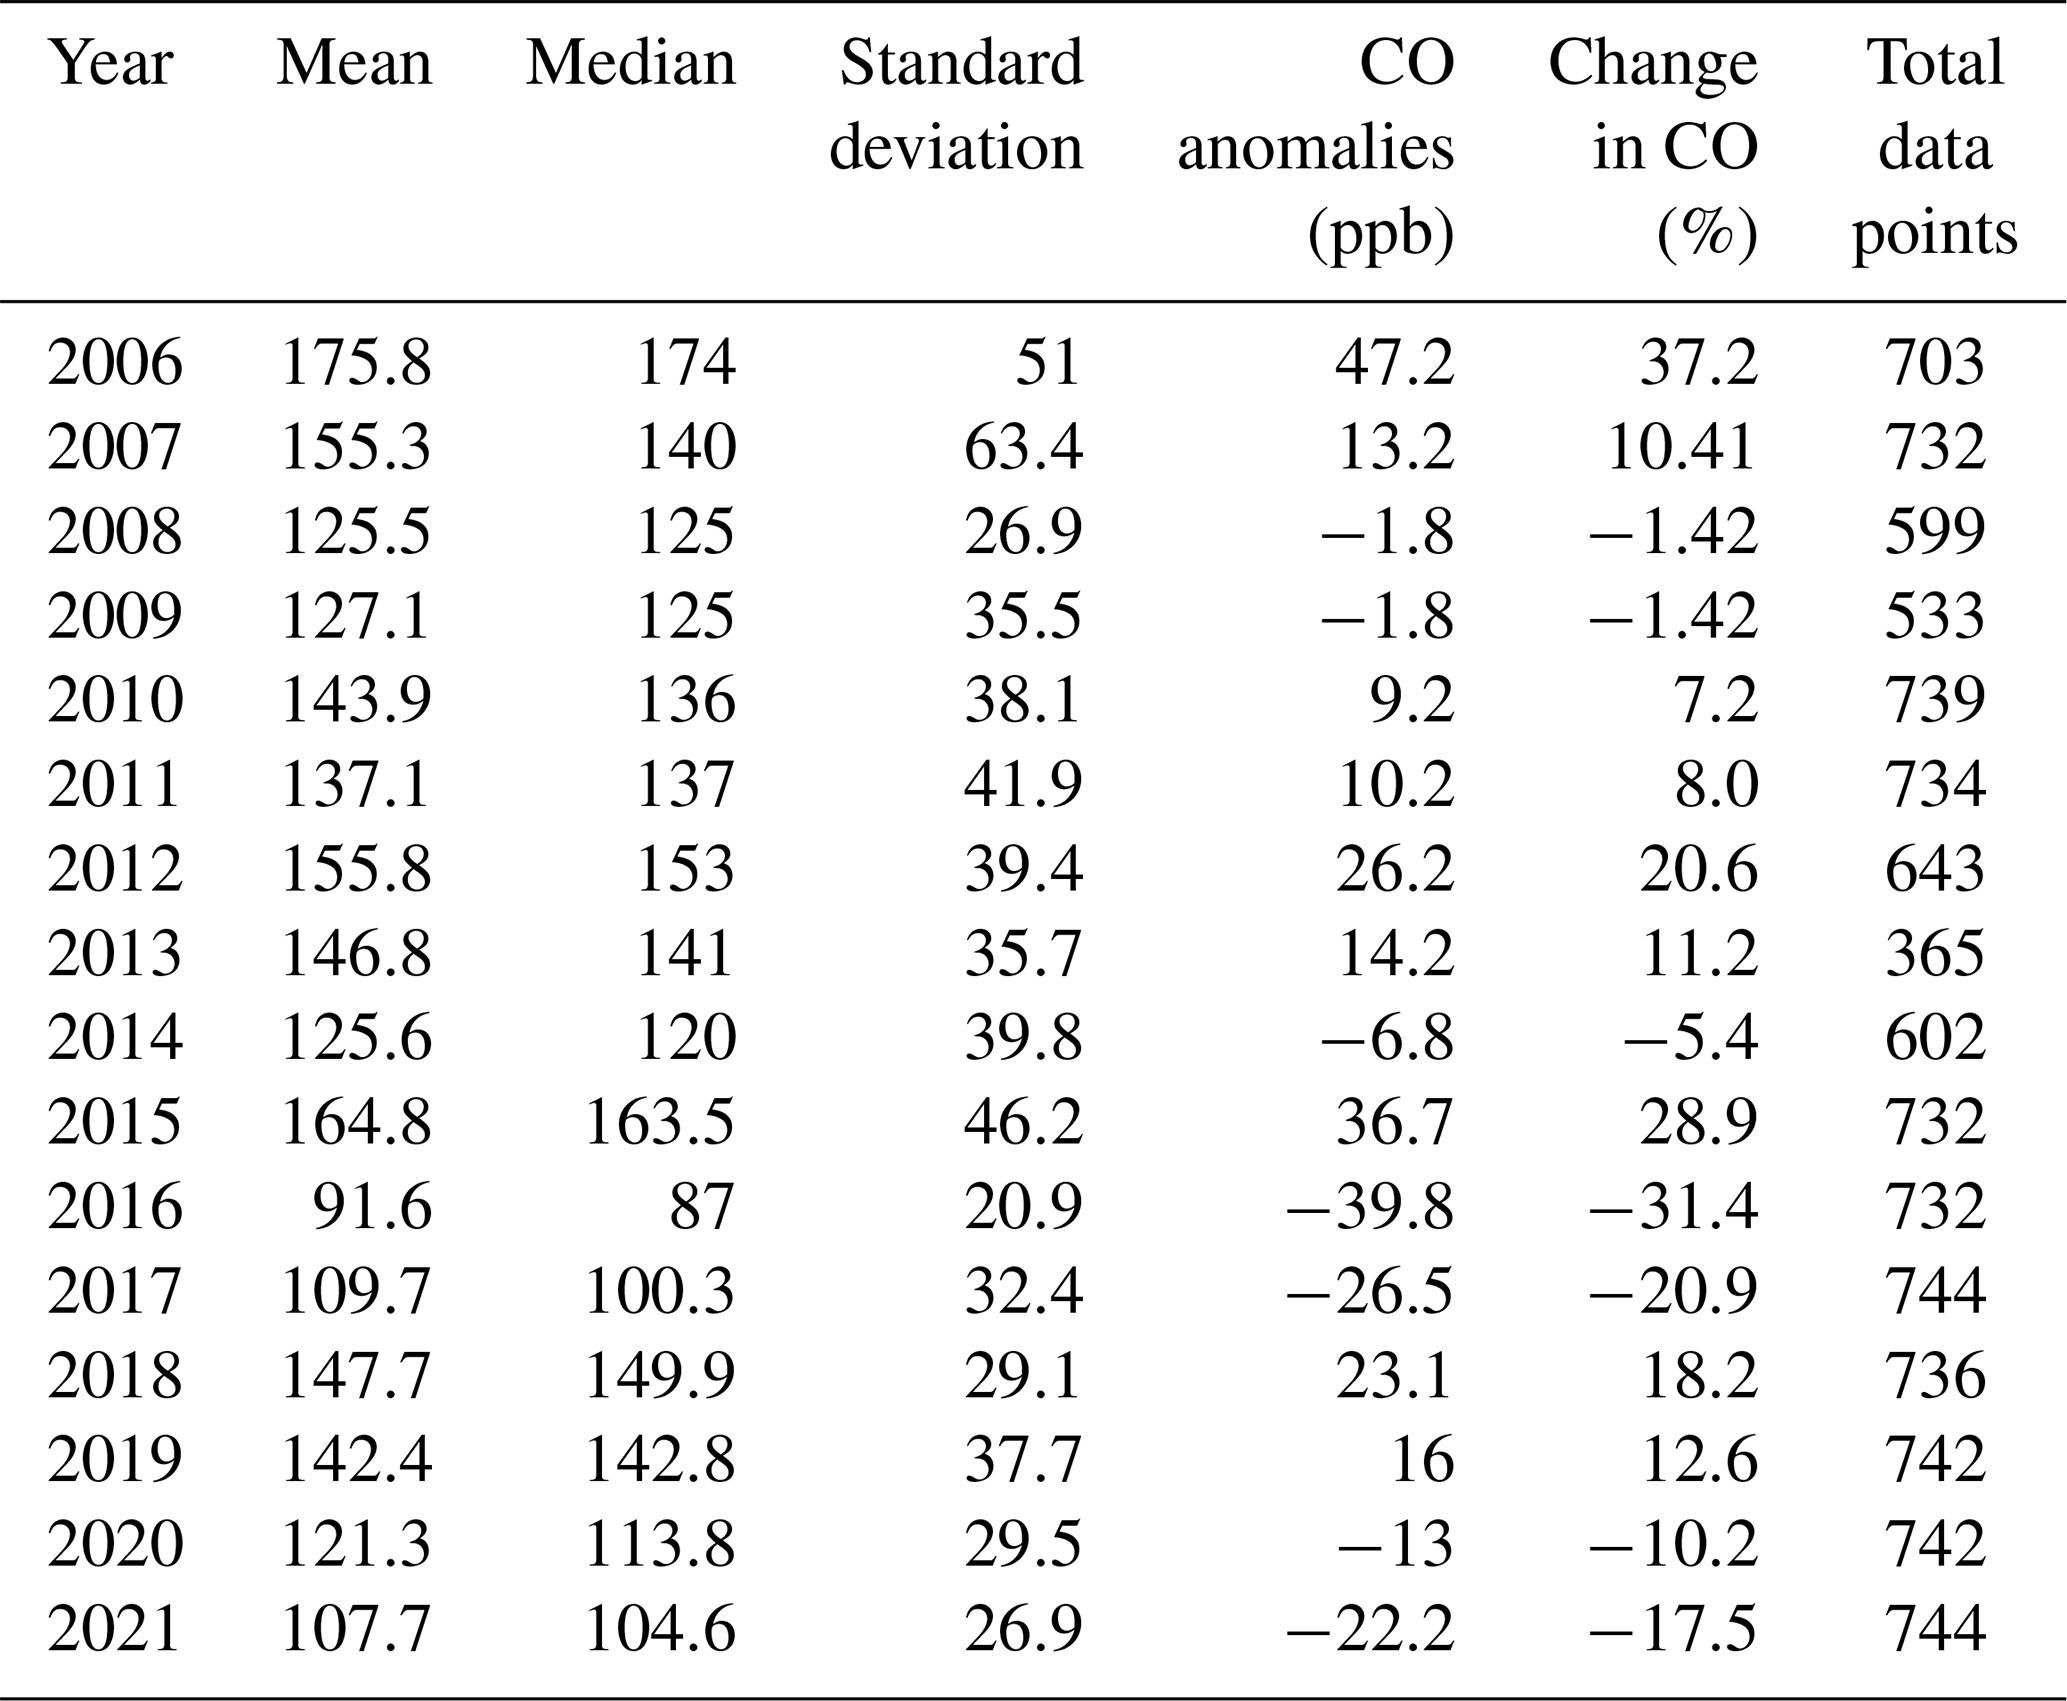
Details of the CO and various meteorological measurements at LABS employed in the current study have been previously described in detail (Sheu et al., 2009; Ou-Yang et al., 2014; Ravindra Babu et al., 2022b) and are thus only briefly described here. The long-term monthly mean of various meteorological parameters such as temperature, relative humidity, wind speed, and wind direction, along with CO, at LABS can be found in Fig. S1 in the Supplement. The overall mean temperature (relative humidity) was about 10.5 ∘C (∼ 80 %), with monthly mean temperatures ranging between ∼ 5 and 14 ∘C. The local wind direction is mostly from the southwest and to a lesser extent from the northeast. The long-term monthly mean in CO shows distinct seasonal patterns, with a springtime maximum and a summertime minimum at LABS. CO measurements were measured by a nondispersive infrared (NDIR) analyzer (APMA-360; Horiba, Japan) at LABS. Hourly averages of the 6 s data were analyzed in this study. The detection limit of the NDIR is ∼ 20 ppb (parts per billion; 1σ; Zellweger et al., 2009). More details about CO measured at LABS can be found in Ou-Yang et al. (2014). The magnitude of the CO concentration enhancement in 2006 and 2015 above the long-term background was determined by comparing a 16-year average (2006–2021) of October CO data at LABS. We obtained the percentage change in CO relative to the respective background using Eq. (1):
where xi represents the monthly mean of October in 2006 and 2015, and is the corresponding monthly long-term mean calculated using the data from 2006 to 2021 (Ou-Yang et al., 2014).
2.3 Satellite measurements
CO observations from the Measurement of Pollution in the Troposphere (MOPITT; version 8) instrument were also utilized in this study (Worden et al., 2010; Deeter et al., 2019). MOPITT is a multi-channel thermal infrared (TIR) and near-infrared (NIR) instrument operating on board the sun-synchronous polar-orbiting NASA Terra satellite. The version 8 (V8) CO products, consisting of a CO profile at 10 pressure levels, have been validated; more details about the retrieval algorithm, validation, and uncertainties in MOPITT CO can be found in Deeter et al. (2019). In addition to the MOPITT measurements, we utilized CO from the Atmospheric Infrared Sounder (AIRS) on the NASA Aqua satellite, which provides CO at different vertical levels twice daily and has near-global coverage. AIRS uses wavenumbers 2183–2200 cm−1 (4.58–4.5 µm) for retrieving CO (McMillan et al., 2005). The V8 level 3 CO product, available at 1∘ × 1∘ resolution at various pressure levels, was utilized in the present study. AIRS data were downloaded from https://disc.gsfc.nasa.gov/datasets/AIRS3STM_7.0 (last access: 11 September 2022; AIRS project, 2019). AIRS sensitivity to CO is broad and optimal in the midtroposphere between approximately 300 and 600 hPa (Warner et al., 2007, 2013; AIRS project, 2019). CO retrievals have a bias of 6 %–10 % between 900 and 300 hPa with a root mean square error of 8 %–12 % (McMillan et al., 2011).
Apart from MOPITT and AIRS CO data, we used Moderate Resolution Imaging Spectroradiometer (MODIS) collection 6.1 daily active fire hot spot data from 2006–2021 over Indonesia (Giglio et al., 2016).
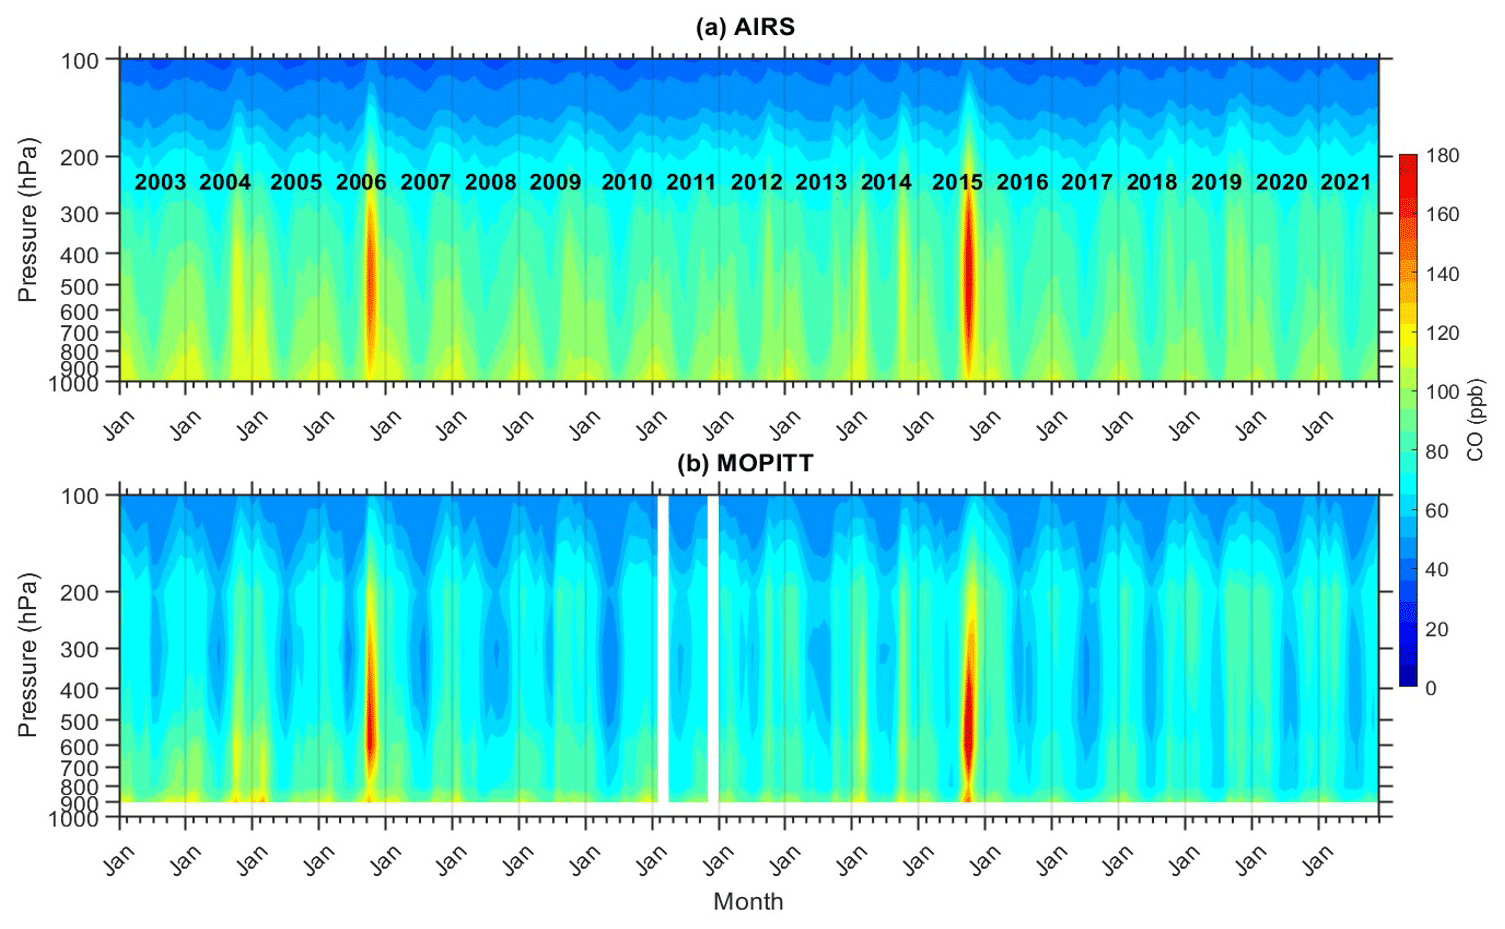
Figure 2Pressure–time cross section of monthly mean carbon monoxide observed over the MC (average over 90–140∘ E, 10∘ S–10∘ N) during 2003–2021 as obtained from (a) AIRS and (b) MOPITT satellite measurements.
2.4 MERRA-2 reanalysis products
We also utilized monthly mean geopotential height (GpH), wind vectors (zonal and meridional wind speed), and pressure vertical velocity from the Modern-Era Retrospective Analysis for Research and Applications, version 2 (MERRA-2). MERRA-2 is the latest atmospheric reanalysis data produced by the NASA Global Modeling and Assimilation Office (GMAO; Gelaro et al., 2017). The horizontal resolution of MERRA-2 reanalysis is 0.5∘ × 0.625∘. MERRA-2 data are available online through the NASA Goddard Earth Sciences Data Information Services Center (GES DISC; https://disc.gsfc.nasa.gov/, last access: 11 September 2022).
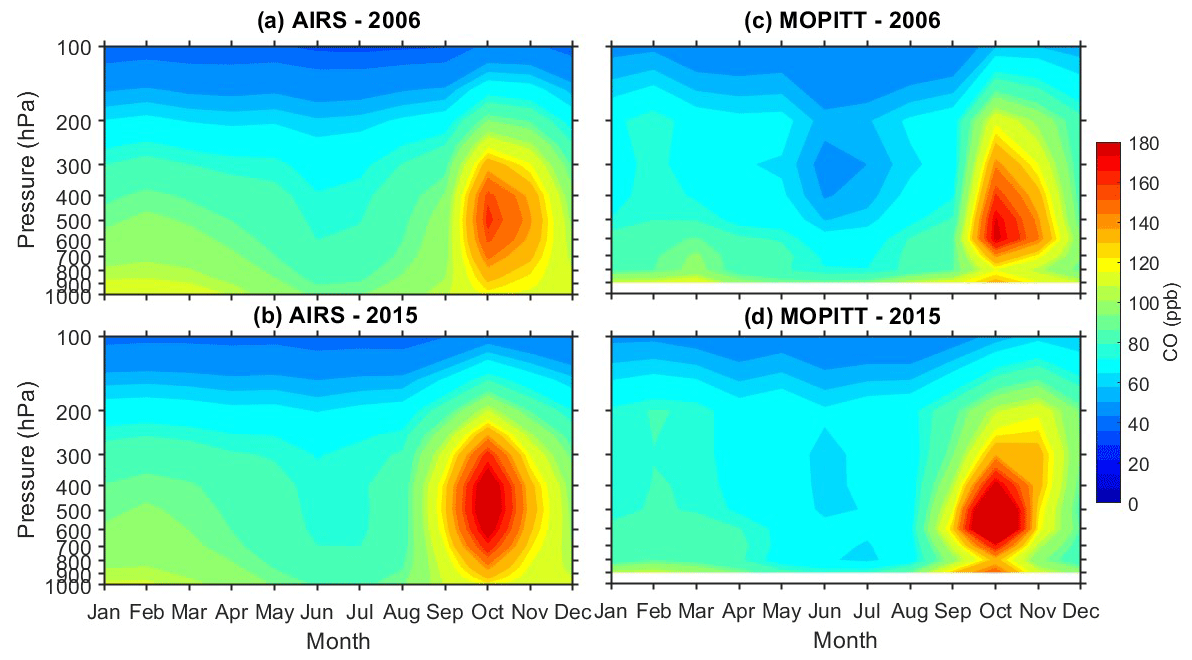
Figure 3Pressure–time cross section of monthly mean carbon monoxide observed over the MC (average over 90–140∘ E, 10∘ S–10∘ N) in (a) 2006 and (b) 2015, as obtained from AIRS satellite measurements. Panels (c) and (d) are the same as panels (a) and (b) but for the MOPITT satellite measurements.
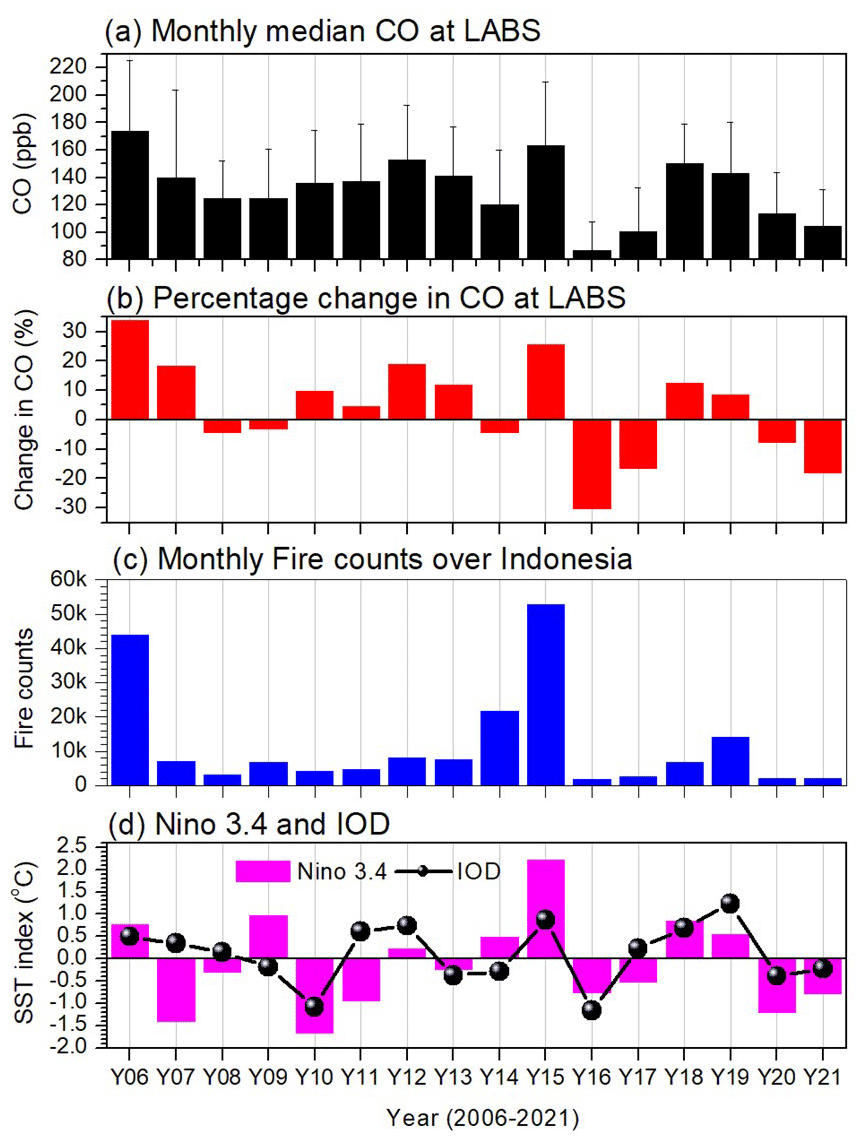
Figure 4Interannual variations in October of the (a) monthly median of CO, (b) percentage change in CO from the long-term mean at LABS, (c) MODIS (Moderate Resolution Imaging Spectroradiometer) total active fire counts (only fires tagged with > 30 % confidence) over Indonesia, and (d) sea surface temperature index for Niño 3.4 (magenta) and IOD (black) during 2006–2021.
3.1 Higher CO mixing ratios in October 2006 and 2015 over the Maritime Continent and at LABS
Figure 2 shows the height–time cross section of monthly mean CO over the MC obtained from MOPITT and AIRS from 2003 to 2021. There is a significant interannual variability in the CO time series in Fig. 2, as observed by both instruments. The maximum CO mixing ratio for this time period was observed in the fall of 2006 and 2015; both were tied to El Niño events (Field et al., 2016; Ravindra Babu et al., 2021; Ravindra Babu and Liou, 2021). Several studies have reported on the impact of the intense fire activity in 2006 and 2015 and on the release of significant carbon emissions and poor air quality over the wider equatorial Asia region (Logan et al., 2008; Chandra et al., 2009; Field et al., 2016; Huijnen et al., 2016; Ravindra Babu et al., 2019). Even though 2009 and 2014 were El Niño years, the CO over MC was not as high as observed in 2006 and 2015. The weaker and shorter duration of fire activities could largely explain the lower CO over the MC in 2009 and 2014 in contrast to those in 2006 and 2015. Furthermore, Fig. 3 shows the temporal variability in monthly mean CO from MOPITT and AIRS from January through December in both years (2006 and 2015, respectively). Both instruments show maximum CO enhancement in October compared to the remaining months in 2006 and 2015. Overall, it is clear from Figs. 2 and 3 that, in October 2006 and 2015, CO over the MC in the entire troposphere increased dramatically due to increased CO emissions near the surface from extreme fire activity (Fig. 4c).
Figure 4 summarizes the interannual variations in CO in October that were observed at LABS, along with MODIS active fire counts over Indonesia and the observed Niño 3.4 and the IOD index values, which helped to motivate this study. The highest CO mixing ratios for this period were observed in 2006 and 2015 at well over the long-term means of 132.1 ± 23.3 ppb when including all points and 126.8 ± 19.6 ppb when excluding 2006 and 2015. A significant enhancement of CO, over the latter mean calculation, of more than 47.2 ppb (37.2 %) in 2006 and 36.7 ppb (28.9 %) in 2015 was observed, with the value in 2006 (2015) being more significant than the ± 2σ (± 1σ) standard deviation of the long-term mean (Table 1). Higher CO mixing ratios in 2006 and 2015 at LABS were also evident from the MOPITT and AIRS satellite measurements obtained over a 1∘ radius around the LABS location (Fig. S1).
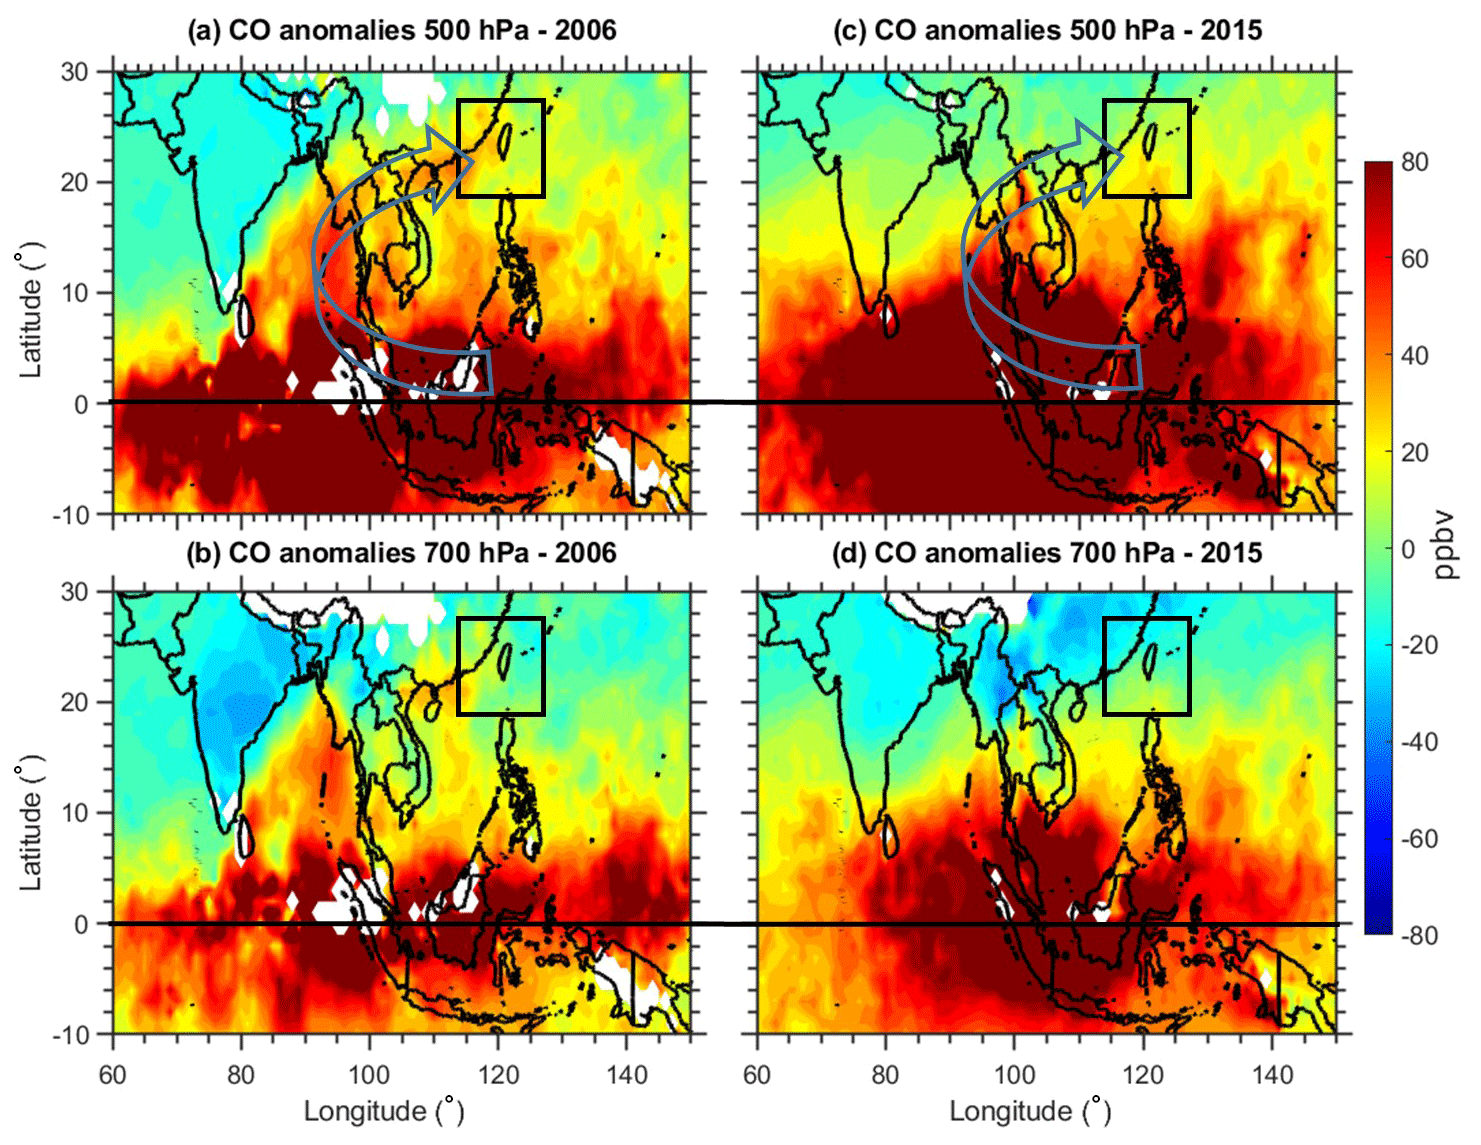
Figure 5Monthly mean CO anomalies obtained from MOPITT satellite observations (a) at 500 hPa and (b) at 700 hPa during October 2006. Panels (c) and (d) are the same as panels (a) and (b) but for October 2015, respectively. The anomalies are obtained by subtracting the 2006 and 2015 data from the long-term mean of MOPITT CO data from 2001 to 2021.
Table 1Detailed statistics of observed CO in October during 2006 to 2021 at LABS.
Unprecedented CO values in 2006 and 2015 at LABS could be due to the transport of CO from large-scale forest fires that were intense during the same period in the Indonesian region. It is clear from Fig. 4 that the higher values of CO at LABS in 2006 and 2015 coincided with more intense fire activity over Indonesia, along with warm phases of ENSO and IOD (Fig. 4c and d), which have been extensively studied due to the induced drought conditions in those years (Field et al., 2016; Huijnen et al., 2016; Pan et al., 2018). Previous studies (e.g., Logan et al., 2008; Zhang et al., 2011; Field et al., 2016; Pan et al., 2018) have demonstrated the direct relationship between strong Indonesian fires and El Niño events. The enhanced CO values from the 2006 and 2015 events at LABS in the present study complement the findings of Matsueda and Inoue (1999), in the case the of 1997 El Niño event, and Nara et al. (2011), in the case of the 2006 El Niño event. However, the impact on CO at LABS occurred significantly further north of the source region than in either of the aforementioned studies. Based on aircraft measurements, Matsueda and Inoue (1999) reported the enhancement of CO2, CO, and CH4 in the upper troposphere (at 9–12 km) over the South China Sea (SCS) during the October 1997 Indonesian fire event. However, this large CO increase appeared only over the SCS west of Kalimantan and not in the subtropics between 10 and 26∘ N. Nara et al. (2011) reported a substantial increase in CO mixing ratios over the western Tropical Pacific Ocean (between 15∘ N and the Equator) by shipboard observations routinely operated between Japan and Australia and New Zealand during October and November of 2006. Similarly, Pochanart et al. (2003) also reported the influence of the 1997 Indonesian fire event on CO enhancement at the rural station of Srinakarin (14∘22′ N, 99∘07′ E, 296 ) in Thailand.
In addition, due to La Niña and the negative-phase IOD, the fire activity in Indonesia during 2016 was much less intense than in 2006 and 2015 (Fig. 4c and d). Interestingly, CO at LABS during 2016 exhibited the lowest October values in the entire data period, which is ∼ 39.8 ppb (31.4 %) lower than the long-term October mean (2006–2021). It is well known that the major sources of CO at LABS are BB from peninsular SEA in spring and industrial emissions from continental Asia in winter (Ou-Yang et al., 2014; Pani et al., 2019; Ravindra Babu et al., 2022a; Ou-Yang et al., 2022). However, October is a transition month from the summer to winter at LABS, when air masses can still arrive from the Pacific Ocean. Our analysis (Fig. 4) suggests that the extensive fires that occurred during the 2006 and 2015 El Niño events over Indonesia may have yielded the unprecedented CO mixing ratios at LABS in October of those years. Combined El Niño- and IOD-related changes in the large-scale dynamics and circulations may have promoted CO emissions from Indonesian fires to transport to LABS.
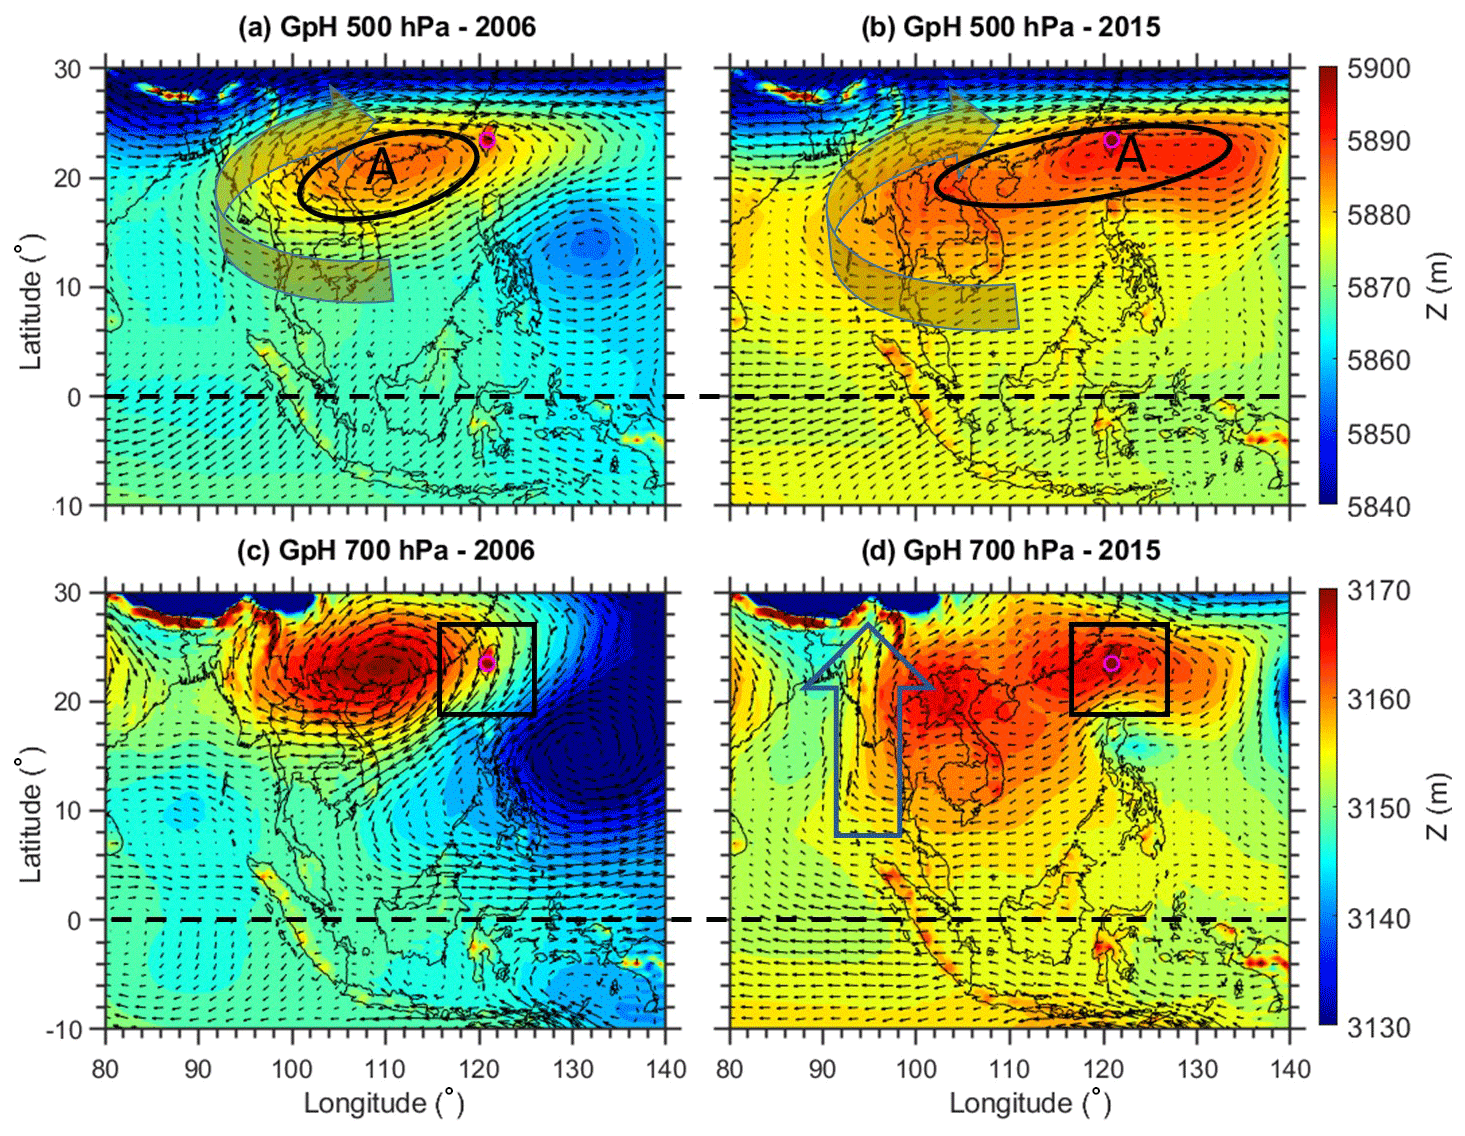
Figure 6Monthly mean geopotential height (GpH) obtained from MERRA-2 reanalysis (a) at 500 hPa and (b) at 700 hPa during October 2006. Panels (c) and (d) are the same as panels (a) and (b) but for October 2015.
To confirm the impact of Indonesian fire pollution on LABS CO, we further checked the spatial distribution of CO in 2006 and 2015 from the MOPITT satellite CO observations. An intercomparison between October monthly mean CO at LABS (2006–2021) and MOPITT and AIRS CO data at 700 hPa within the 1∘ radius around the LABS location yielded correlation coefficients of 0.88 and 0.78 (p < 0.01), respectively (Fig. S2). We then used the MOPITT satellite data to track the spatial and vertical CO changes in October 2006 and 2015; first, we examined the distribution of the CO anomalies at free tropospheric heights in those years. Figure 5 shows these anomalies compared to the long-term mean (2001–2021) at 700 and 500 hPa, revealing extensive enhancements of CO mixing ratios over most of equatorial Asia in 2006 and 2015. Figure 5 indicates that CO from the Indonesian fires affected both the Indian Ocean to the west and South Pacific and North Pacific to the east. Furthermore, these outflows of CO split northwestward into the Bay of Bengal and northeastward into the western North Pacific. It is also worth noting that the anomalies were significantly higher at 500 hPa than at 700 hPa. Elevated CO is visible in the Taiwan region at 700 and 500 hPa in both years. This further provides a clear signature of the impact of Indonesian fire activity on enhanced CO in 2006 and 2015 at LABS. Overall, from Fig. 5, MOPITT CO data show the Indonesia fires transported CO vertically and horizontally in all directions. We further investigated the associated dynamics and large-scale circulations supporting the transport of Indonesian pollution to LABS.
3.2 Role of large-scale dynamics and atmospheric circulations
Large-scale dynamics and circulations can play a crucial role in transporting Indonesian pollution to long-distance downwind regions (Bowman, 2006; Nara et al., 2011; Matsueda et al., 2019). To understand the plausible mechanisms behind the transport of Indonesian fire pollution to LABS, we further examined the MERRA-2 reanalysis of geopotential height (GpH) and wind distribution in 2006 and 2015. The spatial distribution of GpH at two pressure levels (700 and 500 hPa) in both events is shown in Fig. 6. The GpH and wind vectors in the two event years exhibited quite different patterns in relation to a high-pressure system over the northern parts of the SCS. A high-pressure anticyclonic circulation center extended from the Southeast Asian Peninsula to the SCS in October 2006, with LABS located precisely on the eastern edge of the anticyclone. In 2015, the anticyclone extended from the Southeast Asian Peninsula to the western North Pacific region and over Taiwan.
During both event years, strong southerlies at 500 hPa were evident due to the high-pressure anticyclone system in the northern SCS. It is assumed that the northern edge of the Indonesian fire pollution plume can be carried out by the southerlies and around the western edge of the high-pressure anticyclone over SCS. An apparent merging of the southerlies from the Equator with the subtropical westerlies in the northern PSEA region subsequently led to the transport of CO to downwind LABS. Overall, in both events, there was a significant anticyclone over the SCS. El Niño and the positive-IOD-induced high-pressure anticyclone over SCS strengthen the southerlies from the Equator, consequently bringing higher amounts of CO to LABS. We further investigated the vertical pressure velocity (omega) behavior in both events (Fig. S3), where negative (positive) values represent upward (downward) winds. Significant upward wind in both events was evident over equatorial MC, while the vertical pressure velocity over Taiwan and surrounding regions at both pressure levels was mostly downwards in 2006 and 2015. The presence of a downwind will provide the downward transport of any pollutant presence in the upper troposphere over that region. Also, the downward wind was relatively higher in 2006 compared to 2015. The center of the downward wind was shifted eastwards in the western North Pacific in 2015. The distinct behavior of the vertical pressure velocity around LABS during these two events might be due to the associated climate conditions in the two periods; more discussion will be provided in Sect. 3.4.
We further showed CO deviations at both pressure levels in October 2016 when there was very low fire activity in Indonesia (Fig. 7). Interestingly, there was a significant lowering of CO over the Taiwan region in 2016, which agrees with the observed low CO values from the in situ measurements at LABS (Fig. 4b). Another agreement is that the year 2016 was a La Niña and negative-IOD year, and fire activity was much weaker (Fig. 4c and d). During the La Niña years, large-scale dynamical processes are greatly reversed with respect to the El Niño years. We further analyzed the GpH and wind circulation patterns in 2016 (Fig. 8). A significant high-pressure system (western North Pacific subtropical high) was present over the western North Pacific region in 2016, which was shifted considerably further eastward compared to the SCS in 2006 and 2015. The wind vectors also highlighted the transport of a clean marine air mass from the Pacific Ocean to LABS in 2016. Interestingly, the vertical pressure velocity exhibited a pronounced upward wind over Taiwan in 2016, in contrast to the downward wind in 2006 and 2015. This indicates that dominant clean marine air reached LABS in 2016, resulting in the lowest CO mixing ratio in the entire dataset at LABS.
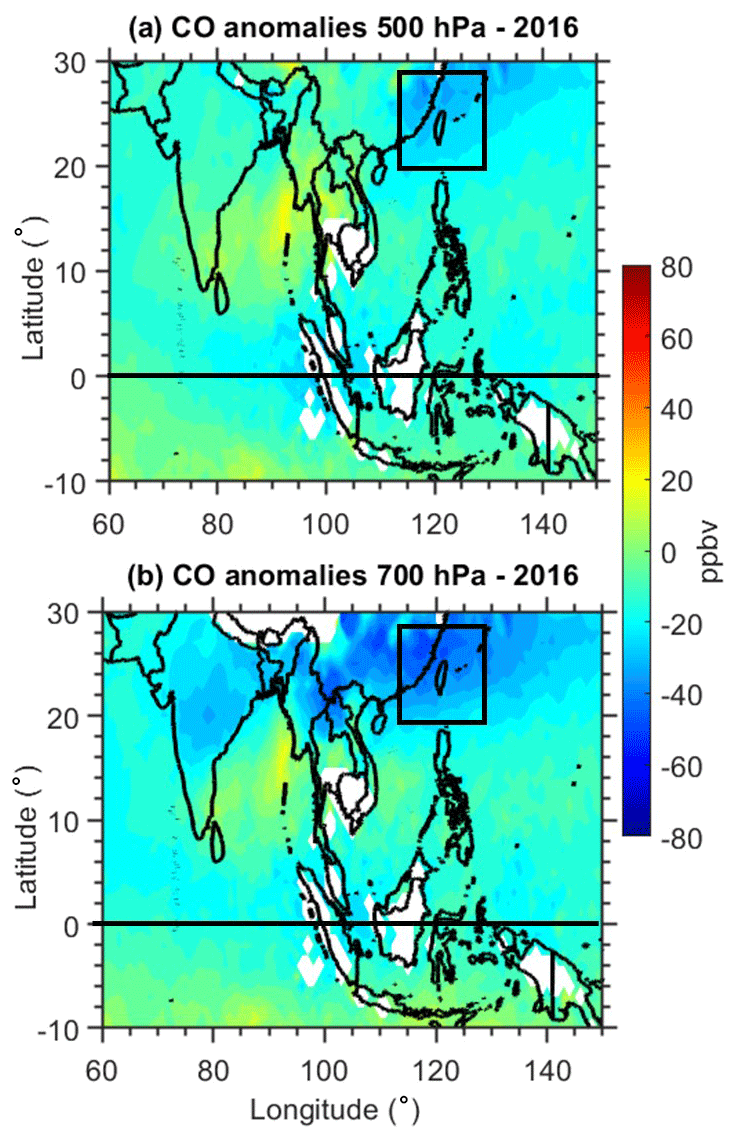
Figure 7Monthly mean CO deviations from the long-term mean (2001–2021) were obtained from MOPITT satellite observations (a) at 500 hPa and (b) at 700 hPa during October 2016.
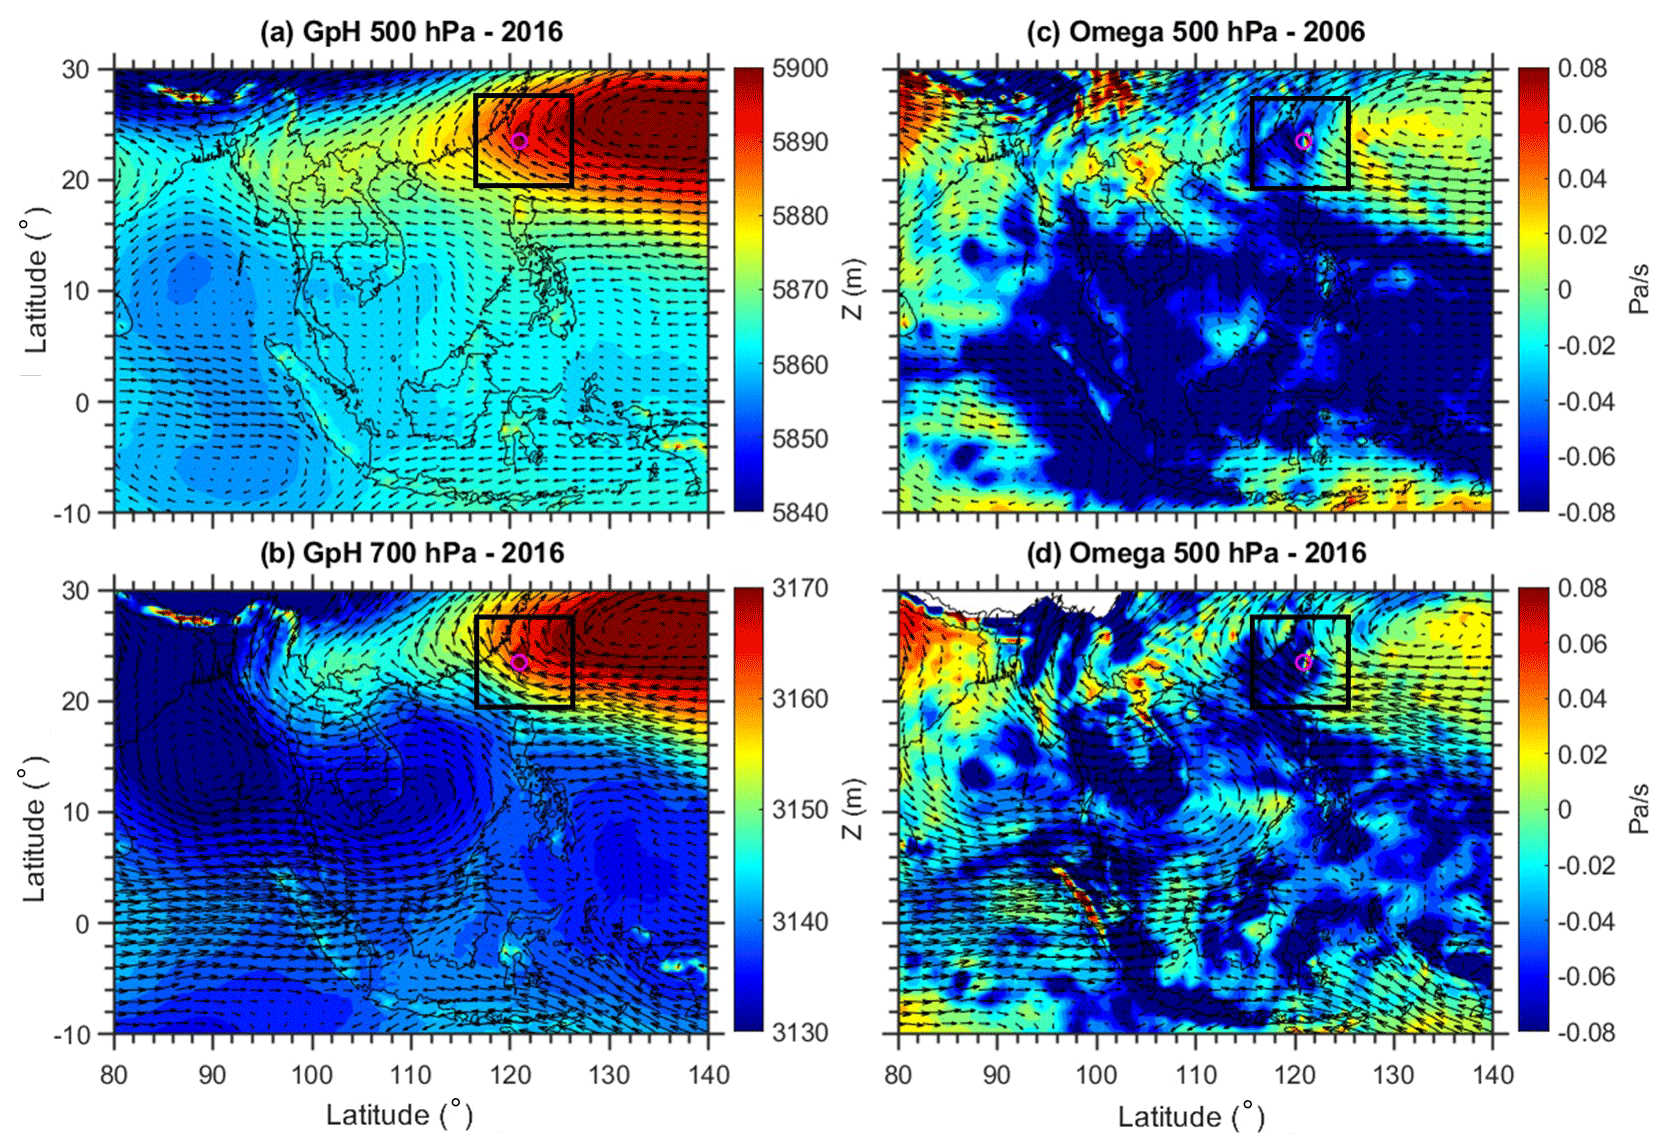
Figure 8Monthly mean geopotential height (GpH) obtained from MERRA-2 reanalysis (a) at 500 hPa and (b) at 700 hPa during October 2016. Panels (c) and (d) are the same as panels (a) and (b) but for the observed vertical pressure velocity (omega).
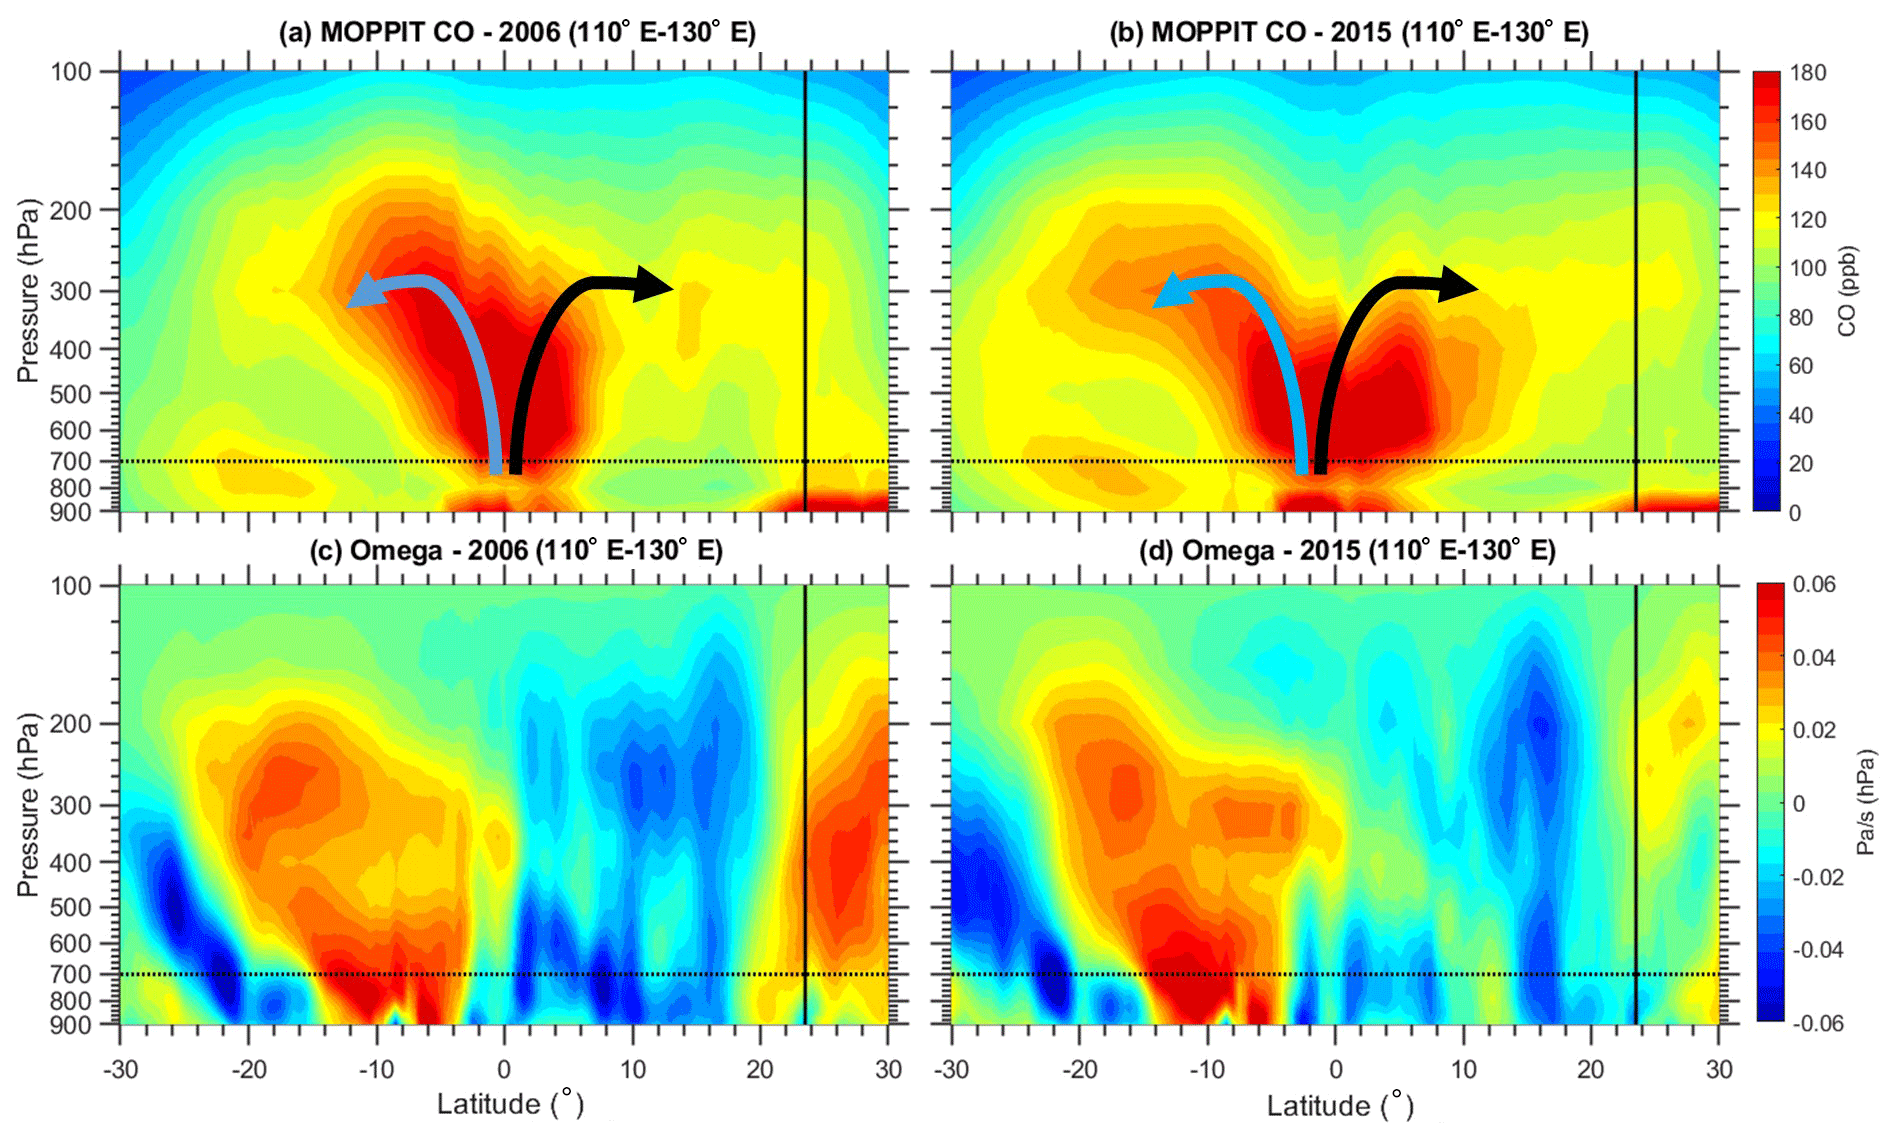
Figure 9Pressure–latitude cross section of MOPITT CO averaged along 110–130∘ E (a) for October 2006 and (b) for October 2015. Panels (c) and (d) are the same as panels (a) and (b) but for the MERRA-2 reanalysis vertical pressure velocity. Positive (negative) values represent the downward (upward) wind.
3.3 Role of Hadley circulation
The Hadley circulation (HC) is a crucial component of the climate system, which is characterized by a thermally driven large-scale meridional circulation (Hadley, 1735). This circulation links the troposphere and stratosphere and the tropics and extratropics through horizontal and vertical motions, transporting moisture, heat, and momentum to regulate Earth's energy budget. As the CO sources (Indonesia) in this study were close to the Equator, it is expected that air tends to rise more or less directly over the CO sources. Figure 9 shows the vertical–meridional cross section of CO and vertical pressure velocity in separate panels averaged between 110–130∘ E in October 2006 and 2015. The vertical black-colored line in all the panels in Fig. 9 shows the location of LABS, and the horizontal line represents the 700 hPa. The vertical cross section of CO highlights the uplifting of CO into the upper troposphere over the Equator, followed by southward and northward movement in both 2006 and 2015 (Fig. 9a and b). A clear transport of CO from the source region to the subtropics via meridional transport was evident in both events. It is noted that the higher CO observed between 20–30∘ N latitude below ∼ 700 hPa is related to anthropogenic emissions and not due to the Indonesian fires. To confirm that the lofted CO from Indonesia really descended in the subtropics due to the Hadley circulation, we looked into the vertical cross section of the vertical pressure velocity in both events. From Fig. 9, it is suggested that large amounts of CO from Indonesia were transferred into the free troposphere by the strong upward air motion in this region. Similarly, there was a pronounced descending motion (positive values of vertical pressure velocity) during October 2006 (Fig. 9c) in the Northern Hemisphere subtropics around 20–30∘ N latitude, which corresponds well with the location of LABS. However, in October 2015, the descending motion was not significant compared to 2006. This may be due to the different El Niño conditions in 2006 and 2015. While IOD conditions were indeed similar between 2006 and 2015 (Fig. 4d), the higher descending motions in 2006 can be explained in part by the moderate El Niño conditions during that year. A well-developed El Niño condition was already established in 2015 compared to 2006. In October 2006, the observed Niño 3.4 value was around 0.7, whereas, in 2015, it was around 2.21. These values indicate that the El Niño conditions were already well established in October 2015, whereas, in 2006, the conditions were not developed as El Niño. It is reported that, in El Niño conditions, the western Pacific HC is observed to be weakened, whereas the eastern Pacific HC is strengthened (Wang, 2004). This is supported by the observed lesser descending motions in 2015 from the present study. These differences in the descending motions likely influenced the greater CO enhancement in 2006 compared to 2015 at LABS (Fig. 4b and Table 1). Overall, it is clearly illustrated from the MOPITT CO vertical cross section and the MERRA-2 vertical pressure velocity that the CO emitted from the Indonesian fire was transported vertically through the Hadley circulation to the LABS location.
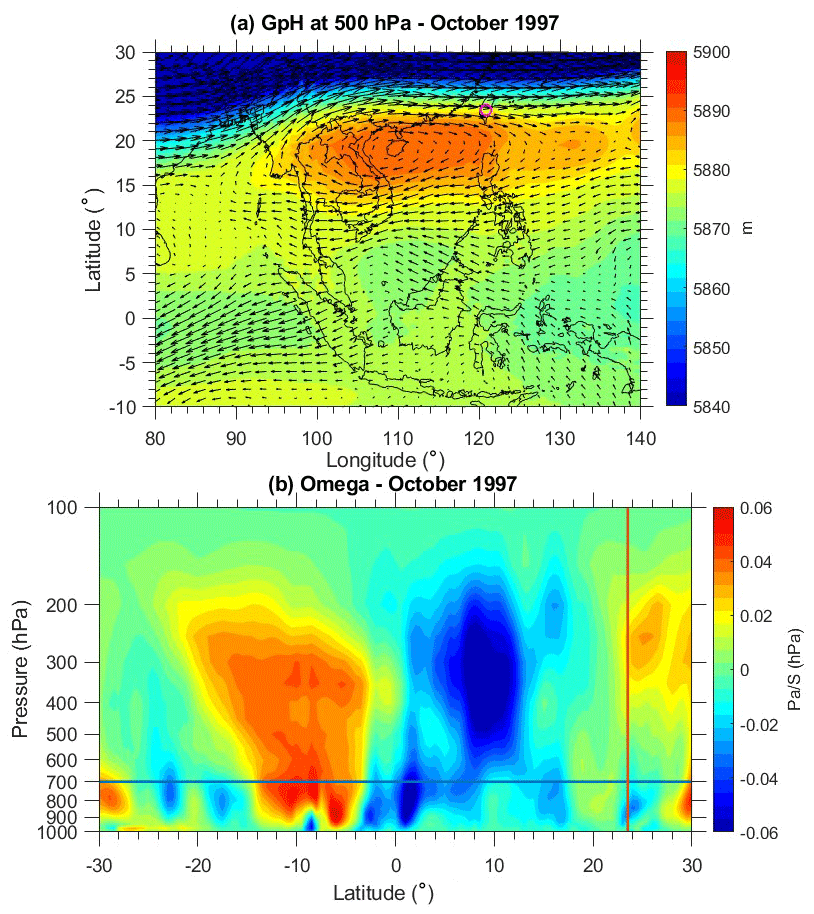
Figure 10MERRA-2 reanalysis, with the (a) monthly mean geopotential height (GpH) at 500 hPa and (b) pressure–latitude cross section of the vertical pressure velocity observed on October 1997.
One of the worst fire events in Indonesia's history occurred in October 1997 and was associated with an El Niño event and a positive IOD (Duncan et al., 2003a). In order to see if there were any similarities between 1997 and 2006 and 2015, particularly in large-scale circulations, we further checked the MERRA-2 GpH and wind circulation pattern in October 1997. Note that none of the satellite measurements of CO (either AIRS or MOPITT) is available during the 1997 event, and measurements at LABS did not start until 2006. Hence, we only cross-checked the large-scale circulations that are observed in October 1997. Figure 10a shows the spatial distribution of GpH observed at 500 hPa, and Fig. 10b shows the vertical–meridional cross section of the vertical pressure velocity averaged along 110–130∘ E in October 1997. Interestingly, we noticed a significant high-pressure anticyclonic circulation over northern parts of the SCS in October 1997, as also observed in 2006 and 2015. Also evident is the merging of the southerlies from the MC with the subtropical westerlies in the northern PSEA region. Similarly, the vertical pressure velocity also shows the upward wind over the MC and the downward wind over the Northern Hemisphere subtropics around 20–30∘ N latitude. From Fig. S4b, it is very clear that a significant descending wind was evident around the LABS location in 1997, which is similar to 2006 and 2015. Overall, it is very clear from the present results that it is possible to transport pollution from Indonesia to subtropical East Asia during extreme and higher-duration fire events like those in 1997, 2006, and 2015.
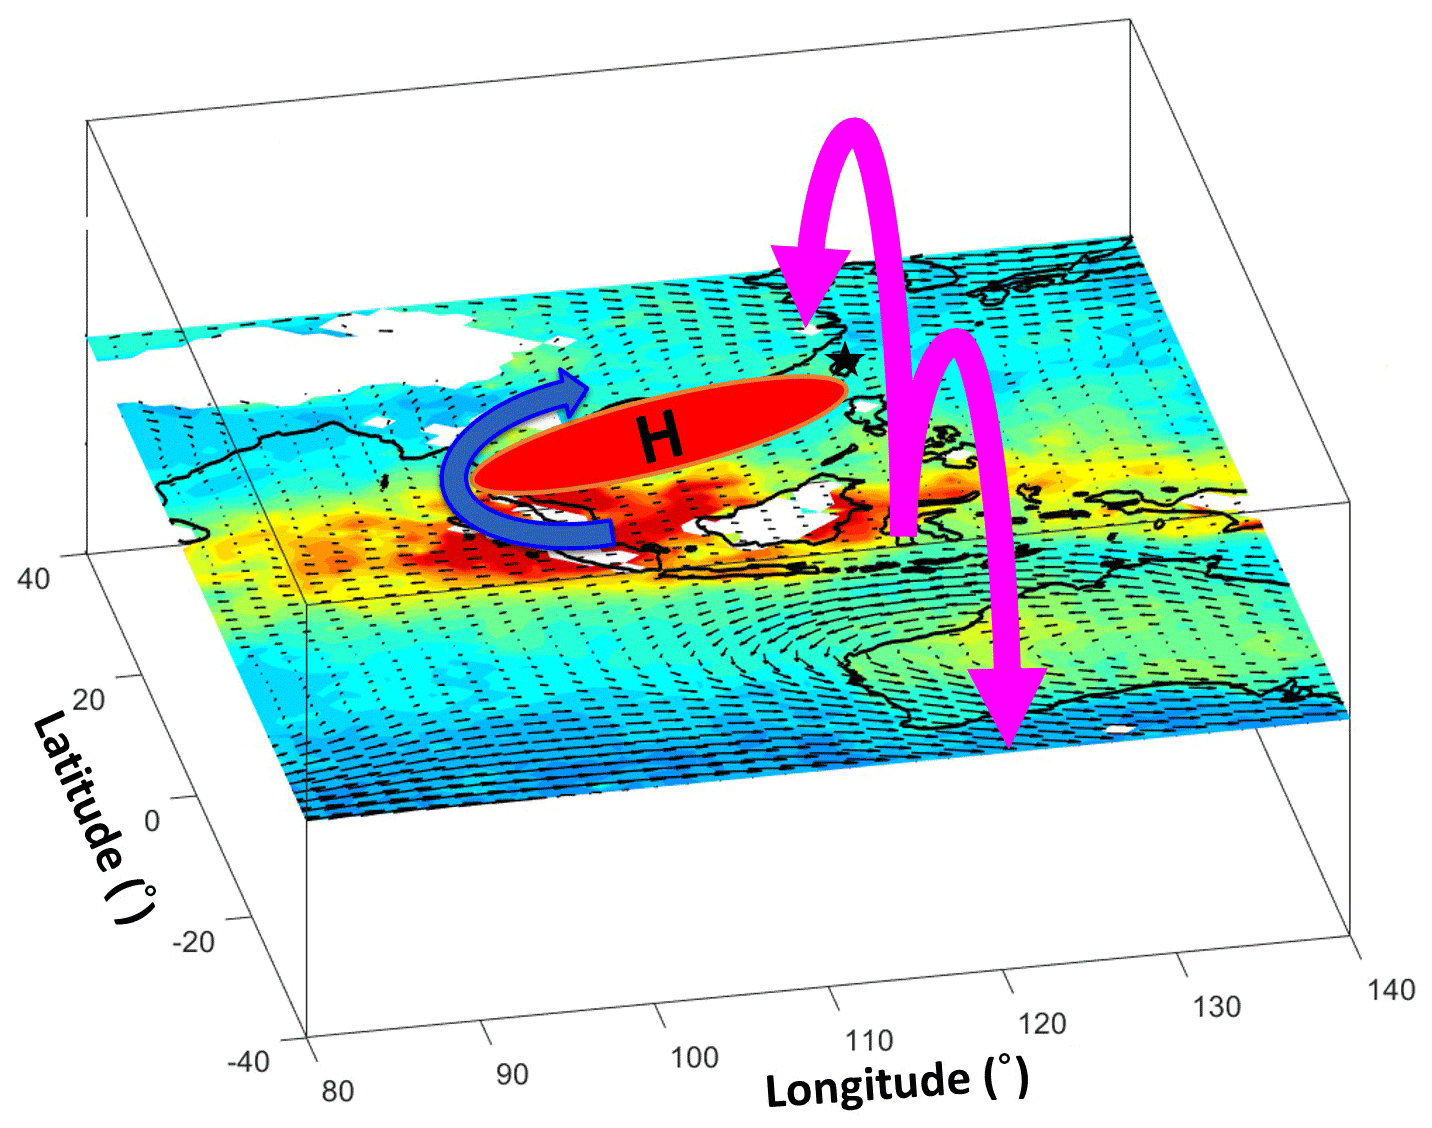
Figure 11Schematic diagram of CO transport from Indonesian fires to subtropical East Asian region. The horizontal transport of CO due to the high-pressure anticyclone is denoted by the blue-colored arrow. H denotes a high-pressure anticyclone over northern parts of the South China Sea. Magenta-colored arrows indicate the transport of CO through the local Hadley circulation (over 110–130∘ E). A black-colored star represents the LABS location.
The major transport pathways of CO from Indonesia to subtropical East Asia are illustrated in a schematic diagram (Fig. 11). Illustrated mechanisms include horizontal transport in the free troposphere due to El Niño and positive-IOD-induced high-pressure anticyclone circulation and vertical transport through the Hadley circulation. The southerlies on the southwestern flank of the anticyclone merged with the subtropical westerlies over PSEA and then transported polluted air to LABS. Apart from this horizontal transport, CO was transported through the Hadley circulation to LABS in both events. However, there was a distinctly different Hadley circulation strength in 2006 compared to 2015 due to the different El Niño conditions. These two events were strongly associated with positive IOD, but in 2006 the El Niño conditions were not well developed, whereas in 2015 well-developed El Niño conditions were evident. These El Niño conditions further suppressed the HC over the western Pacific in 2015 compared to 2006. This suggested the importance of the background climate conditions (ENSO and IOD) on the pollutant transport process.
Due to the combined impact of positive-phase IOD and El Niño-induced drought conditions in 2006 and 2015, Indonesia experienced extreme fire activity. MODIS active fire counts showed the largest fires in October 2006 and 2015 compared to the other years in the 16-year period in Indonesia. These recorded fires reflected two of the largest carbon emissions in the Indonesian region since 1997. The Lulin Atmospheric Background Station (LABS, 23.47∘ N, 120.87∘ E; 2862 ) is the only high-altitude background station located in the western North Pacific region and is optimally located to study some of these transport processes, including the long-range transport of pollution in the free troposphere and stratospheric intrusions. Interestingly, during these two events (October 2006 and 2015), we noticed an abnormal enhancement of CO compared to other years at LABS from the in situ measurements. In the present study, for the first time, the impact of Indonesia fire pollution on CO measurements at LABS and the plausible transport pathways for the transport of CO from Indonesia to subtropical East Asia were investigated. The main findings are summarized below.
-
Compared to the 16-year (2006–2021) means, a substantial increase in CO mixing ratios of about ∼ 47.2 ppb (37.2 %) in October 2006 and ∼ 36.7 ppb (28.9 %) in October 2015 was observed at LABS.
-
By comparing the CO and atmospheric large-scale circulation data, we found two plausible transport pathways of CO from Indonesia to LABS (i.e., horizontal transport in the free troposphere and vertically through the Hadley circulation).
-
El Niño and positive-IOD-induced high-pressure anticyclone circulation over northern parts of the South China Sea play an important role in the horizontal transport of CO.
-
The distinct strength of the Hadley circulation over the western Pacific was observed in October 2006 (stronger) and 2015 (weaker). Well-developed El Niño conditions in October 2015 suppressed the strength of the Hadley circulation over the western Pacific.
A changing warmer climate can influence carbon emissions and alter the transport pathways, hence impacting the various scales of air pollution and climate. Changes in the background climate will inevitably impact meteorological transport processes and the concentrations of pollutants arriving at downwind regions. Overall, the present results further provide knowledge to the atmospheric chemistry community about the different transport pathways of pollutants and the role of climate conditions.
The CO data at LABS can be assessed at http://lulin.tw (last access: 31 March 2023). The AIRS and MOPITT CO data can be downloaded from https://disc.gsfc.nasa.gov/datasets/AIRS3STM_7.0 (AIRS project, 2019) and https://asdc.larc.nasa.gov/project/MOPITT (NASA, 2023a). MERRA-2 data are available online through the NASA Goddard Earth Sciences Data Information Services Center (GES DISC; https://disc.gsfc.nasa.gov; NASA, 2023b). The Niño 3.4 index and IOD data can be downloaded from https://psl.noaa.gov/gcos_wgsp/Timeseries/Nino34/ (NOAA, 2023a) and https://psl.noaa.gov/gcos_wgsp/Timeseries/DMI/ (NOAA, 2023b). The MODIS fire products can be downloaded from https://firms.modaps.eosdis.nasa.gov/active_fire/ (NASA, 2023c).
The supplement related to this article is available online at: https://doi.org/10.5194/acp-23-4727-2023-supplement.
SRB and NHL conceptualized the project. SRB and CFOY developed the software and validated the project. SRB conducted the formal analysis, led the investigation with NHL, and prepared the draft. SRB, SMG, and NHL reviewed and edited the paper. SRB, CFOY, SKP, and SSK curated the data and visualized the project. NHL acquired funding and resources and supervised the project.
The contact author has declared that none of the authors has any competing interests.
Publisher's note: Copernicus Publications remains neutral with regard to jurisdictional claims in published maps and institutional affiliations.
The work has primarily been supported by the Ministry of Science and Technology, Taiwan (grant nos. MOST 110-2811-M-008-562 and MOST 109-2811-M-008-553). The authors thank the Taiwan Environmental Protection Administration (TEPA) for supporting the air pollutants monitoring at LABS. The authors thank NASA and NOAA for providing MOPITT, MODIS, and AIRS satellite data. We thank NASA's Global Monitoring and Assimilation Office (GMAO) for providing the Modern-Era Retrospective analysis for Research and Applications, version 2 (MERRA-2) data. We also thank the NOAA ESRL Physical Sciences Laboratory for providing Indian Ocean Dipole and Niño 3.4 index values (https://psl.noaa.gov/gcos_wgsp/Timeseries/DMI/, last access: 31 March 2023; https://psl.noaa.gov/gcos_wgsp/Timeseries/Nino34/, last access: 31 March 2023;).
This research has been supported by the Ministry of Science and Technology, Taiwan (grant no. MOST 110-2811-M-008-562).
This paper was edited by Jayanarayanan Kuttippurath and reviewed by three anonymous referees.
AIRS project: Aqua/AIRS L3 Monthly Standard Physical Retrieval (AIRS-only) 1 degree × 1 degree V7.0, Goddard Earth Sciences Data and Information Services Center (GES DISC), Greenbelt, MD, USA [data set], https://doi.org/10.5067/UBENJB9D3T2H, 2019.
Bowman, K. P.: Transport of carbon monoxide from the tropics to the extratropics, J. Geophys. Res.-Atmos., 111, D02107, https://doi.org/10.1029/2005JD006137, 2006.
Chandra, S., Ziemke, J. R., Duncan, B. N., Diehl, T. L., Livesey, N. J., and Froidevaux, L.: Effects of the 2006 El Niño on tropospheric ozone and carbon monoxide: implications for dynamics and biomass burning, Atmos. Chem. Phys., 9, 4239–4249, https://doi.org/10.5194/acp-9-4239-2009, 2009.
Chi, K. H., Hung, N. T., Lin, C. Y., Wang, S. H., Ou-Yang, C. F., Lee, C. T., and Lin, N. H.: Evaluation of Atmospheric PCDD/Fs at Two High-Altitude Stations in Vietnam and Taiwan during Southeast Asia Biomass Burning, Aerosol Air Qual. Res., 16, 2706–2715, https://doi.org/10.4209/aaqr.2015.11.0653, 2016.
Chuang, M. T., Fu, J. S., Lee, C. Te, Lin, N. H., Gao, Y., Wang, S. H., Sheu, G. R., Hsiao, T. C., Wang, J. L., Yen, M. C., Lin, T. H., and Thongboonchoo, N.: The simulation of long-range transport of biomass burning plume and short-range transport of anthropogenic pollutants to a mountain observatory in east Asia during the 7-SEAS/2010 Dongsha experiment, Aerosol Air Qual. Res., 16, 2933–2949, https://doi.org/10.4209/aaqr.2015.07.0440, 2016.
Cooper, O. R., Gao, R. S., Tarasick, D., Leblanc, T., and Sweeney, C.: Long-term ozone trends at rural ozone monitoring sites across the United States, 1990–2010, J. Geophys. Res.-Atmos.,117, 1990–2010, https://doi.org/10.1029/2012JD018261, 2012.
Deeter, M. N., Edwards, D. P., Francis, G. L., Gille, J. C., Mao, D., Martínez-Alonso, S., Worden, H. M., Ziskin, D., and Andreae, M. O.: Radiance-based retrieval bias mitigation for the MOPITT instrument: the version 8 product, Atmos. Meas. Tech., 12, 4561–4580, https://doi.org/10.5194/amt-12-4561-2019, 2019.
Duncan, B. N., Bey, I., Chin, M., Mickley, L. J., Fairlie, T. D., Martin, R. V., and Matsueda, H.: Indonesian wildfires of 1997: Impact on tropospheric chemistry, J. Geophys. Res., 108, 4458, https://doi.org/10.1029/2002JD003195, 2003a.
Field, R. D., van der Werf, G. R., and Shen, S. S. P.: Human amplification of drought-induced biomass burning in Indonesia since 1960, Nat. Geosci., 2, 185–188, https://doi.org/10.1038/ngeo443, 2009.
Field, R. D., van der Werf, G. R., Fanin, T., Fetzer, E. J., Fuller, R., Jethva, H., Levy, R., Livesey, N. J., Luo, M., Torres, O., and Worden, H. M.: Indonesian fire activity and smoke pollution in 2015 show persistent nonlinear sensitivity to El Ni ̃no-induced drought, P. Natl. Acad. Sci. USA, 113, 9204–9209, https://doi.org/10.1073/pnas.1524888113, 2016.
Gelaro, R., McCarty, W., Suárez, M. J., Todling, R., Molod, A., Takacs, L., Randles, C. A., Darmenov, A., Bosilovich, M. G., Reichle, R., Wargan, K., Coy, L., Cullather, R., Draper, C., Akella, S., Buchard, V., Conaty, A., Silva, A. M. da, Gu, W., Kim, G.-K., Koster, R., Lucchesi, R., Merkova, D., Nielsen, J. E., Partyka, G., Pawson, S., Putman, W., Rienecker, M., Schubert, S. D., Sienkiewicz, M., and Zhao, B.: The Modern-Era Retrospective Analysis for Research and Applications, Version 2 (MERRA-2), J. Climate, 30, 5419–5454, https://doi.org/10.1175/jcli-d-16-0758.1, 2017.
Giglio, L., Schroeder, W., and Justice, C. O.: The collection 6 MODIS active fire detection algorithm and fire products, Remote Sens. Environ., 178, 31–41, https://doi.org/10.1016/j.rse.2016.02.054, 2016.
Hadley, G.: Concerning the cause of the general trade-winds, Philos. Trans. R. Soc. Lond., 29, 58–62, https://doi.org/10.1098/rstl.1735.0014, 1735.
Heymann, J., Reuter, M., Buchwitz, M., Schneising, O., Bovensmann, H., Burrows, J. P., Massart, S., Kaiser, J. W., and Crisp, D.: CO2 emission of Indonesian fires in 2015 estimated from satellite-derived atmospheric CO2 concentrations, Geophys. Res. Lett., 44, 1537–1544, https://doi.org/10.1002/2016gl072042, 2017.
Hsiao, T. C., Ye, W. C., Wang, S. H., Tsay, S. C., Chen, W. N., Lin, N. H., Lee, C. Te, Hung, H. M., Chuang, M. T., and Chantara, S.: Investigation of the CCN activity, BC and UVBC mass concentrations of biomass burning aerosols during the 2013 BASELInE campaign, Aerosol Air Qual. Res., 16, 2742–2756, https://doi.org/10.4209/aaqr.2015.07.0447, 2016.
Huang, H. Y., Wang, S. H., Huang, W. X., Lin, N. H., Chuang, M. T., da Silva, A. M., and Peng, C. M.: Influence of Synoptic-Dynamic Meteorology on the Long-Range Transport of Indochina Biomass Burning Aerosols, J. Geophys. Res.-Atmos., 125, e2019JD031260, https://doi.org/10.1029/2019JD031260, 2020.
Huang, L., Lin, W., Li, F., Wang, Y., and Jiang, B.: Climate Impacts of the Biomass Burning in Indochina on Atmospheric Conditions over Southern China, Aerosol Air Qual. Res., 19, 2707–2720, https://doi.org/10.4209/aaqr.2019.01.0028, 2019.
Huijnen, V., Wooster, M. J., Kaiser, J. W., Gaveau, D. L. A., Flemming, J., Parrington, M., Inness, A., Murdiyarso, D., Main, B., and van Weele, M.: Fire carbon emissions over maritime southeast Asia in 2015 largest since 1997, Sci. Rep.-UK, 6, 26886, https://doi.org/10.1038/srep26886, 2016.
IPCC: Climate Change 2013: The Physical Science Basis, in: Contribution of Working Group I to the Fifth Assessment Report of the Intergovernmental Panel on Climate Change, edited by: Stocker, T. F., Qin, D., Plattner, G.-K., Tignor, M., Allen, S. K., Boschung, J., Nauels, A., Xia, Y., Bex, V., and Midgley, P. M., Cambridge University Press, Cambridge, UK and New York, NY, USA, https://doi.org/10.1017/CBO9781107415324, 2013.
Lin, C. C., Chen, W. N., Loftus, A. M., Lin, C. Y., Fu, Y. T., Peng, C. M., and Yen, M. C.: Influences of the long-range transport of biomass-burning pollutants on surface air quality during 7-SEAS field campaigns, Aerosol Air Qual. Res., 17, 2595–2607, https://doi.org/10.4209/aaqr.2017.08.0273, 2017.
Lin, C.-Y., Hsu, H.-M., Lee, Y. H., Kuo, C. H., Sheng, Y.-F., and Chu, D. A.: A new transport mechanism of biomass burning from Indochina as identified by modeling studies, Atmos. Chem. Phys., 9, 7901–7911, https://doi.org/10.5194/acp-9-7901-2009, 2009.
Lin, N.-H., Tsay, S.-C., Maring, H. B., Yen, M.-C., Sheu, G.-R., Wang, S.-H., Chi, K. H., Chuang, M.-T., Ou-Yang, C.-F., Fu, J. S., Reid, J. S., Lee, C.-T., Wang, L.-C., Wang, J.-L., Hsu, C. N., Sayer, A. M., Holben, B. N., Chu, Y.-C., Nguyen, X. A., Sopajaree, K., Chen, S.-J., Cheng, M.-T., Tsuang, B.-J., Tsai, C.-J., Peng, C.-M., Schnell, R. C., Conway, T., Chang, C.-T., Lin, K.-S., Tsai, Y. I., Lee, W.-J., Chang, S.-C., Liu, J.-J., Chiang, W.-L., Huang, S.-J., Lin, T.-H., and Liu, G.-R.: An overview of regional experiments on biomass burning aerosols and related pollutants in Southeast Asia: From BASE-ASIA and the Dongsha Experiment to 7-SEAS, Atmos. Environ., 78, 1–19, https://doi.org/10.1016/j.atmosenv.2013.04.066, 2013.
Logan, J. A., Megretskaia, I., Nassar, R., Murray, L. T., Zhang, L., Bowman, K. W., Worden, H. M., and Luo, M.: Effects of the 2006 El Niño on tropospheric composition as revealed by data from the Tropospheric Emission Spectrometer (TES), Geophys. Res. Lett., 35, 1–5, https://doi.org/10.1029/2007GL031698, 2008.
Matsueda, H. and Inoue, H. Y.: Aircraft measurements of trace gases between Japan and Singapore in October of 1993, 1996, and 1997, Geophys. Res. Lett., 26, 2413–2416, https://doi.org/10.1029/1999GL900089, 1999.
Matsueda, H., Inoue, H. Y., and Ishii, M.: Aircraft observation of carbon dioxide at 8–13 km altitude over the western Pacific from 1993 to 1999, Tellus B, 54, 1–21, https://doi.org/10.1034/j.1600-0889.2002.00304.x, 2002.
Matsueda, H., Buchholz, R. R., Ishijima, K., Worden, H. M., Hammerling, D., and Machida, T.: Interannual Variation of Upper Tropospheric CO over the Western Pacific Linked with Indonesian Fires, SOLA, 15, 205–210, https://doi.org/10.2151/sola.2019-037, 2019.
McMillan, W. W., Barnet, C., Strow, L., Chahine, M. T., McCourt, M. L., Warner, J. X., Novelli, P. C., Korontzi, S., Maddy, E. S., and Datta, S.: Daily global maps of carbon monoxide from NASA's Atmospheric Infrared Sounder, Geophys. Res. Lett., 32, L11801, https://doi.org/10.1029/2004GL021821, 2005.
McMillan, W. W., Evans, K. D., Barnet, C. D., Maddy, E. S., Sachse, G. W., and Diskin, G. S.: Validating the AIRS Version 5 CO retrieval with DACOM in situ measurements during INTEX-A and -B, IEEE T. Geosci. Remote, 49, 2802–2813, https://doi.org/10.1109/TGRS.2011.2106505, 2011.
Nara, H., Tanimoto, H., Nojiri, Y., Mukai, H., Zeng, J., Tohjima, Y., and Machida, T.: CO emissions from biomass burning in South-east Asia in the 2006 El Nino year: shipboard and AIRS satellite observations, Environ. Chem., 8, 213–223, https://doi.org/10.1071/EN10113, 2011.
NASA: Measurements Of Pollution In The Troposphere, https://asdc.larc.nasa.gov/project/MOPITT (last access: 31 March 2023), 2023a.
NASA: GES DISC, https://disc.gsfc.nasa.gov (last access: 31 March 2023), 2023b.
NASA: Active Fire Data, https://firms.modaps.eosdis.nasa.gov/active_fire/ (last access: 31 March 2023), 2023c.
Nassar, R., Logan, J. A., Megretskaia, I. A., Murray, L. T., Zhang, L., and Jones, D. B. A.: Analysis of tropical tropospheric ozone, carbon monoxide, and water vapor during the 2006 El Niño using TES observations and the GEOS Chem model, J. Geophys. Res.-Atmos., 114, D17304, https://doi.org/10.1029/2009JD011760, 2009.
NOAA: Niño 3.4 SST Index, https://psl.noaa.gov/gcos_wgsp/Timeseries/Nino34/ (last access: 31 March 2023), 2023a.
NOAA: Dipole Mode Index (DMI), https://psl.noaa.gov/gcos_wgsp/Timeseries/DMI/ (last access: 31 March 2023), 2023b.
Ou-Yang, C. F., Lin, N. H., Sheu, G. R., Lee, C. T., and Wang, J. L.: Seasonal and diurnal variations of ozone at a high-altitude mountain baseline station in East Asia, Atmos. Environ., 46, 279–288, https://doi.org/10.1016/j.atmosenv.2011.09.060, 2012.
Ou-Yang, C. F., Lin, N. H., Lin, C. C., Wang, S. H., Sheu, G. R., Lee, C. Te, Schnell, R. C., Lang, P. M., Kawasato, T., and Wang, J. L.: Characteristics of atmospheric carbon monoxide at a high-mountain background station in East Asia, Atmos. Environ., 89, 613–622, https://doi.org/10.1016/j.atmosenv.2014.02.060, 2014.
Ou-Yang, C. F., Ravindra Babu, S., Lee, J.-R., Yen, M.-C., Griffith, S. M., Lin, C.-C., Chang, S.-C., and Lin, N.-H.: Detection of stratospheric intrusion events and their role in ozone enhancement at a mountain background site in sub-tropical East Asia, Atmos. Environ., 268, 118779, https://doi.org/10.1016/j.atmosenv.2021.118779, 2022.
Pan, X., Chin, M., Ichoku, C. M., and Field, R. D.: Connecting Indonesian fires and drought with the type of El Niño and phase of the Indian Ocean dipole during 1979–2016, J. Geophys. Res.-Atmos., 123, 1–15, https://doi.org/10.1029/2018JD028402, 2018.
Pani, S. K., Wang, S. H., Lin, N. H., Lee, C. Te, Tsay, S. C., Holben, B. N., Janjai, S., Hsiao, T. C., Chuang, M. T., and Chantara, S.: Radiative effect of springtime biomass-burning aerosols over northern Indochina during 7-SEAS/BASELInE 2013 campaign, Aerosol Air Qual. Res., 16, 2802–2817, https://doi.org/10.4209/aaqr.2016.03.0130, 2016.
Pani, S. K., Ou-Yang, C.-F., Wang, S.-H., Ogren, J. A., Sheridan, P. J., Sheu, G.-R., and Lin, N.-H. J. A. E.: Relationship between long-range transported atmospheric black carbon and carbon monoxide at a high-altitude background station in East Asia, Atmos. Environ, 210, 86–99, https://doi.org/10.1016/j.atmosenv.2019.04.053, 2019.
Park, S., Kim, S. W., Lin, N. H., Pani, S. K., Sheridan, P. J., and Andrews, E.: Variability of Aerosol Optical Properties Observed at a Polluted Marine (Gosan, Korea) and a High-altitude Mountain (Lulin, Taiwan) Site in the Asian Continental Outflow, Aerosol Air Qual. Res., 19, 1283, https://doi.org/10.4209/aaqr.2018.11.0416, 2019.
Parker, R. J., Boesch, H., Wooster, M. J., Moore, D. P., Webb, A. J., Gaveau, D., and Murdiyarso, D.: Atmospheric CH4 and CO2 enhancements and biomass burning emission ratios derived from satellite observations of the 2015 Indonesian fire plumes, Atmos. Chem. Phys., 16, 10111–10131, https://doi.org/10.5194/acp-16-10111-2016, 2016.
Pochanart, P., Akimoto, H., Kajii, Y., and Sukasem, P.: Carbon monoxide, regional-scale, and biomass burning in tropical continental Southeast Asia: Observations in rural Thailand, J. Geophys. Res.-Atmos., 108, 4552, https://doi.org/10.1029/2002JD003360, 2003.
Ravindra Babu, S. and Liou, Y. A.: Tropical tropopause layer evolution during 2015–16 El Niño event inferred from COSMIC RO measurements, J. Atmos. Sol.-Terr. Phy., 212, 105507, https://doi.org/10.1016/j.jastp.2020.105507, 2021.
Ravindra Babu, S., VenkataRatnam, M., Basha, G., Liou, Y.-A., and Narendra Reddy, N.: Large Anomalies in the Tropical Upper Troposphere Lower Stratosphere (UTLS) Trace Gases Observed during the Extreme 2015–16 El Niño Event by Using Satellite Measurements, Remote Sens.-Basel, 11, 687, https://doi.org/10.3390/rs11060687, 2019.
Ravindra Babu, S., Venkat Ratnam, M., Basha, G., Pani, S. K., and Lin, N.-H.: Structure, dynamics, and trace gas variability within the Asian summer monsoon anticyclone in the extreme El Niño of 2015–2016, Atmos. Chem. Phys., 21, 5533–5547, https://doi.org/10.5194/acp-21-5533-2021, 2021.
Ravindra Babu, S., Nguyen, L. S. P., Sheu, G.-R., Griffith, S. M., Pani, S. K., Huang, H.-Y., and Lin, N.-H.: Long-range transport of La Soufrière volcanic plume to the western North Pacific: Influence on atmospheric mercury and aerosol properties, Atmos. Environ., 268, 118806, https://doi.org/10.1016/j.atmosenv.2021.118806, 2022a.
Ravindra Babu, S., Pani, S. K., Ou-Yang, C. F., Lin, N. H.: Impact of 21 June 2020 Annular Solar Eclipse on Meteorological Parameters, O3 and CO at a High Mountain Site in Taiwan, Aerosol Air Qual. Res., 22, 220248, https://doi.org/10.4209/aaqr.220248, 2022b.
Reid, J. S., Hyer, E. J., Johnson, R., Holben, B. N., Yokelson, R. J., Zhang, J., Campbell, J. R., Christopher, S. A., Di Girolamo, L., Giglio, L., Holz, R. E., Kearney, C., Miettinen, J., Reid, E. A., Turk, F. J., Wang, J., Xian, P., Zhao, G., Balasubramanian, R., Chew, B. N., Janai, S., Lagrosas, N., Lestari, P., Lin, N.-H., Mahmud, M., Nguyen, A. X., Norris, B., Oahn, N. T. K., Oo, M., Salinas, S. V., Welton, E. J., Liew, S. C.: Observing and understanding the Southeast Asian aerosol system by remote sensing: An initial review and analysis for the Seven Southeast Asian Studies (7SEAS) program, Atmos. Res., 122, 403–468, https://doi.org/10.1016/j.atmosres.2012.06.005, 2013.
Sheu, G.-R., Lin, N.-H., Wang, J.-L., and Lee, C.-T.: Lulin Atmospheric Background Station: A New High-Elevation Baseline Station in Taiwan, J-STAGE, 24, 84–89, https://doi.org/10.11203/jar.24.84, 2009.
Tsay, S. C., Maring, H. B., Lin, N. H., Buntoung, S., Chantara, S., Chuang, H. C., Gabriel, P. M., Goodloe, C. S., Holben, B. N., Hsiao, T. C., Christina Hsu, N., Janjai, S., Lau, W. K. M., Lee, C. Te, Lee, J., Loftus, A. M., Nguyen, A. X., Nguyen, C. M., Pani, S. K., Pantina, P., Sayer, A. M., Tao, W. K., Wang, S. H., Welton, E. J., Wiriya, W., and Yen, M. C.: Satellitesurface perspectives of air quality and aerosol-cloud effects on the environment: An overview of 7-SEAS/BASELInE, Aerosol Air Qual. Res., 16, 2581–2602, https://doi.org/10.4209/aaqr.2016.08.0350, 2016.
van der Werf, G. R., Dempewolf, J., Trigg, S. N., Randerson, J. T., Kasibhatla, P. S., Giglio, L., Murdiyarso, D., Peters, W., Morton, D. C., Collatz, G. J., Dolman, A. J., and DeFries, R. S.: Climate regulation of fire emissions and deforestation in equatorial Asia, P. Natl. Acad. Sci. USA, 105, 20350–20355, https://doi.org/10.1073/pnas.0803375105, 2008.
van der Werf, G. R., Randerson, J. T., Giglio, L., van Leeuwen, T. T., Chen, Y., Rogers, B. M., Mu, M., van Marle, M. J. E., Morton, D. C., Collatz, G. J., Yokelson, R. J., and Kasibhatla, P. S.: Global fire emissions estimates during 1997–2016, Earth Syst. Sci. Data, 9, 697–720, https://doi.org/10.5194/essd-9-697-2017, 2017.
Wang, C.: ENSO, Atlantic climate variability, and the Walker and Hadley circulations, in: The Hadley circulation: Present, past and future, Springer, Berlin, 173–202, https://doi.org/10.1007/978-1-4020-2944-8_7, 2004.
Wang, S.-H., Welton, E. J., Holben, B. N., Tsay, S.-C., Lin, N.-H., Giles, D., Stewart, S. A., Janjai, S., Nguyen, X. A., Hsiao, T.-C., Chen, W.-N., Lin, T.-H., Buntoung, S., Chantara, S., and Wiriya, W.: Vertical Distribution and Columnar Optical Properties of Springtime Biomass-Burning Aerosols over Northern Indochina during 2014 7-SEAS Campaign, Aerosol Air Qual. Res., 15, 2037–2050, https://doi.org/10.4209/aaqr.2015.05.0310, 2015.
Warner, J., Carminati, F., Wei, Z., Lahoz, W., and Attié, J.-L.: Tropospheric carbon monoxide variability from AIRS under clear and cloudy conditions, Atmos. Chem. Phys., 13, 12469–12479, https://doi.org/10.5194/acp-13-12469-2013, 2013.
Warner, J. X., Comer, M. M., Barnet, C. D., McMillan, W. W., Wolf, W., Maddy, E., and Sachse, G.: A Comparison of Satellite Tropospheric Carbon Monoxide Measurements from AIRS and MOPITT During INTEX-A, J. Geophys. Res., 112, D12S17, https://doi.org/10.1029/2006JD007925, 2007.
Worden, H. M., Deeter, M. N., Edwards, D. P., Gille, J. C., Drummond, J. R., and Nedélec, P. P.: Observations of near-surface carbon monoxide from space using MOPITT multispectral retrievals, J. Geophys. Res., 115, D18314, https://doi.org/10.1029/2010JD014242, 2010.
Zellweger, C., Hüglin, C., Klausen, J., Steinbacher, M., Vollmer, M., and Buchmann, B.: Inter-comparison of four different carbon monoxide measurement techniques and evaluation of the long-term carbon monoxide time series of Jungfraujoch, Atmos. Chem. Phys., 9, 3491–3503, https://doi.org/10.5194/acp-9-3491-2009, 2009.
Zhang, L., Li, Q. B., Jin, J., Liu, H., Livesey, N., Jiang, J. H., Mao, Y., Chen, D., Luo, M., and Chen, Y.: Impacts of 2006 Indonesian fires and dynamics on tropical upper tropospheric carbon monoxide and ozone, Atmos. Chem. Phys., 11, 10929–10946, https://doi.org/10.5194/acp-11-10929-2011, 2011.