the Creative Commons Attribution 4.0 License.
the Creative Commons Attribution 4.0 License.
 | 17 Apr 2023
Satellite observations of smoke–cloud–radiation interactions over the Amazon rainforest
Ross Herbert
Philip Stier
The Amazon rainforest routinely experiences intense and long-lived biomass burning events that result in smoke plumes that cover vast regions. The spatial and temporal extent of the plumes and the complex pathways through which they interact with the atmosphere have proved challenging to measure for purposes of gaining a representative understanding of smoke impacts on the Amazonian atmosphere. In this study, we use multiple collocated satellite sensors on board AQUA and TERRA platforms to study the underlying smoke–cloud–radiation interactions during the diurnal cycle. An 18-year time series for both morning and afternoon overpasses is constructed, providing collocated measurements of aerosol optical depth (AOD; column-integrated aerosol extinction), cloud properties, top-of-atmosphere radiative fluxes, precipitation, and column water vapour content from independent sources.
The long-term time series reduces the impact of interannual variability and provides robust evidence that smoke significantly modifies the Amazonian atmosphere. Low loadings of smoke (AOD ≤ 0.4) enhance convective activity, cloudiness, and precipitation, but higher loadings (AOD > 0.4) strongly suppress afternoon convection and promote low-level cloud occurrence. Accumulated precipitation increases with convective activity but remains elevated under high smoke loadings, suggesting fewer but more intense convective cells. Contrasting morning and afternoon cloud responses to smoke are observed, in line with recent simulations. Observations of top-of-atmosphere radiative fluxes support the findings and show that the response of low-level cloud properties and cirrus coverage to smoke results in a pronounced and consistent increase in top-of-atmosphere outgoing radiation (cooling) of up to 50 W m−2 for an AOD perturbation of +1.0.
The results demonstrate that smoke strongly modifies the atmosphere over the Amazon via widespread changes to the cloud field properties. Rapid adjustments work alongside instantaneous radiative effects to drive a stronger cooling effect from smoke than previously thought, whilst contrasting morning and afternoon responses of liquid and ice water paths highlight a potential method for constraining aerosol impacts on climate. Increased drought susceptibility, land use change, and deforestation will have important and widespread impacts on the region over the coming decades. Based on this analysis, we anticipate that further increases in anthropogenic fire activity will associated with an overall reduction in regional precipitation and a negative forcing (cooling) on the Earth's energy budget.
- Article
(7846 KB) - Full-text XML
-
Supplement
(1460 KB) - BibTeX
- EndNote


Anthropogenic aerosols and their role in the Earth system remain a key uncertainty in quantifying the impact of historic and future anthropogenic activity on the global climate (Forster et al., 2021). Aerosols interact with the atmosphere via modifying fluxes of solar and terrestrial radiation (referred to as aerosol–radiation interactions; ARI) and by influencing the properties of clouds (referred to as aerosol–cloud interactions; ACI) and therefore have the potential to significantly alter surface fluxes, cloud properties, precipitation, and the energy budget of the atmosphere.
Biomass burning produces smoke aerosol particles that efficiently absorb shortwave radiation and strongly perturb the atmosphere via both ARI and ACI processes. Smoke instantaneously reduces shortwave radiation reaching the surface and produces localized warming of the smoke layer via the ARI pathway. Rapid adjustments of the environment due to ARI can result in reduced surface fluxes and suppressed convection (Y. Zhang et al., 2008; Liu et al., 2020; Martins et al., 2009), with the localized warming driving cloud evaporation or deepening depending on the cloud type and the relative altitude of the smoke (Koch and Del Genio, 2010; Herbert et al., 2020). Via the ACI pathway, aerosol particles can act as cloud condensation nuclei (CCN) or ice nuclei (IN) and instantaneously modify the number concentration of cloud droplets or ice particles in a given cloud, thus changing the cloud albedo. Rapid adjustments associated with ACI include changes to precipitation efficiency and cloud evolution (Wu et al., 2011; Liu et al., 2020; Thornhill et al., 2018; Marinescu et al., 2021; Zaveri et al., 2022). The influence that a smoke particle has on a cloud and its environment is dependent on its physiochemical properties, which determine its optical properties and its ability to act as a CCN or IN. These properties are dependent on the type of fuel (McClure et al., 2020; Petters et al., 2009) and the combustion efficiency (Liu et al., 2014) and may also change with time through ageing processes and interaction with other species (Vakkari et al., 2014; R. Zhang et al., 2008). This, combined with the myriad of pathways through which smoke can impact the environment and the spatial and temporal extent of the smoke plumes, has proven to be a challenge to understand at a process level and to represent in atmospheric models. As a result, there remains considerable uncertainty in our understanding of smoke impacts on climate on a global scale (Forster et al., 2021; Bond et al., 2013), which will become increasingly important in the future as drought conditions become more prevalent (IPCC, 2013) and as anthropogenic deforestation continues (de Oliveira et al., 2020).
The Amazon rainforest in South America is one of the world's largest sources of biomass burning aerosols (van der Werf et al., 2017), with peak emissions observed during the annual dry season (August to October) driven almost exclusively by agricultural activities and anthropogenic activity (Libonati et al., 2021). The associated smoke plumes can extend high into the troposphere (Holanda et al., 2020) and can cover vast regions, with sustained high atmospheric loadings of smoke often observed for days to weeks. Observational studies have demonstrated the ability of smoke to strongly influence the Amazon atmosphere during the dry season via changes to the initiation and efficiency of precipitation processes in deep convective clouds (Andreae et al., 2004; Gonçalves et al., 2015; Camponogara et al., 2014; Bevan et al., 2008; Braga et al., 2017; Wendisch et al., 2016). These impacts are largely attributed to the suppression of convection or enhanced cloud droplet number concentrations, though the overall response of cumulative precipitation remains uncertain.
The widespread and long-lived nature of the smoke perturbations presents a challenge to make the necessary in situ measurements that capture the overall impact of the smoke on the atmosphere. Regional modelling studies with sufficient complexity to reproduce the convective nature of the Amazon atmosphere have been used to quantify the widespread smoke–cloud–radiation interactions. A consistent result is widespread suppression of convection underneath smoke plumes due to the cooler surface and elevated heating stabilizing the boundary layer and a corresponding reduction in cumulative precipitation (Martins et al., 2009; Zhang et al., 2009; Wu et al., 2011; Liu et al., 2020; Herbert et al., 2021). There is less agreement regarding the change to the widespread cloud field properties, such as the cloud fraction (CF), liquid water path (LWP), and ice water path (IWP), potentially due to the complexity of sufficiently representing ACI and ARI processes in these models (Marinescu et al., 2021; White et al., 2017). In a recent study, Herbert et al. (2021) performed week-long simulations of smoke–cloud–radiation interactions over the Amazon at convection-permitting resolution. The authors reported considerable diurnal variation in the cloud response, with enhanced cloudiness overnight and reduced cloudiness in the afternoon; this occurred alongside a gradual increase in the IWP across the domain that strongly dictated the overall positive effective radiative forcing (ERF) due to the smoke. The response in IWP was in contrast to a similar study by Liu et al. (2020), in which only weakly increasing IWP across the model domain was reported, with changes in the liquid cloud fraction dictating the overall negative ERF. The contrasting results have important implications for the ERF of smoke; however, without robust observational information, it is difficult to establish whether these model-based conclusions are valid.
One means of gathering this information is using space-borne remote observations that are able to provide widespread and routine coverage. Koren et al. (2004) used retrievals from the Moderate Resolution Imaging Spectroradiometer (MODIS) instrument on board the AQUA satellite to examine cloud–smoke relationships during the 2002 dry season; the authors found that the low-cloud fraction was strongly suppressed as the smoke optical depth increased. Yu et al. (2007) similarly used MODIS-AQUA retrievals to examine widespread smoke–cloud interactions for the 2002 and 2003 dry seasons and found pronounced variability in the smoke–cloud relationships between the years studied and considerable sensitivity to the cloud properties (e.g. LWP) in both years. This study supported the results of Koren et al. (2004) but also demonstrated important interannual variability, suggesting that a longer time series is required to quantify and understand the underlying processes through which the smoke perturbs the widespread environment. Koren et al. (2008) used MODIS-AQUA retrievals of cloud fraction and cloud top height during the dry seasons of 2005 to 2007 to propose that the response of clouds to smoke is nonlinear: at low loadings of smoke, clouds are invigorated, but at higher loadings, the clouds are suppressed. These results were supported by a simplified theoretical model that additionally suggested that the invigoration was driven by ACI processes, whereas the suppression was driven by ARI processes. These widespread remote observations provide valuable insights, but there are several areas that can be improved upon: (1) the interannual variability, as the response of the atmosphere to smoke may be different from one year to the next, which may mask the underlying smoke–cloud–radiation processes and the overall impact of the smoke; (2) the diurnal cycle, as modelling studies suggest important diurnal responses to the cloud and precipitation (Liu et al., 2020; Herbert et al., 2021), yet previous remote observations over the Amazon have only observed a very small window of time coinciding with the AQUA satellite overpass time (∼ 13:30 local solar time; LST); (3) the radiative effect, as it is understood that smoke may have important impacts on deep convective clouds and their optical properties, yet previous studies have estimated radiative effects using offline radiative transfer models, which may not be representative of the true radiative effect
In this study, we build upon previous efforts to quantitatively understand aerosol–cloud–radiative interactions by focusing on smoke impacts on the Amazonian atmosphere during the dry season. This region provides a unique opportunity to study the interactions between long-lived, substantial aerosol loadings and deep convective clouds over a widespread region. We use 18 years of satellite observations to produce a 1∘ gridded climatology of smoke–cloud–radiation effects over the Amazon during the biomass burning season. The long time series allows us to work towards removing or reducing the interannual variability and provides the means to robustly explore more of the parameter space. We explore the diurnal cycle of the responses to smoke by combining and contrasting the AQUA satellite retrievals with the TERRA satellite, which is host to the same instruments as AQUA but has an overpass time of ∼ 10:30 LST. The two satellites are hosts to several instruments including MODIS, CERES (Clouds and the Earth's Radiant Energy System), and AIRS (The Atmospheric Infrared Sounder). The use of all three instruments, alongside reanalysis and precipitation datasets, provides spatially and temporally collocated data that can be used to support individual observations and to strengthen the analysis. Additionally, CERES can provide collocated information regarding the top-of-atmosphere (TOA) radiative fluxes and the overall radiative effect of the smoke, which has not previously been explored in this region.
2.1 Domain and analysis time period
Biomass burning occurs annually during the dry season between the months of August and October (Fig. 1d). We focus our analysis on the month of peak aerosol optical depth (AOD), September, between 2002 and 2019, and we confine the analysis to an area (15 to 1∘ S, 70 to 52∘ W) collocated with a region of climatologically high AOD (Fig. 1a). AERONET stations at the Rio Branco and Alta Floresta sites provide information on the single-scattering albedo (SSA) of the aerosol throughout the analysis period. These sites are situated at opposite ends of the analysis region and are collocated with the climatologically highest regions of AOD (Fig. 1a). Histograms of the daily mean SSA from each station, given at 675 nm, are shown in Fig. 1e. Both stations show SSA675 ranging from values as low as 0.85 to 0.98, with a peak around 0.93. This is consistent with in situ local observations of smoke optical properties (Palácios et al., 2020; Rosário et al., 2011), providing good evidence that the aerosol in this analysis period and domain absorbs smoke strongly. Note that mineral dust has an SSA closer to 1 at this wavelength (Di Biagio et al., 2019). We would therefore expect ARI-mediated impacts via absorption of solar radiation to be a viable mechanism in this region.
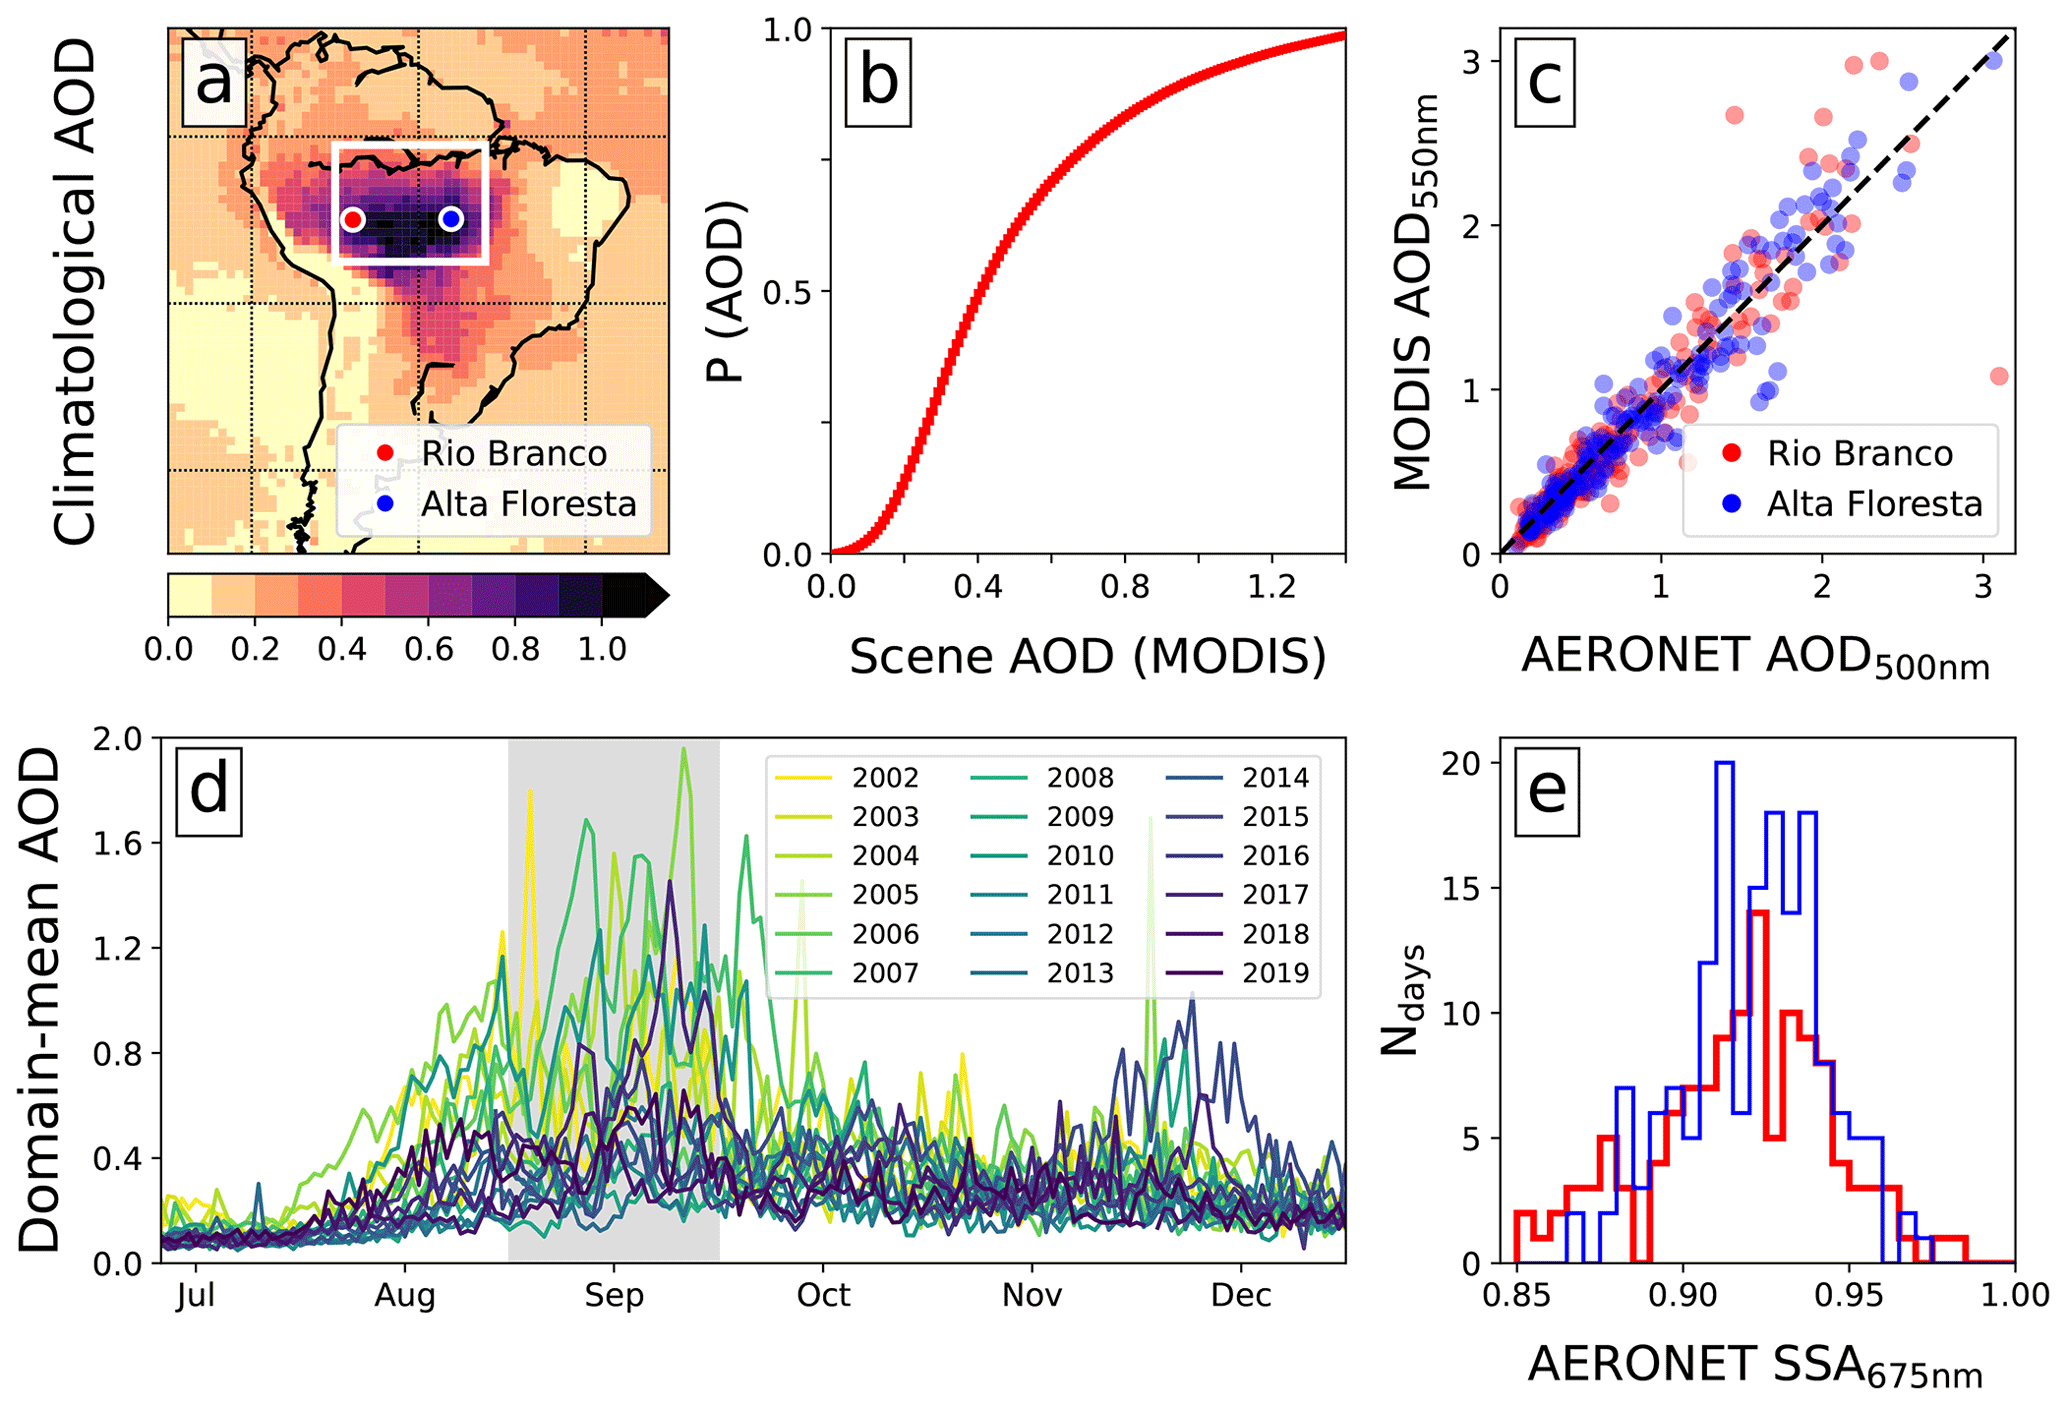
Figure 1Information on the climatological AOD and SSA in the region during the analysis period of 2002 to 2019: (a) MODIS AOD climatology for September, (b) cumulative probability of occurrence of gridded MODIS AOD in the analysis domain (white box in a), (c) collocated AERONET and daily mean MODIS-retrieved AOD at the two stations shown in (a), (d) time series of daily mean AOD from MODIS-AQUA over the analysis region (time series only shown between July and December for clarity), and (e) histograms of the daily mean SSA at 675 nm from the two AERONET stations. MODIS AODs are given at a wavelength of 550 nm, and AERONET AODs are given at a wavelength of 500 nm.
2.2 Satellite and reanalysis products
In this study, we primarily use data products from the MODIS, CERES, and AIRS instruments on board AQUA and TERRA satellites. This is complemented by precipitation information from the Global Precipitation Measurement (GPM) level 3 Integrated Multi-satellitE Retrievals for GPM (IMERG) dataset and by meteorological information from ERA5 reanalysis. A brief overview of the variables extracted from each dataset is presented below, with full details in Table S1 in the Supplement.
MODIS-AQUA and TERRA. We use the MODIS collection 6.1 1∘ level 3 products (AQUA: MYD08_D3; TERRA: MOD08_D3) for instantaneous retrievals of AOD (given at 550 nm) and cloud properties, including total cloud fraction (CFtotal), liquid cloud fraction (CFliquid), LWP, IWP, total water path (TWP), cloud top temperature (CTT) and height (CTH), cloud optical thickness (COT) of both liquid and ice (COTtotal) and liquid only (COTliquid), ice cloud droplet effective radius (REice), and cirrus fraction (CFcirrus). The morning TERRA overpass is at ∼ 10:30 LST, and the afternoon AQUA overpass is at ∼ 13:30 LST. We also use the level 2 products MYD04_L02, MOD04_L02, MYD06_L02, and MOD06_L02 to obtain aerosol and cloud properties at a finer resolution (10 km) for comparison with the coarser-scale level 3 dataset.
CERES top-of-atmosphere fluxes. Top-of-atmosphere fluxes of radiation for the incoming solar (SOLTOA), shortwave (SWTOA), longwave (LWTOA), and net (NETTOA) components on a 1∘ grid are taken from the CERES level 3 data product, SSF1Deg-1H, which provides instantaneous fluxes on board AQUA and TERRA satellites.
AIRS. The AIRS daily level 3 product, AIRS3STD, is used to provide daily mean values of total column water vapour (QVcolumn), surface-level specific humidity (QVsurface), and surface-level relative humidity (RHsurface).
IMERG precipitation. Daily accumulated precipitation estimates (Paccum) on a 0.1∘ grid are taken from the IMERG dataset (3B-DAY_MS_MRG_3IMERG_V06). A second dataset (3B-HHR_MS_MRG_3IMERG_V06B) provides 30 min temporal resolution estimates at 0.1∘ resolution, which are used to determine cumulative precipitation in the morning (PAM; 07:00–12:00 LST) and afternoon (PPM; 14:00–19:00 LST) and peak precipitation rate during the diurnal cycle (Ppeak).
ERA5 reanalysis. Daily mean 850 hPa horizontal winds and 2 m temperature (T2 m) on a 1∘ grid are taken from the ERA5 reanalysis dataset for spatial collocation with satellite observations; horizontal wind components are used to determine the wind direction (degrees from due north). Daily mean fields of 850 hPa specific humidity (QV850) and temperature (T850) are also taken from the dataset to obtain large-scale environmental conditions upstream of the domain, discussed in Sect. 3.6; mean values are determined over a region off the east coast of South America (20∘ S to 5∘ N, 35 to 30∘ W), roughly 5 d upstream of the prevailing winds (see Supplement).
2.3 Collocating datasets
All data are analysed on a regular 1∘ grid. MODIS, CERES, AIRS, and ERA5 datasets are provided on a 1∘ grid, so they are readily collocated spatially, and IMERG data are regridded onto a 1∘ grid. CERES instantaneous TOA fluxes and MODIS products each have separate datasets for TERRA and AQUA overpasses and are temporally collocated in the analysis. Daily mean ERA5 horizontal winds, describing the large-scale daily mean flow, are selected for each corresponding day of the time series, and daily mean AIRS and IMERG daily Paccum and Ppeak data are similarly selected. PAM and PPM are collocated with the TERRA and AQUA datasets, respectively. Although AIRS provides instantaneous retrievals, we use the retrieved atmospheric water variables to describe the large-scale environmental properties; as such, we do not require the higher temporal resolution.
For this study, we are primarily interested in how widespread properties of the atmosphere change with AOD. We use AOD as a proxy for the availability of aerosols that can influence clouds both via ARI and ACI, thereby assuming that as AOD increases linearly, so does the number of aerosols that act as CCN and interact with radiation. For ARI, this assumption is reasonable if the source and size distribution stay relatively constant as AOD increases. As the primary source of aerosols in this region is biomass burning, with AOD increasing linearly with the frequency of fires (Ten Hoeve et al., 2012), this is, to first order, a reasonable approximation. This can be similarly applied to the availability of CCN, but the number activated is also dependent on properties of the atmosphere, namely the updraught speed. Herbert et al. (2021) used in situ observations from field campaigns over the Amazon and found a positive, albeit non-linear, relationship between AOD and cloud droplet number concentration (CDNC). However, this is confounded by any changes to the distribution of vertical velocities as AOD changes. Given the inherent non-linearity and confounding factors between AOD and CDNC, we can only say that AOD is a reasonable proxy for the availability of CCN.
In this analysis, representation error may arise from the fact that AOD retrievals are made in clear-sky conditions, whereas cloud properties are necessarily in cloudy sky. Wet scavenging is known to impact the column loading of aerosols (Gryspeerdt et al., 2015). Therefore, can we be confident that the AOD retrievals are representative of the underlying conditions impacting the clouds? As precipitation predominantly occurs within the afternoon period, a comparison of AOD retrieved in the TERRA and AQUA overpasses provides some information as to whether we may expect wet scavenging to strongly influence the AOD. Figure S1 in the Supplement shows that there is very little systematic bias between the two overpasses, even though precipitation has likely occurred in some of the scenes, therefore giving us confidence that clear-sky retrievals of AOD are representative of the widespread AOD. A second source of potential bias may arise from the retrieval of AOD in cloudy conditions. The presence of aerosols in the vicinity of clouds can impact the retrieval of both properties: enhanced humidity close to clouds can cause aerosols to swell, elevating the AOD retrievals, whilst aerosols embedded within or below clouds may be misidentified as cloud, thereby modifying the retrieved cloud optical properties. Finally, very high loadings of aerosols may be misidentified as cloud. These are well-known sources of retrieval bias; as such, cloud-masking algorithms are continually refined to separate the influence of the two. The MODIS cloud mask product in the collection 6 variants, used in this study, is constructed using 1 km scale pixels and employs multi-spectral tests to identify heavy aerosol loading. Aerosol retrievals are made in clear-sky pixels, with collection 6.1 using the Dark-Target and Deep-Blue aerosol retrieval algorithms, designed to take into account the underlying surface properties. These well-maintained and extensively evaluated products (e.g. Wei et al., 2019; Huang et al., 2019; Zhang et al., 2022; Levy et al., 2013; Platnick et al., 2017) provide a robust dataset of collocated aerosol and cloud properties but may not remove all bias. Therefore, to support our analysis, we will pay particular attention to aerosol–cloud misclassification, especially at high cloud fractions. We achieve this by first comparing the MODIS retrievals of AOD with those from two AERONET stations (below), and later in Sect. 4, we repeat the analysis with level 2 data products, where we find the same conclusions.
In previous studies (e.g. Koren et al., 2004; Yu et al., 2007), scenes where cloud fraction exceeds 0.8 have been removed to avoid AOD retrieval uncertainty, yet in this study, we do not do so in order to preserve the data and to avoid potential bias to the properties of the cloud field. This ensures that we are considering the response of the atmosphere over the region as a whole rather than over a subset. If clouds strongly influenced the retrieved AOD, then independent retrievals from AERONET, able to take measurements throughout the day, would highlight biases. A spatially and temporally collocated comparison of AOD retrieved from two AERONET stations (Rio Branco and Alta Floresta), with mean MODIS AOD shown in Fig. 1c, gives confidence that MODIS AOD retrievals are not biased high in the presence of high cloud coverage. This is consistent with the low biases reported by Wei et al. (2019) and Sayer et al. (2019), who additionally show evidence that South America has one of the lowest regional biases between the two datasets, partly due to the performance of the MODIS AOD retrievals over forested land.
The vertical profile of aerosols is a difficult property to measure on the scales that we are interested in, yet previous studies (e.g. Koch and Del Genio, 2010) have shown that the position of smoke in relation to clouds can greatly impact the cloud rapid adjustments and ERF. Most significantly, when smoke is elevated above clouds, it reduces the scene albedo, thereby driving a positive TOA instantaneous radiative effect. Gonzalez-Alonso et al. (2019) used three remote sensing instruments over 6 years to construct a climatology of smoke heights over the Amazon. The authors found that smoke plumes during September are generally located below 1.5 km, with less than 5 % of smoke plume injection heights observed in the free troposphere. Some studies, focusing on the eastern edge of the Amazon rainforest, have reported the presence of smoke being transported from the African continent at concentrations that often compete with localized sources (Barkley et al., 2019; Holanda et al., 2020). Therefore, although we assume that the smoke in this analysis is predominantly within the BL and from local sources, we caveat that this is not always the case. We discuss the validity of this assumption in Sect. 3.5.
3.1 Liquid water path
The 18-year September climatology shows that there are contrasting LWP–AOD relationships in the morning and afternoon. Figure 2 shows a consistent increase in LWP with AOD for the morning overpass (Fig. 2a); the histogram suggests that the existing clouds become increasingly laden with water as AOD increases. Conversely, the afternoon overpass (Fig. 2b) shows an initial spread of the cloud distribution to higher LWP, followed by a gradual focus towards lower LWP. This behaviour describes an initial enhancement followed by a gradual suppression. The same analysis, performed on the domain mean dataset rather than the 1∘ grid, results in the same relationships (see Fig. S2).
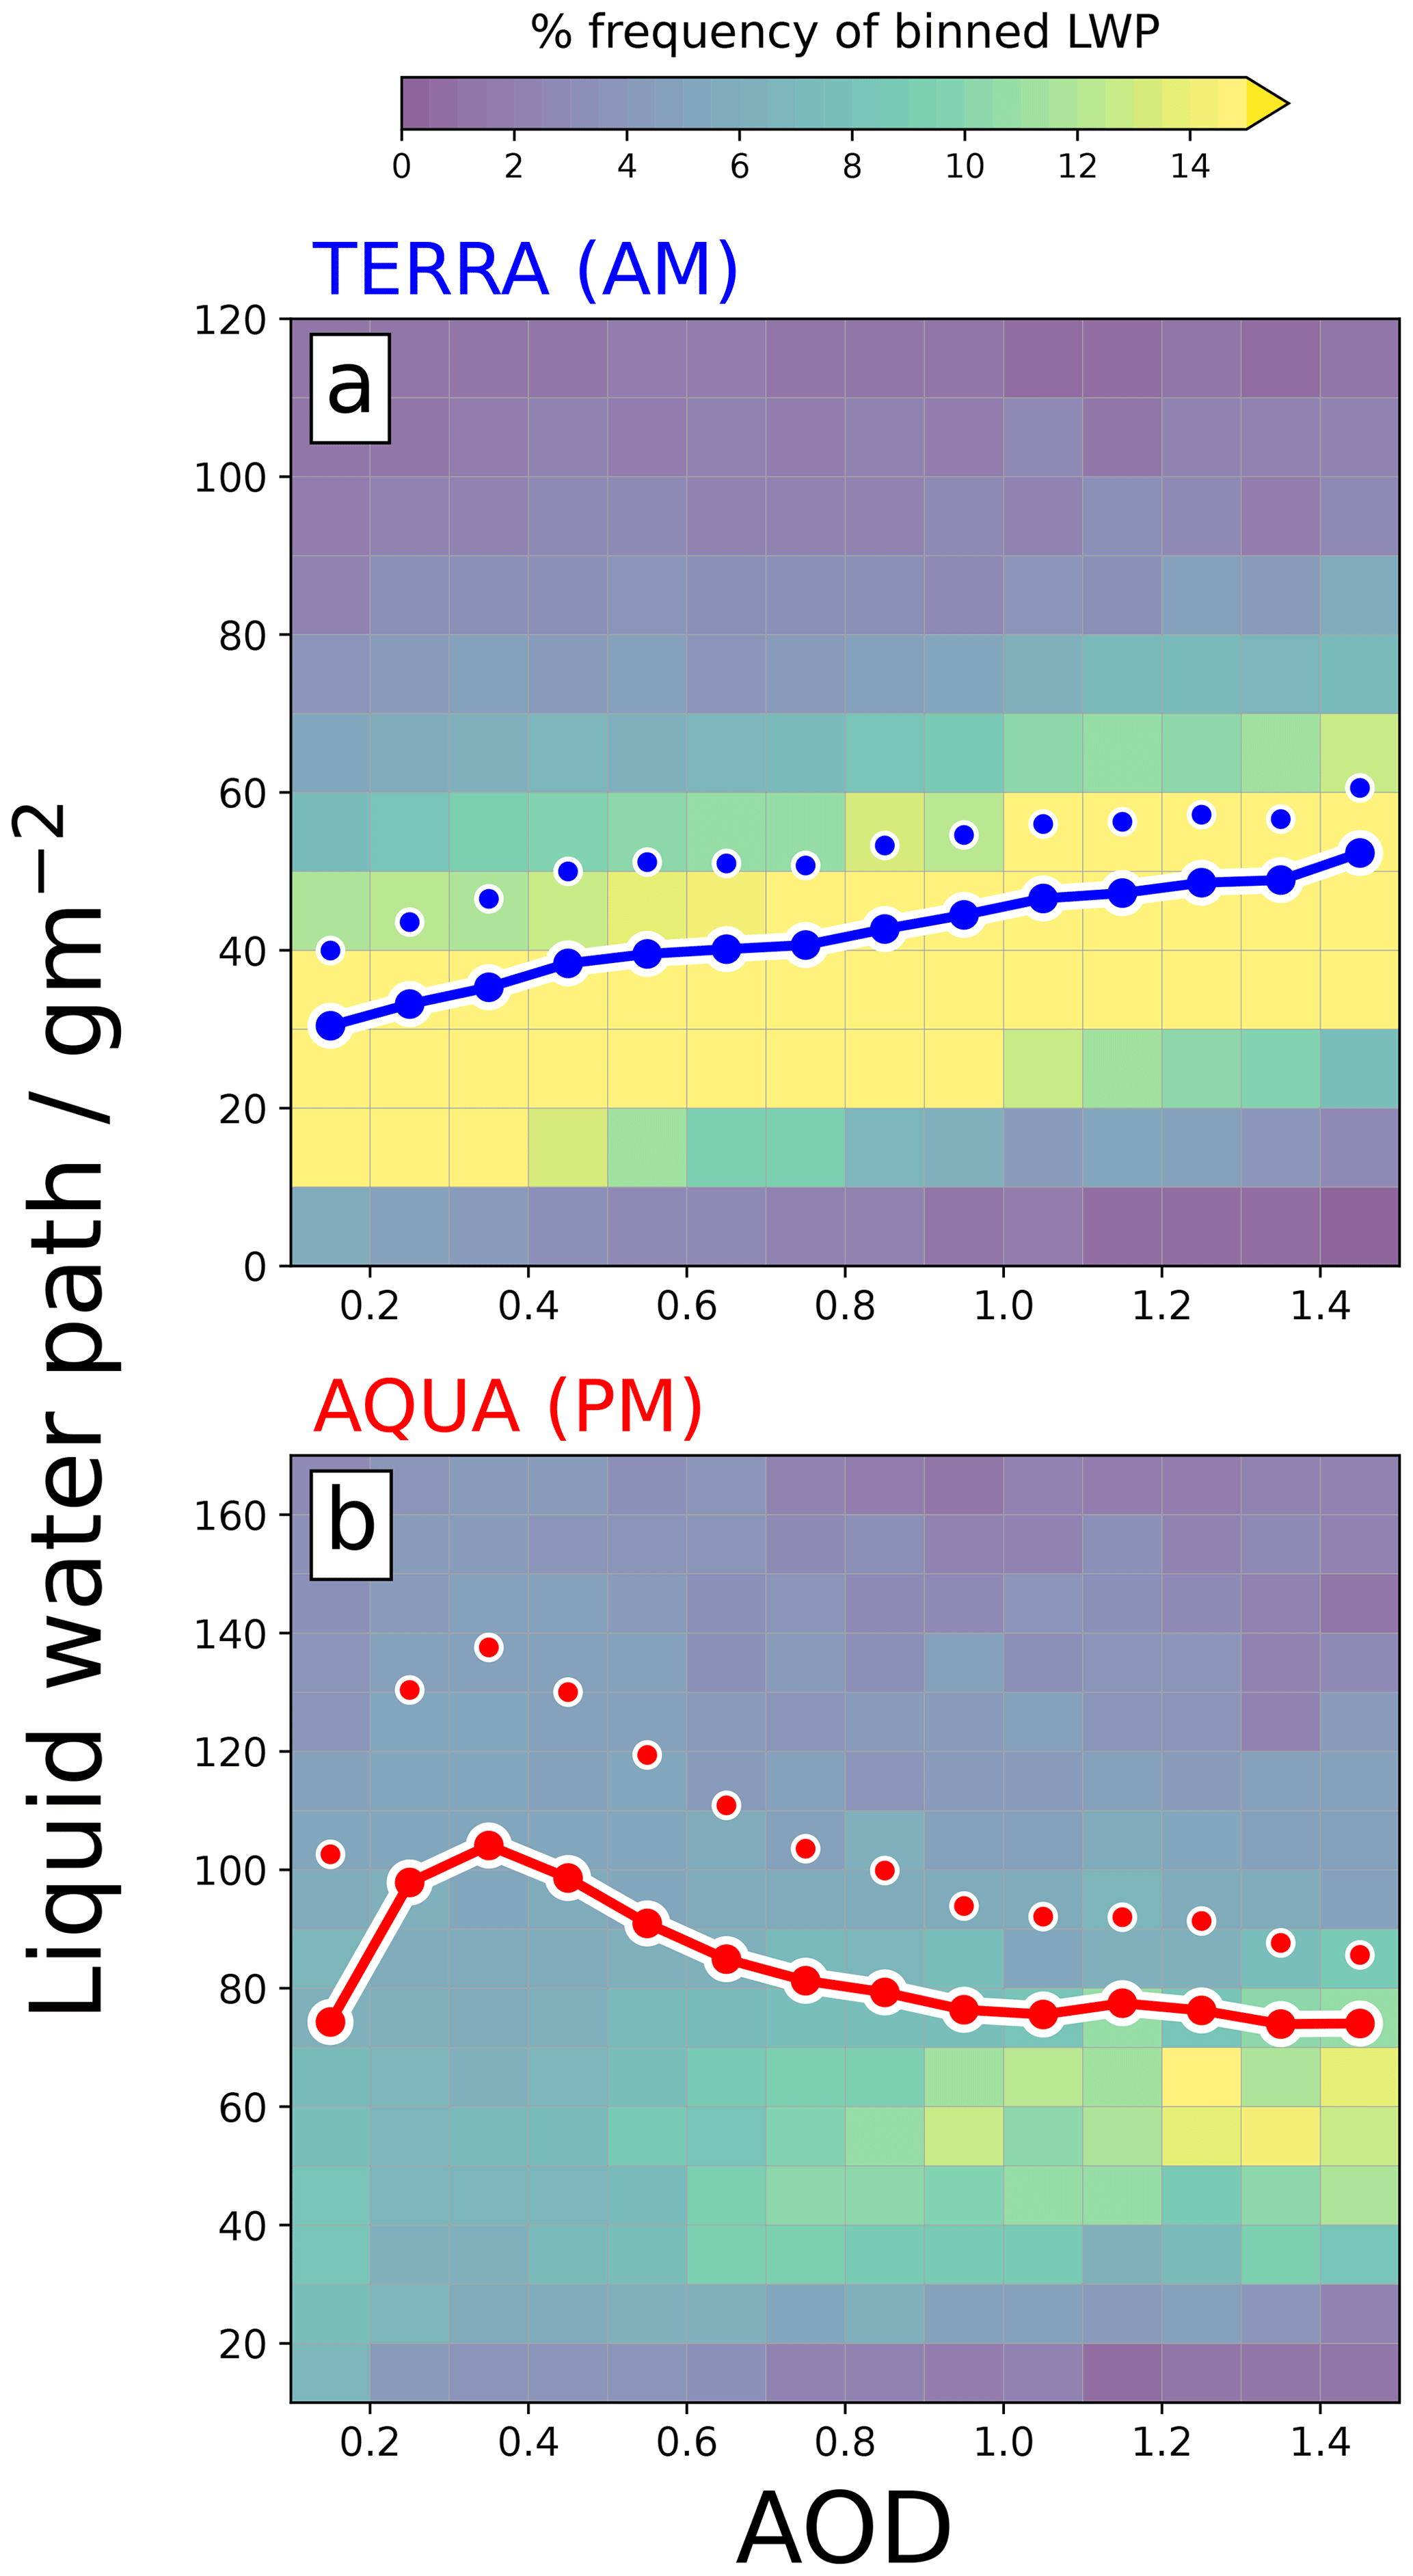
Figure 2MODIS liquid water path as a function of AOD for the (a) morning TERRA overpass and (b) afternoon AQUA overpass. Joint histograms show % frequency of LWP binned by AOD, and coloured lines (individual circles) show the geometric (arithmetic) mean in each AOD bin. Data are only shown for cloudy scenes where LWP > 0.
The contrasting diurnal responses of LWP to AOD are consistent with the high-resolution modelling study from Herbert et al. (2021). In their study, it was found that the domain mean LWP adjustment to an AOD perturbation was positive in the morning (due to widespread modification to the thermodynamic environment) but negative in the afternoon (due to a suppression of convection). The enhanced mean LWP in the morning overpass (Fig. 2a) is consistent with ACI-induced suppression of the warm-rain process, where an increase in CCN from smoke results in more numerous, smaller cloud droplets; this behaviour has been observed in observational (e.g. Twohy et al., 2021; Andreae et al., 2004; Martins and Silva Dias, 2009) and modelling (e.g. Liu et al., 2020; Herbert et al., 2021; Martins et al., 2009) studies. The afternoon AOD dependence in Fig. 2b is well aligned with changes in the convective activity. An increase in CCN availability has been found to promote convection in some studies via ACI adjustments (Fan et al., 2018; Lebo, 2018; Khain et al., 2005; Marinescu et al., 2021), whilst the heat generated from biomass burning has also been found to enhance buoyancy and deep convection (Zhang et al., 2019). ARI adjustments from smoke also impact convection, as the aerosol particles cool the surface and stabilize the boundary layer via elevated heating of the absorbing aerosol, acting to suppress convection. Using a theoretical model, Koren et al. (2004) demonstrated that the competition between ACI and ARI adjustments in deep convective clouds results in an initial enhancement (driven by ACI) for small AOD perturbations, followed by a suppression at higher AOD as ARI adjustments dominate. The observations in this study are consistent with this; Fig. 3a demonstrates that the percentage of the domain that exhibits high TWP loadings (indicative of deep convective clouds) follows this non-linear relationship with AOD. Figure 3b and c additionally show that the non-linearity is reflected in the occurrence of precipitating liquid clouds and in the magnitude of precipitation itself (Paccum and Ppeak). For AOD > 0.4, there is less suppression in the precipitation (Fig. 3b and c) compared to the fraction of domain that shows signs of convective activity (Fig. 3a); this may suggest that, at high AOD, there are fewer deep convective cells, but those that do form are more intense, providing relatively more precipitation per convective cell.
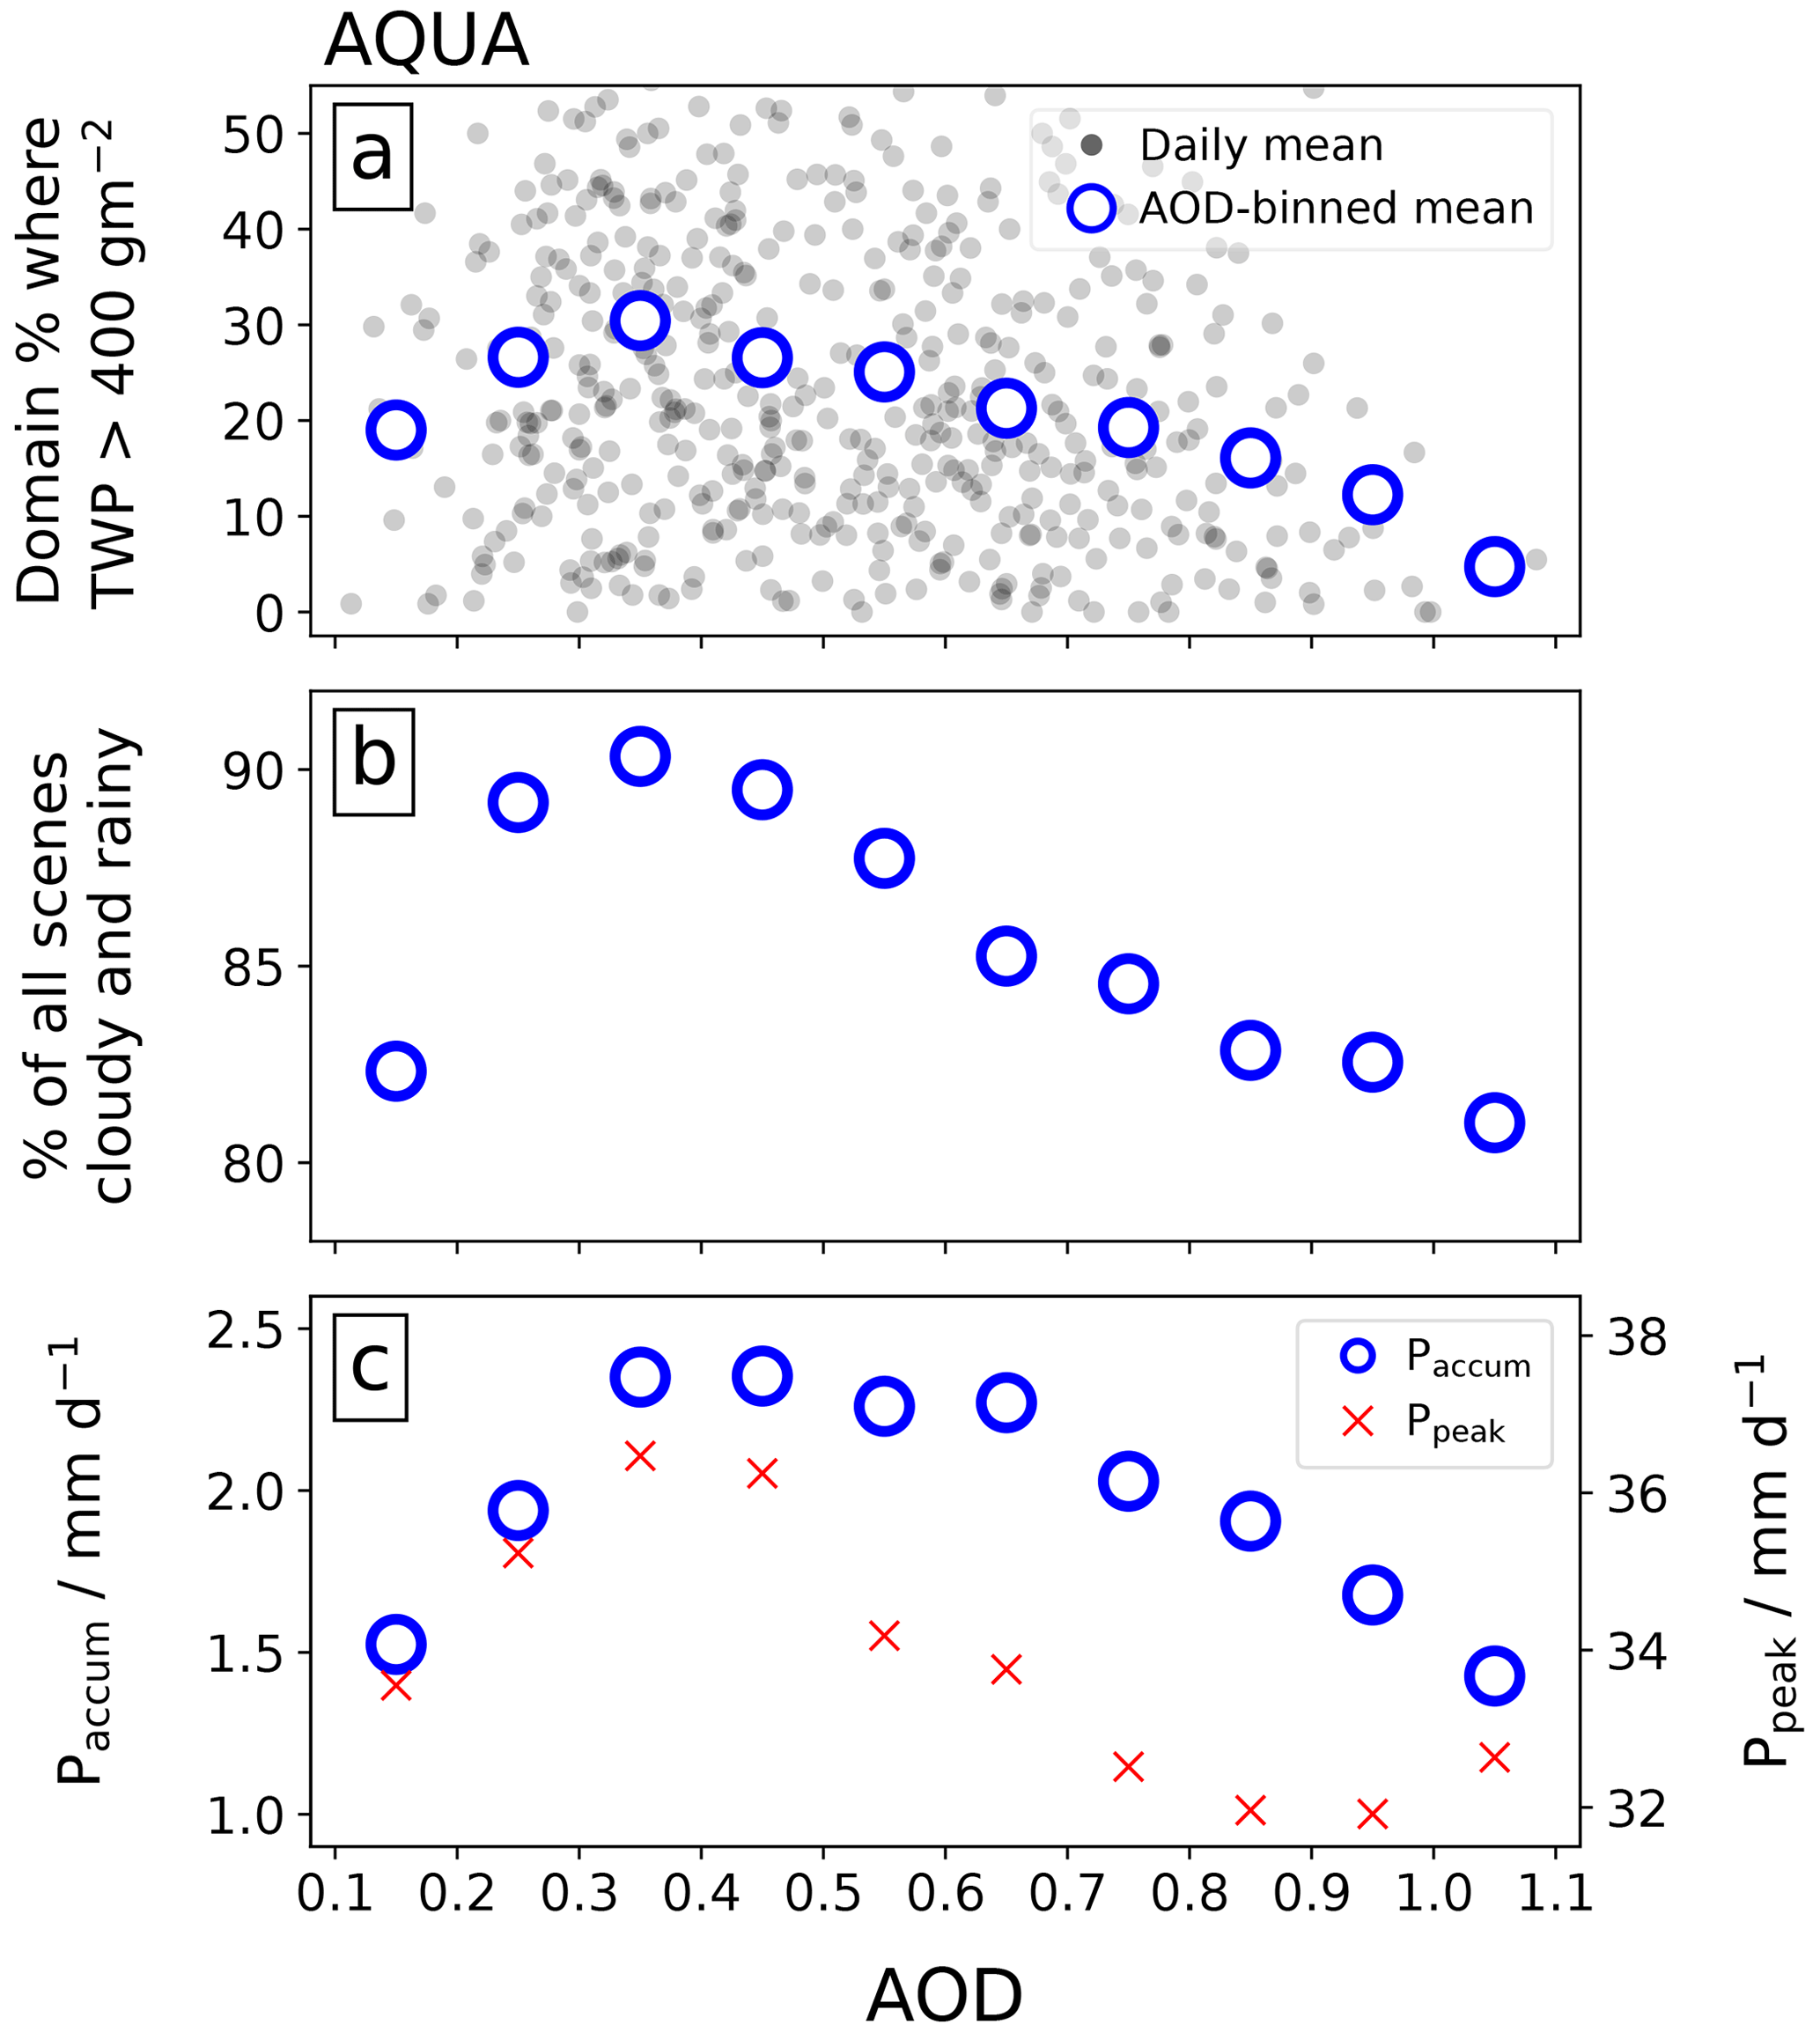
Figure 3Convection and precipitation as a function of AOD: (a) percentage of the domain where TWP > 400 g m−2 as a function of the domain mean AOD for each day (filled grey circles) and the mean of all days binned by AOD (empty blue circles), (b) mean percentage of all scenes that include liquid cloud and precipitation as a function of binned AOD, and (c) mean daily accumulated precipitation (blue circles) and daily peak precipitation (red crosses) in each scene binned by AOD. MODIS data are shown for the AQUA overpass.
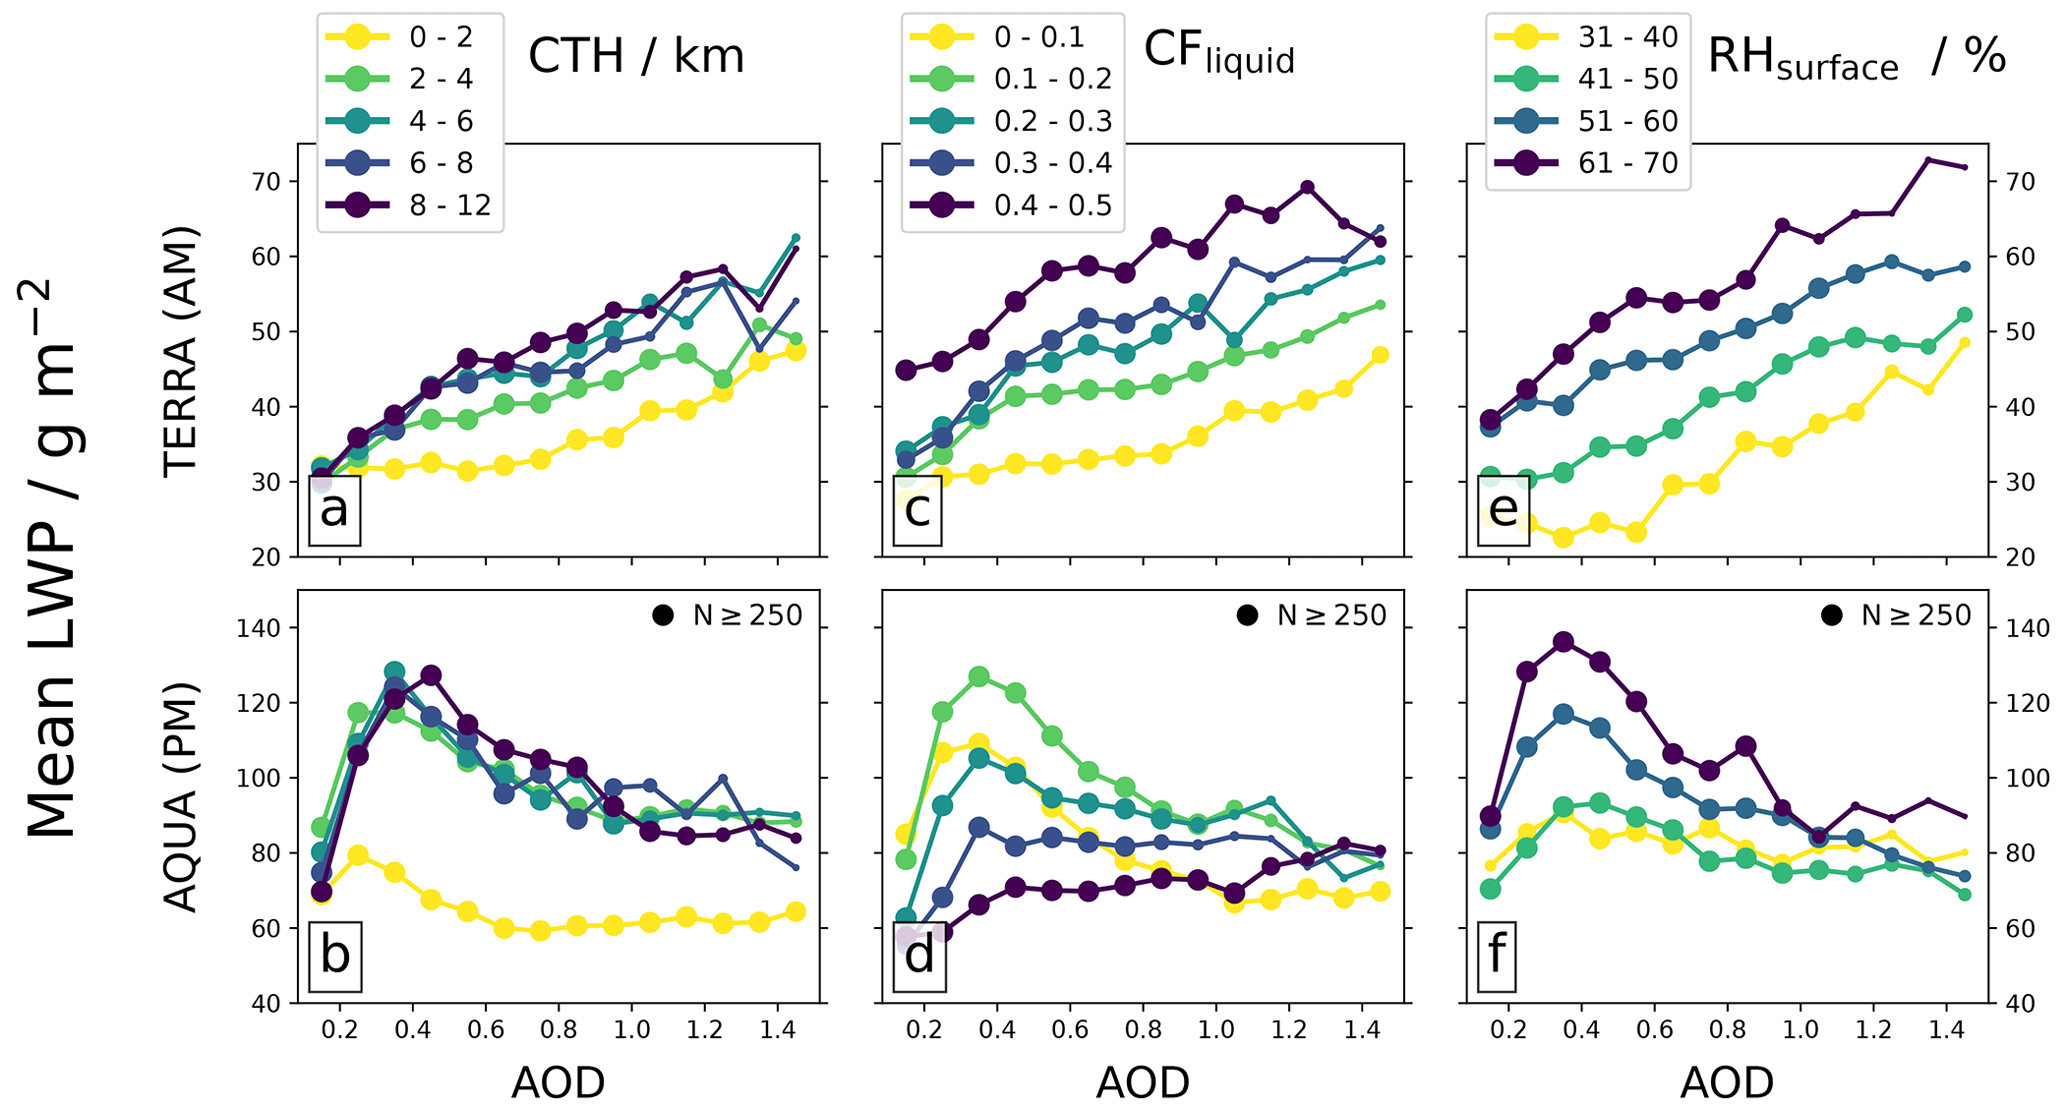
Figure 4Geometric mean LWP as a function of AOD, subset by different cloud or environmental properties: MODIS cloud top height (a–b), MODIS liquid cloud fraction (c–d), and AIRS surface-level RH (e–f). For each plot, the top panel is for the TERRA overpass, and bottom panel is for the AQUA overpass. The size of each circle gives a representation of how many scenes are included in the mean, with a maximum size shown for N ≥ 250.
Subsetting the dataset by CTH, CFliquid, and RHsurface in Fig. 4 demonstrates that the LWP–AOD relationships observed in Fig. 2 persist when constrained by environmental conditions. For the morning TERRA overpass (Fig. 4 top row), the AOD-binned mean LWP increases with AOD for all constrained datasets. CTH (Fig. 4a) and CFliquid (Fig. 4c) show interesting behaviour. For AOD < 0.4, LWP increases sharply for all clouds that extend beyond 2 km and exhibit CFliquid > 0.2, which may indicate mesoscale systems that have persisted overnight. Above this AOD (where we posit that daytime convection is suppressed), the data are predominantly confined to small boundary layer clouds with CFliquid < 0.1 and CTH < 1 km (the smaller marker sizes depict fewer data points), suggesting a link between convective activity during the daytime (Fig. 3) and the development of larger mesoscale systems. Subsetting by RHsurface (Fig. 4e) shows a consistent and positive LWP–AOD relationship, which suggests that the increase in LWP is driven by changes in cloud properties (ACI) rather than by the environment. The AQUA overpass in the afternoon (Fig. 4 bottom row) provides more evidence that the mean response is controlled by the initial enhancement (AOD < 0.4) and then the suppression (AOD > 0.4) of convective activity. First, all clouds that exceed CTH of 2 km display an almost-identical relationship with LWP (Fig. 4b), with this subset of clouds typically being representative of locations that contain cells of deep convection. Second, lower CFliquid scenes (Fig. 4d) show greater sensitivity to AOD and greater magnitudes of LWP. This can be explained by appreciating that deeper convective clouds will contain more cloud condensate in the ice phase and will therefore not be retrieved as liquid cloud (subsetting IWP by CFtotal confirms this) – low-CFliquid scenes with high loadings of LWP thereby indicate regions with intense convective cells. Subsetting by RHsurface demonstrates that the environmental conditions play a role in the LWP–AOD relationship and are likely mediated by the connection between boundary layer moisture, convective available potential energy (CAPE), and convective activity (a similar relationship was observed by Ten Hoeve et al. (2011) for COTliquid). The response of RHsurface to AOD will be discussed in Sect. 3.4.
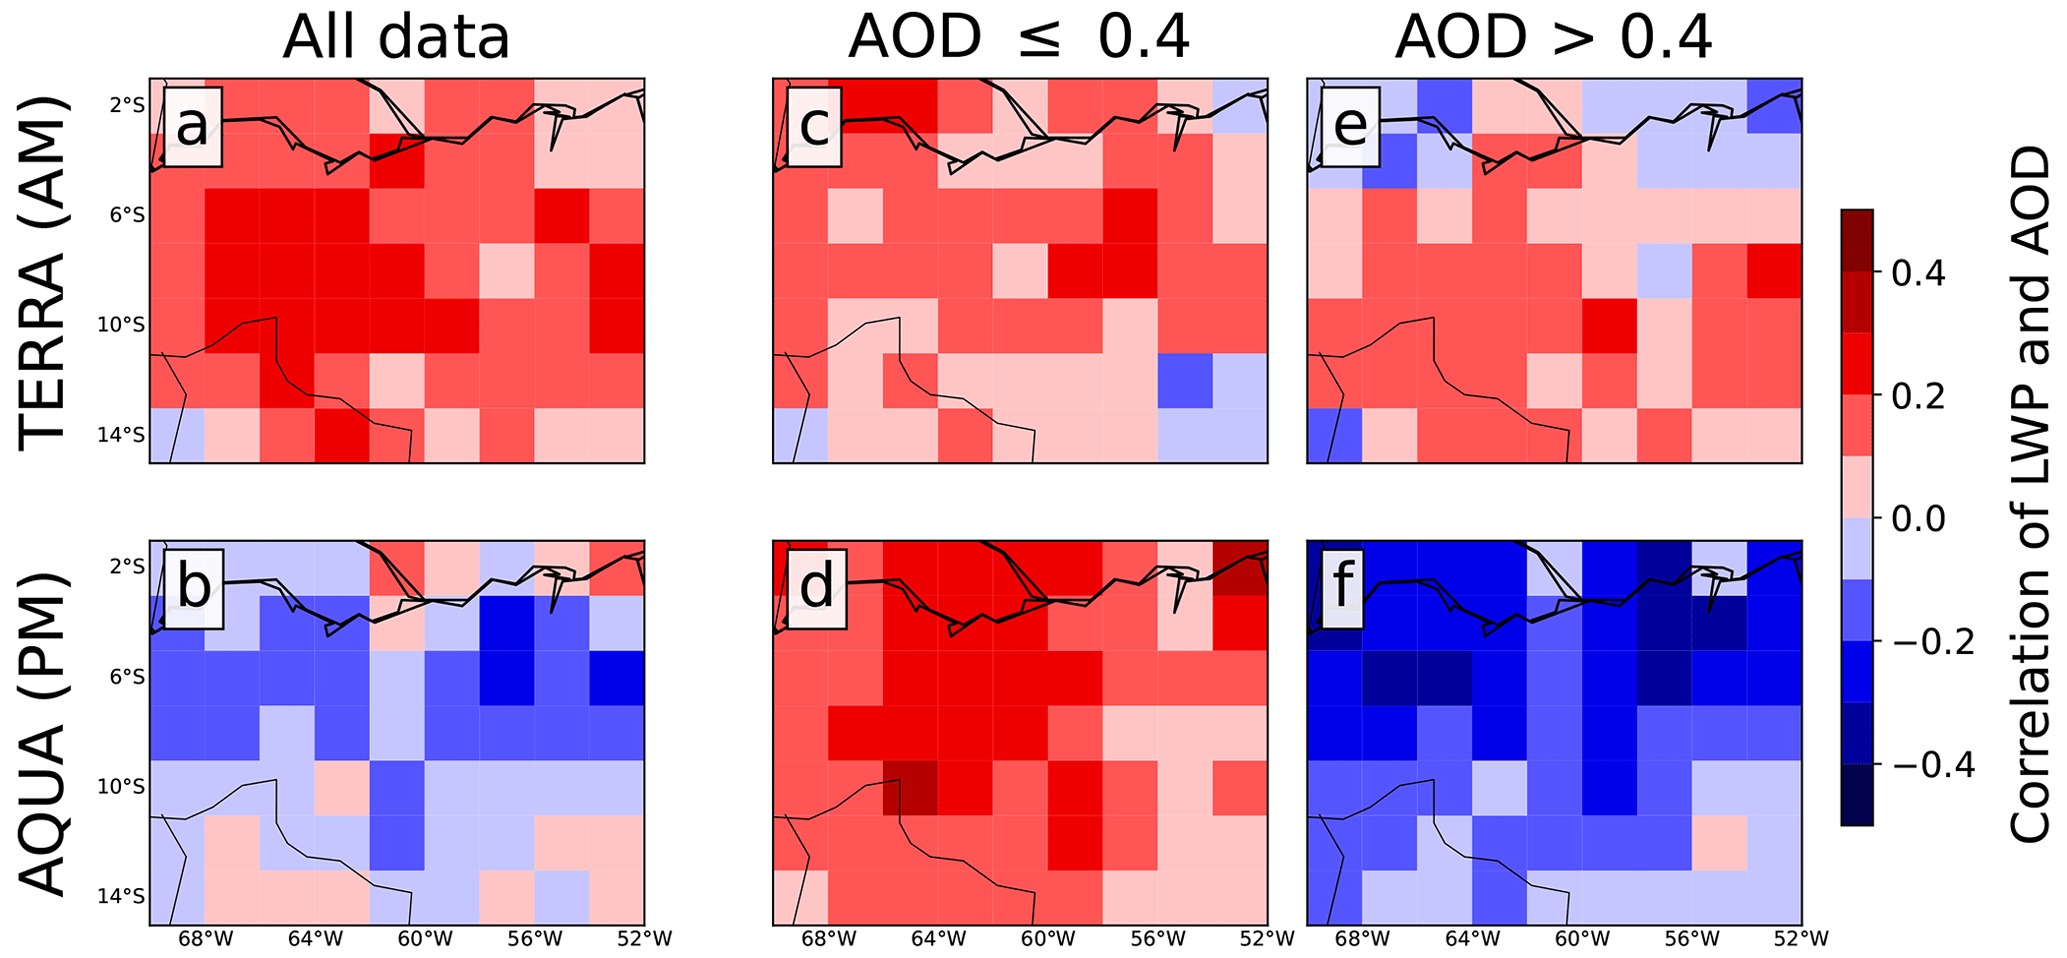
Figure 5Pearson's correlation coefficient between LWP and AOD. The top row (a, c, e) shows the TERRA overpass in the morning, and the bottom row (b, d, f) shows the AQUA overpass in the afternoon. The left column (a, b) shows the spatial distribution of the coefficient for all data, the middle column (c, d) shows data for AOD ≤ 0.4, and the right column (e, f) shows data for AOD > 0.4. Red colours depict a positive correlation, and blue colours depict a negative correlation.
Is this response spatially consistent? If not, it may suggest that we are seeing different regions of the domain influencing the mean and masking any underlying AOD relationship. Figure 5 shows the Pearson's correlation coefficient between LWP and AOD across the domain (regridded from 1 to 2∘ resolution to increase the number of data points). The TERRA correlation apparent in Fig. 2a suggests a consistent positive relationship throughout the range of AOD, which is also observed across the domain in Fig. 5a with positive (albeit small) correlation coefficients throughout. For the AQUA overpass, we also see a consistent correlation, as observed in Fig. 2 – for AOD ≤ 0.4, the correlation is consistently positive across the domain (Fig. 5d), and for AOD > 0.4, it is consistently negative throughout the domain (Fig. 5f).
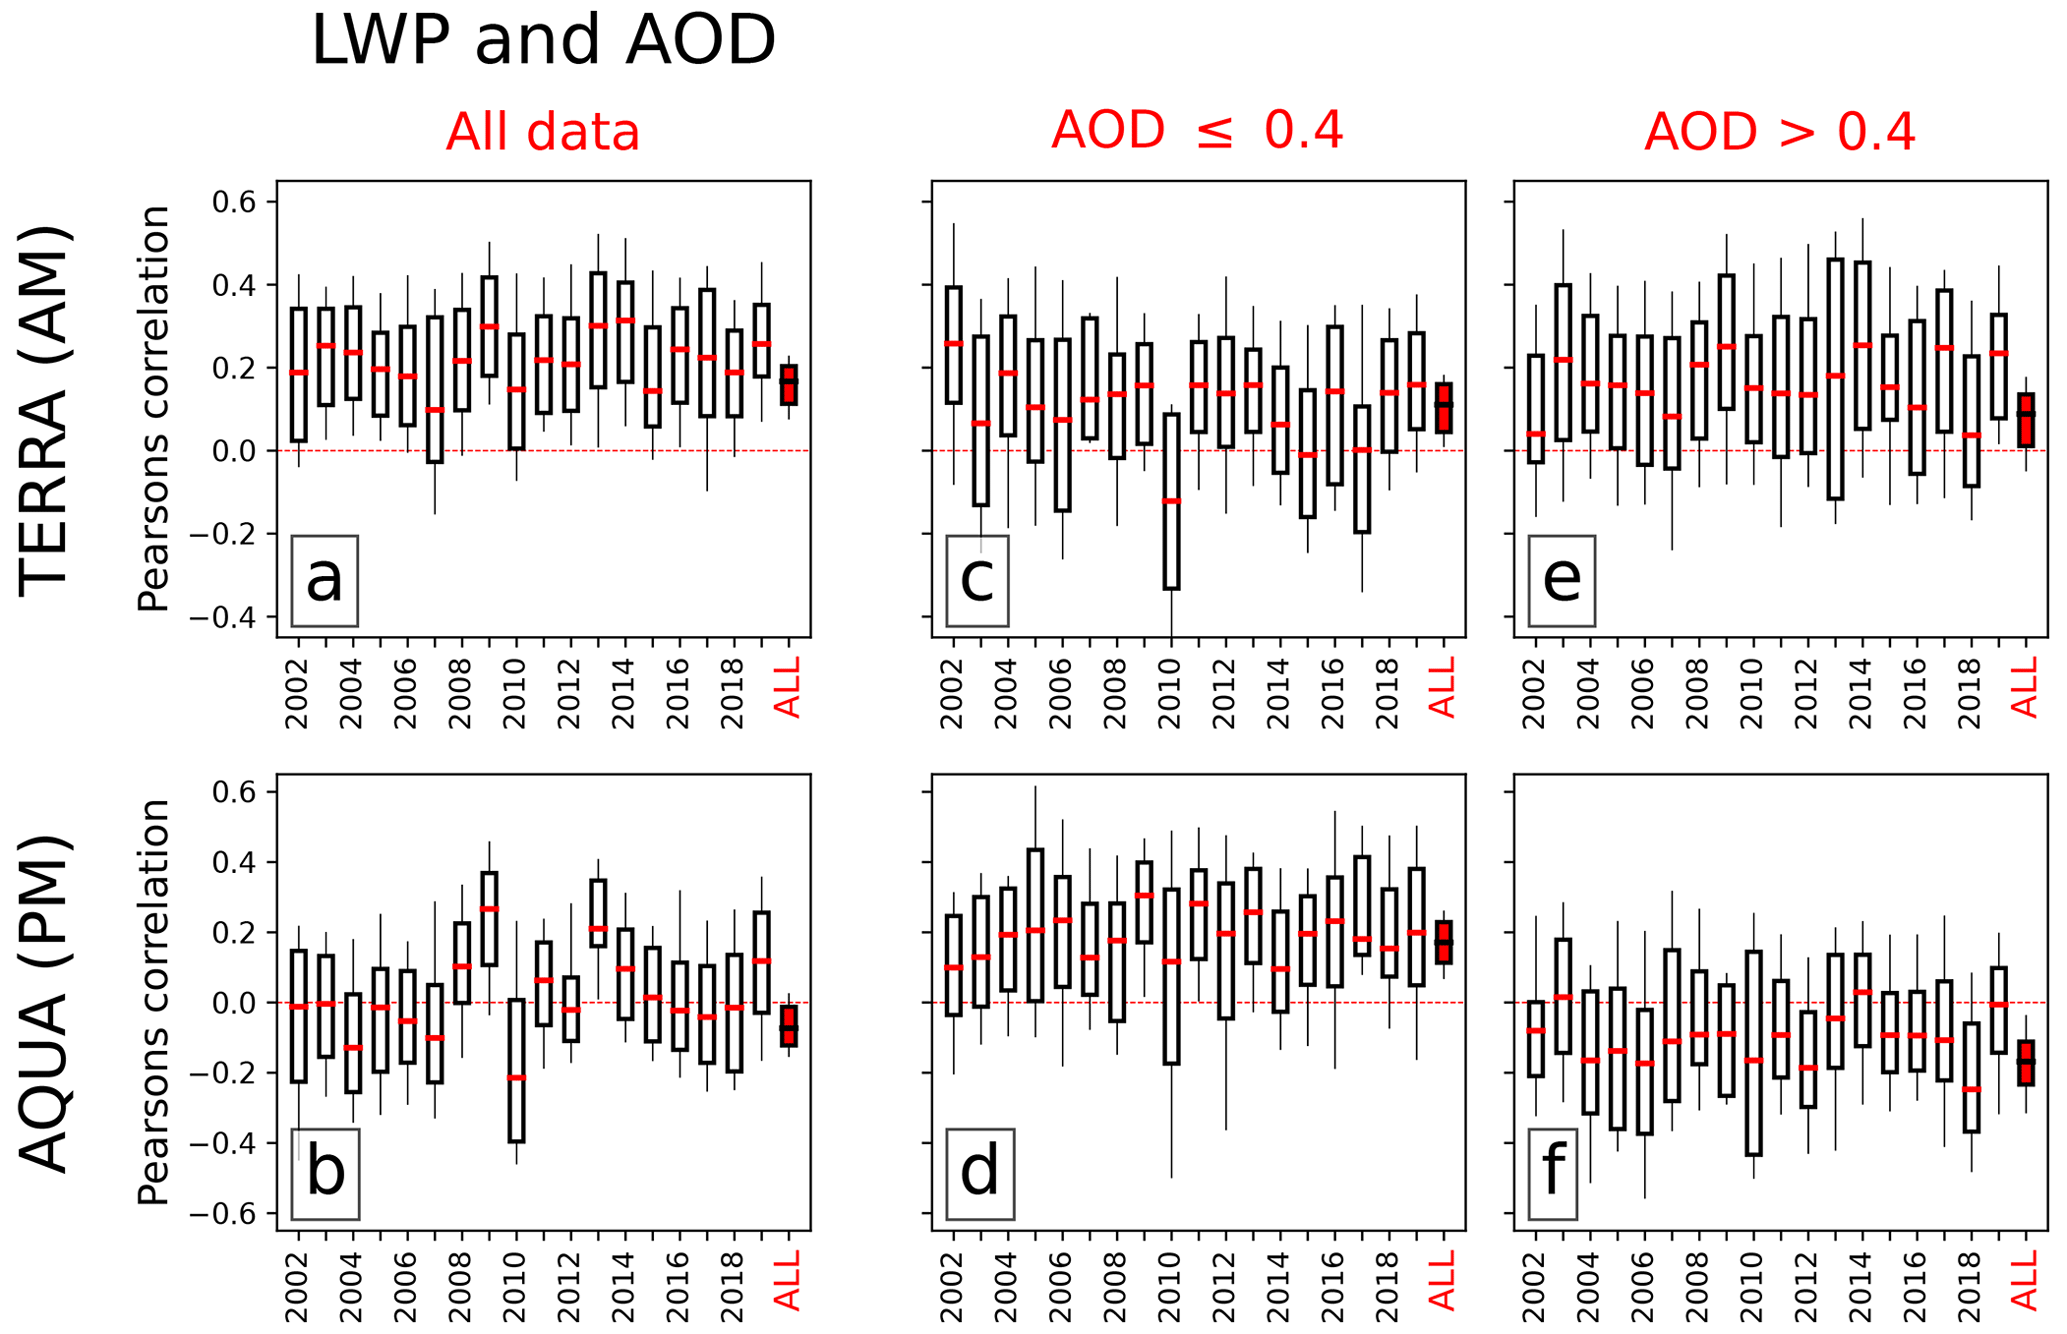
Figure 6Boxplots showing Pearson's correlation coefficients in the domain for the September of each individual year during the time series. Rows and columns are as in Fig. 5. The rightmost boxplot (in red) in each subplot shows the data for all years.
The interannual variability in the LWP–AOD relationship during September is shown in Fig. 6 (also see Fig. S3). Here, the correlation coefficients are similarly determined throughout the domain (as in Fig. 5), but now, data are additionally subset for each year. The TERRA overpass shows a positive LWP–AOD relationship (for all AOD) over the entire time series (Fig. 6a), with some degree of interannual variability. Note the final boxplot using the entire 18-year time series, demonstrating the benefit of using a long time series. The AQUA afternoon overpass shows more interannual variability, though it still shows a consistent relationship below (Fig. 6d) and above AOD = 0.4 (Fig. 6f). A possible explanation for the additional variability is whether the LWP response is connected to the enhancement or suppression of convective cells; the CAPE and other environmental conditions required for triggering deep convection would be sensitive to larger-scale drivers and would thus influence the number of convective cells on any given day, month, and year. As shown in Fig. 4f, the LWP response in the afternoon is particularly sensitive to the RHsurface (moisture content is a key component of CAPE). In Sect. 3.6, we will provide evidence suggesting that the LWP–AOD relationships presented here are not driven by large-scale external drivers and are primarily an internalized response to AOD.
3.2 Ice water path and effective radius
The simulations from Herbert et al. (2021) showed pronounced increases in IWP and ice–cloud coverage which had important implications for the longwave TOA radiative effect due to smoke. Figure 7 shows the mean IWP and REice retrieved from MODIS binned by AOD. For the IWP in the morning overpass (Fig. 7a), there is an overall positive relationship, with > 50 % increase in IWP from AOD = 0.2 to AOD = 1.0. The AQUA overpass (Fig. 7b) shows initial enhancement of IWP up to AOD = 0.4 followed by a consistent negative relationship. In both timeframes, the geometric mean displays a maximum IWP response to AOD of +50 %, though there is considerably more sensitivity to AOD in the afternoon. This behaviour is closely correlated to the LWP–AOD relationships (Fig. 2). Enhanced LWP in the morning from a suppressed warm-rain process allows more condensate to reach the freezing level, and in the afternoon, changes in convective activity will have a direct influence on the amount of condensate reaching the freezing level.
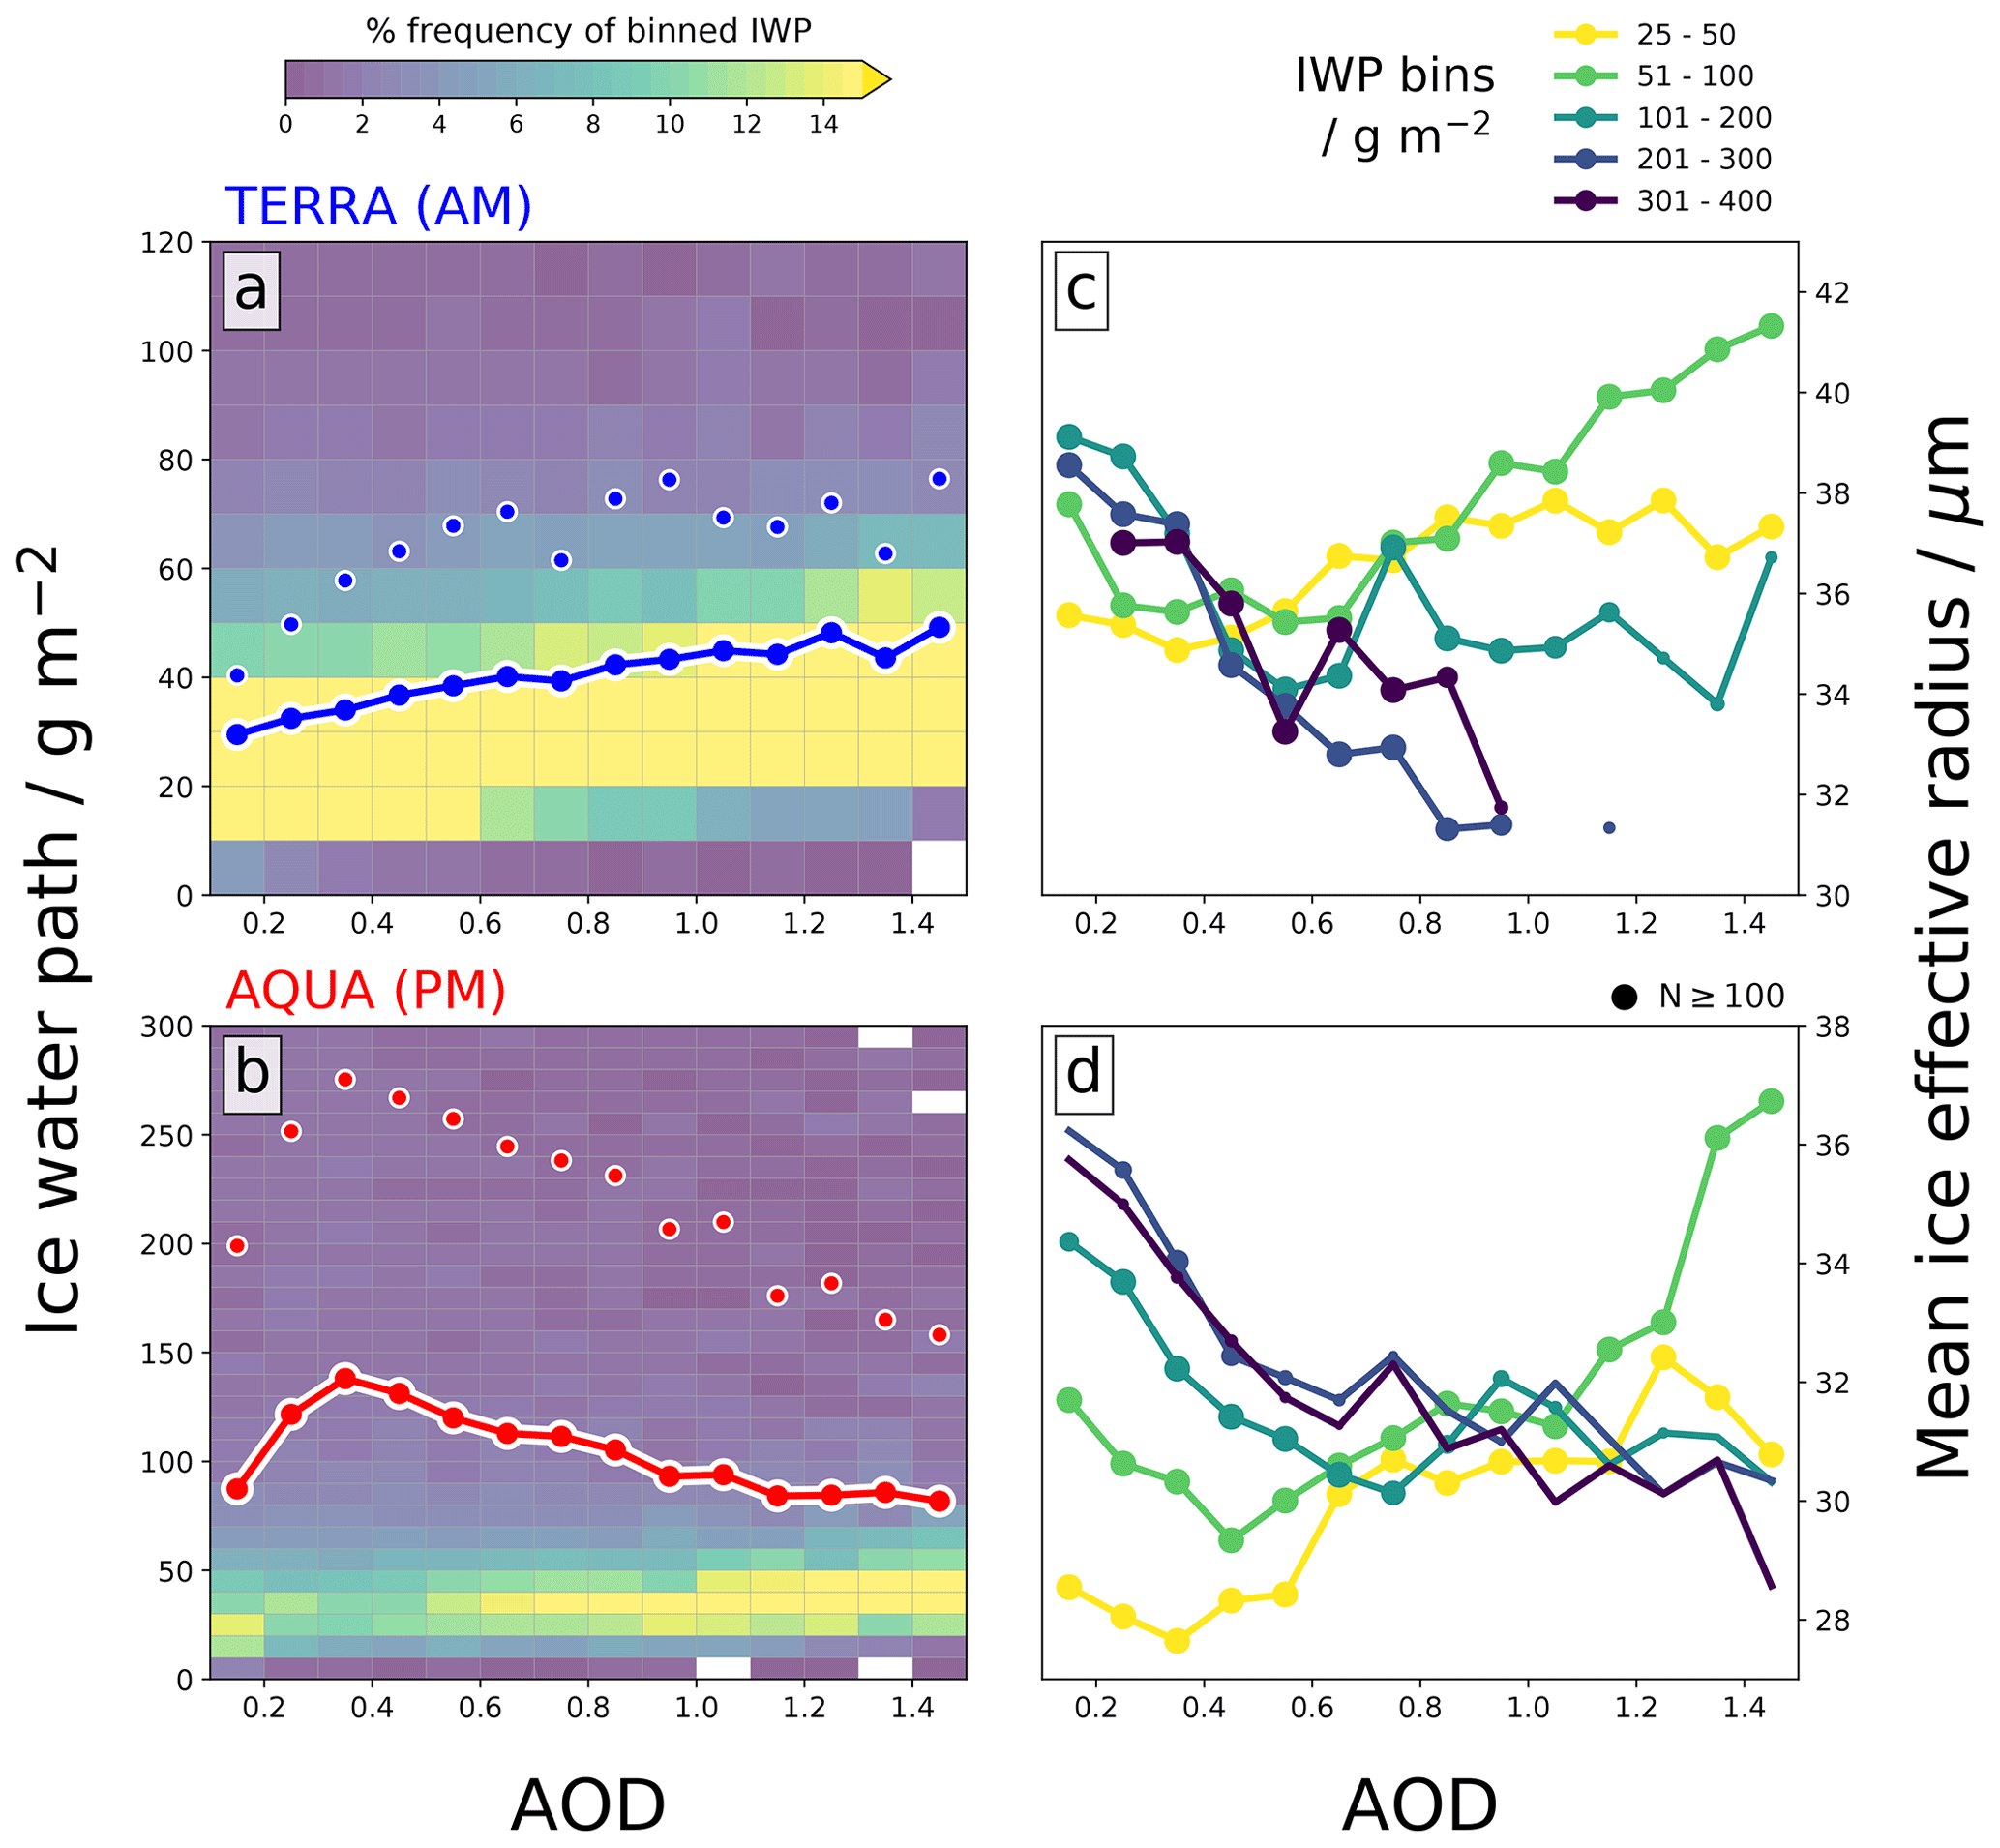
Figure 7MODIS ice water path (IWP) as a function of AOD (a, b) and MODIS mean ice effective radius binned by IWP as a function of AOD (c, d) for the TERRA (a, c) and AQUA overpasses (b, d). Joint histograms show % the frequency of IWP binned by AOD, and coloured lines (individual circles) show the geometric (arithmetic) mean in each AOD bin.
REice provides information on the cloud top ice particle size distribution; Fig. 7c and d show mean REice as a function of AOD for bins of IWP. For AOD < 0.4, REice decreases with AOD for all IWP bins during both overpasses, whilst at AOD > 0.4, REice increases for low-IWP scenes and continues to decrease for high-IWP scenes. This behaviour suggests that, for deep convective clouds associated with high IWP, increasing AOD and the availability of CCN results in smaller ice particle sizes at the cloud top. A possible explanation is ACI effects resulting in a larger CDNC of smaller droplet sizes at the freezing level; smaller ice particles increase the longevity of deep convective outflow and high-altitude cloud coverage (Wendisch et al., 2016). Lower-IWP scenes (< 100 g m−2) generally show an increasing REice with AOD; these scenes may be associated with weakly convective regions dominated by shallower convection. This contrasting behaviour is consistent with the findings of Zhao et al. (2019), who found that ice particle size decreased for strongly convective regions and increased for moderately convective regions (when going from clean to polluted conditions), which occurred due to the different freezing pathways dominant in each type of convection.
3.3 Cloud fraction
Changes to the cloud coverage over a region strongly influence the TOA radiative response. Subsetting CFliquid and CFtotal to low- (0.0 < AOD < 0.2), mid- (0.3 < AOD < 0.5), and high-AOD (0.8 < AOD < 1.0) scenes in Fig. 8 demonstrates widespread modifications to the cloud field over the region, which occur alongside the changes in LWP.
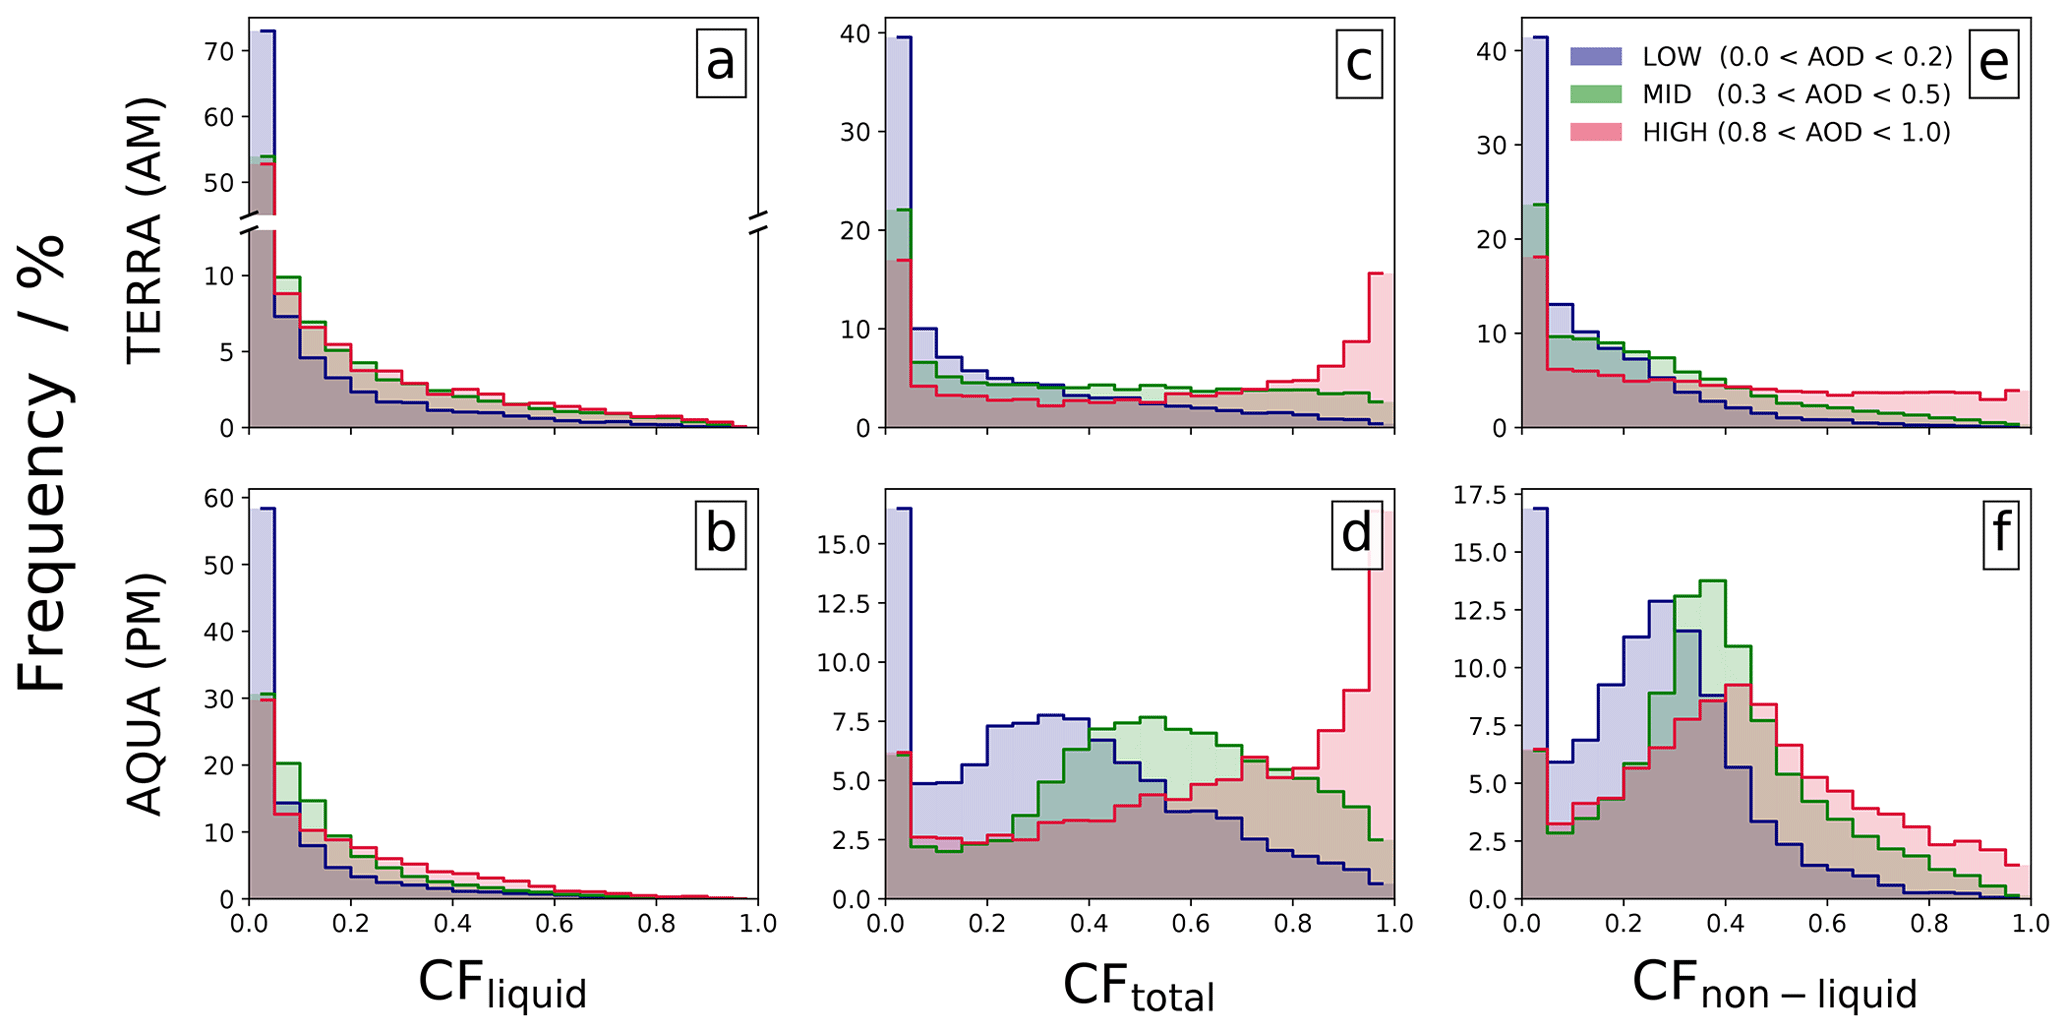
Figure 8Normalized probability of occurrence of CFliquid (a–b), CFtotal (c–d), and CFnon-liquid (e–f) for low- (0.0 < AOD < 0.2), mid- (0.3 < AOD < 0.5), and high (0.8 < AOD < 1.0) AOD scenes. The top row shows the TERRA overpass in the morning, and the bottom row shows the AQUA overpass in the afternoon. Note the break in the y axis in panel (a).
The relative percentage of cloud-free scenes (CF < 0.05) in both overpasses and all cloud phases strongly decreases for AOD > 0.2. CFliquid in the morning (Fig. 8a) is well aligned with LWP (Fig. 2a) and a suppression of precipitation, promoting cloudiness. There is little change going from mid- to high-AOD scenes, suggesting a saturation effect of CFliquid, though the cloud LWP (Fig. 2a) continues to increase; this could be associated with a widespread and robust drying of the boundary layer as AOD increases (see Sect. 3.4). In the afternoon, CFliquid is similarly well correlated with the LWP–AOD relationship and convective activity. For mid-AOD scenes, the enhanced convection drives an increased frequency of liquid cloud coverage over much of the distribution (Fig. 8b). At higher AOD loadings, there is a suppression of convection which promotes the occurrence of liquid cloud retrievals (fewer and/or weaker convective cells result in reduced mixed-phase cloud coverage). This result may have important implications for the TOA radiative response, as liquid clouds are more radiatively opaque than ice clouds (Cesana and Storelvmo, 2017).
CFtotal (Fig. 8c–d) demonstrates widespread sensitivity of the Amazon to the presence of AOD, with clear shifts in the cloud field distribution that correlate with the changes in convective activity. CFnon-liquid (CFtotal − CFliquid) provides information on the non-liquid-phase cloud coverage (Fig. 8e–f). Beginning with the afternoon overpass (Fig. 8d), low-AOD scenes are characterized by ∼ 85 % cloud coverage, with a peak centred around CFtotal = 0.3; this likely correlates with the presence of scattered deep convective cells that extend beyond the freezing level. As convective activity increases with AOD (Fig. 3), the domain becomes cloudier, and the peak occurrence (for mid-AOD) shifts to higher coverage as enhanced convection promotes more numerous and/or more intense cells, increasing the cloud coverage. For high-AOD scenes, the convection is suppressed, promoting the occurrence of extensive CFtotal coverage exceeding 0.8 (aerosol misclassification of cloud was discussed in Sect. 2.3, and we do not believe it heavily influences the coincident high-AOD and high-CFtotal scenes). CFnon-liquid (Fig. 8f) shows that, although convection is suppressed in the high-AOD scenes (lower peak), there is still some convective activity, with a peak centred at higher cloud coverages. This suggests that, under high-AOD conditions, deep convection is less likely, but when it does occur, it is more intense. This may explain why mean Paccum remains relatively enhanced for AOD > 0.4 (Fig. 3b and c) even though convective activity is less likely (Fig. 3a), although this would require more attention to be confirmed. CFnon-liquid demonstrates that the extensive CFtotal coverage under high-AOD conditions in Fig. 8d is driven by a combination of liquid and non-liquid clouds and is not solely due to extensive cirrus clouds or deep convective anvil outflow. The morning overpass CFtotal and CFnon-liquid (Fig. 8c and e) bear strong similarities to the afternoon overpass: at low AOD, there are preferentially more low-coverage scenes, and at high AOD, there are preferentially more high-coverage scenes. The sensitivity to AOD is primarily driven by the non-liquid phase and is likely associated with the previous day's convective activity; this is most evident under high-AOD scenes and may indicate longer-lived convective systems or more intense cells. The pronounced shift from low- to high-CFtotal occurrence with AOD during both overpasses (Fig. 8c and d) is a consistent feature for all years when individually analysed (see Fig. S4), which suggests that this is a causal relationship rather than an artefact of co-varying meteorology, which is more likely to exhibit interannual variability. This will be explored further in Sect. 3.6.
3.4 Large-scale environment
Changes to the large-scale environments of moisture availability and temperature can influence the formation and evolution of clouds and precipitation. Studies have demonstrated that smoke perturbations may drive widespread changes to these properties (e.g. Yu et al., 2007; Y. Zhang et al., 2008; Lee et al., 2014; Herbert et al., 2021), thus influencing the overall response of the cloud field.
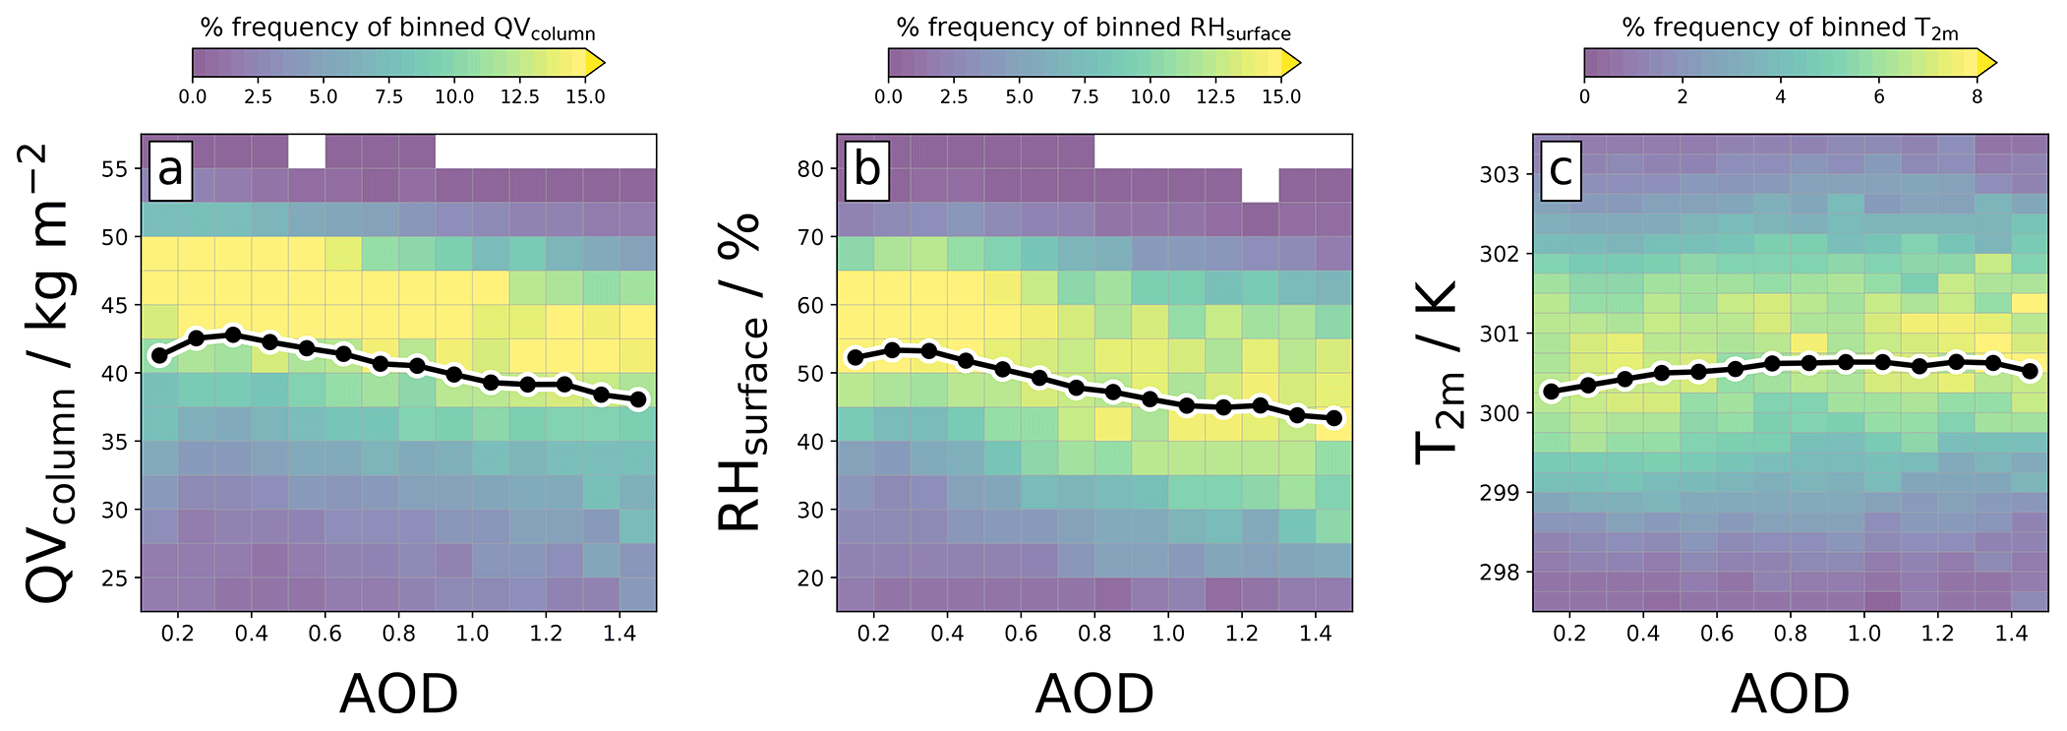
Figure 9Daily mean (a) AIRS total column water vapour (QVcolumn), (b) AIRS surface RH (RHsurface), and (c) ERA5 2 m temperature (T2 m) as a function of AOD. Joint histograms show % the frequency of each variable binned by AOD, and black lines show the mean in each AOD bin.
AIRS observations of total column water vapour (QVcolumn) and relative humidity at the surface (RHsurface), together with ERA5 reanalysis data of the 2 m temperature (T2 m), are collocated with AOD in Fig. 9. The observations suggest that the moisture content of the column and boundary layer (BL) generally decreases as AOD increases, though there is an initial increase at low-AOD values. QVcolumn will be primarily influenced by local changes in precipitation and surface fluxes that modify the water content of the BL. As observed in Figs. 3 and 4, there is an increase in convection and precipitation until AOD = 0.4, followed by a decrease. This relationship correlates well with the QVcolumn sensitivity to AOD in Fig. 9a, though there is more evident suppression of QVcolumn than of Paccum. This may be caused by surface cooling (due to the smoke) reducing surface fluxes of moisture (Y. Zhang et al., 2008), thus enhancing the drying of the BL. The sensitivity of RHsurface is strongly influenced by QVcolumn and displays a similar relationship, though suppression at higher values of AOD is more pronounced, possibly due to an overall warming of the BL. T2 m from ERA5 increases as a function of the AOD; smoke strongly absorbs solar radiation and results in anomalous heating, which may explain the increase. However, T2 m only increases by ∼ 0.5 K over the whole range of AODs, which suggests that other sources influence the temperature. Surface cooling due to the overlying smoke will reduce the surface sensible heat flux, which may counteract some of the heating. The collocated data show that the large-scale environment changes alongside the AOD and is likely driven by changes to the convective activity over the region and by changes to surface fluxes due to ARI processes. The influence of large-scale external drivers on these conclusions is discussed in Sect. 3.6.
3.5 Top-of-atmosphere radiative effects
Collocated all-sky CERES retrievals from both TERRA and AQUA overpasses provide us with the TOA radiative impact of smoke and a means to corroborate previous findings from the MODIS retrievals.
The SWTOA flux is largely determined by the underlying albedo – so is the function of the cloud fraction, cloud optical thickness, AOD, and surface albedo. Figure 10 shows that increases in AOD are correlated with a decrease in net downwards SWTOA (cooling), with a maximum cooling effect of 50 W m−2 in both time periods. In clear-sky conditions, extinction from smoke aerosols results in less solar radiation at the surface and increases outgoing SW radiation. A 1-D radiative transfer model (ecRad; Hogan and Bozzo, 2018) was used to estimate the TOA SW radiative effects due to smoke in the presence of clouds over the Amazon; the output is shown in Fig. S5 in the Supplement. For a typical smoke SSA550 nm of 0.92 over the region (Palácios et al., 2020; Rosário et al., 2011), an AOD perturbation of 1.5 results in an SWTOA clear-sky instantaneous aerosol radiative effect on the order of −40 W m−2, but this is strongly offset towards positive values when even small cloud coverage is present (see Fig. S5). Therefore, although the presence of smoke aerosols potentially contributes towards the negative correlation in SWTOA, the changes to cloud properties are likely the primary driver of the observed relationship.
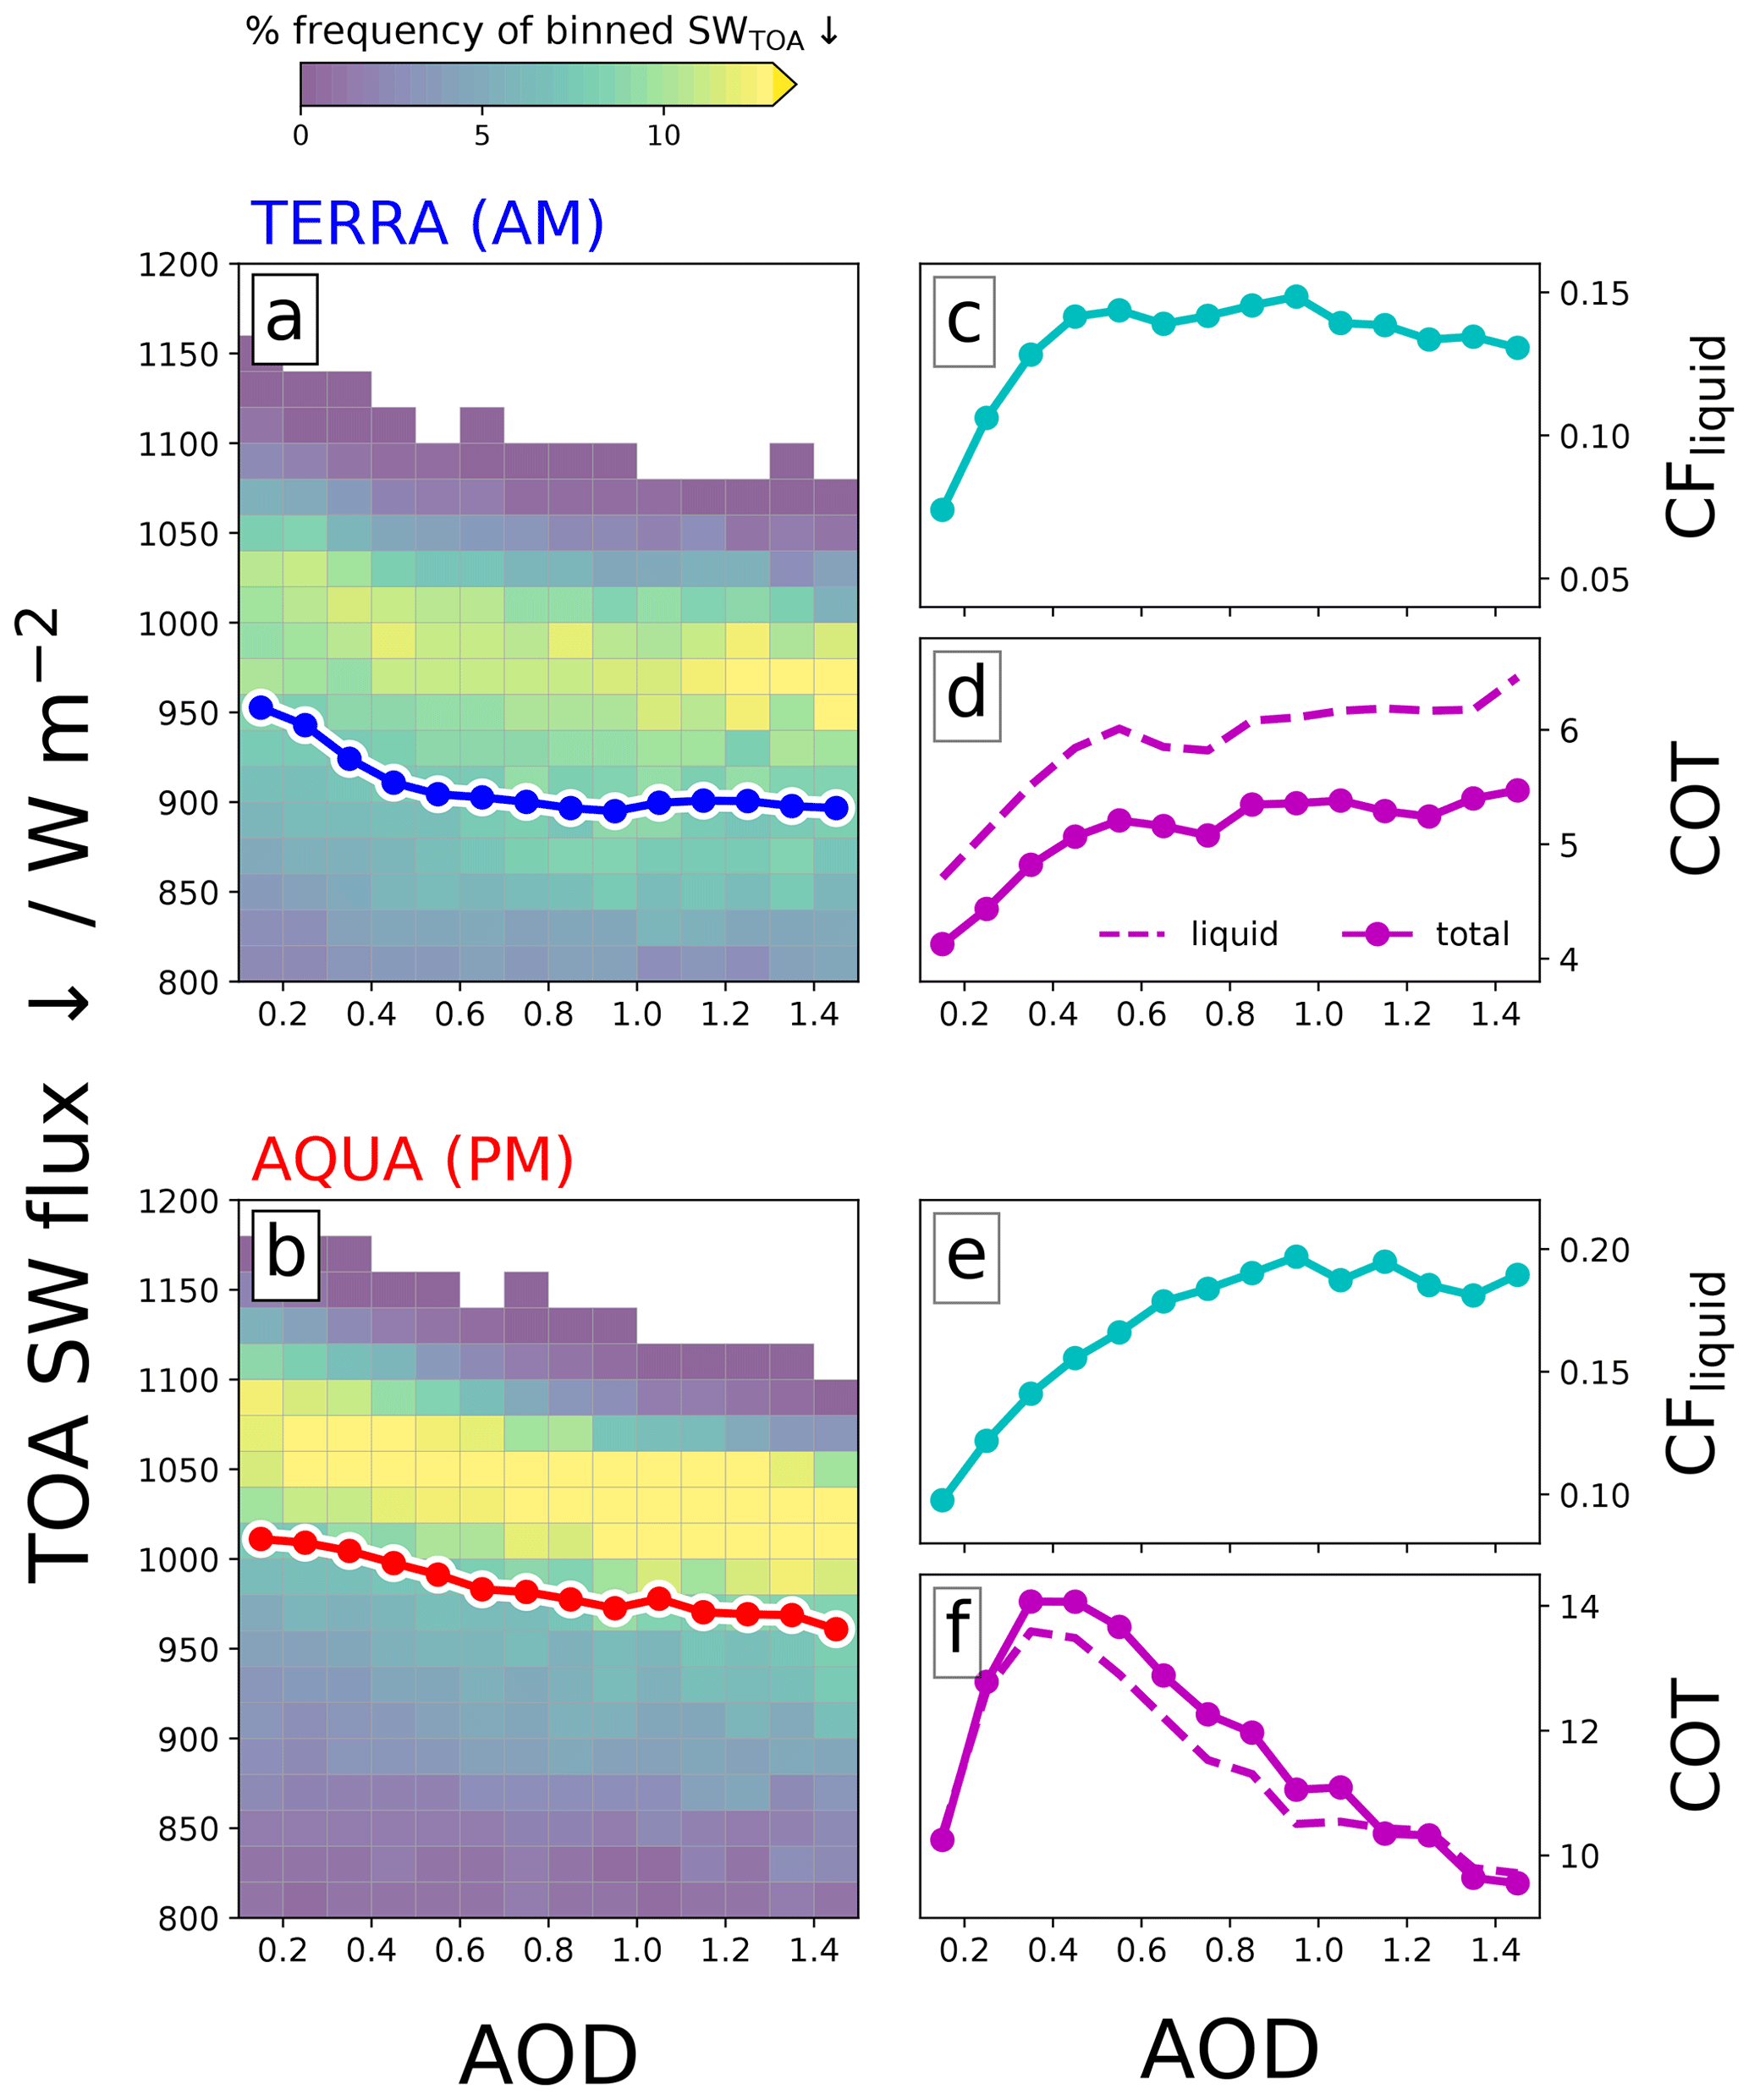
Figure 10CERES TOA net downward SW flux as a function of AOD (a–b) for the morning TERRA overpass (a) and the afternoon AQUA overpass (b). Joint histograms show % frequency of SWTOA binned by AOD, and coloured lines show the mean in each AOD bin. The column on the right (c–f) shows the MODIS-retrieved mean CFliquid (c, e) and the mean COT (d, f) binned by AOD for the corresponding satellite overpasses. COT is shown for both COTtotal (solid) and COTliquid (dashed).
The morning relationship is largely driven by the change in CFliquid across the domain (Fig. 10c), which increases by +100 % at AOD = 0.5 and then slowly decreases. COT (Fig. 10d) gradually increases with AOD and is largely controlled by the change in CFliquid and the increase in cloud LWP (Fig. 2). The afternoon overpass shows a consistent increase in the outgoing SWTOA with AOD, but this is of of smaller magnitude than in the morning. The relationship is well correlated with the MODIS-retrieved CFliquid and COT that have contrasting trends (Fig. 10e and f); CFliquid consistently increases with AOD, whereas for AOD > 0.4, COT counteracts these changes, resulting in a weakly decreasing SWTOA correlation.
These results provide evidence that the SWTOA radiative effect from smoke is strongly influenced by the widespread changes to the cloud regimes in the region via ACI and ARI rapid adjustments. The 2-D histograms in Fig. 10 show considerably more variability in the TERRA overpass than in the AQUA overpass, suggesting that the background state of the cloud field and of the environment in the morning plays an important role in how it responds to the smoke. Conversely, the afternoon is more centred around the impact this has on the convection. The cooling trend also suggests that the smoke is not predominantly elevated above the cloud field. If this were the case, we would expect a reduction in scene albedo as AOD increased, driving a warming trend accentuated by the increasing CFliquid trend. This supports our assumption made in Sect. 2.3 that the smoke is largely confined to the BL.
Changes to the outgoing LWTOA flux will be driven by modification to column-integrated phases of water and their vertical distribution. Figure 11 shows considerable non-linear behaviour between LWTOA and AOD, apparent in both satellite overpasses. Initially, mean LWTOA decreases with AOD until AOD ≈ 0.4, then it increases. The relationship is more apparent in the morning (Fig. 11a) than in the afternoon (Fig. 11b), with reductions in LWTOA of −20 and −10 W m−2, respectively. The behaviour is well explained by the change in MODIS-retrieved CTH, which also correlates well with CFcirrus. The CFcirrus–AOD relationship in both overpasses (Fig. 11d and f) is a result of both modified convective activity in the afternoon (Fig. 3) and changes to the cloud top REice (Fig. 7c and d). At AOD < 0.4, convection is enhanced, and smaller ice particles drive extensive long-lived cirrus clouds, whilst at higher AOD, convection is suppressed (or less frequent) and ice particle sizes tend to be larger, resulting in lower cirrus coverage. The different magnitudes in LWTOA appear to be a feature of the diurnal cycle, with colder mean CTT in the morning than in the afternoon (Fig. 11c and e) driving a stronger sensitivity to AOD for the same decrease in CTT. An interesting feature occurs at high AOD: the mean CTT in both overpasses is the same maximum value at very low and very high AOD, yet CFcirrus does not return to the same coverage. This may be a result of ARI processes heating the smoke layer and environment, increasing the CTT. The LWTOA results demonstrate that convective activity in the afternoon (and modifications as result of smoke) produces long-lived cirrus anvil clouds that persist throughout the night, driving the observed LWTOA–AOD relationship in the morning.
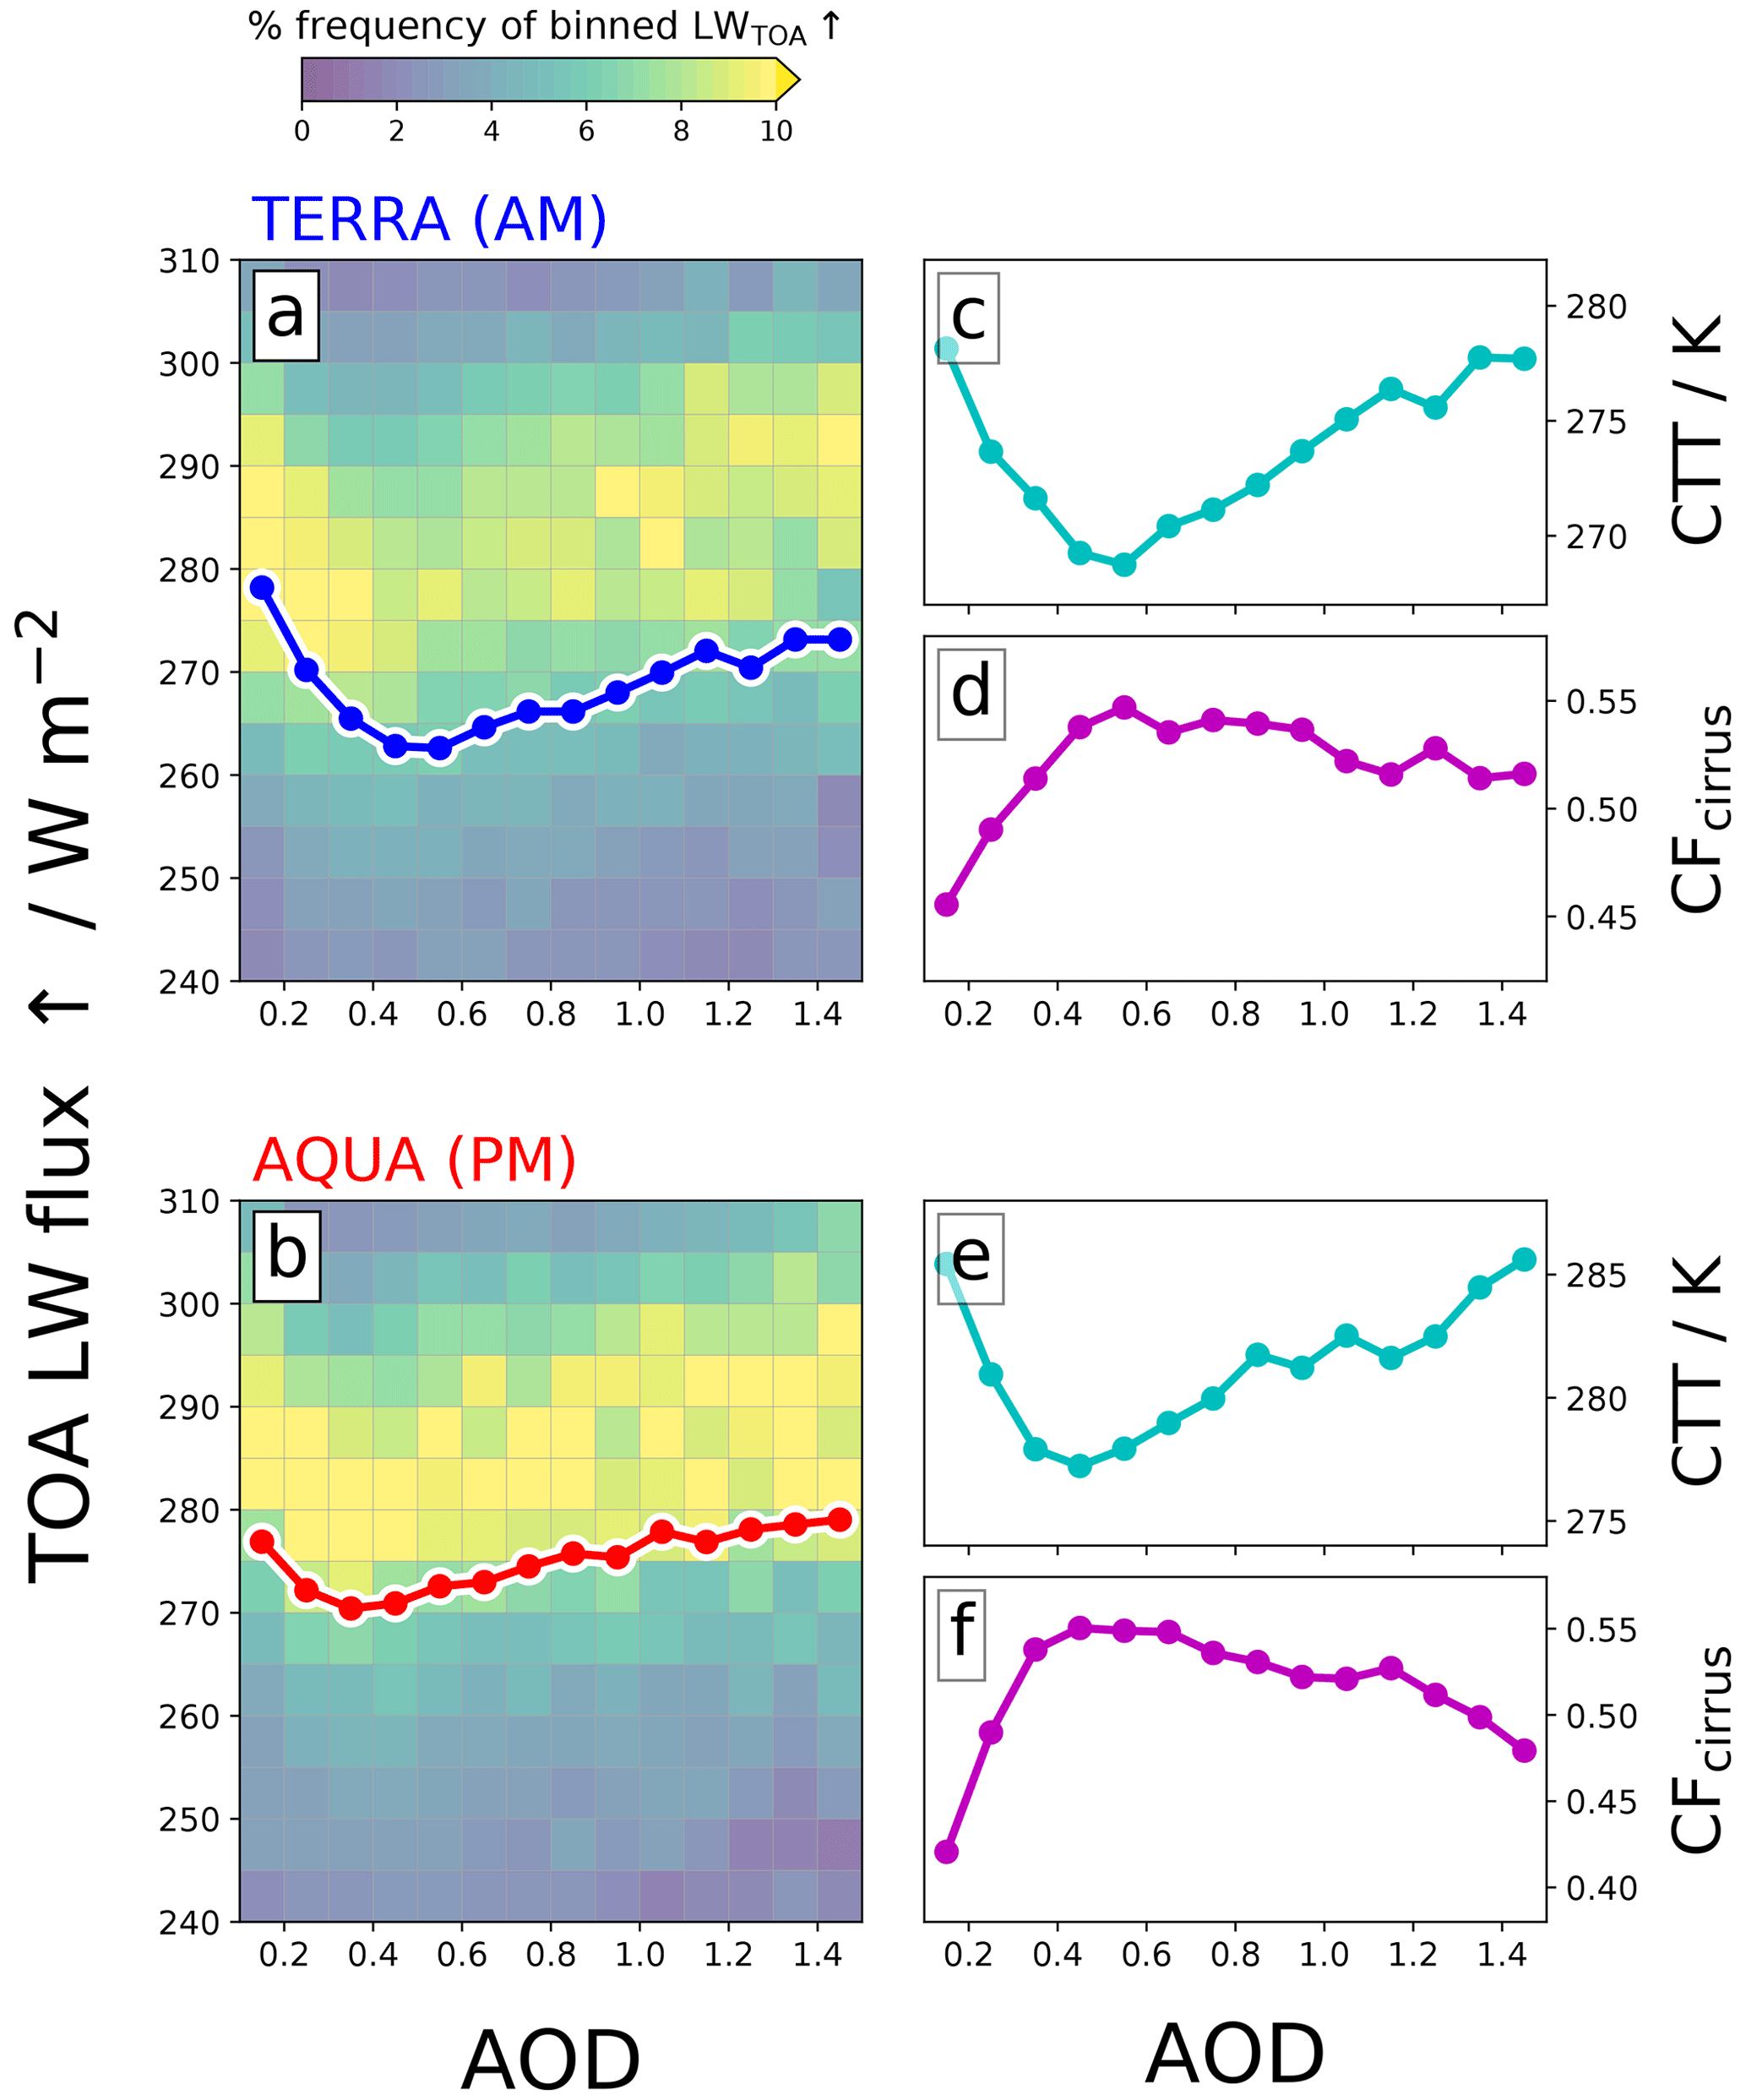
Figure 11CERES outgoing TOA longwave flux as a function of AOD (a–b) for the morning TERRA overpass (a) and the afternoon AQUA overpass (b). Joint histograms show % frequency of LWTOA binned by AOD, and coloured lines show the mean in each AOD bin. The column on the right (c–f) shows MODIS-retrieved mean cloud top temperature (c, e) and cirrus fraction (d, f) binned by AOD for the corresponding satellite overpasses.
NETTOA fluxes and their relationship with AOD are shown in Fig. 12. The nonlinearities of SWTOA and LWTOA largely counteract each other, resulting in a consistent and largely linear negative relationship between NETTOA and AOD (Fig. 12a and b). In both overpasses, the mean NET flux reduces by ∼ 50 W m−2 when AOD = 1, which represents a considerable aerosol radiative forcing and a pronounced cooling effect in this region. The interannual variability of each component (SW, LW, NET) of the radiative forcing (RF) calculated between 0.0 < AOD < 0.2 and 0.8 < AOD < 1.0 is shown in Fig. 12c and d. RFNET is consistently negative in the AM and largely negative in the PM throughout the time series, though there is clearly some interannual variability in the latter timeframe. The components RFSW and RFLW oppose each other, with the LW warming from enhanced anvil coverage acting to partially counteract the SW cooling from changes to the liquid cloud coverage and optical thickness, though RFSW dominates the RFNET magnitude and variability. The RF components suggest that changes to anvil properties (LW) play a minor role, yet a comparison with Figs. 10 and 11 shows that, below AOD = 0.4, the cooling is primarily driven by the changes in liquid cloud (SW), whereas for higher loadings of AOD, the reduction in anvil coverage (LW) has a more pronounced role in driving the relationship. Additionally, the LW warming will dominate the radiative effect during the night and may play a more important role in the full diurnal cycle, though this is likely not to the extent of what is estimated for deep convection over tropical oceans (Koren et al., 2010a).
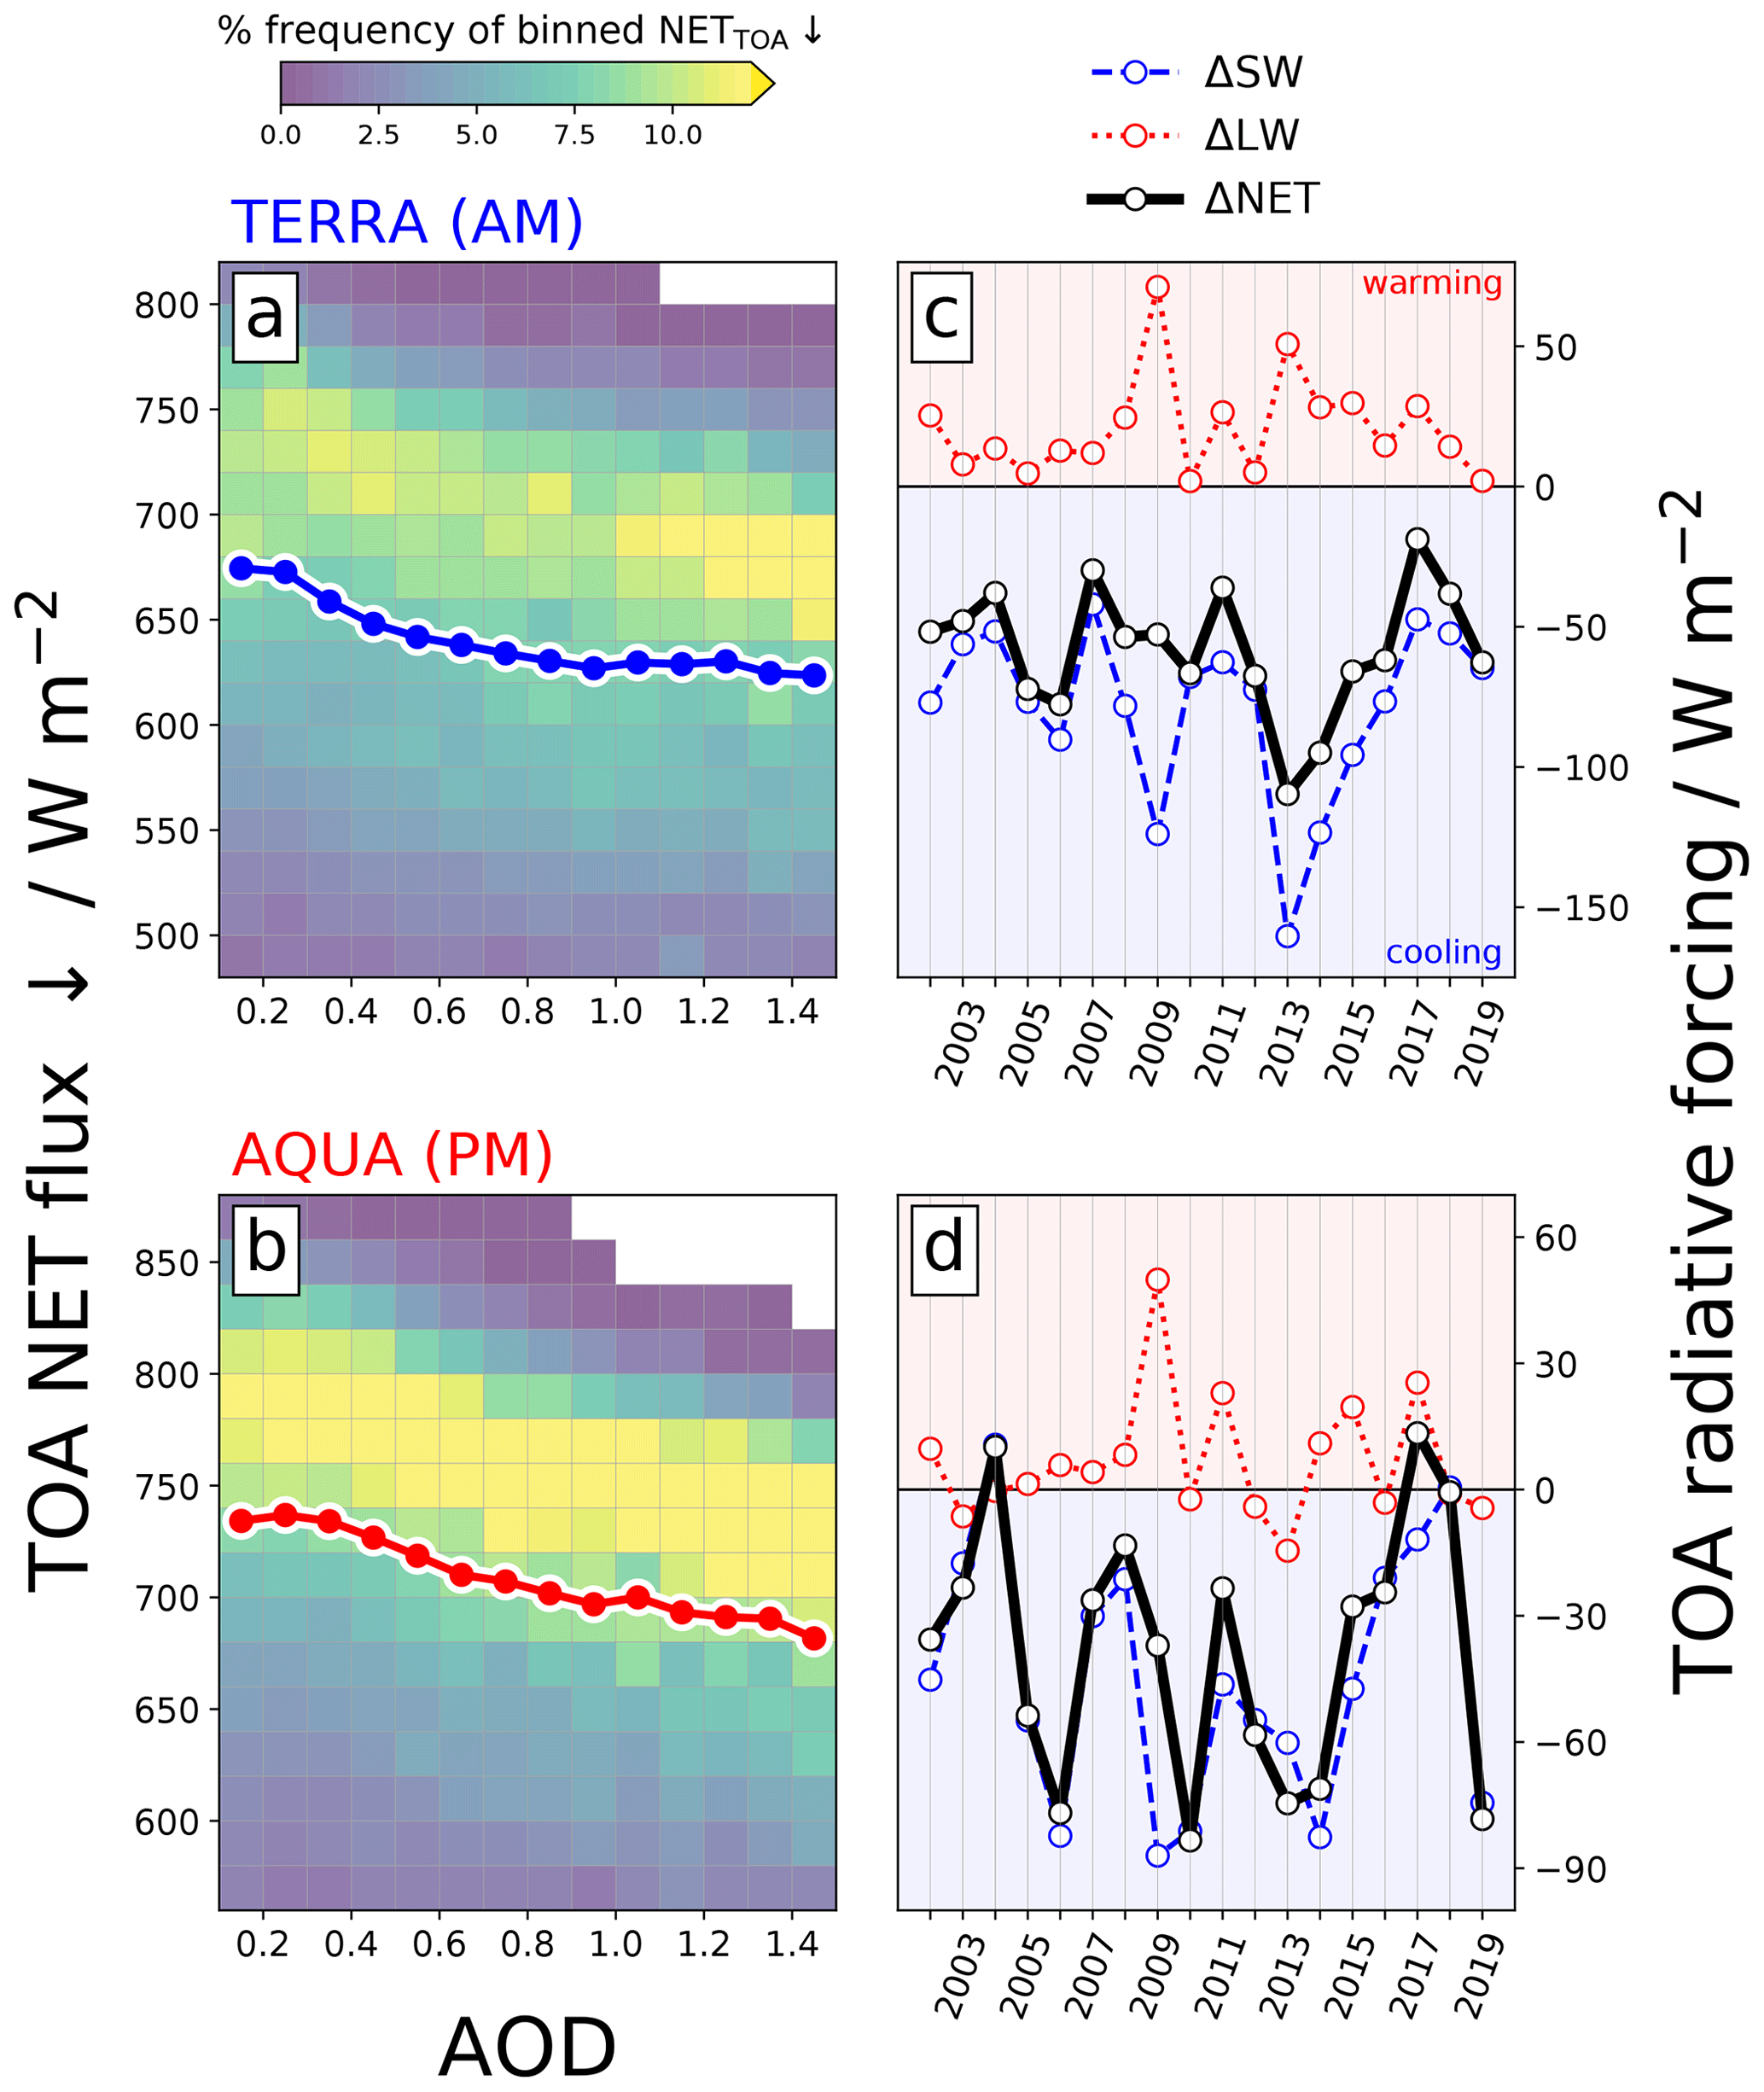
Figure 12CERES TOA net incoming flux as a function of AOD (a–b) for the morning TERRA overpass (a) and the afternoon AQUA overpass (b). Joint histograms show % frequency of NETTOA binned by AOD, and coloured lines show the mean in each AOD bin. The column on the right (c–d) shows the September mean TOA radiative forcing (from 0.0 < AOD < 0.2 to 0.8 < AOD < 1.0) for SW, LW, and NET components; negative values represent a cooling and vice versa.
3.6 Internalized response vs. external drivers
An important question to ask is whether the sensitivity of the environment to AOD presented here is a result of an internal response of the atmosphere over the Amazon rainforest or an artefact of large-scale driving meteorological conditions. These conditions may be seasonal-scale perturbations to the transport of temperature and moisture to the region or shifts in the climatological mean wind direction that result in drought-susceptible conditions that may be more favourable for high AOD. In this event, the sensitivity of AOD and the widespread transition of cloud regimes that we have presented here may be flawed.
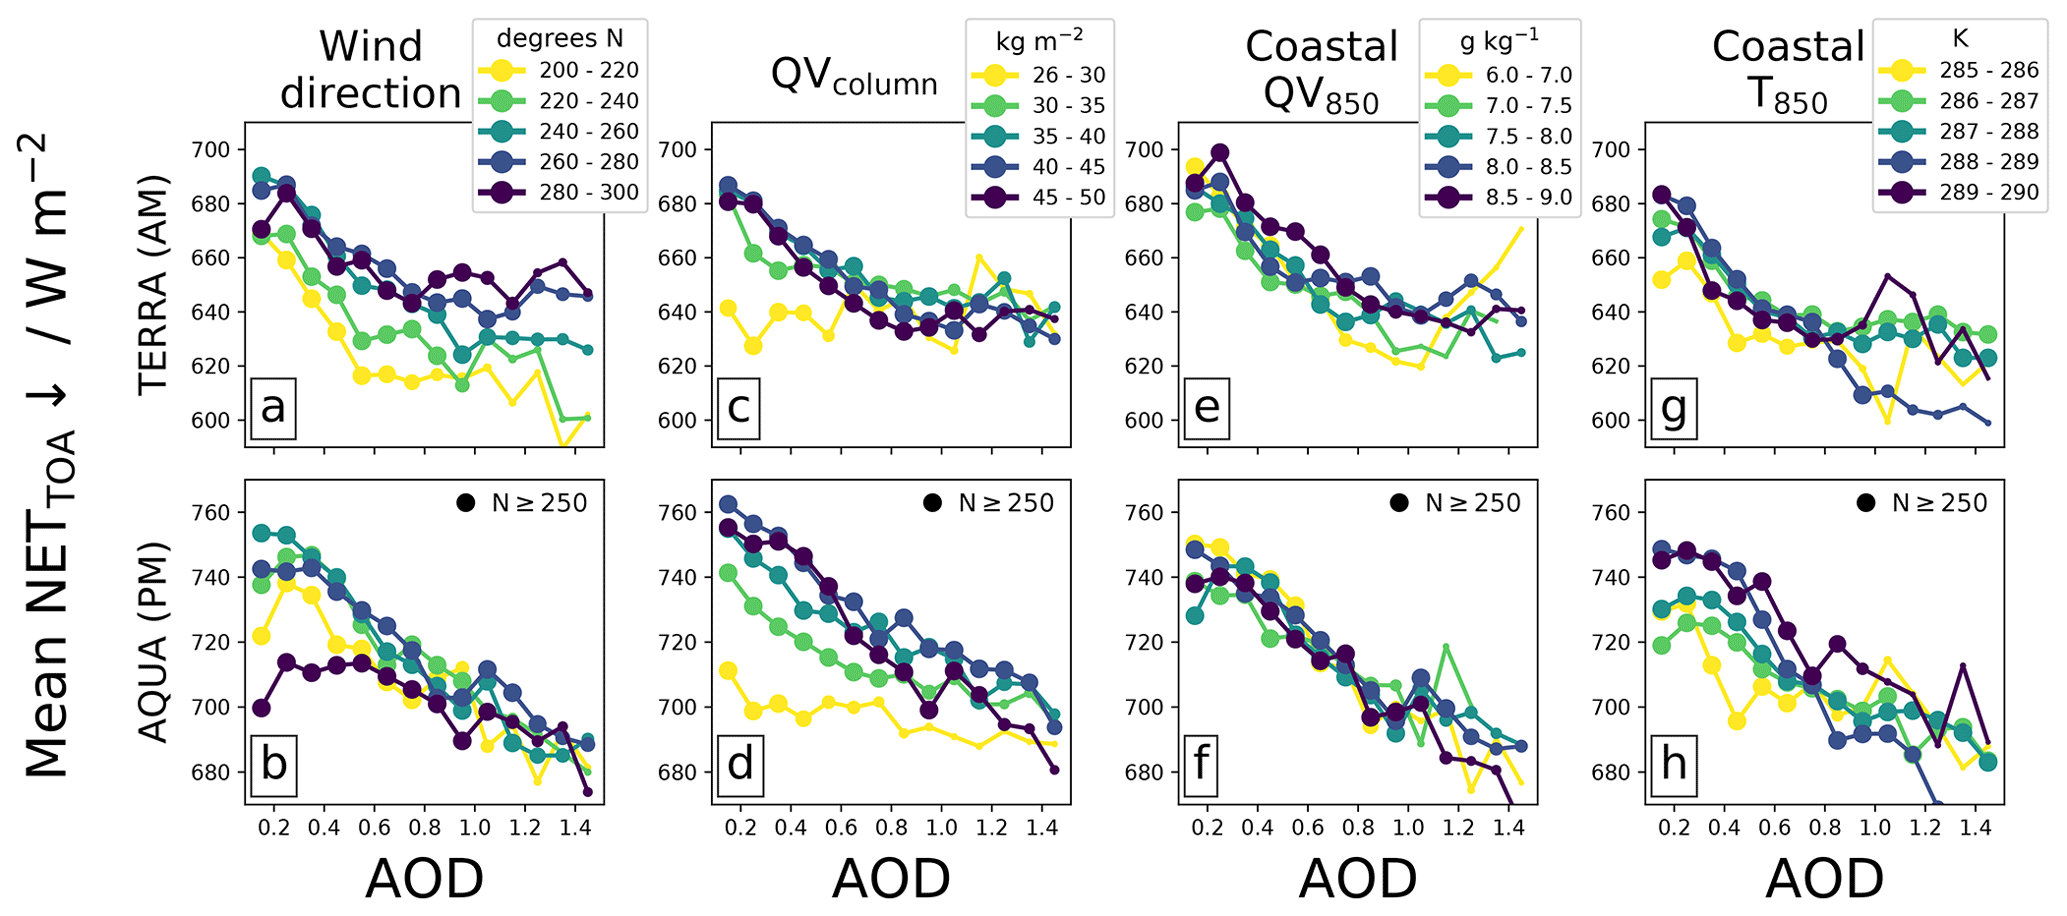
Figure 13Mean NETTOA as a function of AOD subset by wind direction from due north (a–b), where 270∘ describes an easterly; total column water vapour (c–d); mean water vapour content of the coastal boundary layer (e–f); and mean temperature of the coastal boundary layer (g–h). The top row is for the TERRA overpass, and the bottom row is for the AQUA overpass. The size of each circle gives a representation of how many scenes are included in the mean, with a maximum size shown for N ≥ 250.
Climatologically, the Amazon rainforest in September is characterized by easterlies that supply the region with moisture from the Atlantic Ocean (see Fig. S6a). Southerly winds originating from over the continent may result in anomalously dry air, driving anomalous meteorological conditions and high AOD. Figure 13a and b show the AOD-binned NETTOA subset by ERA5 collocated wind direction, ranging from northeasterlies (200∘ N) to southeasterlies (300∘ N). The subsetted data show that the cooling trend in NETTOA–AOD is present for all wind directions, though there is variation in the magnitude, most notably in the AQUA afternoon overpass, where winds other than easterlies result in a weaker cooling effect. A histogram of QVcolumn as a function of wind direction (Fig. S7) shows that northerly and southerly winds exhibit lower loadings of water than easterlies. As the cooling trend in the afternoon is driven by changes in convection, it is likely that the drier air masses tend to produce weaker background convective activity as CAPE is reduced and therefore weaken the sensitivity of the environment to AOD perturbations. This result is similarly observed when the NETTOA is subset by AIRS QVcolumn in Fig. 13c and d – the cooling trend persists but is weaker for drier air masses, especially for QVcolumn < 35 kg m−2.
Collocated meteorological variables (e.g. moisture and winds) may be influenced by the presence of aerosols, weakening the robustness of the analysis. To account for this, we can subset the data for the large-scale meteorology influencing the region. Data are constrained for climatological easterlies that constitute 50 % of the most-frequent wind directions (Fig. S6a), giving us some confidence that air advected into the region comes from the Atlantic coast. A region due east of the analysis domain off the coast (Fig. S6b) is used to determine mean meteorological properties from ERA5, including temperature and water vapour content at 850 hPa (T850 and QV850); using coastal values removes any influence from the land surface and associated processes. Back-trajectory analysis using the Hybrid Single-Particle Lagrangian Integrated Trajectory (HYSPLIT) model (Stein et al., 2015) shows that air parcels in the analysis domain tend to originate in the boundary layer in the coastal region (hence 850 hPa), taking ∼ 5 or more days to reach the domain. We therefore temporally collocate the constrained satellite dataset with mean T850 and QV850 from the coastal domain with an offset of −5 d. Figure 13e–h shows the AOD-binned mean NETTOA subset by QV850 and T850 at the coast. The data, spanning 3 g kg−1 and 5 K, shows a consistent cooling trend, with almost no variation from QV850 and slightly weaker cooling for lower T850 (cooler advected air may reduce CAPE); this analysis supports the previous results.
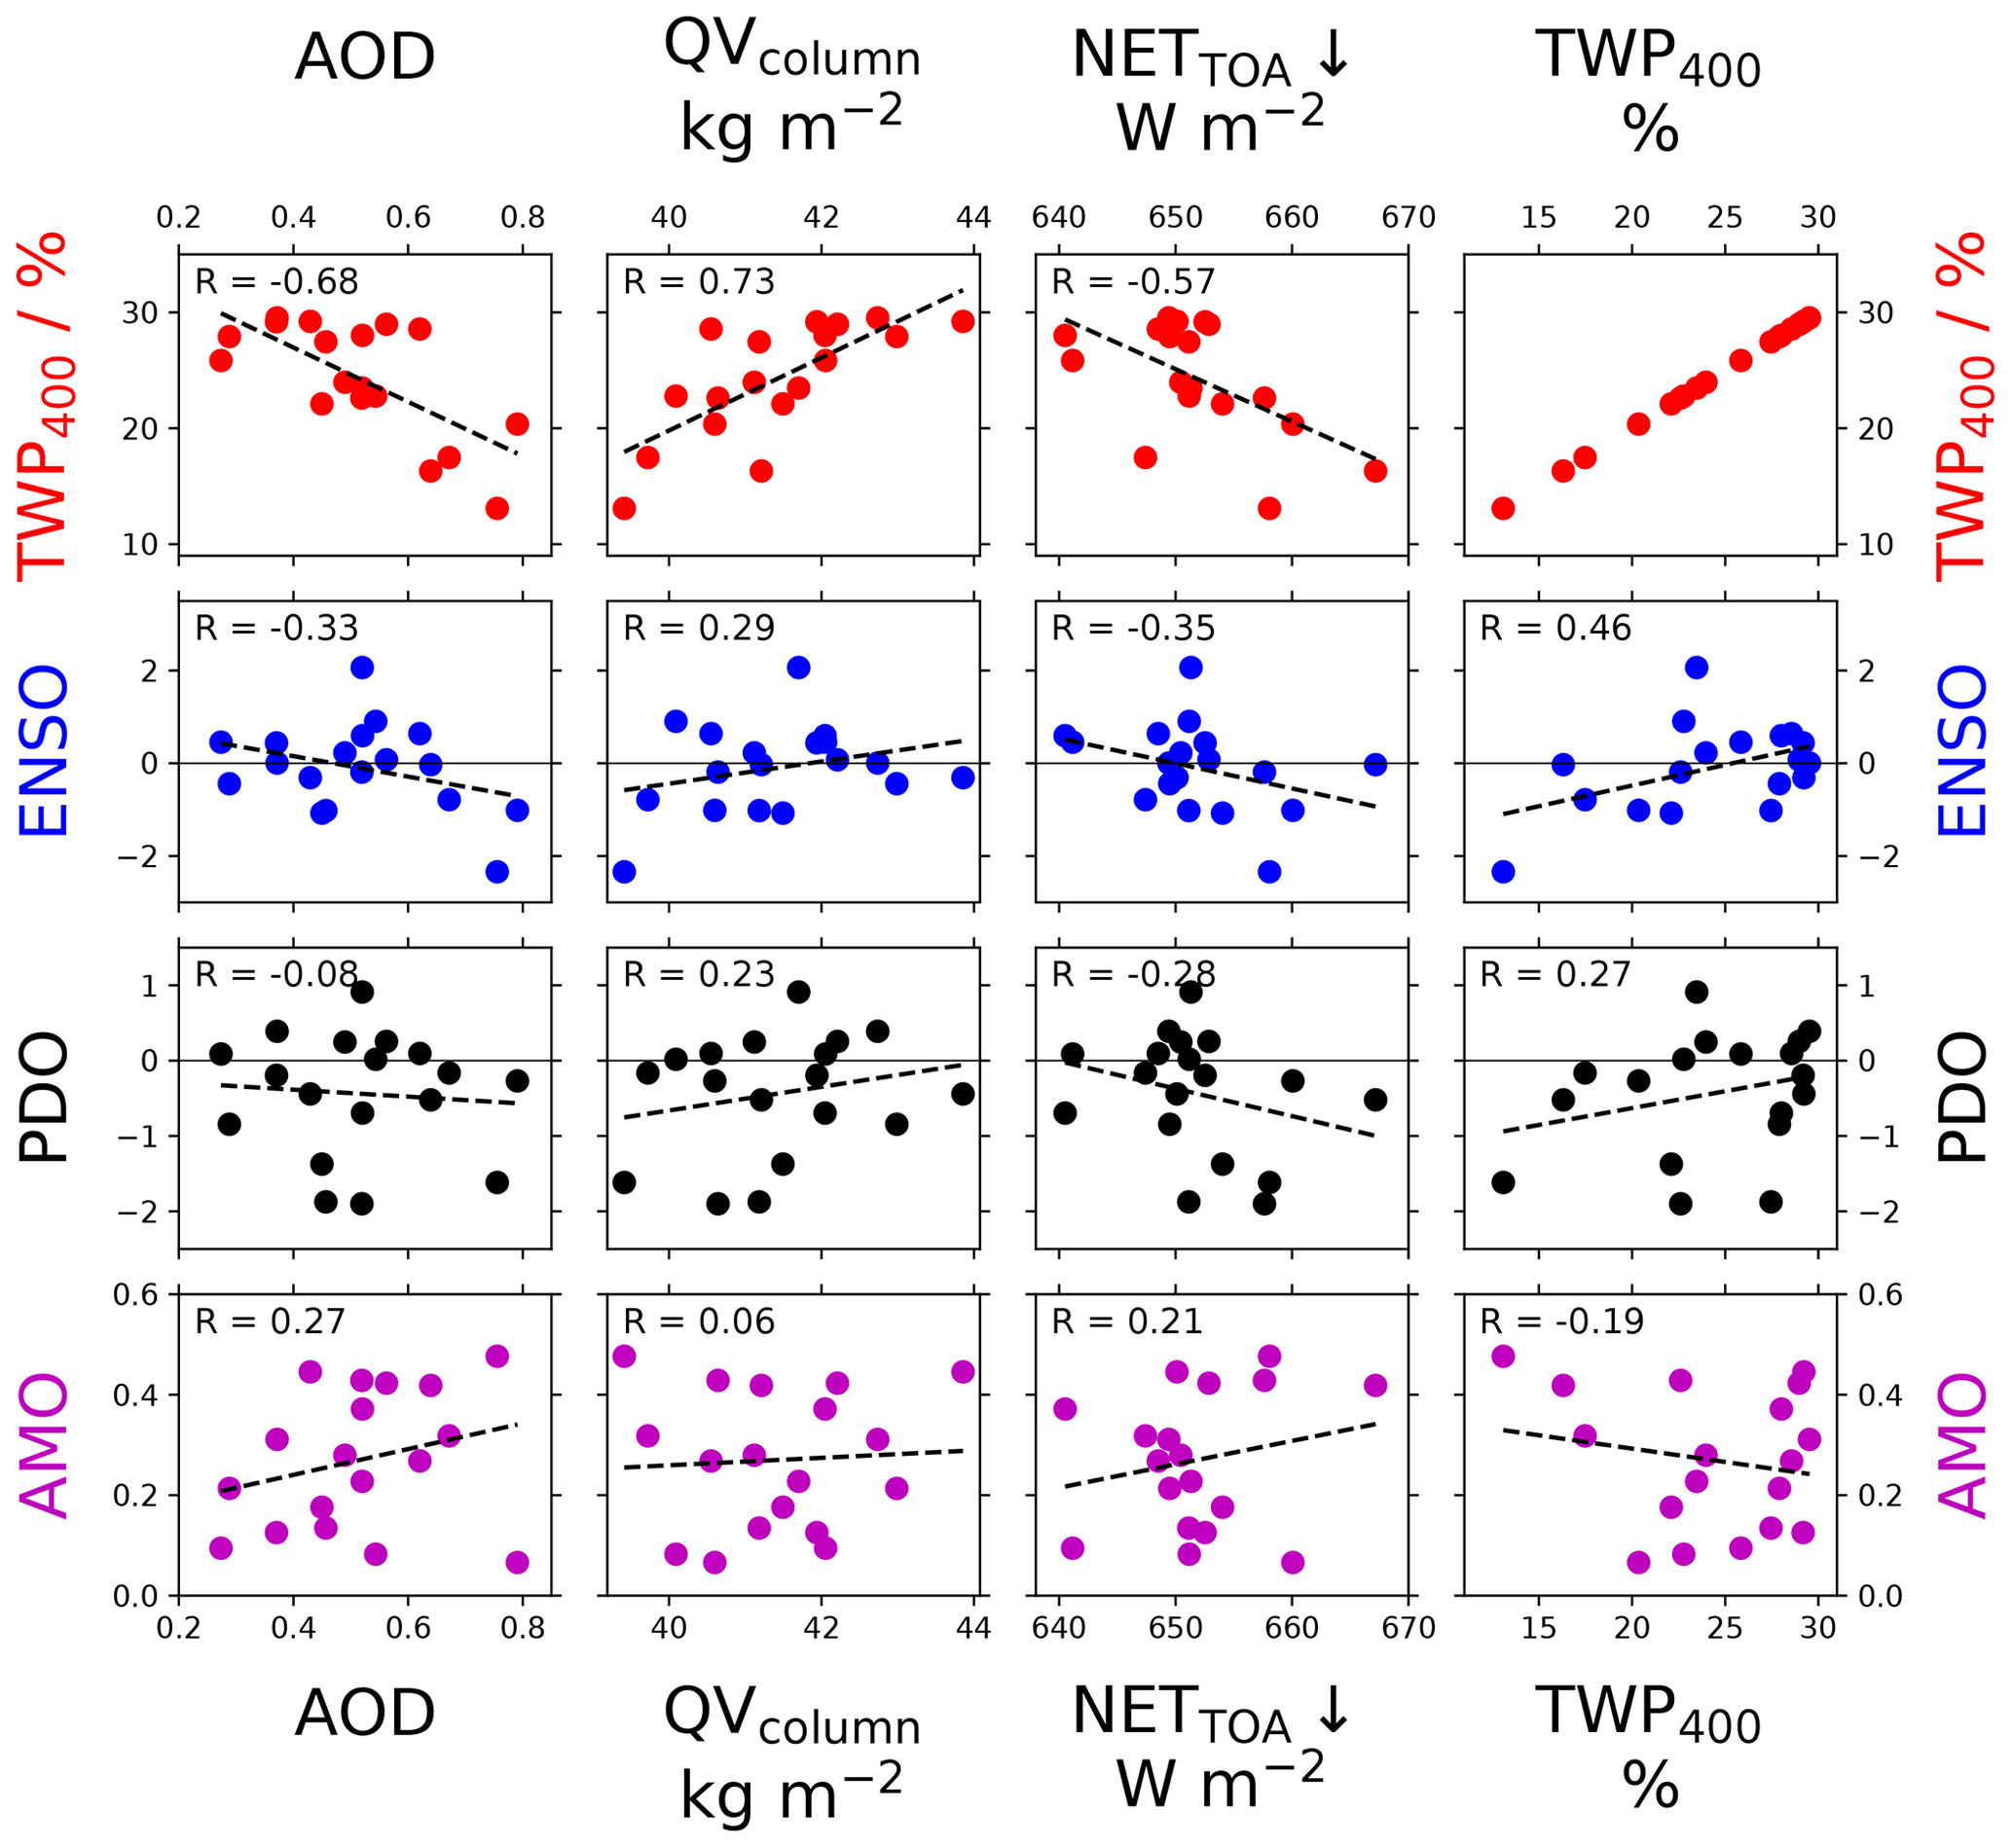
Figure 14September mean AOD (first column), QVcolumn (second column), NETTOA (third column), and TWP400 (fourth column) from the domain for each year as a function of the corresponding (from the top row downwards) TWP400, August–September mean ENSO index, PDO index, and AMO index. TWP400 is the percentage of the domain where TWP > 400 g m−2 and is used as a metric to describe the convective nature of the domain. The dotted line in each plot shows the linear regression between the two datasets, with the corresponding R value shown at the top of each plot.
In the final analysis, we look at the influence of climate-scale circulation anomalies and patterns such as the El Niño–Southern Oscillation (ENSO), the Pacific Decadal Oscillation (PDO), and the Atlantic Multidecadal Oscillation (AMO). The ENSO is largely a phenomenon that impacts the Pacific Ocean, though there have been links made between drought conditions in the Amazon and positive phases of the ENSO (Jimenez et al., 2021; Jiménez-Muñoz et al., 2016; Aragão et al., 2018). Similarly, the PDO has also been linked to influencing the Amazon dry season (Aragão et al., 2018). The AMO impacts tropical Atlantic sea surface temperatures and the position of the intertropical convergence zone, which can drive drought conditions over the Amazon (Boulton et al., 2022; Ciemer et al., 2020; Yoon and Zeng, 2010). If strong correlations between these phenomena and the AOD over the domain are evident, it would be difficult to separate the two. Conversely, if there is no clear evidence of the phenomena driving the AOD variability, then this would suggest that changes to the cloud field and environment (with respect to AOD) are more heavily influenced by local perturbations – i.e. the smoke. The same applies to other variables such as the QVcolumn or RHsurface. Figure 14 shows the September mean AOD, QVcolumn, and NETTOA for each year of the time series as a function of the corresponding ENSO, PDO, and AMO indices (averaged over August and September). There are no strong correlations evident for any pairings, and the strongest correlations are at odds with what we would expect. For example, positive-ENSO years are generally associated with drought conditions, yet we observe lower AOD and lower QVcolumn. Although the sample size is small, this does suggest that the AOD is driven by localized processes, such as anthropogenic sources, rather than by large-scale circulation anomalies. Similarly, the QVcolumn is not significantly influenced by these phenomena and is possibly primarily driven by local sources of moisture. Although this is neither an extensive nor entirely quantitative analysis, we would expect there to be more correlation if these large-scale circulation anomalies were driving the strong responses that are evident from the MODIS, AIRS, and CERES collocated retrievals. AIRS collocated data (Fig. 9) show that low-AOD scenes are typically more moist than high-AOD scenes. RHsurface decreases more rapidly with AOD than QVcolumn, which suggests that temperature also increases at high AOD; this would be consistent with a localized heating of the smoke layer.
Figure 14 also shows the September mean percentage of the domain where TWP > 400 g m−2 (named TWP400 in the plot), used to indicate the convective nature of the season; higher values will be associated with more numerous deep clouds throughout the domain and are hence a reasonable proxy for more convection. Here, we see strong relationships between AOD and convection, as well as between the QVcolumn and NETTOA. The regressions suggest that, on seasonal timescales, high-AOD years coincide with suppressed convection, a drier atmosphere, and a net cooling radiative effect.
In this study, we used spatially and temporally collocated observations and estimates from multiple satellite instruments and datasets to examine smoke–cloud–radiation interactions over the Amazon rainforest during the month of September. We found evidence that smoke drives widespread changes to the cloud field over the region, consistent with ACI and ARI processes. Figure 15 shows a schematic summarizing the main findings.
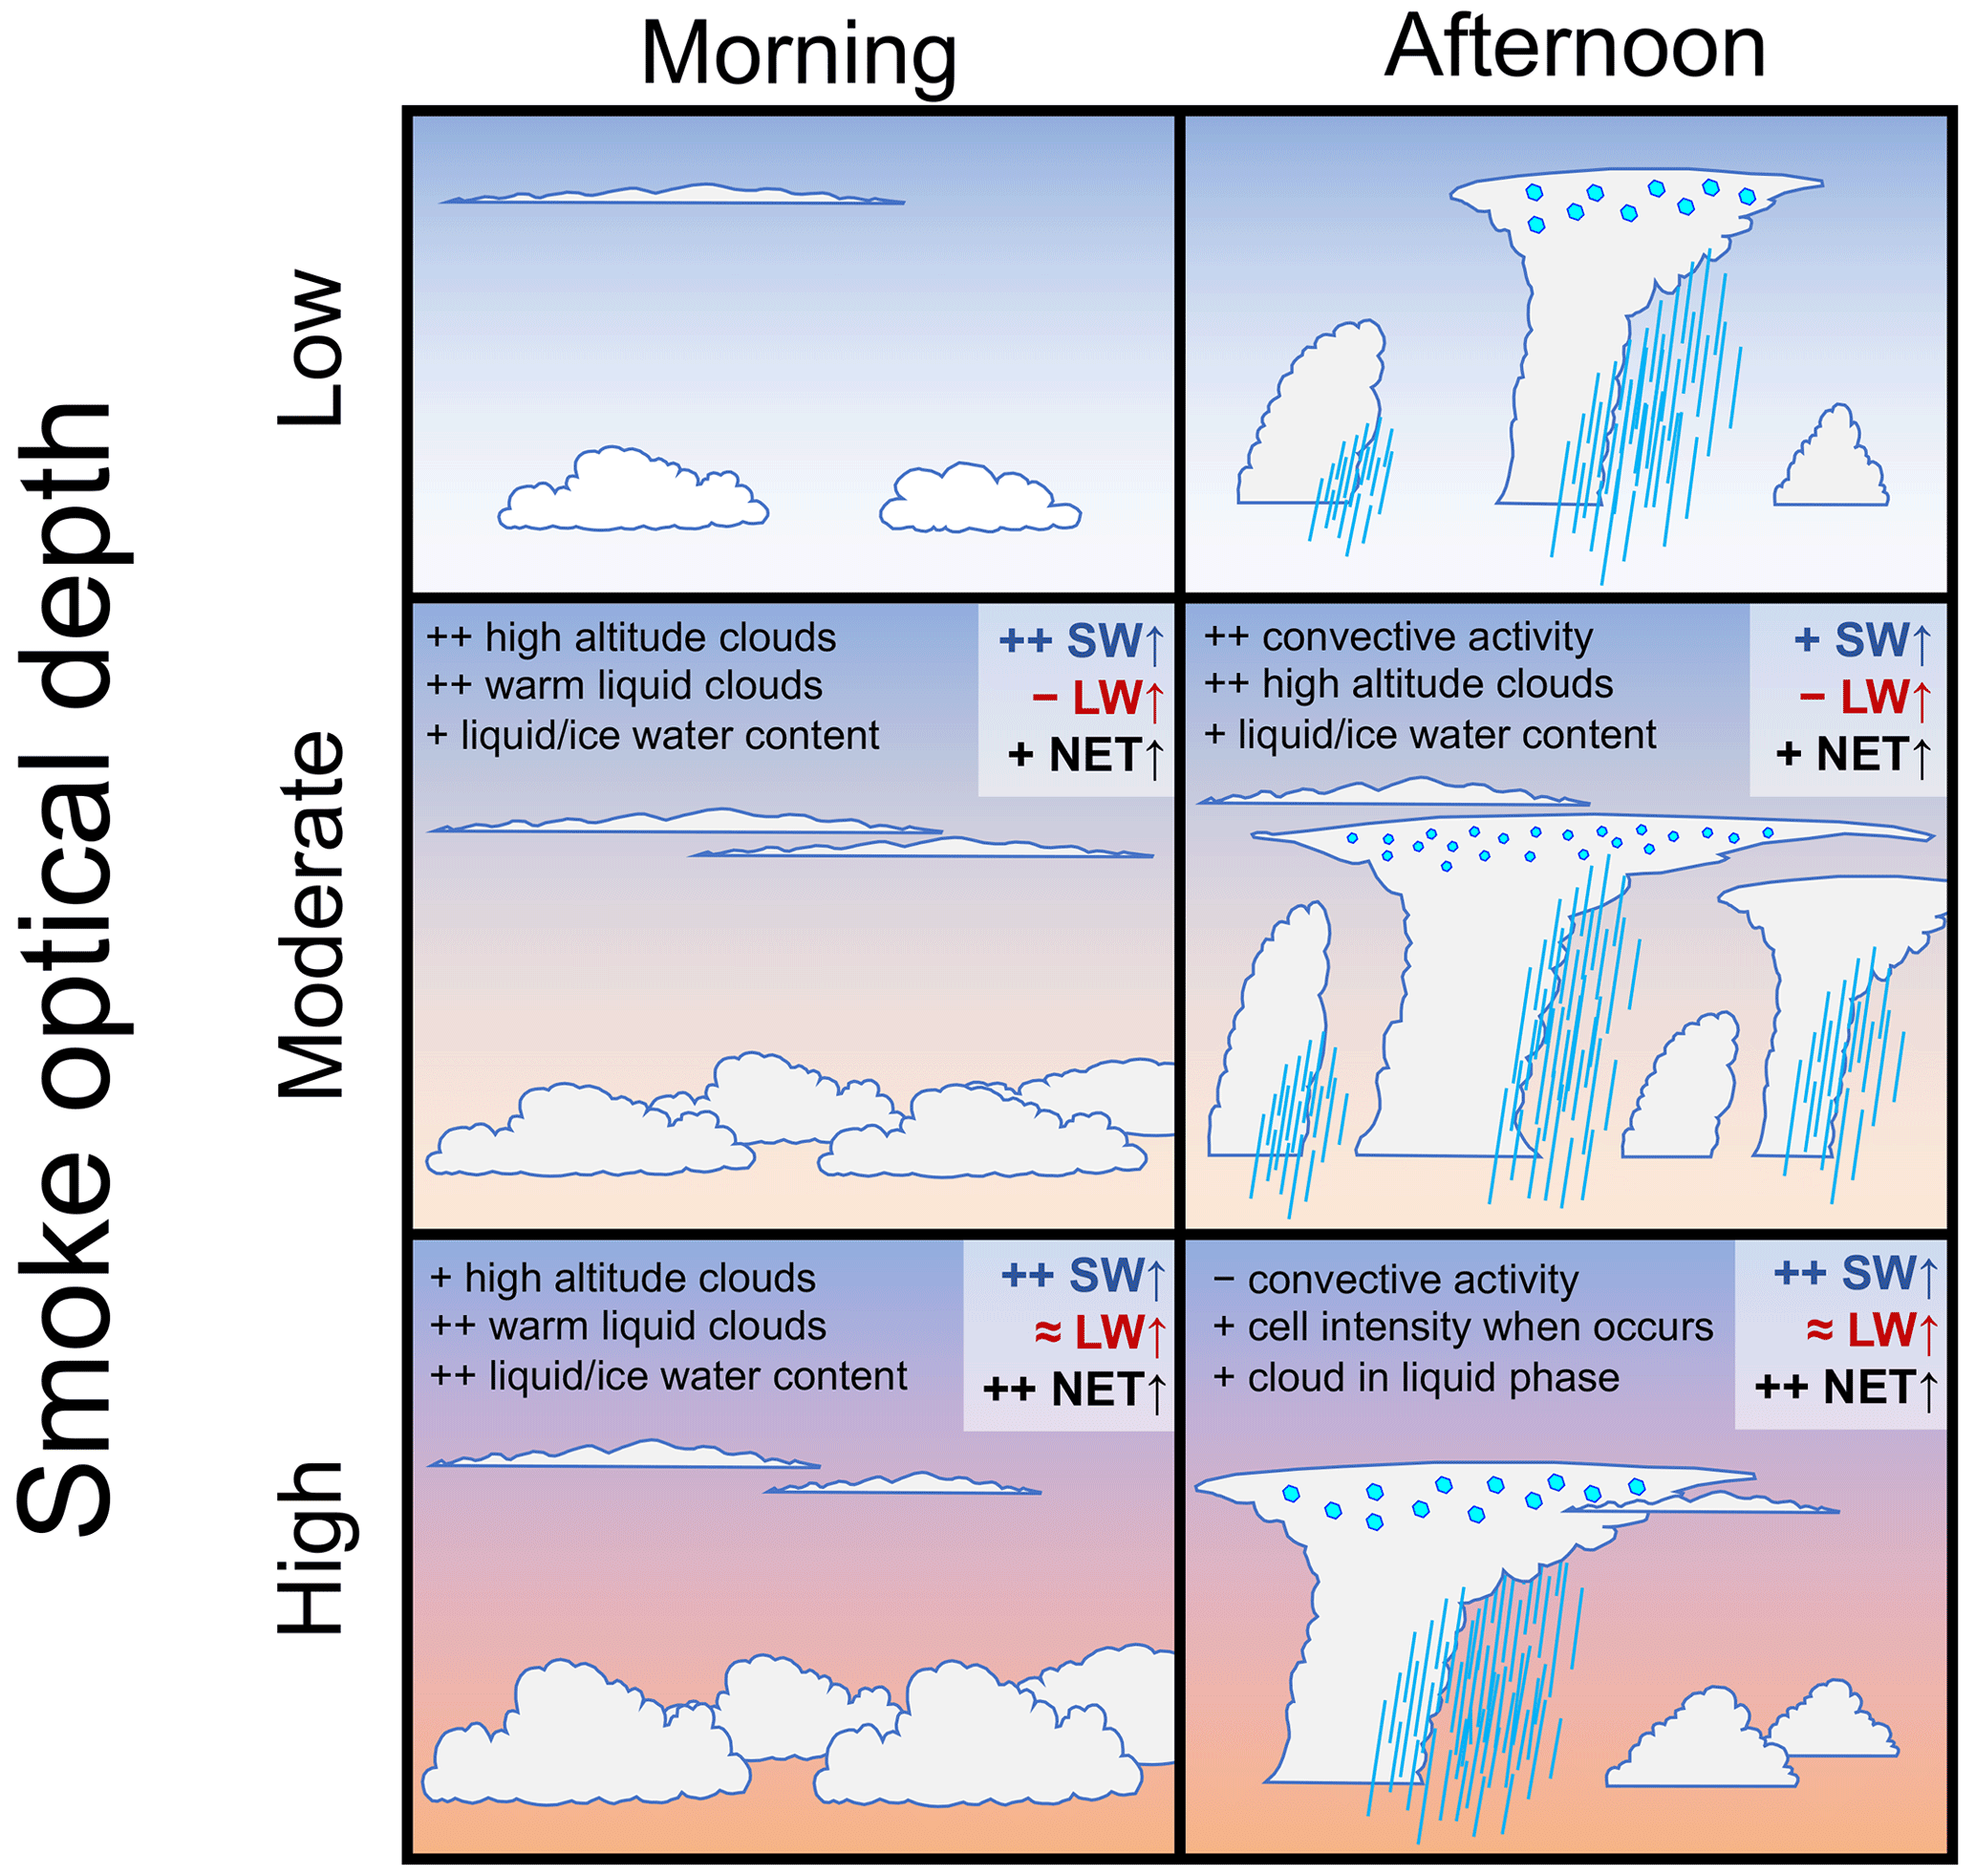
Figure 15Summary of results from an 18-year time series of collocated MODIS, CERES, and AIRS observations on board TERRA (morning overpass) and AQUA (afternoon overpass) satellite platforms, combined with IMERG precipitation estimates, during the peak biomass burning month of September over the Amazon rainforest. Panels are shown for low (AOD < 0.1), moderate (AOD = 0.4), and high (AOD > 1.0) smoke optical depths. Annotations are included to highlight primary responses to the cloud field and TOA outgoing radiation fluxes as compared to the background low-AOD scene; symbols depict increases (+), substantial increases (), decreases (−), and relatively little change (≈).
The Amazon atmosphere is very sensitive to low to moderate loadings of smoke where AOD ≤ 0.4. In the morning, the smoke perturbation coincides with increases in the warm-phase cloud coverage and cloud optical thickness, consistent with a suppression of the warm-rain process. In the afternoon, there is a considerable enhancement in the formation and development of deep convection, enhancing daily accumulated precipitation and intensity and high-altitude cloud coverage. The high-altitude clouds persist throughout the night and into the morning, possibly enhanced by smaller ice particle sizes. The increased coverage and optical thickness of liquid clouds enhance the scene albedo, resulting in a negative SW forcing; enhanced cirrus coverage partially offsets this via a decrease in LW, resulting in a negative TOA net forcing.
At higher loadings of smoke where AOD > 0.4, the liquid cloud coverage in the morning remains relatively stable, with small increases in the cloud optical depth resulting in enhanced TOA cooling; an overall drying and warming of the boundary layer may play a role in limiting the cloud coverage extent. A primary response of the atmosphere in the afternoon is an overall suppression of convection, consistent with a stabilization of the atmosphere via surface cooling and elevated heating by ARI processes (Herbert et al., 2021). A reduction in cumulative precipitation and cirrus cloud coverage is consistent with the suppressed convection, along with a shift from the ice phase to liquid phase as mean cloud vertical extent decreases. At very high AOD, accumulated precipitation remains comparable with background (very low AOD) scenes despite weaker convection across the domain. This may suggest fewer and more intense convective cells, consistent with the simulations of Herbert et al. (2021) and observations of delayed and more intense precipitation (Andreae et al., 2004; Gonçalves et al., 2015), though this would require further investigation to be confirmed.
These results are generally consistent with previous studies but also help to fill in some important knowledge gaps. Previous studies have focused on MODIS-AQUA retrievals to study the response of warm liquid clouds to aerosols over the region. Koren et al. (2004) used retrievals from the dry season of 2002 and reported a pronounced decrease in cloud fraction as the smoke optical depth increased. Using a similar methodology, Yu et al. (2007) analysed data for 2 consecutive years and found opposing correlations (negative in 2002, positive in 2003). Ten Hoeve et al. (2011), focusing on a smaller domain and over 4 years, reported a consistent increase in cloud fraction with AOD; the authors found that the collocated column water vapour (CWV) of the scene strongly influenced the cloud fraction, and they proposed that this behaviour may explain the opposing correlations in Yu et al. (2007). In our study, we do not subset for one cloud type and instead consider all clouds, making a direct comparison difficult. However, comparing to CFliquid in our study for the AQUA overpass, we observe a shift towards higher coverage as AOD increases (Figs. 8b and 10e) for all years in the time series (not shown), consistent with Ten Hoeve et al. (2011) but not with Koren et al. (2004) and Yu et al. (2007). The inconsistencies may be explained by the differing methodologies in that the authors removed scenes with cloud fractions > 0.8, whereas in our study, we do not. Subsetting our data to remove scenes with CFliquid or CFtotal > 0.8 has a considerable impact on our results, as it removes a lot of data from the higher-AOD scenes (Fig. 8), biassing the dataset towards lower cloud fractions. The result of subsetting our data is a negative CFliquid–AOD relationship at higher AOD and a weaker TOA radiative effect, though this is of the same sign. This suggests that results from previous studies may be biased towards lower cloud fractions. However, a caveat is that the primary reason for restricting high CF values is to reduce misclassification of clouds and aerosols (Koren et al., 2010b). To test this further, we used level 2 MODIS products (10 km resolution) to compare with the coarser (1∘) level 3 data. Cloud products at 5 km resolution are regridded to 10 km resolution and are spatially and temporally collocated with the 10 km aerosol product. The comparison is shown in Fig. S8 of the Supplement. First, the distribution of level 2 AOD (Fig. S8a) and CFtotal (Fig. S8b) within each 1∘ pixel shows very good agreement between scales, with reasonable variability around the mean and median. These illustrate that the AOD (and cloud response) is widespread amongst the region rather than focused within single plumes of smoke or single cloud features. Secondly, at high values of AOD, the retrieved 10 km cloud fraction is increasingly close to 1, with less variability than at lower values. We would expect more variability across the 1∘ pixel if there were widespread misclassification occurring. We also perform the same analysis as in Sect. 3 to test our conclusions on this finer-scale dataset. Figure 16 shows the same trends, and of similar magnitude, to those observed using the 1∘ data. This analysis helps to support our conclusions and method, though we cannot rule out misclassification, so some caution should be applied until further work can corroborate these findings.
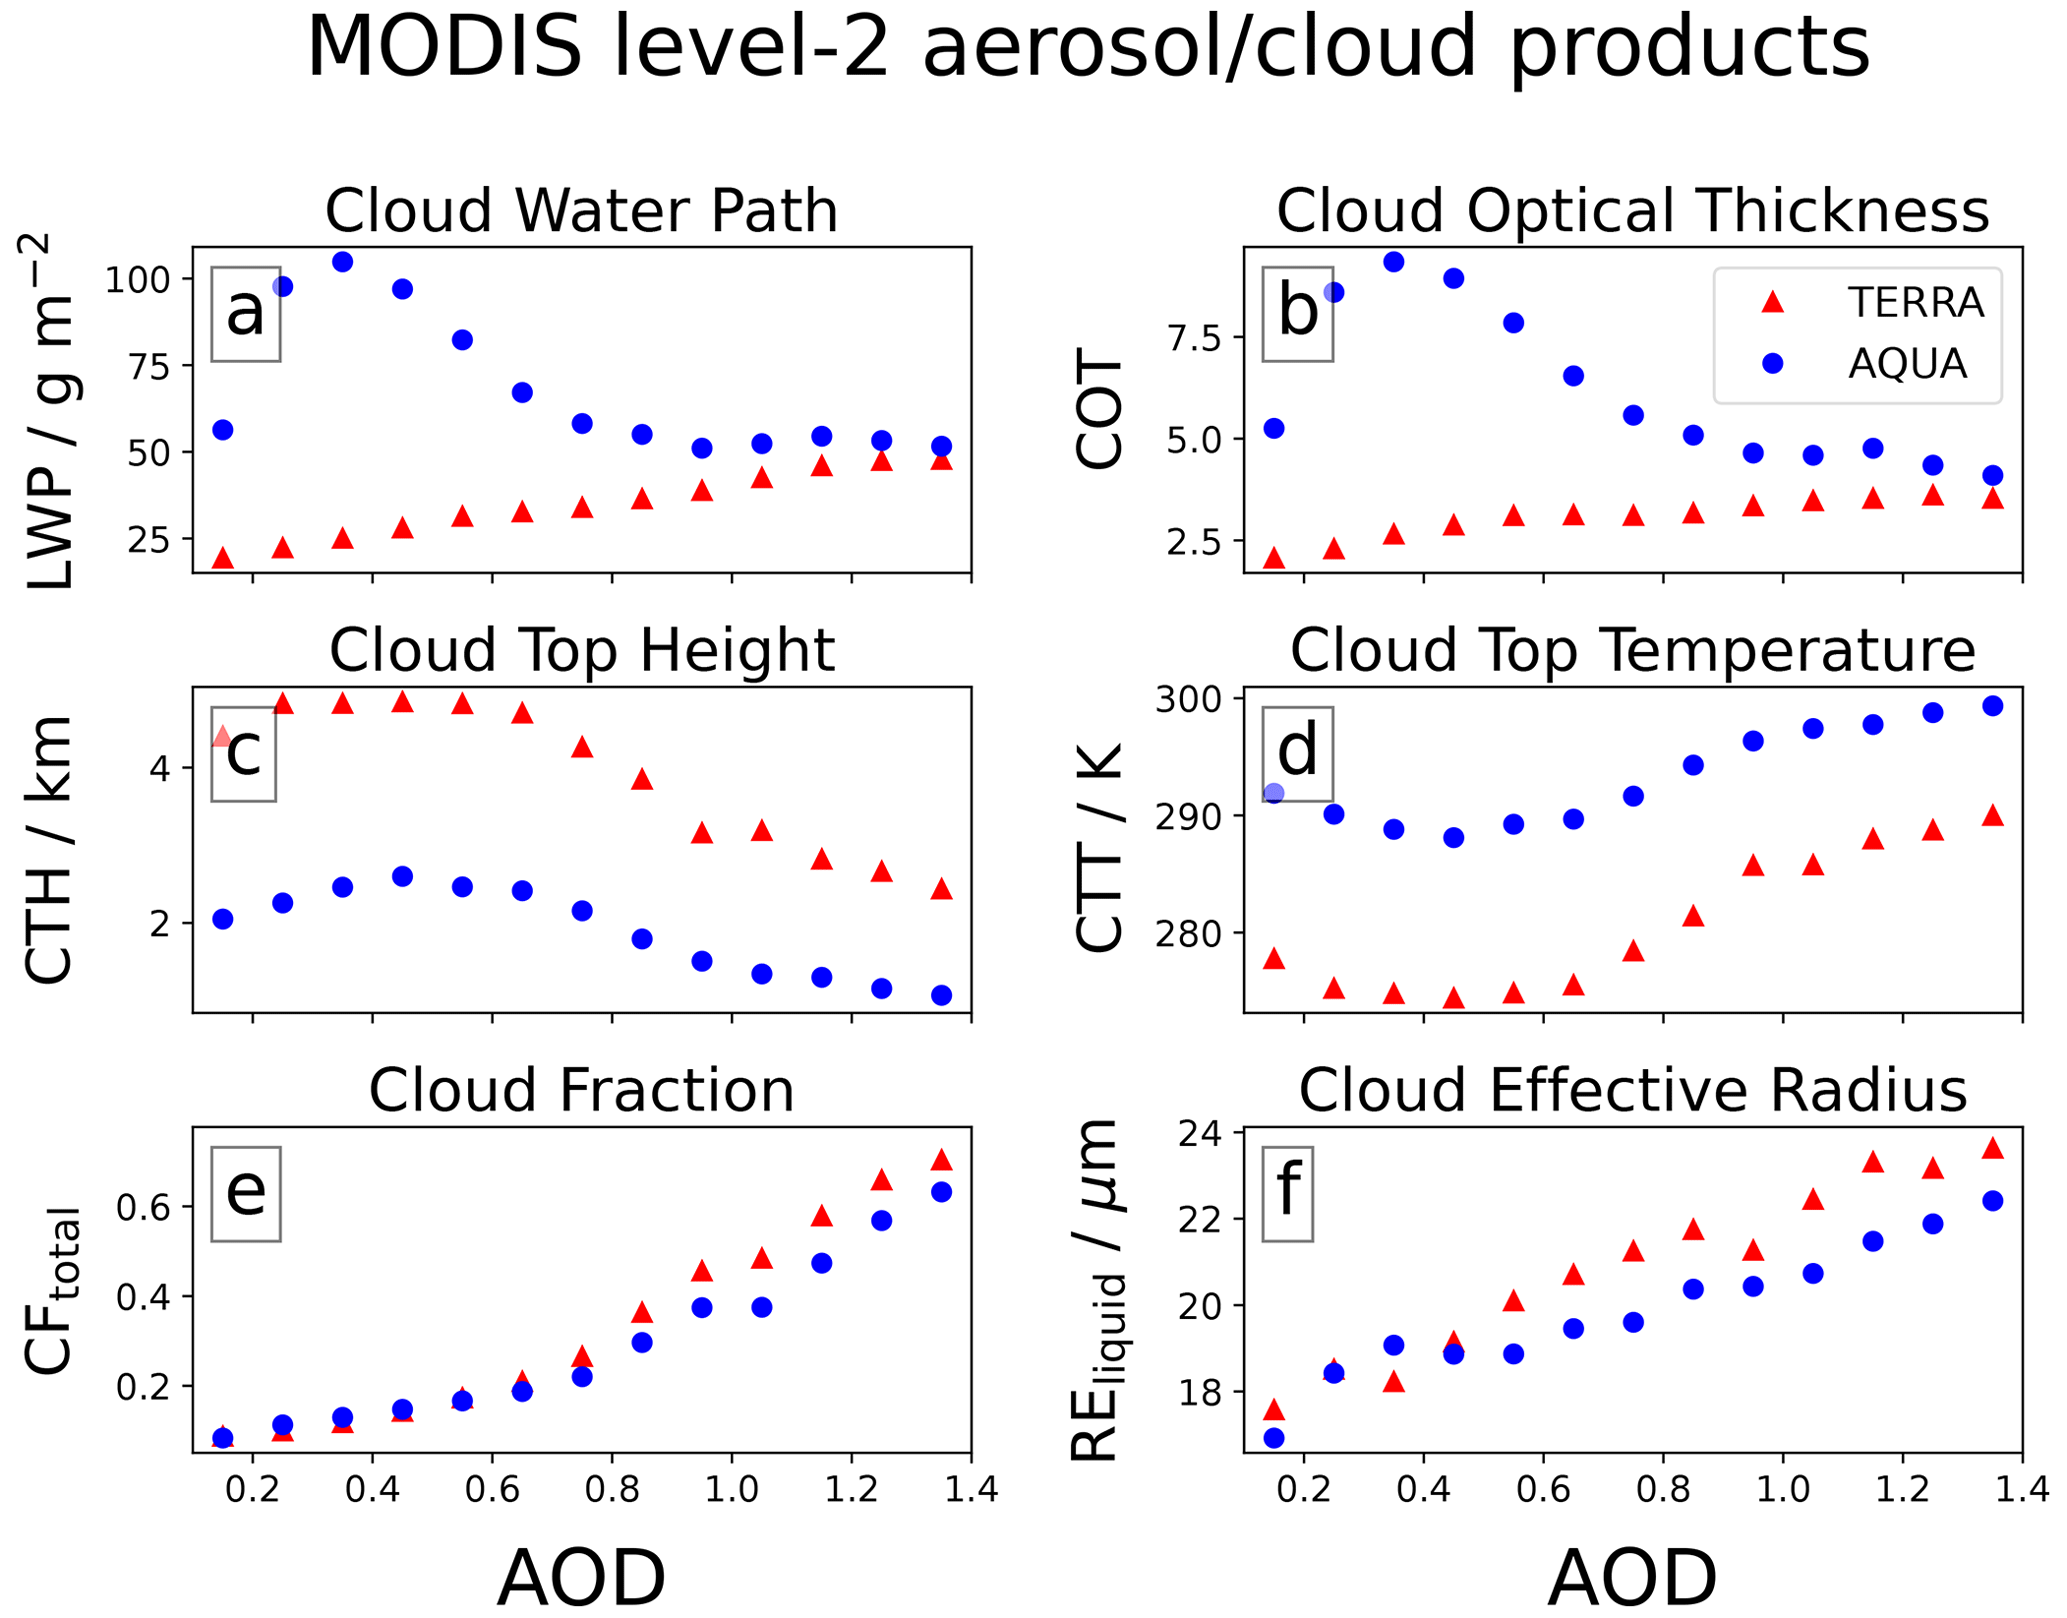
Figure 16Cloud properties from the MODIS 5 km cloud product binned by MODIS 10 km AOD for the TERRA (red triangles) and AQUA (blue circles) satellite overpasses. The mean values (symbols) are taken from all spatially and temporally collocated grid points within the AOD bin (5 km product regridded to 10 km). Data are for September 2002 to 2019 inside the domain 9 to 1∘ S, 68 to 58∘ W.
Our conclusions may additionally explain behaviour reported by Koren et al. (2008). In that study, the authors examine the relationship between low cloud fraction and AOD in MODIS-AQUA data. At higher AOD, the authors find that subsetting the data to increasingly lower cloud fractions results in an increasingly negative CFliquid–AOD relationship, which is attributed to the greater sensitivity of low-cloud-fraction scenes to aerosol absorption. This behaviour was also seen in our data when we subset the data to remove high-CFliquid scenes; therefore, the results from Koren et al. (2008) could be alternatively interpreted as a result of dampening the underlying pathway, which is a pronounced shift from low- to high-CFliquid scenes as AOD increases and modifies the widespread convective nature of the region. It is also possible that both processes occur simultaneously and contribute to the overall response of the cloud field.
A key process influencing the diurnal cycle of cloud cover and vertical distribution is the modification to convection in the afternoon, driven by ARI at high AOD and ACI and/or by thermal buoyancy at low AOD. We observe increasingly suppressed convection and precipitation for AOD > 0.4 during the AQUA overpass; this is consistent with modelling studies that report ARI-driven stabilization of the lower atmosphere (Herbert et al., 2021; Liu et al., 2020; Martins et al., 2009; Wu et al., 2011) and suppressed (or delayed) convection, with similar impacts in relation to precipitation. Field studies from the region have similarly reported suppressed or delayed peak precipitation rates (Andreae et al., 2004; Bevan et al., 2008; Camponogara et al., 2014; Gonçalves et al., 2015), and remote observations from Koren et al. (2008) show a tendency for shallower convective clouds (less vertical extent) under high aerosol loading. The invigoration of convection at AOD < 0.4 in our observations suggests an important process that has considerable implications for the region. Koren et al. (2008) report an increase in cloud fraction and taller convective clouds at small AOD perturbations, and Ten Hoeve et al. (2011) reported similar behaviour by COTliquid. This is consistent with ACI-induced warm-phase invigoration in shallow convection and in the warm base of deep convective cells (Marinescu et al., 2021; Koren et al., 2014; Seiki and Nakajima, 2014; Igel and van den Heever, 2021; Dagan et al., 2020) or with anomalous thermal buoyancy due to the fire itself (Zhang et al., 2019). The reduction in cloud top REice (Fig. 7c and d) with AOD for high-IWP scenes suggests that more cloud droplets are reaching the freezing level; this may due to ACI processes or enhanced aerosol activation through thermally induced anomalous buoyancy, making the attribution of the dominant mechanism difficult.
The analysis suggests an important inflection point in the Amazonian atmosphere's response to aerosols at AOD ≈ 0.4. This value represents close to 50 % of the retrieved AOD values over the time period analysed (Fig. 1b), suggesting that, in the near-present climate, enhanced convection is as likely as suppressed convection. Current trends and future projections suggest that biomass burning frequency and scale will increase throughout the Amazon rainforest (IPCC, 2013; Boisier et al., 2015); this will increase the likelihood of deep convection being suppressed and, overall, will result in reduced cumulative precipitation to the region and potentially act as a positive feedback to fire activity and AOD. Simultaneously, increases in AOD are correlated with an overall brightening of the scene albedo (Fig. 10) and a warmer, drier boundary layer (Fig. 9). Together with reduced precipitation, there may be important impacts to the Amazonian biosphere and ecosystem.
The pronounced diurnal cycle in the response of the clouds to aerosols is consistent with high-resolution modelling studies from the Amazon (Herbert et al., 2021) and over Borneo (Hodzic and Duvel, 2018), a region similarly dominated by biomass burning aerosols. The same contrasting responses in LWP and IWP were found when analysing scenes independently (Figs. 2 and 7) and the domain as a whole (Fig. S2), suggesting that the signal is independent of scale. These strong repeatable signals point towards the possibility of using the amplitude of the diurnal cycle in key cloud properties as an important source of information for constraining global ARI and ACI effects on the climate. This could be applied to both Earth system models and observations, working towards reducing the uncertainty in current forcing estimates (Forster et al., 2021), with the caveat that current Earth system models used to produce the forcing estimates do not fully capture these convective processes. This study highlights the need for explicit treatment of convection in climate models.
Both overpasses suggest that AOD drives an overall SW cooling at the TOA due to changes in cloud properties. This is at odds with the theoretical model proposed by Koren et al. (2004), in which it is estimated that cloud field adjustments due to smoke (cloud thinning) over the Amazon would counteract some of the cooling, which suggests that the widespread radiative impact of smoke aerosols over the Amazon rainforest is more important than previously thought. We also find important changes to high-altitude cloud coverage, likely from deep convective outflow, which impact the outgoing LW at the TOA. Unlike over the tropical oceans (Koren et al., 2010a), these are of secondary importance when compared to changes in SW but will influence the daily mean radiative effect due to their dominating role during the night. This study would benefit from using geostationary satellite data from GOES to validate our findings and to extend the analysis throughout the full diurnal cycle, but this would require well-validated aerosol retrievals, which are currently unavailable.
All satellite datasets used in this analysis are available online. MODIS datasets are available via the NASA Level-1 and Atmosphere Archive & Distribution System (LAADS) Distributed Active Archive Centre (DAAC) at https://ladsweb.modaps.eosdis.nasa.gov/archive/allData/61/ (NASA, 2023). IMERG daily and instantaneous data are available via the NASA Goddard Earth Sciences Data and Information Services Centre (GESDISC) at https://gpm1.gesdisc.eosdis.nasa.gov/data/ (NASA, 2022). ERA5 reanalysis datasets from the European Centre for Medium-Range Weather Forecasts (ECWMF) are available via the Natural Environment Research Council (NERC) Centre for Environmental Data analysis (CEDA), accessed via https://data.ceda.ac.uk/badc/ecmwf-era5/ (European Centre for Medium-Range Weather Forecasts, 2022a). AIRS data are available via NASA's Earth Science Data Systems (ESDS) programme at https://www.earthdata.nasa.gov/ (NASA EOSDIS, 2021). AERONET data are available from the AERONET (AErosol RObotic NETwork) programme (https://aeronet.gsfc.nasa.gov/; NASA Goddard Space Flight Center, 2023). CERES datasets are available from the NASA Langley Research Center (LARC) CERES Ordering, Subsetting, Visualization Tool (https://ceres.larc.nasa.gov/; NASA, 2021). HYSPLIT back trajectories were performed using the National Oceanic and Atmospheric Administration (NOAA) Air Resources Laboratory (ARL) HYSPLIT-WEB transport and dispersion model (https://www.ready.noaa.gov/HYSPLIT.php; NOAA, 2022). The ecRad offline radiative transfer model is available via GitHub at https://github.com/ecmwf-ifs/ecrad (European Centre for Medium-Range Weather Forecasts, 2022b). The spatially and temporally collocated datasets (at 1 and 2∘ resolution) are available, alongside the relevant scripts for reproducing all figures, at https://doi.org/10.5281/zenodo.7664442 (Herbert, 2022).
The supplement related to this article is available online at: https://doi.org/10.5194/acp-23-4595-2023-supplement.
RH designed the study and acquired the datasets. RH wrote the necessary scripts and analysed the dataset. RH prepared the paper with contributions from PS.
At least one of the (co-)authors is a member of the editorial board of Atmospheric Chemistry and Physics. The peer-review process was guided by an independent editor, and the authors also have no other competing interests to declare.
Publisher's note: Copernicus Publications remains neutral with regard to jurisdictional claims in published maps and institutional affiliations.
This research was supported by the European Research Council project RECAP under the European Union's Horizon 2020 research and innovation programme (grant no. 724602) and by the FORCeS project under the European Union's Horizon 2020 research programme with grant agreement no. 821205.
This work used the ARCHER2 UK National Supercomputing Service (https://www.archer2.ac.uk, last access: 2 October 2022).
This research has been supported by the European Union's Horizon 2020 projects RECAP (grant no. 724602) and FORCeS (grant no. 821205).
This paper was edited by Matthias Tesche and reviewed by two anonymous referees.
Andreae, M. O., Rosenfeld, D., Artaxo, P., Costa, A. A., Frank, G. P., Longo, K. M., and Silva-Dias, M. A. F.: Smoking Rain Clouds over the Amazon, Science, 303, 1337–1342, https://doi.org/10.1126/science.1092779, 2004.
Aragão, L. E. O. C., Anderson, L. O., Fonseca, M. G., Rosan, T. M., Vedovato, L. B., Wagner, F. H., Silva, C. V. J., Silva Junior, C. H. L., Arai, E., Aguiar, A. P., Barlow, J., Berenguer, E., Deeter, M. N., Domingues, L. G., Gatti, L., Gloor, M., Malhi, Y., Marengo, J. A., Miller, J. B., Phillips, O. L., and Saatchi, S.: 21st Century drought-related fires counteract the decline of Amazon deforestation carbon emissions, Nat. Commun., 9, 536, https://doi.org/10.1038/s41467-017-02771-y, 2018.
Barkley, A. E., Prospero, J. M., Mahowald, N., Hamilton, D. S., Popendorf, K. J., Oehlert, A. M., Pourmand, A., Gatineau, A., Panechou-Pulcherie, K., Blackwelder, P., and Gaston, C. J.: African biomass burning is a substantial source of phosphorus deposition to the Amazon, Tropical Atlantic Ocean, and Southern Ocean, P. Natl. Acad. Sci. USA, 116, 16216–16221, https://doi.org/10.1073/pnas.1906091116, 2019.
Bevan, S. L., North, P. R. J., Grey, W. M. F., Los, S. O., and Plummer, S. E.: The impact of atmospheric aerosol from biomass burning on Amazon dry-season drought, in: European Space Agency, Special Publication, ESA SP, https://doi.org/10.1029/2008jd011112, 2008.
Boisier, J. P., Ciais, P., Ducharne, A., and Guimberteau, M.: Projected strengthening of Amazonian dry season by constrained climate model simulations, Nat. Clim. Chang., 5, 656–660, https://doi.org/10.1038/nclimate2658, 2015.
Bond, T. C., Doherty, S. J., Fahey, D. W., Forster, P. M., Berntsen, T., DeAngelo, B. J., Flanner, M. G., Ghan, S., Kärcher, B., Koch, D., Kinne, S., Kondo, Y., Quinn, P. K., Sarofim, M. C., Schultz, M. G., Schulz, M., Venkataraman, C., Zhang, H., Zhang, S., Bellouin, N., Guttikunda, S. K., Hopke, P. K., Jacobson, M. Z., Kaiser, J. W., Klimont, Z., Lohmann, U., Schwarz, J. P., Shindell, D., Storelvmo, T., Warren, S. G., and Zender, C. S.: Bounding the role of black carbon in the climate system: A scientific assessment, J. Geophys. Res.-Atmos., 118, 5380–5552, https://doi.org/10.1002/jgrd.50171, 2013.
Boulton, C. A., Lenton, T. M., and Boers, N.: Pronounced loss of Amazon rainforest resilience since the early 2000s, Nat. Clim. Chang., 12, 271–278, https://doi.org/10.1038/s41558-022-01287-8, 2022.
Braga, R. C., Rosenfeld, D., Weigel, R., Jurkat, T., Andreae, M. O., Wendisch, M., Pöhlker, M. L., Klimach, T., Pöschl, U., Pöhlker, C., Voigt, C., Mahnke, C., Borrmann, S., Albrecht, R. I., Molleker, S., Vila, D. A., Machado, L. A. T., and Artaxo, P.: Comparing parameterized versus measured microphysical properties of tropical convective cloud bases during the ACRIDICON–CHUVA campaign, Atmos. Chem. Phys., 17, 7365–7386, https://doi.org/10.5194/acp-17-7365-2017, 2017.
Camponogara, G., Silva Dias, M. A. F., and Carrió, G. G.: Relationship between Amazon biomass burning aerosols and rainfall over the La Plata Basin, Atmos. Chem. Phys., 14, 4397–4407, https://doi.org/10.5194/acp-14-4397-2014, 2014.
Cesana, G. and Storelvmo, T.: Improving climate projections by understanding how cloud phase affects radiation, J. Geophys. Res.-Atmos., 122, 4594–4599, https://doi.org/10.1002/2017JD026927, 2017.
Ciemer, C., Rehm, L., Kurths, J., Donner, R. V., Winkelmann, R., and Boers, N.: An early-warning indicator for Amazon droughts exclusively based on tropical Atlantic sea surface temperatures, Environ. Res. Lett., 15, 094087, https://doi.org/10.1088/1748-9326/ab9cff, 2020.
Dagan, G., Stier, P., Christensen, M., Cioni, G., Klocke, D., and Seifert, A.: Atmospheric energy budget response to idealized aerosol perturbation in tropical cloud systems, Atmos. Chem. Phys., 20, 4523–4544, https://doi.org/10.5194/acp-20-4523-2020, 2020.
de Oliveira, G., Chen, J. M., Mataveli, G. A. V., Chaves, M. E. D., Seixas, H. T., da Cardozo, F. S., Shimabukuro, Y. E., He, L., Stark, S. C., and dos Santos, C. A. C.: Rapid recent deforestation incursion in a vulnerable indigenous land in the Brazilian Amazon and fire-driven emissions of fine particulate aerosol pollutants, Forests, 11, 829–829, https://doi.org/10.3390/f11080829, 2020.
Di Biagio, C., Formenti, P., Balkanski, Y., Caponi, L., Cazaunau, M., Pangui, E., Journet, E., Nowak, S., Andreae, M. O., Kandler, K., Saeed, T., Piketh, S., Seibert, D., Williams, E., and Doussin, J.-F.: Complex refractive indices and single-scattering albedo of global dust aerosols in the shortwave spectrum and relationship to size and iron content, Atmos. Chem. Phys., 19, 15503–15531, https://doi.org/10.5194/acp-19-15503-2019, 2019.
European Centre for Medium-Range Weather Forecasts: ECMWF Re-Analysis 5 (ERA5) model data, The Centre for Environmental Data Analysis (CEDA) Archive [data set], https://data.ceda.ac.uk/badc/ecmwf-era5/, last access: 10 June 2022a.
European Centre for Medium-Range Weather Forecasts: ECRAD – ECMWF atmospheric radiation scheme, GitHub [code], https://github.com/ecmwf-ifs/ecrad, last access: 7 October 2022b.
Fan, J., Rosenfeld, D., Zhang, Y., Giangrande, S. E., Li, Z., Machado, L. A. T., Martin, S. T., Yang, Y., Wang, J., Artaxo, P., Barbosa, H. M. J., Braga, R. C., Comstock, J. M., Feng, Z., Gao, W., Gomes, H. B., Mei, F., Pöhlker, C., Pöhlker, M. L., Pöschl, U., and De Souza, R. A. F.: Substantial convection and precipitation enhancements by ultrafine aerosol particles, Science, 359, 411–418, https://doi.org/10.1126/science.aan8461, 2018.
Forster, P., Storelvmo, T., Armour, K., Collins, W., Dufresne, J.-L., Frame, D., Lunt, D., J., Mauritsen, T., Palmer, M., D., Watanabe, M., Wild, M., and Zhang, H.: The Earth's Energy Budget, Climate Feedbacks, and Climate Sensitivity, in: Climate Change 2021: The Physical Science Basis. Contribution of Working Group I to the Sixth Assessment Report of the Intergovernmental Panel on Climate Change, edited by: Masson-Delmotte, V., Zhai, P., Pirani, A., Connors, S. L., Péan, C., Berger, S., Caud, N., Chen, Y., Goldfarb, L., Gomis, M. I., Huang, M., Leitzell, K., Lonnoy, E., Matthews, J. B. R., Maycock, T. K., Waterfield, T., Yelekçi, O., Yu, R., and Zhou, B., Cambridge University Press, Cambridge, United Kingdom and New York, NY, USA, 923–1054, https://doi.org/10.1017/9781009157896.009, 2021.
Gonçalves, W. A., Machado, L. A. T., and Kirstetter, P.-E.: Influence of biomass aerosol on precipitation over the Central Amazon: an observational study, Atmos. Chem. Phys., 15, 6789–6800, https://doi.org/10.5194/acp-15-6789-2015, 2015.
Gonzalez-Alonso, L., Val Martin, M., and Kahn, R. A.: Biomass-burning smoke heights over the Amazon observed from space, Atmos. Chem. Phys., 19, 1685–1702, https://doi.org/10.5194/acp-19-1685-2019, 2019.
Gryspeerdt, E., Stier, P., White, B. A., and Kipling, Z.: Wet scavenging limits the detection of aerosol effects on precipitation, Atmos. Chem. Phys., 15, 7557–7570, https://doi.org/10.5194/acp-15-7557-2015, 2015.
Herbert, R.: Dataset for manuscript “Satellite Observations of Smoke-Cloud-Radiation Interactions Over the Amazon Rainforest”, Zenodo [data set], https://doi.org/10.5281/zenodo.7664442, 2022.
Herbert, R., Stier, P., and Dagan, G.: Isolating Large-Scale Smoke Impacts on Cloud and Precipitation Processes Over the Amazon With Convection Permitting Resolution, J. Geophys. Res.-Atmos., 126, e2021JD034615, https://doi.org/10.1029/2021JD034615, 2021.
Herbert, R. J., Bellouin, N., Highwood, E. J., and Hill, A. A.: Diurnal cycle of the semi-direct effect from a persistent absorbing aerosol layer over marine stratocumulus in large-eddy simulations, Atmos. Chem. Phys., 20, 1317–1340, https://doi.org/10.5194/acp-20-1317-2020, 2020.
Hodzic, A. and Duvel, J. P.: Impact of Biomass Burning Aerosols on the Diurnal Cycle of Convective Clouds and Precipitation Over a Tropical Island, J. Geophys. Res.-Atmos., 123, 1017–1036, https://doi.org/10.1002/2017JD027521, 2018.
Hogan, R. J. and Bozzo, A.: A Flexible and Efficient Radiation Scheme for the ECMWF Model, J. Adv. Model. Earth Syst., 10, 1990–2008, https://doi.org/10.1029/2018MS001364, 2018.
Holanda, B. A., Pöhlker, M. L., Walter, D., Saturno, J., Sörgel, M., Ditas, J., Ditas, F., Schulz, C., Franco, M. A., Wang, Q., Donth, T., Artaxo, P., Barbosa, H. M. J., Borrmann, S., Braga, R., Brito, J., Cheng, Y., Dollner, M., Kaiser, J. W., Klimach, T., Knote, C., Krüger, O. O., Fütterer, D., Lavrič, J. V., Ma, N., Machado, L. A. T., Ming, J., Morais, F. G., Paulsen, H., Sauer, D., Schlager, H., Schneider, J., Su, H., Weinzierl, B., Walser, A., Wendisch, M., Ziereis, H., Zöger, M., Pöschl, U., Andreae, M. O., and Pöhlker, C.: Influx of African biomass burning aerosol during the Amazonian dry season through layered transatlantic transport of black carbon-rich smoke, Atmos. Chem. Phys., 20, 4757–4785, https://doi.org/10.5194/acp-20-4757-2020, 2020.
Huang, Y., Zhu, B., Zhu, Z., Zhang, T., Gong, W., Ji, Y., Xia, X., Wang, L., Zhou, X., and Chen, D.: Evaluation and Comparison of MODIS Collection 6.1 and Collection 6 Dark Target Aerosol Optical Depth over Mainland China Under Various Conditions Including Spatiotemporal Distribution, Haze Effects, and Underlying Surface, Earth and Space Science, 6, 2575–2592, https://doi.org/10.1029/2019EA000809, 2019.
Igel, A. L. and van den Heever, S. C.: Invigoration or Enervation of Convective Clouds by Aerosols?, Geophys. Res. Lett., 48, e2021GL093804, https://doi.org/10.1029/2021GL093804, 2021.
IPCC: Climate Change 2013: The Physical Science Basis, Contribution of Working Group I to the Fifth Assessment Report of the Intergovernmental Panel on Climate Change, edited by: Stocker, T. F., Qin, D., Plattner, G.-K., Tignor, M., Allen, S. K., Boschung, J., Nauels, A., Xia, Y., Bex, V., and Midgley, P. M., Cambridge University Press, Cambridge, United Kingdom and New York, NY, USA, 1535 pp., https://doi.org/10.1017/CBO9781107415324, 2013.
Jimenez, J. C., Marengo, J. A., Alves, L. M., Sulca, J. C., Takahashi, K., Ferrett, S., and Collins, M.: The role of ENSO flavours and TNA on recent droughts over Amazon forests and the Northeast Brazil region, Int. J. Climatol., 41, 3761–3780, https://doi.org/10.1002/joc.6453, 2021.
Jiménez-Muñoz, J. C., Mattar, C., Barichivich, J., Santamaría-Artigas, A., Takahashi, K., Malhi, Y., Sobrino, J. A., and Schrier, G. van der: Record-breaking warming and extreme drought in the Amazon rainforest during the course of El Niño 2015–2016, Sci. Rep., 6, 33130, https://doi.org/10.1038/srep33130, 2016.
Khain, A., Rosenfeld, D., and Pokrovsky, A.: Aerosol impact on the dynamics and microphysics of deep convective clouds, Q. J. Roy. Meteor. Soc., 131, 2639–2663, https://doi.org/10.1256/qj.04.62, 2005.
Koch, D. and Del Genio, A. D.: Black carbon semi-direct effects on cloud cover: review and synthesis, Atmos. Chem. Phys., 10, 7685–7696, https://doi.org/10.5194/acp-10-7685-2010, 2010.
Koren, I., Kaufman, Y. J., Remer, L. A., and Martins, J. V.: Measurement of the Effect of Amazon Smoke on Inhibition of Cloud Formation, Science, 303, 1342–1345, https://doi.org/10.1126/science.1089424, 2004.
Koren, I., Vanderlei Martins, J., Remer, L. A., and Afargan, H.: Smoke invigoration versus inhibition of clouds over the amazon, Science, 321, 946–949, https://doi.org/10.1126/science.1159185, 2008.
Koren, I., Remer, L. A., Altaratz, O., Martins, J. V., and Davidi, A.: Aerosol-induced changes of convective cloud anvils produce strong climate warming, Atmos. Chem. Phys., 10, 5001–5010, https://doi.org/10.5194/acp-10-5001-2010, 2010a.
Koren, I., Feingold, G., and Remer, L. A.: The invigoration of deep convective clouds over the Atlantic: aerosol effect, meteorology or retrieval artifact?, Atmos. Chem. Phys., 10, 8855–8872, https://doi.org/10.5194/acp-10-8855-2010, 2010b.
Koren, I., Dagan, G., and Altaratz, O.: From aerosol-limited to invigoration of warm convective clouds, Science, 344, 1143–1146, https://doi.org/10.1126/science.1252595, 2014.
Lebo, Z.: A numerical investigation of the potential effects of aerosol-induced warming and updraft width and slope on updraft intensity in deep convective clouds, J. Atmos. Sci., 75, 535–554, https://doi.org/10.1175/JAS-D-16-0368.1, 2018.
Lee, S. S., Feingold, G., McComiskey, A., Yamaguchi, T., Koren, I., Vanderlei Martins, J., and Yu, H.: Effect of gradients in biomass burning aerosol on shallow cumulus convective circulations, J. Geophys. Res.-Atmos., 119, 9948–9964, https://doi.org/10.1002/2014JD021819, 2014.
Levy, R. C., Mattoo, S., Munchak, L. A., Remer, L. A., Sayer, A. M., Patadia, F., and Hsu, N. C.: The Collection 6 MODIS aerosol products over land and ocean, Atmos. Meas. Tech., 6, 2989–3034, https://doi.org/10.5194/amt-6-2989-2013, 2013.
Libonati, R., Pereira, J. M. C., Da Camara, C. C., Peres, L. F., Oom, D., Rodrigues, J. A., Santos, F. L. M., Trigo, R. M., Gouveia, C. M. P., Machado-Silva, F., Enrich-Prast, A., and Silva, J. M. N.: Twenty-first century droughts have not increasingly exacerbated fire season severity in the Brazilian Amazon, Sci. Rep., 11, 4400, https://doi.org/10.1038/s41598-021-82158-8, 2021.
Liu, L., Cheng, Y., Wang, S., Wei, C., Pöhlker, M. L., Pöhlker, C., Artaxo, P., Shrivastava, M., Andreae, M. O., Pöschl, U., and Su, H.: Impact of biomass burning aerosols on radiation, clouds, and precipitation over the Amazon: relative importance of aerosol–cloud and aerosol–radiation interactions, Atmos. Chem. Phys., 20, 13283–13301, https://doi.org/10.5194/acp-20-13283-2020, 2020.
Liu, S., Aiken, A. C., Arata, C., Dubey, M. K., Stockwell, C. E., Yokelson, R. J., Stone, E. A., Jayarathne, T., Robinson, A. L., DeMott, P. J., and Kreidenweis, S. M.: Aerosol single scattering albedo dependence on biomass combustion efficiency: Laboratory and field studies, Geophys. Res. Lett., 41, 742–748, https://doi.org/10.1002/2013GL058392, 2014.
Marinescu, P. J., Heever, S. C. van den, Heikenfeld, M., Barrett, A. I., Barthlott, C., Hoose, C., Fan, J., Fridlind, A. M., Matsui, T., Miltenberger, A. K., Stier, P., Vie, B., White, B. A., and Zhang, Y.: Impacts of Varying Concentrations of Cloud Condensation Nuclei on Deep Convective Cloud Updrafts – A Multimodel Assessment, J. Atmos. Sci., 78, 1147–1172, https://doi.org/10.1175/JAS-D-20-0200.1, 2021.
Martins, J. A. and Silva Dias, M. A. F.: The impact of smoke from forest fires on the spectral dispersion of cloud droplet size distributions in the Amazonian region, Environ. Res. Lett., 4, 015002, https://doi.org/10.1088/1748-9326/4/1/015002, 2009.
Martins, J. A., Silva Dias, M. A. F., and Gonçalves, F. L. T.: Impact of biomass burning aerosols on precipitation in the Amazon: A modeling case study, J. Geophys. Res., 114, D02207, https://doi.org/10.1029/2007jd009587, 2009.
McClure, C. D., Lim, C. Y., Hagan, D. H., Kroll, J. H., and Cappa, C. D.: Biomass-burning-derived particles from a wide variety of fuels – Part 1: Properties of primary particles, Atmos. Chem. Phys., 20, 1531–1547, https://doi.org/10.5194/acp-20-1531-2020, 2020.
NASA: NASA CERES ordering, subsetting, visualization tool, NASA [data set], https://ceres.larc.nasa.gov/, last access: 29 April 2021.
NASA: NASA GESDISC data archive, Goddard Earth Sciences Data and Information Services Center [data set], https://gpm1.gesdisc.eosdis.nasa.gov/data/, last access: 2 June 2022.
NASA: Level-1 and Atmosphere Archive & Distribution System Distributed Active Archive Center, NASA EOSDIS [data set], https://ladsweb.modaps.eosdis.nasa.gov/archive/allData/61/, last access: 27 January 2023.
NASA EOSDIS: EARTHDATA search archive, NASA EOSDIS [data set], https://www.earthdata.nasa.gov/, last access: 21 April 2021.
NASA Goddard Space Flight Center: The AERONET data display interface, NASA Goddard Space Flight Center [data set], https://aeronet.gsfc.nasa.gov/, last access: 14 February 2023.
NOAA: HYSPLIT-WEB trajectory model, NOAA [code], https://www.ready.noaa.gov/HYSPLIT.php, last access: 14 May 2022.
Palácios, R. da S., Romera, K. S., Curado, L. F. A., Banga, N. M., Rothmund, L. D., Sallo, F. d. S., Morais, D., Santos, A. C. A., Moraes, T. J., Morais, F. G., Landulfo, E., Franco, M. A. de M., Kuhnen, I. A., Marques, J. B., Nogueira, J. d. S., Júnior, L. C. G. d. V., and Rodrigues, T. R.: Long Term Analysis of Optical and Radiative Properties of Aerosols in the Amazon Basin, Aerosol Air Qual. Res., 20, 139–154, https://doi.org/10.4209/aaqr.2019.04.0189, 2020.
Petters, M. D., Carrico, C. M., Kreidenweis, S. M., Prenni, A. J., DeMott, P. J., Collett Jr., J. L., and Moosmüller, H.: Cloud condensation nucleation activity of biomass burning aerosol, J. Geophys. Res.-Atmos., 114, D22205, https://doi.org/10.1029/2009JD012353, 2009.
Platnick, S., Meyer, K. G., King, M. D., Wind, G., Amarasinghe, N., Marchant, B., Arnold, G. T., Zhang, Z., Hubanks, P. A., Holz, R. E., Yang, P., Ridgway, W. L., and Riedi, J.: The MODIS Cloud Optical and Microphysical Products: Collection 6 Updates and Examples From Terra and Aqua, IEEE T. Geosci. Remote, 55, 502–525, https://doi.org/10.1109/TGRS.2016.2610522, 2017.
Rosário, N. E., Yamasoe, M. A., Brindley, H., Eck, T. F., and Schafer, J.: Downwelling solar irradiance in the biomass burning region of the southern Amazon: Dependence on aerosol intensive optical properties and role of water vapor, J. Geophys. Res.-Atmos., 116, D18304, https://doi.org/10.1029/2011JD015956, 2011.
Sayer, A. M., Hsu, N. C., Lee, J., Kim, W. V., and Dutcher, S. T.: Validation, Stability, and Consistency of MODIS Collection 6.1 and VIIRS Version 1 Deep Blue Aerosol Data Over Land, J. Geophys. Res.-Atmos., 124, 4658–4688, https://doi.org/10.1029/2018JD029598, 2019.
Seiki, T. and Nakajima, T.: Aerosol Effects of the Condensation Process on a Convective Cloud Simulation, J. Atmos. Sci., 71, 833–853, https://doi.org/10.1175/JAS-D-12-0195.1, 2014.
Stein, A. F., Draxler, R. R., Rolph, G. D., Stunder, B. J. B., Cohen, M. D., and Ngan, F.: NOAA's HYSPLIT Atmospheric Transport and Dispersion Modeling System, B. Am. Meteorol. Soc., 96, 2059–2077, https://doi.org/10.1175/BAMS-D-14-00110.1, 2015.
Ten Hoeve, J. E., Remer, L. A., and Jacobson, M. Z.: Microphysical and radiative effects of aerosols on warm clouds during the Amazon biomass burning season as observed by MODIS: impacts of water vapor and land cover, Atmos. Chem. Phys., 11, 3021–3036, https://doi.org/10.5194/acp-11-3021-2011, 2011.
Ten Hoeve, J. E., Remer, L. A., Correia, A. L., and Jacobson, M. Z.: Recent shift from forest to savanna burning in the Amazon Basin observed by satellite, Environ. Res. Lett., 7, 024020, https://doi.org/10.1088/1748-9326/7/2/024020, 2012.
Thornhill, G. D., Ryder, C. L., Highwood, E. J., Shaffrey, L. C., and Johnson, B. T.: The effect of South American biomass burning aerosol emissions on the regional climate, Atmos. Chem. Phys., 18, 5321–5342, https://doi.org/10.5194/acp-18-5321-2018, 2018.
Twohy, C. H., Toohey, D. W., Levin, E. J. T., DeMott, P. J., Rainwater, B., Garofalo, L. A., Pothier, M. A., Farmer, D. K., Kreidenweis, S. M., Pokhrel, R. P., Murphy, S. M., Reeves, J. M., Moore, K. A., and Fischer, E. V.: Biomass Burning Smoke and Its Influence on Clouds Over the Western U. S., Geophys. Res. Lett., 48, e2021GL094224, https://doi.org/10.1029/2021GL094224, 2021.
Vakkari, V., Kerminen, V.-M., Beukes, J. P., Tiitta, P., van Zyl, P. G., Josipovic, M., Venter, A. D., Jaars, K., Worsnop, D. R., Kulmala, M., and Laakso, L.: Rapid changes in biomass burning aerosols by atmospheric oxidation, Geophys. Res. Lett., 41, 2644–2651, https://doi.org/10.1002/2014GL059396, 2014.
van der Werf, G. R., Randerson, J. T., Giglio, L., van Leeuwen, T. T., Chen, Y., Rogers, B. M., Mu, M., van Marle, M. J. E., Morton, D. C., Collatz, G. J., Yokelson, R. J., and Kasibhatla, P. S.: Global fire emissions estimates during 1997–2016, Earth Syst. Sci. Data, 9, 697–720, https://doi.org/10.5194/essd-9-697-2017, 2017.
Wei, J., Li, Z., Peng, Y., and Sun, L.: MODIS Collection 6.1 aerosol optical depth products over land and ocean: validation and comparison, Atmos. Environ., 201, 428–440, https://doi.org/10.1016/j.atmosenv.2018.12.004, 2019.
Wendisch, M., Poschl, U., Andreae, M. O., MacHado, L. A. T., Albrecht, R., Schlager, H., Rosenfeld, D., Martin, S. T., Abdelmonem, A., Afchine, A., Araujo, A. C., Artaxo, P., Aufmhoff, H., Barbosa, H. M. J., Borrmann, S., Braga, R., Buchholz, B., Cecchini, M. A., Costa, A., Curtius, J., Dollner, M., Dorf, M., Dreiling, V., Ebert, V., Ehrlich, A., Ewald, F., Fisch, G., Fix, A., Frank, F., Futterer, D., Heckl, C., Heidelberg, F., Huneke, T., Jakel, E., Jarvinen, E., Jurkat, T., Kanter, S., Kastner, U., Kenntner, M., Kesselmeier, J., Klimach, T., Knecht, M., Kohl, R., Kolling, T., Kramer, M., Kruger, M., Krisna, T. C., Lavric, J. V., Longo, K., Mahnke, C., Manzi, A. O., Mayer, B., Mertes, S., Minikin, A., Molleker, S., Munch, S., Nillius, B., Pfeilsticker, K., Pohlker, C., Roiger, A., Rose, D., Rosenow, D., Sauer, D., Schnaiter, M., Schneider, J., Schulz, C., De Souza, R. A. F., Spanu, A., Stock, P., Vila, D., Voigt, C., Walser, A., Walter, D., Weigel, R., Weinzierl, B., Werner, F., Yamasoe, M. A., Ziereis, H., Zinner, T., and Zoger, M.: Acridicon-chuva campaign: Studying tropical deep convective clouds and precipitation over amazonia using the New German research aircraft HALO, B. Am. Meteorol. Soc., 97, 1885–1908, https://doi.org/10.1175/BAMS-D-14-00255.1, 2016.
White, B., Gryspeerdt, E., Stier, P., Morrison, H., Thompson, G., and Kipling, Z.: Uncertainty from the choice of microphysics scheme in convection-permitting models significantly exceeds aerosol effects, Atmos. Chem. Phys., 17, 12145–12175, https://doi.org/10.5194/acp-17-12145-2017, 2017.
Wu, L., Su, H., and Jiang, J. H.: Regional simulations of deep convection and biomass burning over South America: 2. Biomass burning aerosol effects on clouds and precipitation, J. Geophys. Res.-Atmos., 116, D17209, https://doi.org/10.1029/2011JD016106, 2011.
Yoon, J.-H. and Zeng, N.: An Atlantic influence on Amazon rainfall, Clim. Dynam., 34, 249–264, https://doi.org/10.1007/s00382-009-0551-6, 2010.
Yu, H., Fu, R., Dickinson, R. E., Zhang, Y., Chen, M., and Wang, H.: Interannual variability of smoke and warm cloud relationships in the Amazon as inferred from MODIS retrievals, Remote Sens. Environ., 111, 435–449, https://doi.org/10.1016/j.rse.2007.04.003, 2007.
Zaveri, R. A., Wang, J., Fan, J., Zhang, Y., Shilling, J. E., Zelenyuk, A., Mei, F., Newsom, R., Pekour, M., Tomlinson, J., Comstock, J. M., Shrivastava, M., Fortner, E., Machado, L. A. T., Artaxo, P., and Martin, S. T.: Rapid growth of anthropogenic organic nanoparticles greatly alters cloud life cycle in the Amazon rainforest, Science Advances, 8, eabj0329, https://doi.org/10.1126/sciadv.abj0329, 2022.
Zhang, M., Zhang, L., He, Q., and Yuan, Y.: Evaluation of the MODIS Collection 6.1 3 km aerosol optical depth product over China, Atmos. Environ., 273, 118970, https://doi.org/10.1016/j.atmosenv.2022.118970, 2022.
Zhang, R., Khalizov, A. F., Pagels, J., Zhang, D., Xue, H., and McMurry, P. H.: Variability in morphology, hygroscopicity, and optical properties of soot aerosols during atmospheric processing, P. Natl. Acad. Sci. USA, 105, 10291–10296, https://doi.org/10.1073/pnas.0804860105, 2008.
Zhang, Y., Fu, R., Yu, H., Dickinson, R. E., Juarez, R. N., Chin, M., and Wang, H.: A regional climate model study of how biomass burning aerosol impacts land-atmosphere interactions over the Amazon, J. Geophys. Res., 113, D14S15, https://doi.org/10.1029/2007jd009449, 2008.
Zhang, Y., Fu, R., Yu, H., Qian, Y., Dickinson, R., Silva Dias, M. A. F., da Silva Dias, P. L., and Fernandes, K.: Impact of biomass burning aerosol on the monsoon circulation transition over Amazonia, Geophys. Res. Lett., 36, L10814, https://doi.org/10.1029/2009GL037180, 2009.
Zhang, Y., Fan, J., Logan, T., Li, Z., and Homeyer, C. R.: Wildfire Impact on Environmental Thermodynamics and Severe Convective Storms, Geophys. Res. Lett., 46, 10082–10093, https://doi.org/10.1029/2019GL084534, 2019.
Zhao, B., Wang, Y., Gu, Y., Liou, K.-N., Jiang, J. H., Fan, J., Liu, X., Huang, L., and Yung, Y. L.: Ice nucleation by aerosols from anthropogenic pollution, Nat. Geosci., 12, 602–607, https://doi.org/10.1038/s41561-019-0389-4, 2019.