the Creative Commons Attribution 4.0 License.
the Creative Commons Attribution 4.0 License.
 | 12 Jan 2023
Quantitative impacts of vertical transport on the long-term trend of nocturnal ozone increase over the Pearl River Delta region during 2006–2019
Yongkang Wu
Yingchang You
Qianqian Xie
Shiguo Jia
Xuemei Wang
The Pearl River Delta (PRD) region in southern China has been subject to severe ozone (O3) pollution during daytime and anomalous nocturnal O3 increase (NOI) during nighttime. In this study, the spatiotemporal variation of NOI events in the PRD region from 2006 to 2019 is comprehensively analysed, and the role of vertical transport in the occurrence of NOI events is quantified based on observed surface and vertical O3 and the fifth-generation European Centre for Medium-Range Weather Forecasts (ECMWF) reanalysis (ERA5) dataset. The results show that the average annual frequency of NOI events in the whole PRD region during the 14 year period is estimated to be 53 ± 16 d yr−1, with an average of 58 ± 11 µg m−3 for the nocturnal O3 peak (NOP) concentration. Low-level jets (LLJs) are the main meteorological processes triggering NOI events, explaining on average 61 % of NOI events. Annual NOI events exhibit an upward trend before 2011 (4.70 d yr−1) and a downward trend thereafter (−0.72 d yr−1), which is consistent with the annual variation of LLJs (r=0.88, p<0.01). Although the contribution of convective storms (Conv) to NOI events is relatively small with an average value of 11 %, Conv-induced NOI events steadily increased at a rate of 0.26 d yr−1 during this 14 year period due to the impact of urbanisation. Seasonally, a relatively higher frequency of NOI events is observed in spring and autumn, which is consistent with the seasonal pattern of LLJs and maximum daily 8 h average (MDA8) O3. Spatially, NOI events are frequent in the eastern PRD, which agrees well with the spatial distribution of the frequency of LLJs and partially overlaps with the distribution of MDA8 O3 concentration, suggesting that vertical transport plays a more important role in NOI events than daytime O3 concentration. The Weather Research and Forecasting (WRF) model coupled with the Community Multiscale Air Quality (CMAQ) model and the observed vertical O3 profiles are further applied to illustrate the mechanisms of NOI formation caused by LLJs and Conv. The results confirm that both LLJs and Conv trigger NOI events by inducing downdrafts with the difference being that LLJs induce downdrafts by wind shear, while Conv by compensating downdrafts. Through observational and modelling analysis, this study presents the long-term (2006–2019) trends of NOI events in the PRD region and quantifies the contribution of meteorological processes for the first time, emphasising the importance of vertical transport, as well as daytime O3 concentration for the occurrence of NOI events.
- Article
(10531 KB) - Full-text XML
-
Supplement
(1942 KB) - BibTeX
- EndNote


As a secondary pollutant, surface ozone (O3) is formed via photochemical reactions involving nitric oxide (NOx) and volatile organic compounds (VOCs) in the presence of sunlight. Therefore, O3 shows significant diurnal variation, with concentration peaks observed during daytime (Kleinman et al., 1994; Zhang et al., 2004). During nighttime, O3 production ceases owing to the absence of sunlight, and dry deposition and NO titration (Eq. R1) remove O3 directly from the atmosphere, leading to relatively low O3 concentrations at night (Jacob, 2000; Brown et al., 2006).
However, O3 concentrations do not always remain at low levels during nighttime, and frequent nocturnal O3 increase (NOI) events have been observed in various countries in Asia, Europe, North America, etc. in different topographies (plains, valleys, mountains, etc.) (Kuang et al., 2011; Kulkarni et al., 2013; Klein et al., 2019; Udina et al., 2019; Zhu et al., 2020). Kulkarni et al. (2015) found that NOI events were observed around 03:00 (LT) in the UK, with concentrations as high as 118 µg m−3, which was much higher than the monthly average daytime O3 concentration (69 ± 10 µg m−3). Yusoff et al. (2019) also reported that frequent NOI events were observed in some cities in Malaysia, and the annual trend of nocturnal O3 concentration was found to be on the increase based on 11 years of ground-based measurements. High nocturnal surface O3 concentrations have adverse effects on crops and vegetation, leading to plant water loss, stomatal sluggishness, and reduction in plant production (Caird et al., 2007; Cirelli et al., 2016; Yue et al., 2017), as well as on human health (Kurt et al., 2016; Carré et al., 2017).
Because there is no photochemical production of O3 at night, NOI events are likely to be due to meteorological processes (Salmond and McKendry, 2002). It has been widely recognised that low-level jets (LLJs) are one of the most important meteorological processes that cause NOI events (Salmond and McKendry, 2002; Kuang et al., 2011; Sullivan et al., 2017). After sunset, radiative cooling and subsequent weakened turbulence result in a stratified nocturnal boundary layer (NBL) with an altitude of 400–500 m (Stull, 1988; Sugimoto et al., 2009; Fan et al., 2022). A residual layer (RL) exists above the NBL, which contains residual O3 produced during daytime. When an LLJ occurs during nighttime, it can break the delamination between the NBL and the RL by wind shear and bring the O3 from the RL to the surface, leading to an accumulation of ground-level O3. An analysis of aircraft data from California has shown that LLJs promote the mixing between the NBL and the RL and transport O3 from the RL to the surface, leading to NOI events (Caputi et al., 2019). Convective storms (Conv) are another meteorological process that contributes to NOI events, especially at the Equator and in tropical areas that have a higher frequency of convection (Prtenjak et al., 2013; Zhu et al., 2020; Wu et al., 2020). Dias-Junior et al. (2017) revealed that downdrafts induced by Conv play an important role in triggering NOI events in the Amazon region of Brazil based on 1 year of observations. Jain et al. (2007) noted that NOI events in India are often accompanied by thunderstorms and stable boundary layer conditions. Other meteorological processes that are highly dependent on topography, such as sea–land breezes and mountain–valley breezes, also contribute to NOI events (Salmond and McKendry, 2002; Nair et al., 2002). Seibert et al. (2000) pointed out that nocturnal O3 concentrations are elevated during foehn events in the Eastern Alps.
Therefore, NOI events are not an exception and can occur worldwide as a result of certain meteorological processes (LLJs, thunderstorms, foehn, etc.) (Hu et al., 2013; Caputi et al., 2019; Klein et al., 2019; Udina et al., 2019; Shith et al., 2021). LLJs and Conv are important factors influencing the generation of NOI events; however, their relative contribution to NOI events has not yet been quantified. Most previous studies have focused on the analysis of a single NOI event or NOI events at limited monitoring sites for short periods (Jain et al., 2007; Hu et al., 2013; He et al., 2021). Consequently, it is of great importance to investigate the long-term trends of NOI events on a larger scale to further quantify the impacts of meteorological processes, such as LLJs and Conv, on NOI events.

In China, ground-level O3 pollution has deteriorated in recent years, especially in the Pearl River Delta (PRD) region (Wang et al., 2017). Liao et al. (2021) investigated ozonesonde profiles recorded in Hong Kong during 2000–2019 and indicated that O3 concentrations in the lower troposphere have increased substantially at a rate of 0.618 ppbv yr−1, indicating a continuous deterioration of O3 pollution in the PRD region over the last 20 years. The PRD region is the first urban agglomeration in China to change its main pollutant from particulate matter with an aerodynamic diameter of less than or equal to 2.5 mm (PM2.5) to O3. Numerous studies in the PRD region have investigated the daytime O3 characteristics, such as the long-term trends (Xue et al., 2014; Li et al., 2022), the nonlinear response of O3 to precursor emissions (Lu et al., 2010; Mao et al., 2022), the source apportionment of O3 (Shen et al., 2015; Liu et al., 2020), and the relative contributions of precursor emissions and meteorology to O3 (L. Yang et al., 2019; Chen et al., 2020). In terms of nighttime O3, Tong and Leung (2012) observed a double-peak pattern of diurnal O3 variation in Hong Kong during 1990–2005 and found that nocturnal O3 peaks are sometimes higher than daytime maxima. He et al. (2021) studied an NOI event in the city Shaoguan in Guangdong province and found that nocturnal mountain–valley breezes from the Nanling Mountains transported O3 from the RL to the surface. However, studies on the spatiotemporal distribution of nocturnal O3 concentration in the PRD region and the factors influencing it are still lacking. There is an urgent need to comprehensively study the characteristics of NOI events in the PRD region, as it is frequently affected by special meteorological processes (such as LLJs and Conv) that favour NOI events due to its special topography with the coast to the south and the mountains to the north. In addition, high population densities and an increasing number of people active at night in the PRD region make NOI events an important potential risk to human health (Kurt et al., 2016; Carré et al., 2017; C. Yang et al., 2019; Zhang et al., 2021).
In this study, the long-term trends and spatial distribution of NOI are presented via in situ hourly O3 concentration data collected from 16 air quality monitoring sites in the PRD region during 2006–2019. In addition, the relative contributions of LLJs and Conv to NOI events are quantified based on the ERA5 reanalysis dataset. Finally, the observed vertical profile of O3 and the Weather Research and Forecasting (WRF) model coupled with the Community Multiscale Air Quality (CMAQ) model are applied to further elaborate the impacts of LLJs and Conv on the selected typical NOI events. This study provides a comprehensive analysis of NOI events and the meteorological factors influencing them in the PRD region over a 14 year period for the first time, expanding our knowledge of the meteorological role in NOI events.
2.1 Data sources
The dataset used in this study is summarised in Table 1. In brief, the observed hourly O3 concentrations at the 16 air quality monitoring sites in the PRD region from 2006 to 2019 are provided by the Guangdong–Hong Kong–Macau Pearl River Delta Regional Air Quality Monitoring Network (HKEPD, 2017) (Fig. 1). More detailed information of these sites can be found in Table S1 in the Supplement. The observed hourly O3 data were used for subsequent NOI and NOP analyses and evaluation of O3 simulations.
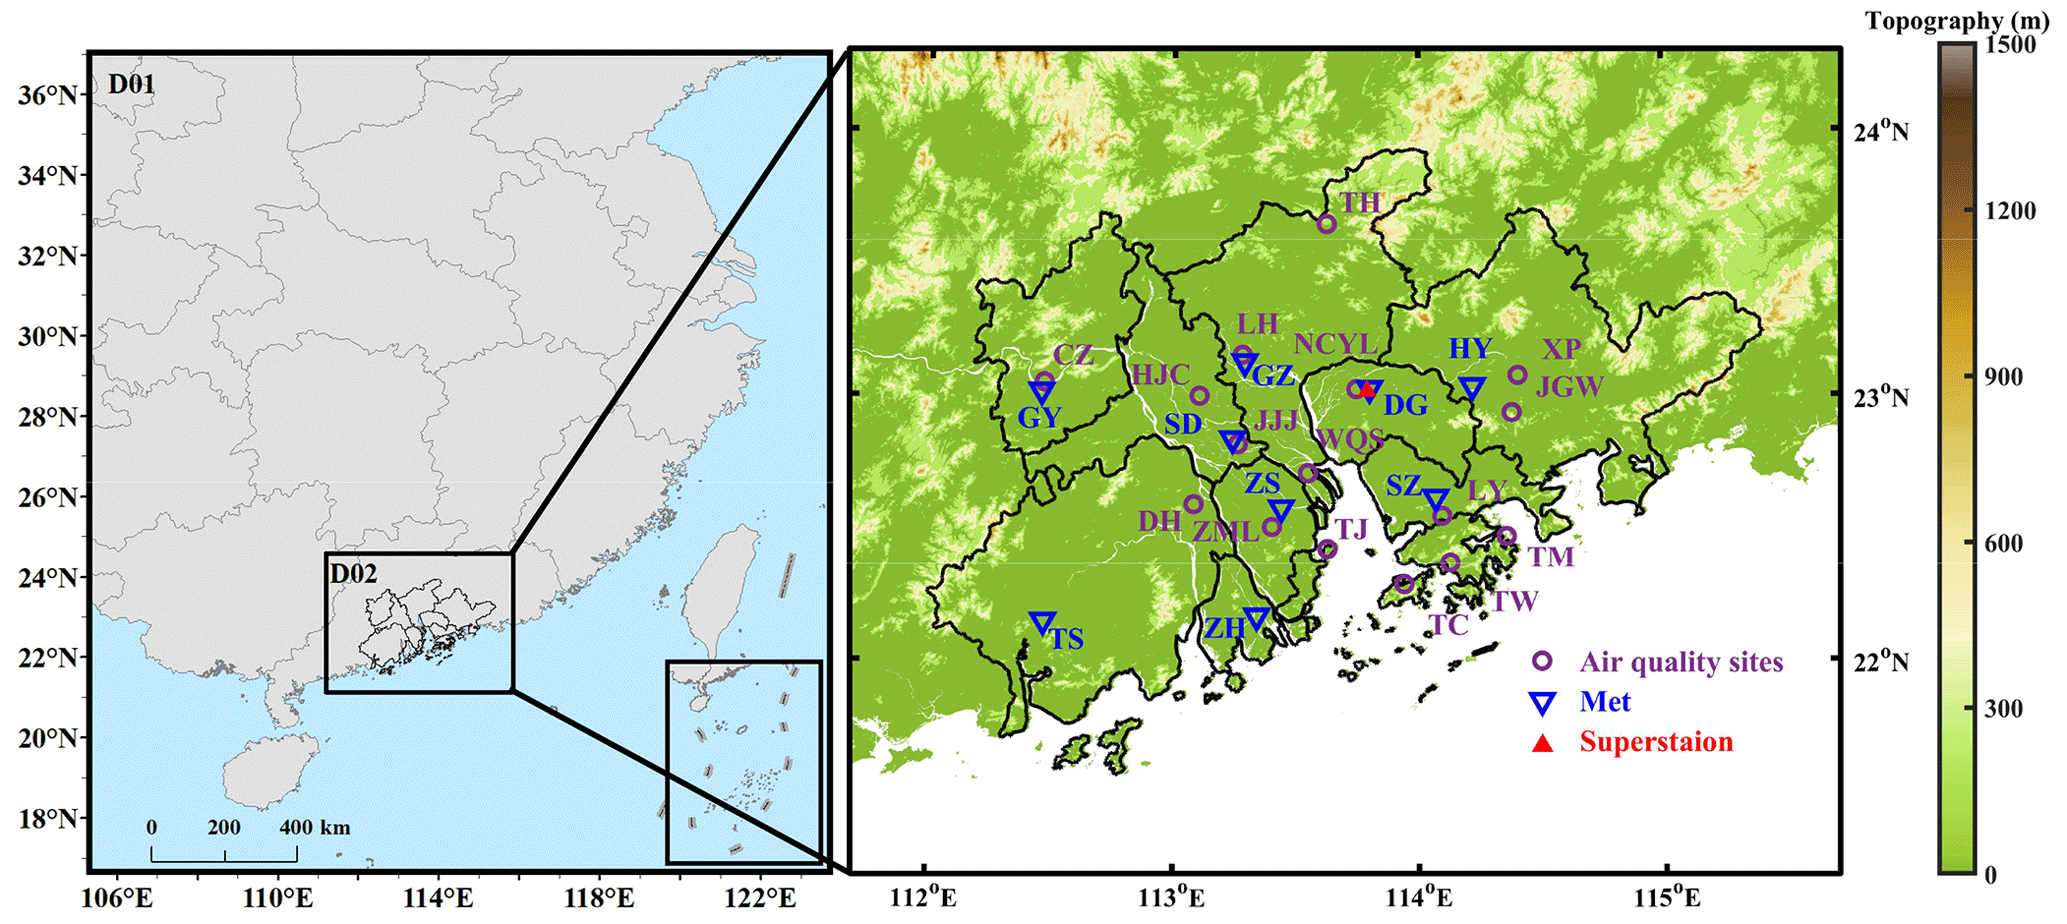
Figure 1Model domains and locations of 16 air quality monitoring stations (purple dots), nine meteorological stations (blue triangles), and the Dongguan superstation (red triangles). The figure on the right shows the elevation of the terrain (m). The 16 air quality monitoring stations are Nanchengyuanling (NCYL), Jinjiju (JJJ), Huijingcheng (HJC), Luhu (LH), Wanqingsha (WQS), Tianhu (TH), Tap Mun (TM), Tsuen Wan (TW), Tung Chung (TC), Xiapu (XP), Jinguowan (JGW), Donghu (DH), Liyuan (LY), Tangjia (TJ), Chengzhong (CZ), and Zimaling (ZML). The nine meteorology sites are Dongguan (DG), Shunde (SD), Guangzhou (GZ), Huiyang (HY), Taishan (TS), Shenzhen (SZ), Zhuhai (ZH), Gaoyao (GY), and Zhongshan (ZS).
The vertical distribution of O3 concentrations observed at the Dongguan superstation (23.02∘ N, 113.79∘ E) in 2019 is also used to investigate the impact of Conv on a particular NOI event. The vertical profile of O3 is measured using an O3 lidar (model: LIDAR-G-2000). The detection height of the O3 lidar is 3 km, with a vertical spatial resolution of 7.5 m and a temporal resolution of 12 min.
The observed meteorological variables at the nine meteorological sites (Fig. 1) in the PRD region are obtained from the Chinese National Meteorological Centre (CNMC, http://www.cma.gov.cn/, last access: 10 February 2022), including temperature (T2), relative humidity (RH) and wind speed (WS10). The observed meteorological data were used to evaluate the performance of the model. More detailed information of the nine meteorological sites can be found in Table S2.
To investigate the impacts of meteorological processes on NOI events, the ERA5 reanalysis dataset (https://cds.climate.copernicus.eu/cdsapp#!/home, last access: 10 February 2022) provided by the European Centre for Medium-Range Weather Forecasts (ECMWF) is used in this study. The ERA5 reanalysis dataset, which currently covers the period from 1979 to present, is provided on regular latitude–longitude grids at approximately and up to 1 h frequency. Vertically, ERA5 resolves the atmosphere using 137 levels from the surface to an altitude of 0.01 hPa. The performance of ERA5 has been evaluated in previous studies and has been shown to be adequate for further analysis (Olauson, 2018; Hersbach et al., 2020). The ERA5 reanalysis dataset includes wind speed, precipitation, temperature, and vertical wind velocity. Since the ERA5 reanalysis dataset was gridded, the nearest-neighbour interpolation method is used to obtain site-specific meteorological variables at the 16 air quality monitoring sites.
The observed cloud-top temperature (CTT) data for 2019 obtained from the Fengyun 2G satellite (http://satellite.nsmc.org.cn/, last access: 31 August 2022) are used to indicate the occurrence of convection. The CTT data cover the East Asia region with a spatial resolution of 0.1∘ and a temporal resolution of 1 h.
2.2 Definition of NOI and NOP
For our analysis, we define a nocturnal O3 increase (NOI) event as O3 concentrations peaked at night (from 21:00 to 06:00 LT the next day), with an increase in levels of at least 10 µg m−3 compared to the previous hour (includes 20:00 LT) and a decrease of less than 10 µg m−3 in the next hour (includes 07:00 LT). The corresponding nighttime peak concentration of O3 is referred to as the nocturnal O3 peak (NOP) (Zhu et al., 2020). In this study, based on the above observed hourly O3 data at the 16 air quality monitoring sites, NOI events are identified at each site, yet only one NOI event is recorded per night, regardless of how many NOI events occur in a single night. In addition, the regional values of NOI and NOP from the 16 air quality monitoring sites were averaged.
2.3 Definition of LLJs and Conv
Low-level jets (LLJs) and convective storms (Conv) are defined in this study based on the above site-specific ERA5 reanalysis dataset. According to Banta et al. (2002) and Hodges and Pu (2019), LLJs are defined as when vertical wind speed maxima occur below 800 hPa and exhibit a decrease of at least 1.5 m s−1 at vertical levels both above and below the levels of the maxima. We assume that LLJs cause downdrafts because of the vertical wind shear the jets induce, which creates mechanical turbulence.
Conv is defined by the following criterion: the mean K index (KI) is greater than 30 ∘C within 3 h prior to an NOI event (George, 1960; Johnson, 1982). The KI is calculated as follows:
where T850, T700, and T500 are the temperature (∘C) at 850, 700, and 500 hPa, respectively, and Td850 and Td700 are the dew point temperature at 850 and 700 hPa, respectively.
Cloud-top temperature (CTT) was also introduced as an indicator of the occurrence of convective systems and further used to evaluate the applicability of KI. The lower the CTT, the higher the probability of a convection event. According to the work of Ai et al. (2016), CTT lower than −35 ∘C indicates the occurrence of convection. We randomly selected 10 nights with KI>30 ∘C (Table S3) and 10 nights with KI<30 ∘C (Table S4) and examined the corresponding CTT values. In the cases with KI>30 ∘C, the CTT values were lower than −35 ∘C in 10 out of 10 nights (Table S3). And the spatial distribution of CTT showed that they had a distinct circular area with a lower value over the selected sites, indicating the occurrence of convective systems (Fig. S1 in the Supplement). For the cases with KI<30 ∘C, 6 out of 10 nights were with CTT higher than −35 ∘C, while the rest of the 4 nights had no CTT data due to cloudless weather (Table S4). The spatial distribution of CTT did not show the features of a convective system (Fig. S2), suggesting that convection was not observed for the selected 10 cases with KI<30 ∘C. The above results suggest that the KI>30 ∘C criterion is a valid metric to capture the occurrence of convection.
In this study, an NOI event at each air quality site was classified into four categories: caused by LLJs only, caused by Conv only, caused by LLJs and Conv (LLJs+Conv) at the same time, and caused by other factors.
2.4 Trend analysis
In this study, the nonparametric Mann–Kendall (M–K) test (Mann, 1945) is used to determine the statistical significance (p values) associated with the annual trends of NOI, NOP, MDA8 O3, LLJs and Conv, etc. A significance level of p<0.05 was used to test the significance of the interannual trend. The magnitude of a given trend is calculated by the nonparametric Theil–Sen (T–S) estimator (Sen, 1968). The advantage of the M–K test and the T–S estimator is that they do not require prior assumptions of the statistical distribution for the data and are resistant to outliers. The M–K test and the T–S estimator have been widely used in previous O3 trend studies (Wang et al., 2019; Lu et al., 2020; Li et al., 2022).
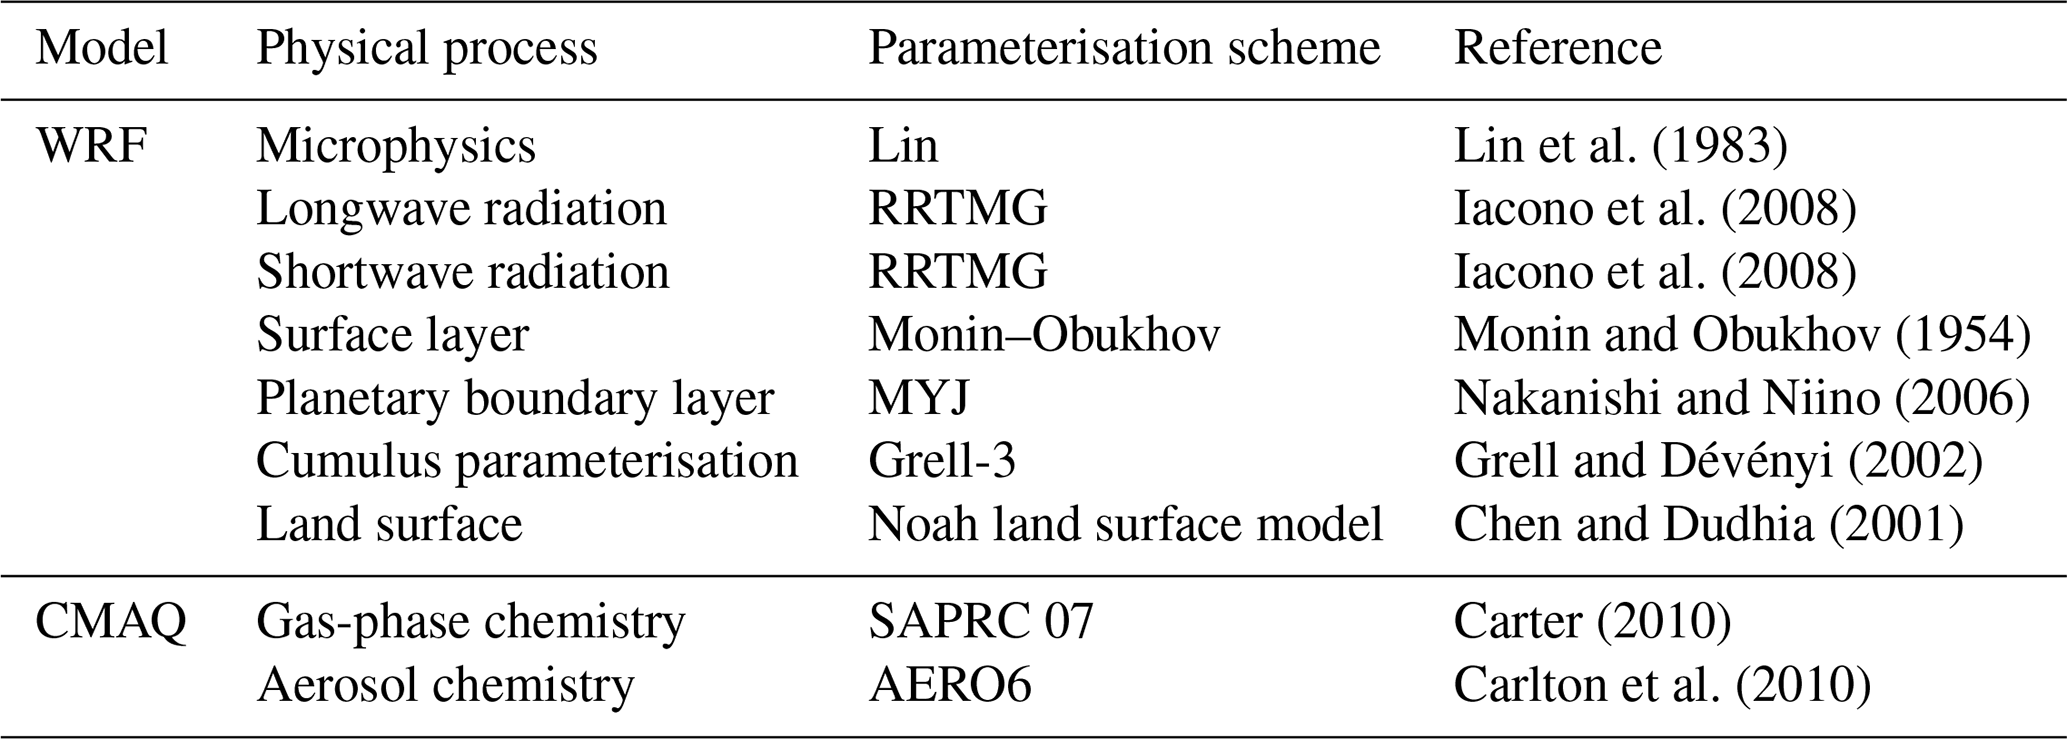
2.5 WRF–CMAQ model configuration
Due to the lack of observed vertical profiles of wind speed, the WRF–CMAQ model is employed to investigate the effects of LLJs on a selected NOI event. The NOI event induced by LLJs that occurred at the Nancheng Yuanling (NCYL) site in Dongguan on 13–14 September 2017 is selected as a typical case. The simulation was conducted during 6–14 September by using the WRF–CMAQ–IPR model with the first 2 d used as model spin-up to eliminate the impact of the initial meteorological conditions (IC) (Jiménez et al., 2007).
The Weather Research and Forecasting model (WRFv3.9.1) is used to provide meteorological inputs to drive the Community Multiscale Air Quality (CMAQ v5.3.1) model. The IC and boundary conditions (BC) are provided by the National Centers for Environmental Prediction (NCEP) Final Analyses (FNL) dataset, with a spatial resolution of and a temporal resolution of 6 h. The main physics options used for the WRF model are shown in Table 2. Two nested domains are used in the WRF simulations, with 38 vertical layers from the surface to 100 hPa. Figure 1 shows the two nested modelling domains, with spatial resolutions of 27 km×27 km, and 3 km×3 km for the coarse (D01) and inner (D02) domains, respectively. D01 covers most regions of China and D02 covers the whole PRD region.
The CMAQ model is used to simulate the O3 concentrations in the PRD region. The SAPRC07 and AERO6 aerosol modules are used for gas-phase and particulate matter chemical mechanisms, respectively (Carter, 2010; Wyat Appel et al., 2018). The chemical IC and BC for D01 are derived from a global chemical transport model, the Model for Ozone and Related Chemical Tracers, version 4 (MOZART4) (Emmons et al., 2010), and those for D02 are provided by the simulated results from D01. The anthropogenic emissions for D01 are based on the 2016 Multi-resolution Emission Inventory for China, which has a grid resolution of (Zheng et al., 2018). Those used for D02 are based on the 2017 high-resolution emission inventory of the PRD region with a grid resolution of 3 km×3 km (Zhong et al., 2018), which includes the emission sectors of agriculture, biomass combustion, incineration, dust, industrial processes, non-road, solvent, storage, transportation and waste disposal. Biogenic emissions are calculated using the Model of Emissions of Gases and Aerosols from Nature (MEGAN) v2.1 that was integrated into the CMAQ model (Guenther et al., 2006; Wang et al., 2011).
In order to interpret the underlying atmospheric mechanisms for NOI events, the Integrated Process Rates (IPR) analysis tool embedded in the WRF–CMAQ model is used to identify and quantify the contribution of various physical and chemical processes to O3. The processes include horizontal transport (HTRA), vertical transport (VTRA), gas-phase chemistry (CHEM), dry deposition (DDEP), and cloud processes (CLDS). Horizontal transport is the sum of horizontal advection and diffusion, and vertical transport is the sum of vertical advection and diffusion. More details on the IPR analysis tool can be found in previous work (Liu et al., 2010; Wang et al., 2010).
2.6 Model evaluation
The WRF–CMAQ simulation results are evaluated by comparison with available ground-based observed O3 and meteorological data. Statistical metrics including mean value ( and ), mean bias (MB), normalised mean bias (NMB), normalised mean error (NME), root mean square error (RMSE), correlation coefficient (r), and index of agreement (IoA) are calculated as follows to evaluate model performance.
The evaluation protocols of the U.S. Environmental Protection Agency (EPA, 2017) are used to evaluate the performance of the meteorological parameters. The simulated results were accepted when the statistics met the criteria listed as follows: ∘C and IoA≥0.8 for simulated T2; % and IoA≥0.6 for simulated RH; and m s−1, RMSE≤2.0 m s−1, and IoA≥0.6 for simulated WS10. The evaluation protocols of the Ministry of Environmental Protection of China (MEE, 2015) are used to evaluate the performance of O3 and the simulated results were acceptable if the statistics met the criteria listed below: %, NME<35 %, and r>0.4.
3.1 General characteristics of NOI events
The average annual frequency of NOI events in the 16 sites across the whole PRD region from 2006 to 2019 is estimated to be 53 ± 16 d yr−1, with an average annual NOP concentration of 58 ± 11 µg m−3. LLJs are the primary factor causing NOI events, accounting for about 61 %, followed by the combination of LLJs and Conv (LLJs+Conv) with a value of 16 %, while the corresponding value is 11 % for Conv (Fig. 2). The remaining 12 % of NOI events that cannot be explained by LLJs and Conv may be related to other meteorological processes, such as mountain–valley breezes and sea–land breezes (Sousa et al., 2011; He et al., 2021).
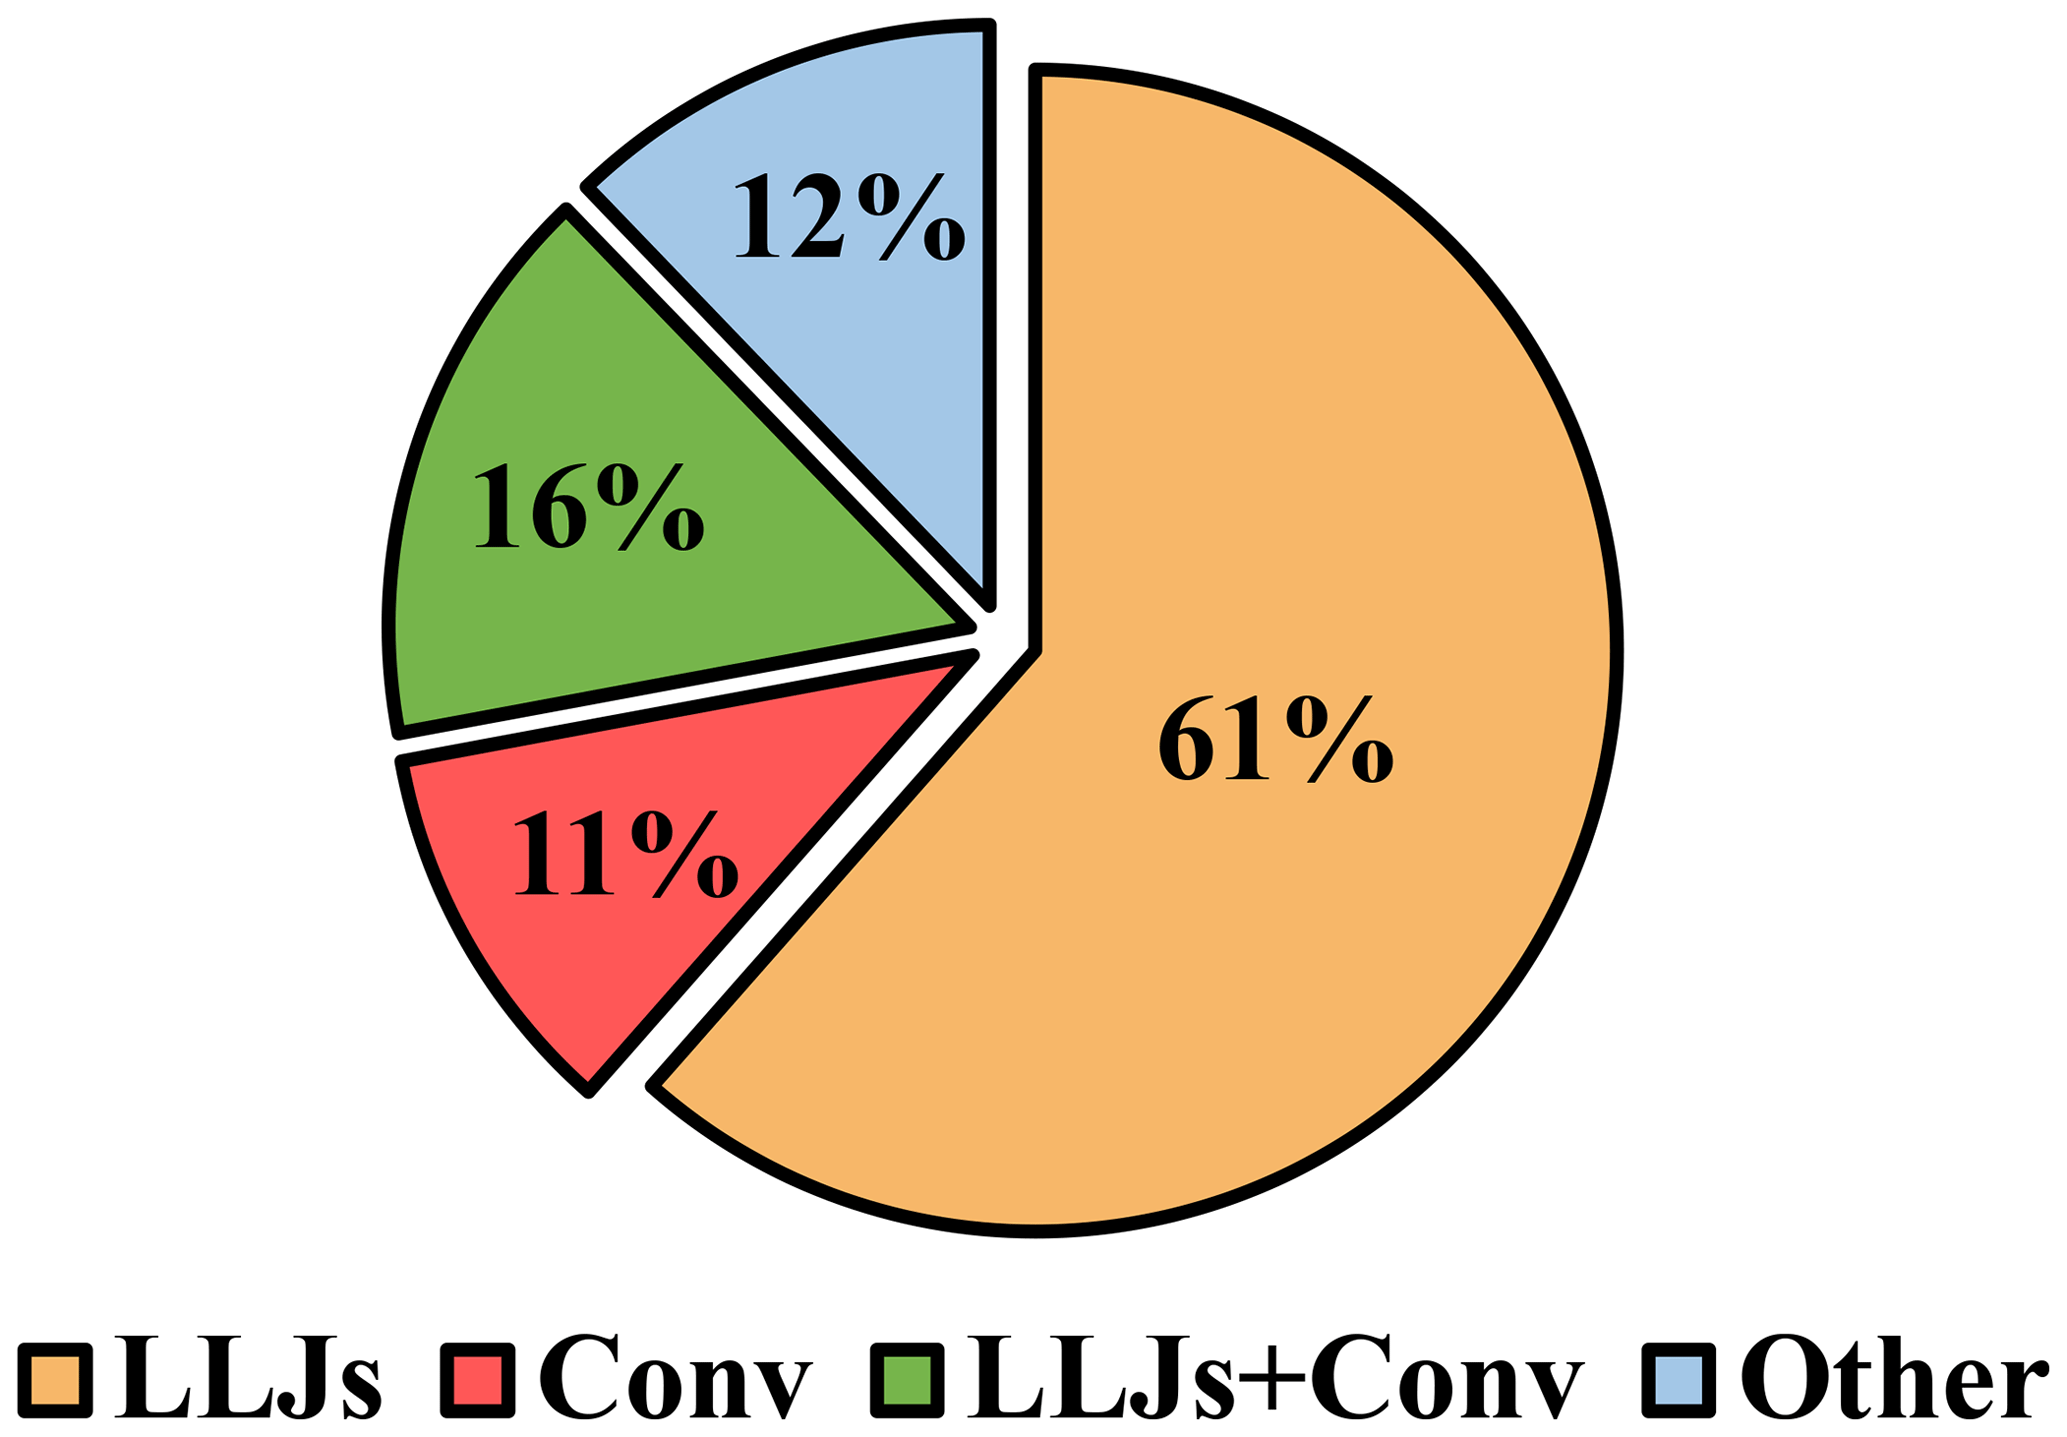
Figure 2The average relative contribution of different meteorological processes to NOI events during 2006–2019.
3.2 Long-term trends of NOI events
As depicted in Fig. 3a, the regional-average annual frequency of NOI events increased from 38 ± 18 d yr−1 in 2006 to as high as 67 ± 18 d yr−1 in 2011 at a rate of 4.70 d yr−1 (p<0.01) and gradually decreased after 2012 at a rate of −0.72 d yr−1 (p<0.05). A similar annual trend is observed for the frequency of total downdrafts (sum of LLJs, LLJs+Conv, and Conv) (Fig. 3b). The frequency of total downdrafts increased at a rate of 4.02 d yr−1 (p<0.01) before 2012 and decreased at a rate of −0.53 d yr−1 (p<0.05) thereafter, which is significantly positively correlated with NOI events, with a Pearson correlation coefficient (r) of 0.96 (p<0.01). Among the total downdrafts, LLJs exhibit a similar pattern with NOI events (r=0.89, p<0.01), further suggesting that LLJs are the predominant driver. Conv presents a continuously increasing trend over the whole 14 year period, with a rate of 0.26 d yr−1 (p<0.01), and the frequency of LLJs+Conv does not show obvious variation.

Figure 3Regional-average annual trends of (a) frequency of NOI events; (b) frequency of total downdrafts (black), LLJs (orange), LLJs+Conv (green), and Conv (red) that can induce NOI events; (c) NOP concentrations; and (d) MDA8 O3 concentrations in the PRD region during 2006–2019. The units of k (Sen's slope) are in (a, b) and in (c, d). Linear trends significant at the 95 % confidence level are illustrated with dashed lines. The error bars indicate the range of deviations for the 16 air quality sites.
Both the frequency of NOI and LLJs present increasing trends before 2012 and decreasing trends thereafter, which was likely related to urbanisation. Previous studies have shown that urbanisation has large effects on the frequency of LLJs by changing surface conditions (roughness and soil moisture) and further affecting the turbulence and geostrophic wind speed (McCorcle, 1988; Fast and McCorcle, 1990; Kallistratova, 2008; Nikolic et al., 2019; Ziemann et al., 2019). Kallistratova (2008) and Nikolic et al. (2019) pointed out that negative correlation was found between urban areas and the frequency of LLJs. During 1987–2017, the urban areas in the PRD region grew at an average rate of 8.82 % yr−1 (C. Yang et al., 2019) and reached a maximum urban land expansion growth rate of 6.66 % during 2010–2015 (Zhang et al., 2021). Therefore, the trends for the frequency of NOI and LLJs were quite different during these two periods (2006–2011 and 2012–2019).
Although the percentage of NOI events caused by Conv alone is relatively small compared to those caused by LLJs (Fig. 2), it is noteworthy that the frequency of Conv-induced NOI events was on the increase during the 14 year period (Fig. 3b), which is also mainly related to the rapid urbanisation in the PRD region in recent years (C. Yang et al., 2019; Zhang et al., 2021). Surface roughness increase due to city expansion led to the greater frequency and intensity of convection in the form of enhanced mechanical turbulence (Li et al., 2021), thus an increase in the frequency of Conv-induced NOI events. The role of Conv in the occurrence of NOI events is expected to amplify in the future if the urbanisation trend in China continues (Seto et al., 2012; Marelle et al., 2020).
In contrast to the annual trend of NOI frequency, the nocturnal O3 peak (NOP) value shows an upward trend during 2006–2019, with a slower growth rate of 0.54 (p<0.05) before 2015 and a faster growth rate of 4.76 (p<0.01) thereafter (Fig. 3c). The maximum daily 8 h average (MDA8) O3 mixing ratio exhibits a similar pattern to NOP, with an increase rate of 0.39 (p<0.05) before 2015 and 9.21 (p<0.01) thereafter (Fig. 3d). NOP is significantly positively correlated with MDA8 O3, with r up to 0.88 (p<0.01). This implies that daytime O3 concentration levels potentially affect NOP concentrations. The variations of NOP and MDA8 O3 during the two periods (2006–2015 and 2016–2019) are more likely related to the change in precursor emissions. The continuous increase in the emissions of anthropogenic VOCs and NOx resulted in the gradual increase of O3 concentrations between 2006 and 2012 (Ma et al., 2016; Li et al., 2017; Zhong et al., 2018; Liao et al., 2021). However, since the implementation of the Air Pollution Prevention and Control Action Plan (APPCAP) in 2013, NOx emissions were dramatically decreased by 21 % in 2017 compared to 2013 (Feng et al., 2019; L. Yang et al., 2019). The weakening of NO titration caused by the dramatic decrease in NOx emissions and the continuously increasing VOC emissions due to the lack of controls became important drivers of the sharp rise in O3 since 2015 (Li et al., 2019; Mousavinezhad et al., 2021; Li et al., 2022). Furthermore, the decreasing PM2.5 levels and the increasing atmospheric oxidising capacity in the PRD region in recent years have also been considered important contributors to accelerated O3 growth during 2016–2019 (Gong et al., 2018; Li et al., 2019; Han et al., 2019). Consequently, NOP and MDA8 O3 present a slower increase rate before 2015 and higher increase rate thereafter.
3.3 Seasonal variations of NOI events
NOI events exhibit obvious seasonal variation (Fig. 4a), with relatively higher frequency observed in spring (18 ± 4 d yr−1) and autumn (20 ± 5 d yr−1) and lower frequency in summer (14 ± 3 d yr−1) and winter (16 ± 3 d yr−1). LLJs are the dominant inducer of NOI events in spring, autumn, and winter (Fig. 4b), while in summer, the dominant factors are LLJs+Conv and Conv, because convective activity is more intense during summer (Chen et al., 2014). Given that LLJs can enhance turbulence below the jet and create favourable formation conditions for Conv (Trier et al., 2017; Du and Chen, 2019), most Conv events preferentially occur on days when LLJs exist in the PRD region (Chen et al., 2014), which makes LLJs+Conv the main contributor in summer.
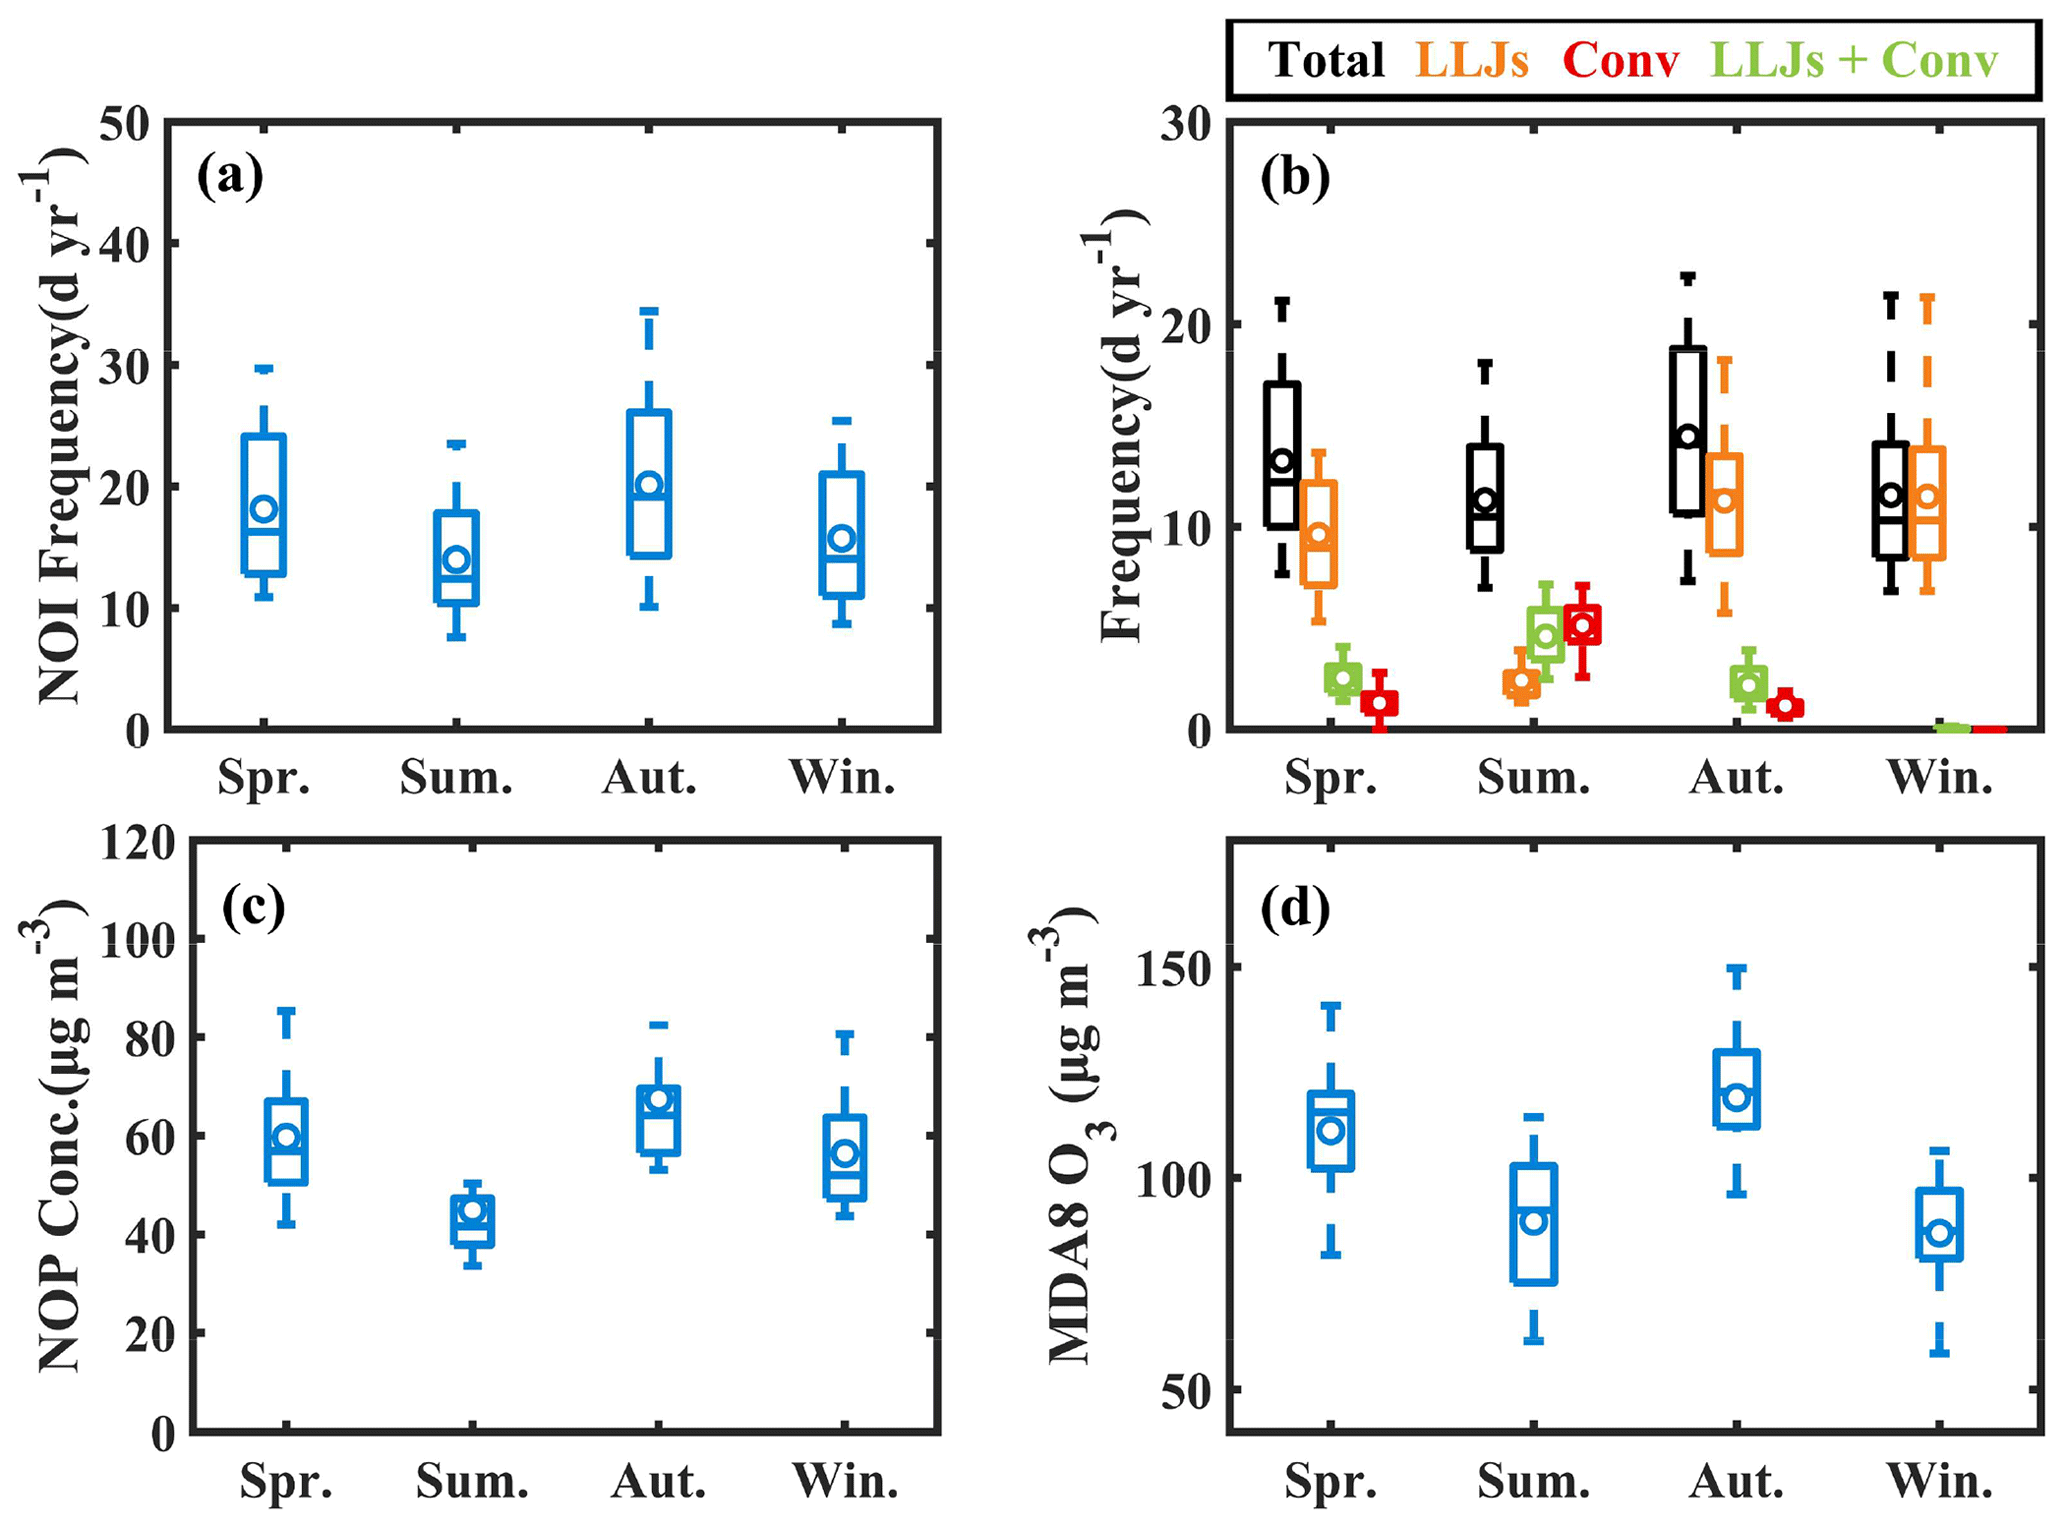
Figure 4Seasonal variation of (a) frequency of NOI events; (b) frequency of total downdrafts (black), LLJs (orange), LLJs+Conv (green), and Conv (red) that can induce NOI events; (c) NOP concentrations; and (d) MDA8 O3 concentrations in the PRD region during 2006–2019. The error bars indicate the range of deviations for the 16 air quality sites.
In terms of NOP (Fig. 4c), relatively higher concentrations are observed in spring and autumn, with values of 59 ± 12 and 66 ± 10 µg m−3, respectively, while the concentration in summer is the lowest (44 ± 7 µg m−3). The MDA8 O3 has a similar seasonal variation to NOP except in winter (Fig. 4d); it is high in spring (111 ± 15 µg m−3) and autumn (120 ± 13 µg m−3) and low in summer (88 ± 15 µg m−3). In winter, surface MDA8 O3 was the lowest (86 ± 12 µg m−3), while NOP remained at relatively high levels (56 ± 10 µg m−3). This is because the higher O3 concentrations in the lower troposphere in winter allow more O3 to be transported downward during the NOI period, resulting in a higher NOP concentration in winter, as shown by the seasonally observed vertical O3 profile at the Dongguan superstation (Fig. 5). As illustrated in Fig. 5, higher O3 concentrations are observed at 200 to 750 m altitude in winter than in summer. A similar result was also observed in Hong Kong (Liao et al., 2021). This is mainly due to the typical Asian monsoon circulation, which brings clean marine air to the lower troposphere of the PRD region in summer and dilutes polluted air masses inland, while it brings pollutant-laden air from mainland China in winter resulting in higher O3 concentrations over the PRD region (Wang et al., 2009).

Figure 5Seasonally averaged vertical distribution of O3 concentrations at the Dongguan superstation from the surface to an altitude of 3000 m in 2019. Spring (Spr.): March–May, Summer (Sum.): June–August, Autumn (Aut.): September–November, Winter (Win.): December–February.
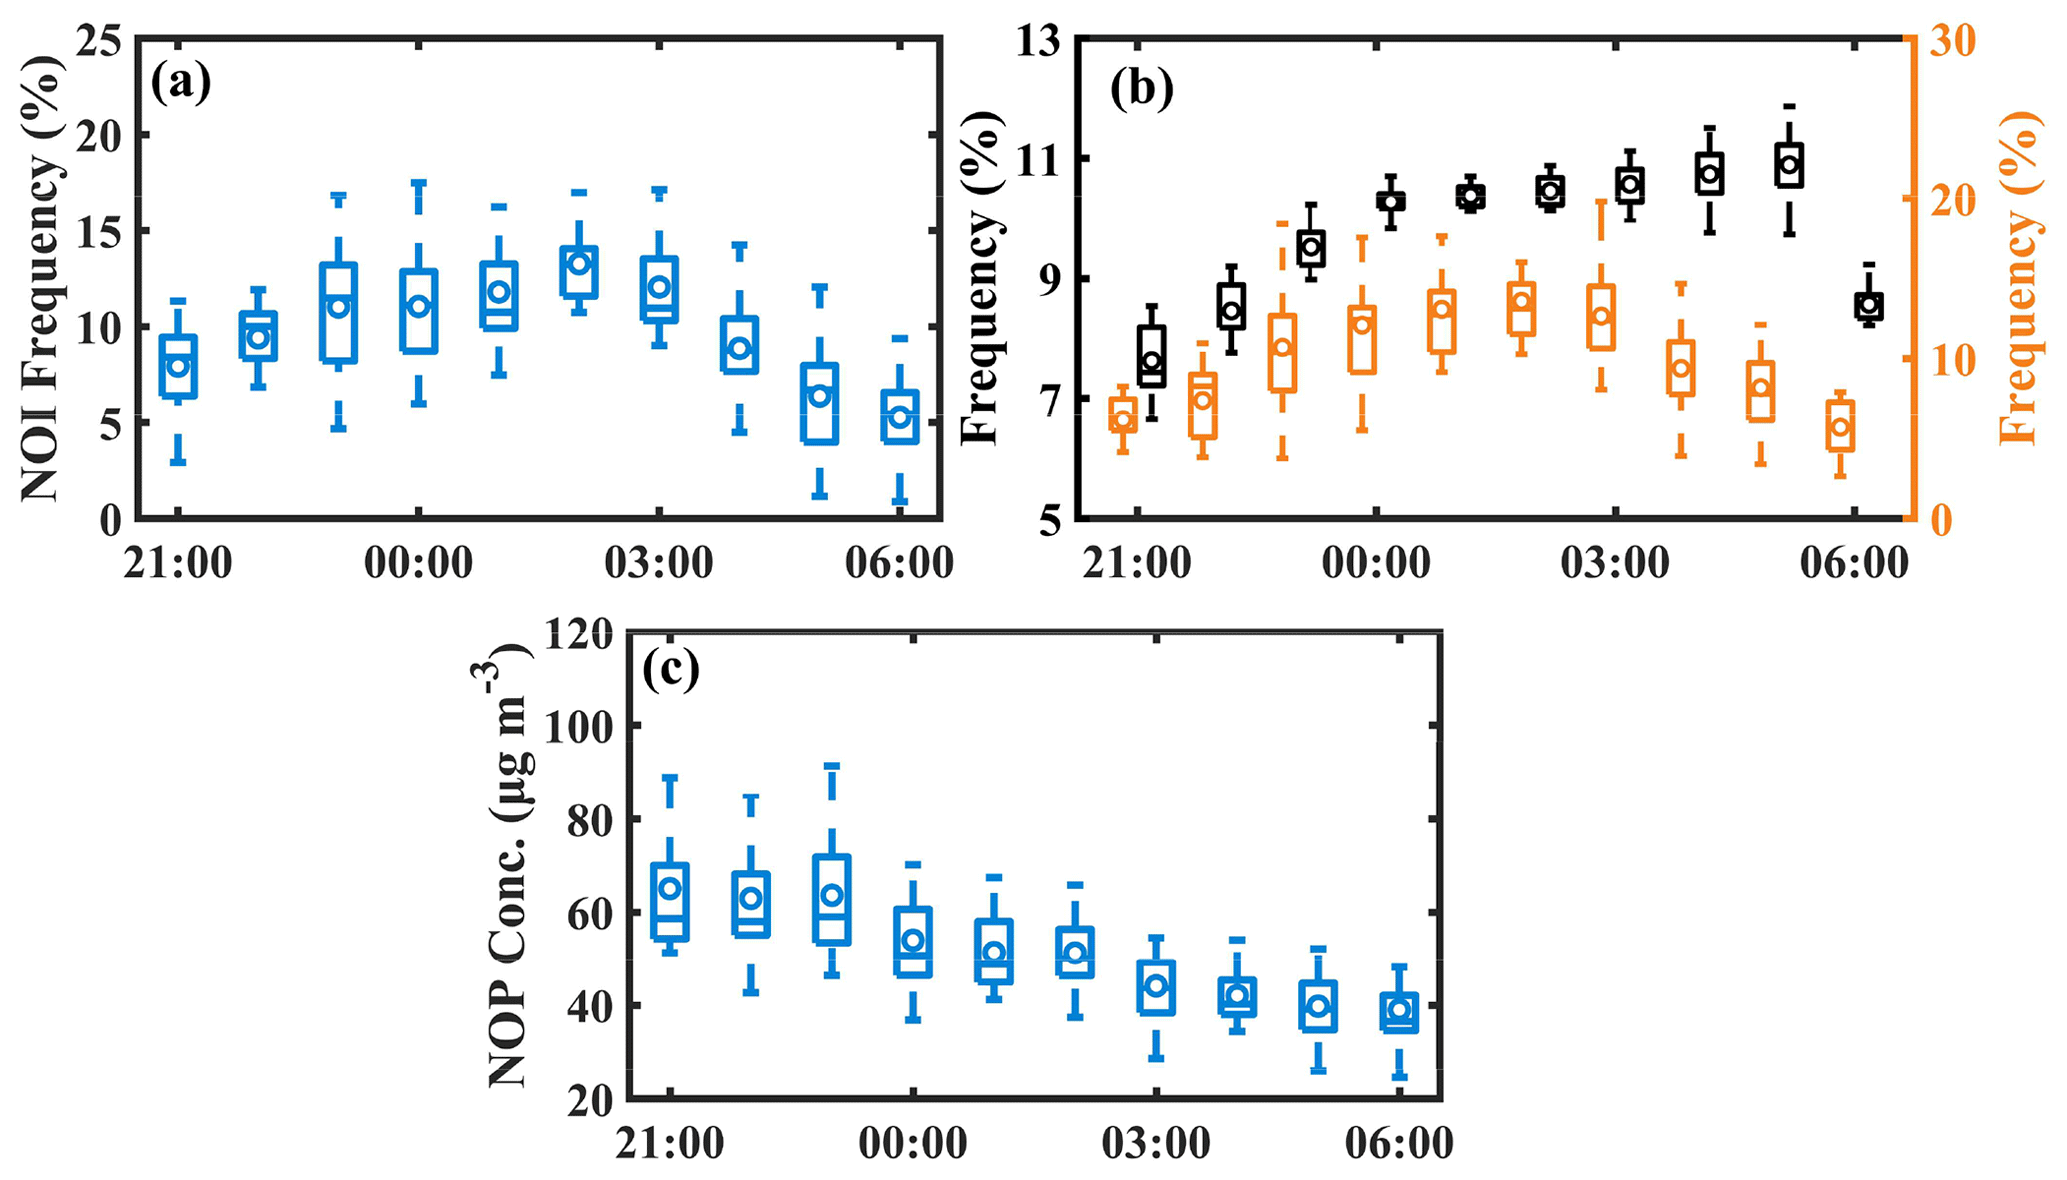
Figure 6Diurnal variation of (a) the frequency of NOI events, (b) the frequency of total LLJs (black) and the LLJs that can induce NOI events (orange), and (c) NOP concentrations during 21:00–06:00 (LTC) in the PRD region during 2006–2019. The error bars indicate the range of deviations for the 16 air quality sites.
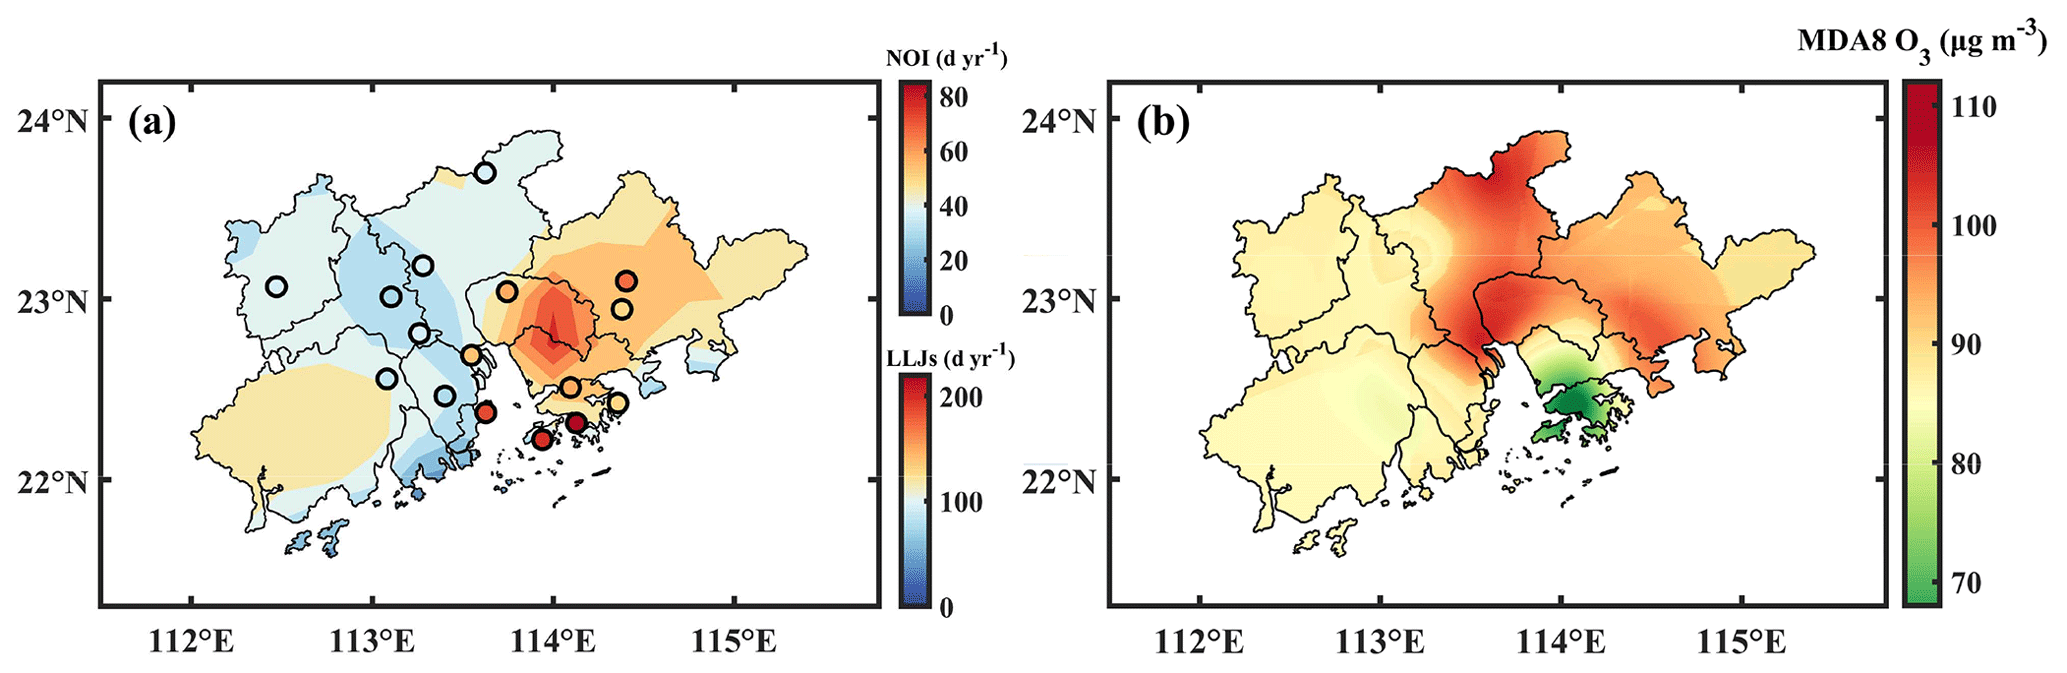
Figure 7Spatial distribution of annual average (a) NOI event frequency (points) and LLJs frequency (contours) and (b) MDA8 O3 concentrations.
3.4 Diurnal variation of NOI events
Distinct diurnal variation is observed in NOI events (Fig. 6a) with an increasing trend from 21:00 to 03:00 LT (UTC+08:00) and a decreasing trend thereafter. It is estimated that about 60 % of the events occurred in the middle of the night (11:00–03:00 LT). The LLJs that can induce NOI events show a similar diurnal variation to the frequency of NOI events and often occur around midnight. However, the frequency of total LLJs differs from the frequency of LLJs that can induce NOI events (Fig. 6b), as it increases steadily from 21:00 to 00:00 LT and remains stable after 00:00 LT. This suggests that LLJs are not the only factor that determines whether an NOI event can develop, and O3 concentration in the RL can also affect the development of an NOI event. As the sun sets and the daytime boundary layer fades away, the O3 produced during daytime remains at a relatively high level in the RL during 21:00–03:00 LT. During this period, the occurrence of LLJs tends to increase the probability of NOI events. After 03:00 LT, the O3 concentrations in the RL decreased due to horizontal transport to a downwind area and vertical transport (e.g. LLJs, convection, O3 dry deposition process) during 21:00–03:00 LT, which reduced the amount of O3 that can be transported downward. Hence, even though the frequency of the total LLJs is relatively high after 03:00 LT, the lower O3 content in the RL results in less O3 being transported downward to form an NOI event, which ultimately decreases the frequency of NOI events. As illustrated in Fig. 6c, the trends of NOP concentrations from 21:00 to 06:00 LT also reflect the fact that O3 concentrations in the RL are higher during 21:00–00:00 LT and lower during 00:00–06:00 LT. Therefore, the development of an NOI event is influenced by the combination of a downdraft induced by meteorological processes and the level of O3 concentrations.
3.5 Spatial distribution of NOI events
As most NOI events are caused by LLJs, LLJs are taken as an example to explore the role of meteorological processes in the spatial distribution of NOI events. The spatial distribution of the average annual frequency of NOI events and LLJs in the PRD region from 2006 to 2019 is shown in Fig. 7a, and the spatial distribution of MDA8 O3 concentrations obtained by Kriging's interpolation method is shown in Fig. 7b. Obvious geographical variations are observed for NOI events, with a higher frequency in the eastern PRD region, coupled with a higher frequency of LLJs, although the MDA8 O3 concentrations are relatively lower in these regions. In the central PRD region, despite the highest MDA8 O3 concentrations, the frequency of NOI events was the lowest, implying a more important role of vertical transport induced by meteorological processes in the formation of NOI events. At the three sites located in the southern part of the PRD regions (Tangjia– TJ, Tsuen Wan – TW, Tung Chung – TC) the frequency of NOI events was the highest, while the frequency of LLJs was not. This is because these three sites were also affected by non-LLJ () processes with comparable contributions of LLJs and non-LLJs to the NOI events. And the contributions of LLJs (60 %–70 %) were higher than those of non-LLJs at the rest of the sites (Table S5).
3.6 Causative analysis of NOI events: convective storms trigger
In order to elaborate on the underlying atmospheric mechanisms for Conv-induced NOI events, a distinct NOI event associated with Conv observed at the Nancheng Yuanling (NCYL) site in Dongguan on 3–4 September 2019 is taken as a typical example. The vertical O3 profile data observed at the Dongguan superstation are used to represent the vertical O3 distribution at the NCYL site during this NOI event, since the distance between these two stations is only 3 km.
The KI remains above 36 ∘C (Fig. 8a), and the vertical velocity shows continuous updraft trends at 1–3 km altitude from 14:00 to 23:00 LT (Fig. 8b), indicating a high possibility of convection. Although the magnitude of vertical velocity was relatively low, it has also been found in previous studies (Ploeger et al., 2021). In addition, the spatial distribution of CTT shows that the CTT value at 18:00 LT over Dongguan was around −70 ∘C (Fig. 9a), which was lower than the criterion (−35 ∘C) for the occurrence of a convection process. The results of KI, the vertical velocity, and the CTT indicate that the possibility of a convection process is high. Thus, the precipitation that occurred during 16:00–20:00 LT was a convective precipitation. The effect of rainfall on O3 removal is relatively small after sunset, because wet deposition of O3 occurs through the removal of the precursors HNO3 and H2O2 by water vapour under solar radiation, which is indirect and rather peripheral, and the effect of heterogeneous processes on O3 removal is weak (Jacob, 2000; Awang et al., 2015; Zhu et al., 2020). Therefore, the unconsumed O3 remains stable in the RL. As illustrated in Fig. 8c, higher O3 concentrations are found in the RL after 18:00 LT, reaching around 200 µg m−3. At 21:00 LT, a strong updraft suddenly appears above 1.5 km (Fig. 8b), and a distinct area of low CTT values (around −66 ∘C) could be observed over Dongguan (Fig. 9b), confirming the occurrence of an updraft. The updraft subsequently caused a strong compensating downdraft below 1 km at 22:00–23:00 LT (Fig. 8b). The downdraft then breaks through the stable nocturnal boundary layer and transports O3 from the RL to the surface (Fig. 8c). Hence, an NOI event occurs at 23:00 LT, with O3 concentrations increased from 45 µg m−3 at 22:00 LT to 59 µg m−3 at 23:00 LT. Although the modelled downdraft that occurred at 22:00–23:00 LT (Fig. 8b) was around half an hour later than the observed O3 intrusion into the nocturnal boundary layer (Fig. 8c) due to the model errors, the modelled results can still generally capture the occurrence of convection processes.

Figure 8(a) Hourly variations of KI (brown line), O3 concentrations (blue line), and hourly precipitation amount (blue bar); (b) vertical wind velocity with positive and negative values related to updrafts and downdrafts; and (c) vertical profile of O3 concentrations at the NCYL site in Dongguan on 3–4 September 2019.
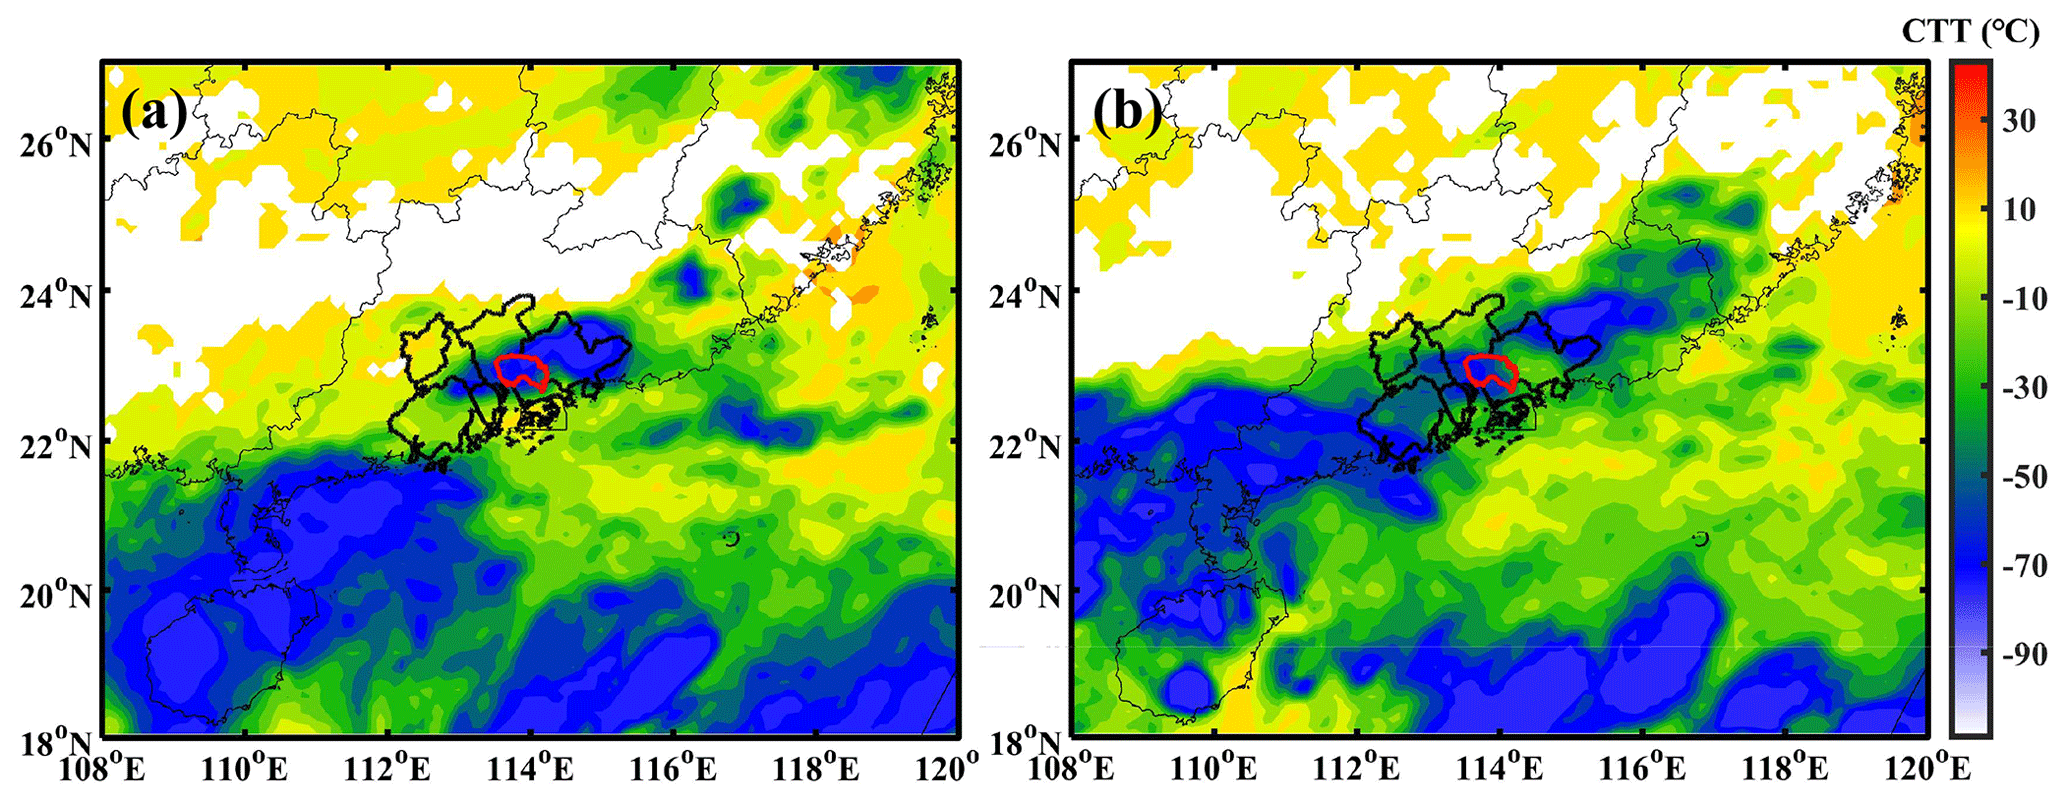
Figure 9Spatial distribution of cloud-top temperature (CTT) at (a) 18:00 LT and (b) 21:00 LT on 3 September 2019.
3.7 Causative analysis of NOI events: LLJs trigger
Another typical NOI event induced by LLJs that occurred at the NCYL site in Dongguan on 13–14 September 2017 was simulated using the WRF–CMAQ–IPR model, because no vertical profiles of wind speed were observed. Model performance was first evaluated. Comparisons of the simulated meteorological parameters with observations for the nine sites in the PRD region during 8–14 September 2017 are shown in Fig. S3, with statistical indices reported in Table S6. The results show that WS10 was reasonably well simulated, as the regional average of MB, RMSE, and IoA met the EPA criteria mentioned in Sect. 2.6. The simulated regional average of RH and T2 were slightly overestimated (MB = −6.1 %) and underestimated (MB = 1.4 ∘C), respectively, while they performed well at the Dongguan site, where both the MB (RH = −1.0 %, T2 = 0.5 ∘C) and IoA (both are 1.0) met the EPA criteria mentioned in Sect. 2.6. The MB of the simulated WS10 at the Dongguan site was slightly underestimated () with the RMSE and IoA meeting the EPA criteria.
Comparisons of simulated O3 with hourly observations during 8–14 September 2017 are shown in Fig. S3, with statistical indices reported in Table S7. The simulated O3 showed a good performance in the PRD region, with NMB (−4.8 %), NME (17.7 %), and r (1.0) meeting the MEE criteria, while it was slightly underestimated at the NCYL site in Dongguan but still met the MEE criteria ( %, NME=29.8 %, r=0.8). Therefore, the simulation results of the meteorological parameters and O3 are reasonable and reliable for further analysis.
Figure 10a shows the time series of simulated O3 concentrations and the contributions of different processes to surface O3 concentrations at the NCYL site in Dongguan during 13–14 September 2017. During the night on 13 September, the O3 concentration increased from 45 µg m−3 at 21:00 LT, reached the peak of 85 µg m−3 around 22:00 LT and dropped to 15 µg m−3 at 00:00 LT. Before 21:00 LT, the magnitude of the negative contribution of chemical processes to O3 was greater than the positive contribution of vertical transport, resulting in net O3 depletion. This suggests that gas-phase chemistry processes such as NO titration are the main pathway for O3 loss at night. At 21:00 LT, the vertical and horizontal transport contribution increased abruptly by 48 and 27 µg m−3, respectively, while the chemical depletion remained constant. At this point, the net O3 concentration turned from loss to production (51 µg m−3). In terms of vertical distribution (Fig. 10b), a positive contribution of both vertical and horizontal transport can be found at the surface, while vertical transport became negative in the upper layers and horizontal transport remained positive, indicating the occurrence of a downdraft. In addition, the wind profile showed a typical LLJ characteristic (Fig. 10b), with a maximum wind speed of about 12 m s−1 at 1 km altitude and a wind speed difference of more than 3 m s−1 above and below. Figure 11 further presents the process of vertical transport during an NOI event. Compared to normal days, the nocturnal boundary layer during the NOI event was more unstable and turbulent, with significant upward and downward transport. At around 1 km, there was a straight stream over the NCYL site during the NOI event (Fig. 11b). This suggested that LLJs broke the stable structure between the nocturnal boundary layer and the RL and enhanced the strength of turbulence (Caputi et al., 2019). The LLJ-induced turbulence promoted mixing between the upper and lower layers and continuously transported O3 from the upper layer to the surface, causing an unusual surge in O3 at the surface and leading to an NOI event. As a result, the LLJ process contributed as much as 40 µg m−3 O3 from the upper layer to the surface during this NOI event.
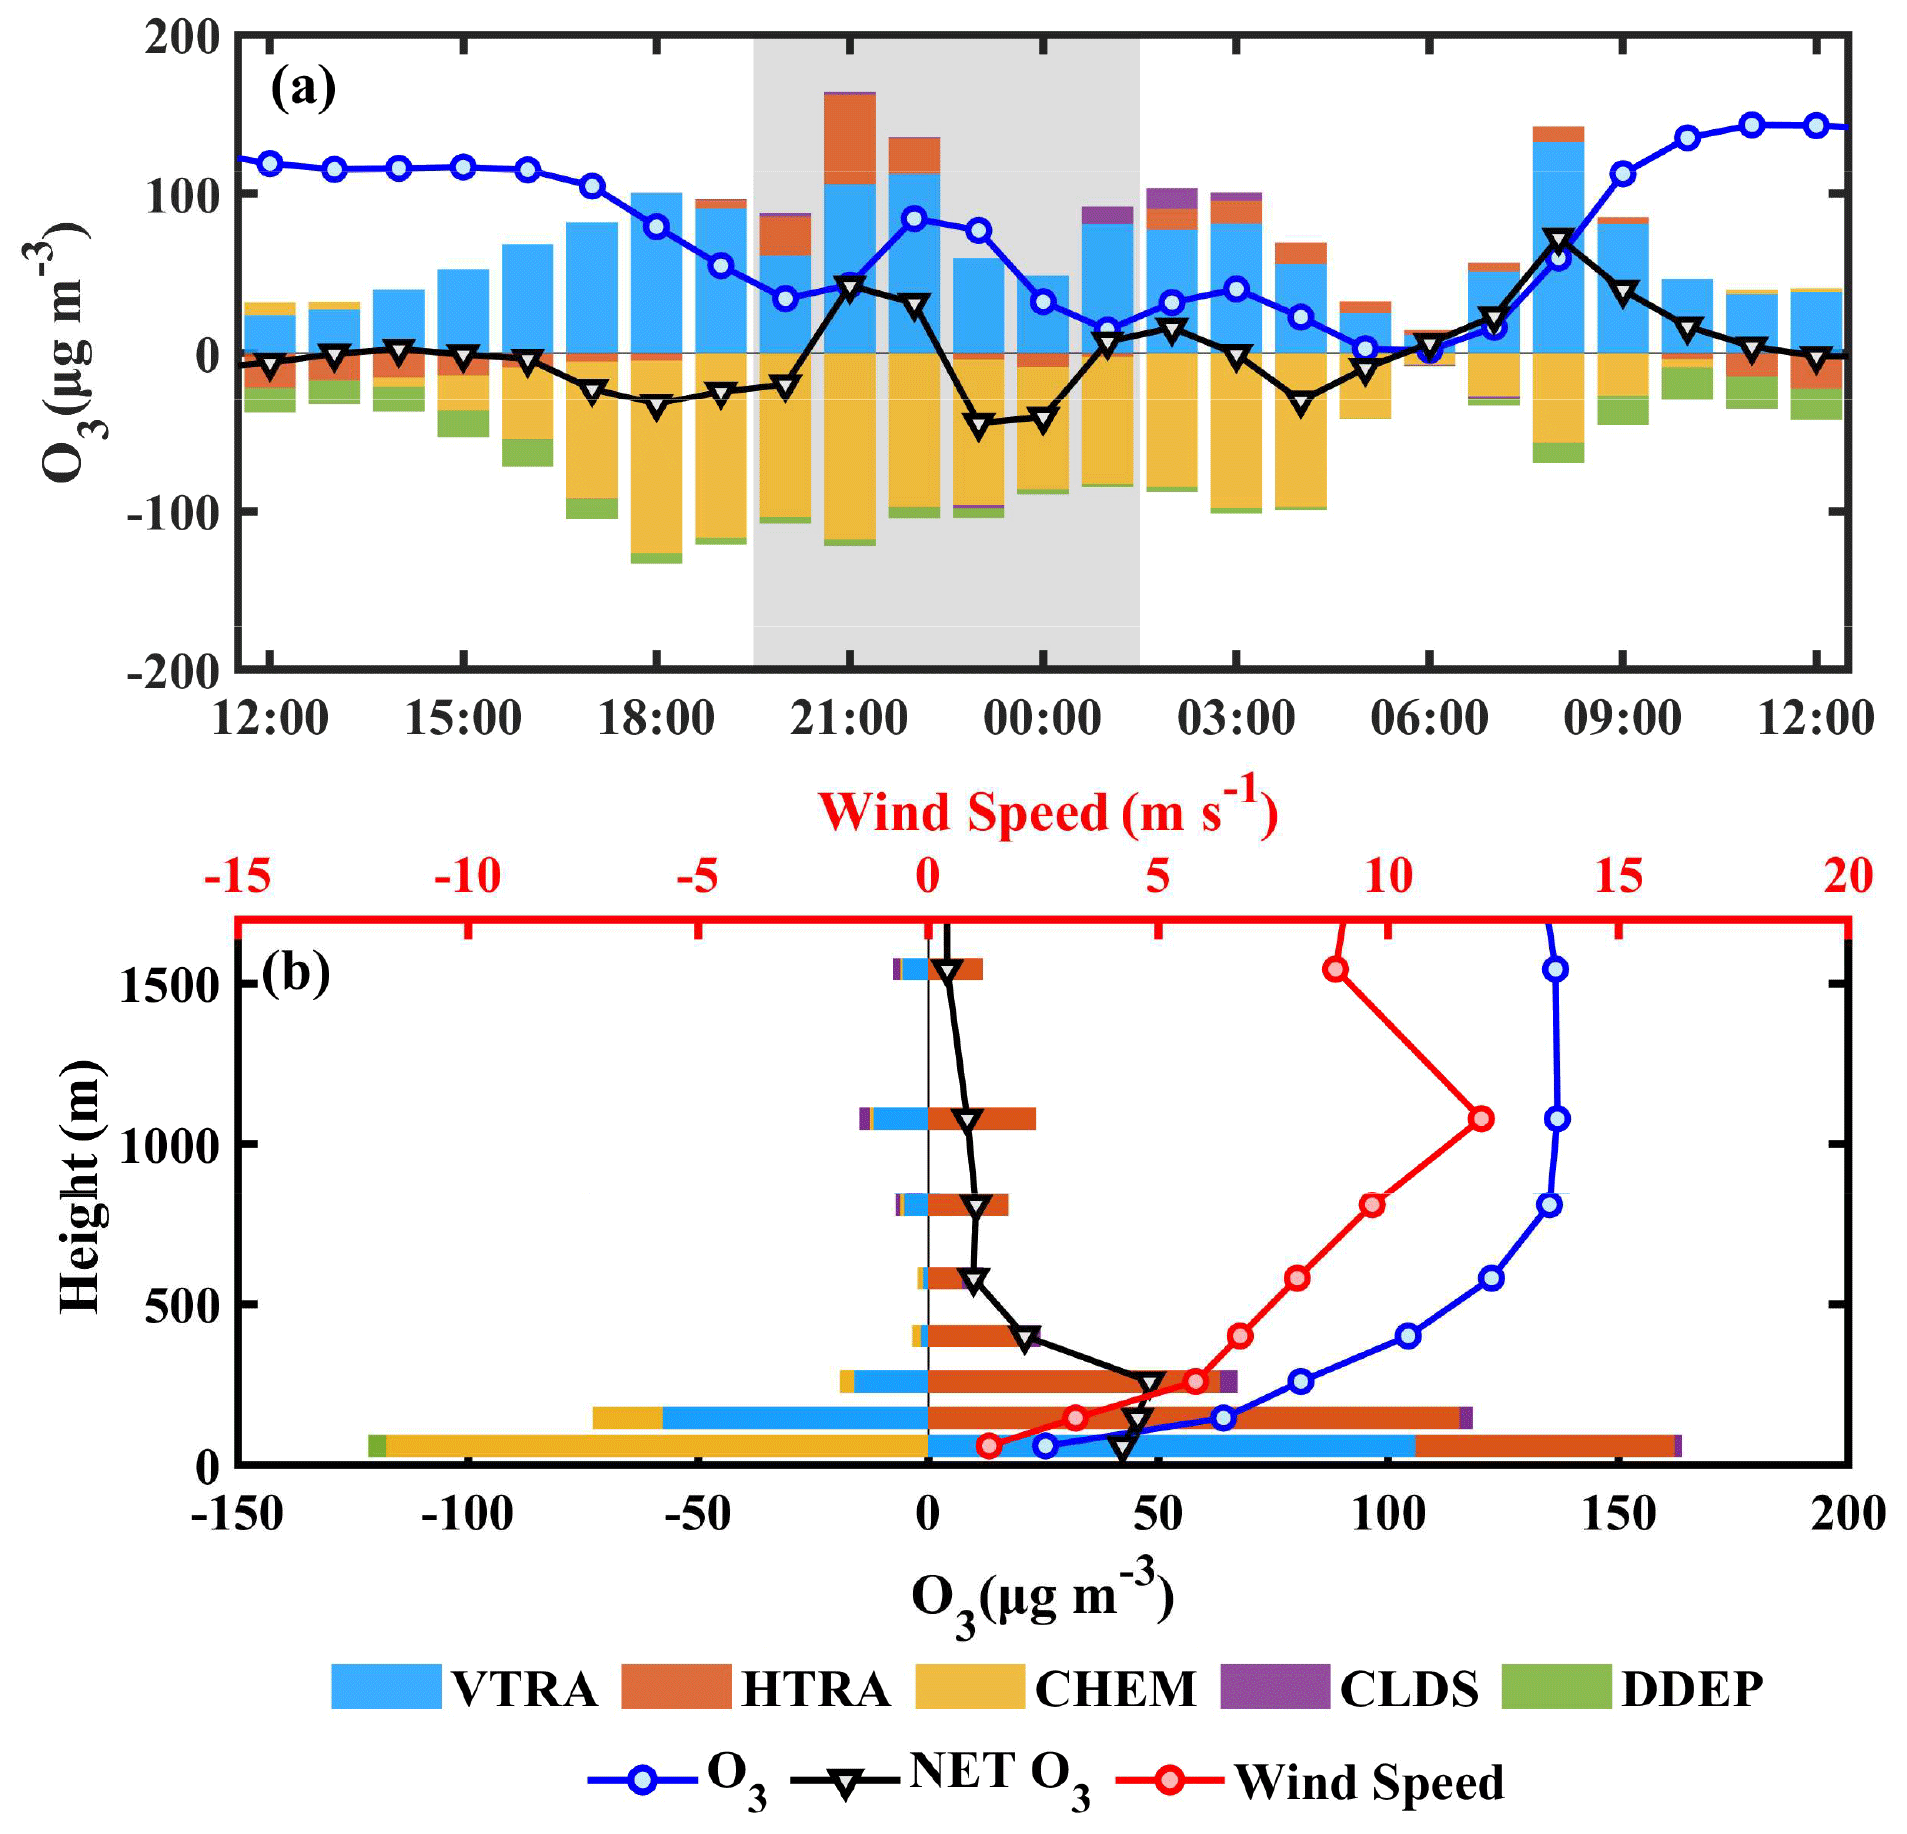
Figure 10Contribution of individual processes to (a) hourly O3 concentration near the surface during 13–14 September 2017 and (b) vertical O3 concentration at 21:00 LT on 13 September 2017. VTRA: vertical transport, the net effect of vertical advection and diffusion; HTRA: horizontal transport, the net effect of horizontal advection and diffusion; CHEM: gas-phase chemistry; CLDS: cloud processes; DDEP: dry deposition; NET: the net change in O3 due to all atmospheric processes.
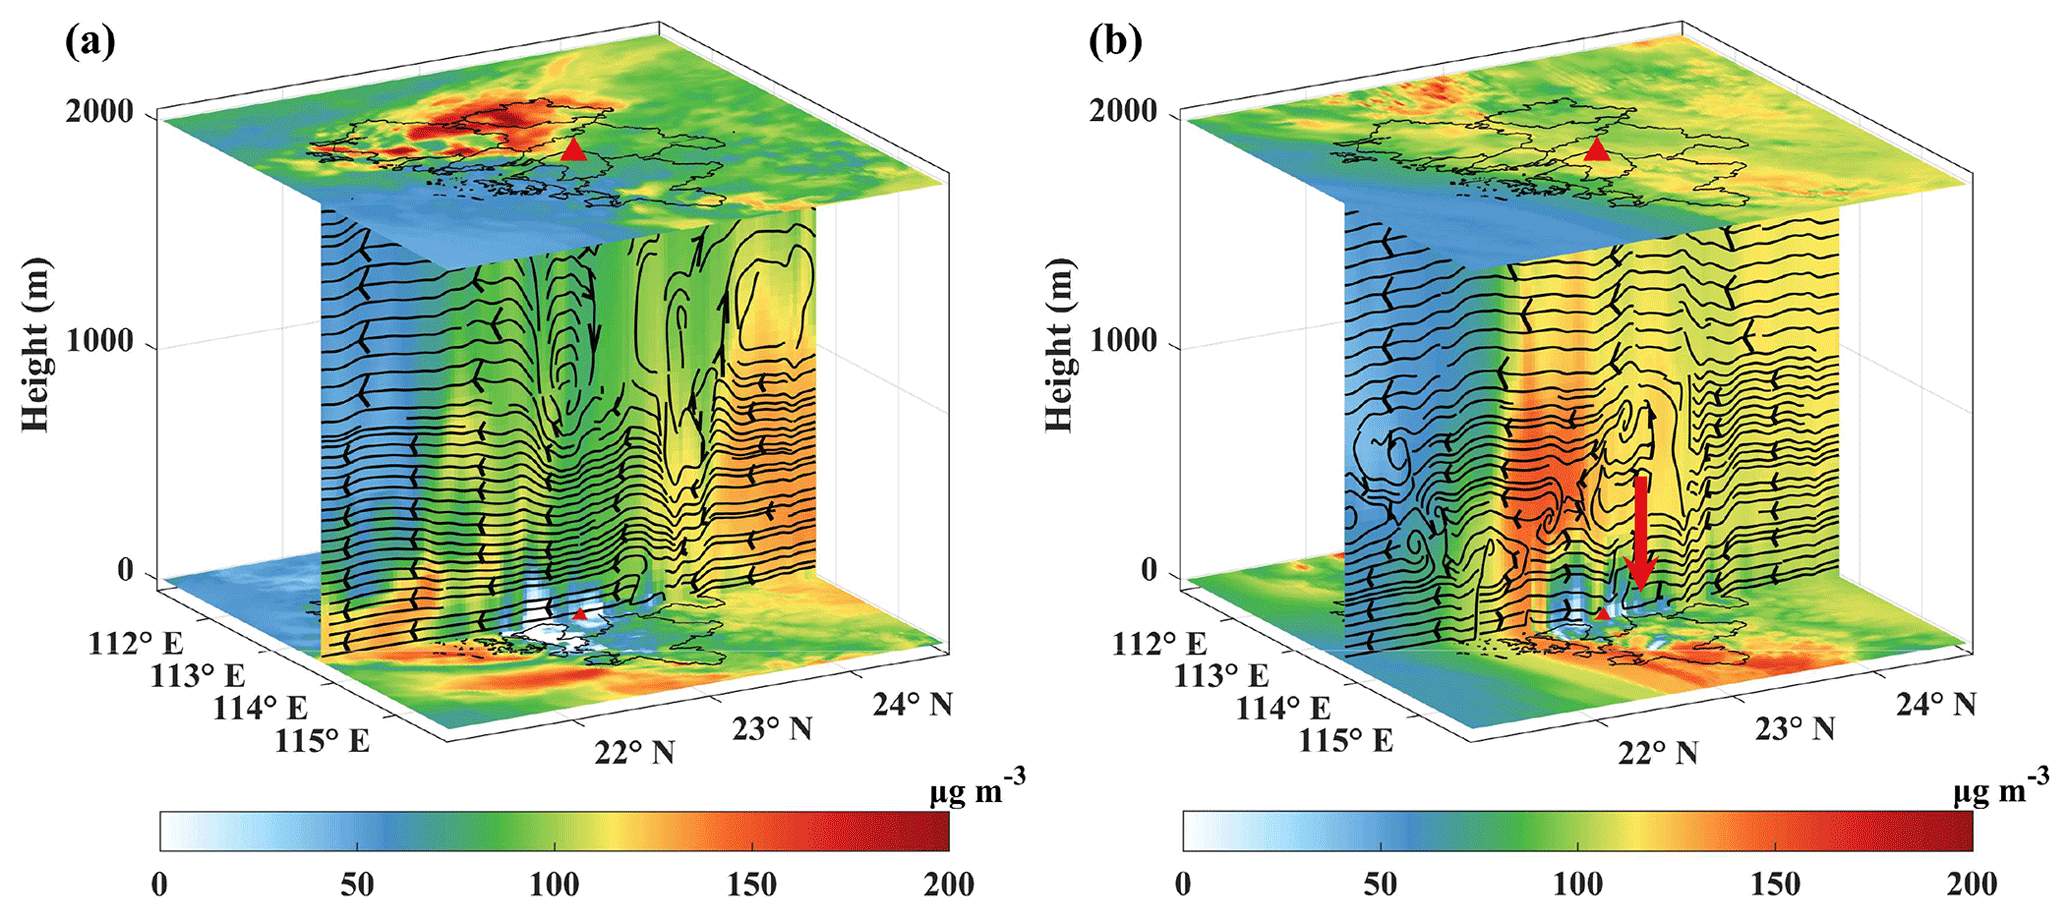
Figure 11Vertical profiles of O3 concentrations at 21:00 LT during (a) a normal day (12 September 2017) and (b) an NOI event (13 September 2017). Red triangles represent the NCYL site in Dongguan, contours represent O3 concentrations (µg m−3), and black lines and arrows indicate vertical airflow and its direction.
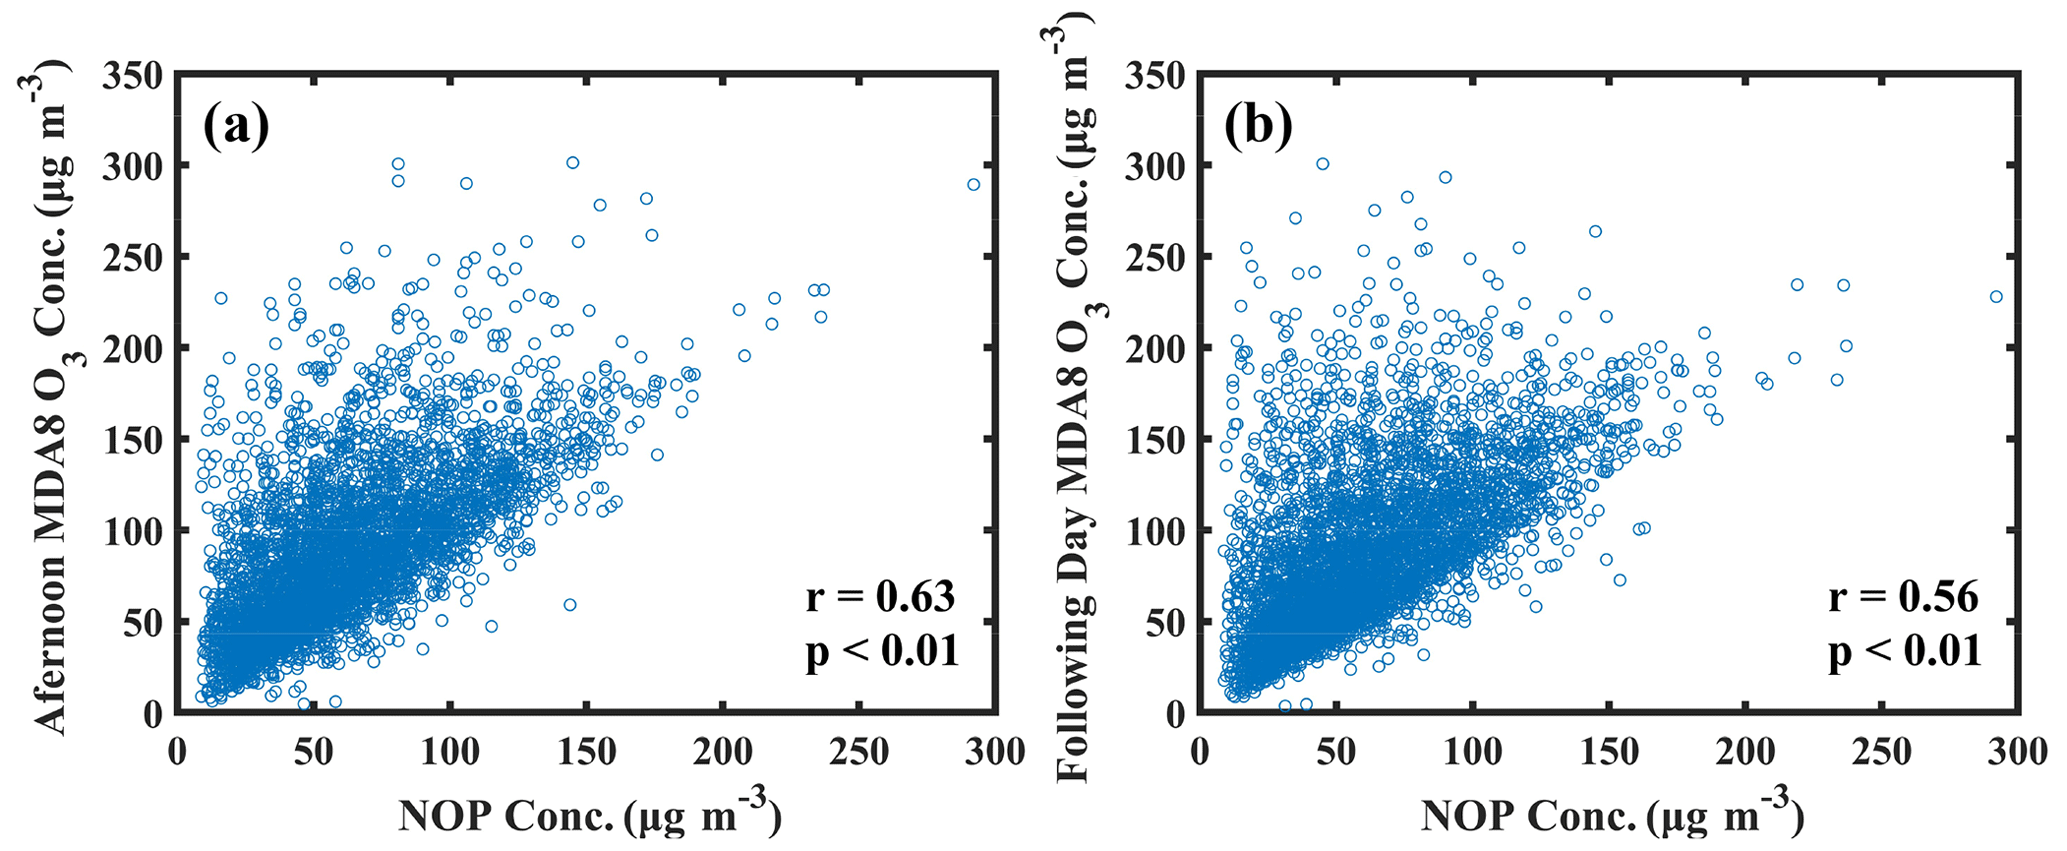
Figure 12Correlation between (a) the afternoon's MDA8 O3 concentration and the following night's NOP concentration and (b) the NOP concentration and the following afternoon's MDA8 O3 concentration.
3.8 Comparison and prospects
Zhu et al. (2020) identified an NOI event frequency of 16–19 d yr−1 in the summers from 2014 to 2015 in Beijing, China, with nocturnal O3 maxima ranging from 45 to 85 µg m−3, which is comparable to our result of NOI frequency (14 ± 3 d yr−1) and slightly higher than our NOP concentration (44 ± 7 µg m−3) in summer. Sousa et al. (2011) analysed nocturnal O3 maxima events (maxima higher than the average nocturnal O3 concentration of 10 µg m−3) during 2005–2007 in northern Portugal and found that the frequencies of nocturnal O3 maxima were between 40 % and 50 % in urban areas and 15 % in rural areas, which is higher than our NOI frequency (53 d yr−1, 14.5 %). Other studies focusing on short-term nocturnal O3 maxima cases found that NOP concentrations were 30–50 µg m−3 in the lower Fraser Valley, British Columbia, Canada (Salmond and McKendry, 2002), 20–60 µg m−3 in Senegal (Grant et al., 2008), and 40–80 µg m−3 in North America (Kuang et al., 2011; Hu et al., 2013; Sullivan et al., 2017), values that are comparable to our results (58 ± 11 µg m−3).
Our study emphasises the importance of meteorological processes, as well as daytime O3 concentration in the occurrence of NOI events, implying that higher NOP may occur during a severe daytime O3 pollution period under the effect of meteorological processes. The occurrence of NOI events is likely to impact the O3 levels on the following day, which makes O3 prevention more complex and challenging (Ravishankara, 2009; Sullivan et al., 2017). However, the relationship between NOI events and the following daytime O3 pollution remains unclear and controversial. Kuang et al. (2011) and Sullivan et al. (2017) revealed that NOI events led to a higher increasing rate of O3 and worse air quality on the following day, while Klein et al. (2019) and Caputi et al. (2019) observed lower O3 levels during the daytime following NOI events. To further explore the relationship between the daytime MDA8 O3 and nighttime NOP in the PRD region, we display the correlation between the MDA8 O3 and the following night's NOP (shorthand MDA8–NOP) (Fig. 12a) and the NOP and the following MDA8 O3 (shorthand NOP–MDA8) (Fig. 12b), respectively. The results show that MDA8 O3 was positively correlated with NOP with a correlation coefficient of 0.63 (p<0.01) and 0.56 (p<0.01) for MDA8–NOP and NOP–MDA8, respectively, suggesting an interplay between daytime O3 and NOP in the PRD region.
In this study, based on observed surface and vertical O3 data, ERA5 datasets and WRF-CMAQ simulations, the spatial and temporal characteristics of NOI events are comprehensively presented and the role of vertical transport in NOI events in the PRD region from 2006 to 2019 is further quantified.
The average annual frequency of NOI events is estimated to be 53 ± 16 d yr−1 from 2006 to 2019, with an annual average of 58 ± 11 µg m−3 for nocturnal O3 peak (NOP). LLJs are the dominant factors causing NOI events (61 %), followed by the combination of LLJs and Conv (LLJs+Conv) with a value of 16 %. The high correlation between NOI events and the frequency of LLJs in the annual trend (r=0.89, p<0.01) supports the important influence of LLJs on the occurrence of NOI events. Although the contribution of Conv to NOI events is relatively small, Conv-induced NOI events steadily increased at a rate of 0.26 d yr−1 during this 14 year period due to the impact of urbanisation. Moreover, the significant positive correlation between NOP and maximum daily 8 h average (MDA8) O3 in annual (r=0.88, p<0.01) and seasonal trends (r=0.80, p<0.01) and a higher NOI frequency (60 %) during the first half of the night imply that daytime O3 concentrations are also an important factor influencing the formation of NOI events.
Two typical NOI events caused by LLJs and Conv further demonstrate that downdrafts from enhanced turbulence are the direct cause of NOI events, as these can transport O3 from the RL to the surface. The difference is that LLJs induce downdrafts by a fast-moving air mass enhancing shear below, whereas Conv induce downdraft by compensating downdrafts.
This study emphasises the importance of vertical transport induced by LLJs, Conv, and daytime O3 concentration in the formation of NOI events and highlights the key role of vertical transport in linking daytime and nighttime O3 pollution. This study provides not only a new perspective and better understanding to reconceptualise the role of meteorology in daytime and nighttime O3 pollution but also a reference for other regions with ground-level O3 pollution.
The observed hourly meteorological data at the nine sites across the PRD region can be downloaded from http://www.cma.gov.cn/ (CMA, 2022). The ERA5 reanalysis dataset can be downloaded from https://cds.climate.copernicus.eu/cdsapp#!/home (Fifth-generation European Centre for Medium-Range Weather Forecasts, 2022). The vertical O3 profile data and the in situ hourly O3 data at 16 stations across the PRD region from 2006 to 2019 are available upon request from the corresponding author Weihua Chen.
The supplement related to this article is available online at: https://doi.org/10.5194/acp-23-453-2023-supplement.
YW and WC designed the research. YW did the data analysis and simulation work and prepared the draft with support and editing from WC. YY and QX contributed to data analysis. SJ and XW contributed to paper revision.
The contact author has declared that none of the authors has any competing interests.
Publisher's note: Copernicus Publications remains neutral with regard to jurisdictional claims in published maps and institutional affiliations.
The authors gratefully acknowledge the AirQuip (High-resolution Air Quality Information for Policy) Project funded by the Research Council of Norway, the Collaborative Innovation Center of Climate Change, Jiangsu province, China, and the high-performance computing platform of Jinan University. The authors would like to thank Dani Caputi (University of California, Davis) and the other anonymous referee for their thoughtful comments and efforts towards improving the paper.
This research has been supported by the Key-Area Research and Development Program of Guangdong Province (grant no. 2020B1111360003), the National Natural Science Foundation of China (grant nos. 42121004, 42230701, 41905086, 41905107, 42077205, and 41425020), the Science and Technology Projects in Guangzhou (grant no. 202102080141), the Special Fund Project for Science and Technology Innovation Strategy of Guangdong Province (grant no. 2019B121205004), and the national Key Research and Development Program of China (grant no. 2019YFE0106300).
This paper was edited by Jerome Brioude and reviewed by Dani Caputi and one anonymous referee.
Ai, Y., Li, W., Meng, Z., and Li, J.: Life cycle characteristics of MCSs in middle east China tracked by geostationary satellite and precipitation estimates, Mon. Weather Rev., 144, 2517–2530, https://doi.org/10.1175/MWR-D-15-0197.1, 2016.
Awang, N. R., Ramli, N. A., Yahaya, A. S., and Elbayoumi, M.: High nighttime ground-level ozone concentrations in Kemaman: NO and NO2 concentrations attributions, Aerosol Air Qual. Res., 15, 1357–1366, https://doi.org/10.4209/aaqr.2015.01.0031, 2015.
Banta, R. M., Newsom, R. K., Lundquist, J. K., Pichugina, Y. L., Coulter, R. L., and Mahrt, L.: Nocturnal low-level jet characteristics over Kansas during CASES-99, Bound.-Lay. Meteorol., 105, 221–252, https://doi.org/10.1023/A:1019992330866, 2002.
Brown, S. S., Neuman, J. A., Ryerson, T. B., Trainer, M., Dubé, W. P., Holloway, J. S., Warneke, C., de Gouw, J. A., Donnelly, S. G., Atlas, E., Matthew, B., Middlebrook, A. M., Peltier, R., Weber, R. J., Stohl, A., Meagher, J. F., Fehsenfeld, F. C., and Ravishankara, A. R.: Nocturnal odd-oxygen budget and its implications for ozone loss in the lower troposphere, Geophys. Res. Lett., 33, L08801, https://doi.org/10.1029/2006GL025900, 2006.
Caird, M. A., Richards, J. H., and Donovan, L. A.: Nighttime stomatal conductance and transpiration in C3 and C4 plants, Plant Physiol., 143, 4–10, https://doi.org/10.1104/pp.106.092940, 2007.
Caputi, D. J., Faloona, I., Trousdell, J., Smoot, J., Falk, N., and Conley, S.: Residual layer ozone, mixing, and the nocturnal jet in California's San Joaquin Valley, Atmos. Chem. Phys., 19, 4721–4740, https://doi.org/10.5194/acp-19-4721-2019, 2019.
Carlton, A. G., Bhave, P. V., Napelenok, S. L., Edney, E. O., Sarwar, G., Pinder, R. W., Pouliot, G. A., and Houyoux, M.: Model representation of secondary organic aerosol in CMAQv4.7, Environ. Sci. Technol., 44, 8553–8560, https://doi.org/10.1021/es100636q, 2010.
Carré, J., Gatimel, N., Moreau, J., Parinaud, J., and Leandri, R.: Influence of air quality on the results of in vitro fertilization attempts: A retrospective study, Eur. J. Obstet. Gyn. R. B., 210, 116–122, https://doi.org/10.1016/j.ejogrb.2016.12.012, 2017.
Carter, W. P. L.: Development of the SAPRC-07 chemical mechanism, Atmos. Environ., 44, 5324–5335, https://doi.org/10.1016/j.atmosenv.2010.01.026, 2010.
Chen, F. and Dudhia, J.: Coupling an advanced land surface–hydrology model with the Penn State–NCAR MM5 modeling system. Part I: Model implementation and sensitivity, Mon. Weather Rev., 129, 569–585, https://doi.org/10.1175/1520-0493(2001)129<0569:CAALSH>2.0.CO;2, 2001.
Chen, X., Zhao, K., and Xue, M.: Spatial and temporal characteristics of warm season convection over Pearl River Delta region, China, based on 3 years of operational radar data, J. Geophys. Res.-Atmos., 119, 12447–12465, https://doi.org/10.1002/2014jd021965, 2014.
Chen, X., Zhong, B., Huang, F., Wang, X., Sarkar, S., Jia, S., Deng, X., Chen, D., and Shao, M.: The role of natural factors in constraining long-term tropospheric ozone trends over southern China, Atmos. Environ., 220, 117060, https://doi.org/10.1016/j.atmosenv.2019.117060, 2020.
Cirelli, D., Equiza, M. A., Lieffers, V. J., and Tyree, M. T.: Populus species from diverse habitats maintain high night-time conductance under drought, Tree Physiol., 36, 229–242, https://doi.org/10.1093/treephys/tpv092, 2016.
CMA – China Meteorological Administration: National Meteorological Information Centre, http://www.cma.gov.cn/, last access: 10 February 2022.
Dias-Junior, C. Q., Dias, N. L., Fuentes, J. D., and Chamecki, M.: Convective storms and non-classical low-level jets during high ozone level episodes in the Amazon region: An ARM/GOAMAZON case study, Atmos. Environ., 155, 199–209, https://doi.org/10.1016/j.atmosenv.2017.02.006, 2017.
Du, Y. and Chen, G.: Heavy rainfall associated with double low-level jets over southern China. Part II: Convection initiation, Mon. Weather Rev., 147, 543–565, https://doi.org/10.1175/mwr-d-18-0102.1, 2019.
Emmons, L. K., Walters, S., Hess, P. G., Lamarque, J.-F., Pfister, G. G., Fillmore, D., Granier, C., Guenther, A., Kinnison, D., Laepple, T., Orlando, J., Tie, X., Tyndall, G., Wiedinmyer, C., Baughcum, S. L., and Kloster, S.: Description and evaluation of the Model for Ozone and Related chemical Tracers, version 4 (MOZART-4), Geosci. Model Dev., 3, 43–67, https://doi.org/10.5194/gmd-3-43-2010, 2010.
EPA: Guidance on the use of models and other analyses for demonstrating attainment of air quality goals for ozone, PM2.5, and regional haze, https://www.epa.gov/sites/default/files/2020-10/documents/final-03-pm-rh-guidance.pdf (last access: 10 February 2022), 2017.
Fan, X., Xia, X., Chen, H., Zhu, Y., Li, J., Yang, H., and Luo, H.: Baseline of Surface and Column-Integrated Aerosol Loadings in the Pearl River Delta Region, China, Front. Environ. Sci., 10, 574, https://doi.org/10.3389/fenvs.2022.893408, 2022.
Fast, J. D. and McCorcle, M. D.: A two-dimensional numerical sensitivity study of the Great Plains low-level jet, Mon. Weather Rev., 118, 151–164, https://doi.org/10.1175/1520-0493(1990)118<0151:ATDNSS>2.0.CO;2, 1990.
Feng, Y., Ning, M., Lei, Y., Sun, Y., Liu, W., and Wang, J.: Defending blue sky in China: Effectiveness of the “Air Pollution Prevention and Control Action Plan” on air quality improvements from 2013 to 2017, J. Environ. Manage., 252, 109603, https://doi.org/10.1016/j.jenvman.2019.109603, 2019.
Fifth-generation European Centre for Medium-Range Weather Forecasts: ERA5 hourly data on pressure levels from 1959 to present, https://cds.climate.copernicus.eu/cdsapp#!/home, last access: 10 February 2022.
George, J. J.: Weather forecasting for aeronautics, Academic Press, https://doi.org/10.1016/C2013-0-12567-6, 1960.
Gong, D., Wang, H., Zhang, S., Wang, Y., Liu, S. C., Guo, H., Shao, M., He, C., Chen, D., He, L., Zhou, L., Morawska, L., Zhang, Y., and Wang, B.: Low-level summertime isoprene observed at a forested mountaintop site in southern China: implications for strong regional atmospheric oxidative capacity, Atmos. Chem. Phys., 18, 14417–14432, https://doi.org/10.5194/acp-18-14417-2018, 2018.
Grant, D. D., Fuentes, J. D., DeLonge, M. S., Chan, S., Joseph, E., Kucera, P., Ndiaye, S. A., and Gaye, A. T.: Ozone transport by mesoscale convective storms in western Senegal, Atmos. Environ., 42, 7104–7114, https://doi.org/10.1016/j.atmosenv.2008.05.044, 2008.
Grell, G. A. and Dévényi, D.: A generalized approach to parameterizing convection combining ensemble and data assimilation techniques, Geophys. Res. Lett., 29, 381–384, https://doi.org/10.1029/2002gl015311, 2002.
Guenther, A., Karl, T., Harley, P., Wiedinmyer, C., Palmer, P. I., and Geron, C.: Estimates of global terrestrial isoprene emissions using MEGAN (Model of Emissions of Gases and Aerosols from Nature), Atmos. Chem. Phys., 6, 3181–3210, https://doi.org/10.5194/acp-6-3181-2006, 2006.
Han, C., Liu, R., Luo, H., Li, G., Ma, S., Chen, J., and An, T.: Pollution profiles of volatile organic compounds from different urban functional areas in Guangzhou China based on GC/MS and PTR-TOF-MS: Atmospheric environmental implications, Atmos. Environ., 214, 116843, https://doi.org/10.1016/j.atmosenv.2019.116843, 2019.
He, Y., Wang, H., Wang, H., Xu, X., Li, Y., and Fan, S.: Meteorology and topographic influences on nocturnal ozone increase during the summertime over Shaoguan, China, Atmos. Environ., 256, 118459, https://doi.org/10.1016/j.atmosenv.2021.118459, 2021.
Hersbach, H., Bell, B., Berrisford, P., Hirahara, S., Horányi, A., Muñoz-Sabater, J., Nicolas, J., Peubey, C., Radu, R., Schepers, D., Simmons, A., Soci, C., Abdalla, S., Abellan, X., Balsamo, G., Bechtold, P., Biavati, G., Bidlot, J., Bonavita, M., Chiara, G., Dahlgren, P., Dee, D., Diamantakis, M., Dragani, R., Flemming, J., Forbes, R., Fuentes, M., Geer, A., Haimberger, L., Healy, S., Hogan, R. J., Hólm, E., Janisková, M., Keeley, S., Laloyaux, P., Lopez, P., Lupu, C., Radnoti, G., Rosnay, P., Rozum, I., Vamborg, F., Villaume, S., and Thépaut, J. N.: The ERA5 global reanalysis, Q. J. Roy. Meteor. Soc., 146, 1999–2049, https://doi.org/10.1002/qj.3803, 2020.
HKEPD: Pearl River Delta Regional Air Quality Monitoring Report for Year 2017, https://www.epd.gov.hk/epd/sites/default/files/epd/english/resources_pub/publications/files/PRD_2017_report_en.pdf (last access: 10 February 2022), 2017.
Hodges, D. and Pu, Z. X.: Characteristics and variations of low-level jets and environmental factors associated with summer precipitation extremes over the Great Plains, J. Climate, 32, 5123–5144, https://doi.org/10.1175/jcli-d-18-0553.1, 2019.
Hu, X. M., Klein, P. M., Xue, M., Zhang, F., Doughty, D. C., Forkel, R., Joseph, E., and Fuentes, J. D.: Impact of the vertical mixing induced by low-level jets on boundary layer ozone concentration, Atmos. Environ., 70, 123–130, https://doi.org/10.1016/j.atmosenv.2012.12.046, 2013.
Iacono, M. J., Delamere, J. S., Mlawer, E. J., Shephard, M. W., Clough, S. A., and Collins, W. D.: Radiative forcing by long-lived greenhouse gases: Calculations with the AER radiative transfer models, J. Geophys. Res.-Atmos., 113, D13103, https://doi.org/10.1029/2008jd009944, 2008.
Jacob, D. J.: Heterogeneous chemistry and tropospheric ozone, Atmos. Environ., 34, 2131–2159, https://doi.org/10.1016/S1352-2310(99)00462-8, 2000.
Jain, S. L., Arya, B. C., Kumar, A., Ghude, S. D., and Kulkarni, P. S.: Observational study of surface ozone at New Delhi, India, Int. J. Remote Sens., 26, 3515–3524, https://doi.org/10.1080/01431160500076616, 2007.
Jiménez, P., Parra, R., and Baldasano, J. M.: Influence of initial and boundary conditions for ozone modeling in very complex terrains: A case study in the northeastern Iberian Peninsula, Environ. Modell. Softw., 22, 1294–1306, https://doi.org/10.1016/j.envsoft.2006.08.004, 2007.
Johnson, D. L.: A stability analysis of AVE-IV severe weather sounding, NASA Tech. Paper, 2045–2126, https://ntrs.nasa.gov/citations/19830006553 (last access: 10 February 2022), 1982.
Kallistratova, M. A.: Investigation of low-level-jets over rural and urban areas using two sodars, IOP C. Ser. Earth Env., 1, 012040, https://doi.org/10.1088/1755-1315/1/1/012040, 2008.
Klein, A., Ravetta, F., Thomas, J. L., Ancellet, G., Augustin, P., Wilson, R., Dieudonné, E., Fourmentin, M., Delbarre, H., and Pelon, J.: Influence of vertical mixing and nighttime transport on surface ozone variability in the morning in Paris and the surrounding region, Atmos. Environ., 197, 92–102, https://doi.org/10.1016/j.atmosenv.2018.10.009, 2019.
Kleinman, L., Lee, Y. N., Springston, S. R., Nunnermacker, L., Zhou, X., Brown, R., Hallock, K., Klotz, P., Leahy, D., and Lee, J. H.: Ozone formation at a rural site in the southeastern United States, J. Geophys. Res.-Atmos., 99, 3469–3482, https://doi.org/10.1029/93JD02991, 1994.
Kuang, S., Newchurch, M. J., Burris, J., Wang, L., Buckley, P. I., Johnson, S., Knupp, K., Huang, G., Phillips, D., and Cantrell, W.: Nocturnal ozone enhancement in the lower troposphere observed by lidar, Atmos. Environ., 45, 6078–6084, https://doi.org/10.1016/j.atmosenv.2011.07.038, 2011.
Kulkarni, P. S., Bortoli, D., and Silva, A. M.: Nocturnal surface ozone enhancement and trend over urban and suburban sites in Portugal, Atmos. Environ., 71, 251–259, https://doi.org/10.1016/j.atmosenv.2013.01.051, 2013.
Kulkarni, P. S., Bortoli, D., Silva, A. M., and Reeves, C. E.: Enhancements in nocturnal surface ozone at urban sites in the UK, Environ. Sci. Pollut. R., 22, 20295–20305, https://doi.org/10.1007/s11356-015-5259-z, 2015.
Kurt, O. K., Zhang, J., and Pinkerton, K. E.: Pulmonary health effects of air pollution, Curr. Opin. Pulm. Med., 22, 138–143, https://doi.org/10.1097/MCP.0000000000000248, 2016.
Li, K., Jacob, D. J., Liao, H., Zhu, J., Shah, V., Shen, L., Bates, K. H., Zhang, Q., and Zhai, S.: A two-pollutant strategy for improving ozone and particulate air quality in China, Nat. Geosci., 12, 906–910, https://doi.org/10.1038/s41561-019-0464-x, 2019.
Li, M., Liu, H., Geng, G., Hong, C., Liu, F., Song, Y., Tong, D., Zheng, B., Cui, H., Man, H., Zhang, Q., and He, K.: Anthropogenic emission inventories in China: a review, Natl. Sci. Rev., 4, 834–866, https://doi.org/10.1093/nsr/nwx150, 2017.
Li, X. B., Yuan, B., Parrish, D. D., Chen, D., Song, Y., Yang, S., Liu, Z., and Shao, M.: Long-term trend of ozone in southern China reveals future mitigation strategy for air pollution, Atmos. Environ., 269, 118869, https://doi.org/10.1016/j.atmosenv.2021.118869, 2022.
Li, Y., Wang, W., Chang, M., and Wang, X.: Impacts of urbanization on extreme precipitation in the Guangdong-Hong Kong-Macau Greater Bay Area, Urban Clim., 38, 100904, https://doi.org/10.1016/j.uclim.2021.100904, 2021.
Liao, Z., Ling, Z., Gao, M., Sun, J., Zhao, W., Ma, P., Quan, J., and Fan, S.: Tropospheric ozone variability over Hong Kong based on recent 20 years (2000–2019) ozonesonde observation, J. Geophys. Res.-Atmos., 126, e2020JD033054, https://doi.org/10.1029/2020jd033054, 2021.
Lin, Y., Farley, R. D., and Orville, H. D.: Bulk parameterization of the snow field in a cloud model, J. Appl. Meteorol. Clim., 22, 1065–1092, https://doi.org/10.1175/1520-0450(1983)022<1065:BPOTSF>2.0.CO;2, 1983.
Liu, H., Zhang, M., and Han, X.: A review of surface ozone source apportionment in China, Atmos. Ocean. Sci. Lett., 13, 470–484, https://doi.org/10.1080/16742834.2020.1768025, 2020.
Liu, X. H., Zhang, Y., Xing, J., Zhang, Q., Wang, K., Streets, D. G., Jang, C., Wang, W., and Hao, J. M.: Understanding of regional air pollution over China using CMAQ, part II. Process analysis and sensitivity of ozone and particulate matter to precursor emissions, Atmos. Environ., 44, 3719–3727, https://doi.org/10.1016/j.atmosenv.2010.03.036, 2010.
Lu, K., Zhang, Y., Su, H., Shao, M., Zeng, L., Zhong, L., Xiang, Y., Chang, C., Chou, C. K. C., and Wahner, A.: Regional ozone pollution and key controlling factors of photochemical ozone production in Pearl River Delta during summer time, Sci. China Chem., 53, 651–663, https://doi.org/10.1007/s11426-010-0055-6, 2010.
Lu, X., Zhang, L., Wang, X., Gao, M., Li, K., Zhang, Y., Yue, X., and Zhang, Y.: Rapid increases in warm-season surface ozone and resulting health impact in China since 2013, Environ. Sci. Tech. Let., 7, 240–247, https://doi.org/10.1021/acs.estlett.0c00171, 2020.
Ma, Z., Xu, J., Quan, W., Zhang, Z., Lin, W., and Xu, X.: Significant increase of surface ozone at a rural site, north of eastern China, Atmos. Chem. Phys., 16, 3969–3977, https://doi.org/10.5194/acp-16-3969-2016, 2016.
Mann, H. B.: Nonparametric tests against trend, Econometrica, 13, 245–259, https://doi.org/10.2307/1907187, 1945.
Mao, J., Yan, F., Zheng, L., You, Y., Wang, W., Jia, S., Liao, W., Wang, X., and Chen, W.: Ozone control strategies for local formation- and regional transport-dominant scenarios in a manufacturing city in southern China, Sci. Total Environ., 813, 151883, https://doi.org/10.1016/j.scitotenv.2021.151883, 2022.
Marelle, L., Myhre, G., Steensen, B. M., Hodnebrog, Ø., Alterskjær, K., and Sillmann, J.: Urbanization in megacities increases the frequency of extreme precipitation events far more than their intensity, Environ. Res. Lett., 15, 124072, https://doi.org/10.1088/1748-9326/abcc8f, 2020.
McCorcle, M. D.: Simulation of surface-moisture effects on the Great Plains low-level jet, Mon. Weather Rev., 116, 1705–1720, https://doi.org/10.1175/1520-0493(1988)116<1705:SOSMEO>2.0.CO;2, 1988.
MEE: The Ministry of Ecology and Environment of People's Republic of China, Guidelines for selection of ambient air quality models (Trial), https://english.mee.gov.cn/Resources/standards/Air_Environment/quality_standard1/201605/t20160511_337502.shtml (lass access: 10 February 2022), 2015.
Monin, A. S. and Obukhov, A. M.: Basic laws of turbulent mixing in the surface layer of the atmosphere, Contrib. Geophys. Inst. Acad. Sci. USSR, 151, e187, https://gibbs.science/efd/handouts/monin_obukhov_1954.pdf (last access: 10 February 2022), 1954.
Mousavinezhad, S., Choi, Y., Pouyaei, A., Ghahremanloo, M., and Nelson, D. L.: A comprehensive investigation of surface ozone pollution in China, 2015–2019: Separating the contributions from meteorology and precursor emissions, Atmos. Res., 257, 105599, https://doi.org/10.1016/j.atmosres.2021.105599, 2021.
Nair, P. R., Chand, D., Lal, S., Modh, K. S., Naja, M., Parameswaran, K., Ravindran, S., and Venkataramani, S.: Temporal variations in surface ozone at Thumba (8.6∘ N, 77∘ E) – a tropical coastal site in India, Atmos. Environ., 36, 603–610, https://doi.org/10.1016/S1352-2310(01)00527-1, 2002.
Nakanishi, M. and Niino, H.: An improved Mellor–Yamada Level-3 model: Its numerical stability and application to a regional prediction of advection fog, Bound.-Lay. Meteorol., 119, 397–407, https://doi.org/10.1007/s10546-005-9030-8, 2006.
Nikolic, J., Zhong, S., Pei, L., Bian, X., Heilman, W. E., and Charney, J. J.: Sensitivity of low-level jets to land-use and land-cover change over the continental US, Atmosphere, 10, 174, https://doi.org/10.3390/atmos10040174, 2019.
Olauson, J.: ERA5: The new champion of wind power modelling?, Renew. Energ., 126, 322–331, https://doi.org/10.1016/j.renene.2018.03.056, 2018.
Ploeger, F., Diallo, M., Charlesworth, E., Konopka, P., Legras, B., Laube, J. C., Grooß, J.-U., Günther, G., Engel, A., and Riese, M.: The stratospheric Brewer–Dobson circulation inferred from age of air in the ERA5 reanalysis, Atmos. Chem. Phys., 21, 8393–8412, https://doi.org/10.5194/acp-21-8393-2021, 2021.
Prtenjak, M. T., Jerièeviæ, A., Klaiæ, Z. B., Alebiæ-Juretiæ, A., and Buliæ, I. H.: Atmospheric dynamics and elevated ozone concentrations in the northern Adriatic, Meteorol. Appl., 20, 482–496, https://doi.org/10.1002/met.1312, 2013.
Ravishankara, A. R.: Are chlorine atoms significant tropospheric free radicals?, P. Natl. Acad. Sci. USA, 106, 13639–13640, https://doi.org/10.1073/pnas.0907089106, 2009.
Salmond, J. A. and McKendry, I. G.: Secondary ozone maxima in a very stable nocturnal boundary layer: Observations from the Lower Fraser Valley, BC, Atmos. Environ., 36, 5771–5782, https://doi.org/10.1016/S1352-2310(02)00698-2, 2002.
Seibert, P., Feldmann, H., Neininger, B., Baumle, M., and Trickl, T.: South foehn and ozone in the Eastern Alps – case study and climatological aspects, Atmos. Environ., 34, 1379–1394, https://doi.org/10.1016/S1352-2310(99)00439-2, 2000.
Sen, P. K.: Estimates of the regression coefficient based on Kendall's tau, J. Am. Stat. Assoc., 63, 1379–1389, https://doi.org/10.2307/2285891, 1968.
Seto, K. C., Guneralp, B., and Hutyra, L. R.: Global forecasts of urban expansion to 2030 and direct impacts on biodiversity and carbon pools, P. Natl. Acad. Sci. USA, 109, 16083–16088, https://doi.org/10.1073/pnas.1211658109, 2012.
Shen, J., Zhang, Y., Wang, X., Li, J., Chen, H., Liu, R., Zhong, L., Jiang, M., Yue, D., Chen, D., and Lv, W.: An ozone episode over the Pearl River Delta in October 2008, Atmos. Environ., 122, 852–863, https://doi.org/10.1016/j.atmosenv.2015.03.036, 2015.
Shith, S., Awang, N. R., Latif, M. T., and Ramli, N. A.: Fluctuations in nighttime ground-level ozone concentrations during haze events in Malaysia, Air Qual. Atmos. Hlth., 14, 19–26, https://doi.org/10.1007/s11869-020-00908-5, 2021.
Sousa, S. I. V., Alvim-Ferraz, M. C. M., and Martins, F. G.: Identification and origin of nocturnal ozone maxima at urban and rural areas of northern Portugal – Influence of horizontal transport, Atmos. Environ., 45, 942–956, https://doi.org/10.1016/j.atmosenv.2010.11.008, 2011.
Stull, R. B.: An introduction to boundary layer meteorology, Springer Science and Business Media, ISBN 978-94-009-3027-8, 1988.
Sugimoto, N., Nishizawa, T., Liu, X., Matsui, I., Shimizu, A., Zhang, Y., Kim, Y. J., Li, R., and Liu, J.: Continuous observations of aerosol profiles with a two-wavelength Mie-scattering lidar in Guangzhou in PRD2006, J. Appl. Meteorol. Clim., 48, 1822–1830, https://doi.org/10.1175/2009JAMC2089.1, 2009.
Sullivan, J. T., Rabenhorst, S. D., Dreessen, J., McGee, T. J., Delgado, R., Twigg, L., and Sumnicht, G.: Lidar observations revealing transport of O3 in the presence of a nocturnal low-level jet: Regional implications for “next-day” pollution, Atmos. Environ., 158, 160–171, https://doi.org/10.1016/j.atmosenv.2017.03.039, 2017.
Tong, N. Y. O. and Leung, D. Y. C.: Ozone diurnal characteristics in areas with different urbanisations, Int. J. Environ. Pollut., 49, 100–124, https://doi.org/10.1504/Ijep.2012.049771, 2012.
Trier, S. B., Wilson, J. W., Ahijevych, D. A., and Sobash, R. A.: Mesoscale vertical motions near nocturnal convection initiation in PECAN, Mon. Weather Rev., 145, 2919–2941, https://doi.org/10.1175/mwr-d-17-0005.1, 2017.
Udina, M., Soler, M. R., Olid, M., Jiménez-Esteve, B., and Bech, J.: Pollutant vertical mixing in the nocturnal boundary layer enhanced by density currents and low-level jets: Two representative case studies, Bound.-Lay. Meteorol., 174, 203–230, https://doi.org/10.1007/s10546-019-00483-y, 2019.
Wang, T., Wei, X. L., Ding, A. J., Poon, C. N., Lam, K. S., Li, Y. S., Chan, L. Y., and Anson, M.: Increasing surface ozone concentrations in the background atmosphere of Southern China, 1994–2007, Atmos. Chem. Phys., 9, 6217–6227, https://doi.org/10.5194/acp-9-6217-2009, 2009.
Wang, T., Xue, L., Brimblecombe, P., Lam, Y. F., Li, L., and Zhang, L.: Ozone pollution in China: A review of concentrations, meteorological influences, chemical precursors, and effects, Sci. Total Environ., 575, 1582–1596, https://doi.org/10.1016/j.scitotenv.2016.10.081, 2017.
Wang, T., Dai, J., Lam, K. S., Nan Poon, C., and Brasseur, G. P.: Twenty-five years of lower tropospheric ozone observations in tropical East Asia: The influence of emissions and weather patterns, Geophys. Res. Lett., 46, 11463–11470, https://doi.org/10.1029/2019GL084459, 2019.
Wang, X., Zhang, Y., Hu, Y., Zhou, W., Lu, K., Zhong, L., Zeng, L., Shao, M., Hu, M., and Russell, A. G.: Process analysis and sensitivity study of regional ozone formation over the Pearl River Delta, China, during the PRIDE-PRD2004 campaign using the Community Multiscale Air Quality modeling system, Atmos. Chem. Phys., 10, 4423–4437, https://doi.org/10.5194/acp-10-4423-2010, 2010.
Wang, X., Situ, S., Guenther, A., Chen, F. E. I., Wu, Z., Xia, B., and Wang, T.: Spatiotemporal variability of biogenic terpenoid emissions in Pearl River Delta, China, with high-resolution land-cover and meteorological data, Tellus B, 63, 241–254, https://doi.org/10.1111/j.1600-0889.2010.00523.x, 2011.
Wu, X., Yuan, T., Qie, K., and Luo, J.: Geographical distribution of extreme deep and intense convective storms on Earth, Atmos. Res., 235, 104789, https://doi.org/10.1016/j.atmosres.2019.104789, 2020.
Wyat Appel, K., Napelenok, S., Hogrefe, C., Pouliot, G., Foley, K. M., Roselle, S. J., Pleim, J. E., Bash, J., Pye, H. O. T., Heath, N., Murphy, B., and Mathur, R.: Overview and evaluation of the Community Multiscale Air Quality (CMAQ) modeling system version 5.2, in: Air Pollution Modeling and its Application XXV, Springer Proceedings in Complexity, Springer, 69–73, https://doi.org/10.1007/978-3-319-57645-9_11, 2018.
Xue, L., Wang, T., Louie, P. K., Luk, C. W., Blake, D. R., and Xu, Z.: Increasing external effects negate local efforts to control ozone air pollution: A case study of Hong Kong and implications for other Chinese cities, Environ. Sci. Technol., 48, 10769–10775, https://doi.org/10.1021/es503278g, 2014.
Yang, C., Li, Q., Hu, Z., Chen, J., Shi, T., Ding, K., and Wu, G.: Spatiotemporal evolution of urban agglomerations in four major bay areas of US, China and Japan from 1987 to 2017: Evidence from remote sensing images, Sci. Total Environ., 671, 232–247, https://doi.org/10.1016/j.scitotenv.2019.03.154, 2019.
Yang, L., Luo, H., Yuan, Z., Zheng, J., Huang, Z., Li, C., Lin, X., Louie, P. K. K., Chen, D., and Bian, Y.: Quantitative impacts of meteorology and precursor emission changes on the long-term trend of ambient ozone over the Pearl River Delta, China, and implications for ozone control strategy, Atmos. Chem. Phys., 19, 12901–12916, https://doi.org/10.5194/acp-19-12901-2019, 2019.
Yue, X., Unger, N., Harper, K., Xia, X., Liao, H., Zhu, T., Xiao, J., Feng, Z., and Li, J.: Ozone and haze pollution weakens net primary productivity in China, Atmos. Chem. Phys., 17, 6073–6089, https://doi.org/10.5194/acp-17-6073-2017, 2017.
Yusoff, M. F., Latif, M. T., Juneng, L., Khan, M. F., Ahamad, F., Chung, J. X., and Mohtar, A. A. A.: Spatio-temporal assessment of nocturnal surface ozone in Malaysia, Atmos. Environ., 207, 105–116, https://doi.org/10.1016/j.atmosenv.2019.03.023, 2019.
Zheng, B., Tong, D., Li, M., Liu, F., Hong, C., Geng, G., Li, H., Li, X., Peng, L., Qi, J., Yan, L., Zhang, Y., Zhao, H., Zheng, Y., He, K., and Zhang, Q.: Trends in China's anthropogenic emissions since 2010 as the consequence of clean air actions, Atmos. Chem. Phys., 18, 14095–14111, https://doi.org/10.5194/acp-18-14095-2018, 2018.
Zhang, B., Li, J., Wang, M., Duan, P., and Li, C.: Using DMSP/OLS and NPP/VIIRS images to analyze the expansion of 21 urban agglomerations in mainland China, J. Urban Plan. Dev., 147, 04021024, https://doi.org/10.1061/(asce)up.1943-5444.0000690, 2021.
Zhang, R., Lei, W., Tie, X., and Hess, P.: Industrial emissions cause extreme urban ozone diurnal variability, P. Natl. Acad. Sci. USA, 101, 6346–6350, https://doi.org/10.1073/pnas.0401484101, 2004.
Zhong, Z., Zheng, J., Zhu, M., Huang, Z., Zhang, Z., Jia, G., Wang, X., Bian, Y., Wang, Y., and Li, N.: Recent developments of anthropogenic air pollutant emission inventories in Guangdong province, China, Sci. Total Environ., 627, 1080–1092, https://doi.org/10.1016/j.scitotenv.2018.01.268, 2018.
Zhu, X. W., Ma, Z. Q., Li, Z. M., Wu, J., Guo, H., Yin, X. M., Ma, X. H., and Qiao, L.: Impacts of meteorological conditions on nocturnal surface ozone enhancement during the summertime in Beijing, Atmos. Environ., 225, 117368, https://doi.org/10.1016/j.atmosenv.2020.117368, 2020.
Ziemann, A., Starke, M., and Leiding, T.: Sensitivity of nocturnal low-level jets to land-use parameters and meteorological quantities, Adv. Sci. Res., 16, 85–93, https://doi.org/10.5194/asr-16-85-2019, 2019.