the Creative Commons Attribution 4.0 License.
the Creative Commons Attribution 4.0 License.
 | 14 Apr 2023
Measurement report: Radiative efficiencies of (CF3)2CFCN, CF3OCFCF2, and CF3OCF2CF3
Beni Adi Trisna
Seungnam Park
Injun Park
Absorption cross sections of emerging greenhouse gases (GHGs) were measured to estimate the radiative efficiency using high-resolution Fourier transform infrared spectroscopy (HR-FTIR). For quantitative spectroscopy, the Beer–Lambert parameters of absorber pressure, temperature, and optical path length (OPL) were accurately determined to be traceable to the primary standards. The OPL of the multipass cell mounted on the HR-FTIR spectrometer was spectroscopically calibrated. A ratio of the averaged N2O absorptions was found to be in the range of 2217.4–2219.0 cm−1, with a spectral resolution of 0.026 cm−1, yielding a ratio of OPLs between the multipass cell and reference cell. This cell-to-cell comparison method is free from the uncertainty of the referring line strength, which reduced the calibration uncertainty compared with the direct line-strength referring method. With the OPL-calibrated multipass cell (3.169 ± 0.079 m), the absorption cross sections were measured at low absorber pressures with a spectral resolution of 2 cm−1, integrated at 10 cm−1 intervals, and multiplied by the new narrow band model to yield the radiative efficiencies. The radiative efficiency values of CF4, SF6, and NF3 were evaluated to be 0.085 ± 0.002, 0.573 ± 0.016, and 0.195 ± 0.008 W m−2 ppb−1, respectively, which are consistent with previously reported values. For the emerging GHGs, the radiative efficiency values were determined to be 0.201 ± 0.008 W m−2 ppb−1 for heptafluoroisobutyronitrile (CF3)2CFCN; commercially referred to as Novec-4710), 0.328 ± 0.013 W m−2 ppb−1 for perfluoro methyl vinyl ether (CF3OCFCF2; PMVE), and 0.544 ± 0.022 W m−2 ppb−1 for 1,1,1,2,2-pentafluoro-2-(trifluoromethoxy)ethane (CF3OCF2CF3; PFMEE).
- Article
(1363 KB) - Full-text XML
-
Supplement
(835 KB) - BibTeX
- EndNote


Radiative efficiency is a measure of the radiative forcing for a unit change in the atmospheric concentration of a single greenhouse gas (GHG). Emitted GHGs undergo degradation via a range of atmospheric reactions that define their atmospheric lifetimes. The concentration of a GHG shows a timely reduction according to its atmospheric lifetime, which also reduces the thermal energy flux. Integrating the radiative forcing over a designated time horizon yields the absolute global warming potential, which is expressed in m−2 kg−1 years. The global warming potential (GWP; unitless), defined as the ratio of the absolute GWP of a gas to the absolute GWP of CO2, over the same time horizon, was developed to compare the relative integrated effect of various compounds on climate. In the nationally determined contribution, GHG emissions are reported in terms of the CO2 equivalent amount as rated by the GWP, with the value for CO2 designated as 1 (UNFCCC secretariat, 2015). To date, the GWPs of major GHGs have been reported in the Intergovernmental Panel on Climate Change (IPCC) Sixth Assessment Report (AR6), by combining multiple radiative forcing and atmospheric lifetime values obtained from different independent studies (Sixth Assessment Report (AR6): Climate Change 2021, 2021). Although the GWP is the de facto climate metric standard for reporting the nationally determined contribution, there has been a debate within the climate research community regarding the reliability of GWP values (Denison et al., 2019; Rosenzweig et al., 2018). The climate impacts of emission pathways can be misinterpreted by the simple aggregation of GWPs of different GHGs. To resolve this problem, alternative climate metrics, such as the global temperature change potential and short-lived climate pollutants adjusted GWP have been suggested to fill the error gap in the prediction of target atmospheric temperatures in the characterization of mitigation pathways (Allen et al., 2018; Denison et al., 2019; Lynch et al., 2020). Meanwhile, the uncertainty in the measurement of GWP has gained attention as a focus area for improving the accuracy of the GWP. The IPCC AR6 includes a discussion regarding the major uncertainty sources of climate metrics that originate from the atmospheric lifetime, radiative efficiency, chemical response, and absolute GWP of CO2 (Forster et al., 2021). Sulbaek Andersen et al. (2021) determined that a standardization of laboratory kinetics measurements is required to enhance the reliability of atmospheric lifetime measurements. Similarly, the reliability of atmospheric lifetime values can be enhanced by the accurate measurement of the absorption cross section, which is an in-laboratory measurement parameter for radiative efficiency. According to the IPCC AR6, the uncertainties of radiative efficiency values are one of the major contributors to the total uncertainty in the GWP, with proportions of up to 22 %, depending on the compound (Forster et al., 2021). In this study, we propose an accurate measurement method for radiative efficiency and assess the uncertainty budget in detail.
The well-studied and emerging GHGs were comprehensively evaluated as follows: (1) the spectroscopic calibration of the optical path length (OPL) was conducted using high-resolution Fourier transform infrared spectroscopy (HR-FTIR), an essential tool for accurate absorption cross-sectional measurements. (2) The new narrow band model (nNBM), wherein the stratospheric–temperature adjustment has been applied to the (traditional) narrow band model (NBM), was used to evaluate the radiative efficiency. (3) An uncertainty assessment of the radiative efficiency values of the well-studied and emerging GHGs was conducted. The emerging GHGs for which the radiative efficiency values were assessed in this study were heptafluoro isobutyronitrile (commercially known as Novec-4710, (CF3)2CFCN), 1,1,1,2,2-pentafluoro-2-(trifluoromethoxy)ethane (PFMEE, CF3OCF2CF3), and perfluoro methyl vinyl ether (PMVE, CF3OCFCF2). Novec-4710 is used as an alternative to SF6 as an insulator for gas-insulated switchgear (Sulbaek Andersen et al., 2017; Laruelle et al., 2017; Zhao et al., 2019). PMVE and PFMEE are considered future alternatives to chlorofluorocarbons, although their radiative efficiency (RE) values have rarely been reported to date (Kim et al., 2014; Li et al., 2000). The values obtained for the well-studied GHGs (NF3, SF6, and CF4) were compared with those reported in previous studies to corroborate the validity of the proposed method.
2.1 Instrumental setup
HR-FTIR (Bruker IFS 125HR) was used throughout the measurement procedure. The spectrometer was equipped with a KBr beam splitter, which enabled measurements between 400 and 6500 cm−1. The measurements were conducted by passing a collimated thermal light source through a reference gas cell or a multipass cell (the White type). A mercury cadmium telluride (MCT) detector, cooled using liquid nitrogen, was used for all the spectroscopic calibration measurements of the OPLs and absorption cross sections of the target GHGs. For the MCT detector, a nonlinearity correction was applied to the detector response when recording the interferograms. The correction algorithm for the instrumental control and spectrum acquisition was implemented in OPUS software. For the spectroscopic calibration of the OPL, N2O absorption spectra were obtained at a resolution of 0.026 cm−1 (maximum optical path difference is 36 cm) from the reference cell and multipass cell. The instrumental line shape (ILS) was retrieved from the measured N2O spectra in the reference cell using the LINEFIT program (Fig. S1). Additionally, inverse modelling of the modulation efficiency and phase error in the domain of the optical path difference was performed (Hase et al., 1999). The pure absorption spectrum of N2O was forward-modelled using the Voigt profile with HITRAN parameters, such as line strength and self-broadening coefficient. The residuals between the measured and modelled spectra were minimized to provide the best fits of the modulation efficiency and phase error values as a function of the optical path difference. The ILS was then reconstructed using the pre-set apodization of the Norton–Beer strong function. Subsequently, the N2O spectra in the multipass cell were obtained using the same instrumental parameters as those used for the reference cell measurement. The ratio of the absorption areas between the multipass cell and reference cell was obtained via deconvolution of the ILS (Fig. 1). We found that if the ILS was not deconvoluted, the ratio value was considerably distorted from the original value owing to the differing extents of pressure broadening. The OPL of the multipass cell was then determined by comparison with the peak area of the reference cell measurement. For this comparison, the absorption lines of N2O were selected from 2217.4 to 2219.0 cm−1. The theoretical details of the OPL calibration method are presented in the Supplement S1 and S2. The total pressures of the reference and multipass cells were 0.71 and 70.93 Torr, respectively. To obtain the values lying within the linear region of the curve-of-growth plot, the concentration of N2O in the multipass cell was diluted to 481.943 µmol mol−1 using an N2 broadener, which corresponds to an absorption burden (OPL × partial pressure) of 10.6 cm Torr (Fig. 2). A detailed discussion of the curve-of-growth analysis is also provided in the Supplement S1. The length between the inner faces of the reference cell (20.01 ± 0.05 mm (1σ)) is traceable to the national gauge block standards. Given that the cell temperature (297 ± 1 K) was well equilibrated to the temperature of the surroundings, it can be assumed that the temperature distribution of the gas was homogeneous throughout the beam path. The spectra were averaged 64 times.
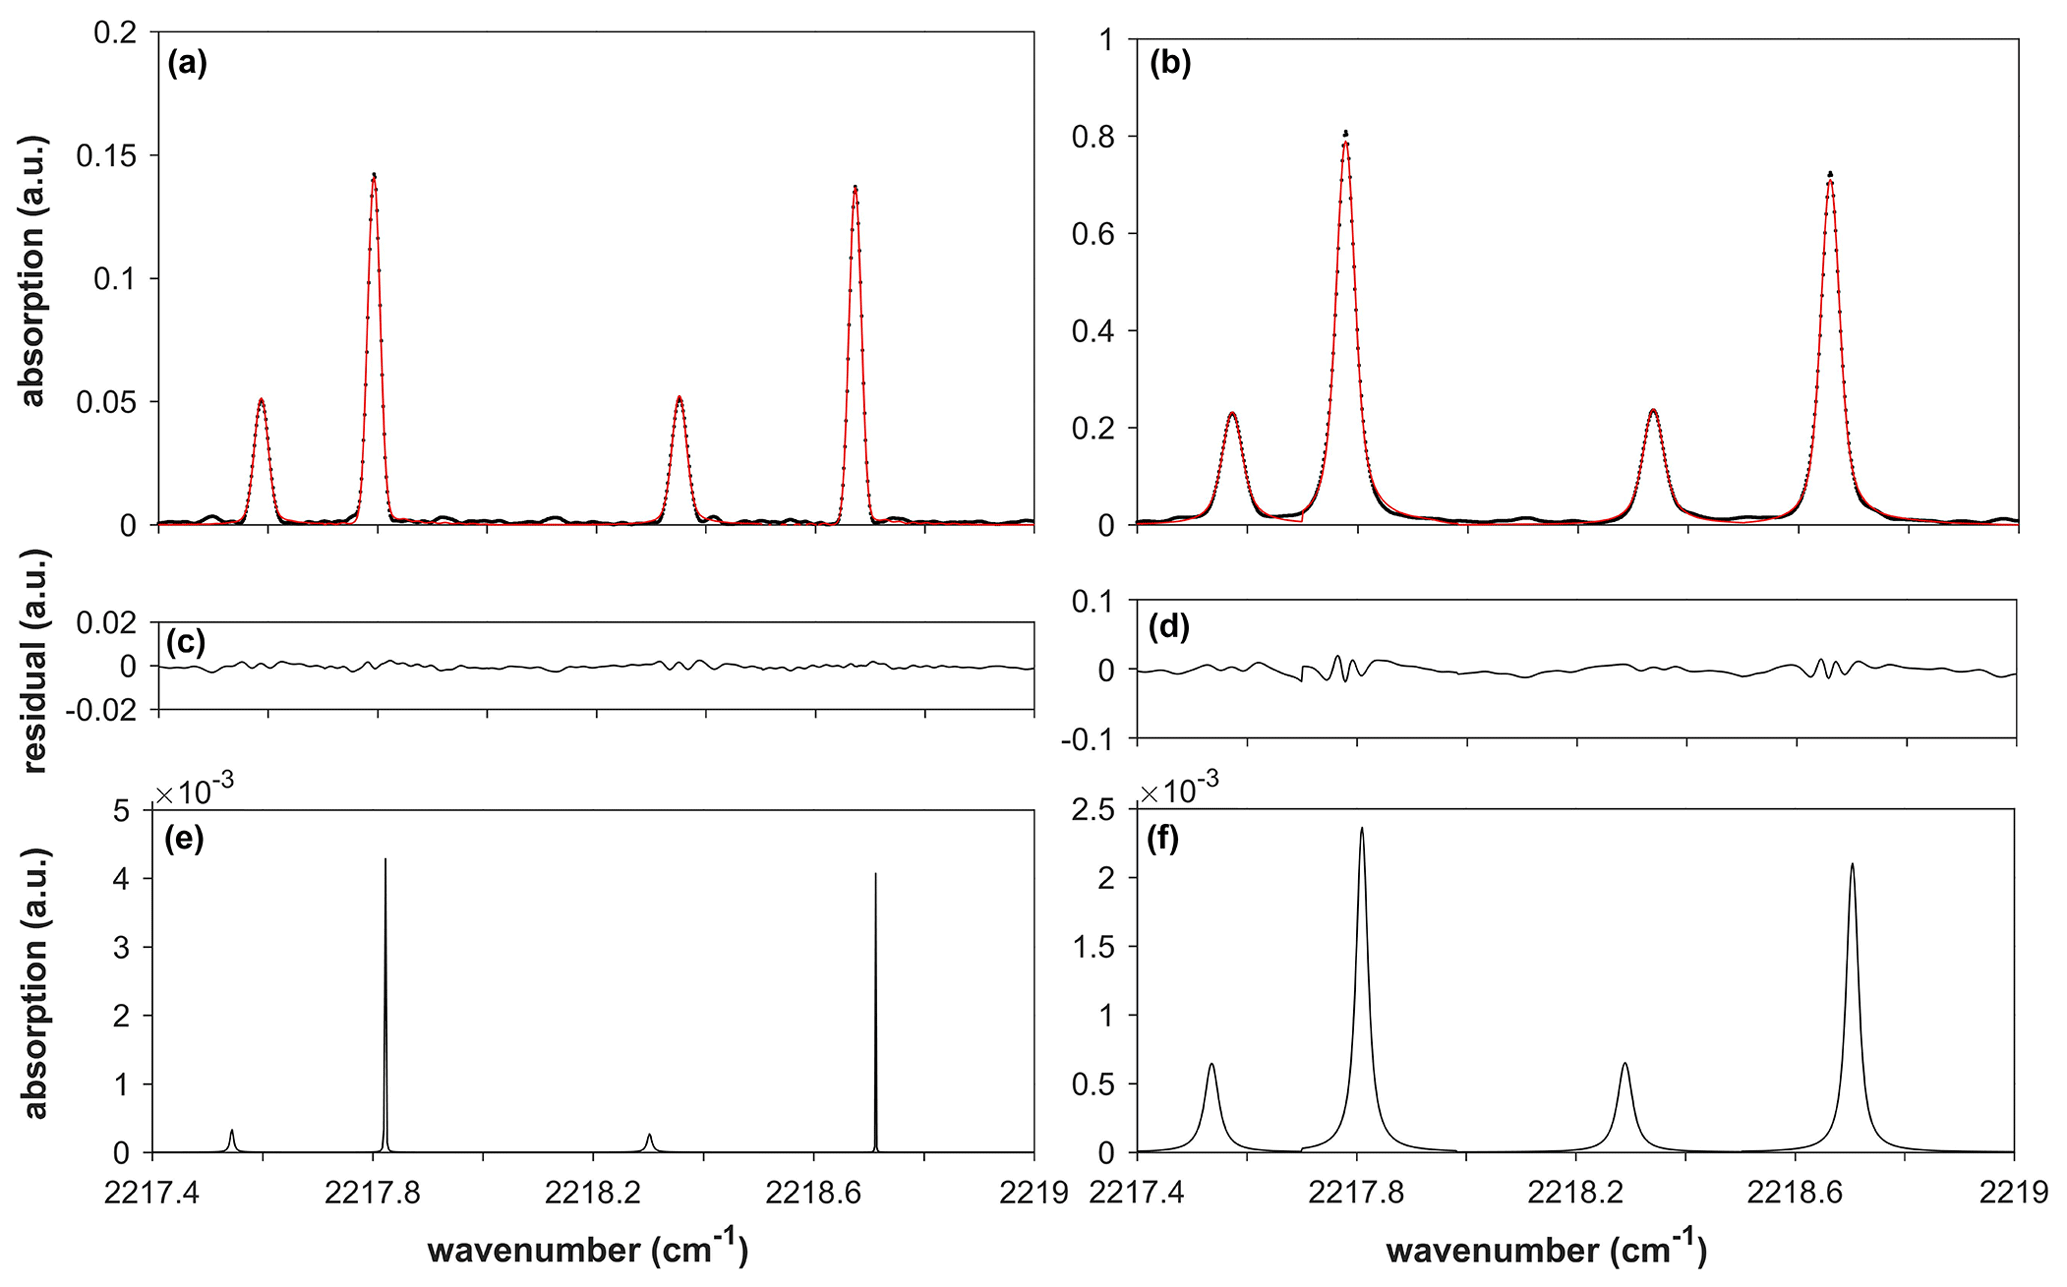
Figure 1Instrumental line shape (ILS)-convoluted Voigt fit of the measured spectrum of the reference cell (a). ILS-convoluted Voigt fit of the measured spectrum of the multipass cell (b). The residuals of each fit are shown in (c) and (d); (e) and (f) show ILS-deconvoluted spectra of the reference and multipass cells. The areas under the ILS-deconvoluted spectra are compared, and the optical path length (OPL) of the multipass cell is determined using Eq. (4). The areas for the reference and multipass cells are 2.9 × 10⁻⁵ and 2.2 × 10⁻⁴, respectively, resulting in an OPL of the multipass cell of 3.169 ± 0.079 m.
The absorption cross sections were obtained by averaging 256 spectra, measured within the wavenumber range of 500–3000 cm−1, at a spectral resolution of 2 cm−1. To obtain low absorption burdens at the nominal OPL of the multipass cell, the gases to be measured were gravimetrically diluted to a designated concentration using an N2 broadener (the typical gravimetric uncertainty is below 1.5 %). This was also required to ensure the accuracy of the pressure readings for trace levels of the absorbing gas (<0.1 Torr) using pressure gauges, the full scales of which are over 100 Torr (accuracy of 0.05 Torr) with a valid dynamic range of 5 % to 95 % (Johnson et al., 2021). The overall signal-to-noise ratios () of the absorption spectra were higher than 2000. NF3 at a pressure of 0.035 Torr was mixed with N2 to yield a total pressure of 354.97 Torr in the multipass cell. In brief, the partial pressures for SF6, CF4, PMVE, and PFMEE were 0.0057, 0.021, 0.047, and 0.039 Torr, respectively, using N2 as the broadening agent. For Novec-4710, the partial pressure was set at 0.11 Torr and broadened using CO2. The pressure gauges (INFICON, CDG025D, and MKS, 626A13TBE) were calibrated against the standards set by the Korea Research Institute of Standard and Science (KRISS). The temperature sensors (Testek, 303A and SK Sato, PC-5000TRH-II) were calibrated against a platinum resistance thermometer (Fluke-Hart Scientific, 5628) that was traceable to the NIST temperature fixed-point standards. The other instrumental parameters for the OPL calibration and absorption cross-sectional measurements are listed in Table 1.
2.2 Spectroscopic calibration method for the optical path length
Quantification of gas absorption requires Beer–Lambert parameters such as pressure, temperature, and OPL. In this study, the pressures and temperatures were measured directly. The OPL of the multipass cell was calibrated based on FTIR spectroscopy, and its uncertainty was assessed by applying the linear law of propagation of uncertainty (JCGM, 2008). The absorbance measured at high pressures exhibited a different extent of saturation according to the respective bands, disobeying the linear property of the Beer–Lambert law (Johnson et al., 2021). Therefore, it was critical to use the multipass cell at low partial pressures. However, a single pass cell is frequently used with a (sometimes mechanically determined) preassigned OPL uncertainty or only the nominal OPL value (Hurley et al., 2005; Harrison et al., 2010; Harrison, 2015, 2020; Robson et al., 2006). However, measuring the OPL of a multipass cell requires an alternative approach rather than the mechanical method used for measuring the OPL of a single-pass cell. In this regard, Nwaboh et al. (2014) demonstrated a calibration method for the OPL of a multipass cell using tunable diode laser absorption spectroscopy (TDLAS), in which the OPL and absorption are related as follows:
where xabs is amount fraction of absorber, kB is the Boltzmann constant, T is the temperature, ST is the line strength of the probed absorption line, riso is the isotope abundance of absorbing N2O, L is OPL, Pabs is the partial pressure of the absorber, and Aabs is the integrated peak area under the absorption line of the absorbing gas , where is the centre transition wavenumber. Using Eq. (1), LMP can be obtained directly by comparing the referred line strength, hereafter referred to as the direct line-strength referring method. Nwaboh et al. (2014) reported the OPL calibration result of the gas cell against a line strength of CH4 as 4987.3 cm−1 ((8.289 ± 0.414) × 10−22 cm (cm−2 molecule)), and a contribution of 95.4 % to the standard uncertainty of OPL, which led to a relative standard uncertainty of 5 %. A similar phenomenon has been reported in the calibration of gas concentrations (xabs) using cavity ring down spectroscopy (CRDS), wherein the expected value of the OPL was substituted by the direct measurement of the ring down time. Consequently, the calibration of xabs against ST in the CRDS measurements is analogous to the OPL calibration in the TDLAS measurement. The uncertainty in ST contributed to over 80 % of the standard uncertainty in xabs, which was 1.2 % of the calibrated value (Kim et al., 2001). The findings of these studies implied that the direct line-strength referring method needs to be bypassed to avoid direct use of the line strength, which in classic line databases, such as HITRAN and GEISA, exhibits a non-negligible or considerably high uncertainty. Instead, we attempted to construct a measurement traceability chain of the OPL of the multipass cell LMP to the national gauge block using the cell-to-cell comparison method. In this method, line strength acts as a mediator between the measurements of the reference and multipass cells (Nwaboh et al., 2014). The uncertainty of OPL of the reference cell LRC (0.12 %, including the measurement uncertainty using callipers) was better than that of the referred line strengths. Although experimentally determined uncertainties of the referred N2O lines in this study, (0111) ← (0110) R9e (first peak), (0001) ← (0000) P7e (second peak), (0111) ← (0110) R10e (third peak), and (0001) ← (0000) P6e (fourth peak) have not been reported (Table S3), those of N2O have typically been reported to be between 2 % and 5 % within the measurement range of 0–3000 cm−1 (Gordon et al., 2017; Pinnock and Shine, 1998). Notably, other GHGs, such as CO2 and CH4, have exhibited similar levels of uncertainty. As discussed in Sect. 3.1, the uncertainties of the referred line strengths were not required in the uncertainty evaluation process.
Table 1Instrumental setup and experimental conditions.
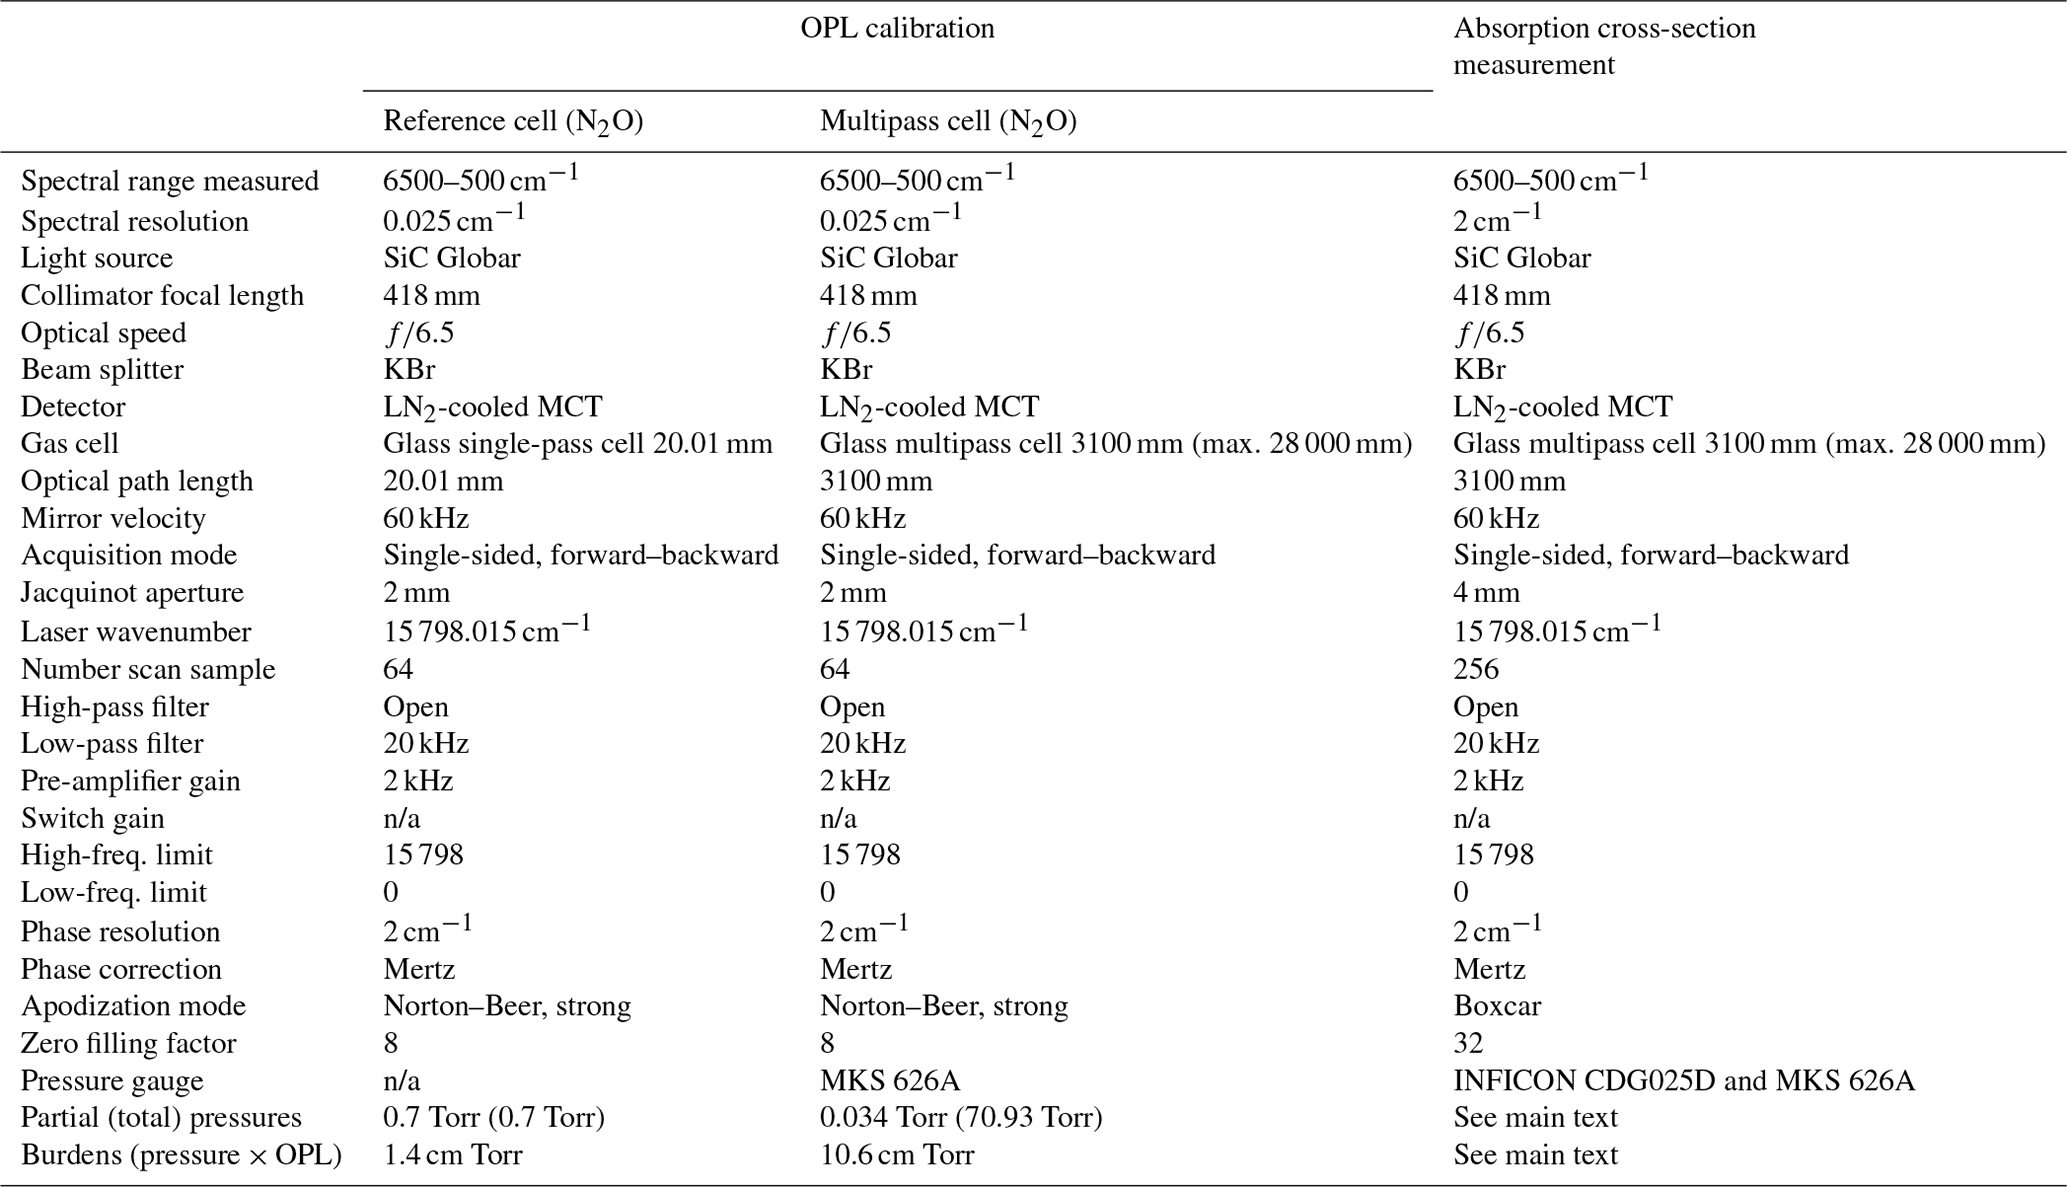
n/a: not applicable.
An optical bandpass filter at a central wavelength of 4.5 µm was used to measure the spectra obtained from the reference cell. The optical bandpass filter in front of the reference cell enabled the setting of similar radiant powers transmitted through both the multipass and reference cells, because the throughput of the multipass cell was reduced to 80 % owing to the surface ageing of the gold reflection mirrors. This ensured that the interferograms of the reference and multipass cells were obtained at the same aperture size of 2 mm and at similar levels. The identical field-of-view function (same aperture size) between multiple measurements was required to ensure identical ILSs for the comparison of the multipass and reference cell measurements (Smith et al., 2011). We assumed that no significant drift in the ILS occurred during the entire measurement process. The boxcar apodization function should yield a sharper ILS that resembles the sinc function at the set maximum optical path difference. However, the Norton–Beer strong function provides a reasonable symmetric line shape by effectively suppressing the sideband, even at a less ideal alignment status of the interferometer.
The spectral absorption was calculated as , where and are the transmitted and incident radiant powers, respectively. The measured spectral absorbance at the transition wavenumber , , can be expressed by the convolution of the pure gas absorption line and the ILS as follows:
Therefore, in FTIR spectroscopy, Aabs is the integrated area under the ILS-deconvoluted absorption line of the absorbing gas; namely, . In contrast, using TDLAS, an ILS of less than a few megahertz could be treated as a delta function, because the line widths of the well-separated absorption lines of a small molecule are typically over a few gigahertz. This aspect of laser-based measurements simplifies the procedure of OPL calibration, which is facilitated by the direct measurements of the reference and multipass cells without the retrieval of the pure gas spectra. Because the linewidth of the FTIR ILS obtained in the present study was comparable to that of the pure gas absorption line, the peak area measured using FTIR spectroscopy was substantially distorted from that of the pure gas absorption line. Mathematically, for a comparison of the integrated area, the convoluted functions of the numerator and denominator cannot be cancelled (. Based on Eq. (1), LMP was obtained by comparing the spectral absorptions of the reference and multipass cells, and it is expressed as follows:
where ST comprises the temperature-dependent prefactor (PT) and reference line strength (S0), as described in the Supplement S3. The peak areas of the pure gas spectra of the multipass and reference cells (AMP and ARC, respectively) were estimated using the trapezoidal method. The peak areas fell within the linear region of the curve-of-growth plot, ensuring the accuracy of this calibration method by securing linearity (Fig. 2). However, the uncertainty of the slope of the curve-of-growth plot must also be included in the uncertainty of AMP (S2). The partial pressure of the broadener was not a factor in determining the values of AMP and ARC.
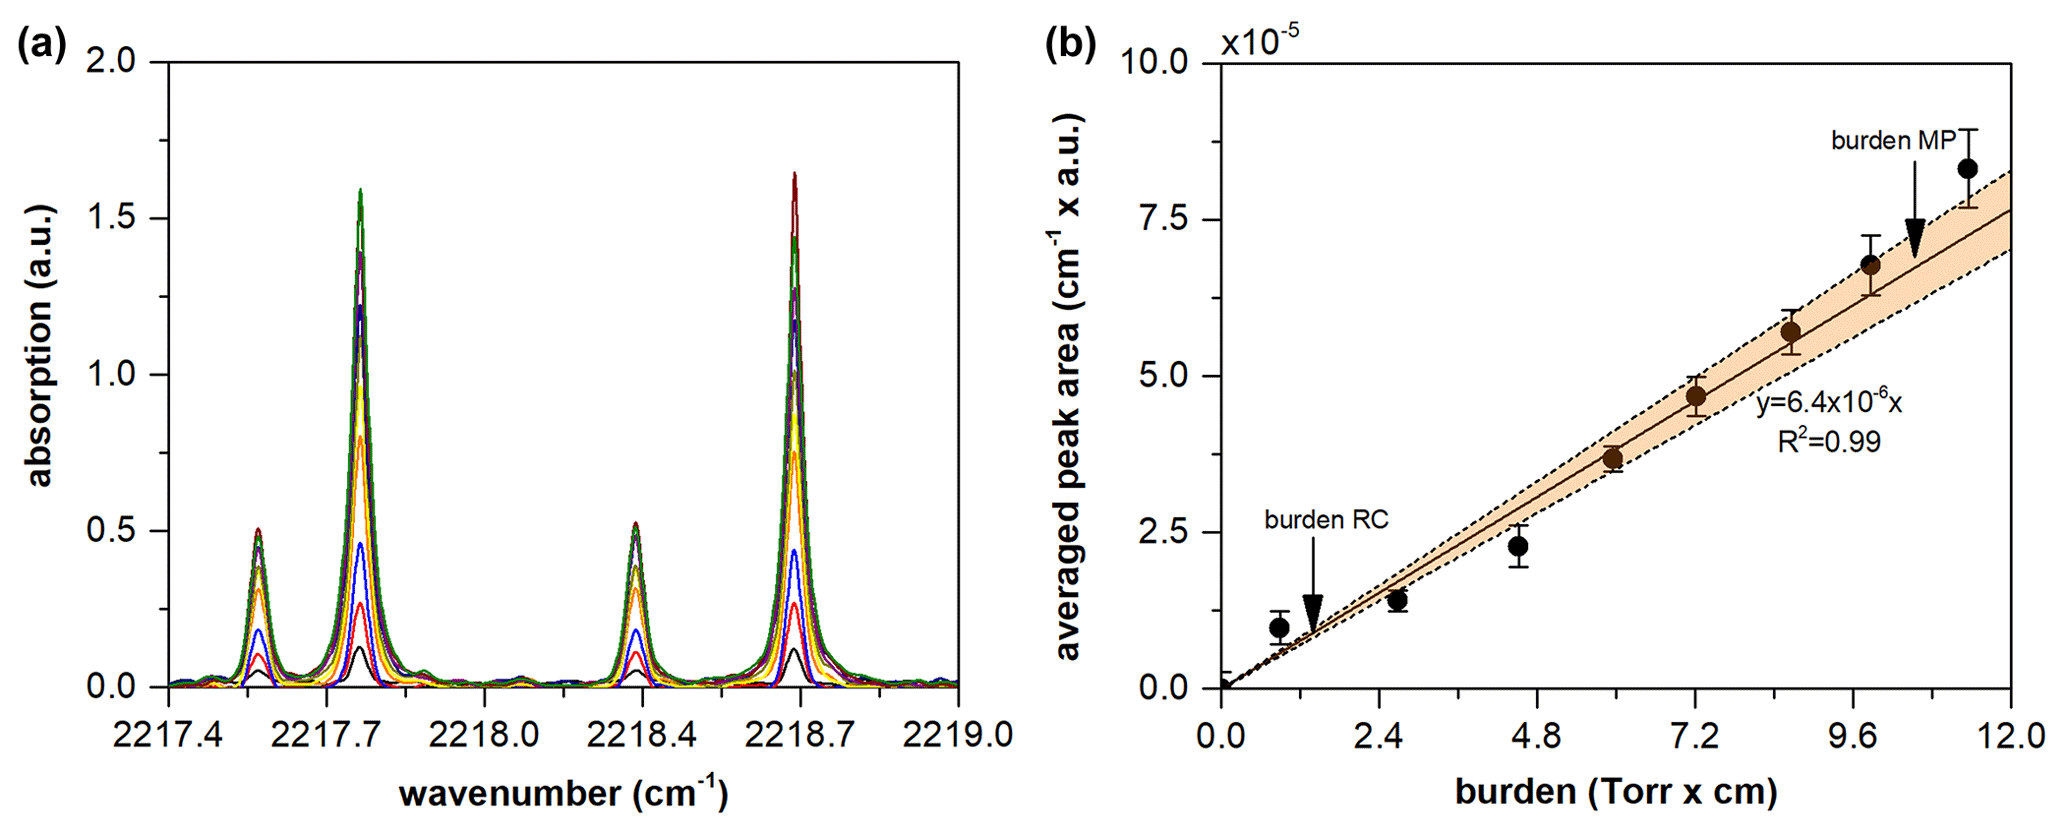
Figure 2Absorption of N2O with respect to cell pressure (a). The curve-of-growth plot for the corresponding peaks (b). Averaged peak areas after instrumental line shape (ILS) deconvolutions are shown with respect to the absorption burden (pressure × optical path length (OPL)). Without ILS deconvolution, no linearity of fit was obtained. A weighted least squares method was employed to fit the measured dataset with a straight line crossing the origin. The orange areas represent the confidence bands (at k=2) of the fitted line. The curve-of-growth analysis shows that the OPL calibration was valid for the cell-to-cell comparison method by occurring within the linear region of the curve-of-growth plot.
2.3 Estimation of radiative efficiency
Radiative efficiency is a measure of the radiative forcing for a unit change in the atmospheric concentration of a gas, and it is generally reported in W m−2 ppb−1. To obtain the radiative efficiency value, the absorption cross section of a GHG is multiplied by the radiative forcing as follows:
where RFi is the applied radiative forcing model and is the integrated absorption cross sections at the ith wavenumber block. The instantaneous radiative forcing model, which accounts for the global and annual means of the Earth's atmosphere, was proposed by Pinnock et al. (1995). The Pinnock curve is based on a 10 cm−1 narrow-band model. Hodnebrog et al. (2013) subsequently updated the Pinnock curve by increasing the spectral resolution from 10 to 1 cm−1 using the Oslo line-by-line radiative transfer code at a spectral resolution of 0.02 cm−1; hereafter referred to as the high-resolution narrow band model (hNBM). Although the Oslo line-by-line model includes an improved representation of the water vapour continuum and some changes to the representation of clouds, it is computationally expensive to introduce the necessity of a parameterized radiative forcing model such as a narrow band model (NBM, Hodnebrog et al., 2020; Shine and Myhre, 2020). In the new NBM (nNBM) proposed by Hodnebrog et al. (2020), the effect of the stratospheric temperature adjustment was added to the NBM. Notably, in the studies conducted by Hodnebrog et al. (2020), a lifetime correction for short-lived species was applied to improve the breakdown of the baseline assumption, which accounts for the well-mixed condition of a stable GHG within the atmosphere. In the present study, we applied the nNBM without a lifetime correction. σi is the integrated absorption cross section obtained at a spectral resolution of 2 cm−1 and integrated at a 10 cm−1 block interval. We did not observe any dependence of the radiative efficiency values on the spectral resolution of the absorption cross section, which tends to imply a negligible effect of the variation in the linewidth of the ILS on the value of the integrated absorption cross section. Johnson et al. (2021) demonstrated that the integrated absorption cross sections of isobutane measured at multiple resolutions between 0.01 and 4.0 cm−1 were in good agreement, thereby implying that resolution dependence did not need to be considered. This confirms that the radiative efficiency is an integrated absorption cross section that is weighted by a radiative forcing model from 0 to 3000 cm−1. Above 3000 cm−1, solar radiation is strongly reduced in the atmosphere, thus indicating that laboratory-measured absorption cross-sectional values exceeding 3000 cm−1 do not influence the radiative efficiency value (Pinnock et al., 1995). is expressed as follows (Harrison et al., 2010; Harrison, 2015, 2020):
The absorption cross section is expressed in terms of cm2 molec.−1. Owing to instrumental limitations, we did not measure absorption cross sections below 500 cm−1 in the present study, which may have introduced additional uncertainty in the radiative efficiency value for cases in which these absorption bands occur (Hodnebrog et al., 2013).
3.1 Calibration of the optical path length
Figure 2 shows the measurement results of the spectroscopic calibration of LMP. According to Eq. (3), the ratio of AMP to ARC results in LMP at a given pressure and temperature. In our study, four absorption lines from 2217.4 to 2219.0 cm−1 were simultaneously fitted to minimize the fit residuals. In this “multispectra fitting” method, each peak was modelled using the Voigt profiles with a fixed Doppler width (gD), independent Lorentzian widths (gL), and peak areas (Aabs). This is because the Doppler width depends only on the temperature and molecular weight, which are universal for every absorption line. In contrast, gL and Aabs are inherent parameters of each absorption line. In every optimization step, the retrieved ILS ILS was convoluted to the modelled pure gas spectrum , and the residuals between the measured and modelled spectra were minimized to obtain the best fit for the spectral parameters (Aabs, gL, gD). The measurement of the pressure broadening coefficient was beyond the scope of this study because the peak area was not affected by pressure broadening. Because the temperature variations in the multipass and reference cells during the experiments are independent of each other, the uncertainties in ST,RC and ST,MP should be independently determined (Supplement S3). The combined standard uncertainty in LMP was estimated based on the general law of uncertainty propagation and the derivation of Eq. (3) as follows (JCGM, 2008):
where ru is the relative uncertainty. An advantage of the cell-to-cell comparison method is indicated in Eq. (6). Because the S0 values of ST,RC and ST,MP are fully correlated (ρ=1), u(S0) is cancelled by the negative definite covariance; namely (details are provided in Supplement S2) (Nwaboh et al., 2014). This approach is identical to the uncertainty assessment method applied in isotope dilution mass spectrometry (Pagliano and Meija, 2016). To determine the uncertainty in the PT and u(PT), the thermodynamic (partition function and Boltzmann population) and quantum chemical (energy level) properties were weighted by the temperature. Details regarding the uncertainty evaluation method used for each term are described in the Supplement S2. In brief, the most sensitive sources of the OPL uncertainty were the absorption peak areas and LRC, whereas the contributions by LMP were similar to those of the other uncertainty sources, such as temperature and pressure variations. The uncertainties of the absorption peak areas could be assigned to the instrumental origin. As shown in Fig. 1, clear undulating patterns in the fit residuals imply that the ratio was sufficiently high to eliminate the white noise generated by the MCT detector. However, the undulations in the fit residuals (0.10 % for the multipass cell and 0.13 % for reference cell) were caused by the non-ideal ILS. An uneven sampling period, i.e. phase error, and transversal displacement of the retroreflector, i.e. modulation efficiency, during interferogram acquisition, both leading to a non-ideal ILS, are deemed to be critical factors affecting the fit residuals, considering that the Voigt profile fits the absorption line shape of N2O especially well in the measured wavenumber range (Loos et al., 2015; Hashemi et al., 2021). It was also noted that the uncertainty of the slope of the curve-of-growth plot, u(COGslope), was added to the uncertainty of AMP to account for the comparability between the distinct values of LMP and LRC. The u(COGslope) was found to contribute to up to 80 % of u(LMP). The slope of the curve-of-growth plot was determined using the weighted least squares method with a straight line that crosses the origin. Consequently, we obtained the values of 3.169 ± 0.079 m for LMP. The associated uncertainty budget is presented in Table S1.
3.2 Radiative efficiencies and associated uncertainties of emerging greenhouse gases
Figure 3 shows the absorption cross sections of the emitted GHGs. The uncertainty in the radiative efficiency could be evaluated based on the law of uncertainty propagation from the derivation of Eq. (5) (JCGM, 2008). Assuming that all the uncertainty components are independent, the relative uncertainty in the radiative efficiency value, ru(RE), can be estimated as follows:
where ru(LMP), ru(rd), ru(P), and ru(T) are the relative uncertainties of the LMP, responsivity drift, total pressure measurement, and temperature variability, respectively. The responsivity drift of the FTIR spectrometer occurred as a variation of the measured radiance of the light source. This drift can occur owing to various causes, such as the temporal variation in the radiant intensity of the light source and the detection sensitivity. These uncertainty components were evaluated as described in Sect. 3.1. Finally, ru(x) is the uncertainty of the amount fraction of the absorbing gas. The partial pressure of the absorber is P × x. Although the band shape generally varies depending on the temperature, the integrated absorption cross sections may remain constant within the measured temperature range, leading to (Harrison et al., 2020; Nelson et al., 2012). Therefore, the temperature terms in Eq. (5) were only dependent on the prefactor. We did not consider the uncertainty of nNBM because the values were not reported in the previous study. A hidden uncertainty source may be the lack of data for bands below 500 cm−1 in the present study. For example, the missing bands in the far infrared region may cause a systematic bias in the radiative efficiency value, as larger compounds exhibit low-frequency bending vibrations (Bravo et al., 2010).
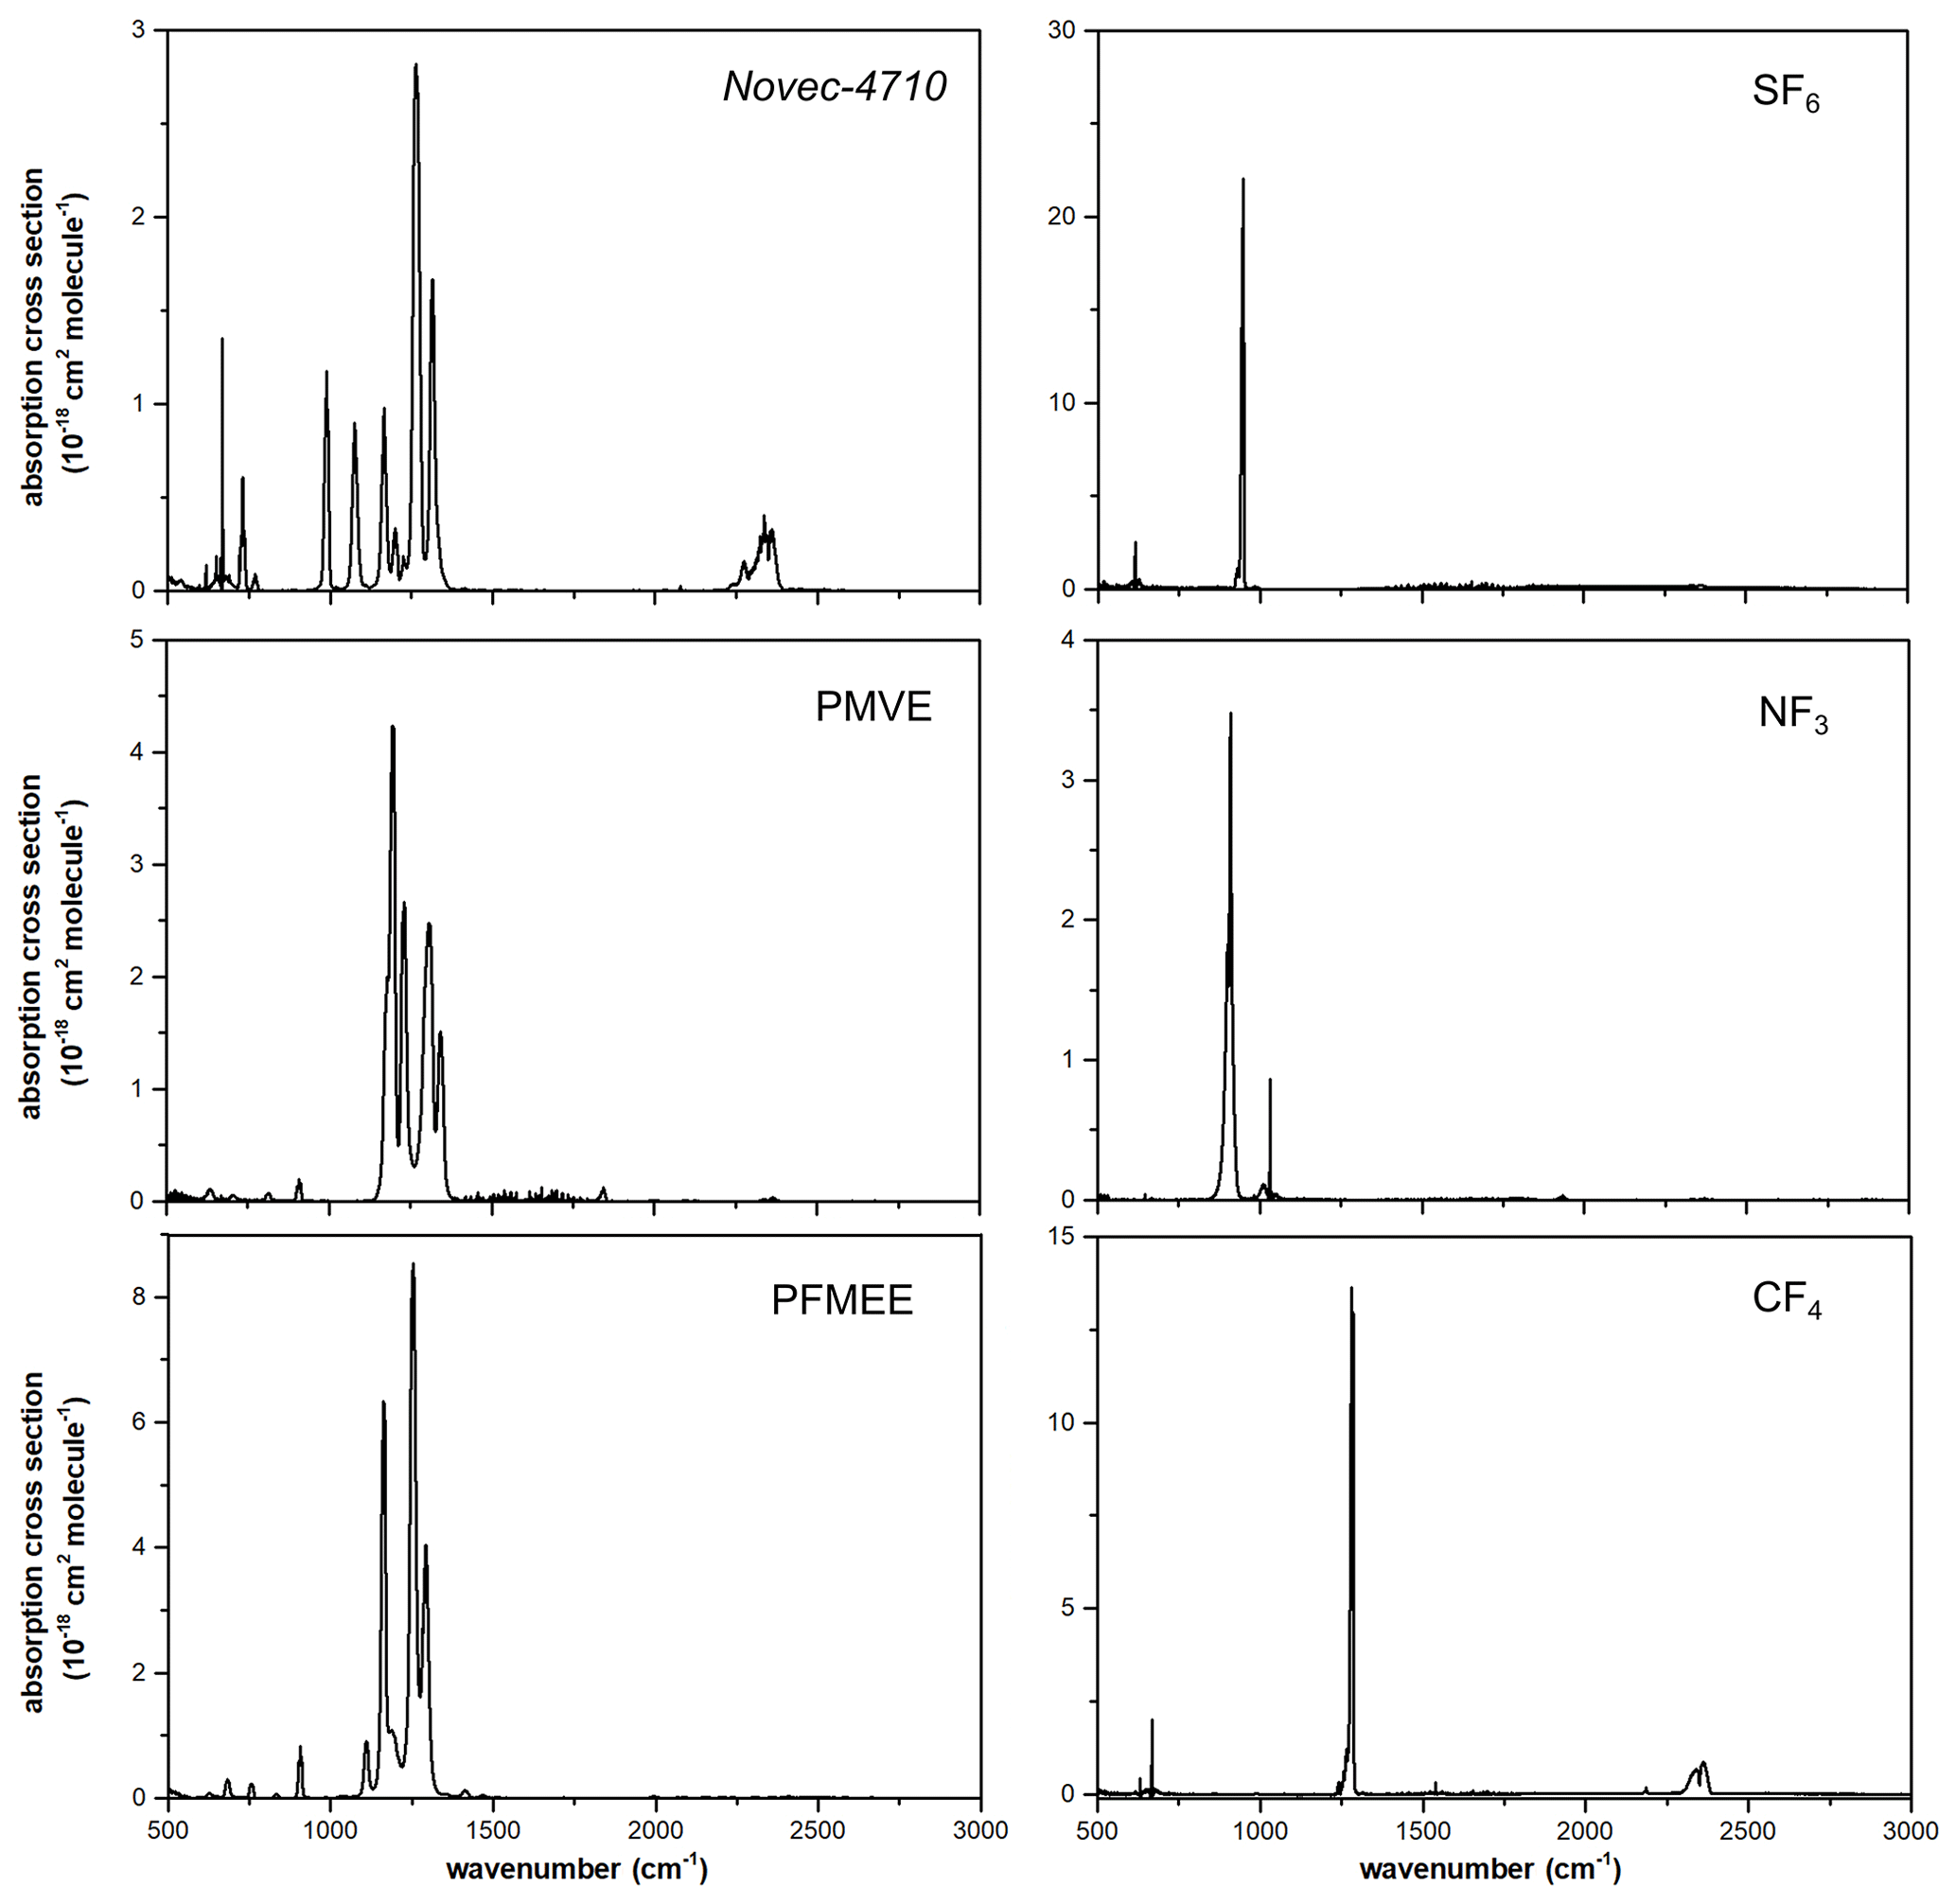
Figure 3Absorption cross-sectional measurements for estimating the radiative efficiencies of heptafluoroisobutyronitrile (Novec-4710) at 297.15 ± 1 K, perfluoro methyl vinyl ether (PMVE) at 297.15 ± 1 K, 1,1,1,2,2-pentafluoro-2-(trifluoromethoxy)ethane (PFMEE) at 295.15 ± 1 K, SF6 at 297.15 ± 1 K, NF3 at 296.15 ± 1 K, and CF4 at 296.15 ± 1 K.
3.2.1 Well-studied greenhouse gases
To validate the proposed methods in the present study, the radiative efficiencies of SF6, CF4, and NF3 were estimated and compared with those reported in the literature, with absorption burdens of 1.8, 6.6, and 11.2 cm Torr, respectively. Numerous studies have reported the radiative efficiency values of GHGs obtained using different radiative forcing models. In Hodnebrog et al. (2013), the radiative efficiency values of SF6 were found to be within the range of 0.49–0.68 W m−2 ppb−1, depending on the radiative forcing model used (with a mean value of 0.56 W m−2 ppb−1). In the same study, the authors used hNBM with the lifetime correction to obtain a radiative efficiency estimate of 0.57 W m−2 ppb−1, which is consistent with the value obtained in the present study (0.573 ± 0.02 W m−2 ppb−1) using the nNBM. In another study by Hodnebrog et al. (2020), the radiative efficiency value with the nNBM and lifetime correction was also 0.57 W m−2 ppb−1, which is consistent with that obtained in the current study. Although the value obtained in the present study was not lifetime-corrected, this consistency between studies validates our proposed method, considering that lifetime correction for long-lived GHGs is generally considered ineffective, owing to their long atmospheric lifetime (e.g. 3200 years for SF6), which facilitates a well-mixed atmospheric condition. The IPCC AR6 adopted a radiative efficiency value of 0.567 W m−2 for SF6, which is also in good agreement with the present study (Forster et al., 2021). Similar relationships were identified for NF3 and CF4, which have long lifetimes of 740 and 50 000 years, respectively (Table 2). However, the radiative efficiency value of SF6 reported by Jain et al. (2000), who used the NBM, showed a considerable decrease compared with the values of SF6, NF3, and CF4 obtained in other studies. In practice, the radiative forcing intensity in the 700–1000 cm−1 range of the NBM is decreased in comparison with that of the nNBM (Shine et al., 2020). In the same region, a strong band of SF6 spikes, which might contribute to the considerable decrease in the NBM-based radiative efficiency value of SF6. Detailed uncertainty budgets for SF6, NF3, and CF4 are presented in Tables S3, S4, and S5, respectively.
Table 2Summary of the radiative efficiency values obtained in this study and previous studies. The confidence level of uncertainty of the radiative efficiency value in this study is 95 %.
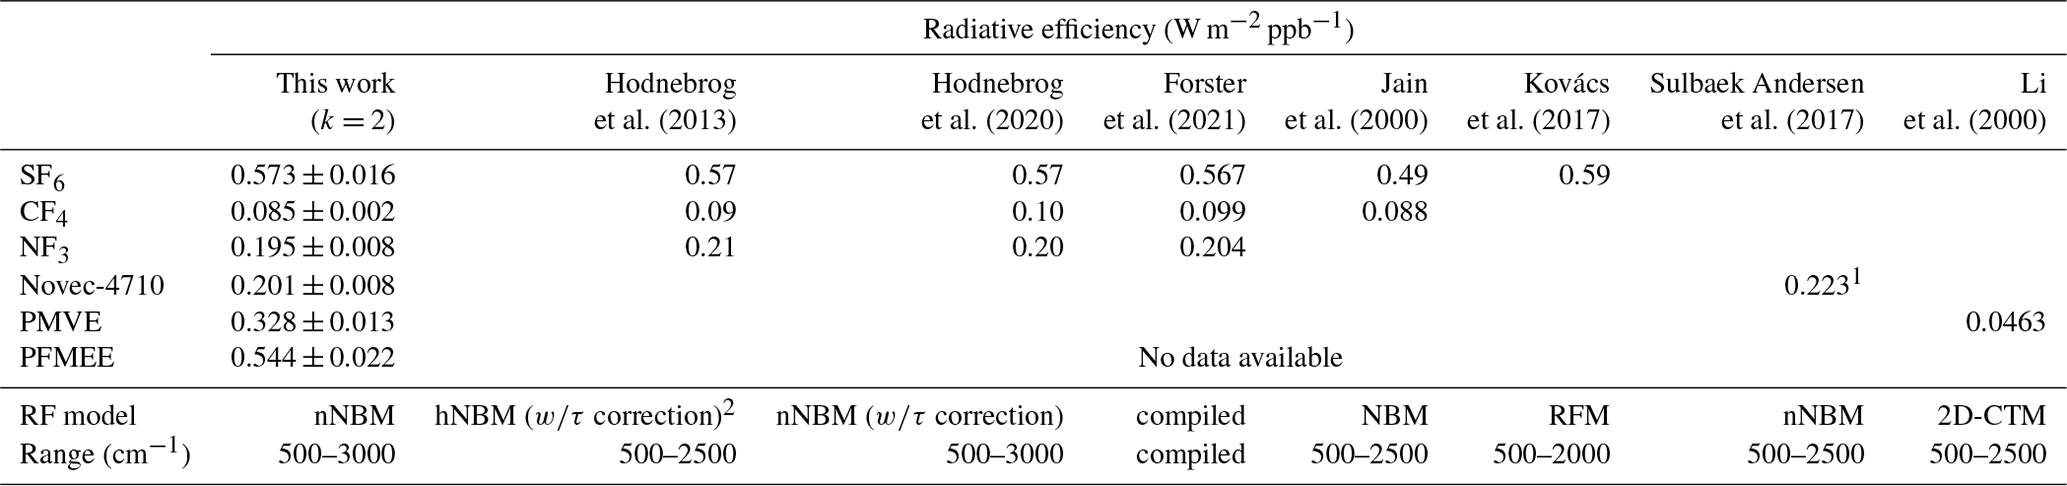
1 The final value was cited as 0.217 W m−1 ppb−1, which was lifetime-corrected. 2 The τ correction denotes a lifetime correction.
3.2.2 Novec-4710
Among the range of emerging GHGs, Novec-4710 is considered to be a sustainable replacement for strong gas insulators such as SF6. Its superior dielectric properties but low GWP make it desirable as an insulating material for eco-friendly gas-insulated switchgear (Pan et al., 2020). Novec-4710 was gravimetrically diluted with a CO2 broadener to a concentration of 39 967 µmol mol−1. In contrast to the other gases measured, CO2 was used as the broadener for Novec-4710 for practical reasons, because a Novec-4710 CO2 mixture has been used in the dielectric medium used in eco-friendly gas-insulated switchgear. Nevertheless, we assumed that the integrated absorption cross section of Novec-4710 does not differ from that obtained when using an N2 broadener. In general, the extent of alien gas broadening is considerably smaller than that of self-broadening (Johnson et al., 2021). The absorption cross section of Novec-4710 is shown in Fig. 3. The absorption burden for the absorption cross-sectional measurement of Novec-4710 was found to be 35.6 cm Torr. Our results revealed that bands in the range of 865–1355 cm−1 contributed to almost 90.8 % of the radiative efficiency value, whereas minor bands in the range of 600–785 cm−1 contributed an additional 5.1 %. Compared with the estimated radiative efficiency value of 0.217 W m−2 ppb−1 obtained previously by Sulbaek Andersen et al. (2017) using an nNBM model, we obtained a value of 0.201 ± 0.008 W m−2 ppb−1, which accordingly implies unresolved uncertainty sources. A detailed uncertainty budget for Novec-4710 is presented in Table 3.
3.2.3 Perfluoro methyl vinyl ether and 1,1,1,2,2-pentafluoro-2-(trifluoromethoxy)ethane
PMVE is used to develop novel fluoroplastics and fluorine rubber, although its climatic impacts have yet to be sufficiently assessed. PMVE was synthesized in our laboratory and broadened using N2 as a broadener. Owing to its high flammability, handling with N2 dilution was essential. The absorption burden during the absorption cross-sectional measurement of PMVE was estimated to be 14.8 cm Torr. Li et al. (2000) reported that the radiative efficiency value of PMVE was 0.0499 W m−2 ppb−1 using a two-dimensional chemical transport model (2D-CTM) that evaluated a change in the radiative forcing due to a change in the concentration derived by a modelled vertical decaying profile. The radiative efficiency value of PMVE estimated with chemical transport models showed a noticeable underestimation compared with the present study. The absorption cross section of PMVE obtained in the present study was found to be 1.5 times greater at the strongest band compared with that reported by Li et al. (2000), whereas our estimated radiative efficiency value of 0.328 W m−2 ppb−1 is 6.8-fold larger than that estimated by Li et al. (2000), confirming the underestimation tendency of the 2D-CTM. The significant contribution of radiative forcing to PMVE is from the bands within 1135–1365 cm−1 (93.1 %). An uncertainty budget for PMVE is presented in Table S6.
PFMEE is a prospective substitute for chlorofluorocarbons, and the absorption burden during the absorption cross-sectional measurement was estimated to be 12.4 cm Torr. PFMEE was synthesized in our laboratory and broadened using N2 as a broadener. Our findings reveal that bands in the range of 1035–1325 cm−1 contributed almost 91.8 % to the radiative efficiency value, and the minor bands at 615–925 cm−1 contributed 7.1 % to the radiative efficiency value. To the best of our knowledge, the radiative efficiency value of PFMEE, which we estimated to be 0.544 ± 0.022 W m−2 ppb−1, is reported for the first time. Although the overall band shapes of PMVE and PFMEE do not appear to be similarly weighted by the radiative forcing model, the absorption cross-sectional intensities of PFMEE at 1000–1500 cm−1 were found to be 2-fold higher than those of PMVE, accordingly yielding 2-fold higher radiative efficiency values. This difference can be attributed to the C = C bonds of PFMEE, which strengthen the structural rigidity and enhance the Franck–Condon overlap integral. The uncertainty budget for PFMEE is presented in Table S7.
Table 3Uncertainty budget for radiative efficiency of Novec-4710 (representative example; others are presented in the Supplement).
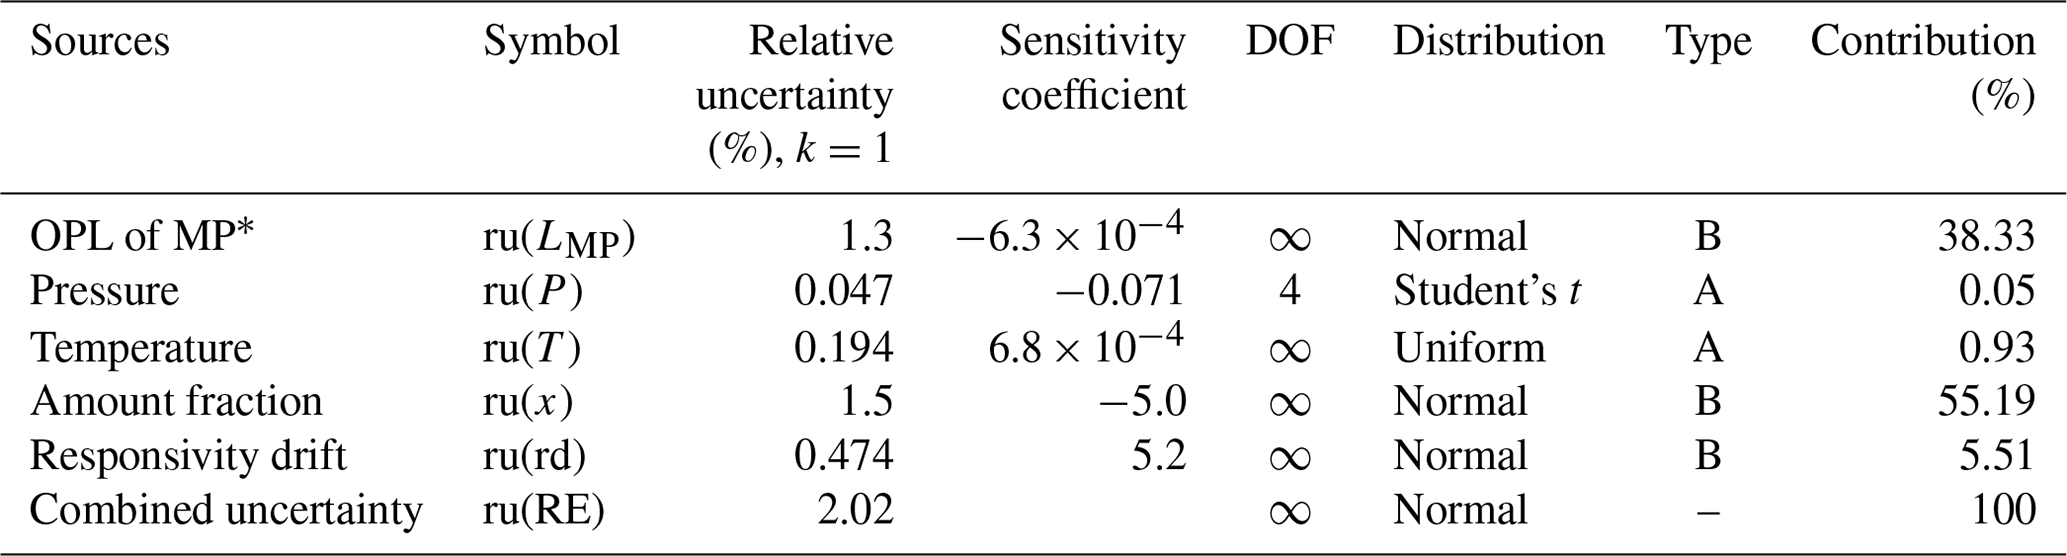
* A detailed budget is provided in the supporting information.
In this study, a radiative efficiency value for PFMEE, an emerging GHG, is reported for the first time. Additionally, we re-evaluated the RE values of NF3, SF6, Novec-4710, CF4, and PMVE. Moreover, the utility of a metrology-level measurement of absorption cross section, performed in conjunction with a direct calibration of LMP mounted in the HR-FTIR spectrometer, is demonstrated for the first time. The radiative efficiency values of the well-studied GHGs obtained in this study are consistent with those reported in previous studies, thereby demonstrating the validity of the proposed method. Although the use of different radiative forcing models can introduce subtle deviations in the radiative efficiency values, the proposed method contributes to reducing the uncertainty of radiative efficiency value. The present study establishes measurement traceability to the primary standards for the Beer–Lambert parameters of temperature, pressure, and OPL, which ensure the reliability of the reported radiative efficiency values. The cell-to-cell comparison method exhibited a 2.5 % uncertainty (at 95 % confidence level) for the spectroscopic calibration of the OPL, which contributes approximately 35 % to the standard uncertainty of radiative efficiency value. Notably, the dead length within a multipass cell is often missed in the product specification, thereby resulting in a systematic error in the evaluation of the OPL (Nwaboh et al., 2014). The cell-to-cell comparison was unaffected by the ST of the referred lines but was sensitive to LRC. Meanwhile, a highly accurate ST enables the reduction in the u(LMP) with a combination of the direct line-strength referring method, which does not require a curve-of-growth analysis. Metrological spectroscopic measurements, such as frequency-stabilized cavity ring down spectroscopy, are a potent tool for establishing line strength with high accuracy (Fleisher et al., 2019).
Another consideration is the significance of the partial pressure of the absorbing gas. As shown in Table 3, the uncertainty in the amount fraction (partial pressure × concentration) contributes approximately 50 % to the standard uncertainty of the radiative efficiency value. Because low-pressure measurements of the absorption cross section are required to ensure that no systematic errors arise from the saturation effect, using a multipass cell and a pressure broadener is essential. As typical pressure sensors are valid within a dynamic range of 5 % to 95 %, the pressure added by a broadening agent enhances the accuracy of the pressure reading. However, further improvements in the dilution uncertainty can be achieved by using metrology-level gravimetry (Rhoderick et al., 2014).
One of the uncertainty sources that we were able to control is the responsivity drift of the FTIR spectrometer, which corresponded to a 5 % contribution to the standard uncertainty of the radiative efficiency value. In the quality assurance/quality control process, a high sensitivity coefficient implies that the corresponding measurement parameter should be carefully controlled to improve the measurement quality. Although the sensitivity coefficients of the responsivity drift were 104-fold higher than those of OPL calibration, our measurements restricted the corresponding uncertainty well. However, the responsivity drift can be improved by bracketing the Φ0 and Φ measurements.
New GHG substituents and their relevant applications are expected to be actively developed in the coming years, reflecting the continuing drive to replace potent GHGs (e.g. NF3, SF6, and CF4). However, these may have short atmospheric lifetimes, and thus high chemical activity. Such compounds should therefore be handled with care by diluting them using inert gases. Therefore, we believe that the method proposed herein will be beneficial for improving the laboratory measurement procedures for determining radiative efficiency. In future studies, we intend to extend the measuring window into the far infrared range, in which absorption bands contribute approximately 3 % to the total radiative forcing uncertainty (Hodnebrog et al., 2020).
Data are available at Zenodo at https://doi.org/10.5281/zenodo.7132870 (Beni, 2022).
The supplement related to this article is available online at: https://doi.org/10.5194/acp-23-4489-2023-supplement.
Study design: JSL and JL. Methodology establishment: JSL and BAT. Measurements: BAT. Gas synthesis and preparation: IP. Data analysis and uncertainty evaluation: BAT. Supervision: JSL and JL. Validation: JSL, JL, and SP. Writing – original draft: JSL and BAT. Writing – review and editing: JSL and BAT. Funding acquisition: JSL and JL.
The contact author has declared that none of the authors has any competing interests.
Publisher’s note: Copernicus Publications remains neutral with regard to jurisdictional claims in published maps and institutional affiliations.
We thank Chu-Shik Kang for providing traceability to the reference cell length measurements. Beni Adi Trisna is grateful to Sangwoo Kim and Yera Kim for their fruitful discussions.
This work was funded by KRISS as a part of a project for establishing measurement standards for climate monitoring based on molecular spectroscopy (grant no. 23011081). This work was also supported by the Ministry of Trade, Industry & Energy (MOTIE) of Korea under projects of laser-based radical measurement system for prediction of atmospheric lifetimes of semiconductor GHGs (grant no. 20019435) and GWP 1000 or less chamber cleaning gas and its remote plasma system for low GWP gas (grant no. RS-2022-00155753).
This paper was edited by Eliza Harris and reviewed by Tim Wallington and one anonymous referee.
Allen, M. R., Shine, K. P., Fuglestvedt, J. S., Millar, R. J., Cain, M., Frame, D. J., and Macey, A. H.: A solution to the misrepresentations of CO2-equivalent emissions of short-lived climate pollutants under ambitious mitigation, NPJ Clim. Atmos. Sci., 1, 1–8, https://doi.org/10.1038/s41612-018-0026-8, 2018.
Beni, A. T., Park, S., Park, I., Lee, J., and Lim, J. S.: Measurement report: Radiative efficiency estimates of (CF3)2CFCN, CF3OCFCF2, and CF3OCF2CF3 using high-resolution Fourier transform infrared spectroscopy, Zenodo [data set], https://doi.org/10.5281/zenodo.7132870, 2022.
Bravo, I., Aranda, A., Hurley, M. D., Marston, G., Nutt, D. R., Shine, K. P., Smith, K., and Wallington, T. J.: Infrared absorption spectra, radiative efficiencies, and global warming potentials of perfluorocarbons: Comparison between experiment and theory, J. Geophys. Res.-Atmos., 115, D24317, https://doi.org/10.1029/2010JD014771, 2010.
Denison, S., Forster, P. M., and Smith, C. J.: Guidance on emissions metrics for nationally determined contributions under the Paris Agreement, Environ. Res. Lett., 14, 124002, https://doi.org/10.1088/1748-9326/ab4df4, 2019.
Fleisher, A. J., Adkins, E. M., Reed, Z. D., Yi, H., Long, D. A., Fleurbaey, H. M., and Hodges, J. T.: Twenty-five-fold reduction in measurement uncertainty for a molecular line intensity, Phys. Rev. Lett., 123, 043001, https://doi.org/10.1103/PhysRevLett.123.043001, 2019.
Forster, P., Storelvmo, T., Alterskjæ, K., et al.: IPCC sixth assessment report (AR6) working group 1: the physical science basis, chap. 7, University Press, UK, https://www.ipcc.ch/report/ar6/wg1/downloads (last access: 25 August 2022), 2021.
Gordon, I. E., Rothman, L. S., Hill, C., Kochanov, R. V., Tan, Y., Bernath, P. F., Birk, M., Boudon, V., Campargue, A., and Chance, K.: The HITRAN2016 molecular spectroscopic database, J. Quant. Spectrosc. Ra., 203, 3–69, https://doi.org/10.1016/j.jqsrt.2017.06.038, 2017.
Harrison, J. J., Allen, N. D., and Bernath, P. F.: Infrared absorption cross sections for ethane (C2H6) in the 3 µm region, J. Quant. Spectrosc. Ra., 111, 357–363, https://doi.org/10.1016/j.jqsrt.2009.09.010, 2010.
Harrison, J. J.: Infrared absorption cross sections for 1,1,1,2-tetrafluoroethane, J. Quant. Spectrosc. Ra., 151, 210–216, https://doi.org/10.1016/j.jqsrt.2014.09.023, 2015.
Harrison, J. J.: New infrared absorption cross sections for the infrared limb sounding of sulfur hexafluoride (SF6), J. Quant. Spectrosc. Ra., 254, 107202, https://doi.org/10.1016/j.jqsrt.2020.107202, 2020.
Hase, F., Blumenstock, T., and Paton-Walsh, C.: Analysis of the instrumental line shape of high-resolution Fourier transform IR spectrometers with gas cell measurements and new retrieval software, Appl. Optics, 38, 3417–3422, https://doi.org/10.1364/AO.38.003417, 1999.
Hashemi, R., Gordon, I. E., Adkins, E. M., Hodges, J. T., Long, D. A., Birk, M., Loos, J., Boone, C. D., Fleisher, A. J., Predoi-Cross, A., and Rothman, L. S.: Improvement of the spectroscopic parameters of the air- and self-broadened NO and CO lines for the HITRAN2020 database applications, J. Quant. Spectrosc. Ra., 271, 107735, https://doi.org/10.1016/j.jqsrt.2021.107735, 2021.
Hodnebrog, Ø., Etminan, M., Fuglestvedt, J. S., Marston, G., Myhre, G., Nielsen, C. J., Shine, K. P., and Wallington, T. J.: Global warming potentials and radiative efficiencies of halocarbons and related compounds: A comprehensive review, Rev. Geophys., 51, 300-378, https://doi.org/10.1002/rog.20013, 2013.
Hodnebrog, Ø., Aamaas, B., Fuglestvedt, J. S., Marston, G., Myhre, G., Nielsen, C. J., Sandstad, M., Shine, K. P., and Wallington, T. J.: Updated global warming potentials and radiative efficiencies of halocarbons and other weak atmospheric absorbers, Rev. Geophys., 58, e2019RG000691, https://doi.org/10.1029/2019RG000691, 2020.
Hurley, M., Wallington, T., Buchanan, G., Gohar, L., Marston, G., and Shine, K.: IR spectrum and radiative forcing of CF4 revisited, J. Geophys. Res.-Atmos., 110, D02102, https://doi.org/10.1029/2004JD005201, 2005.
Jain, A. K., Briegleb, B. P., Minschwaner, K., and Wuebbles, D. J.: Radiative forcings and global warming potentials of 39 greenhouse gases, J. Geophys. Res.-Atmos., 105, 20773–20790, https://doi.org/10.1029/2000JD900241, 2000.
JCGM: Evaluation of measurement data – guide for the expression of uncertainty in measurement, Joint Committee for Guides in Metrology (JCGM/WG1), BIPM, France, https://www.bipm.org/documents/20126/2071204/JCGM_100_2008_E.pdf/cb0ef43f-baa5-11cf-3f85-4dcd86f77bd6 (last access: 25 August 2022), 2008.
Johnson, T. J., Hughey, K. D., Blake, T. A., Sharpe, S. W., Myers, T. L., and Sams, R. L.: Confirmation of PNNL quantitative infrared cross-sections for isobutane, J. Phys. Chem. A, 125, 3793–3801, https://doi.org/10.1021/acs.jpca.1c01933, 2021.
Kim, J. W., Yoo, Y. S., Lee, J. Y., Lee, J. B., and Hahn, J. W.: Uncertainty analysis of absolute concentration measurement with continuous-wave cavity ringdown spectroscopy, Appl. Optics, 40, 5509–5516, https://doi.org/10.1364/AO.40.005509, 2001.
Kim, J. and Lee, J.: Estimation of the global warming potential of fluorinated green house gases, J. Korean Soc. Atmos. Environ., 30, 387-397, https://doi.org/10.5572/KOSAE.2014.30.4.387, 2014.
Kovács, T., Feng, W., Totterdill, A., Plane, J., Dhomse, S., Gómez-Martín, J. C., Stiller, G. P., Haenel, F. J., Smith, C., and Forster, P. M.: Determination of the atmospheric lifetime and global warming potential of sulfur hexafluoride using a three-dimensional model, Atmos. Chem. Phys., 17, 883–898, https://doi.org/10.5194/acp-17-883-2017, 2017.
Laruelle, E., Kieffel, Y., and Ficheux, A.: In international conference on eco-design in electrical engineering, Springer, 139–146, https://link.springer.com/book/10.1007/978-3-319-58172-9 (last access: 25 August 2022), 2017.
Li, Z., Tao, Z., Naik, V., Good, D. A., Hansen, J. C., Jeong, G. R., Francisco, J. S., Jain, A. K., and Wuebbles, D. J.: Radiative forcings and global warming potentials of 39 greenhouse gases, J. Geophys. Res.-Atmos., 105, 4019-4029, https://doi.org/10.1029/2000JD900241, 2000.
Loos, J., Birk, M., and Wagner, G.: Pressure broadening, -shift, speed dependence and line mixing in the ν3 rovibrational band of N2O, J. Quant. Spectrosc. Ra., 151, 300–309, https://doi.org/10.1016/j.jqsrt.2014.10.008, 2015.
Lynch, J., Cain, M., Pierrehumbert, R., and Allen, M.: Demonstrating GWP*: a means of reporting warming-equivalent emissions that captures the contrasting impacts of short- and long-lived climate pollutants, Environ. Res. Lett., 15, 044023, https://doi.org/10.1088/1748-9326/ab6d7e, 2020.
Nelson, C. T., Overzet, L. J., and Goeckner, M. J.: Temperature dependence of the infrared absorption cross-sections of neutral species commonly found in fluorocarbon plasmas, J. Vac. Sci. Technol. A, 30, 021305, https://doi.org/10.1116/1.3679408, 2012.
Nwaboh, J. A., Witzel, O., Pogány, A., Werhahn, O., and Ebert, V.: Optical path length calibration: a standard approach for use in absorption cell-based IR-spectrometric gas analysis, Int. J. Spectrosc., 2014, 132607, https://doi.org/10.1155/2014/132607, 2014.
Pagliano, E. and Meija, J.: Reducing the matrix effects in chemical analysis: fusion of isotope dilution and standard addition methods, Metrologia, 53, 829–834, https://doi.org/10.1088/0026-1394/53/2/829, 2016.
Pan, B., Wang, G., Shi, H., Shen, J., Ji, H.-K., and Kil, G.-S.: Green gas for grid as an eco-friendly alternative insulation gas to SF6: a review, Appl. Sci., 10, 2526, https://doi.org/10.3390/app10072526, 2020.
Pinnock, S. and Shine, K. P.: The effects of changes in HITRAN and uncertainties in the spectroscopy on infrared irradiance calculations, J. Atmos. Sci., 55, 1950–1964, https://doi.org/10.1175/1520-0469(1998)055<1950:TEOCIH>2.0.CO;2, 1998.
Pinnock, S., Hurley, M. D., Shine, K. P., Wallington, T. J., and Smyth, T.: Radiative forcing of climate by hydrochlorofluorocarbons and hydrofluorocarbons, J. Geophys. Res.-Atmos., 100, 23227–23238, https://doi.org/10.1029/95JD02323, 1995.
Rhoderick, G., Guenther, F., Duewer, D., Lee, J., Moon, D., Lee, J., Lim, J. S., and Kim, J. S.: Final report on international comparison CCQM-K83: Halocarbons in dry whole air, Metrologia, 51, 08009, https://doi.org/10.1088/0026-1394/51/1A/08009, 2014.
Robson, J., Gohar, L., Hurley, M., Shine, K., and Wallington, T.: Revised IR spectrum, radiative efficiency and global warming potential of nitrogen trifluoride, Geophys. Res. Lett., 33, L10817, https://doi.org/10.1029/2006GL026210, 2006.
Rosenzweig, C., Ruane, A. C., Antle, J., Elliott, J., Ashfaq, M., Chatta, A. A., Ewert, F., Folberth, C., Hathie, I., and Havlik, P.: Coordinating AgMIP data and models across global and regional scales for 1.5 ∘C and 2.0 ∘C assessments, Philos. T. R. Soc. A, 376, 20160455, https://doi.org/10.1098/rsta.2016.0455, 2018.
Shine, K. P. and Myhre, G.: The spectral nature of stratospheric temperature adjustment and its application to halocarbon radiative forcing, J. Adv. Model. Ea. Sy., 12, e2019MS001951, https://doi.org/10.1029/2019MS001951, 2020.
Sixth Assessment Report (AR6): Climate Change 2021: The Physical Science Basis; The Intergovernmental Panel on Climate Change (IPCC)-WGI: Cambridge University Press, UK, https://www.ipcc.ch/report/ar6/wg1/downloads (last access: 25 August 2022), 2021.
Smith, T., Wooster, M., Tattaris, M., and Griffith, D.: Absolute accuracy and sensitivity analysis of OP-FTIR retrievals of CO2, CH4 and CO over concentrations representative of “clean air” and “polluted plumes”, Atmos. Meas. Tech., 4, 97–116, https://doi.org/10.5194/amt-4-97-2011, 2011.
Sulbaek Andersen, M. P., Kyte, M., Andersen, S. T., Nielsen, C. J., and Nielsen, O. J.: Atmospheric chemistry of (CF3)2CF–C ≡ N: a replacement compound for the most potent industrial greenhouse gas, SF6, Environ. Sci. Technol., 51, 1321–1329, https://doi.org/10.1021/acs.est.6b03758, 2017.
Sulbaek Andersen, M. P., Nielsen, O. J., and Sherman J. D.: The global warming potentials for anesthetic gas sevoflurane need significant corrections, Environ. Sci. Technol., 55, 10189–10191, https://doi.org/10.1021/acs.est.1c02573, 2021.
UNFCCC secretariat: Report of the conference of the parties on its twenty-first session, part two: action taken by the conference of the parties at its twenty-first session, United Nations Framework Convention on Climate Change (UNFCCC), UN, NYC, https://unfccc.int/process-and-meetings/conferences/past-conferences/paris-climate-change-conference-november-2015/cop-21/cop-21-reports (last access: 25 August 2022), 2015.
Zhao, M., Han, D., Zhou, Z., and Zhang, G.: Experimental and theoretical analysis on decomposition and by-product formation process of (CF3)2CFCN mixture, AIP Adv., 9, 105204, https://doi.org/10.1063/1.5116211, 2019.