the Creative Commons Attribution 4.0 License.
the Creative Commons Attribution 4.0 License.
 | 14 Apr 2023
Parameterization of downward long-wave radiation based on long-term baseline surface radiation measurements in China
Junli Yang
Jianglin Hu
Qiying Chen
Downward long-wave radiation (DLR) affects energy exchange between the land surface and the atmosphere and plays an important role in weather forecasting, agricultural activities, and the development of climate models. Because DLR is seldom observed at conventional radiation stations, numerous empirical parameterizations have been presented to estimate DLR from screen-level meteorological variables. The reliability and representativeness of parameterization depend on the coefficients regressed from the simultaneous observations of DLR and meteorological variables. Only a few previous studies have attempted to build parameterizations over regions in China such as the Tibetan Plateau and East China. In this study, a long-term (2011–2022) hourly dataset of DLR and meteorological elements, obtained from seven stations of the China Baseline Surface Radiation Network, was used to recalculate the coefficients of the Brunt and Weng models and to develop a new model. Results showed that the mean bias error (MBE) and relative MBE (rMBE) between the measured clear-sky DLR and that estimated using the Brunt, Weng, and new models were −4.3, −5.1, and 3.7 W m−2 and −1.5 %, −1.8 %, and 1.3 %, respectively. The root mean square errors (RMSEs) were in the range of 13.8–14.3 W m−2, and the relative RMSEs (rRMSEs) were approximately 5.0 %. The MBEs (rMBEs) of the Brunt, Weng, and new models under all-sky conditions were −2.8 W m−2 (−1.0 %), −6.1 W m−2 (−2.1 %), and −1.5 W m−2 (−0.5 %), respectively. The RMSE (rRMSE) of the parameterization models in retrieving all-sky DLR was ∼ 17.5 W m−2 (∼ 6.1 %). Therefore, the models are considered suitable for retrieval of DLR over China.
- Article
(5042 KB) - Full-text XML
- BibTeX
- EndNote


Downward long-wave radiation (DLR) on the ground is one of the fluxes involved in the exchange of energy between Earth's surface and the atmosphere (e.g. Idso and Jackson, 1969; Konzelmann et al., 1994; Gabathuler et al., 2001; Sridhar and Elliot, 2002). Consequently, DLR plays a vital role in weather forecasting, agricultural production (e.g. prediction of frost and crop temperature), climate simulations, and water cycle modelling (e.g. Crawford and Duchon, 1999; Wild and Cechet, 2002; Bilbao and De Miguel, 2007; Li et al., 2017).
In comparison with other radiation components, DLR is seldom observed at conventional radiation stations (e.g. Iziomon et al., 2003; Stephens et al., 2012). Therefore, considerable effort has been made to develop simple parameterization methods to calculate DLR from easily measured meteorological variables (Duarte et al., 2006). As identified by Ångström (1915), clear-sky DLR can be determined from the emissivity and effective temperature of the atmosphere. Under clear-sky conditions, as much as 60 % (90 %) of atmospheric emission is derived from the atmosphere within the first 100 m (1 km). When the sky is overcast, more than 90 % originates from within the first 1 km between the ground and the bottom of the cloud (Ohmura, 2001). Following the pioneering work of Ångström, numerous investigators have presented empirical relationships between effective atmospheric emissivity (hereafter referred to as emissivity) under clear-sky conditions and vapour pressure (e) (e.g. Brunt, 1932; Weng et al., 1993; Niemelä et al., 2001). Nevertheless, for a limited isothermal atmosphere emissivity would be less than unity and independent of temperature only if the atmosphere were of a constant greyness. In the real atmosphere, emissivity must, in principle, be temperature (Ta)-dependent (e.g. Swinbank, 1963; Idso and Jackson, 1969). Moreover, some investigators even pointed out that the empirical emissivity depends on the dew point temperature (Td) (e.g. Berdahl and Fromberg, 1982), e and Ta (e.g. Brutsaert, 1975; Satterlund, 1979; Idso, 1981; Iziomon et al., 2003), relative humidity (φ) and Ta (e.g. Carmona et al., 2014), or even the total amount of water vapour (e.g. Ruckstuhl et al., 2007). Under all-sky conditions, the presence of clouds can increase emissivity and atmospheric radiation. Clouds generally consist of water vapour, water droplets, or ice crystals. They absorb thermal radiation very strongly and radiate similar to a black body in the infrared range (Heitor et al., 1991). Many studies have demonstrated that all-sky emissivity can be well predicted from clear-sky emissivity with correction for cloud effects (e.g. Crawford and Duchon, 1999; Bilbao and De Miguel, 2007; Wang and Liang, 2009; Alados et al., 2012; Li et al., 2017; Liu et al., 2020).
Because the regression coefficients of empirical parameterization models exhibit spatial dependence (e.g. Goss and Brooks, 1956; Brutsaert, 1975; Marthews et al., 2012; Liu et al., 2020), they should be recalculated on the basis of observations over wider regions to ensure their accuracy and representativeness in estimating DLR. For instance, Wang and Liang (2009) assessed the performance of clear-sky DLR parameterization models presented by Brunt (1932) and Brutsaert (1975) at 36 global sites. However, owing to the shortage of high-quality DLR measurements in China, most previous works focused on retrieval of DLR over only a few regions, e.g. the Tibetan Plateau (e.g. Weng et al., 1993; Zhu et al., 2017; Liu et al., 2020) and East China (Wang and Liang, 2009). Therefore, these models might not represent optimal parameterizations suited to retrieval of DLR over other areas of China. Fortunately, the China Meteorological Administration established the China Baseline Surface Radiation Network (CBSRN) in 2007 (Li et al., 2013), which currently comprises seven stations (Mohe, Xilinhot, Yanqi, Shangdianzi, Xuchang, Wenjiang, and Dali). Nine radiometric components including DLR are measured at 1 min intervals at CBSRN stations. The purpose of this study was to recalculate the coefficients of the Brunt (1932) model and the Weng et al. (1993) model and to develop a new parametric formula based on a long-term (2011–2022) hourly dataset obtained from the CBSRN stations.
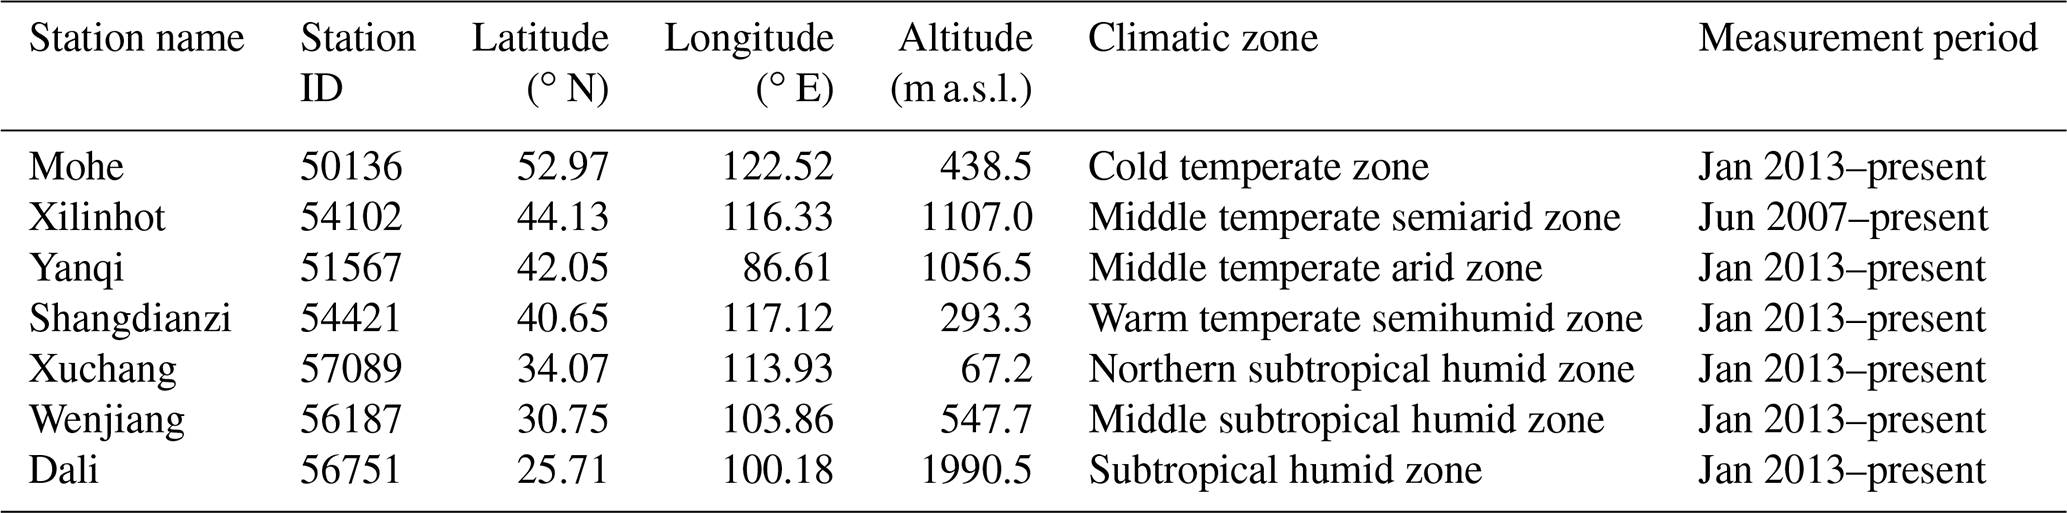
2.1 Site description
Figure 1 shows the geographical locations of the seven CBSRN stations: Mohe (MH; 52.97∘ N, 122.52∘ E; 438.5 m a.s.l.), Xilinhot (XL; 44.13∘ N, 116.33∘ E; 1003.0 m a.s.l.), Yanqi (YQ; 42.05∘ N, 86.61∘ E; 1056.5 m a.s.l.), Shangdianzi (SDZ; 40.65∘ N, 117.12∘ E; 293.3 m a.s.l.), Xuchang (XC; 34.07∘ N, 113.93∘ E; 67.2 m a.s.l.), Wenjiang (WJ; 30.75∘ N, 103.86∘ E; 547.7 m a.s.l.), and Dali (DL; 25.71∘ N, 100.18∘ E; 1990.5 m a.s.l.). It can be seen from Table 1 that these stations are distributed in seven representative climatic zones, i.e. the cold temperate zone (MH), middle temperate semiarid zone (XL), middle temperate arid zone (YQ), warm temperature semihumid zone (SDZ), northern subtropical humid zone (XC), middle subtropical humid zone (WJ), and subtropical humid zone (DL). Additionally, the elevation of three stations (i.e. XC, SDZ, and MH) is <500 m a.s.l., one station (WJ) has medium elevation (547.7 m a.s.l.), and the other three stations (i.e. XL, YQ, and DL) have elevations >1000 m a.s.l. (Table 1). Moreover, the CBSRN stations represent various land covers in China. For instance, MH is the northernmost meteorological station in China surrounded by forest and is located in the north-western suburbs of Mohe County, Heilongjiang Province (Liu et al., 2018). XL lies in central Inner Mongolia, where the main land cover is steppe. YQ, located on the northern margin of the Tarim Basin, is one of the representative stations in the desert and Gobi in the north-west of China. SDZ is located in the northern North China Plain, and only a few small villages with a sparse population surround it (Zhou et al., 2021). XC is located in central Henan Province and is surrounded by a wheat field and became one of the typical representative stations for farmland in China. WJ is located in the Sichuan Basin and represents a paddy field. As a part of the Dali National Climate Observatory near the Erhai Lake in Yunnan Province, DL is a representative station for wetlands.
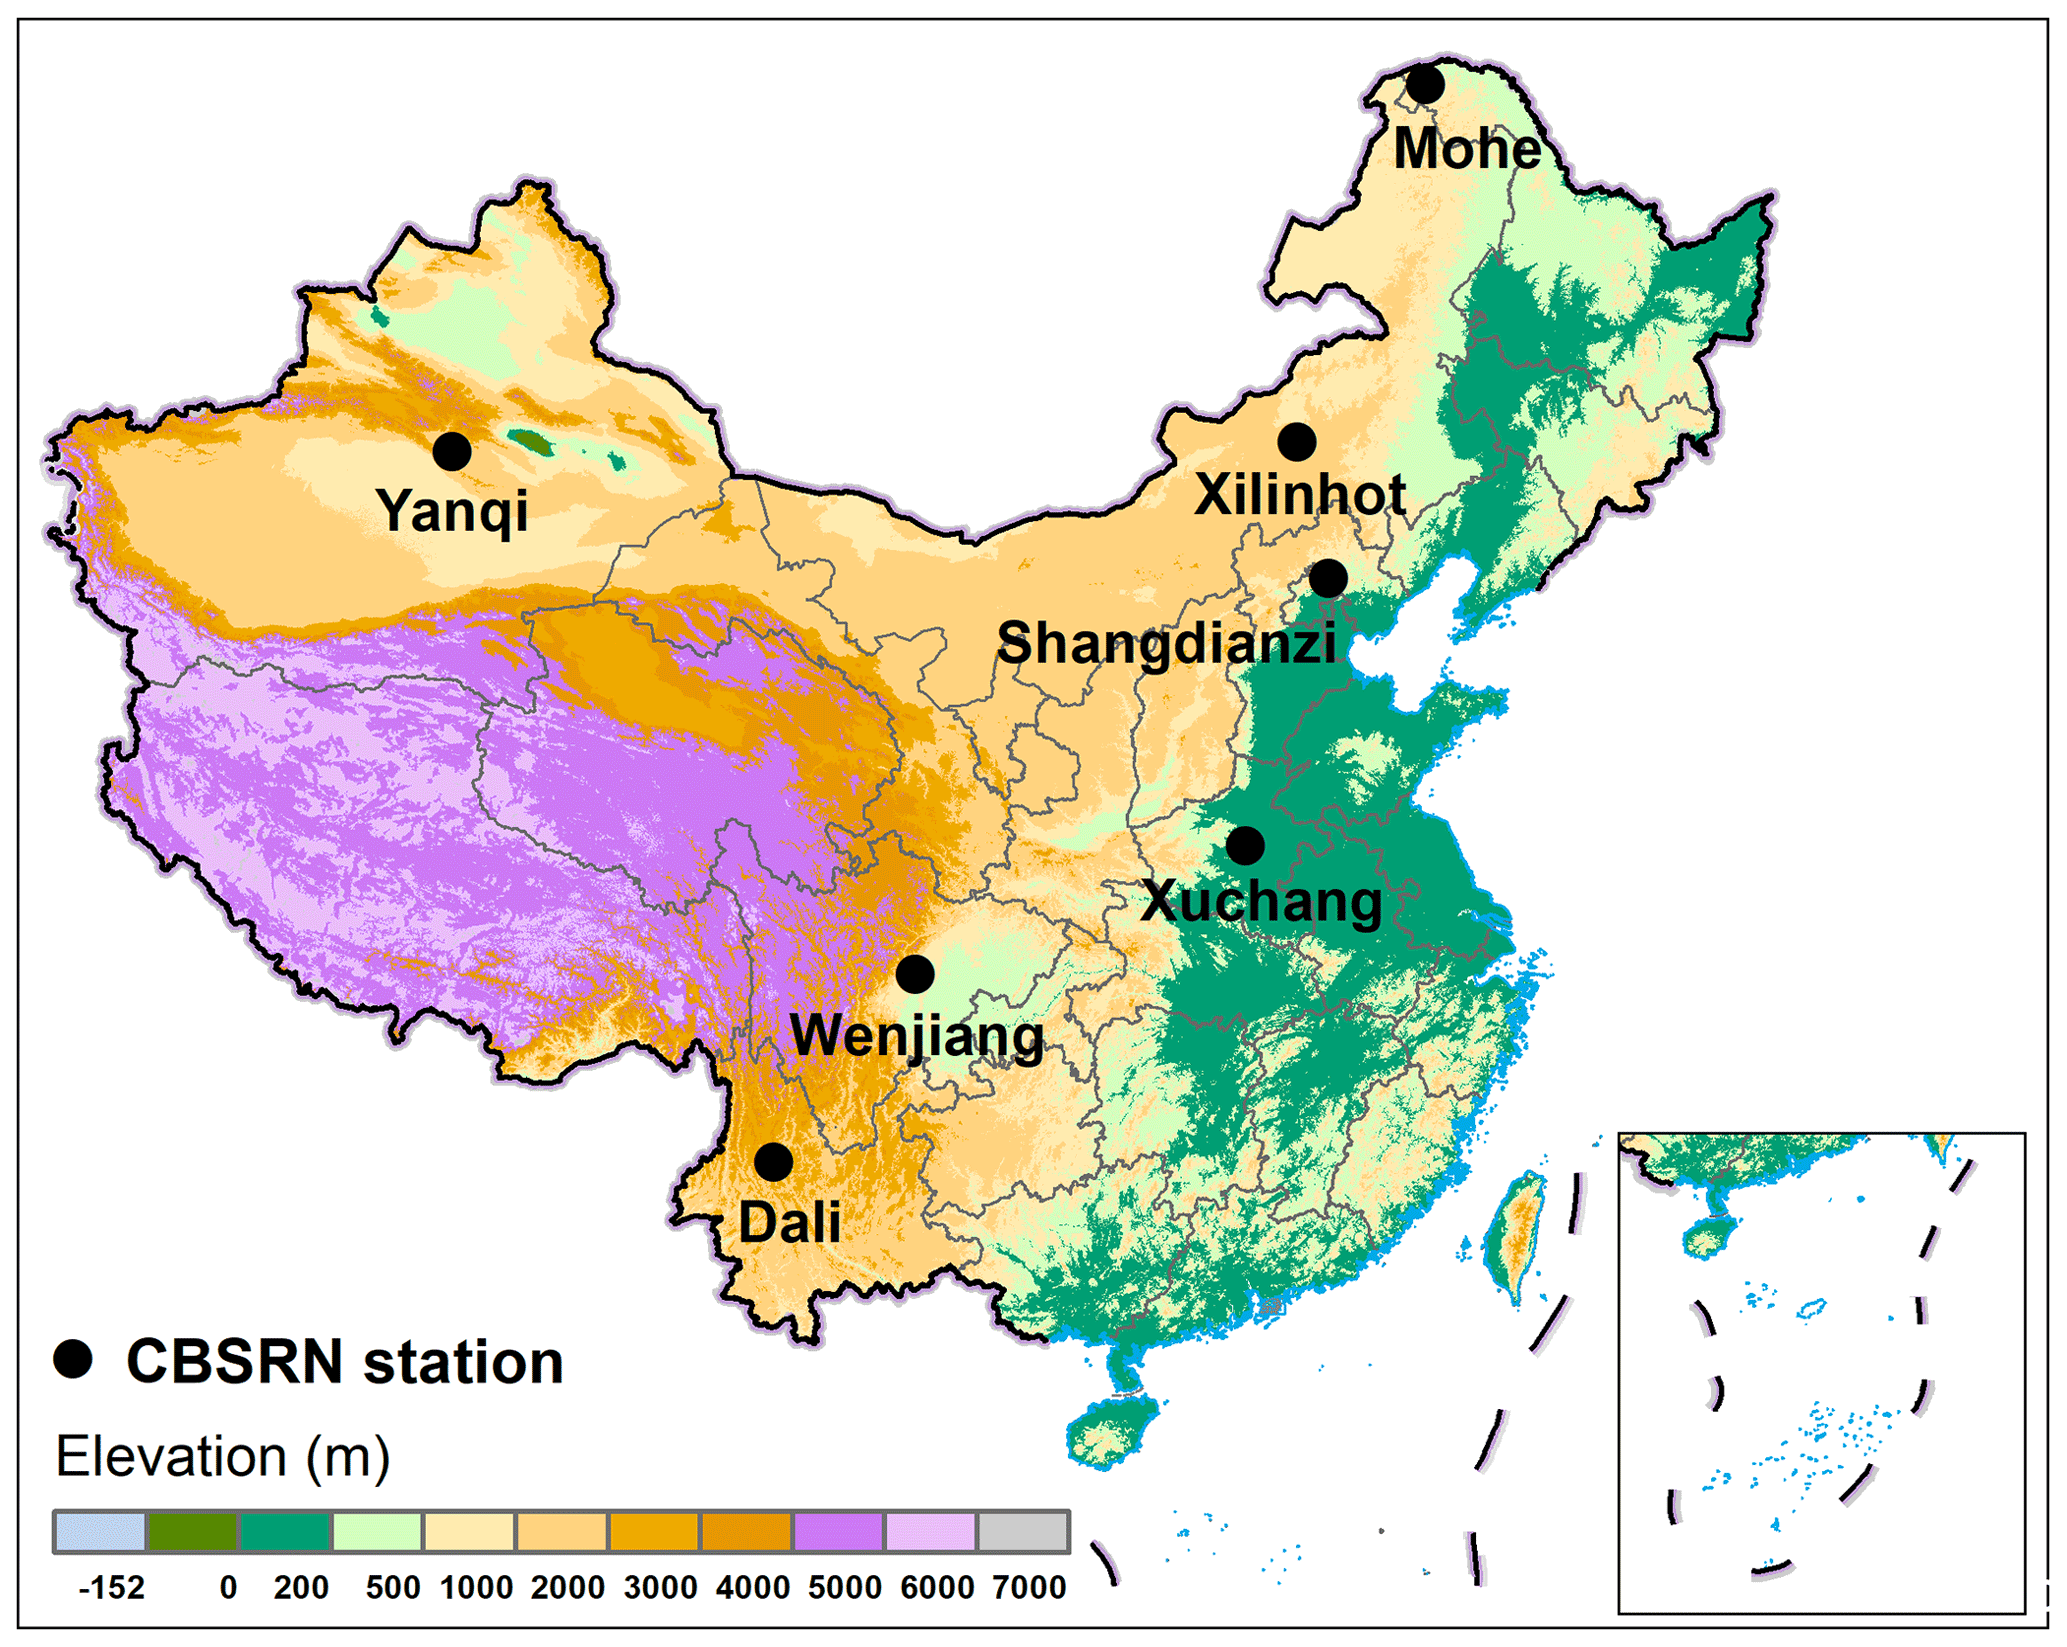
Figure 1Geographical locations of seven CBSRN stations in China. Terrain data represent the GTOP30 digital elevation model (ftp://edcftp.cr.usgs.gov/data/gtopo30/global/, last access: 1 December 2020).
2.2 Instruments and data
The CBSRN stations use IR02 pyrgeometers (Hukseflux, the Netherlands) to measure DLR. The spectral range of the IR02 instrument is 4.5–42 µm, which covers most of the spectral range of atmospheric long-wave radiation, making it a suitable instrument for measuring DLR in most cases. Moreover, to avoid the influence of solar radiation, the IR02 is shaded by a ball mounted on a FS-ST22 automatic solar tracker (Jiangsu Radio Science Research Institute Co. Ltd., China) during observation. Its temperature dependence is within ±3 % (−10 to 40 ∘C), and a ventilation–heating system is installed to reduce the influence of environmental temperature and to prevent dew/dust fall on its window. Note that the field of view (FOV) of the IR02 instrument is 150∘ rather than the desired 180∘, which means its price is attractive, while the accuracy loss is relatively minor (Hukseflux, 2022). The IR02 sampling frequency is 1 Hz, and the 1 min averaged data are stored using a WUSH-BR data logger (Jiangsu Radio Science Research Institute Co. Ltd., China). To assure the DLR measured at CBSRN is traceable to the World Radiometric Reference like that observed by the Baseline Surface Radiation Network (Driemel et al., 2018), the IR02 pyrgeometers used in this study were calibrated against the reference CGR4 pyrgeometer (Kipp & Zonen, the Netherlands) of the China Meteorological Administration (CMA). The CGR4 can be traced to the World Infrared Standard by participating in the International Pyrgeometer Comparison organized by the Physikalisch-Meteorologisches Observatorium Davos and the World Radiation Center (e.g. Gröbner et al., 2014; PMOD/WRC, 2022).
A fisheye camera, mounted on top of the HY-WP1A Intelligent Weather Observation System (Huayun Sounding Meteorological Technology Inc., China), is used to automatically record CF data. Full-sky photographs with a FOV of 180∘ are acquired at 1 min intervals. The photographs are then processed using artificial intelligence image detecting technology to yield hourly CF data with an uncertainty of <10 % (Hua et al., 2021).
Meteorological elements (i.e. Ta, e, and φ) are observed by an automatic weather station (AWS) at 1 min intervals, and the data are stored using a HY3000 data logger (Huayun Sounding Meteorological Technology Inc., China).
The data used in this study, which were downloaded from the China Meteorological Administration Data Service (https://data.cma.cn/data/detail/dataCode/A.0012.0001.S011.html, last access: 5 October 2022), undergo strict quality controls by meteorological experts and trained engineers of the National Meteorological Information Centre of China. Note that the DLR data measured by the IR02 instruments at high-elevation stations (i.e. MH and YQ) under extremely dry and cold synoptic conditions, in which irrational DLR measurements might be produced due to the high temperature dependency of the IR02 pyrgeometer (Hukseflux, 2022), were not involved in this study.
3.1 Emissivity calculation
Effective atmospheric emissivity (ε) is defined as the ratio of incoming long-wave radiation to black-body radiation at screen-level air temperature (e.g. Monteith, 1961; Rodgers, 1967; Prata, 1996):
where DLR is the downward hemispheric long-wave irradiance (W m−2) at the ground, which can be observed directly by a pyrgeometer; Ta is the screen air temperature (K) measured by the AWS; and σ is the Stefan–Boltzmann constant ( W m−2 K−4).
3.2 Statistical methods
This study used the nonlinear-curve-fitting method, orthogonal distance regression (ODR) iteration algorithm, and Levenberg–Marquardt iteration algorithm to regress the coefficients of the parameterization models. Parameterizations were assessed by means of statistical parameters such as mean bias error (MBE), relative MBE (rMBE), root mean square error (RMSE), relative RMSE (rRMSE), and correlation coefficient (r). The MBE is an indicator adopted to denote whether predictions from the parameterization are overestimates (positive values) or underestimates (negative values) in comparison with the measurements. The RMSE accounts for the average magnitude of the errors, but it does not provide an indication of the direction of the errors. The correlation coefficient r reflects the linear agreement between the observed parameter and the estimated variable (e.g. Gubler et al., 2012; Zhou et al., 2021).
4.1 Clear-sky emissivity parameterization
In this study, the coefficients of the Brunt model and the Weng model were calibrated using the nonlinear-curve-fitting method with 12 368 hourly data pairs (DLR and e) under clear-sky conditions (defined as the corresponding cloud fraction equal to zero) observed at seven CBSRN stations between January 2011 and December 2017 (Yang and Quan, 2023a). The Brunt model is one of the earliest pronounced models; a simple formula connects the downward long-wave radiation from the atmosphere, the total black-body radiation at temperature, and the vapour pressure (Brunt, 1932). The Weng model is one of the earliest parameterizations presented to retrieve the DLR over China from the atmospheric temperature and vapour pressure based on the experimental observation data for the Tibetan Plateau (Weng et al., 1993). Note that both the Brunt model and the Weng model are single-parameter parameterization models because only one parameter (e) is adopted as input in these models. The Brunt model is a power function of e with an exponent of , whereas the Weng model is a natural logarithm function of e. A two-parameter model such as the Brutsaert (1975) model, in which e and Ta are both used as input parameters, is recognized to be more reasonable than a single-parameter model in terms of the physical mechanism, especially under warm and wet conditions (e.g. Culf and Gash, 1993; Prata, 1996). In this study, we developed a two-parameter parametric formula (hereafter referred to as the parametric formula) that is similar to the Brutsaert model, except the exponent of the function is set to rather than . The coefficients of the parametric formulae were computed on the basis of the clear-sky hourly dataset (DLR, e, and Ta) using the nonlinear-curve-fitting method together with the ODR iteration algorithm.
The formulae of the parameterization models for retrieving clear-sky emissivity can be expressed as follows:
where εclr,B, εclr,W, and εclr,Y represent the clear-sky emissivity retrieved from the Brunt model, Weng model, and new model developed in this study, respectively; e (hPa) is vapour pressure; and Ta (K) is screen-level air temperature. The coefficients of determination (R2) of Eqs. (2)–(4) were 0.999, 0.999, and 0.930, respectively.
The Brunt model (denoted by the thick black curve in Fig. 2a) can fit all data pairs well under most cases ( hPa), especially those data pairs observed at low-elevation (<1000 m) stations such as XC (67.2 m a.s.l.) and SDZ (293.3 m a.s.l.), whereas the Weng model (denoted by the thick blue curve in Fig. 2a) appears to fit the data pairs better than the Brunt model under dry conditions (e≤17.5 hPa). Note that the Weng model was proposed in terms of radiation data observed over the Tibetan Plateau, where the atmospheric vapour pressure is lower than that in other regions in China. Therefore, it can be inferred that the Weng model is suitable for estimating clear-sky emissivity over arid regions. The parametric formula developed in this study (denoted by the thick black curve in Fig. 2b) fitted the data pairs reasonably and was considered to be based on physics because it uses both e and Ta as input.
Table 2Coefficients of the Brunt model reported by previous investigators as well as those derived in this study. The temporal resolution of the data used to derive the coefficients and the details of network/sites at which the observations were performed are also listed.
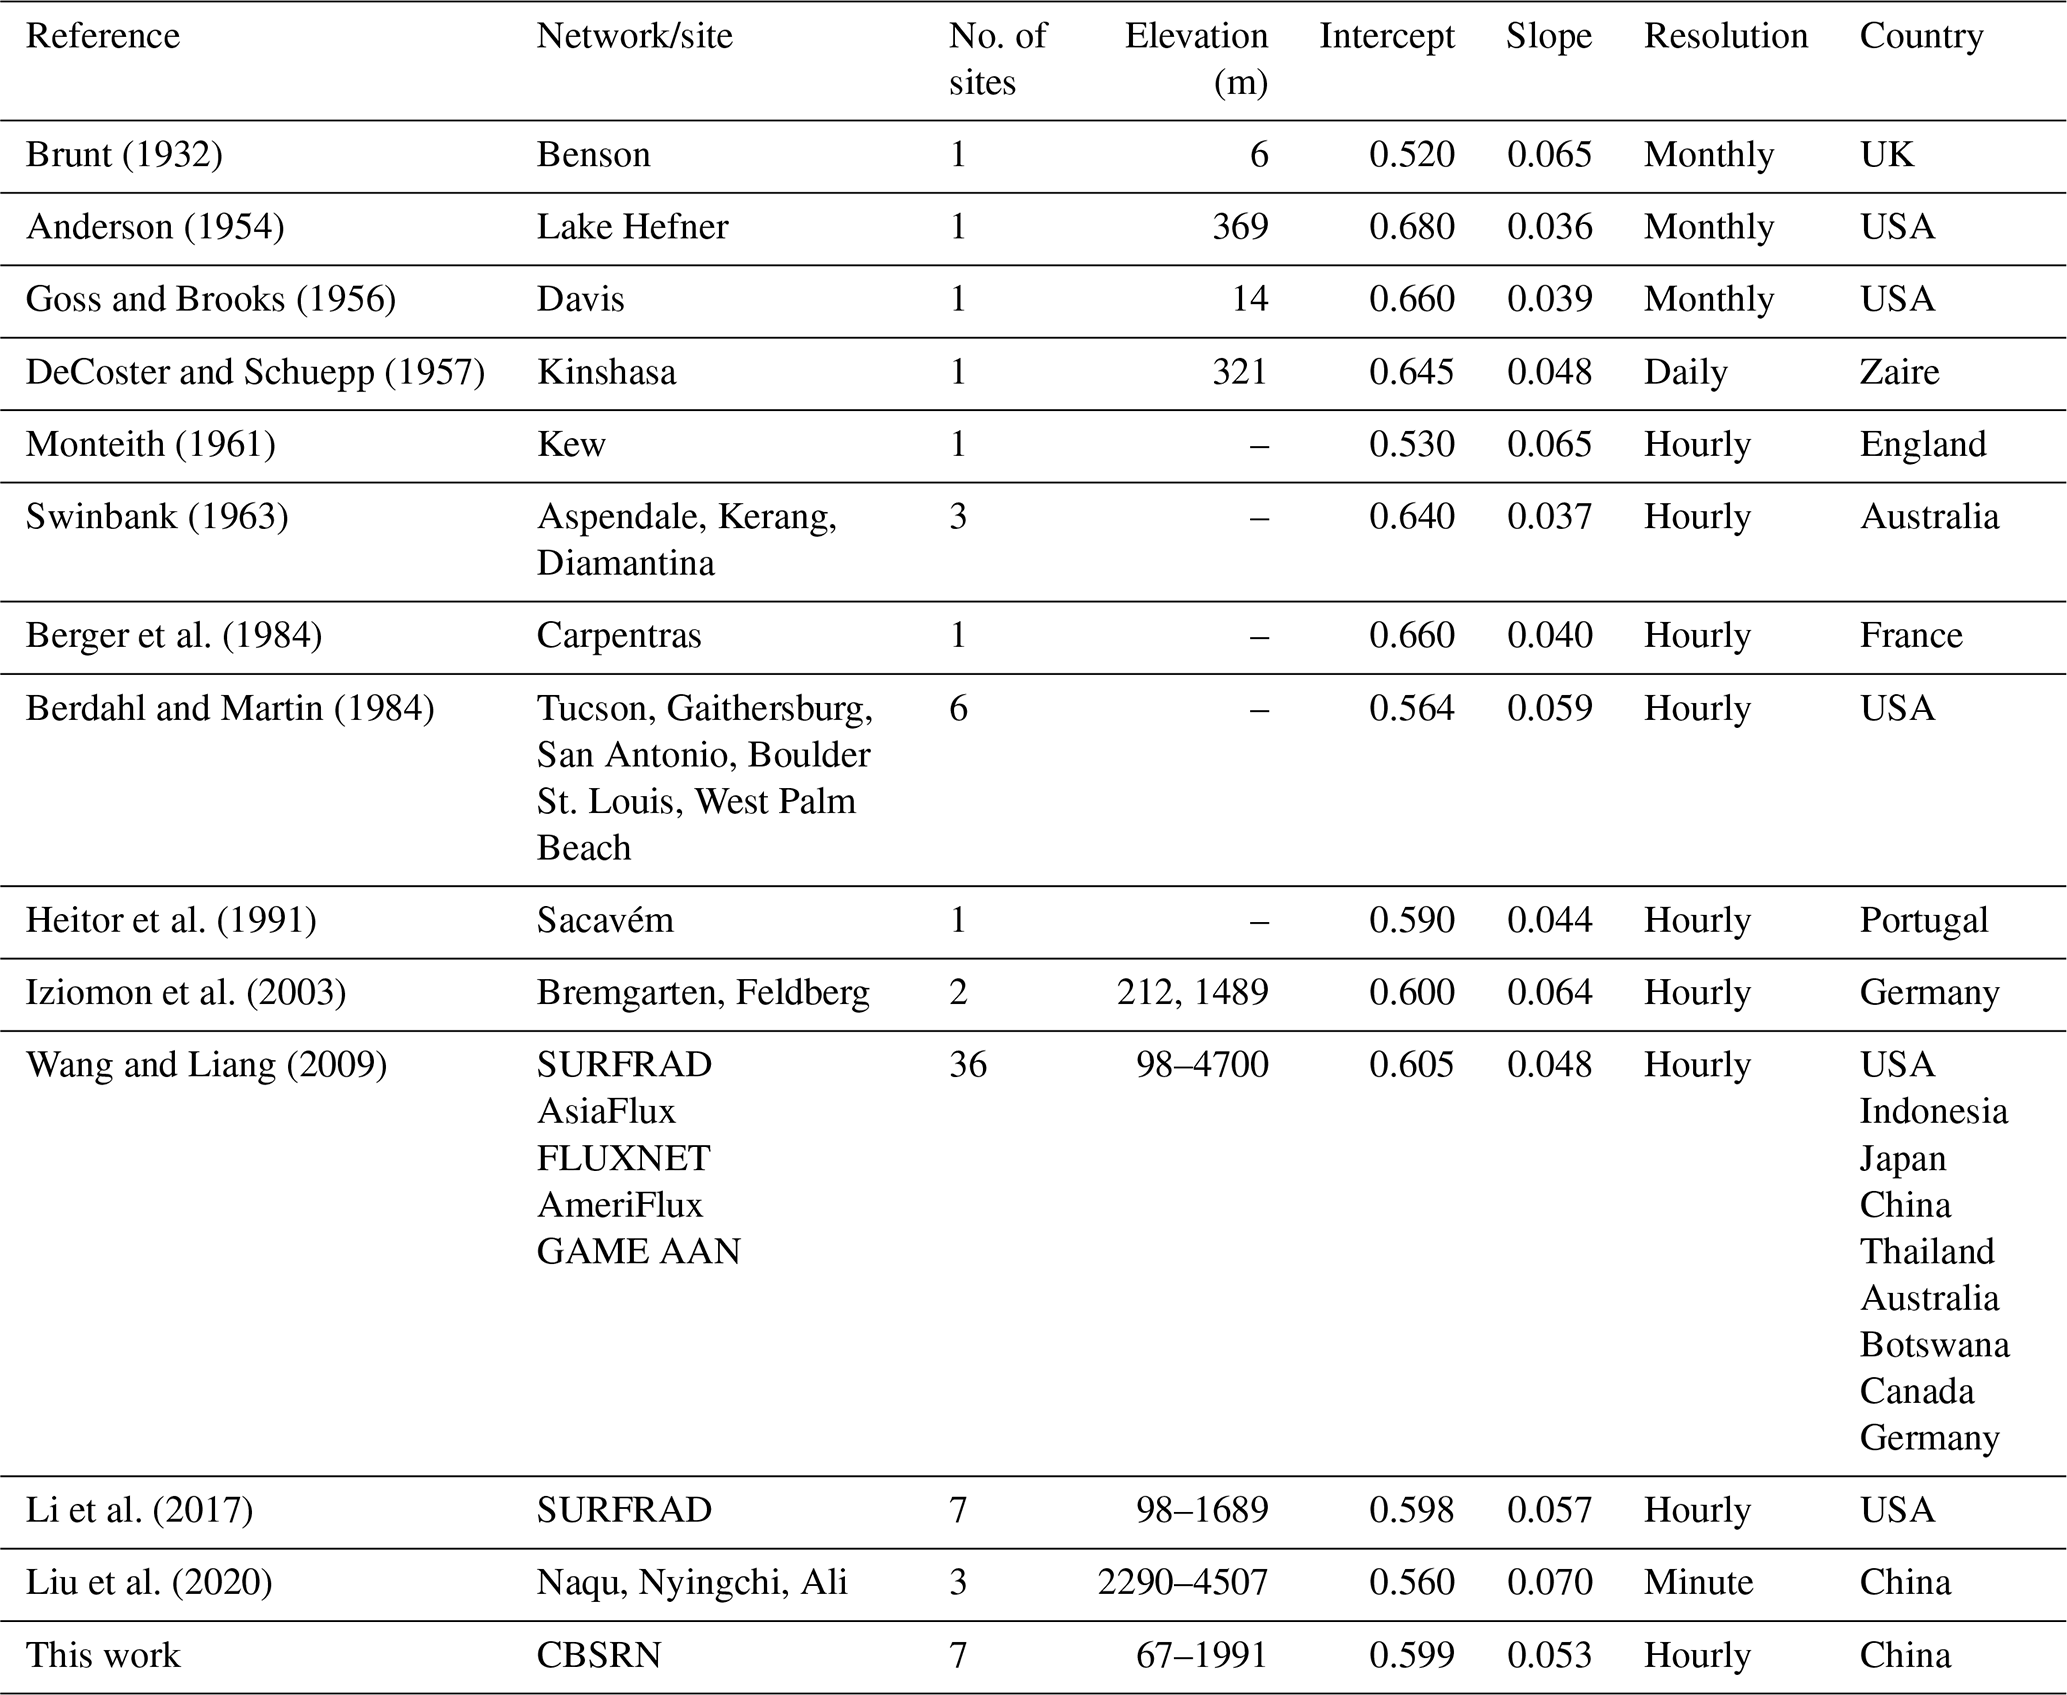
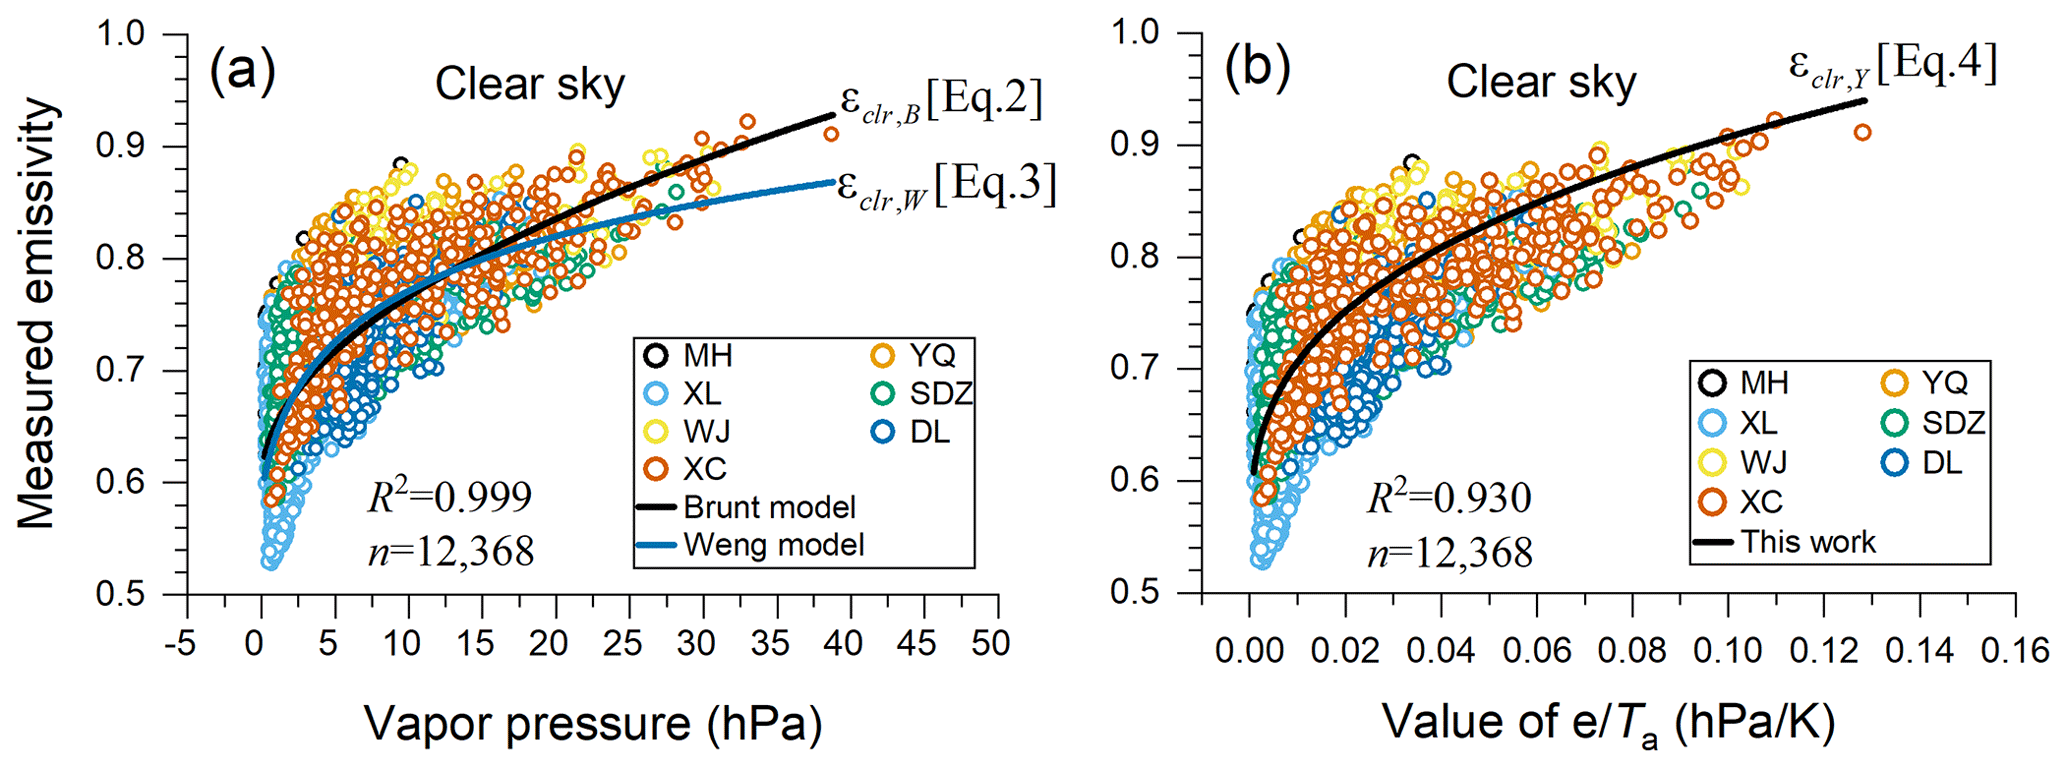
Figure 2Scatterplots of measured clear-sky emissivity versus coincident measurements of (a) vapour pressure and (b) the ratio of vapour pressure to screen-level air temperature. Circles represent hourly data pairs observed at seven CBSRN stations. Thick black and blue curves in (a) denote the Brunt model (Eq. 2) and the Weng model (Eq. 3), respectively. The thick black curve in (b) denotes the parametric formula developed in this study (Eq. 4).
The coefficients of the well-known Brunt model reported by previous authors as well as those derived in this study are listed in Table 2. The intercept (0.599) and slope (0.053) in the Brunt model derived in this study (Eq. 4) are consistent with those presented by both Li et al. (2017) and Wang and Liang (2009) but differ from those provided by other investigators. Discrepancies in the coefficients might result from different atmospheric conditions (e.g. water vapour content, CF, and temperature profiles) and the temporal resolution (hourly, daily, or monthly) of the data used in establishing the parameterization models. The greater the values of the slope, the larger the dependences of the parameterization formula on water vapour (Iziomon et al., 2003). Note the slope value greater than 0.05 in the Brunt model, the Monteith (1961) model, the Iziomon model, the Berdahl and Martin (1984) model, the Li model, and the model developed in this study, which means that these models have greater sensitivity to water vapour in comparison to other models.
4.2 All-sky emissivity parameterization
Under all-sky conditions, the emission from clouds can supplement the radiation emitted by water vapour and other gases in the lower atmosphere. Therefore, the effective emissivity of the atmosphere is higher under all-sky conditions compared to that under clear-sky conditions (e.g. Li et al., 2017). Numerous formulae were presented to estimate the emissivity under all-sky conditions based on the emissivity parameterization under clear-sky conditions and cloud fraction (e.g. Maykut and Church, 1973; Crawford and Duchon, 1999; Duarte et al., 2006; Choi et al., 2008). The formula of Duarte et al. (2006) with an adjustment of atmospheric humidity was adopted in this study. For a site like Barrow, Alaska, where both the temperature and the partial pressure of water vapour are low during much of the year, the effect of atmospheric humidity on emissivity under all-sky conditions can be neglected (e.g. Maykut and Church, 1973). However, the temperature and atmospheric humidity over the CBSRN stations vary over a wide range during a year; the addition of moisture correction to the formula thus seems more reasonable. The structure of the formula to estimate the emissivity under all-sky conditions in this study is
where εall represents the all-sky emissivity; εclr is the clear-sky emissivity calculated using Eqs. (2)–(4); CF is the cloud fraction (0–1); ∅ is relative humidity (%); and α, β, γ, δ, and ζ are regression coefficients, which were derived using the dataset of observations recorded at seven CBSRN stations between January 2011 and December 2020 (Yang and Quan, 2023a). The dataset comprises 71 204 hourly measurements of DLR, e, Ta, CF, and ∅ under all-sky conditions. The formulae derived for all-sky emissivity are as follows:
where εall,B, εall,W, and εall,Y represent all-sky emissivity retrieved from the Brunt model, Weng model, and new model developed in this study, respectively, and εclr,B, εclr,W, and εclr,Y are clear-sky emissivity calculated using Eqs. (2)–(4). The coefficients of determination for Eqs. (6)–(8) are 0.745, 0.748, and 0.750, respectively.
4.3 Emissivity validation
To verify the clear-sky emissivity parameterization models (Eqs. 2–4) defined in Sect. 4.1, this study used an independent clear-sky dataset comprising 1706 hourly clear-sky measurements of DLR, e, and Ta at four CBSRN stations (YQ, XL, SDZ, and XC) acquired between January 2018 and July 2021 (Yang and Quan, 2023a). The MBEs (rMBEs) between the measured clear-sky emissivity and that estimated by the Brunt model, the Weng model, and model developed in this study were −0.013 (−1.8 %), −0.015 (−2.1 %), and 0.007 (1.0 %), respectively (Fig. 3a–c). The small positive MBE of the model developed in this study might be attributable to the fact that two parameters (e and Ta) are involved in the equation. Meanwhile, all models yielded analogous RMSEs (∼ 0.039) and rRMSEs (∼ 5.3 %), which might be a reflection of the dataset and selected independent variables used to establish the formulae. For example, the effects of CO2, O3, and aerosols on emissivity were not considered in these formulae (e.g. Staley and Jurica, 1972; Kjaersgaard et al., 2007; Gubler et al., 2012).
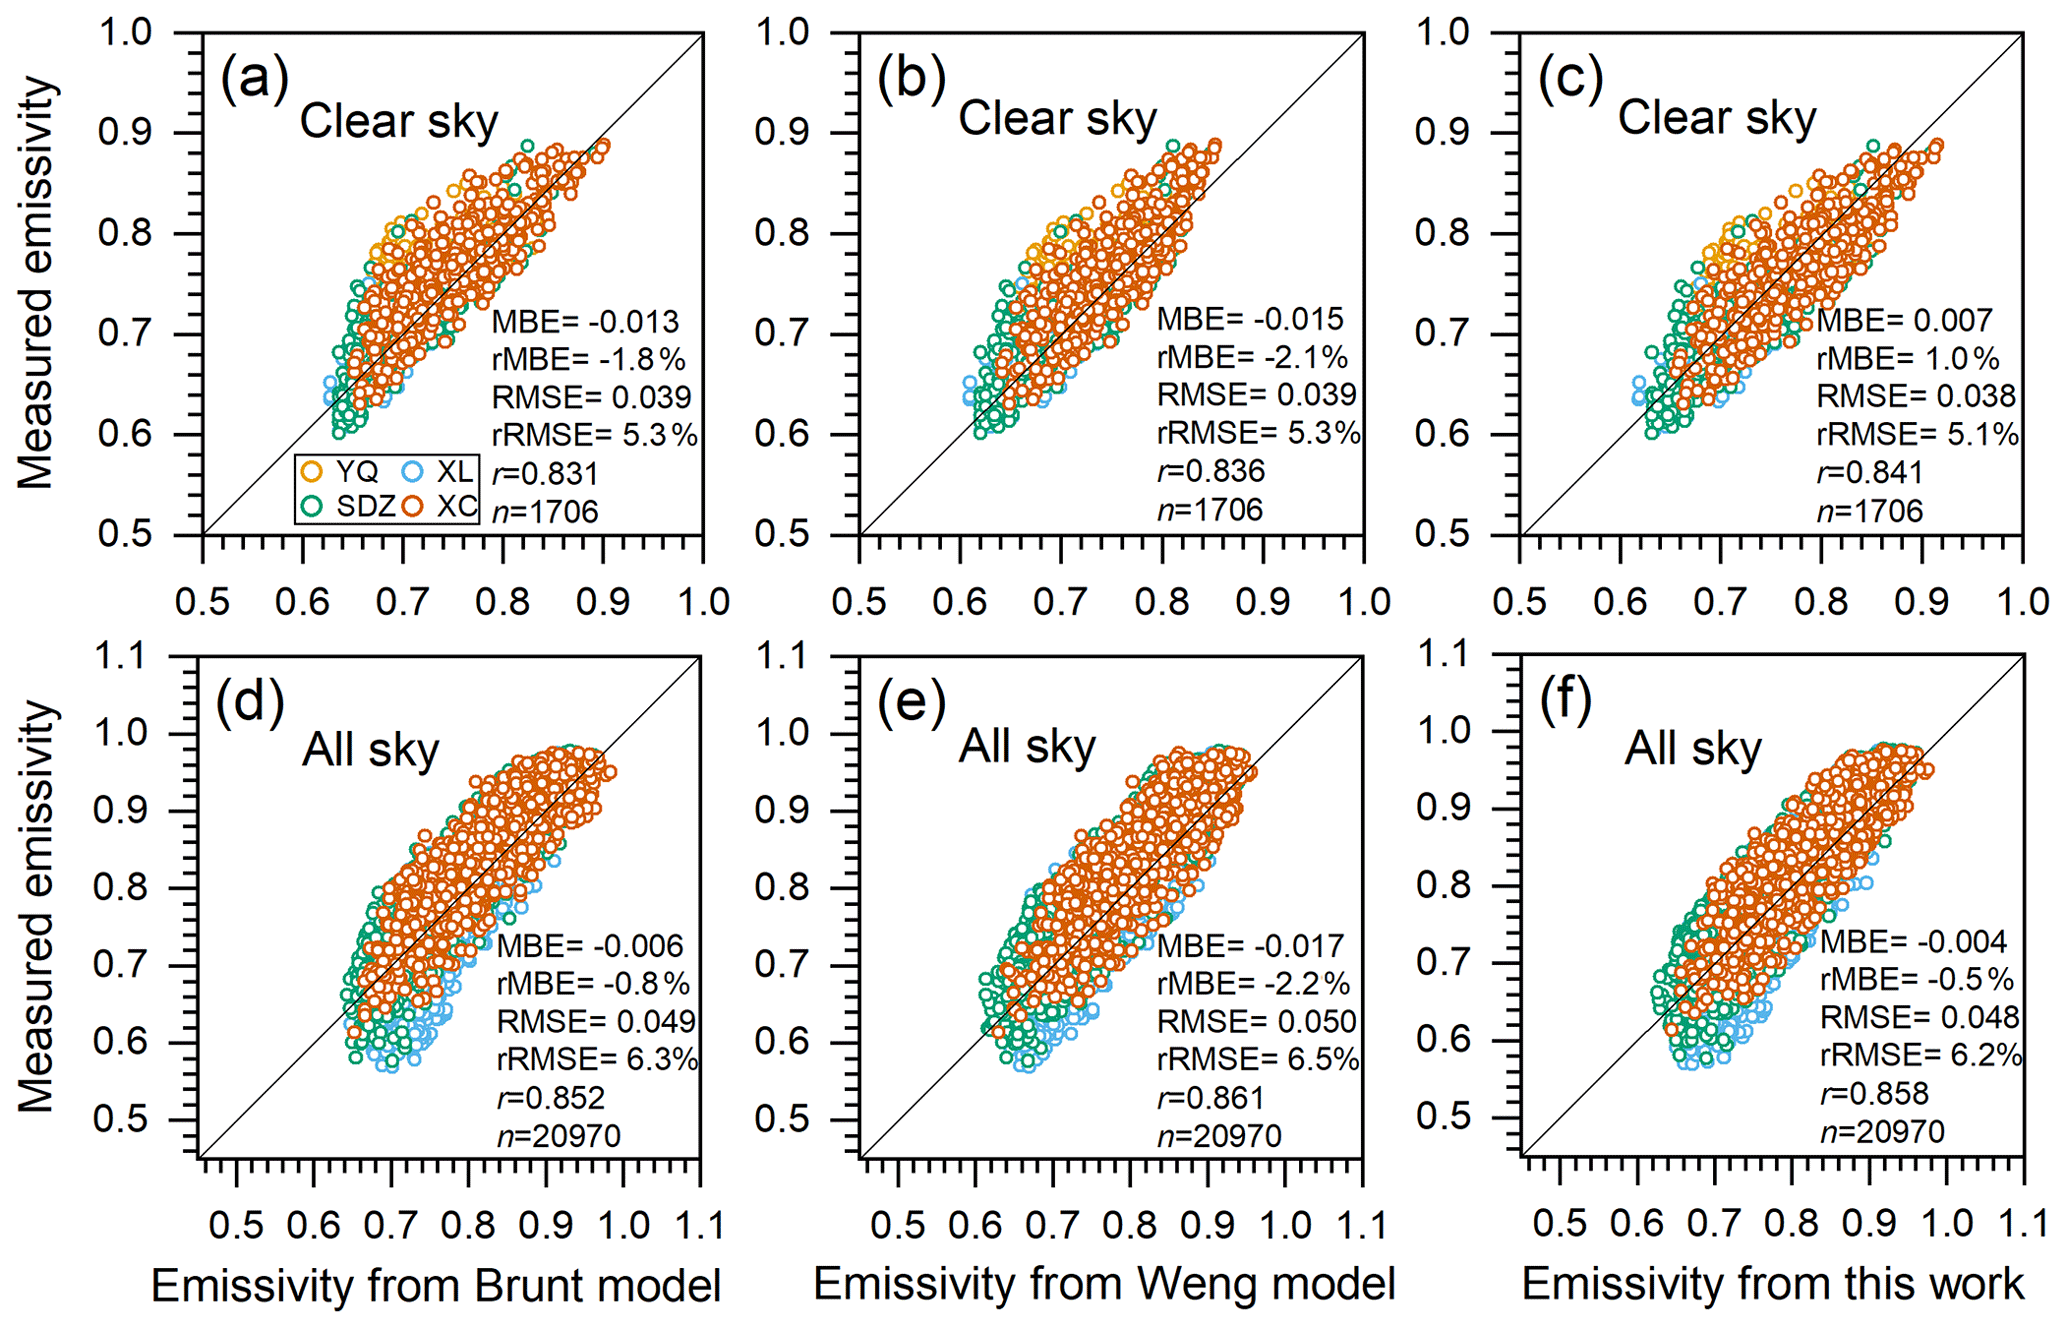
Figure 3Measurements versus calculations of effective atmospheric emissivity by the Brunt model, the Weng model, and the model developed in this study for (a–c) clear-sky and (d–f) all-sky conditions. Black lines denote the 1 : 1 line.
The parameterization models used to estimate all-sky emissivity (Eqs. 6–8) were validated on the basis of an independent dataset comprising 20 970 hourly all-sky measurements (DLR, e, Ta, CF, and φ) acquired at three CBSRN stations (XL, SDZ, XC) between January 2021 and April 2022 (Yang and Quan, 2023a). The MBEs (rMBEs) between the measured all-sky emissivity and that calculated by the Brunt model, the Weng model, and model developed in this study were −0.006 (−0.8 %), −0.017 (−2.2 %), and −0.004 (−0.5 %), respectively (Fig. 3d–f). Note that the MBEs (rMBEs) of the all-sky emissivity were close to or even less than those of the clear-sky emissivity. One possible reason is that more samples (20 970) were adopted in verifying the all-sky emissivity than were adopted in validating the clear-sky emissivity (i.e. 1706). Another reason is that more input parameters (e.g. CF and RH) other than e and Ta were included in the all-sky emissivity formulae, which alleviated the abrupt variations in e or Ta. However, the RMSE of the all-sky emissivity parameterization model was ∼ 0.049, which is higher than that (∼ 0.039) of the clear-sky emissivity model.
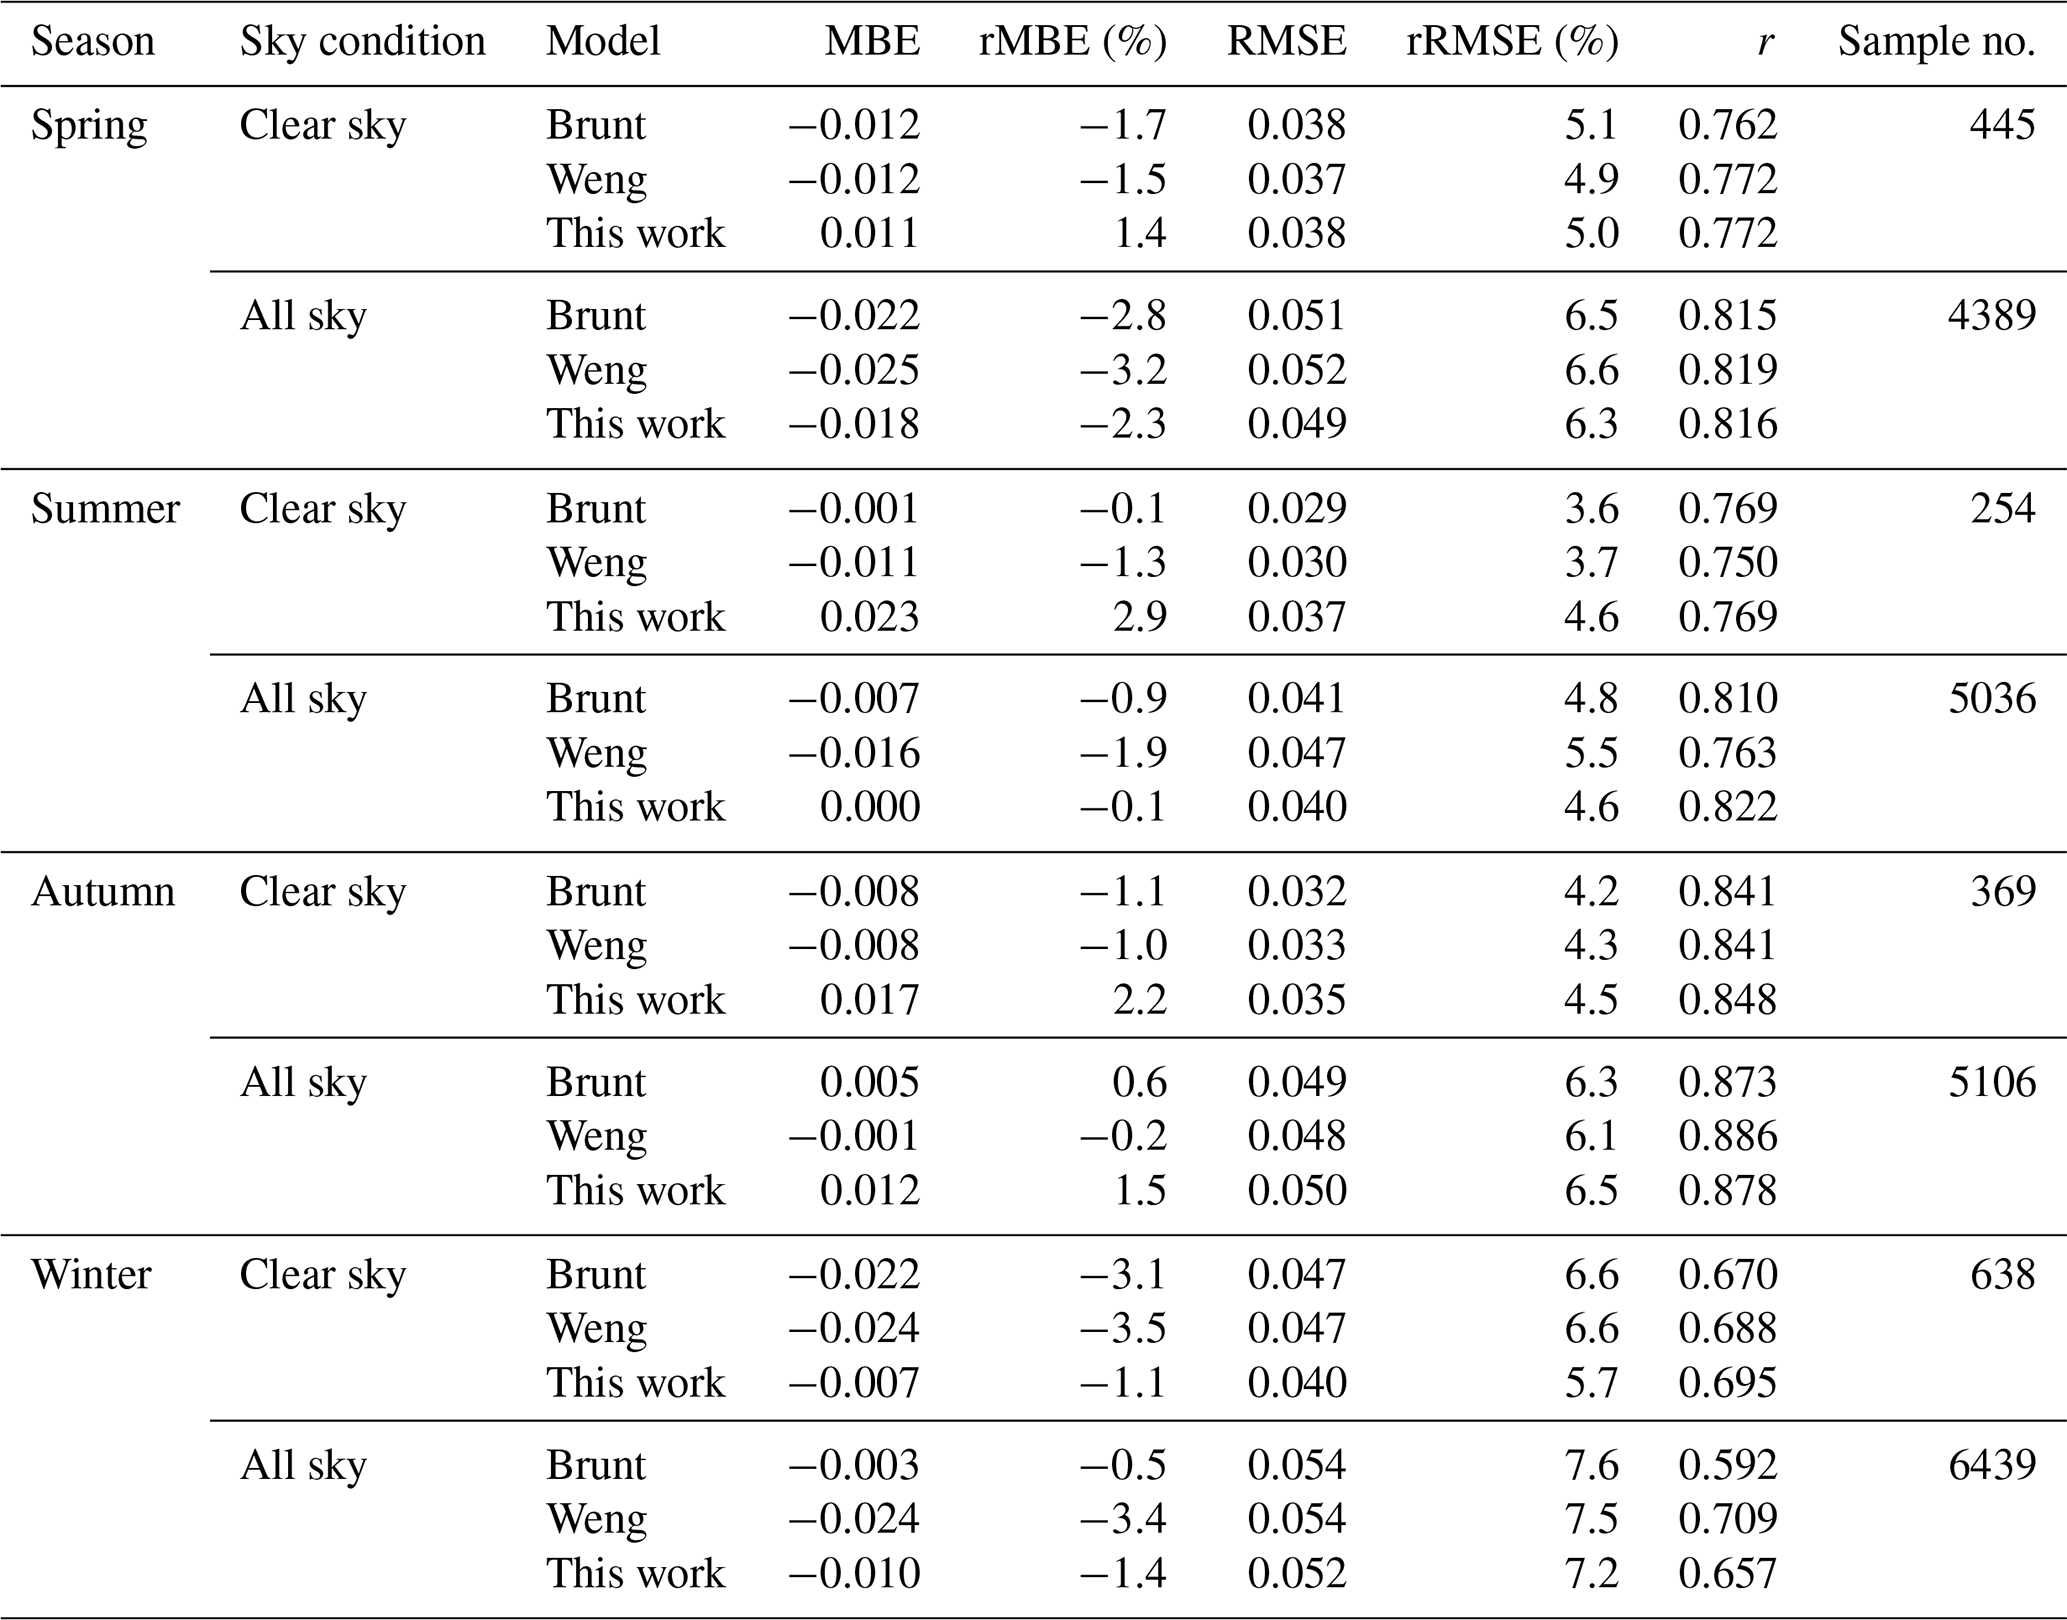
To illustrate the performance of each of the parameterization models in estimating both clear- and all-sky emissivity in different seasons, several statistics are summarized in Table 3 and plotted in Fig. 4. The model developed in this study can overestimate clear-sky emissivity in all seasons except winter (with rRMBE of −1.1 %), whereas both the Brunt model and the Weng model underestimate clear-sky emissivity in all seasons (Fig. 4a). The influence of involving Ta in the model would be more noteworthy during summer and winter because Ta reaches its maximum and minimum value in these seasons, respectively. Furthermore, all parametrization models exhibited apparent negative rMBEs in winter, unlike in other seasons. In winter, the CO2 content over China usually reaches its annual maximum (Fang et al., 2014). Therefore, underestimation of clear-sky emissivity using parameterization models would be greater in winter owing to the effect of neglecting CO2 in the models. Under all-sky conditions, the rMBEs of the parameterization models were negative in all seasons, except for the Brunt model (rMBE of 0.6 %) and the model developed in this study (rMBE of 1.5 %) in autumn (Fig. 4b).
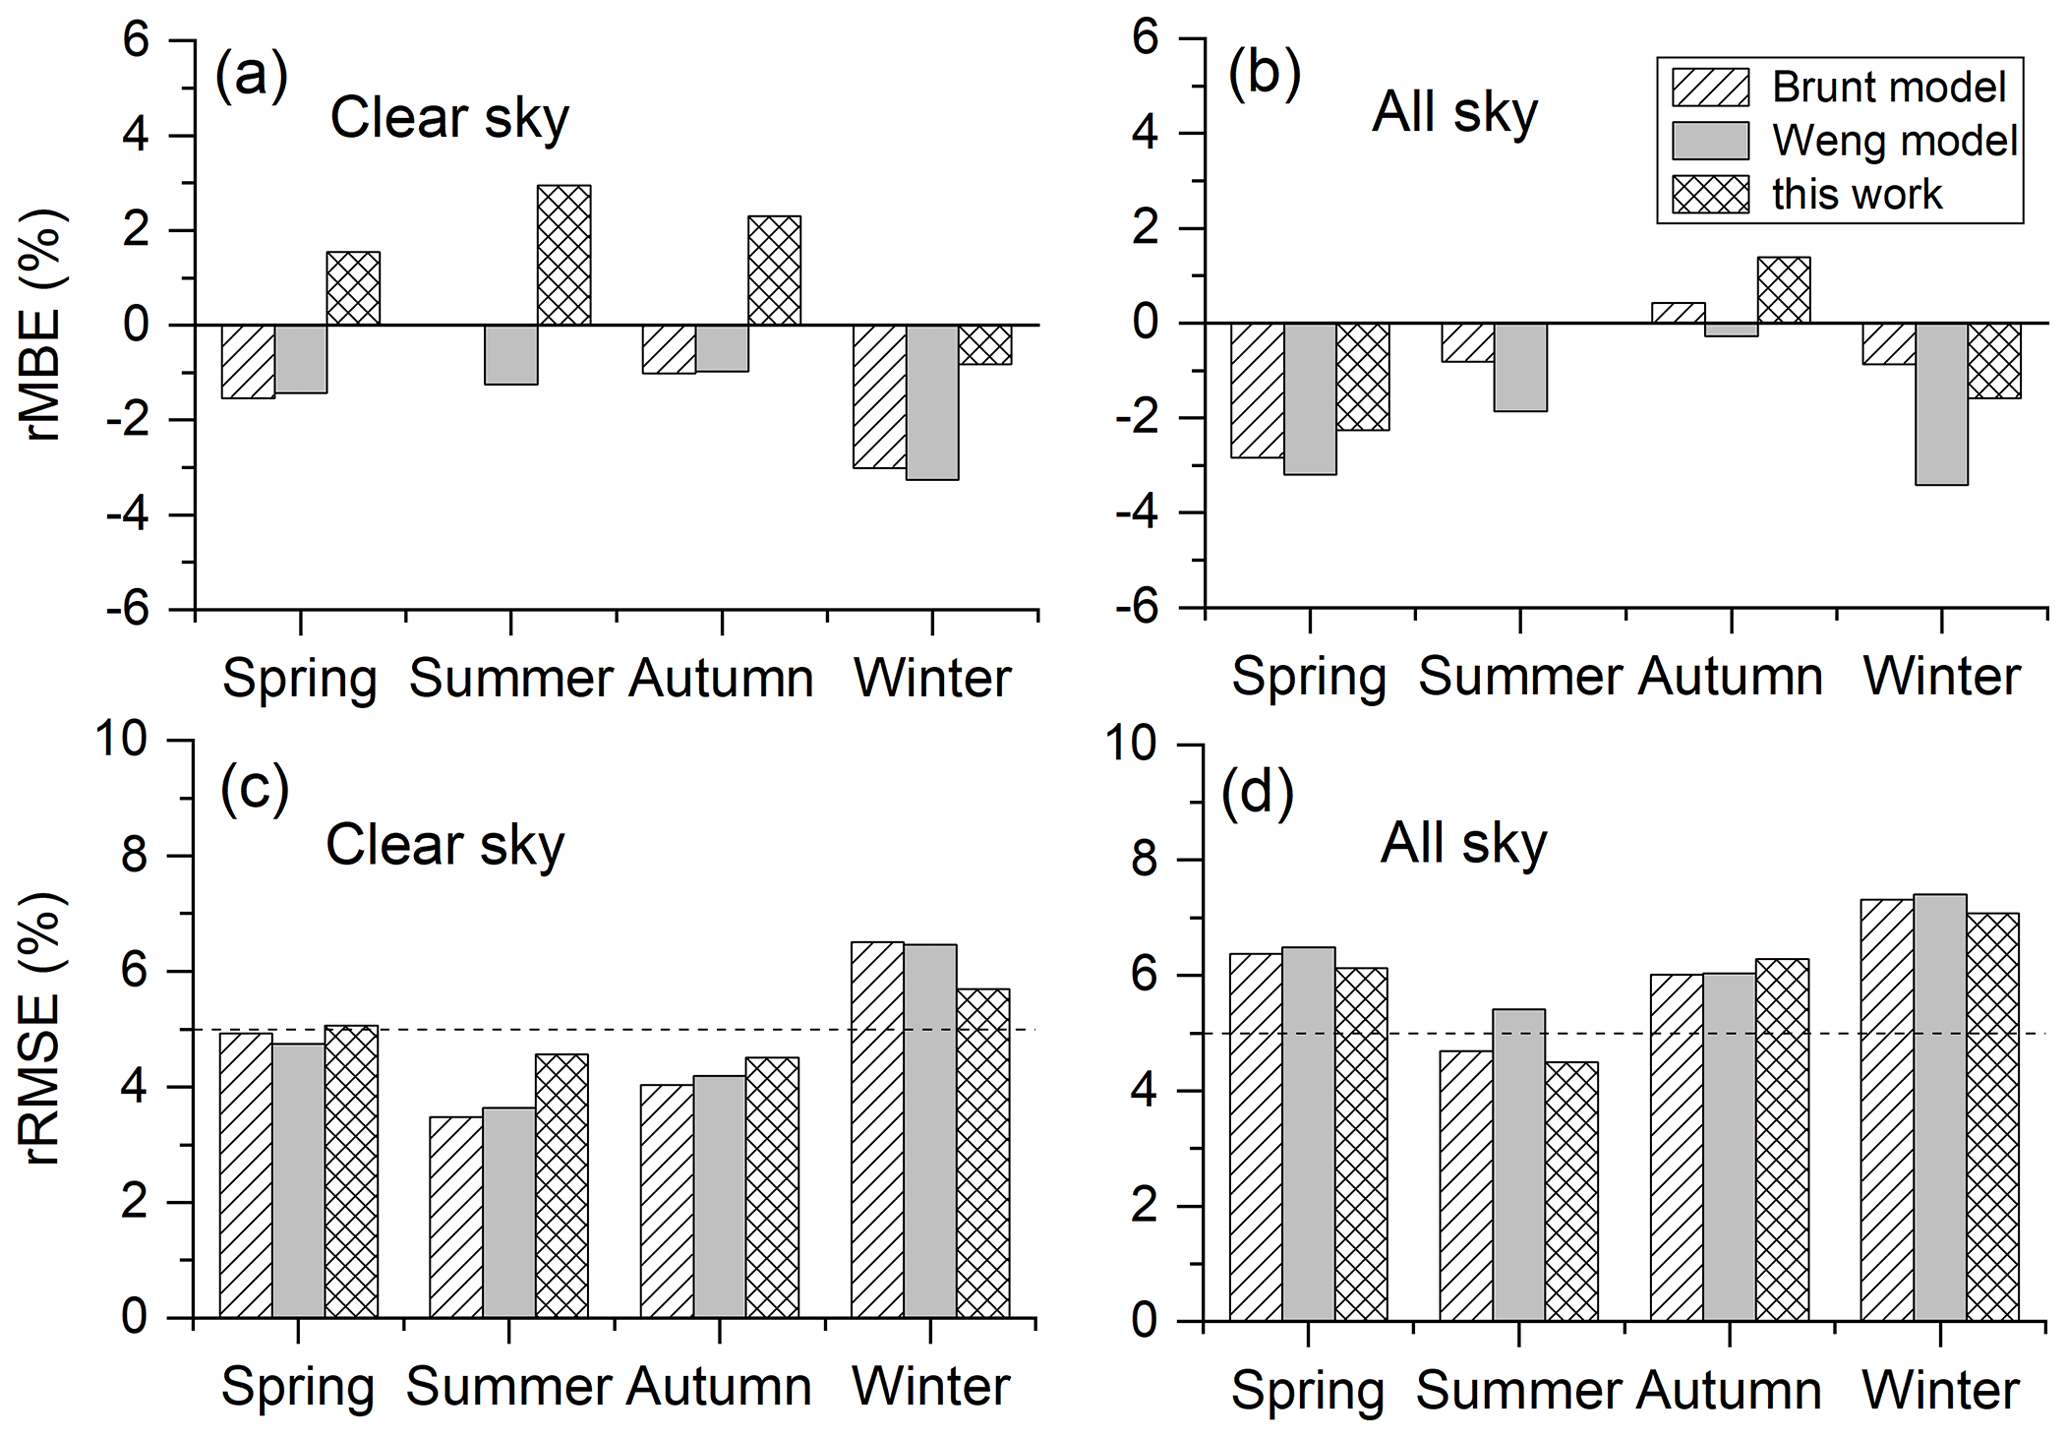
Figure 4Seasonal statistics of rMBEs for three parameterization models (a) under clear-sky conditions and (b) under all-sky conditions. The corresponding rRMSEs for three models (c) under clear-sky conditions and (d) under all-sky conditions. The dashed line denotes the rRMSE value of 5 %.
For clear-sky emissivity (Fig. 4c), the rRMSEs between the measurements and the estimations of three models were ∼ 5 % in spring (March–May), summer (June–August), and autumn (September–November) but >5.7 % in winter (December–February). For all-sky emissivity, the rRMSEs between the measurements and the estimations of three models were closer, with values of ∼ 6.5 %, ∼ 5.0 %, ∼ 6.3 %, and ∼ 7.4 % in spring, summer, autumn, and winter, respectively (Fig. 4d, Table 3).
Table 3Comparison between the measured emissivity and those estimated using three models in four seasons under clear- and all-sky conditions.
4.4 DLR validation
Based on Eq. (1), clear-sky DLR can be calculated in terms of the measurements of screen-level temperature and the corresponding emissivity estimated using the parameterization models. Statistical results (Table 3) indicated that the MBEs (rMBEs) between the measured hourly clear-sky DLR at YQ, XL, SDZ, and XC during 2018–2021 (Yang and Quan, 2023a) and that estimated using the Brunt model, the Weng model, and the model developed in this study were −4.3 W m−2 (−1.5 %), −5.1 W m−2 (−1.8 %), and 3.7 W m−2 (1.3 %), respectively (Fig. 5a–c). The RMSE (rRMSE) of both the Brunt model and the Weng model was 13.8 W m−2 (4.9 %), i.e. slightly lower than the one of the model developed in this study (RMSE: 14.3 W m−2; rRMSE: 5.1 %).
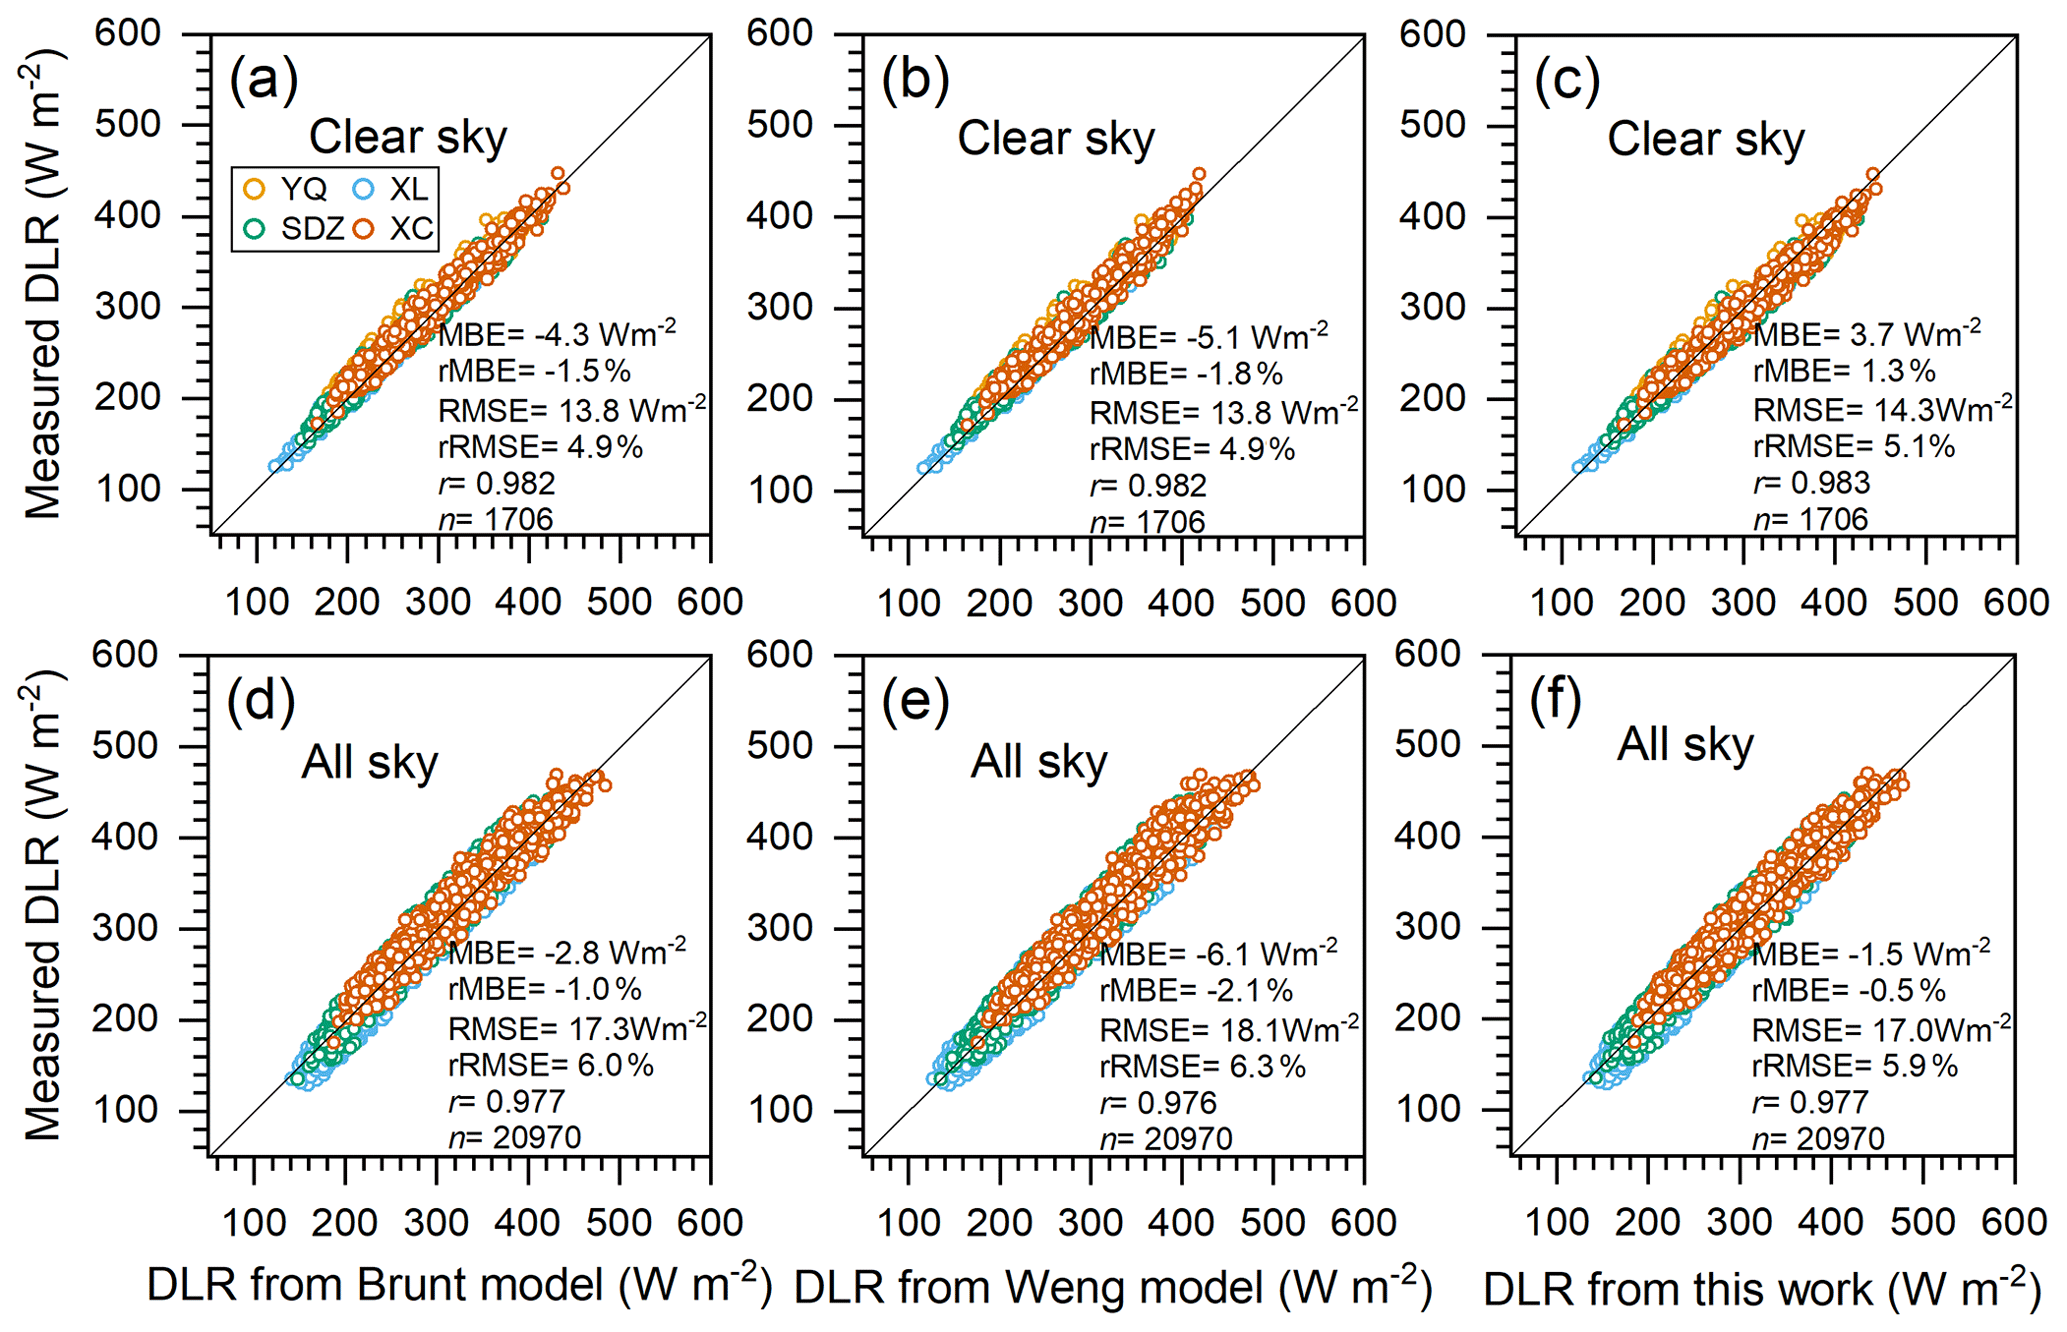
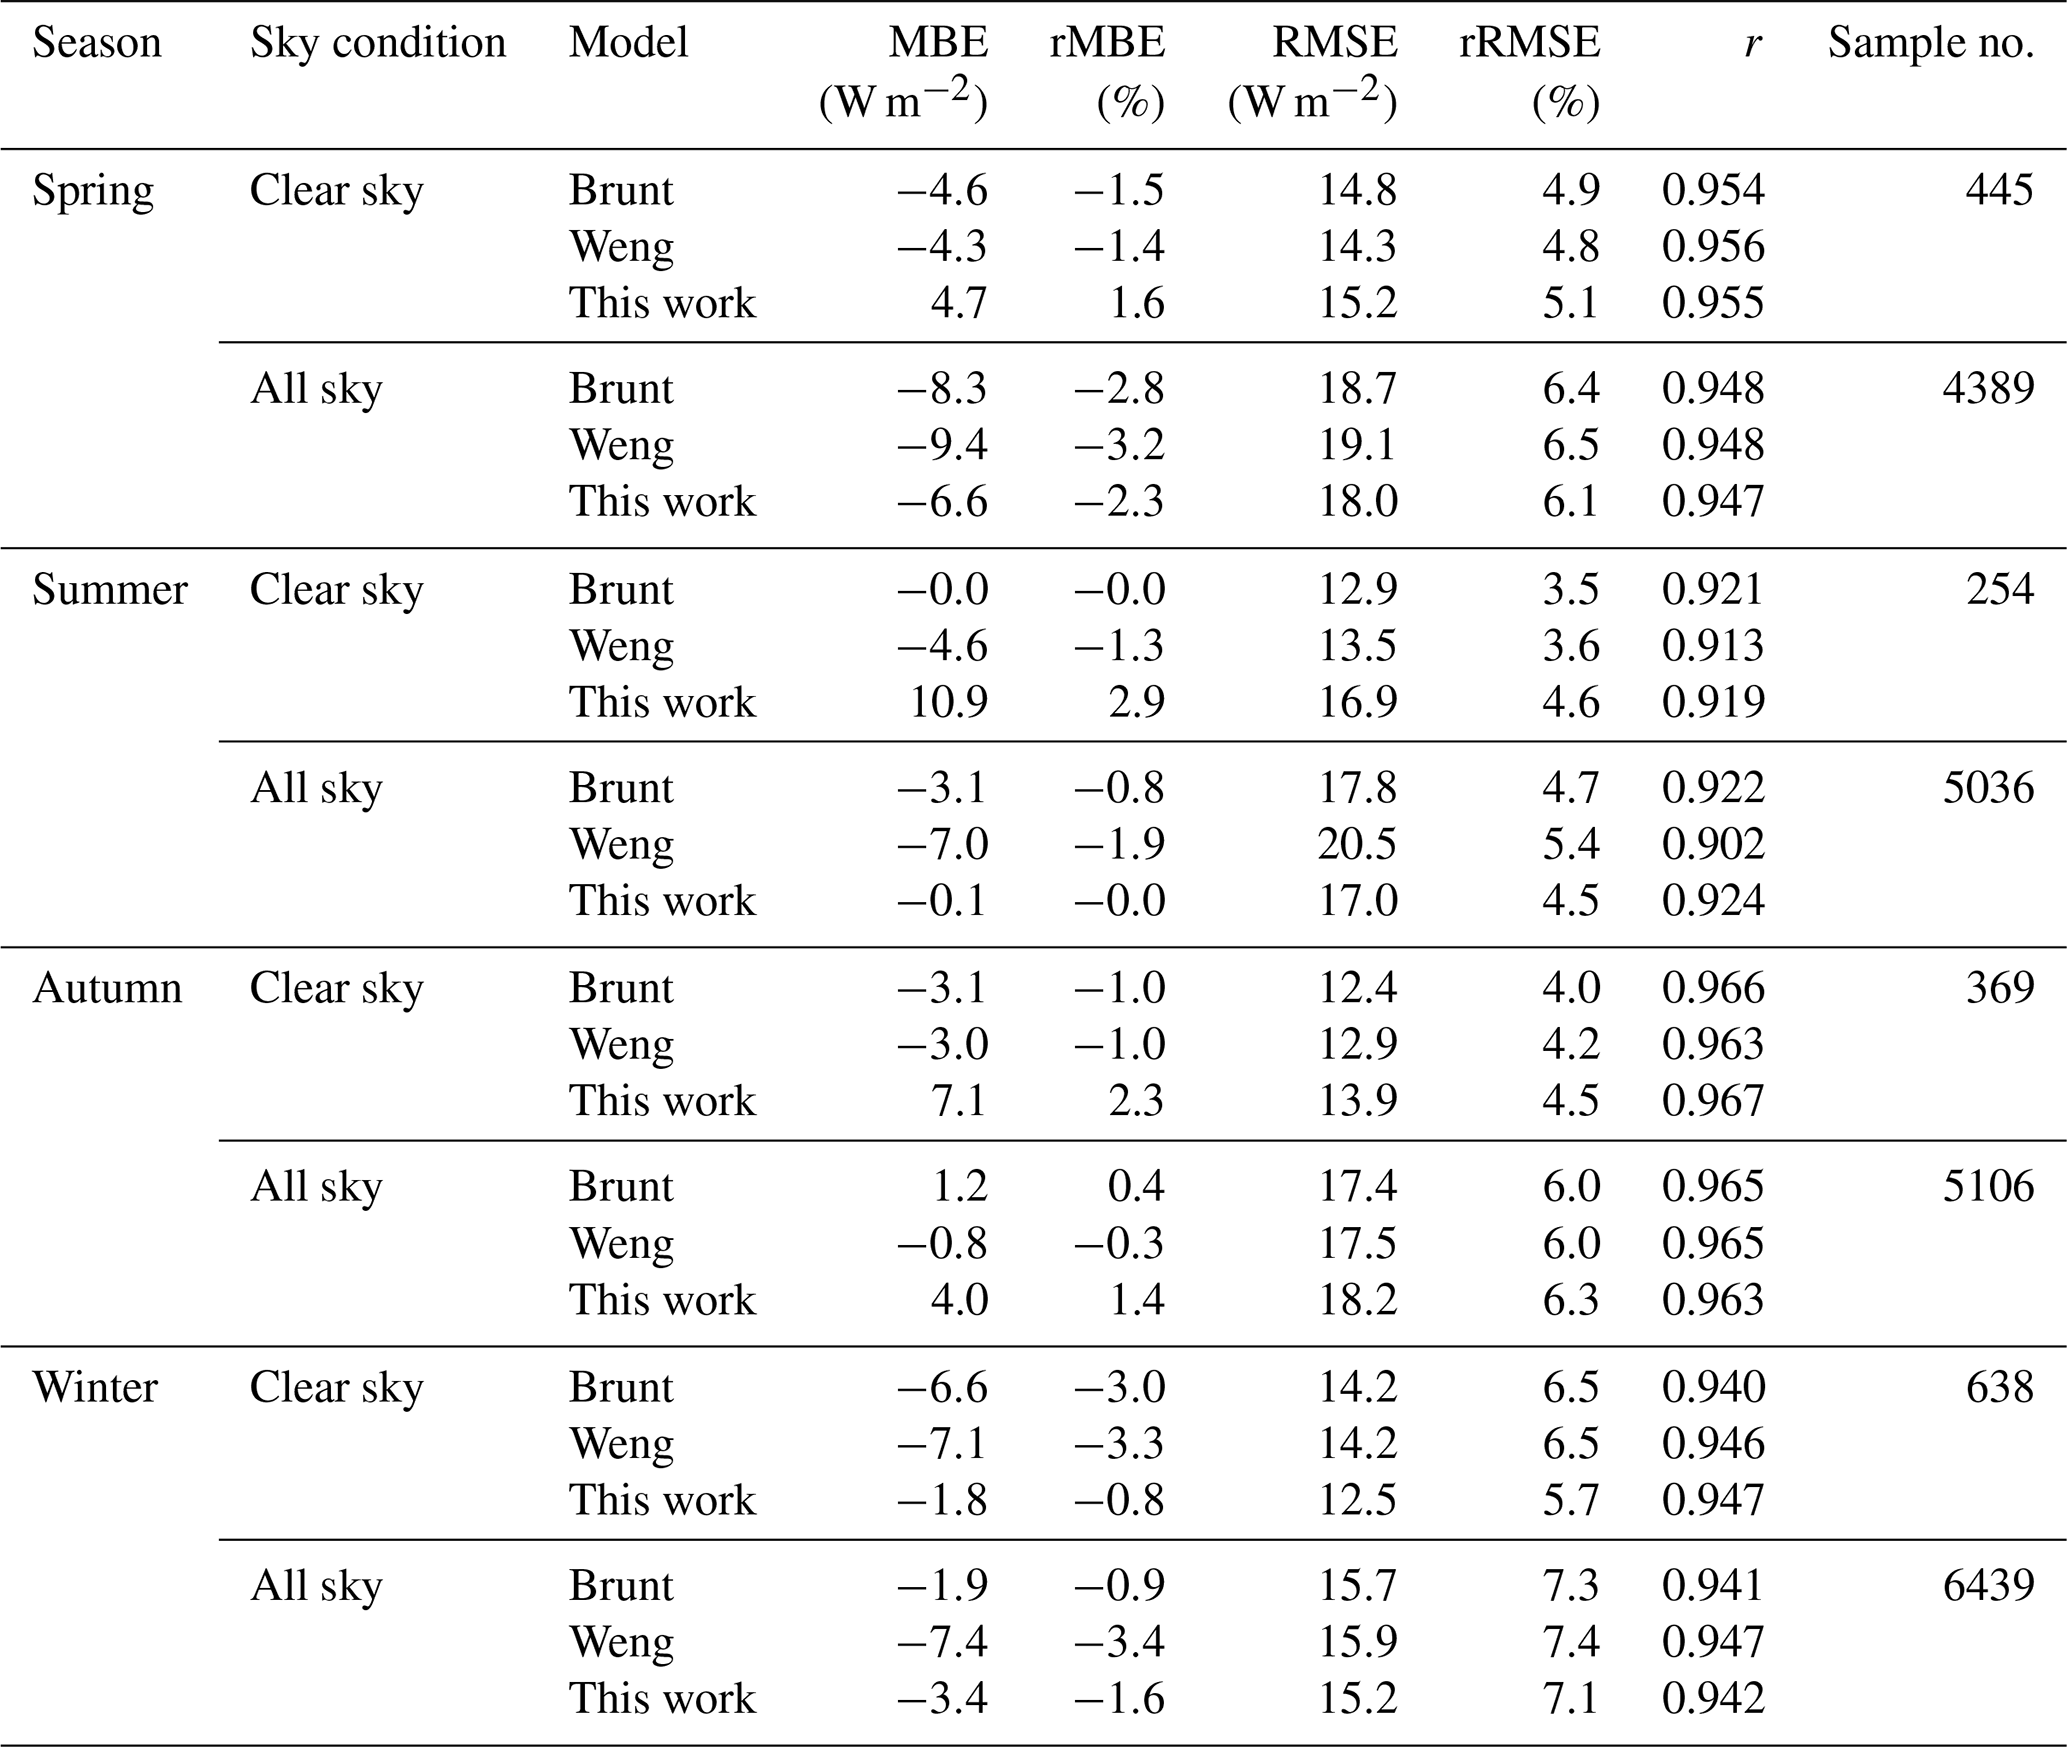
Table 4Comparison between the measured DLR and those estimated using three models in four seasons under clear- and all-sky conditions.
Under all-sky conditions, the MBEs (rMBEs) between the measured hourly all-sky DLR at XL, SDZ, and XC from January 2021 to April 2022 (Yang and Quan, 2023a) and that estimated using the Brunt model, the Weng model, and the parametric formula developed in this study were −2.8 W m−2 (−1.0 %), −6.1 W m−2 (−2.1 %), and −1.5 W m−2 (−0.5 %), respectively (Fig. 5d–f). The RMSEs (rRMSEs) between the measured all-sky DLR and that retrieved using the Brunt model, the Weng model, and the model developed in this study were 17.3 W m−2 (6.0 %), 18.1 W m−2 (6.3 %), and 17.0 W m−2 (5.9 %), respectively. It can be seen that the RMSE (rRMSE) of the all-sky DLR retrieved from the parameterization models was ∼ 3.5 W m−2 (1.0 %) greater than the one of the clear-sky DLR retrieval. Occurrence of clouds and wider ranges of temperature and humidity under all-sky conditions would disperse the relationship between the observations and the predictions of DLR.
It can be seen from Table 4 that both the Brunt model and the Weng model tend to underestimate clear-sky DLR in all seasons (MBEs in the range of −7.1 to 0.0 W m−2), while the model developed in this study tends to overestimate clear-sky DLR in all seasons except winter (MBE of −1.8 W m−2). Additionally, all models tend to underestimate all-sky DLR (MBEs in the range of −9.4 to −0.1 W m−2) in all cases, except the Brunt model and the model developed in this study tend to overestimate all-sky DLR in autumn (MBE of 1.2 and 4.0 W m−2, respectively). The RMSEs (rRMSEs) of clear-sky DLR estimated by the parameterization models were approximately 14.8 W m−2 (5.0 %), 14.4 W m−2 (4.0 %), 13.0 W m−2 (4.2 %), and 13.6 W m−2 (6.2 %) in spring, summer, autumn, and winter, respectively; the counterparts of all-sky DLR were approximately 18.6 W m−2 (6.3 %), 18.4 W m−2 (4.9 %), 17.7 W m−2 (6.1 %), and 15.6 W m−2 (7.3 %) in spring, summer, and winter, respectively.
To date, several empirical parameterization models to derive DLR from near-surface meteorological elements have been developed on the basis of field observations obtained at a few sites in China. In this study, we utilized a long-term dataset of hourly observations from seven CBSRN stations to recalculate the coefficients of the Brunt model, the Weng model, and a new parameterization model to estimate atmospheric effective emissivity and DLR under clear-sky and all-sky conditions. The main conclusions of this study are as follows.
Generally, all three parameterization models can reliably estimate emissivity and DLR under clear- and all-sky conditions; i.e. the MBEs between the measured clear-sky DLR and that estimated using the Brunt model, the Weng model, and a new model developed in this study were −4.3, −5.1, and 3.7 W m−2, respectively; for all-sky DLR, the corresponding MBEs were −2.8, −6.1, and −1.5 W m−2, respectively.
On the basis of the long-term (2011–2022) hourly data measured at the seven CBSRN stations adopted in this study, it is reasonable to suggest that the parameterization models considered in this study have reasonable spatial representation and robustness.
This study used continuous hourly CF observations from the HY-WP1A, which remarkably improved the consideration of cloud effects on estimations of emissivity and DLR. For example, CF data with high temporal resolution can improve the accuracy in estimating emissivity and DLR and provide the opportunity to study diurnal variations in DLR. On the other hand, the IR02 pyrgeometers currently used at the CBSRN stations should be replaced with more precise instruments such as the CGR4 pyrgeometer. The IR02 was usually found to produce irrational positive records of DLR under extreme cold and dry synoptic conditions, which might be caused by its large temperature dependency (within ±3 % under −10 to 40 ∘C).
Owing to the fact that limited data observed at seven CBSRN stations in China are used in establishing the parameterizations, the formulae presented in this study are mainly suitable to retrieve the downward long-wave radiation in China. In the future, more data obtained from worldwide radiation stations (e.g. the BSRN and SURFRAD) are expected to be involved to establish the parameterizations, which could improve their capability for retrieving downward long-wave radiation over more diverse geographical and climatological regions around the world.
Though the dominant emitter of long-wave radiation in the atmosphere is water vapour, other gases (e.g. CO2 and O3) and aerosols also emit long-wave radiation. The effects of gases and aerosols on DLR, however, are not considered sufficiently in the parameterization models. It is expected that the influences of atmospheric components on the relationships between clear-sky emissivity and screen-level meteorological variables will be further explored by means of the comprehensive observations at Global Atmosphere Watch stations such as SDZ.
The data used in this study are available online at https://doi.org/10.5281/zenodo.7715651 (Yang and Quan, 2023a), and an introduction movie to this study and a brief summary are published at https://doi.org/10.5281/zenodo.7715765 (Yang and Quan, 2023b).
JH and QC contributed to shaping the ideas and presenting the research goal and provided constructive comments on the research. JY and WQ presented the construction of the paper. JY contributed to processing and analysis of the data as well as preparation of the manuscript. WQ contributed the ideas, organized the research, performed the review, edited the manuscript, and provided the funding acquisitions.
The contact author has declared that none of the authors has any competing interests.
Publisher’s note: Copernicus Publications remains neutral with regard to jurisdictional claims in published maps and institutional affiliations.
We greatly appreciate Qifeng Lu of the CEMC for providing valuable and stimulating comments. We also thank Na Liu of the National Meteorological Information Centre for her helpful suggestions on how to correctly use the radiation data and meteorological data. We wish to thank the reviewers and the editor for their valuable insights that helped greatly strengthen the manuscript.
This study was funded by the China Scholarship Council (grant no. 202205330024), the National Key Research and Development Program of China (grant no. 2017YFB0504002), the National Science and Technology Infrastructure Platform Project (2017), and the Special Fund for Basic Scientific Research of the Institute of Urban Meteorology (grant no. IUMKY201735).
This paper was edited by Stelios Kazadzis and reviewed by two anonymous referees.
Alados, I., Foyo-Moreno, I., and Alados-Arboledas, L.: Estimation of downwelling longwave irradiance under all-sky conditions, Int. J. Climatol., 32, 781–793, https://doi.org/10.1002/joc.2307, 2012.
Anderson, E. R.: Energy budget studies, water loss investigations: LakeHefner studies, Technical Report, U.S. Geol. Surv. Prof. Pap., 269, 71–119, 1954.
Ångström, A.: A study of the radiation of the atmosphere, Smithsonian Miscellaneous Collection, 65, 1–159, 1915.
Berdahl, P. and Fromberg, R.: The thermal radiance of clear skies, Sol. Energy, 29, 299–314, https://doi.org/10.1016/0038-092X(82)90245-6, 1982.
Berdahl, P. and Martin, M.: Emissivity of clear skies, Sol. Energy, 32, 663–664, https://doi.org/10.1016/0038-092X(84)90144-0, 1984.
Berger, X., Buriot, D., and Garnier, F.: About the equivalent radiative temperature for clear skies, Sol. Energy, 32, 725–733, https://doi.org/10.1016/0038-092X(84)90247-0, 1984.
Bilbao, J. and De Miguel, A. H.: Estimation of daylight downward longwave atmospheric irradiance under clear-sky and all-sky conditions, J. Appl. Meteorol. Clim., 46, 878–889, https://doi.org/10.1175/JAM2503.1, 2007.
Brunt, D.: Notes on radiation in the atmosphere, Q. J. Roy. Meteor. Soc., 58, 389–418, https://doi.org/10.1002/qj.49705824704, 1932.
Brutsaert, W.: On a derivable formula for long-wave radiation from clear skies, Water Resour. Res., 11, 742–744, https://doi.org/10.1029/WR011i005p00742, 1975.
Carmona, F., Rivas, R., and Caselles, V.: Estimation of daytime downward longwave radiation under clear and cloudy skies conditions over a sub-humid region, Theor. Appl. Climatol., 115, 281–295, https://doi.org/10.1007/s00704-013-0891-3, 2014.
Choi, M., Jacobs, J. M., and Kustas, W. P.: Assessment of clear and cloudy sky parameterizations for daily downwelling longwave radiation over different land surfaces in Florida, USA, Geophys. Res. Lett., 35, L20402, https://doi.org/10.1029/2008GL035731, 2008.
Crawford, T. M. and Duchon, C. E.: An improved parameterization for estimating effective atmospheric emissivity for use in calculating daytime downwelling longwave radiation, J. Appl. Meteorol., 38, 474–480, 1999.
Culf, A. D. and Gash, J. H.: Longwave radiation from clear skies in Niger: a comparison of observations with simple formulas, J. Appl. Meteorol., 32, 539–547, https://doi.org/10.1175/1520-0450(1993)032<0539:LRFCSI>2.0.CO;2, 1993.
DeCoster, M. and Schuepp, W.: Measures de rayonnement effectif à Leopoldville, Acad. Roy. Sci. Colon. Brussels Bull. Seances, 3, 642–651, 1957.
Driemel, A., Augustine, J., Behrens, K., Colle, S., Cox, C., Cuevas-Agulló, E., Denn, F. M., Duprat, T., Fukuda, M., Grobe, H., Haeffelin, M., Hodges, G., Hyett, N., Ijima, O., Kallis, A., Knap, W., Kustov, V., Long, C. N., Longenecker, D., Lupi, A., Maturilli, M., Mimouni, M., Ntsangwane, L., Ogihara, H., Olano, X., Olefs, M., Omori, M., Passamani, L., Pereira, E. B., Schmithüsen, H., Schumacher, S., Sieger, R., Tamlyn, J., Vogt, R., Vuilleumier, L., Xia, X., Ohmura, A., and König-Langlo, G.: Baseline Surface Radiation Network (BSRN): structure and data description (1992–2017), Earth Syst. Sci. Data, 10, 1491–1501, https://doi.org/10.5194/essd-10-1491-2018, 2018.
Duarte, H. F., Dias, N. L., and Maggiotto, S. R.: Assessing daytime downward longwave radiation estimates for clear and cloudy skies in Southern Brazil, Agr. Forest. Meteorol., 139, 171–181, https://doi.org/10.1016/j.agrformet.2006.06.008, 2006.
Fang, S. X., Zhou, L. X., Tans, P. P., Ciais, P., Steinbacher, M., Xu, L., and Luan, T.: In situ measurement of atmospheric CO2 at the four WMO/GAW stations in China, Atmos. Chem. Phys., 14, 2541–2554, https://doi.org/10.5194/acp-14-2541-2014, 2014.
Gabathuler, M., Marty, C. A., and Hanselmann, K. W.: Parameterization of incoming longwave radiation in high-mountain environments, Phys. Geogr., 22, 99–114, https://doi.org/10.1080/02723646.2001.10642732, 2001.
Goss, J. R. and Brooks, F. A.: Constants for empirical expressions for downcoming atmospheric radiation under cloudless sky, J. Meteorol., 13, 482–488, 1956.
Gröbner, J., Reda, I., Wacker, S., Nyeki, S., Behrens, K., and Gorman, J.: A new absolute reference for atmospheric longwave irradiance measurements with traceability to SI units, J. Geophys. Res.-Atmos., 119, 7083–7090, https://doi.org/10.1002/2014JD021630, 2014.
Gubler, S., Gruber, S., and Purves, R. S.: Uncertainties of parameterized surface downward clear-sky shortwave and all-sky longwave radiation, Atmos. Chem. Phys., 12, 5077–5098, https://doi.org/10.5194/acp-12-5077-2012, 2012.
Heitor, A., Biga, A. J., and Rosa, R.: Thermal radiation components of the energy balance at the ground, Agr. Forest. Meteorol., 54, 29–48, https://doi.org/10.1016/0168-1923(91)90039-S, 1991.
Hua, H. X., Zhang, R. Q., Li, Z. H., and Tian, X.: Installation, application and maintenance of HY-WP1 intelligent weather observation instrument, Henan Sci. Tech., 31, 6–8, https://doi.org/10.3969/j.issn.1003-5168.2021.31.011, 2021 (in Chinese).
Hukseflux: User manual IR02 pyrgeometer with heater, User mannual, v2207, 1–43, Hukseflux Thermal Sensors B. V., Delftechpark 31, 2628 XJ Delft, the Netherlands, https://www.hukseflux.com/products/pyranometers-solar-radiation-sensors/pyrgeometers/ir02-pyrgeometer (last access: 11 April 2023), 2022.
Idso, S. B.: A set of equations for full spectrum and 8- to 14-µm and 10.5- to 12.5-µm thermal radiation from cloudless skies, Water Resour. Res., 17, 295–304, https://doi.org/10.1029/WR017i002p00295, 1981.
Idso, S. B. and Jackson, R. D.: Thermal radiation from the atmosphere, J. Geophy. Res., 74, 5397–5403, https://doi.org/10.1029/JC074i023p05397, 1969.
Iziomon, M. G., Mayer, H., and Matzarakis, A.: Downward atmospheric longwave irradiance under clear and cloudy skies: Measurement and parameterization, J. Atmos. Sol.-Terr. Phy., 65, 1107–1116, https://doi.org/10.1016/j.jastp.2003.07.007, 2003.
Kjaersgaard, J. H., Plauborg, F. L., and Hansen, S.: Comparison of models for calculating daytime long-wave irradiance using long term data set, Agr. Forest. Meteorol., 143, 49–63, https://doi.org/10.1016/j.agrformet.2006.11.007, 2007.
Konzelmann, T., van de Wal, R. S. W., Greuell, W., Bintanja, R., Henneken, E. A. C., and Abe-Ouchi, A.: Parameterization of global and longwave incoming radiation for the Greenland Ice Sheet, Global. Planet. Change, 9, 143–164, https://doi.org/10.1016/0921-8181(94)90013-2, 1994.
Li, F., Ji, C. L., Mo, Y. Q., and Guo, Z. J.: Examination and evaluation of integrality and rationality of China basic radiation station data, Plateau Meteorol., 32, 1203–1213, http://www.gyqx.ac.cn/CN/Y2013/V32/I4/1203 (last access: 11 April 2023), 2013 (in Chinese).
Li, M. Y., Jiang, Y. J., and Coimbra, C. F. M.: On the determination of atmospheric longwave irradiance under all-sky conditions, Sol. Energy, 144, 40–48, https://doi.org/10.1016/j.solener.2017.01.006, 2017.
Liu, M., Zheng, X., Zhang, J., and Xia, X.: A revisiting of the parametrization of downward longwave radiation in summer over the Tibetan Plateau based on high-temporal-resolution measurements, Atmos. Chem. Phys., 20, 4415–4426, https://doi.org/10.5194/acp-20-4415-2020, 2020.
Liu, Y. L., Ren, G. Y., Zhang, G. Y., and Yu, H. M.: Response of surface air temperature to micro-environmental change: Results from Mohe parallel observation experiment, Meteorol. Sci. Tech., 46, 215–223, https://doi.org/10.19517/j.1671-6345.20170200, 2018.
Marthews, T. R., Malhi, Y., and Iwata, H.: Calculating downward longwave radiation under clear and cloudy conditions over a tropical lowland forest site: an evaluation of model schemes for hourly data, Theor. Appl. Climatol., 107, 461–477, https://doi.org/10.1007/s00704-011-0486-9, 2012.
Maykut, G. A. and Church, P. E.: Radiation climate of Barrow, Alaska, 1962–1966, J. Appl. Meteorol., 12, 620–628, https://doi.org/10.1175/1520-0450(1973)012<0620:RCOBA>2.0.CO;2, 1973.
Monteith, J. L.: An empirical method for estimating long-wave radiation exchange in the British Isles, Q. J. Roy. Meteor. Soc., 87, 171–179, https://doi.org/10.1002/qj.49708837615, 1961.
Niemelä, S., Räisänen, P., and Savijärvi, H.: Comparison of surface radiative flux parameterizations Part I: Longwave radiation, Atmos. Res., 58, 1–18, https://doi.org/10.1016/S0169-8095(01)00084-9, 2001.
Ohmura, A.: Physical basis for the temperature-based melt-index method, J. Appl. Meteorol., 40, 753–761, https://doi.org/10.1175/1520-0450(2001)040<0753:PBFTTB>2.0.CO;2, 2001.
PMOD/WRC: Annual report 2021, 68 pp., Davos, Switzerland, https://www.pmodwrc.ch/wp-content/uploads/2022/06/2021_PMODWRC_Annual_Report.pdf, last access: 12 September 2022.
Prata, A. J.: A new long-wave formula for estimating downward clear-sky radiation at the surface, Q. J. Roy. Meteor. Soc., 122, 1127–1151, https://doi.org/10.1002/qj.49712253306, 1996.
Rodgers, C. D.: The use of emissivity in atmospheric radiation calculations, Q. J. Roy. Meteor. Soc., 93, 43–54, https://doi.org/10.1002/qj.49709339504, 1967.
Ruckstuhl, C., Philipona, R., Morland, J., and Ohmura, A.: Observed relationship between surface specific humidity, integrated water vapor, and longwave downward radiation at different altitudes, J. Geophy. Res., 112, D03302, https://doi.org/10.1029/2006JD007850, 2007.
Satterlund, D. R.: An improved equation for estimating longwave radiation from the atmosphere, Water Resour. Res., 15, 1649–1650, https://doi.org/10.1029/wr015i006p01649, 1979.
Sridhar, V. and Elliott, R. L.: On the development of a simple downwelling longwave radiation scheme, Agr. Forest. Meteorol., 112, 237–243, https://doi.org/10.1016/S0168-1923(02)00129-6, 2002.
Staley, D. O. and Jurica, G. M.: Effective atmospheric emissivity under clear skies, J. Appl. Meteorol., 11, 349–356, https://doi.org/10.1175/1520-0450(1972)011<0349:EAEUCS>2.0.CO;2, 1972.
Stephens, G. L., Wild, M., Stackhouse Jr, P. W., L'Ecuyer, T., Kato, S., and Henderson, D. S.: The global character of the flux of downward longwave radiation, J. Climate, 25, 2329–2340, https://doi.org/10.1175/jcli-d-11-00262.1, 2012.
Swinbank, W. C.: Long-wave radiation from clear skies, Q. J. Roy. Meteor. Soc., 89, 339–348, https://doi.org/10.1002/qj.49708938105, 1963.
Wang, K. C. and Liang, S. L.: Global atmospheric downward longwave radiation over land surface under all-sky conditions from 1973 to 2008, J. Geophys. Res., 114, D19101, https://doi.org/10.1029/2009JD011800, 2009.
Weng, D. M., Sun, Z. A., and Wen, Z. Z.: Climatological study on downward atmospheric radiation in China, J. Nanjing Inst. Meteorol., 16, 1–5, https://doi.org/10.13878/j.cnki.dqkxxb.1993.01.001, 1993 (in Chinese).
Wild, M. and Cechet, R.: Downward longwave radiation in general circulation models: a case study at a semi-arid continental site, Tellus, 54, 330–337, https://doi.org/10.3402/tellusa.v54i4.12149, 2002.
Yang, J. and Quan, W.: Hourly dataset of downward longwave radiation at CBSRN, Zenodo [data set], https://doi.org/10.5281/zenodo.7715651, 2023a.
Yang, J. and Quan, W.: Brief introduction to parameterization of downward longwave radiation based on long-term baseline surface radiation measurements in China, Zenodo [data set, video], https://doi.org/10.5281/zenodo.7715765, 2023b.
Zhou, H. G., Quan, W. J., Wang, Z. F., Li, X. L., Li, Y. R., and Zhao, H. J.: Comparison of sunshine duration measurements between a Jordan sunshine recorder and three automatic sensors at Shangdianzi GAW station, J. Meteorol. Res., 35, 716–728, https://doi.org/10.1007/s13351-021-0158-3, 2021.
Zhu, M. L., Yao, T. D., Yang, W., Xu, B. Q., and Wang, X. J.: Evaluation of parameterizations of incoming longwave radiation in the high-mountain region of the Tibetan Plateau, J. Appl. Meteorol. Clim., 56, 833–848, https://doi.org/10.1175/JAMC-D-16-0189.1, 2017.