the Creative Commons Attribution 4.0 License.
the Creative Commons Attribution 4.0 License.
 | 06 Apr 2023
Nitrate chemistry in the northeast US – Part 1: Nitrogen isotope seasonality tracks nitrate formation chemistry
Claire Bekker
Wendell W. Walters
Lee T. Murray
Meredith G. Hastings
Despite significant precursor emission reductions in the US over recent decades, atmospheric nitrate deposition remains an important terrestrial stressor. Here, we utilized statistical air mass back trajectory analysis and nitrogen stable isotope deltas (δ(15N)) to investigate atmospheric nitrate spatiotemporal trends in the northeastern US from samples collected at three US EPA Clean Air Status and Trends Network (CASTNET) sites from December 2016–2018. For the considered sites, similar seasonal patterns in nitric acid (HNO3) and particulate nitrate (pNO3) concentrations were observed with spatial differences attributed to nitrogen oxide (NOx) emission densities in source contributing regions that were typically ≤ 1000 km. Significant spatiotemporal δ(15N) variabilities in HNO3 and pNO3 were observed with higher values during winter relative to summer, like previous reports from CASTNET samples collected in the early 2000s for our study region. In the early 2000s, δ(15N) of atmospheric nitrate in the northeast US had been suggested to be driven by NOx emissions; however, we did not find significant spatiotemporal changes in the modeled NOx emissions by sector and fuel type or δ(15N, NOx) for the source regions of the CASTNET sites. Instead, the seasonal and spatial differences in the observed δ(15N) of atmospheric nitrate were driven by nitrate formation pathways (i.e., homogeneous reactions of NO2 oxidation via hydroxyl radical or heterogeneous reactions of dinitrogen pentoxide on wetted aerosol surfaces) and their associated δ(15N) fractionation. Under the field conditions of low NOx relative to O3 concentrations and when δ(15N, NOx) emission sources do not have significant variability, we demonstrate that δ(15N) of atmospheric nitrate can be a robust tracer for diagnosing nitrate formation.
- Article
(5643 KB) - Full-text XML
- Companion paper
- BibTeX
- EndNote


Nitrogen oxides (NOx = NO + NO2) are a significant source of air pollution derived from electricity generation, industrial processes, vehicle emissions, biomass burning, lightning, and microbial activity in soils (Jaeglé et al., 2018, 2005; Delmas et al., 1997). NOx emissions have an important impact on climate and human and ecosystem health due to their influence on atmospheric oxidation chemistry and production of total atmospheric nitrate (tNO3 = nitric acid (HNO3) + particulate nitrate (pNO3)) (Galloway et al., 2004; Zhang et al., 2003; Frost et al., 2006; Pinder et al., 2012). NOx chemistry facilitates the production of atmospheric oxidants, including ozone (O3) and hydrogen oxide radicals (HOx = OH + HO2), which defines the tropospheric oxidation capacity (Bloss et al., 2005; Prinn, 2003). These oxidants play an important role in the removal of trace gases and formation of particulate matter, with important consequences for human health and climate (Bauer et al., 2007; Ehn et al., 2014; Pye et al., 2010). Particulate nitrate contributes to poor air quality and represents a significant portion of ambient fine particulate matter (PM2.5), negatively affecting the human respiratory and cardiovascular systems (Xing et al., 2016). Wet and dry deposition of tNO3 contributes bioavailable nitrogen to often sensitive ecosystems (Galloway et al., 2004; Greaver et al., 2016; Pinder et al., 2012; Walker et al., 2019). In the US, NOx emissions from power plants and vehicles have dramatically declined over the last several decades due to effective regulations (Hand et al., 2014). Yet, atmospheric nitrogen deposition remains a major terrestrial stressor, which has important implications for land and water quality and interacting effects with climate (Greaver et al., 2016).
Previous studies have suggested that stable nitrogen isotope deltas may be a powerful observational constraint to enhance our understanding of atmospheric nitrate sources and/or chemical processing (Elliott et al., 2009, 2007; Beyn et al., 2014, 2015; Freyer, 1991; Savard et al., 2017; Savarino et al., 2013; Vicars et al., 2013; Chang et al., 2019; Li et al., 2019; Zong et al., 2017; Hastings et al., 2009; Geng et al., 2014). Precursor NOx emission sources tend to have distinct δ(15N) values (or “fingerprints”) dependent on formation mechanisms (Miller et al., 2017, 2018; Felix et al., 2012; Walters et al., 2015a, b; Li and Wang, 2008; Yu and Elliott, 2017). For example, biogenic soil emissions tend to have low δ(15N, NOx) values of typically less than −25 ‰ (Miller et al., 2018; Yu and Elliott, 2017), stationary liquid fuel combustion has been measured to range between −19.7 ‰ to −13.9 ‰ (Walters et al., 2015a), on-road vehicle plumes have been measured to have a range of −9 ‰ to −2 ‰ (Miller et al., 2017), and coal combustion tends to have elevated values with a range of 9.8 ‰ to 19.8 ‰ (Felix et al., 2012). If these δ(15N) emission source signatures are proportionally transferred into atmospheric nitrate, it can be a useful observational constraint for tracking precursor NOx emission sources to spatiotemporal deposition patterns (Hastings et al., 2013). However, chemical and physical processing associated with NOx cycling and formation of atmospheric nitrate can also induce significant isotope fractionation, such that δ(15N) may not be conserved from emission to deposition (Freyer, 1991; Freyer et al., 1993; Walters et al., 2016; Walters and Michalski, 2015a; Li et al., 2020; Walters and Michalski, 2016a; Vicars et al., 2013). These δ(15N) fractionations are associated with equilibrium isotope effects (EIEs), unidirectional kinetic isotope effects (KIEs), and photo-induced fractionation isotope effects (PHIEs) (Freyer, 1991; Freyer et al., 1993; Walters et al., 2016; Walters and Michalski, 2015a; Li et al., 2020; Walters and Michalski, 2016a; Fang et al., 2021). Accounting for these isotope effects is important for δ(15N) to be used as a quantitative tracker of precursor emission sources (Li et al., 2020; Vicars et al., 2013; Fang et al., 2021; Walters et al., 2018; Savarino et al., 2013; Chang et al., 2018, 2019; Feng et al., 2020).
The northeastern US remains important to monitor due to its high population density, transport patterns, historically degraded air quality, and elevated acid deposition influenced by NOx emissions and transformations (Sickles and Shadwick, 2015). Previous landmark δ(15N) studies of atmospheric nitrate in this region have reported significant correlations between concentration and δ(15N) of atmospheric nitrate in wet (National Atmospheric Deposition Program; NADP) and dry deposition (Clean Air Status and Trends Network; CASTNET) samples with regional stationary NOx emission sources from power plant and industrial sectors in the mid-2000s (Elliott et al., 2007, 2009). Considering dramatic NOx emission changes over the past decades, it is critical to update our understanding of atmospheric tNO3 deposition's precursor sources and drivers in polluted regions such as the northeastern US. Furthermore, our understanding of δ(15N, NOx) emission signatures and δ(15N) isotope fractionation patterns has significantly improved in recent years. In this study, we have measured the δ(15N) compositions of HNO3 and pNO3 from CASTNET samples collected in the northeastern US from December 2016 to 2018. Our study contributes to an update on the spatiotemporal δ(15N) compositions and interpretation of atmospheric tNO3 in the northeastern US and our understanding of the concentration and δ(15N) drivers of atmospheric tNO3 after a period of aggressive NOx emission reductions.
2.1 CASTNET filter samples
Filter samples from December 2016 to 2018 were obtained from the US EPA CASTNET program for several sites in the northeastern US, including (from west to east) Connecticut Hill, NY (CTH110; 42.40∘ N, −76.65∘ W; Elevation = 511 m); Abington, CT (ABT147; 41.84∘ N, −72.01∘ W; Elevation = 202 m); and Woodstock, NH (WST109; 43.94∘ N, −71.70∘ W; Elevation = 255 m) (Fig. 1). The CASTNET sites were characterized by their primary land use as forest for CTH110, urban/agricultural for ABT147, and forest for WST109, respectively (CASTNET Site Locations, 2023). CASTNET is a national monitoring program sponsored by the US EPA to assess spatiotemporal trends in pollutant concentrations and atmospheric deposition. The CASTNET monitoring locations have been sited to avoid the influence of major cities, highways, local activities, and point source pollution and are expected to be regionally representative (Clarke et al., 1997).
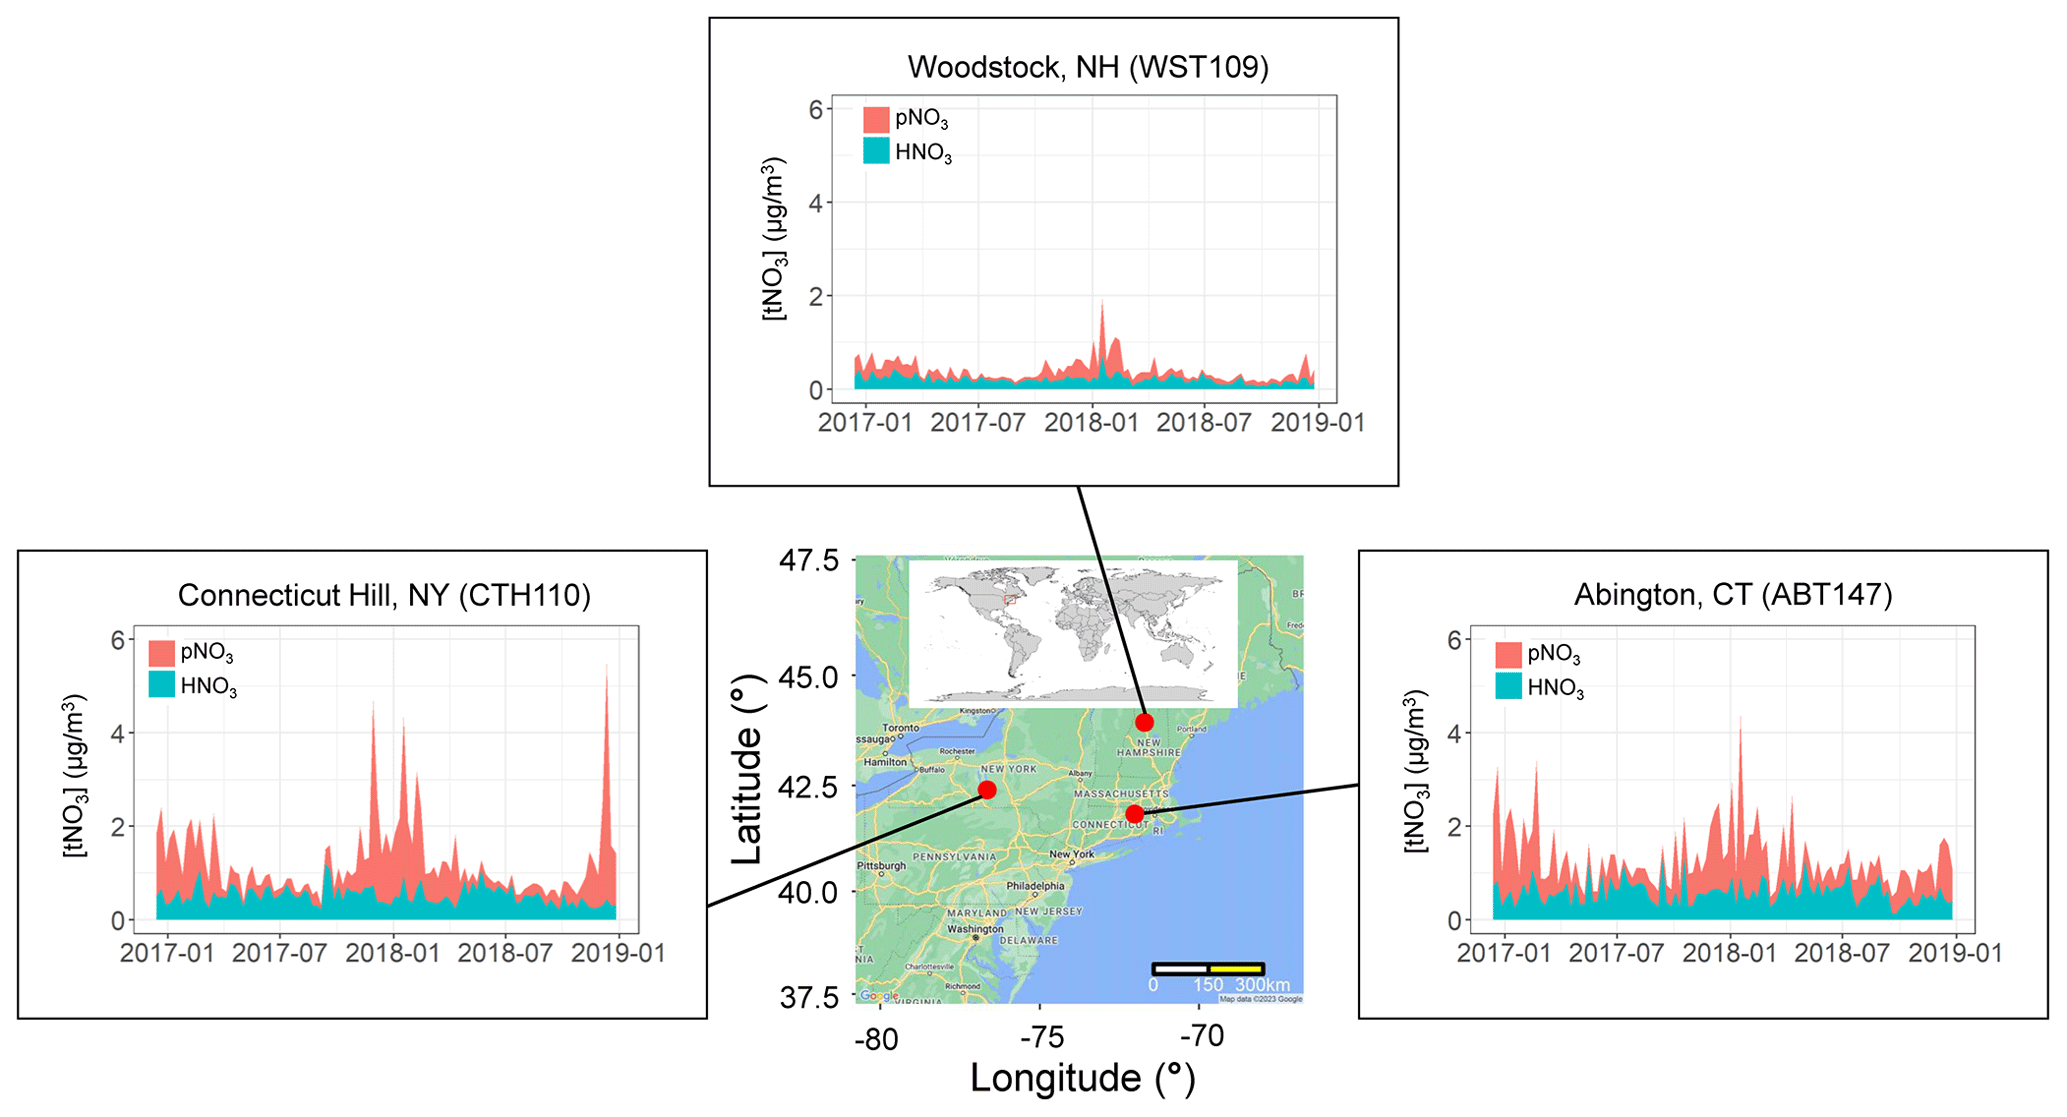
Figure 1Location and nitrate concentrations (nitric acid (HNO3), particulate nitrate (pNO3), and total nitrate (tNO3 = HNO3 + pNO3)) from December 2016–2018 of the three northeastern CASTNET monitoring sites included in the study. The map was created using Google Maps (Map data © 2022 Google).
The CASTNET sampling protocols have been previously described (Baumgardner et al., 2002). The atmospheric samples consist of week-long integrated collections using a three-stage filter pack. The filter pack contains three types of filters in sequence: (1) a Teflon filter (Whatman membrane filter, 47 mm diameter, 1.0 µm pore size) for particulate collection, including pNO3; (2) a nylon filter (before January 2018: Pall Corporation Nylasorb, 47 mm diameter, 1.0 µm pore size; after January 2018: One Measurement Technology Laboratories, 47 mm diameter, 1.0 µm pore size) for acidic gas collections, including HNO3; and (3) two potassium carbonate (K2CO3) impregnated cellulose filters (Whatman 41 Ashless Circle filter) for SO2 collection. The filter pack sampling system is characterized as “open faced”, because a size-selective inlet is not used. The filter packs are prepared and shipped to the field weekly. The filter packs are exchanged at the sampling sites every Tuesday and shipped to the analytical chemistry laboratory for analysis. Blank filter packs are prepared quarterly to evaluate contamination. The filter pack samples are collected at 10 m, and the filter pack flow rate is maintained at 1.50 L min−1 at standard conditions. The filters were extracted and analyzed for concentrations following standardized protocols at the Wood Gainesville, FL, US laboratory. Briefly, the filters were extracted using 25 mL of ultra-high purity water (> 18.2 MΩ), and the Teflon and nylon filter extracts were measured using a micro membrane-suppressed ion chromatography to determine NO(aq) concentrations, which were utilized to calculate the concentration of pNO3 and HNO3 in the air (µg m−3) based on the volume of collected air. Following this analysis, the samples were stored in a laboratory at room temperature for up to 2 years until shipment to Brown University.
To determine the stability of the sample extracts during storage and shipment, the filter extracts were re-measured for the total concentrations of nitrate (NO(aq)) and nitrite (NO(aq)) utilizing standard colorimetric methods (i.e., US EPA Method 353.2) on an automated discrete UV-Vis Analyzer (SmartChem Westco Scientific Instruments, Inc.) once at Brown University. The detection limit was 0.1 and 0.3 µM for NO(aq) and NO(aq), respectively, and the pooled relative standard deviation of replicate quality control standards was better than 3 %. The nitrate concentrations reported by CASTNET were compared to our measured concentrations and gave a near 1:1 relationship for all sites and both filter types (nylon filter: ; r=0.994; p<0.01; Teflon filter: ; r=0.997; p<0.01) indicating excellent NO(aq) stability in the filter extracts (Fig. 2). Additionally, the mean absolute difference and the mean percent difference between the re-measured and reported NO(aq) concentrations were (0.31 ± 0.36 µM; ± σ) and (10.4 ± 13.3 %), respectively (n=632). Equal volumes of 4-weekly collected filter extracts were combined into approximately monthly aggregates to provide sub-seasonal resolution of nitrogen isotope analysis for HNO3 and pNO3. Samples were combined into month aggregates to meet the typical mass requirements for isotope analysis, requiring 20 nmol for δ(15N) and δ(18O) and 50 nmol for Δ(17O) quantification. For samples where [NO] > 0.1 µM, NO(aq) was removed using a sulfamic acid treatment (Granger and Sigman, 2009), as it will cause interference when measuring the nitrogen and oxygen isotope ratios of the nitrate (see below). The samples were then frozen until subsequent isotopic analysis.
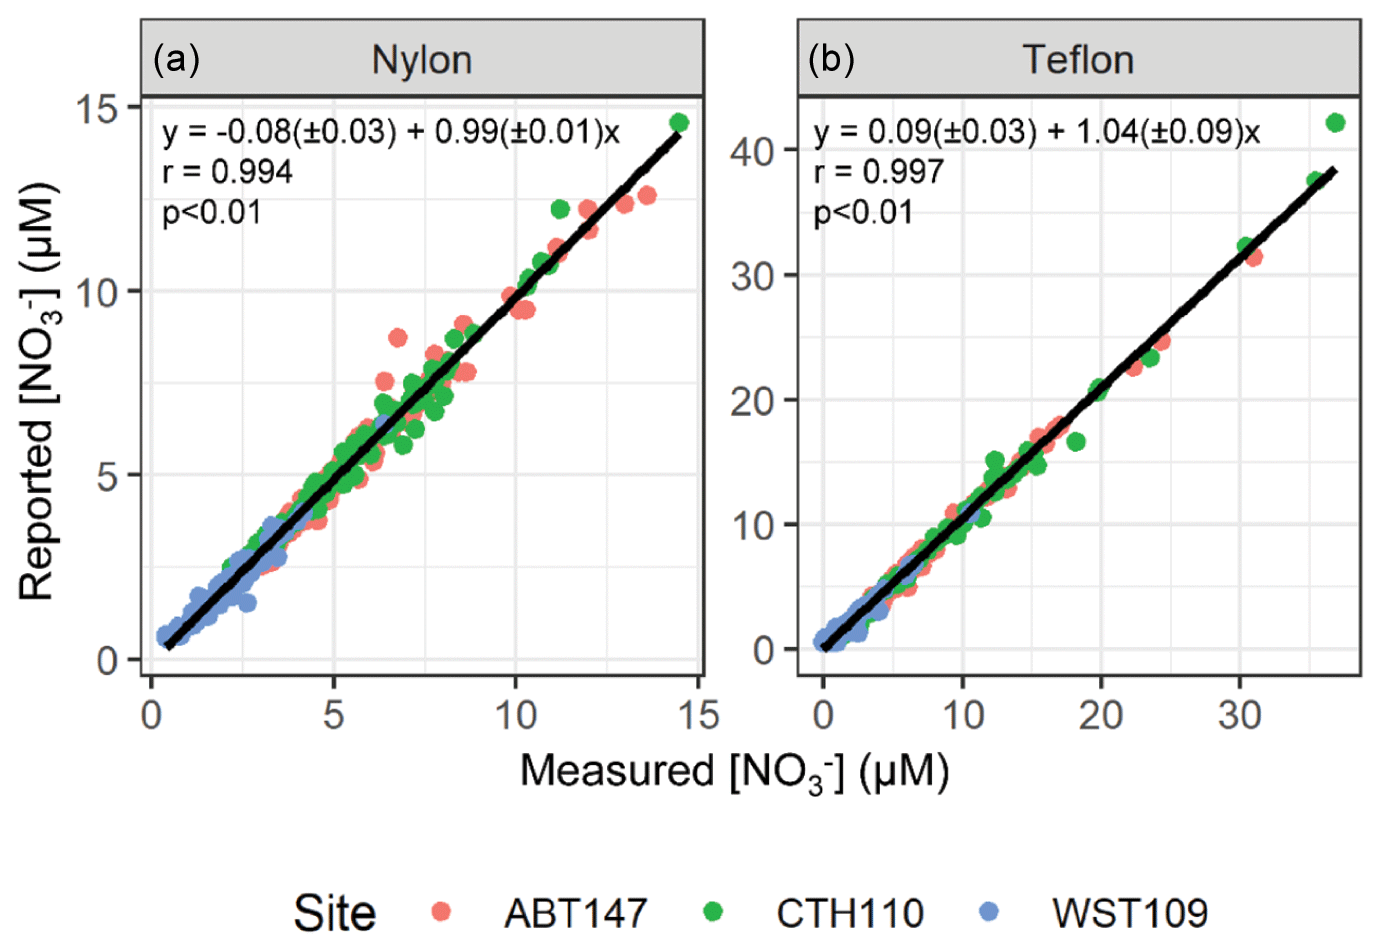
Figure 2Comparison between the nitrate (NO) concentrations reported by CASTNET with those measured at Brown University for the nylon filter (a) and Teflon filter (b) extracts.
2.2 Isotopic analysis
Nitrogen stable isotopic analysis was conducted for HNO3 and pNO3 from the monthly aggregated filter extracts using the well-established bacterial denitrifier method (Sigman et al., 2001; Casciotti et al., 2002). Briefly, samples were injected into vials containing Pseudomonas aureofaciens, which lacks the N2O reductase enzyme, such that NO (and NO) are quantitatively converted to nitrous oxide (N2O). The generated N2O was concentrated and purified using an automatic purge and trap system and introduced to a continuous flow isotope ratio mass spectrometer (CF-IRMS; Thermo Scientific Delta V) with a modified gas bench interface at Brown University. Measurement of N2O was conducted at of 44, 45, and 46 to determine δ(15N), and unknowns were corrected relative to internationally recognized nitrate salt reference materials that included USGS34 (δ(15N) = −1.8 ‰), USGS35 (δ(15N) = 2.7 ‰), and IAEA-N3 (δ(15N) = 4.7 ‰) (Böhlke et al., 1993, 2003). We acknowledge that the δ(15N) range of the nitrate reference material is relatively narrow; however, the range of our calibrated unknowns was quite near these values (calibrated unknowns ranged from −10.6 ‰ to 5.8 ‰ and averaged −1.7 ± 3.7 ‰; n=158). Thus, while some of the unknowns will have a calibrated δ(15N) extrapolated from the reference materials, we do not anticipate this to impact our measurement accuracy and precision or the interpretation of the results. Isobaric influences from 17O contributions were corrected based on a separate analysis, in which N2O was thermally decomposed to O2 by passing through a gold tube heated to 770 ∘C. The generated O2 was introduced to a CF-IRMS (Thermo Scientific Delta V) and measured at 32, 33, and 34 for Δ(17O) (defined as Δ(17O) = δ(17O) − 0.52×δ(18O)) determination (Kaiser et al., 2007). This correction resulted in a δ(15N) decrease typically near 1.5 ‰. All isotopic reference materials were diluted to similar concentrations as samples and run intermittently in each batch analysis. The overall standard deviations of isotopic reference materials were σ(δ(15N))=0.2 ‰ (n=13), 0.4 ‰ (n=13), and 0.2 ‰ (n=15) for USGS34, USGS35, and IAEA-N3, respectively.
2.3 HYSPLIT modeling and “openair” package
Air mass back trajectories were computed using the HYSPLIT model and the North American Regional Reanalysis (NARR) 12 km dataset (Stein et al., 2015). The 72 h back trajectories were calculated at 50 m above ground level every other day for each site (CTH110, ABT147 and WST109) across the sample collection period from December 2016 to 2018. The trajectory data were collated with the reported CASTNET concentration data (pNO3, HNO3, and tNO3) at a weekly resolution to link concentration trends to the source regions for nitrate. Using the “openair” program package in R (Carslaw and Ropkins, 2012), geospatial statistical analysis that included back-trajectory clustering and the concentrated weighted trajectory (CWT) algorithm was conducted to determine patterns of transport and major contributing source regions for atmospheric nitrate. The CWT model is a statistical tool that utilizes the air mass residence time analysis to identify emission source regions (Hsu et al., 2003; Salamalikis et al., 2015; Cheng et al., 2013; Dimitriou et al., 2015). For each grid cell, CWT calculates the concentration of a pollutant as the following (Eq. 1):
where i and j are the indices of grid, k is the index of trajectory, N is the total number of trajectories used in the analysis, ck is the pollutant concentration measured upon arrival of trajectory k, and tijk is the residence time of trajectory k in grid cell (i,j). A high value of means that air parcels that pass over the cell (i,j) would, on average, cause a high concentration at the receptor site (Carslaw and Ropkins, 2012).
2.4 NOx emissions database and δ15N(NOx) estimation
Monthly anthropogenic NOx emission density estimates were extracted from a recent sector and fuel-based emission inventory to understand how precursor NOx emissions contribute to nitrate concentration and isotope trends (McDuffie et al., 2020). The monthly NOx emissions data were reported in gridded units divided into 11 anthropogenic sectors: agriculture, energy production, industry, on-road transportation, non-road transportation, combustion-residential, combustion-commercial, combustion-other, shipping, solvents, and waste (note that solvents are not a source of NOx emissions). The combustion sector emissions were further broken down into fuel types (coal, solid biofuel, and liquid fuel), while non-combustion emissions were assigned to a single “process” fuel type. Monthly NOx emission density estimates by sector and fuel-type data were extracted from the nitrate source regions determined from the CWT analysis. The regions were defined using spatial polygons in “R”, which sets latitude and longitude coordinates to retrieve spatially encoded data. Monthly δ(15N, NOx) was modeled based on isotope mass balance using the fraction of NOx emissions by sector and fuel type and previously reported δ(15N, NOx) emission signatures following a previously described method (Eq. 2) (Walters et al., 2015a):
where δi is the emission signature of source and fi is the fraction contributing to the NOx emissions. The considered δ(15N, NOx) emission signatures included grouped agriculture and waste (Miller et al., 2018), on-road transportation (Miller et al., 2017), non-road transportation (Walters et al., 2015a), and shipping (Walters et al., 2015a). Energy production, industry, and combustion were grouped by fuel type as either combustion – coal & solid biofuel (Felix et al., 2012) or combustion – liquid fuel & process (Walters et al., 2015a). The emission inventory only considers anthropogenic NOx emissions such that natural emissions such as lightning and wildfires were not considered. Table 1 summarizes the δ(15N, NOx) emission signatures (Walters et al., 2015a; Miller et al., 2018, 2017; Felix et al., 2012).
Table 1Summary of δ(15N, NOx) emission source values.
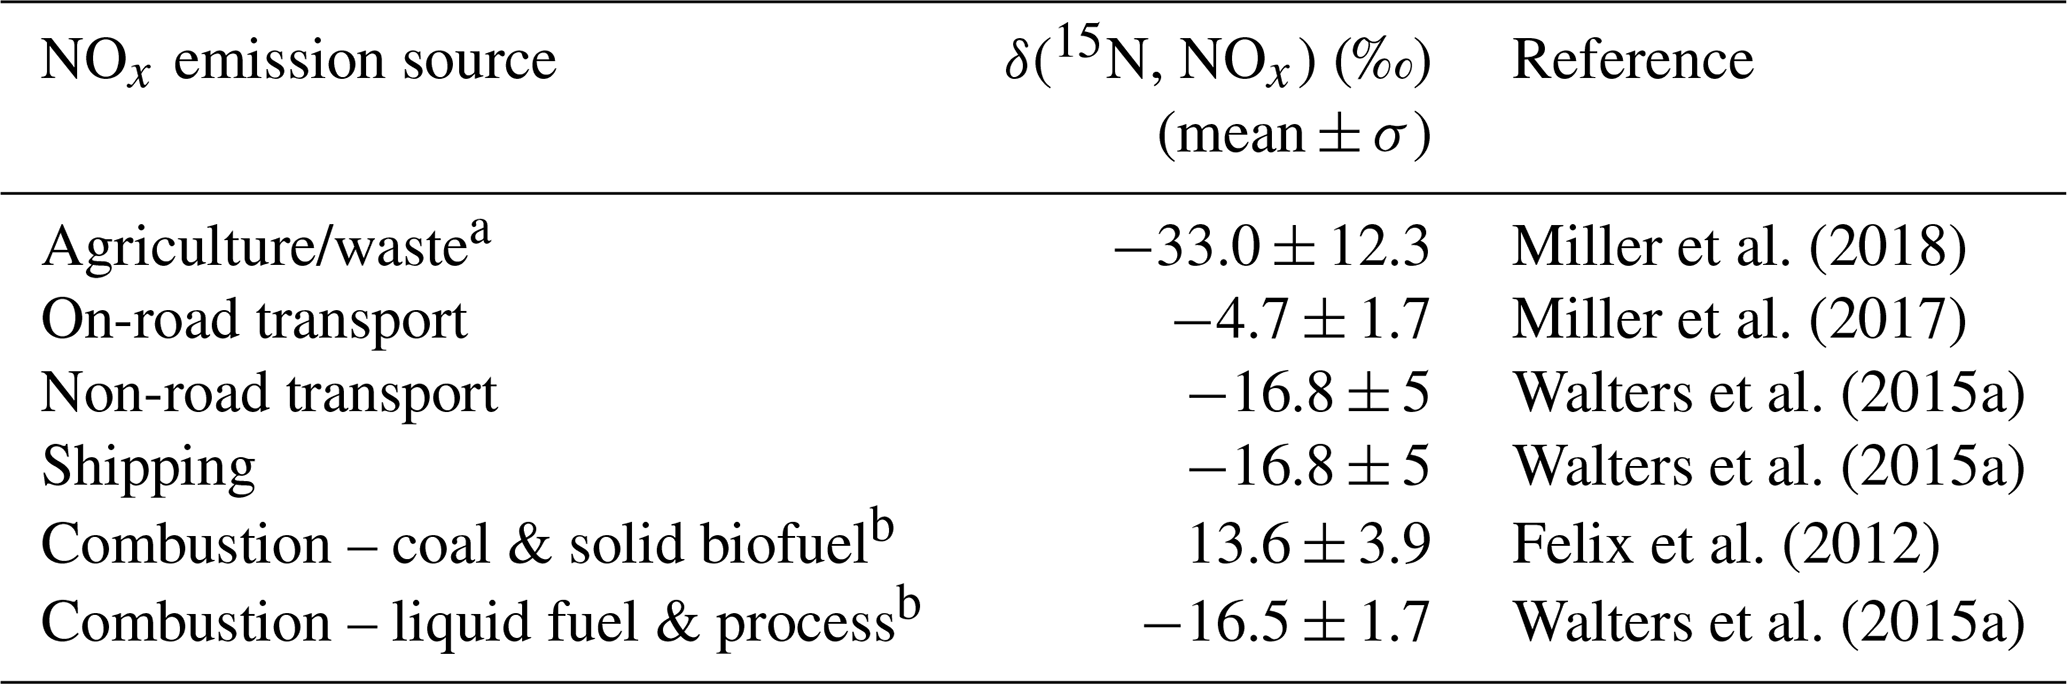
a Waste NOx emissions represented < 1 % of total monthly NOx emissions within each identified nitrate source region and were lumped with agricultural NOx emissions. b Combustion-residential, combustion-commercial, and combustion-other were combined (Combustion) and separated by fuel type (i.e., Combustion – coal & Solid Biofuel & Combustion – liquid fuel & process). The “process” combustion emissions were assumed to have a similar δ(15N, NOx) value as liquid fuel.
2.5 GEOS-Chem simulations
The GEOS-Chem global model of atmospheric chemistry (http://www.geos-chem.org, last access: 22 September 2022) was utilized to predict NOx and O3 concentrations in the regions of the various CASTNET sites (Bey et al., 2001; Walker et al., 2012, 2019). The model was utilized to account for δ(15N) isotope fractionation that occurs during chemical reactions. We use version 13.2.1 (http://wiki.seas.harvard.edu/geos-chem/index.php/GEOS-Chem_13.2.1, last access: 22 September 2022) of the model driven by GEOS5-FP assimilated meteorology from the NASA Global Modeling and Assimilation Office (GMAO). A nested grid (0.25∘ latitude × 0.3125∘ longitude horizontal resolution; 25 km) simulation was conducted over the northeastern United States (97–60∘ W; 35–60∘ N) in 2017 and 2018. Boundary conditions were from global simulations performed at 4∘ latitude × 5∘ longitude horizontal resolution for the same years after a one-year initialization. Gas- and aerosol-phase chemistry was simulated using the default “fullchem” mechanism (Bates and Jacob, 2019; Wang et al., 2021). Inorganic gas and aerosol partitioning were conducted using version 2.2 of the ISORROPIA II thermodynamic equilibrium model (Fountoukis and Nenes, 2007). All default anthropogenic emissions were applied, which is primarily version 2.0 of the Community Emissions Data System (Hoesly et al., 2018) as previously implemented (McDuffie et al., 2020). Natural emissions respond to local meteorology and include biogenic volatile organic compounds from terrestrial plants and the ocean (Millet et al., 2010; Guenther et al., 2012; Hu et al., 2015; Breider et al., 2017), NOx from lightning and soil microbial activity (Murray et al., 2012; Hudman et al., 2012), mineral dust (Ridley et al., 2012), and sea salt (Jaeglé et al., 2011; Huang and Jaeglé, 2017). Biomass burning emissions were monthly means from version 4.1s of the Global Fire Emissions Database (GFED4.1s; van der Werf et al., 2017). Wet deposition for water-soluble aerosols is described by Liu et al. (2001) and by Amos et al. (2012) for gases. Dry deposition is based on the resistance-in-series scheme of Wesely and Lesht (1989).
3.1 Atmospheric nitrate spatiotemporal concentrations
The atmospheric nitrate concentrations (U.S. Environmental Protection Agency Clean Air Markets Division Clean Air Status and Trends Network, 2022) are shown in Fig. 1 and summarized in Table 2. The speciation of tNO3 concentration is important to evaluate due to HNO3 and pNO3 different atmospheric lifetime driven by deposition rates (Benedict et al., 2013). Due to a higher dry deposition rate, HNO3 has a shorter atmospheric lifetime of a few days (i.e., 1–3 d) relative to pNO3, which has a lifetime of several days (i.e., 5 to 15 d). Overall, the mean concentrations of the three examined northeastern US CASTNET sites were significantly different but showed similar seasonal trends. Lower nitrate concentrations at the Woodstock, NH, site compared to the other sites likely reflect the different amounts of NOx emissions and, thus, the amount of nitrate impacting the study sites. For example, the Woodstock, NH, site is relatively remote compared to the urban/agricultural characterization of Abington, CT, and Connecticut Hill, NY, which is directly downwind of the highly industrialized Ohio River valley and other midwestern cities. Across the sites, the annual concentrations of HNO3, pNO3, and tNO3 were significantly higher at Abington, CT, and Connecticut Hill, NY, than at Woodstock, NH (p<0.01). The concentrations were binned by season including winter (DJF), spring (MAM), summer (JJA), and autumn (SON), which indicated seasonal statistical differences at the considered CASTNET sites. The HNO3 concentrations were significantly greater during the winter for Woodstock, NH, than in other seasons (p<0.01). Additionally, HNO3 at Abington, CT, was significantly higher during summer than in autumn (p<0.01). There was no significant seasonal difference in HNO3 concentrations at Connecticut Hill, NY. At all three sites, the concentrations of pNO3 were greatest during the winter and lowest during the summer. These findings were consistent with previous reports of CASTNET samples in the northeastern and midwestern US collected from 2004 to 2005, in which pNO3 concentrations were highest in the winter and lowest in the summer and with little seasonal variation in HNO3 (Elliott et al., 2009). Thus, even as NOx emissions have dramatically decreased in the US by 38 % from 2005–2014 as evidenced from top-down global surface NOx observations (Miyazaki et al., 2017), the HNO3 and pNO3 seasonal trends in the northeast US have been retained.
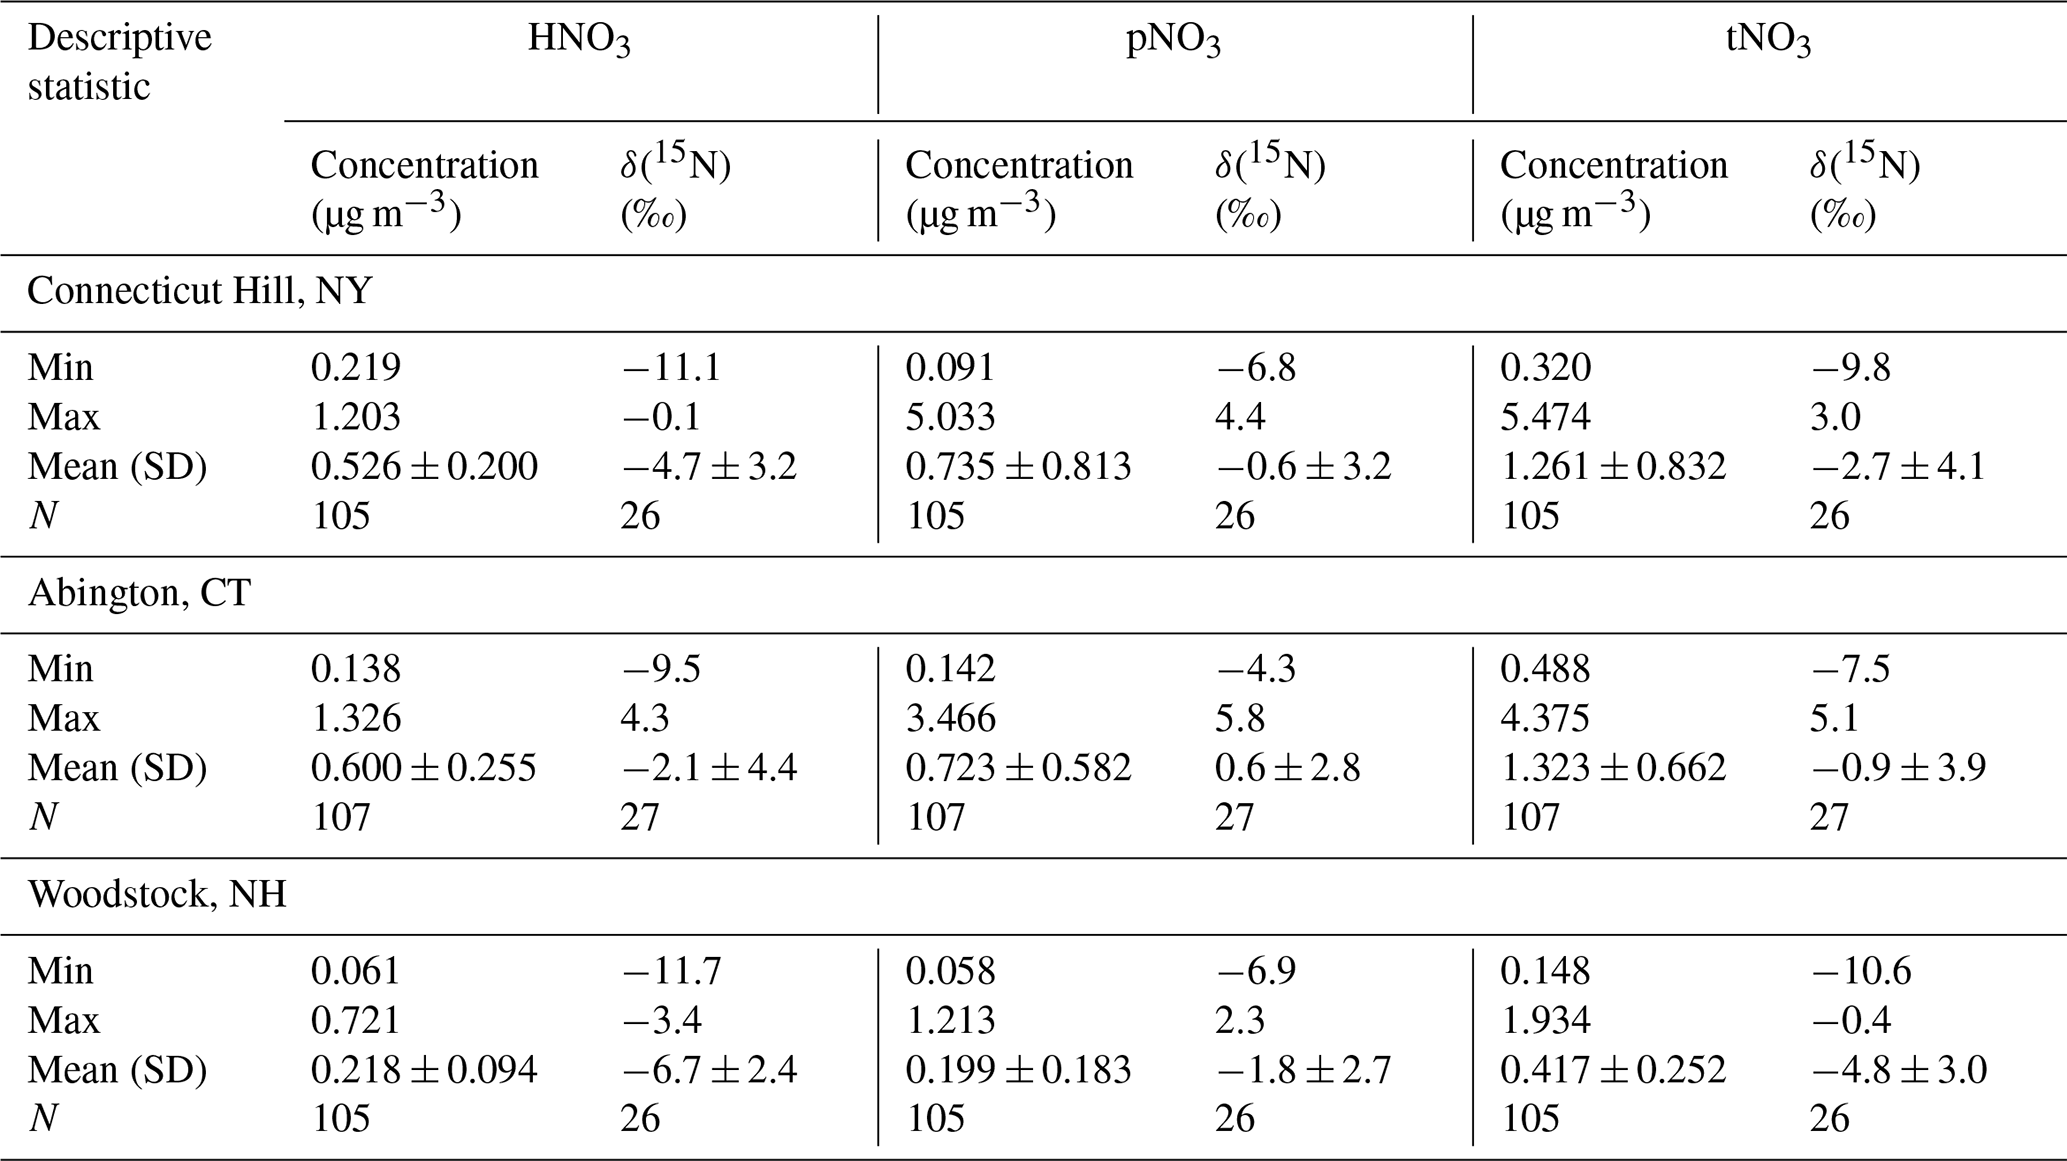
Table 2Statistical summary including minimum (Min), maximum (Max), mean (Mean), standard deviation (SD), and number of counts (N) for concentration and δ(15N) of HNO3, pNO3, and tNO3 at the CASTNET sites.
Clustered air mass back trajectories were calculated for the CASTNET sites (Fig. 3). The annual clustered trajectories indicate that most air masses were associated with westerlies with prevailing winds from the continental US and Canada for all the considered CASTNET sites. The clustered trajectories also indicate the influence of marine/coastal air masses and winds from the northeast. The CWT analysis of tNO3 concentrations indicated that contributing source regions tended to be within approximately 1000 km of the CASTNET sites (Fig. 3). Like the cluster trajectory results, the CWT analysis indicated that the tNO3 source contributing regions tended to extend towards the west and northwest of the CASTNET sites with minimal contributions east of the sites. Similar source regions were identified for the various CASTNET sites, but there were slight spatial differences due to the location of the sites, which likely impacted the nitrate concentration trends observed at the sites. For example, the source regions contributing to CTH110 tended to extend further from the Midwest compared to the other sites, and a higher relative contribution from southeast Canada was identified for the WST109 site.
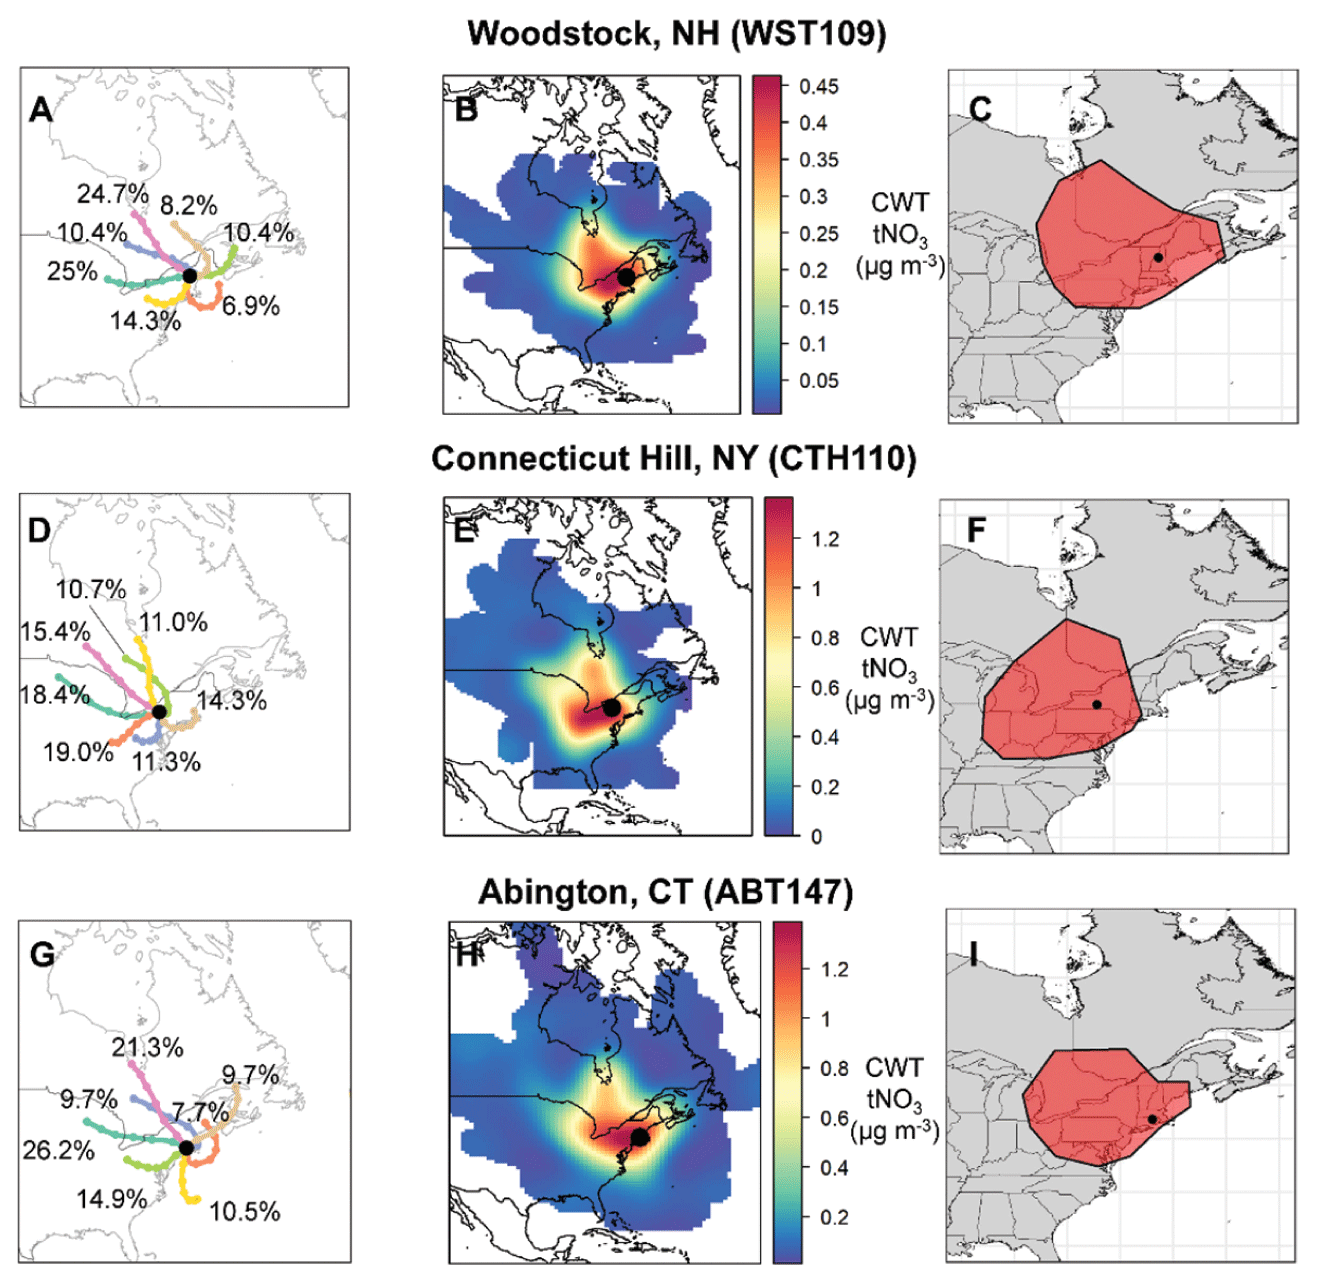
Figure 3Clustered air mass back trajectories (a, d, g), total nitrate (tNO3 = HNO3 + pNO3) concentration weighted trajectories (b, e, h), and geospatial polygons (shown in red) representing the tNO3 source contribution regions (c, f, i) at the CASTNET sites from December 2016 to 2018. The percentage contribution of each cluster to the total is also indicated.
3.2 Atmospheric nitrate spatiotemporal δ(15N) compositions
The measured atmospheric nitrate δ(15N) data are shown in Fig. 4 and summarized in Table 2. The δ(15N) data indicated significant spatial differences but with consistent seasonal patterns for δ(15N, HNO3), δ(15N, pNO3), and δ(15N, tNO3). The δ(15N) values were highest for Abington, CT, second highest for Connecticut Hill, NY, and lowest for Woodstock, NH. Across the sites, there was a consistent offset between δ(15N, HNO3) and δ(15N, pNO3), in which δ(15N, pNO3) tends to have higher values relative to δ(15N, HNO3) that averaged a (3.9 ± 1.8) ‰ (n=79) difference for simultaneously collected samples. This value was in close agreement with the theoretical isotope effect associated with N isotopic equilibrium between NO and HNO3, which has been calculated to be 3.2 ‰ at 298 K, favoring the preferential partitioning of 15N into NO (Walters and Michalski, 2015a).
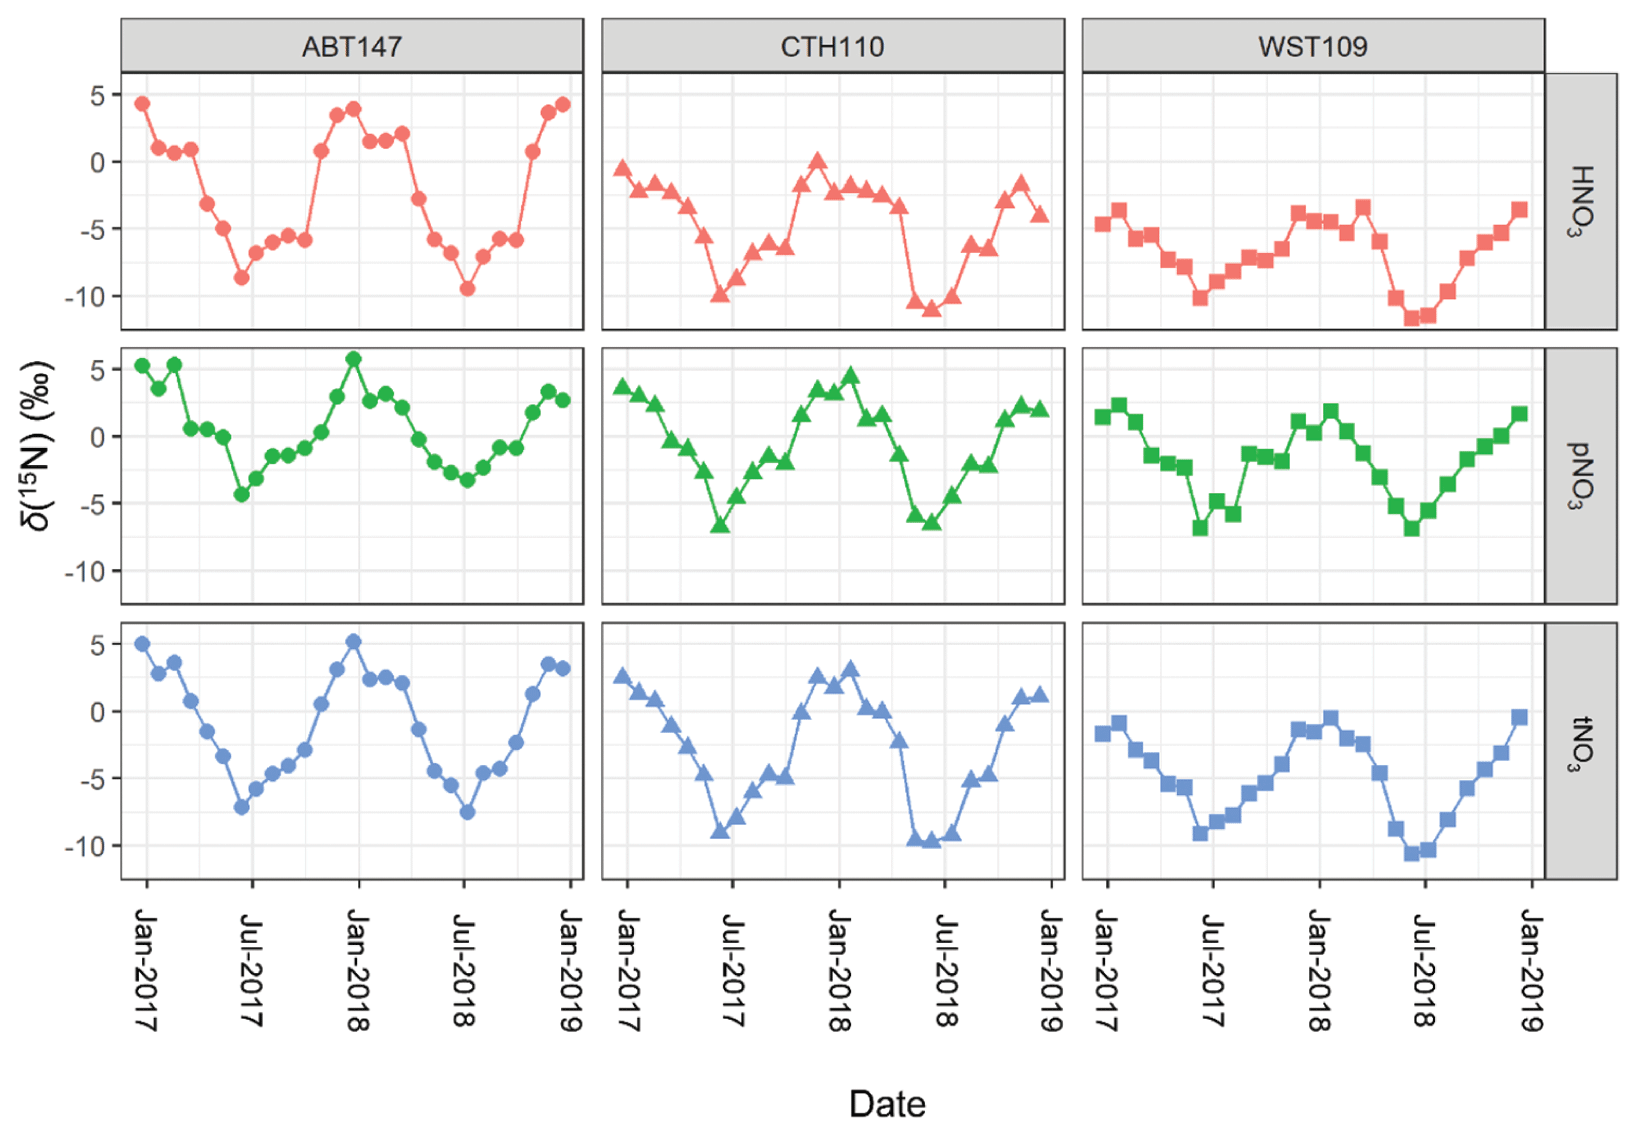
Figure 4Stable nitrogen isotope (δ(15N)) composition data of nitric acid (HNO3), particulate nitrate (pNO3), and total nitrate (tNO3 = HNO3 + pNO3) at the three CASTNET sites (Connecticut Hill, NY (CTH110); Abington, CT (ABT147); and Woodstock, NH (WST109)) from December 2016 to December 2018.
Across all sites, δ(15N, HNO3), δ(15N, pNO3), and δ(15N, tNO3) indicated consistent temporal patterns, with the highest values observed during the winter and lowest values during the summer (Fig. 4). These findings were similar to previous δ(15N) measurements from HNO3, pNO3, and precipitation NO samples collected in the early 2000s in the midwestern and northeastern US, which also reported a significant spatiotemporal variation (Elliott et al., 2009, 2007). The CTH110 site was previously analyzed for its δ(15N) deltas in the early 2000s (Elliott et al., 2009). Overall, the range of measured δ(15N) at CTH110 was lower in 2017–2018 (δ(15N, HNO.1 ‰ to −0.1 ‰; δ(15N, pNO3) = −6.8 ‰ to 4.4 ‰), compared to measurements conducted for 2004–2005 (δ(15N, HNO3) = −5 ‰ to 10 ‰; δ(15N, pNO3) = −1.0 ‰ to 12 ‰) (Elliott et al., 2009). This trend is consistent with an expected decrease in δ(15N) of atmospheric nitrate after implementing NOx reduction technologies on electricity generation units and their subsequent relative decrease in NOx emissions (Felix et al., 2012).
3.3 NOx emission modeling
Previous spatiotemporal δ(15N) differences in atmospheric nitrate in the midwestern and northeastern US had been concluded to reflect the importance of precursor emission sources (Elliott et al., 2009, 2007). Specifically, stationary source NOx emissions associated with coal combustion with a high δ(15N, NOx) emission signature were suggested to drive higher δ(15N) values during winter and a longitudinal gradient across the midwestern and northeastern US (Elliott et al., 2009). To test this hypothesis on the current dataset, the monthly predicted NOx emission densities speciated by sector and fuel-specific sources based on the Community Emissions Data System (McDuffie et al., 2020) were extracted for spatial polygons that approximately corresponded to the identified tNO3 source contributing regions from the CWT analysis (Fig. 3). Across all sites, the predicted NOx emission densities (kg m−2 s−1) indicated similar seasonal variability, with a maximum observed during winter from higher residential, commercial, and other combustion emissions due to a significant heating demand (Fig. 5). A local maximum in NOx emission densities (kg m−2 s−1) was also observed during summer due to increased emissions related to electricity generation for cooling (Fig. 5). The absolute NOx emission densities were higher for CTH110 and ABT147 compared to WST109, which may explain the observed nitrate concentration trends with the lowest concentrations observed at WST109 (Fig. 1). Across the sites, the Community Emissions Data System predicts that there were similar annual contributing NOx emission sectors for the identified source regions contributing tNO3 to the study sites (CTH110, ABT147, WST109) that included energy (21.9 %, 22.5 %, 23.5 %), industry (14.4 %, 14.6 %, 14.1 %), non-road transport (17.3 %, 16.2 %, 15.0 %), combustion-residential, commercial, other (12.8 %, 14.2 %, 14.3 %), road (23.9 %, 23.2 %, 23.3 %), shipping (7.5 %, 7.5 %, 8.5 %), and agricultural/waste (2.1 %, 1.7 %, 1.5 %) (Fig. 5). Additionally, there was similar annual NOx emission density contributing fuel types across sites, including biofuel (2.6 %, 2.7 %, 2.7 %), coal (5.8 %, 5.2 %, 4.8 %), liquid-fuel (76.4 %, 75.0 %, 73.9 %), and process-based emissions (15.3 %, 17.2 %, 18.7 %) for the identified source regions contributing to tNO3 at CTH110, ABT147, and WST109, respectively (Fig. 5).
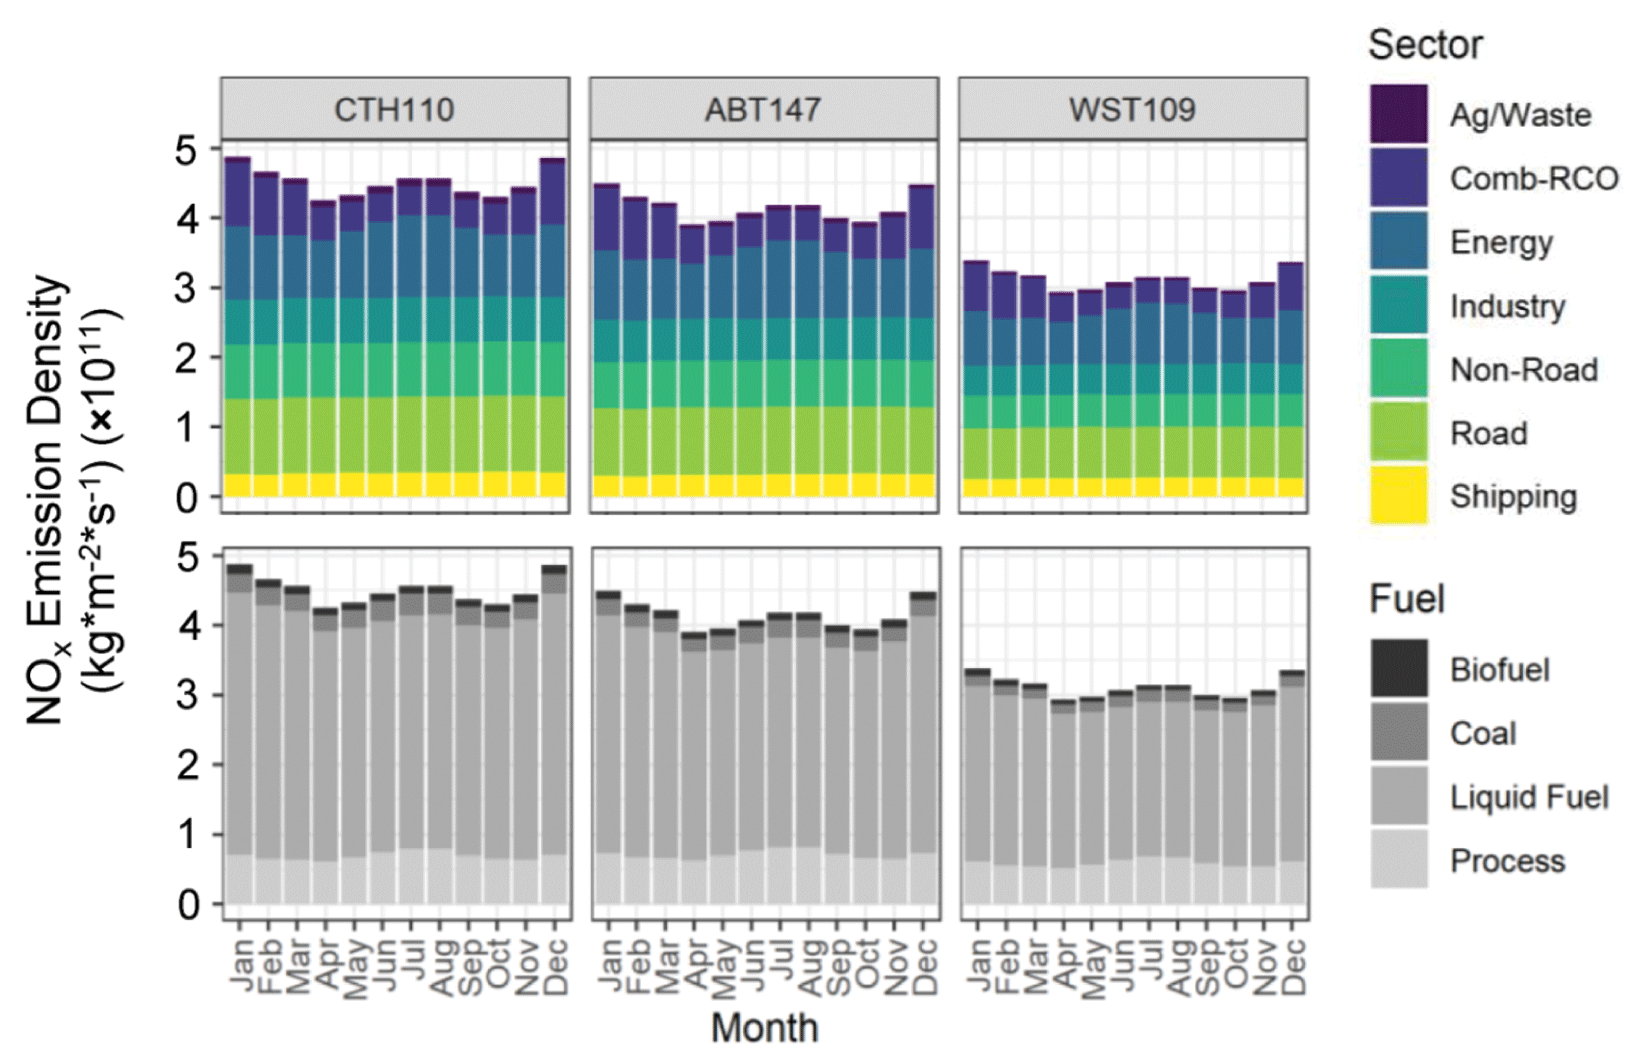
Figure 5Estimated NOx emission density by sector and fuel type for source regions contributing to the considered CASTNET sites, including Connecticut Hill, NY (CTH110); Abington, CT (ABT147); and Woodstock, NH (WST109).
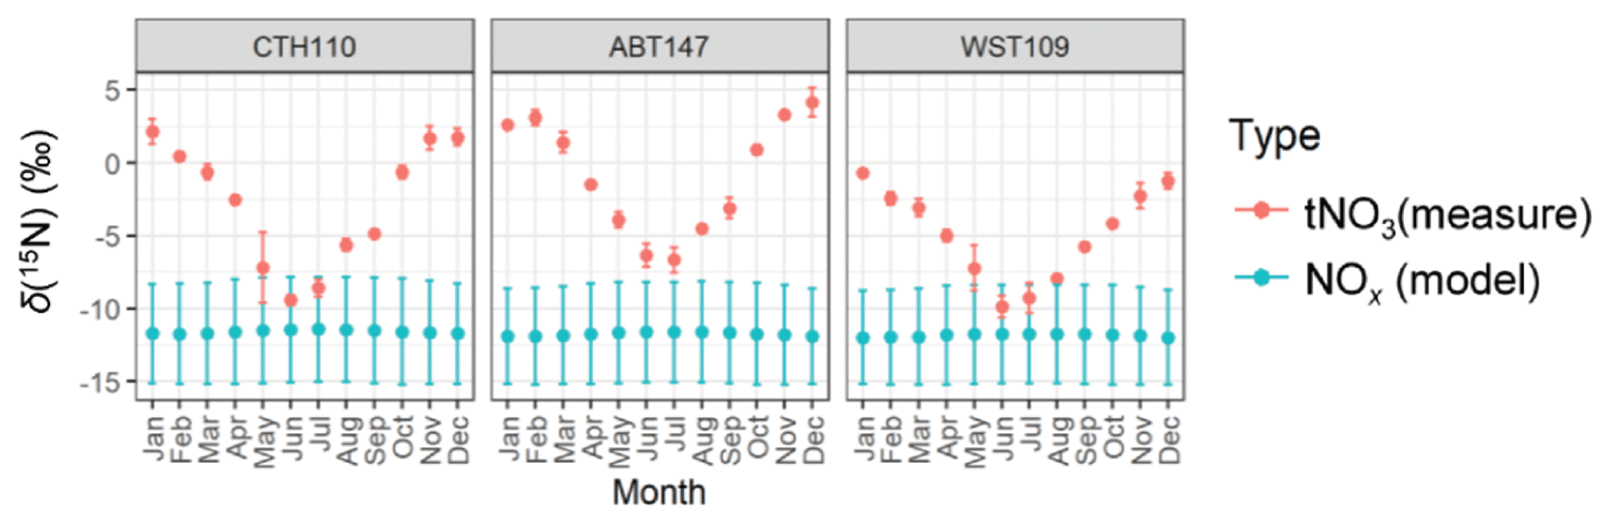
Figure 6The monthly predicted δ(15N, NOx) from the emission estimates and the observed monthly average δ(15N, tNO3). The data points correspond to the mean, and the error bars correspond to the uncertainty, representing the propagated uncertainty for the modeled δ(15N, NOx) and the standard deviation for the δ(15N, tNO3) measurements.
The monthly δ(15N, NOx) was calculated using the NOx emission estimates, assumed emission source values, and isotope mass balance (Fig. 6). Overall, this calculation indicated limited spatial variability with an annual δ(15N, NOx) average of (−11.7 ± 0.1) ‰, (−11.6 ± 0.1) ‰, and (−11.8 ± 0.8) ‰ for ABT147, CTH110, and WST109, respectively. We note that while there were significant differences in modeled NOx emission densities and observed nitrate concentrations at the study site, the relative contributions of NOx emissions contributing to the study sites were nearly identical, leading to similar modeled δ(15N, NOx) values. Thus, NOx emissions were not the main contributor to the observed spatial differences in δ(15N, HNO3, pNO3, tNO3). We note that for each of the monthly δ(15N, NOx) estimations, the propagated uncertainty based on the δ(15N, NOx) emission signature reported uncertainty was approximately ±3.4 ‰ and was not seasonally variable. There was limited seasonality in the modeled δ(15N, NOx) across all sites that was different by no more than 0.3 ‰ in the monthly mean values. The highest modeled mean δ(15N, NOx) values occurred during the summer due to increased emissions from the energy production sector, namely, an increase in coal and solid biofuel combustion, which has an elevated δ(15N, NOx) signature (Table 1) (Felix et al., 2012).
The modeled δ(15N, NOx) was compared with the measured monthly δ(15N, tNO3) to remove the potential δ(15N) phase fractionation between HNO3 and pNO3. Overall, the modeled δ(15N, NOx) was lower than the observed δ(15N, tNO3) values, and the lack of spatiotemporal variability in the modeled δ(15N, NOx) was in direct contrast to the δ(15N, tNO3) values (Fig. 6). This finding suggests that seasonal changes in NOx emission sectors by fuel type did not drive significant seasonal variability in δ(15N, NOx) or δ(15N, tNO3) across the considered CASTNET sites. Previous studies of atmospheric nitrate in the northeastern/midwestern US during the early 2000s found that stationary source NOx emissions, including power plants and industrial processes, were strongly positively correlated with δ(15N, NO) (Elliott et al., 2009, 2007), which is inconsistent with our results from a similar region from samples collected 10 years later. This inconsistency may suggest that the dramatic decrease in stationary combustion emissions, particularly from coal combustion, has led to decoupling between NOx emissions and δ(15N) of atmospheric nitrate.
The mismatch between the modeled δ(15N, NOx) and the observed δ(15N, tNO3) did not suggest that there were significant inaccuracies in the NOx emission inventories, such as under-constrained soil emissions and/or not accounting for natural sources of NOx such as lightning. Soil NOx emissions have a characteristic low δ(15N, NOx) emission signature (Miller et al., 2018; Yu and Elliott, 2017), such that underestimation of soil emissions could not explain the observed mismatch as the modeled δ(15N, NOx) was already lower than the observed δ(15N, tNO3). Lightning-generated NOx was also unlikely to explain the model mismatch with observations. Lightning NOx has a reported δ(15N) signature near 0 ‰ (Hoering, 1957), such that to match the modeled δ(15N, NOx) with the observed δ(15N, tNO3) would require a substantial amount of lightning-produced NOx. However, lightning NOx emissions are expected to be several times smaller than NOx emissions from anthropogenic sources (Murray, 2016). Thus, we next considered if the spatiotemporal δ(15N, tNO3) variability observed at the CASTNET sites during 2016–2018 can be explained by δ(15N) isotope fractionation associated with NOx oxidation.
3.4 NOx cycle isotope fractionation
NOx oxidation to atmospheric nitrate has been suggested to induce significant δ(15N) fractionation associated with NOx cycling and the reaction pathways leading to nitrate formation (Walters and Michalski, 2015; Freyer, 1991; Freyer et al., 1993; Walters et al., 2016; Walters and Michalski, 2016b; Fang et al., 2021; Li et al., 2020). We calculated the influence of δ(15N) fractionation associated with NOx cycling on δ(15N, NO2) derived from previous studies as the following (Eq. 3):
where δ(15N, NOx) represents the modeled emissions (Fig. 6), 15ε(NO2 NO) is the isotope effect associated with NO conversion to NO2, and f(NO2) represents the amount fraction of NO2 in NOx (i.e., f(NO2) = [NO2] [NOx]). The 15ε(NO2 NO) value represents a combination of the NOx equilibrium isotope effect (EIE) and the Leighton cycle isotope effect (LCIE) (Freyer et al., 1993; Walters et al., 2016; Li et al., 2020). Briefly, the EIE between NO and NO2 has been shown to have an isotope effect of (28.9 ± 1.9) ‰ from an experimental investigation under ambient NOx conditions (Li et al., 2020). The effect favors higher δ(15N) values in NO2, which dominates δ(15N, NOx) fractionation during conditions of high NOx concentrations (Freyer et al., 1993; Walters et al., 2016; Li et al., 2020). The LCIE represents a combination of the kinetic isotope effect associated with NO oxidation, primarily driven by reaction with O3, and the isotope effect associated with NO2 photolysis (Walters et al., 2016; Li et al., 2020). The dominant factor in LCIE is likely the NO + O3 fractionation, as the NO2 photolysis isotope effect has been suggested to have a near-negligible fractionation (Fang et al., 2021). Indeed, laboratory investigation of the LCIE suggests an enrichment value of (−10 ± 5) ‰, which is in close agreement with the KIE from ab initio calculations of NO + O3 of −6.7 ‰ at 298 K (Walters and Michalski, 2016a). In contrast to the EIE, the LCIE dominates NOx δ(15N) fractionation during conditions of higher O3 concentrations relative to NOx concentrations (Li et al., 2020).
We have estimated the relative role of EIE and LCIE based on the following (Eq. 4):
The fEIE represents the relative rate of NOx EIE to NO oxidation and is calculated as the following (Eq. 5):
where k(NOx-EIE) is the reaction rate of NOx EIE with a reported value of cm3 s−1 (Sharma et al., 1970), and k(NO+O3) is the NO + O3 reaction rate of cm3 s−1 (Atkinson et al., 2004).
The value of fEIE was calculated using modeled NO, NO2, and O3 concentrations from GEOS-Chem integrated over the source regions that contributed tNO3 to the CASTNET sites. The modeled O3 and NOx concentrations indicated opposite seasonal trends for all considered source regions: O3 reached a maximum during summer due to increased photochemical activity, while NOx reached a maximum during winter due to lower photolysis frequencies and relatively higher NOx emissions, as expected (Fig. 7). The modeled f(NO2) closely followed the O3 seasonal profile (Fig. 7). The calculated fEIE also followed the NOx seasonal profile with peaks during the winter and ranged from 0.124 to 0.513 across the CASTNET sites (Fig. 7), which is the expected trend as the influence of EIE on δ(15N) fractionation is highest during conditions of higher NOx concentrations relative to O3 (Freyer et al., 1993; Walters et al., 2016; Li et al., 2020). The fEIE averaged 0.255 ± 0.108, 0.271 ± 0.115, and 0.218 ± 0.093 for ABT147, CTH110, and WST109, indicating that δ(15N) fractionation was largely driven by the NO + O3 oxidation rather than by NOx EIE due to the low modeled NOx concentration relative to O3. The calculated 15ε(NO2 NO) had a similar seasonal profile as fEIE, with peaks during the winter compared with summer, and ranged from −5.2 ‰ to 10.0 ‰ across the CASTNET sites with an average of (0.5 ± 4.5) ‰, (−0.1 ± 4.2) ‰, and (−1.5 ± 3.6) ‰ for CTH110, ABT147, and WST109, respectively (Fig. 7).
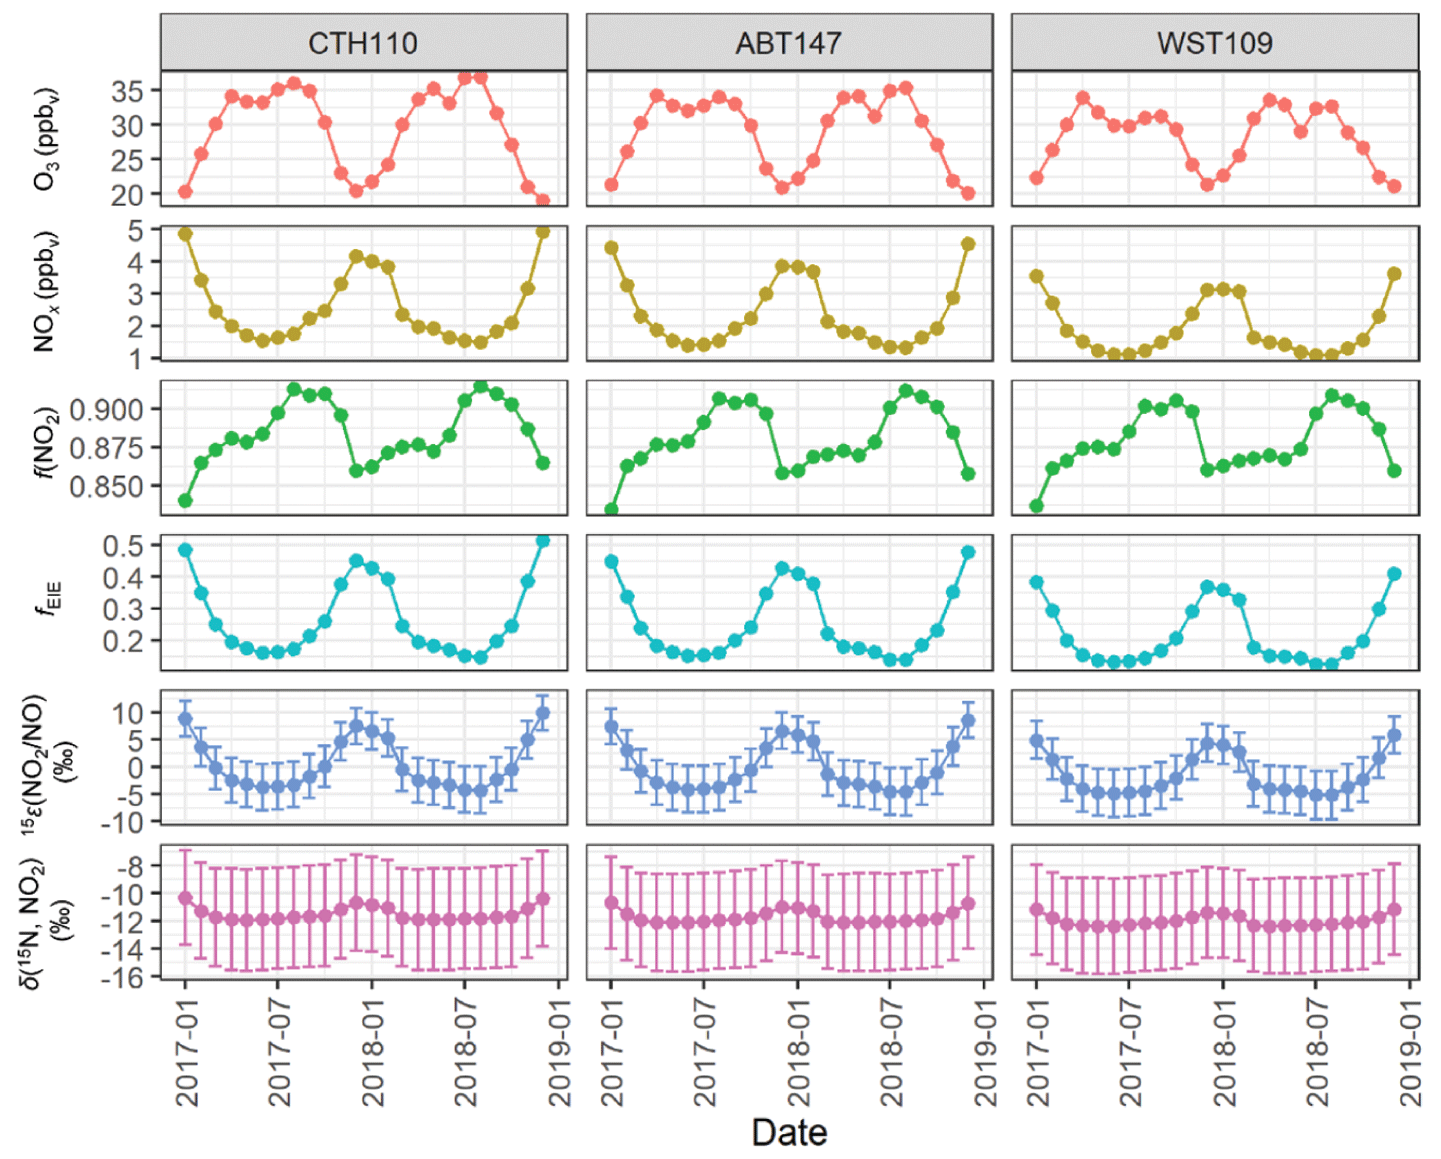
Figure 7GEOS-Chem output of O3, NOx, and f(NO2) data and the calculated fraction of NOx at isotope equilibrium (fEIE), the NO2 NO enrichment factor 15ε(NO2 NO), and δ(15N, NO2) at the considered CASTNET sites. The error bars in 15ε(NO2 NO) and δ(15N, NO2) correspond to the propagated uncertainty.
The δ(15N, NO2) was then calculated using the monthly calculated 15ε(NO2 NO), modeled f(NO2), and modeled δ(15N, NOx). Overall, the δ(15N, NO2) ranged from −12.4 ‰ to −10.3 ‰ across the CASTNET sites and averaged (−11.5 ± 0.5) ‰, (−11.7 ± 0.5) ‰, and (−12.0 ± 0.4) ‰ for CTH110, ABT147, and WST109, respectively (Fig. 7). These annual averages were nearly identical to the modeled δ(15N, NOx) values. There was slight seasonal variability in the calculated δ(15N, NO2), with slightly higher values during winter than in summer. However, neither the magnitude of the seasonal variability, which was no more than 1.6 ‰, nor the absolute value of the calculated δ(15N, NO2) agreed with the measured δ(15N, tNO3). Overall, this indicates that δ(15N) fractionation associated with NOx cycling played an insignificant role in explaining the spatiotemporal variabilities observed for δ(15N, tNO3) at the CASTNET sites.
3.5 Nitrate formation isotope fractionation
Nitrogen isotope fractionation has also been suggested to occur during reactions leading to HNO3 and/or pNO3 formation (Walters and Michalski, 2015, 2016b; Fang et al., 2021). Assuming atmospheric nitrate formation represents an irreversible reaction in an open system with a constant supply of NOx emissions, we model the δ(15N, tNO3) as the following (Eq. 6):
The 15ε() corresponds to the enrichment factor associated with converting NO2 to tNO3. We acknowledge there could be potential differences in the formation pathway for the speciated phases of atmospheric nitrate (i.e., HNO3 and pNO3). However, we evaluated nitrate formation from the mass-weighted δ(15N, tNO3) to remove the potential δ(15N) phase fractionation between HNO3 and pNO3, which complicates evaluating the potential phase-dependent formation pathway. We calculated the 15ε() as the difference between the measured δ(15N, tNO3) and the calculated δ(15N, NO2) (Fig. 8). Across all sites, 15εcalc() ranged from 1.6 ‰ to 16.1 ‰, with an average of (8.7 ± 3.8) ‰, (10.9 ± 3.5) ‰, and (6.9 ± 2.9) ‰, for CTH110, ABT147, and WST109. Additionally, the 15εcalc() indicated strong seasonality with higher values during the winter compared to the summer. The shift in the seasonal 15εcalc() was likely attributed to a change in the dominant nitrate formation pathway from NO2 oxidation via hydroxyl radical during the summer to increased N2O5 hydrolysis during the winter, as previously suggested (Li et al., 2021) and in our companion study (Kim et al., 2023).
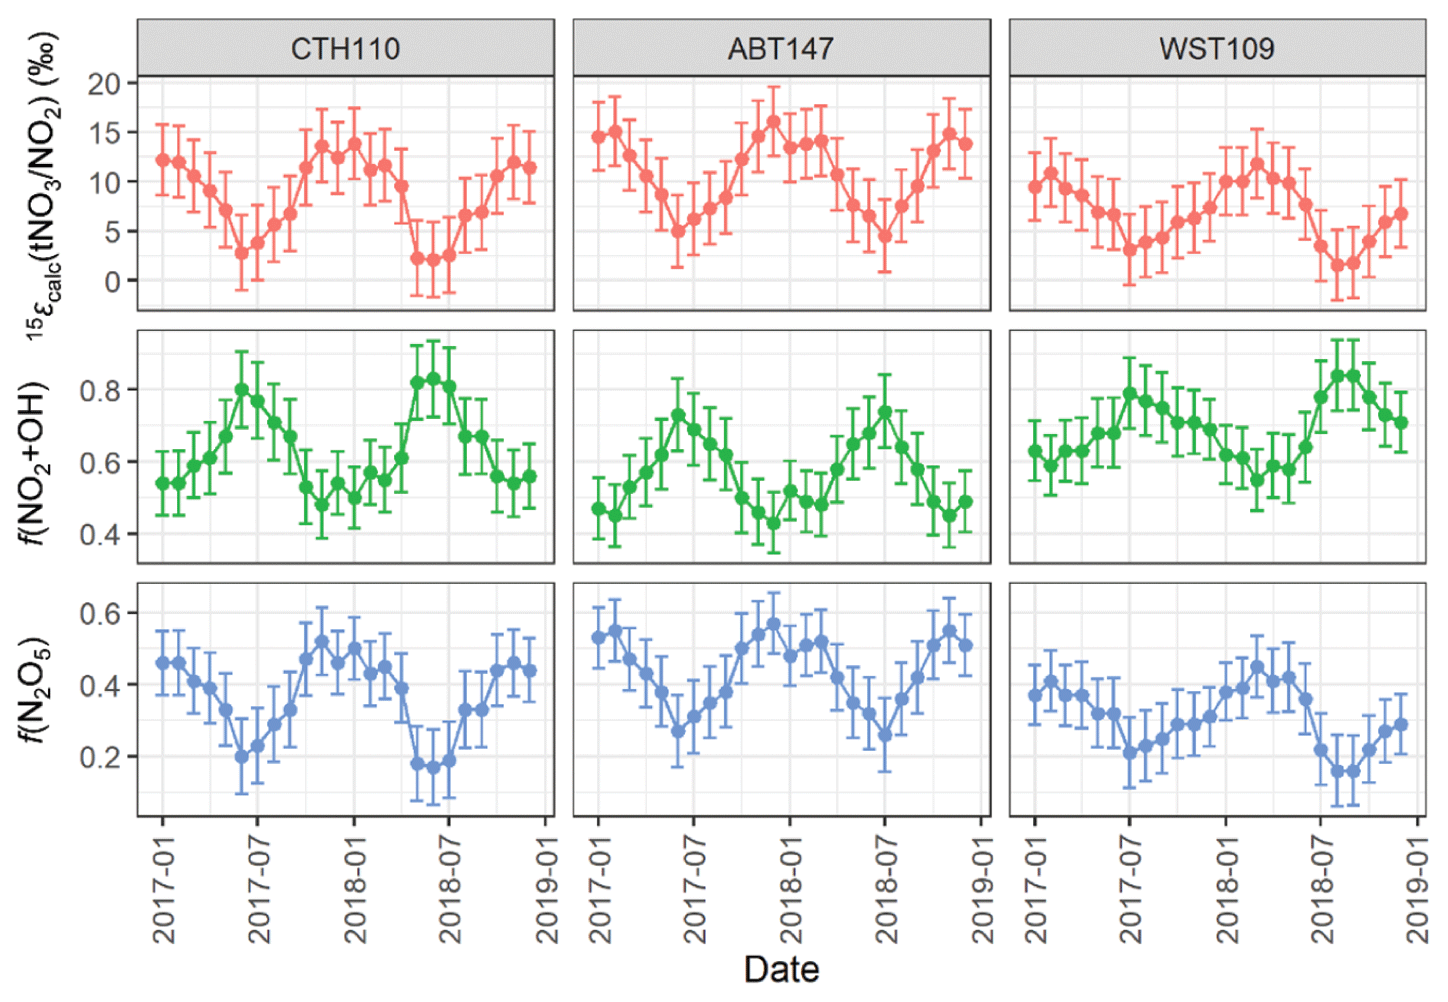
Figure 8The calculated nitrogen enrichment factor associated with nitrate formation 15ε() and the estimated relative fraction of total atmosphere nitrate (tNO3) formation via the N2O5 hydrolysis (Reaction R1) and NO2+ OH (Reaction R2) pathways at the considered CASTNET sites. The error bars represent propagated uncertainty.
The two dominant polluted mid-latitude nitrate formation pathways include NO2 oxidation via hydroxyl radical (Reaction R1) and N2O5 hydrolysis (Reaction R2):
These reactions have an isotope effect of −3 ‰ based on the reduced masses of the transition complex (Freyer, 1991) and 25.5 ‰ at 300 K based on EIE between NO2 and N2O5 (Walters and Michalski, 2016b) for Reactions (R1) and (R2), respectively, indicating that the range of the 15εcalc() is between these end-member values. We estimated the relative role of Reactions (R1) and (R2) contributing to nitrate formation across the considered CASTNET sites based on the following (Eq. 7):
assuming that Reactions (R1) and (R2) dominate the observed tNO3 formation, as expected for the polluted mid-latitudes (Alexander et al., 2020) (8):
where 15εcalc() is our calculated results (Fig. 8); f(NO2+OH) and f(N2O5) correspond to the fractional contribution of Reactions (R1) and (R2), respectively; 15ε(NO2+OH) = −3 ‰ (Freyer, 1991a); and 15ε(N2O5, T)‰ = −0.163 K + 74.08 for a temperature range of 250 to 305 K (Walters and Michalski, 2016b). We utilized the temperature derived over the source regions contributing to the CASTNET sites from the GEOS-Chem simulations in our calculations, which indicated a range in the monthly temperature of 262.4 to 294.8 K, corresponding to a range in 15ε(N2O5, T): ‰ of 26.4 ‰ to 31.3 ‰. Overall, we estimated f(NO2+OH):f(N2O5) contributed 0.63 ± 0.11:0.37 ± 0.11, 0.56 ± 0.09:0.44 ± 0.09, and 0.69 ± 0.8:0.31 ± 0.08 to CTH110, ABT147, and WST109, respectively (Fig. 8). This calculation suggests that the observed spatial δ(15N) differences at the considered sites were driven by slight differences in nitrate formation and oxidation chemistry. For each of the considered sites, the temporal trends in the oxidation chemistry were similar.
The calculated f(NO2+OH) peaked during the summer, and f(N2O5) peaked during the winter, consistent with expected seasonal atmospheric nitrate formation and model results (Alexander et al., 2020). This seasonality in atmospheric nitrate formation is driven by photochemistry and temperature. The OH is formed via photolysis, so its abundance is greater during the summer, leading to a relative increase in the proportion of atmospheric nitrate formed via NO2+ OH homogeneous reactions. During the nighttime, higher order nitrogen oxides form and new pathways of atmospheric nitrate production become important. Under these conditions, NO2 is oxidized by O3 forming the nitrate (NO3) radical, which exists at thermal equilibrium with NO2 and N2O5, which can subsequently hydrolyze on wetted aerosol surfaces leading to atmospheric nitrate production. N2O5 is photolabile and thermally unstable, so N2O5 heterogeneous reactions on aerosol surfaces are typically most prevalent during the winter (Alexander et al., 2020).
We acknowledge that are uncertainties in our model regarding potential contributions from other nitrate formation pathways and the considered enrichment factors that have not been experimentally determined. Nevertheless, our results highlight that seasonal δ(15N, tNO3) values were driven by nitrate formation based on our current understanding of fractionation patterns.
Significant spatiotemporal differences in concentrations and δ(15N) were observed for atmospheric nitrate in the northeastern US from December 2016 to 2018 from CASTNET locations. These findings were consistent with a previous study of atmospheric nitrate from CASTNET sites collected in the early 2000s, indicating that even after dramatic reductions in NOx emissions in the US over the past decade (e.g., a decrease of 38 % from 2005–2014; Miyazaki et al., 2017), atmospheric nitrate spatiotemporal trends have been retained. We focused on evaluating the drivers of the spatiotemporal trends of δ(15N) observed at the CASTNET sites. Back trajectory and geospatial statistical analyses indicated that atmospheric nitrate source regions tended to be within 1000 km and tended to extend towards the west/northwest of the CASTNET sites. Utilizing NOx emission data for the identified source regions, we modeled δ(15N, NOx) for each of the CASTNET sites, indicating no significant spatiotemporal differences. This finding suggested that NOx emissions were not a key driver of the observed spatiotemporal δ(15N) variability as previously reported for CASTNET sites in the early 2000s. Instead, we found that δ(15N) fractionation primarily associated with nitrate formation was the key driver of the observed spatiotemporal δ(15N) variabilities.
Our results highlight that δ(15N) of atmospheric nitrate fractionation could lead to new insights via tracking nitrate formation mechanisms. The δ(15N) fractionation associated with NOx conversion to atmospheric nitrate reflected the nitrate formation pathways. Thus, the δ(15N) of atmospheric nitrate could be a useful way to track the reactions contributing to nitrate formation, similarly to Δ(17O) (Alexander et al., 2020; Michalski et al., 2003). Tracking the formation pathways of nitrate is important for evaluating atmospheric chemistry model representation of oxidation chemistry. For example, uncertainties in the rate of NOx oxidation to nitrate have been shown to represent a significant source of uncertainty for the formation of major tropospheric oxidants (i.e., ozone (O3) and the hydroxyl radical (OH)) that has important implications for our understanding of atmospheric lifetimes of many trace gases, including greenhouse gases. However, δ(15N) would arguably be more sensitive to nitrate formation pathways because most of the Δ(17O) of nitrate reflects NOx photochemical cycling (NO + O3 vs. NO + RO2 HO2) rather than the reactions contributing to nitrate formation. Thus, δ(15N) and Δ(17O) could be useful complementary tools to improve our ability to track NOx oxidation and nitrate formation and compare with model expectations. Future studies are needed to verify the assumed δ(15N) fractionation values associated with nitrate formation, enabling δ(15N) to be a useful tool for tracking oxidation chemistry pathways.
Data presented in this article are available on the Harvard Dataverse at https://doi.org/10.7910/DVN/X6BB1I (Walters, 2022) and the US EPA CASTNET database (http://www.epa.gov/castnet, U.S. Environmental Protection Agency Clean Air Markets Division Clean Air Status and Trends Network, 2022).
CB, WWW, and MGH designed the varying aspects of the study. CB and WWW carried out the laboratory measurements. CB conducted the statistical analysis, back-trajectory calculations, and emissions modeling. LTM contributed GEOS-Chem simulations. CB and WWW prepared the article with contributions from all co-authors.
The contact author has declared that none of the authors has any competing interests.
Publisher's note: Copernicus Publications remains neutral with regard to jurisdictional claims in published maps and institutional affiliations.
We thank Ruby Ho for sampling and laboratory assistance. We are grateful to the US EPA CASTNET program and staff for their cooperation in this study and assistance with receiving archived samples for isotopic analysis.
This research has been supported by the National Science Foundation (AGS-2002750), the Institute at Brown for Environment and Society Seed Grant, and the Voss Environmental Fellowship from the Institute at Brown for Environment and Society.
This paper was edited by Jan Kaiser and reviewed by Pete D. Akers and Eva Stueeken.
Alexander, B., Sherwen, T., Holmes, C. D., Fisher, J. A., Chen, Q., Evans, M. J., and Kasibhatla, P.: Global inorganic nitrate production mechanisms: comparison of a global model with nitrate isotope observations, Atmos. Chem. Phys., 20, 3859–3877, https://doi.org/10.5194/acp-20-3859-2020, 2020.
Amos, H. M., Jacob, D. J., Holmes, C. D., Fisher, J. A., Wang, Q., Yantosca, R. M., Corbitt, E. S., Galarneau, E., Rutter, A. P., Gustin, M. S., Steffen, A., Schauer, J. J., Graydon, J. A., Louis, V. L. St., Talbot, R. W., Edgerton, E. S., Zhang, Y., and Sunderland, E. M.: Gas-particle partitioning of atmospheric Hg(II) and its effect on global mercury deposition, Atmos. Chem. Phys., 12, 591–603, https://doi.org/10.5194/acp-12-591-2012, 2012.
Atkinson, R., Baulch, D. L., Cox, R. A., Crowley, J. N., Hampson, R. F., Hynes, R. G., Jenkin, M. E., Rossi, M. J., and Troe, J.: Evaluated kinetic and photochemical data for atmospheric chemistry: Volume I - gas phase reactions of Ox, HOx, NOx and SOx species, Atmos. Chem. Phys., 4, 1461–1738, https://doi.org/10.5194/acp-4-1461-2004, 2004.
Bates, K. H. and Jacob, D. J.: A new model mechanism for atmospheric oxidation of isoprene: global effects on oxidants, nitrogen oxides, organic products, and secondary organic aerosol, Atmos. Chem. Phys., 19, 9613–9640, https://doi.org/10.5194/acp-19-9613-2019, 2019.
Bauer, S. E., Koch, D., Unger, N., Metzger, S. M., Shindell, D. T., and Streets, D. G.: Nitrate aerosols today and in 2030: a global simulation including aerosols and tropospheric ozone, Atmos. Chem. Phys., 7, 5043–5059, https://doi.org/10.5194/acp-7-5043-2007, 2007.
Baumgardner, Ralph E., Lavery, T. F., Rogers, C. M., and Isil, S. S.: Estimates of the Atmospheric Deposition of Sulfur and Nitrogen Species: Clean Air Status and Trends Network, 1990–2000, Environ. Sci. Technol., 36, 2614–2629, https://doi.org/10.1021/es011146g, 2002.
Benedict, K. B., Carrico, C. M., Kreidenweis, S. M., Schichtel, B., Malm, W. C., and Collett Jr., J. L.: A seasonal nitrogen deposition budget for Rocky Mountain National Park, Ecol. Appl., 23, 1156–1169, https://doi.org/10.1890/12-1624.1, 2013.
Bey, I., Jacob, D. J., Yantosca, R. M., Logan, J. A., Field, B. D., Fiore, A. M., Li, Q., Liu, H. Y., Mickley, L. J., and Schultz, M. G.: Global modeling of tropospheric chemistry with assimilated meteorology: Model description and evaluation, J. Geophys. Atmos., 106, 23073–23095, https://doi.org/10.1029/2001JD000807, 2001.
Beyn, F., Matthias, V., and Dähnke, K.: Changes in atmospheric nitrate deposition in Germany – An isotopic perspective, Environ. Pollut., 194, 1–10, https://doi.org/10.1016/j.envpol.2014.06.043, 2014.
Beyn, F., Matthias, V., Aulinger, A., and Dähnke, K.: Do N-isotopes in atmospheric nitrate deposition reflect air pollution levels?, Atmos. Environ., 107, 281–288, https://doi.org/10.1016/j.atmosenv.2015.02.057, 2015.
Bloss, W. J., Evans, M. J., Lee, J. D., Sommariva, R., Heard, D. E., and Pilling, M. J.: The oxidative capacity of the troposphere: Coupling of field measurements of OH and a global chemistry transport model, Faraday Discuss., 130, 425–436, https://doi.org/10.1039/B419090D, 2005.
Böhlke, J. K., Gwinn, C. J., and Coplen, T. B.: New Reference Materials for Nitrogen-Isotope-Ratio Measurements, Geostandard. Newslett., 17, 159–164, https://doi.org/10.1111/j.1751-908X.1993.tb00131.x, 1993.
Böhlke, J. K., Mroczkowski, S. J., and Coplen, T. B.: Oxygen isotopes in nitrate: New reference materials for 18O: 17O: 16O measurements and observations on nitrate-water equilibration, Rapid Commun. Mass. Sp., 17, 1835–1846, https://doi.org/10.1002/rcm.1123, 2003.
Breider, T. J., Mickley, L. J., Jacob, D. J., Ge, C., Wang, J., Payer Sulprizio, M., Croft, B., Ridley, D. A., McConnell, J. R., and Sharma, S.: Multidecadal trends in aerosol radiative forcing over the Arctic: Contribution of changes in anthropogenic aerosol to Arctic warming since 1980, J. Geophys. Atmos., 122, 3573–3594, https://doi.org/10.1002/2016JD025321, 2017.
Carslaw, D. C. and Ropkins, K.: Openair – an R package for air quality data analysis, Environ. Modell. Softw., 27, 52–61, https://doi.org/10.1016/j.envsoft.2011.09.008, 2012.
Casciotti, K. L., Sigman, D. M., Hastings, M. G., Böhlke, J. K., and Hilkert, A.: Measurement of the oxygen isotopic composition of nitrate in seawater and freshwater using the denitrifier method, Anal. Chem., 74, 4905–4912, https://doi.org/10.1021/ac020113w, 2002.
CASTNET Site Locations: https://www.epa.gov/castnet/castnet-site-locations, last access: 7 February 2023.
Chang, Y., Zhang, Y., Tian, C., Zhang, S., Ma, X., Cao, F., Liu, X., Zhang, W., Kuhn, T., and Lehmann, M. F.: Nitrogen isotope fractionation during gas-to-particle conversion of NOx to NO in the atmosphere – implications for isotope-based NOx source apportionment, Atmos. Chem. Phys., 18, 11647–11661, https://doi.org/10.5194/acp-18-11647-2018, 2018.
Chang, Y., Zhang, Y.-L., Li, J., Tian, C., Song, L., Zhai, X., Zhang, W., Huang, T., Lin, Y.-C., Zhu, C., Fang, Y., Lehmann, M. F., and Chen, J.: Isotopic constraints on the atmospheric sources and formation of nitrogenous species in clouds influenced by biomass burning, Atmos. Chem. Phys., 19, 12221–12234, https://doi.org/10.5194/acp-19-12221-2019, 2019.
Cheng, I., Zhang, L., Blanchard, P., Dalziel, J., and Tordon, R.: Concentration-weighted trajectory approach to identifying potential sources of speciated atmospheric mercury at an urban coastal site in Nova Scotia, Canada, Atmos. Chem. Phys., 13, 6031–6048, https://doi.org/10.5194/acp-13-6031-2013, 2013.
Clarke, J. F., Edgerton, E., and Martin, B. E.: Dry deposition calculations for the clean air status and trends network, Atmos. Environ., 31, 3667–3678, https://doi.org/10.1016/S1352-2310(97)00141-6, 1997.
Delmas, R., Serça, D., and Jambert, C.: Global inventory of NOx sources, Nutr. Cycl. Agroecosys., 48, 51–60, https://doi.org/10.1023/A:1009793806086, 1997.
Dimitriou, K., Remoundaki, E., Mantas, E., and Kassomenos, P.: Spatial distribution of source areas of PM2.5 by Concentration Weighted Trajectory (CWT) model applied in PM2.5 concentration and composition data, Atmos. Environ., 116, 138–145, https://doi.org/10.1016/j.atmosenv.2015.06.021, 2015.
Ehn, M., Thornton, J. A., Kleist, E., Sipilä, M., Junninen, H., Pullinen, I., Springer, M., Rubach, F., Tillmann, R., and Lee, B.: A large source of low-volatility secondary organic aerosol, Nature, 506, 476–479, https://doi.org/10.1038/nature13032, 2014.
Elliott, E. M., Kendall, C., Wankel, S. D., Burns, D. A., Boyer, E. W., Harlin, K., Bain, D. J., and Butler, T. J.: Nitrogen isotopes as indicators of NOx source contributions to atmospheric nitrate deposition across the midwestern and northeastern United States, Environ. Sci. Technol., 41, 7661–7667, https://doi.org/10.1021/es070898t, 2007.
Elliott, E. M., Kendall, C., Boyer, E. W., Burns, D. A., Lear, G. G., Golden, H. E., Harlin, K., Bytnerowicz, A., Butler, T. J., and Glatz, R.: Dual nitrate isotopes in dry deposition: Utility for partitioning NOx source contributions to landscape nitrogen deposition, J. Geophys. Res.-Biogeo., 114, G04020, https://doi.org/10.1029/2008JG000889, 2009.
Environmental Protection Agency Clean Air Markets Division Clean Air Status and Trends Network (CASTNET): Filter Pack Concentrations – Weekly, https://www.epa.gov/castnet, last access: 4 March 2022.
Fang, H., Walters, W. W., Mase, D., and Michalski, G.: iNRACM: incorporating 15N into the Regional Atmospheric Chemistry Mechanism (RACM) for assessing the role photochemistry plays in controlling the isotopic composition of NOx, NOy, and atmospheric nitrate, Geosci. Model Dev., 14, 5001–5022, https://doi.org/10.5194/gmd-14-5001-2021, 2021.
Felix, J. D., Elliott, E. M., and Shaw, S. L.: Nitrogen Isotopic Composition of Coal-Fired Power Plant NOx: Influence of Emission Controls and Implications for Global Emission Inventories, Environ. Sci. Technol., 46, 3528–3535, https://doi.org/10.1021/es203355v, 2012.
Feng, X., Li, Q., Tao, Y., Ding, S., Chen, Y., and Li, X.-D.: Impact of Coal Replacing Project on atmospheric fine aerosol nitrate loading and formation pathways in urban Tianjin: Insights from chemical composition and 15N and 18O isotope ratios, Sci. Total Environ., 708, 134797, https://doi.org/10.1016/j.scitotenv.2019.134797, 2020.
Fountoukis, C. and Nenes, A.: ISORROPIA II: a computationally efficient thermodynamic equilibrium model for K+–Ca2+–Mg2+––Na+–––Cl−–H2O aerosols, Atmos. Chem. Phys., 7, 4639–4659, https://doi.org/10.5194/acp-7-4639-2007, 2007.
Freyer, H. D.: Seasonal variation of ratios in atmospheric nitrate species, Tellus B, 43, 30–44, https://doi.org/10.3402/tellusb.v43i1.15244, 1991.
Freyer, H. D., Kley, D., Volz-Thomas, A., and Kobel, K.: On the interaction of isotopic exchange processes with photochemical reactions in atmospheric oxides of nitrogen, J. Geophys. Res., 98, 14791–14796, https://doi.org/10.1029/93JD00874, 1993.
Frost, G. J., McKeen, S. A., Trainer, M., Ryerson, T. B., Neuman, J. A., Roberts, J. M., Swanson, A., Holloway, J. S., Sueper, D. T., Fortin, T., Parrish, D. D., Fehsenfeld, F. C., Flocke, F., Peckham, S. E., Grell, G. A., Kowal, D., Cartwright, J., Auerbach, N., and Habermann, T.: Effects of changing power plant NOx emissions on ozone in the eastern United States: Proof of concept, J. Geophys. Res.-Atmos., 111, D12306, https://doi.org/10.1029/2005JD006354, 2006.
Galloway, J. N., Dentener, F. J., Capone, D. G., Boyer, E. W., Howarth, R. W., Seitzinger, S. P., Asner, G. P., Cleveland, C., Green, P., and Holland, E.: Nitrogen cycles: past, present, and future, Biogeochemistry, 70, 153–226, https://doi.org/10.1007/s10533-004-0370-0, 2004.
Geng, L., Alexander, B., Cole-Dai, J., Steig, E. J., Savarino, J., Sofen, E. D., and Schauer, A. J.: Nitrogen isotopes in ice core nitrate linked to anthropogenic atmospheric acidity change, P. Natl. Acad. Sci. USA, 111, 5808–5812, https://doi.org/10.1073/pnas.1319441111, 2014.
Granger, J. and Sigman, D. M.: Removal of nitrite with sulfamic acid for nitrate N and O isotope analysis with the denitrifier method, Rapid. Commun. Mass. Sp., 23, 3753–3762, https://doi.org/10.1002/rcm.4307, 2009.
Greaver, T. L., Clark, C. M., Compton, J. E., Vallano, D., Talhelm, A. F., Weaver, C. P., Band, L. E., Baron, J. S., Davidson, E. A., and Tague, C. L.: Key ecological responses to nitrogen are altered by climate change, Nat. Clim. Change, 6, 836–843, https://doi.org/10.1038/nclimate3088, 2016.
Guenther, A. B., Jiang, X., Heald, C. L., Sakulyanontvittaya, T., Duhl, T., Emmons, L. K., and Wang, X.: The Model of Emissions of Gases and Aerosols from Nature version 2.1 (MEGAN2.1): an extended and updated framework for modeling biogenic emissions, Geosci. Model Dev., 5, 1471–1492, https://doi.org/10.5194/gmd-5-1471-2012, 2012.
Hand, J. L., Schichtel, B. A., Malm, W. C., Copeland, S., Molenar, J. V., Frank, N., and Pitchford, M.: Widespread reductions in haze across the United States from the early 1990s through 2011, Atmos. Environ., 94, 671–679, https://doi.org/10.1016/j.atmosenv.2014.05.062, 2014.
Hastings, M. G., Jarvis, J. C., and Steig, E. J.: Anthropogenic Impacts on Nitrogen Isotopes of Ice-Core Nitrate, Science, 324, 1288–1288, https://doi.org/10.1126/science.1170510, 2009.
Hastings, M. G., Casciotti, K. L., and Elliott, E. M.: Stable isotopes as tracers of anthropogenic nitrogen sources, deposition, and impacts, Elements, 9, 339–344, https://doi.org/10.2113/gselements.9.5.339, 2013.
Hoering, T.: The isotopic composition of the ammonia and the nitrate ion in rain, Geochim. Cosmochim. Ac., 12, 97–102, https://doi.org/10.1016/0016-7037(57)90021-2, 1957.
Hoesly, R. M., Smith, S. J., Feng, L., Klimont, Z., Janssens-Maenhout, G., Pitkanen, T., Seibert, J. J., Vu, L., Andres, R. J., Bolt, R. M., Bond, T. C., Dawidowski, L., Kholod, N., Kurokawa, J.-I., Li, M., Liu, L., Lu, Z., Moura, M. C. P., O'Rourke, P. R., and Zhang, Q.: Historical (1750–2014) anthropogenic emissions of reactive gases and aerosols from the Community Emissions Data System (CEDS), Geosci. Model Dev., 11, 369–408, https://doi.org/10.5194/gmd-11-369-2018, 2018.
Hsu, Y.-K., Holsen, T. M., and Hopke, P. K.: Comparison of hybrid receptor models to locate PCB sources in Chicago, Atmos. Environ., 37, 545–562, https://doi.org/10.1016/S1352-2310(02)00886-5, 2003.
Hu, L., Millet, D. B., Baasandorj, M., Griffis, T. J., Turner, P., Helmig, D., Curtis, A. J., and Hueber, J.: Isoprene emissions and impacts over an ecological transition region in the US Upper Midwest inferred from tall tower measurements, J. Geophys. Res.-Atmos., 120, 3553–3571, https://doi.org/10.1002/2014JD022732, 2015.
Huang, J. and Jaeglé, L.: Wintertime enhancements of sea salt aerosol in polar regions consistent with a sea ice source from blowing snow, Atmos. Chem. Phys., 17, 3699–3712, https://doi.org/10.5194/acp-17-3699-2017, 2017.
Hudman, R. C., Moore, N. E., Mebust, A. K., Martin, R. V., Russell, A. R., Valin, L. C., and Cohen, R. C.: Steps towards a mechanistic model of global soil nitric oxide emissions: implementation and space based-constraints, Atmos. Chem. Phys., 12, 7779–7795, https://doi.org/10.5194/acp-12-7779-2012, 2012.
Jaeglé, L., Steinberger, L., Martin, R. V., and Chance, K.: Global partitioning of NOx sources using satellite observations: Relative roles of fossil fuel combustion, biomass burning and soil emissions, Faraday Discuss., 130, 407–423, https://doi.org/10.1039/b502128f, 2005.
Jaeglé, L., Quinn, P. K., Bates, T. S., Alexander, B., and Lin, J.-T.: Global distribution of sea salt aerosols: new constraints from in situ and remote sensing observations, Atmos. Chem. Phys., 11, 3137–3157, https://doi.org/10.5194/acp-11-3137-2011, 2011.
Jaeglé, L., Shah, V., Thornton, J. A., Lopez-Hilfiker, F. D., Lee, B. H., McDuffie, E. E., Fibiger, D., Brown, S. S., Veres, P., Sparks, T. L., Ebben, C. J., Wooldridge, P. J., Kenagy, H. S., Cohen, R. C., Weinheimer, A. J., Campos, T. L., Montzka, D. D., Digangi, J. P., Wolfe, G. M., Hanisco, T., Schroder, J. C., Campuzano-Jost, P., Day, D. A., Jimenez, J. L., Sullivan, A. P., Guo, H., and Weber, R. J.: Nitrogen Oxides Emissions, Chemistry, Deposition, and Export Over the Northeast United States During the WINTER Aircraft Campaign, J. Geophys. Res.-Atmos., 123, 12368–12393, https://doi.org/10.1029/2018JD029133, 2018.
Kaiser, J., Hastings, M. G., Houlton, B. Z., Röckmann, T., and Sigman, D. M.: Triple Oxygen Isotope Analysis of Nitrate Using the Denitrifier Method and Thermal Decomposition of N2O, Anal. Chem., 79, 599–607, https://doi.org/10.1021/ac061022s, 2007.
Kim, H., Walters, W. W., Bekker, C., Murray, L. T., and Hastings, M. G.: Nitrate chemistry in the northeast US – Part 2: Oxygen isotopes reveal differences in particulate and gas-phase formation, Atmos. Chem. Phys., 23, 4203–4219, https://doi.org/10.5194/acp-23-4203-2023, 2023.
Li, D. and Wang, X.: Nitrogen isotopic signature of soil-released nitric oxide (NO) after fertilizer application, Atmos. Environ., 42, 4747–4754, https://doi.org/10.1016/j.atmosenv.2008.01.042, 2008.
Li, J., Zhang, X., Orlando, J., Tyndall, G., and Michalski, G.: Quantifying the nitrogen isotope effects during photochemical equilibrium between NO and NO2: implications for δ15N in tropospheric reactive nitrogen, Atmos. Chem. Phys., 20, 9805–9819, https://doi.org/10.5194/acp-20-9805-2020, 2020.
Li, J., Davy, P., Harvey, M., Katzman, T., Mitchell, T., and Michalski, G.: Nitrogen isotopes in nitrate aerosols collected in the remote marine boundary layer: Implications for nitrogen isotopic fractionations among atmospheric reactive nitrogen species, Atmos. Environ., 245, 118028, https://doi.org/10.1016/j.atmosenv.2020.118028, 2021.
Li, Z., Walters, W. W., Hastings, M. G., Zhang, Y., Song, L., Liu, D., Zhang, W., Pan, Y., Fu, P., and Fang, Y.: Nitrate Isotopic Composition in Precipitation at a Chinese Megacity: Seasonal Variations, Atmospheric Processes, and Implications for Sources, Earth Space Sci., 6, 2200–2213, https://doi.org/10.1029/2019EA000759, 2019.
Liu, H., Jacob, D. J., Bey, I., and Yantosca, R. M.: Constraints from 210Pb and 7Be on wet deposition and transport in a global three-dimensional chemical tracer model driven by assimilated meteorological fields, J. Geophys. Res.-Atmos., 106, 12109–12128, https://doi.org/10.1029/2000JD900839, 2001.
McDuffie, E. E., Smith, S. J., O'Rourke, P., Tibrewal, K., Venkataraman, C., Marais, E. A., Zheng, B., Crippa, M., Brauer, M., and Martin, R. V.: A global anthropogenic emission inventory of atmospheric pollutants from sector- and fuel-specific sources (1970–2017): an application of the Community Emissions Data System (CEDS), Earth Syst. Sci. Data, 12, 3413–3442, https://doi.org/10.5194/essd-12-3413-2020, 2020.
Michalski, G., Scott, Z., Kabiling, M., and Thiemens, M. H.: First measurements and modeling of Δ17O in atmospheric nitrate, Geophys. Res. Lett., 30, 1870, https://doi.org/10.1029/2003GL017015, 2003.
Miller, D. J., Wojtal, P. K., Clark, S. C., and Hastings, M. G.: Vehicle NOx emission plume isotopic signatures: Spatial variability across the eastern United States, J. Geophys. Res.-Atmos., 122, 2016JD025877, https://doi.org/10.1002/2016JD025877, 2017.
Miller, D. J., Chai, J., Guo, F., Dell, C. J., Karsten, H., and Hastings, M. G.: Isotopic Composition of In Situ Soil NOx Emissions in Manure-Fertilized Cropland, Geophys. Res. Lett., 45, 12–058, https://doi.org/10.1029/2018GL079619, 2018.
Millet, D. B., Guenther, A., Siegel, D. A., Nelson, N. B., Singh, H. B., de Gouw, J. A., Warneke, C., Williams, J., Eerdekens, G., Sinha, V., Karl, T., Flocke, F., Apel, E., Riemer, D. D., Palmer, P. I., and Barkley, M.: Global atmospheric budget of acetaldehyde: 3-D model analysis and constraints from in-situ and satellite observations, Atmos. Chem. Phys., 10, 3405–3425, https://doi.org/10.5194/acp-10-3405-2010, 2010.
Miyazaki, K., Eskes, H., Sudo, K., Boersma, K. F., Bowman, K., and Kanaya, Y.: Decadal changes in global surface NOx emissions from multi-constituent satellite data assimilation, Atmos. Chem. Phys., 17, 807–837, https://doi.org/10.5194/acp-17-807-2017, 2017.
Murray, L. T.: Lightning NOx and impacts on air quality, Current Pollution Reports, 2, 115–133, https://doi.org/10.1007/s40726-016-0031-7, 2016.
Murray, L. T., Jacob, D. J., Logan, J. A., Hudman, R. C., and Koshak, W. J.: Optimized regional and interannual variability of lightning in a global chemical transport model constrained by LIS/OTD satellite data, J. Geophys. Res.-Atmos., 117, D20307, https://doi.org/10.1029/2012JD017934, 2012.
Pinder, R. W., Davidson, E. A., Goodale, C. L., Greaver, T. L., Herrick, J. D., and Liu, L.: Climate change impacts of US reactive nitrogen, P. Natl. Acad. Sci. USA, 109, 7671–7675, https://doi.org/10.1073/pnas.1114243109, 2012.
Prinn, R. G.: The cleansing capacity of the atmosphere, Annu. Rev. Environ. Res., 28, 29–57, https://doi.org/10.1146/annurev.energy.28.011503.163425, 2003.
Pye, H. O. T., Chan, A. W. H., Barkley, M. P., and Seinfeld, J. H.: Global modeling of organic aerosol: the importance of reactive nitrogen (NOx and NO3), Atmos. Chem. Phys., 10, 11261–11276, https://doi.org/10.5194/acp-10-11261-2010, 2010.
Ridley, D. A., Heald, C. L., and Ford, B.: North African dust export and deposition: A satellite and model perspective, J. Geophys. Res.-Atmos., 117, D02202, https://doi.org/10.1029/2011JD016794, 2012.
Salamalikis, V., Argiriou, A. A., and Dotsika, E.: Stable isotopic composition of atmospheric water vapor in Patras, Greece: A concentration weighted trajectory approach, Atmos. Res., 152, 93–104, https://doi.org/10.1016/j.atmosres.2014.02.021, 2015.
Savard, M. M., Cole, A., Smirnoff, A., and Vet, R.: δ15N values of atmospheric N species simultaneously collected using sector-based samplers distant from sources – Isotopic inheritance and fractionation, Atmos. Environ., 162, 11–22, https://doi.org/10.1016/j.atmosenv.2017.05.010, 2017.
Savarino, J., Morin, S., Erbland, J., Grannec, F., Patey, M. D., Vicars, W., Alexander, B., and Achterberg, E. P.: Isotopic composition of atmospheric nitrate in a tropical marine boundary layer, P. Natl. Acad. Sci. USA, 110, 17668–17673, https://doi.org/10.1073/pnas.1216639110, 2013.
Sharma, H. D., Jervis, R. E., and Wong, K. Y.: Isotopic exchange reactions in nitrogen oxides, J. Phys. Chem., 74, 923–933, https://doi.org/10.1021/j100699a044, 1970.
Sickles II, J. E. and Shadwick, D. S.: Air quality and atmospheric deposition in the eastern US: 20 years of change, Atmos. Chem. Phys., 15, 173–197, https://doi.org/10.5194/acp-15-173-2015, 2015.
Sigman, D. M., Casciotti, K. L., Andreani, M., Barford, C., Galanter, M., and Böhlke, J. K.: A bacterial method for the nitrogen isotopic analysis of nitrate in seawater and freshwater, Anal. Chem., 73, 4145–4153, https://doi.org/10.1021/ac010088e, 2001.
Stein, A. F., Draxler, R. R., Rolph, G. D., Stunder, B. J., Cohen, M. D., and Ngan, F.: NOAA's HYSPLIT atmospheric transport and dispersion modeling system, B. Am. Meteorol. Soc., 96, 2059–2077, https://doi.org/10.1175/BAMS-D-14-00110.1, 2015.
U.S. Environmental Protection Agency Clean Air Markets Division Clean Air Status and Trends Network (CASTNET): Filter Pack Concentrations – Weekly, http://www.epa.gov/castnet, last access: 4 March 2022.
van der Werf, G. R., Randerson, J. T., Giglio, L., van Leeuwen, T. T., Chen, Y., Rogers, B. M., Mu, M., van Marle, M. J. E., Morton, D. C., Collatz, G. J., Yokelson, R. J., and Kasibhatla, P. S.: Global fire emissions estimates during 1997–2016, Earth Syst. Sci. Data, 9, 697–720, https://doi.org/10.5194/essd-9-697-2017, 2017.
Vicars, W. C., Morin, S., Savarino, J., Wagner, N. L., Erbland, J., Vince, E., Martins, J. M. F., Lerner, B. M., Quinn, P. K., Coffman, D. J., and others: Spatial and diurnal variability in reactive nitrogen oxide chemistry as reflected in the isotopic composition of atmospheric nitrate: Results from the CalNex 2010 field study, J. Geophys. Res.-Atmos., 118, 10567–10588, https://doi.org/10.1002/jgrd.50680, 2013.
Walker, J. M., Philip, S., Martin, R. V., and Seinfeld, J. H.: Simulation of nitrate, sulfate, and ammonium aerosols over the United States, Atmos. Chem. Phys., 12, 11213–11227, https://doi.org/10.5194/acp-12-11213-2012, 2012.
Walker, J. T., Beachley, G., Amos, H. M., Baron, J. S., Bash, J., Baumgardner, R., Bell, M. D., Benedict, K. B., Chen, X., and Clow, D. W.: Toward the improvement of total nitrogen deposition budgets in the United States, Sci. Total Environ., 691, 1328–1352, https://doi.org/10.1016/j.scitotenv.2019.07.058, 2019.
Walters, W.: Data for, “Nitrate Chemistry in the Northeast US Part 1 & Part 2”, Harvard Dataverse V1 [data set], https://doi.org/10.7910/DVN/X6BB1I, 2022.
Walters, W. W. and Michalski, G.: Theoretical calculation of nitrogen isotope equilibrium exchange fractionation factors for various NOy molecules, Geochim. Cosmochim. Ac., 164, 284–297, https://doi.org/10.1016/j.gca.2015.05.029, 2015.
Walters, W. W. and Michalski, G.: Ab initio study of nitrogen and position-specific oxygen kinetic isotope effects in the NO + O3 reaction, J. Chem. Phys., 145, 224311, https://doi.org/10.1063/1.4968562, 2016a.
Walters, W. W. and Michalski, G.: Theoretical calculation of oxygen equilibrium isotope fractionation factors involving various NOy molecules, OH, and H2O and its implications for isotope variations in atmospheric nitrate, Geochim. Cosmochim. Ac., 191, 89–101, https://doi.org/10.1016/j.gca.2016.06.039, 2016b.
Walters, W. W., Tharp, B. D., Fang, H., Kozak, B. J., and Michalski, G.: Nitrogen isotope composition of thermally produced NOx from various fossil-fuel combustion sources, Environ. Sci. Technol., 49, 11363–11371, https://doi.org/10.1021/acs.est.5b02769, 2015a.
Walters, W. W., Goodwin, S. R., and Michalski, G.: Nitrogen Stable Isotope Composition (δ15N) of Vehicle-Emitted NOx, Environ. Sci. Technol., 49, 2278–2285, https://doi.org/10.1021/es505580v, 2015b.
Walters, W. W., Simonini, D. S., and Michalski, G.: Nitrogen isotope exchange between NO and NO2 and its implications for δ15N variations in tropospheric NOx and atmospheric nitrate, Geophys. Res. Lett., 43, 2015GL066438, https://doi.org/10.1002/2015GL066438, 2016.
Walters, W. W., Fang, H., and Michalski, G.: Summertime diurnal variations in the isotopic composition of atmospheric nitrogen dioxide at a small midwestern United States city, Atmos. Environ., 179, 1–11, https://doi.org/10.1016/j.atmosenv.2018.01.047, 2018.
Wang, X., Jacob, D. J., Downs, W., Zhai, S., Zhu, L., Shah, V., Holmes, C. D., Sherwen, T., Alexander, B., Evans, M. J., Eastham, S. D., Neuman, J. A., Veres, P. R., Koenig, T. K., Volkamer, R., Huey, L. G., Bannan, T. J., Percival, C. J., Lee, B. H., and Thornton, J. A.: Global tropospheric halogen (Cl, Br, I) chemistry and its impact on oxidants, Atmos. Chem. Phys., 21, 13973–13996, https://doi.org/10.5194/acp-21-13973-2021, 2021.
Wesely, M. L. and Lesht, B. M.: Comparison of RADM dry deposition algorithms with a site-specific method for inferring dry deposition, Water Air Soil Pollut., 44, 273–293, https://doi.org/10.1007/BF00279259, 1989.
Xing, Y.-F., Xu, Y.-H., Shi, M.-H., and Lian, Y.-X.: The impact of PM2.5 on the human respiratory system, J. Thorac. Dis., 8, E69–E74, https://doi.org/10.3978/j.issn.2072-1439.2016.01.19, 2016.
Yu, Z. and Elliott, E. M.: Novel Method for Nitrogen Isotopic Analysis of Soil-Emitted Nitric Oxide, Environ. Sci. Technol., 51, 6268–6278, https://doi.org/10.1021/acs.est.7b00592, 2017.
Zhang, R., Tie, X., and Bond, D. W.: Impacts of anthropogenic and natural NOx sources over the U.S. on tropospheric chemistry, P. Natl. Acad. Sci., 100, 1505–1509, https://doi.org/10.1073/pnas.252763799, 2003.
Zong, Z., Wang, X., Tian, C., Chen, Y., Fang, Y., Zhang, F., Li, C., Sun, J., Li, J., and Zhang, G.: First Assessment of NOx Sources at a Regional Background Site in North China Using Isotopic Analysis Linked with Modeling, Environ. Sci. Technol., 51, 5923–5931, https://doi.org/10.1021/acs.est.6b06316, 2017.