the Creative Commons Attribution 4.0 License.
the Creative Commons Attribution 4.0 License.
 | 05 Apr 2023
A global evaluation of daily to seasonal aerosol and water vapor relationships using a combination of AERONET and NAAPS reanalysis data
Juli I. Rubin
Jeffrey S. Reid
Peng Xian
Christopher M. Selman
Thomas F. Eck
The co-transport of aerosol particles and water vapor has long been noted in the literature, with a myriad of implications such as air mass characterization, radiative transfer, and data assimilation. Here, the relationship between aerosol optical depth (AOD) and precipitable water vapor (PW) is evaluated to our knowledge for the first time globally, at daily to seasonal levels using approximately 20 years of NASA Aerosol Robotic Network (AERONET) observational data and the 16-year Navy Aerosol Analysis Prediction System (NAAPS) reanalysis v1.0 (NAAPS-RA) model fields. The combination of AERONET observations with small uncertainties and the reanalysis fields with global coverage is used to provide a best estimate of the seasonal AOD and PW relationships, including an evaluation of correlations, slope, and PW probability distributions for identification of statistically significant differences in PW for high-AOD events. The relationships produced from the AERONET and NAAPS-RA datasets were compared against each other and showed consistency, indicating that the NAAPS-RA provides a realistic representation of the AOD and PW relationship. The analysis includes layer AOD and PW relationships for proxies of the planetary boundary layer and the lower, middle, and upper free troposphere. The dominant AOD and PW relationship is positive, supported by both AERONET and model evaluation, which varies in strength by season and location. These relationships were found to be statistically significant and present across the globe, observed on an event-by-event level. Evaluations at individual AERONET sites implicate synoptic-scale transport as a contributing factor in these relationships at daily levels. Negative AOD and PW relationships were identified and predominantly associated with regional dry-season timescales in which biomass burning is the predominant aerosol type. This is not an indication of dry-air association with smoke for an individual event but is a reflection of the overall dry conditions leading to more biomass burning and higher associated AOD values. Stronger correlations between AOD and PW are found when evaluating the data by vertical layers, including the boundary layer and the lower, middle, and upper free troposphere (corresponding to typical water vapor channels), with the largest correlations observed in the free troposphere – indicative of aerosol and water vapor transport events. By evaluating the variability between PW and relative humidity in the NAAPS-RA, hygroscopic growth was found to be a dominant term to (1) amplify positive AOD–PW relationships, particularly in the midlatitudes; (2) diminish negative relationships in dominant biomass burning regions; and (3) lead to statistically insignificant changes in PW for high-AOD events for maritime regions. The importance of hygroscopic growth in these relationships indicates that PW is a useful tracer for AOD or light extinction but not necessarily as strongly for aerosol mass. Synoptic-scale African dust events are an exception where PW is a strong tracer for aerosol transport shown by strong relationships even with hygroscopic effects. Given these results, PW can be exploited in coupled aerosol and meteorology data assimilation for AOD, and the collocation of aerosol and water vapor should be carefully taken into account when conducting particulate matter (PM) retrievals from space and in evaluating radiative impacts of aerosol, with the season and location in mind.
- Article
(35441 KB) - Full-text XML
- BibTeX
- EndNote


The definition of an aerosol is that it is a colloidal system of particles or droplets suspended in a dispersed gaseous medium (Seinfeld and Pandis, 2006). While the word “aerosol” is often taken to represent only the particulate phase, the true definition reminds us of the thermodynamic, compositional, and radiative “whole” that makes up the particulate and dispersed phases of an aerosol parcel. With this definition in mind, an important aspect of aerosol parcels that should be considered is the covariability between the aerosol particles and the dispersed water vapor. While the aerosol and water vapor relationship is generally accounted for in the context of relative humidity, hygroscopicity, and optical properties (e.g., Hänel et al., 1976; Charlson et al., 1992), the covariability of aerosol particles and dispersed water vapor is important in its own right. Early studies of collocated aerosol and water vapor measurements demonstrated the structural covariability between the two components (e.g, Stull and Eloranta 1984; Kleinman and Daum, 1991; Turner 2002; De Tomasi and Perrone, 2003). Now, coupled aerosol–water vapor profiles are commonly used to infer aerosol layer structure (e.g., Livingston et al., 2003; Reid et al., 2003, 2008, 2019; Wang et al., 2012; Yufeng et al., 2018), cloud detrainment (Su et al., 2011; Reid et al., 2019; He et al., 2021), and mixed layer properties (Späth et al., 2016). Even integrated aerosol optical depth (AOD) and precipitable water vapor (PW) comparisons have utility and have been used to identify air masses, transport pathways, and aerosol optical properties. Regional studies include Africa (Kumar et al., 2017; Xian et al., 2020), the Amazon (Kaufman and Frasier, 1997; Martins et al., 2018), India (Kumar et al., 2013; and Kannemadugu et al., 2015), and North America (O'Neil et al., 1993; Smirnov et al., 1994). Notable examples of co-transport of aerosol particles and water vapor include the African Monsoon Multidisciplinary Analysis (AMMA) in which elevated biomass burning aerosol layers were found with higher water vapor concentrations than the surrounding air (Kim et al., 2009). Likewise, Marsham et al. (2016) investigated water vapor enhancements with dust in the Saharan Air Layer (SAL).
Higher PW amounts are typically associated with higher cloud cover fractions. These higher cloud fractions create additional environmental conditions for enhancements of the aerosol AOD and PW relationship. There is a high RH halo around cumulus clouds (Radke and Hobbs, 1991; Perry and Hobbs, 1996,) which increases the near-cloud hygroscopic growth of aerosol. Additionally, the passage of aerosol through clouds by convection and/or advection also increases hygroscopic growth. Cloud processing of particles in cloud droplets and new particle formation from gas-to-particle reactions in cloud water droplets are also important. Examples of remote sensing observations from NASA Aerosol Robotic Network (AERONET) of cloud processing increasing AOD in layer clouds and/or fog are given in Eck et al. (2012) and in the vicinity of cumulus clouds in Eck et al. (2014). Additionally, high-AOD events were often found to be associated with clouds in East Asia (Eck et al., 2019; Arola et al., 2017).
In addition to its utility as a tracer for transport and mixing, the aerosol particle–water vapor co-transport is significant in regard to relative contributions to overall solar and terrestrial radiative effects (Rosario et al., 2011; Marsham et al., 2016; Deaconu et al., 2019; Gutleben et al., 2019; Granados-Muñoz et al., 2019; Zhu et al., 2019; Yu et al., 2021). Similarly, co-transport must be considered in atmospheric correction of land, ocean, and atmospheric products (e.g., Sobrino et al., 1993; Eck and Holben 1994; DeSouza-Machado et al., 2006; Luo et al., 2019; Zeng et al., 2017; Patadia et al., 2018; Frouin et al., 2019; Ibrahim et al., 2019; Miller et al., 2019). As previously noted, there are also links to cloud development and potentially indirect effects (Ten Hoeve et al., 2011; Pistone et al., 2016). Ultimately, the coupled aerosol particle–water vapor system must be considered jointly to adequately contain overall climate budgets and forcing (Kaufman and Fraser, 1997; Wong et al., 2009; Schneider et al., 2010; Sherwood et al., 2010; Haywood et al., 2011; Huttunen et al., 2014; Yu et al., 2014; Spyrou 2018).
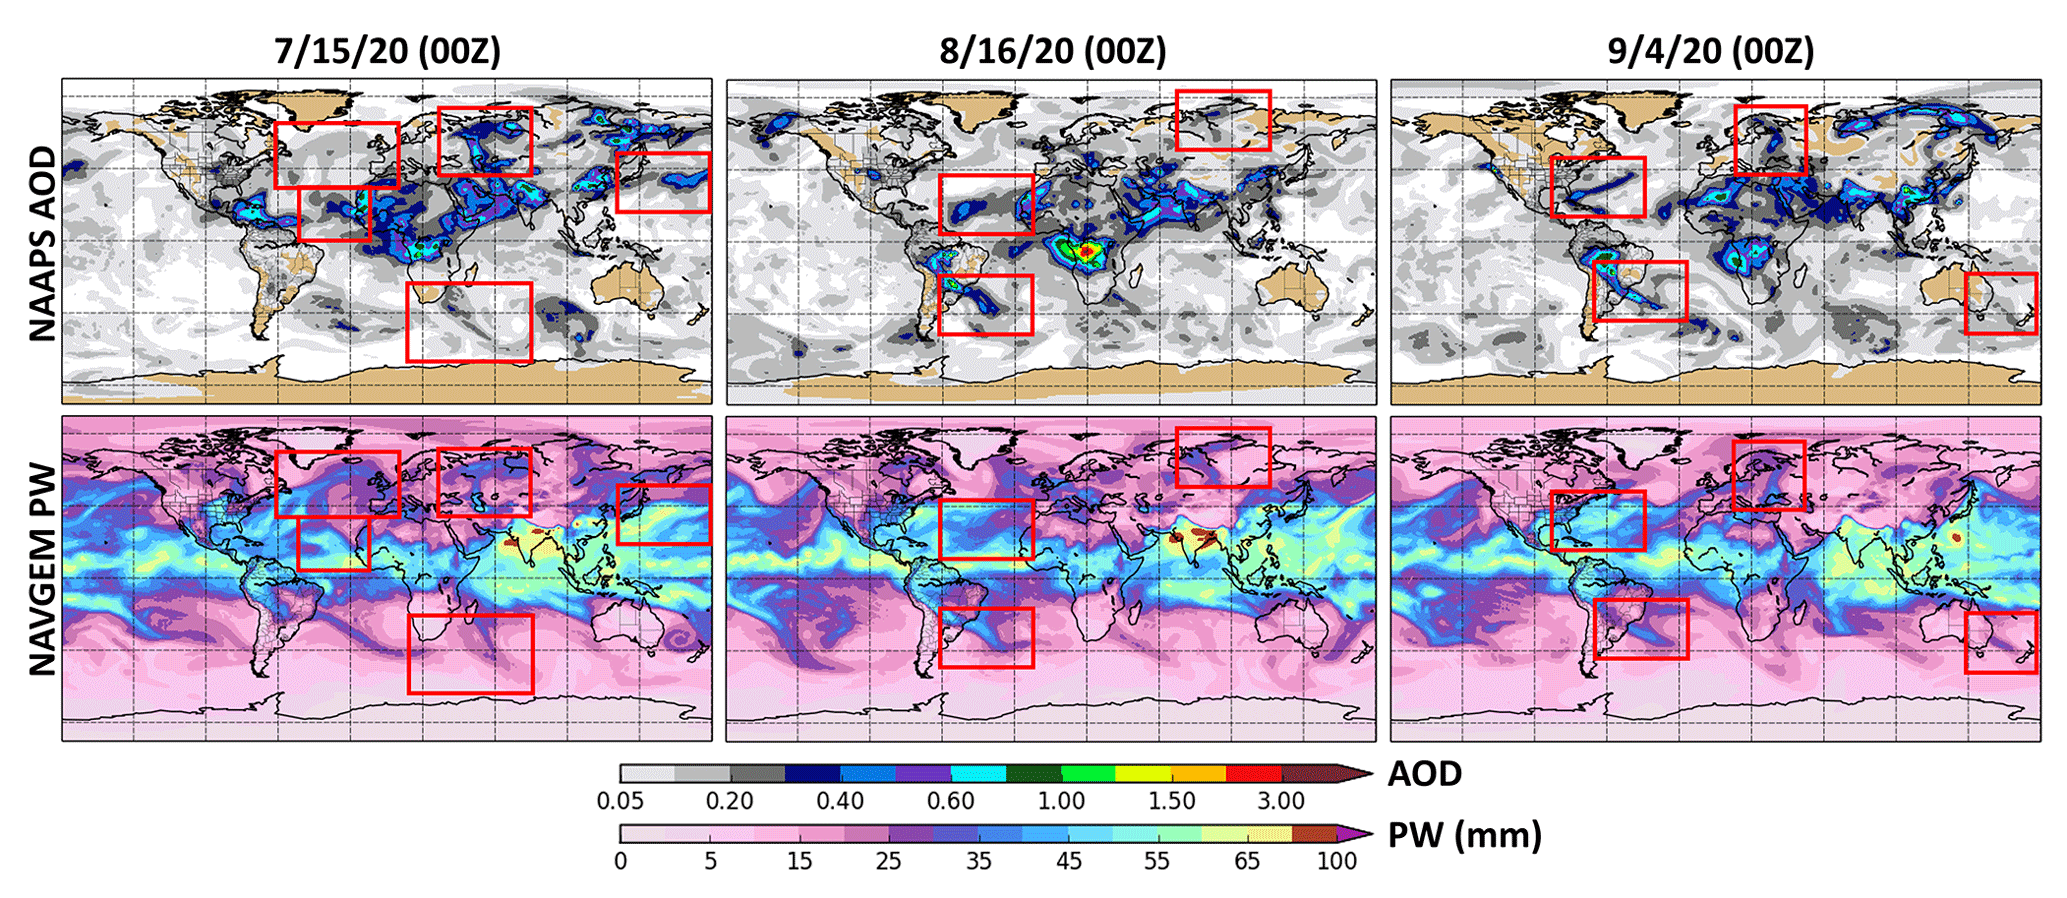
Figure 1Examples of NAAPS AOD and NAVGEM PW forecasts in which similar synoptic-scale transport patterns are found, particularly in the midlatitudes. Aerosol and water vapor features with similar transport patterns are highlighted in matching red boxes in the AOD and PW plots. These types of co-transport events of both positive and negative correlation are found in forecasts on a daily basis.
Finally, recent advances in coupled data assimilation (DA) allow for not only a joint analysis of aerosol particles and water vapor, as is done in weakly coupled approaches, but for observations to jointly influence posteriors through cross-covariances in strongly coupled DA (Liu et al., 2011; Lee et al., 2017; Ménard et al., 2019). The hope is that strongly coupled DA can be used to generate a more consistent representation of coupled atmospheric systems. In the context of the aforementioned references on the coupled aerosol particle–water vapor system, there is now a more pressing need for evaluating joint aerosol and water vapor measurements. This is further emphasized by the observed frequency of aerosol and water vapor co-transport in both forecast models and satellite observations. Similar spatial patterns between aerosol optical depth (AOD) and precipitable water vapor (PW) can be observed on a daily basis in model analyses, forecasts, and satellite products such as the Morphed Integrated Microwave Imagery at CIMSS – Total Precipitable Water (MIMIC-TPW) (Wimmers et al., 2011), particularly associated with midlatitude fronts. An example of forecasts of TPW and AOD from the Navy Global Environmental Model (NAVGEM) (Hogan et al., 2014) and Navy Aerosol Analysis Prediction System (NAAPS; Lynch et al., 2016), respectively, is shown in Fig. 1 in which co-transport regions are highlighted. Aerosol and water vapor relationships are not expected to be universal and will likely vary in magnitude from air mass to air mass due to differences in sources, physics, and overall vertical distribution. While the previously mentioned studies have found relationships between aerosol and water vapor for a host of case or local studies, this relationship has not to our knowledge been evaluated on a larger spatial and temporal scale for broad applicability for aerosol forecasting and data assimilation.
This is the first of several studies developing coupled data analysis and assimilation of the water vapor–aerosol particle system. Here, the project begins by focusing on observations of synoptic-scale temporal and spatial relationships using the extensive NASA Aerosol Robotic Network (AERONET; Holben et al., 1998; Giles et al., 2019). The advantage of AERONET for this study is that the data record is long and includes high-frequency ground-based measurements of both aerosol in the form of AOD and water vapor in the form of PW with sites located across the globe. Additionally, AERONET measurements are made throughout the entire daylight hours when the sun is not obscured by clouds. It should be noted that this does result in a high-pressure bias in AERONET data since few measurements are possible in extensive cloud fraction conditions. Another important advantage is that the observations can be made effectively in the near vicinity of clouds without the commonly observed satellite measurement artifacts of multiple scattering between clouds, molecules, and particles, which enables a minimization of cloud contamination in the near vicinity of clouds as compared to satellite observations. While the AERONET network is extensive, it cannot provide a full global evaluation of the aerosol and water vapor relationship. Therefore, the relationships identified in the AERONET dataset are compared against model AOD and PW relationships found in the NAAPS reanalysis (NAAPS-RA) dataset (Lynch et al., 2016). A description of both the AERONET and NAAPS-RA datasets and the analyses conducting for quantifying the global AOD and PW relationships are described in the Methods section below. The results of the analysis are discussed in the context of large-scale relationships between column-integrated AOD and PW. A follow-on study will then take the relationships found in this work and move on to evaluate the relationships on an event level in space and time as well as the controlling factors that drive the aerosol and water vapor relationship, in particular, how much synoptic-scale transport controls the observed covariability.
In order to evaluate the relationship between column-integrated aerosol and water vapor in space and time, the AERONET observational network is used as it provides joint measurements of aerosol and water vapor with low levels of uncertainty and has a large number of sites located across the globe and a long data record. While AERONET measurements are column-integrated, they provide a good starting point for understanding the observed aerosol and water vapor relationships at locations across the globe. As a first step, relationships are quantified at AERONET sites between daily-averaged AOD and PW measurements. The focus here is on the synoptic-scale relationships between aerosol and water vapor. Therefore, daily-averaged relationships are evaluated in this analysis, using correlations and an evaluation of the water vapor probability distributions to identify statistically significant changes in PW with AOD. The evaluation is then extended to the NAAPS-RA dataset in order to provide a more complete global perspective in the full column as well as in different vertical components of the atmosphere, including the boundary layer and free troposphere, as a means to understand how these relationships vary when considering vertical position. Finally, the impact of relative humidity and hygroscopic growth covariability on model-predicted AOD and PW relationships is evaluated.
2.1 Data description
2.1.1 AERONET AOD
AERONET is a global ground-based network of sun photometers that measure direct sun and sky radiance over a range of wavelengths (340–1640 nm). These measurements are used to generate column-integrated aerosol properties of AOD and aerosol microphysical and radiative properties (Holben et al., 1998; Giles et al., 2019). The network includes over 600 sites, with data available at https://aeronet.gsfc.nasa.gov/ (last access: April 2021). The uncertainty in AERONET AOD is reported to be ∼0.01–0.02 for level 2 data, with the higher uncertainty of 0.02 pertaining to the UV wavelengths and the lower ∼0.01 uncertainty associated with visible and near-infrared wavelengths (Eck et al., 1999). Due to this low uncertainty, AERONET AOD observations are used for validation of satellite retrievals (Remer et al., 2002; Ichoku et al., 2002; Kahn et al., 2005) as well as for verification of model forecasts (Zhang et al., 2008; Benedetti et al., 2008; Sessions et al., 2015; Xian et al., 2019). For this analysis, AERONET version 3 (Giles et al., 2019), level 2 daily-averaged AOD observations are used. AERONET AOD observations at 675 nm for all available sites were collected, and sites that had a minimum of 100 daily-averaged values were retained for the analysis, with seasonal data counts in Fig. 2. The 675 nm wavelength was selected as it is a core AERONET wavelength that is available at all sites and provides parity for both the fine and coarse aerosol modes. It should be noted that the AERONET-Maritime Aerosol Network (MAN) data are not included in this analysis as MAN data are shipborne and available on a periodic basis and thus are not consistent with the long-term evaluation at fixed points that is conducted in this work.
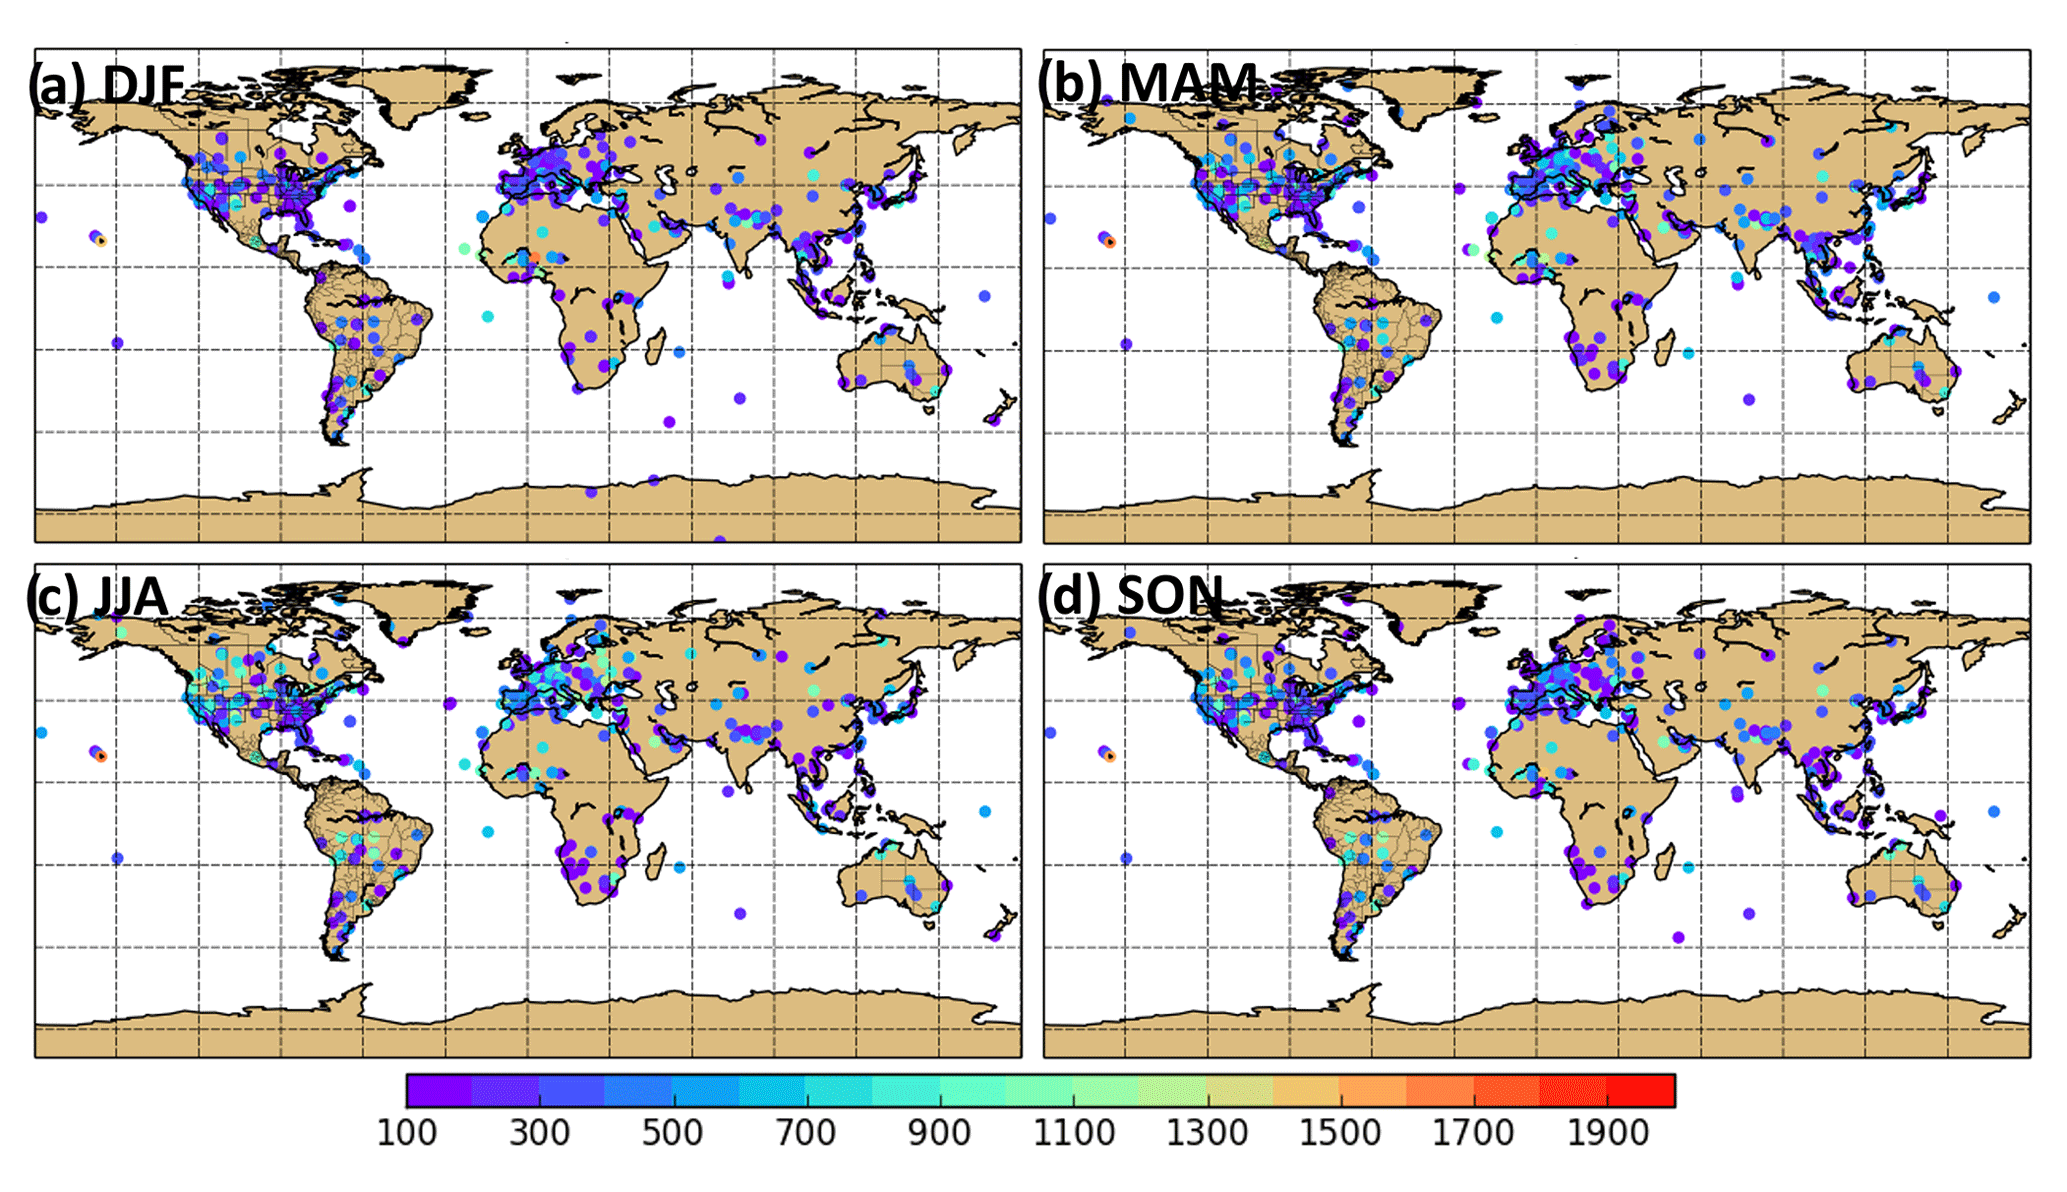
Figure 2Count of daily-averaged AERONET AOD and PW data points by season: (a) DJF, (b) MAM, (c) JJA, and (d) SON. Only sites with at least 100 points are shown.
2.1.2 AERONET water vapor
Precipitable water vapor (PW), a measure of the total amount of water vapor contained in a vertical column from the surface to the top of the atmosphere, is retrieved from AERONET direct sun irradiance measurements in the water vapor absorption band around 940 nm. The uncertainty of AERONET water vapor data is reported at 12 % (Sano et al., 2003), and more recently, an analysis of uncertainty against radiosonde, microwave radiometry, and GPS data indicated a dry bias of 5 %–6 % and a total estimated uncertainty of 12 %–15 % (Perez-Ramirez et al., 2014). The evaluation by Perez-Ramirez et al. (2014) with the identified uncertainty range of 12 %–15 % included PW retrieval comparison at three sites located in the tropics, the midlatitudes, and the Arctic, covering a range of climatic conditions and temperature–water vapor profiles and, therefore, provides a reasonable uncertainty estimate for the entire AERONET network. The PW data used in this analysis come from the same AERONET version 3, level 2 daily-averaged dataset that is used for the AOD data. As was the case for the AERONET AOD data, sites that had a minimum of 100 daily-averaged values were retained for the analysis (Fig. 2).
2.1.3 NAAPS reanalysis
The NAAPS aerosol reanalysis v1.0 (Lynch et al., 2016) is a standardized global modal AOD product generated by the U.S. Naval Research Laboratory (NRL) that extends over a 16-year time period (2003–2019). The core of the aerosol reanalysis is the NAAPS offline aerosol transport model and its associated 2-dimensional variational data assimilation system, the Navy Variational Data Assimilation System for Aerosol Optical Depth (NAVDAS-AOD). NAAPS has been run semi-operationally at NRL since 1998 and became operational at the Fleet Numerical Meteorology and Oceanography Center (FNMOC) in 2006, with NAVDAS-AOD operationally implemented in 2010. For the NAAPS-RA, NAVDAS-AOD is used to assimilate quality-assured and quality-controlled AOD retrievals from the Moderate Resolution Imaging Spectroradiometer (MODIS) and Multi-angle Imaging SpectroRadiometer (MISR). AERONET is not assimilated in the NAAPS-RA.
NAAPS generates 3-dimensional forecasts of dust, smoke, sea salt, and anthropogenic–biogenic fine aerosol (ABF; also referred to in this work as pollution) mass concentration fields and the associated 3-dimensional aerosol extinction and column-integrated AOD fields. As an offline model, NAAPS is driven by meteorological fields from the Navy Global Environmental Model (NAVGEM) (Hogan et al., 2014), using analysis fields every 6 h and forecasts provided at 3 h intervals. The NAVGEM analysis fields are generated using NAVDAS for assimilation of a large number of conventional and satellite-based observations (Daley and Barker, 2001). NAVGEM variables used by NAAPS include the topography, sea ice, snow cover, surface stress, surface heat/moisture fluxes, precipitation, lifting condensation level, and cloud cover and height, as well as 3-dimensional winds, temperature, and, the most relevant for this work, humidity. For the NAAPS analysis, aerosol sources, including dust and smoke, and deposition processes were regionally tuned to best match observations (AERONET, MODIS). A detailed description of the NAAPS-RA v1.0 is described in Lynch et al. (2016).
In NAAPS, the Hanel (1976) formulation of the hygroscopic growth factor (f) for a given species i and relative humidity (r) is used to represent the effect of humidity on particle light scattering, defined as
where γi is an empirical species-dependent exponent (anthropogenic/biogenic fine (ABF) = 0.5, assuming 40 % sulfate and 60 % organics, smoke = 0.18, sea salt = 0.46, dust = 0), and ro is the reference relative humidity of 30 %. The hygroscopic growth factor is applied when calculating the aerosol scattering coefficient. In order to assess the impact of hygroscopic growth on model-predicted AOD and PW correlations, a “dry” AOD is also calculated for the NAAPS-RA in which the hygroscopic growth factor is not applied.
For this work, the NAAPS-RA v1.0 AOD fields and the NAVGEM humidity fields used in generating the NAAPS-RA are extracted for the full 16-year dataset (2003–2019). NAVGEM humidity fields were integrated vertically to generate model-predicted PW fields, and both the PW and AOD fields were averaged on a daily basis. Additionally, “dry” AOD fields were calculated for the NAAPS-RA and, likewise, averaged on a daily basis.
2.2 AOD and PW relationship analysis
2.2.1 Correlation analysis
As a first step in understanding the relationship between aerosol and water vapor in the AERONET data record, correlations (Pearson correlation coefficients) are calculated at each AERONET site with a minimum of 100 data points. The correlations are calculated between the daily-averaged AOD (675 nm) and PW datasets seasonally (December–January–February (DJF), March–April–May (MAM), June–July–August (JJA), September–October–November (SON)). This analysis is used to identify when and where relationships exist between AOD and PW in the data record and the strength of the relationship. In order to provide global context to the AERONET AOD and PW correlations, the same analysis was conducted using the NAAPS 16-year v1.0 reanalysis dataset. The seasonal reanalysis correlations were calculated in a similar manner as the AERONET data, using daily-averaged model-generated AOD and PW values. The model-generated values were then compared against observationally generated AERONET correlations. The correlations in both the AERONET and NAAPS-RA evaluation were tested for statistical significance at the 95 % confidence level.
2.2.2 Slope evaluation
In addition to the AOD and PW Pearson correlation coefficients calculated from the AERONET and NAAPS-RA datasets, the slopes of the AOD and PW relationship were calculated from the seasonal data using a Theil–Sen regression. The Theil–Sen regression is a robust method for fitting a line to sample points by choosing the median of slopes of all lines through pairs of points. Due to the use of the median slope, the Theil–Sen method is insensitive to outliers and, therefore, a useful method for this analysis. With the Theil–Sen regression, a 95 % confidence interval of the Theil–Sen slope was calculated for each location and season.
2.2.3 Evaluation of the AOD and PW probability distribution
In addition to a correlation and slope analysis, the AOD and PW probability distributions were also evaluated. Given the expectation that aerosol and water vapor relationships will change depending on the air mass, seasonal correlations can obscure the presence of aerosol and water vapor relationships when air masses with an existing relationship between aerosol and water vapor occur infrequently. In this evaluation, the PW distribution associated with high-AOD events, defined as having an AOD value greater than 1 standard deviation above the mean, was compared to the PW distribution for all data for a given location and season. A t test was conducted to identify statistically significant differences in the PW distribution means for the high-AOD events and all data (p value = 0.05). This analysis was conducted seasonally (DJF, MAM, JJA, SON) using both the AERONET and the NAAPS-RA datasets.
2.2.4 Vertical evaluation of the AOD and PW relationship
While the global and AERONET site AOD and PW evaluations as well as the studies cited in the Introduction provide an understanding of the column-integrated relationship between aerosol and water vapor, an additional evaluation was conducted to look at the aerosol and water vapor relationship in different levels of the troposphere. This evaluation was conducted using the NAAPS-RA fields only, since observations of joint aerosol and water vapor vertical structure are limited. Model-generated correlations were calculated for a defined boundary layer (BL), lower free troposphere (LT), middle free troposphere (MT), and upper free troposphere (UT) region. The total aerosol extinction and specific humidity from the reanalysis were vertically integrated in the first 1 km of the atmosphere as a representation of the boundary layer. Integration levels in the free troposphere were selected based on the sensitivities of the upper-level, mid-level, and lower-level geostationary water vapor channels on the NOAA Geostationary Operational Environmental Satellite (GOES) Advanced Baseline Imager (ABI) and the JMA Advanced Himawari Imager (AHI), with a goal of using these water vapor channels to further explore aerosol and water vapor relationships in future work. The selected integration levels were from 800 to 500 hPa (LT), 600 to 300 hPa (MT), and 400 to 300 hPa (UT), respectively. The vertically integrated relationships, as was done for the full column-integrated evaluation, are calculated seasonally and are used to identify if the model correlations are controlled by aerosol and water vapor in certain parts of the atmosphere. While the boundary layer is expected to be a dominant control of the signal, given the sources of both aerosol and water vapor are within the boundary layer, strong correlations within the free troposphere could indicate aerosol and water vapor relationships as a result of lifting from the surface or long-range transport which typically occurs within the free troposphere.

Figure 3Mean AOD and precipitable water (cm) for the NAAPS-RA and at AERONET sites by season: DJF, MAM, JJA, and SON.
2.2.5 Impact of hygroscopic growth on AOD and PW relationships
It is well documented in the literature that water uptake on aerosol particles under moist conditions impacts aerosol optical properties. Because of this, it is necessary to understand how much hygroscopic growth impacts AOD and PW relationships through covariability of PW and relative humidity. The data to evaluate this observationally are not available; therefore, the NAAPS-RA is used to evaluate the impact of the hygroscopic growth factor on model-predicted correlations. As a first step in this evaluation, the correlation between PW and relative humidity was calculated by season for the previously defined vertical components of the atmosphere (boundary layer and lower, middle, and upper free troposphere). In order to calculate relative humidity for each defined part of the troposphere, a saturation specific humidity was calculated in each model level using the reanalysis pressure and temperature fields as input. Both the specific humidity and the saturation specific humidity were vertically integrated over the defined levels, and the ratio of the two values was used to produce a relative humidity that conserves the amount of water vapor through the associated portion of the troposphere. This analysis gives a first look at where the covariability between PW and RH is expected to be most impactful on the AOD and PW relationship. However, given aerosol hygroscopic growth is dependent on aerosol type, the analysis was taken a step further by calculating the seasonal relationships, including correlations/slopes and the probability distribution evaluation, between dry AOD and PW. The dry AOD, in which the impact of hygroscopic growth on AOD is removed as described in the NAAPS-RA (Sect. 2.1.3), was calculated for the full dataset. The relationships using the dry AOD are compared to the standard AOD–PW results as a means to evaluate the impact of hygroscopic growth on the modeled AOD and PW relationships.
2.2.6 Evaluation at individual AERONET sites
While the previous analyses provide a global perspective on the aerosol and water vapor relationships, the relationships were also evaluated at select AERONET sites to provide a first look at what is driving the observed covariability between AOD and PW on an event level. The AERONET sites, including Tallahassee, Florida, in the Southeastern United States; Beijing, China, in East Asia; Izaña, Canary Islands, off the coast of Africa; and Alta Floresta, Brazil, in South America, are selected based on the strength of the observed/modeled relationships, and cases are selected for different seasons that exhibited both positive and negative relationships. While this evaluation does not by any means provide a complete understanding of the drivers of these relationships across the globe, it can be used to provide some insight.
This study is highly multi-dimensional. In order to elucidate the findings, the results are first presented as a global evaluation, which is followed by a more in-depth discussion by region and level, accounting for the impacts of hygroscopicity. As aerosol regimes are typically seasonal in nature, all evaluations are performed for DJF, MAM, JJA, and SON. Summaries of the data used in the analyses are presented in Figs. 2 through 6, including Fig. 2, seasonal counts of daily-averaged AERONET AOD and PW data; Fig. 3, seasonal mean AERONET and NAAPS-RA AOD and PW values; Fig. 4, seasonal NAAPS-RA AOD averages by aerosol types (dust, sea salt, anthropogenic/biogenic fine, biomass burning); and Figs. 5 and 6, the NAAPS-RA AOD and PW (respectively) 25th, 75th, and 90th percentiles from daily data and associated interquartile range (IQR) by season. In regard to the AERONET analysis, only sites with a minimum of 100 data points are included, as previously discussed. Due to this constraint, some temporary sites used for field campaigns are excluded in this work.
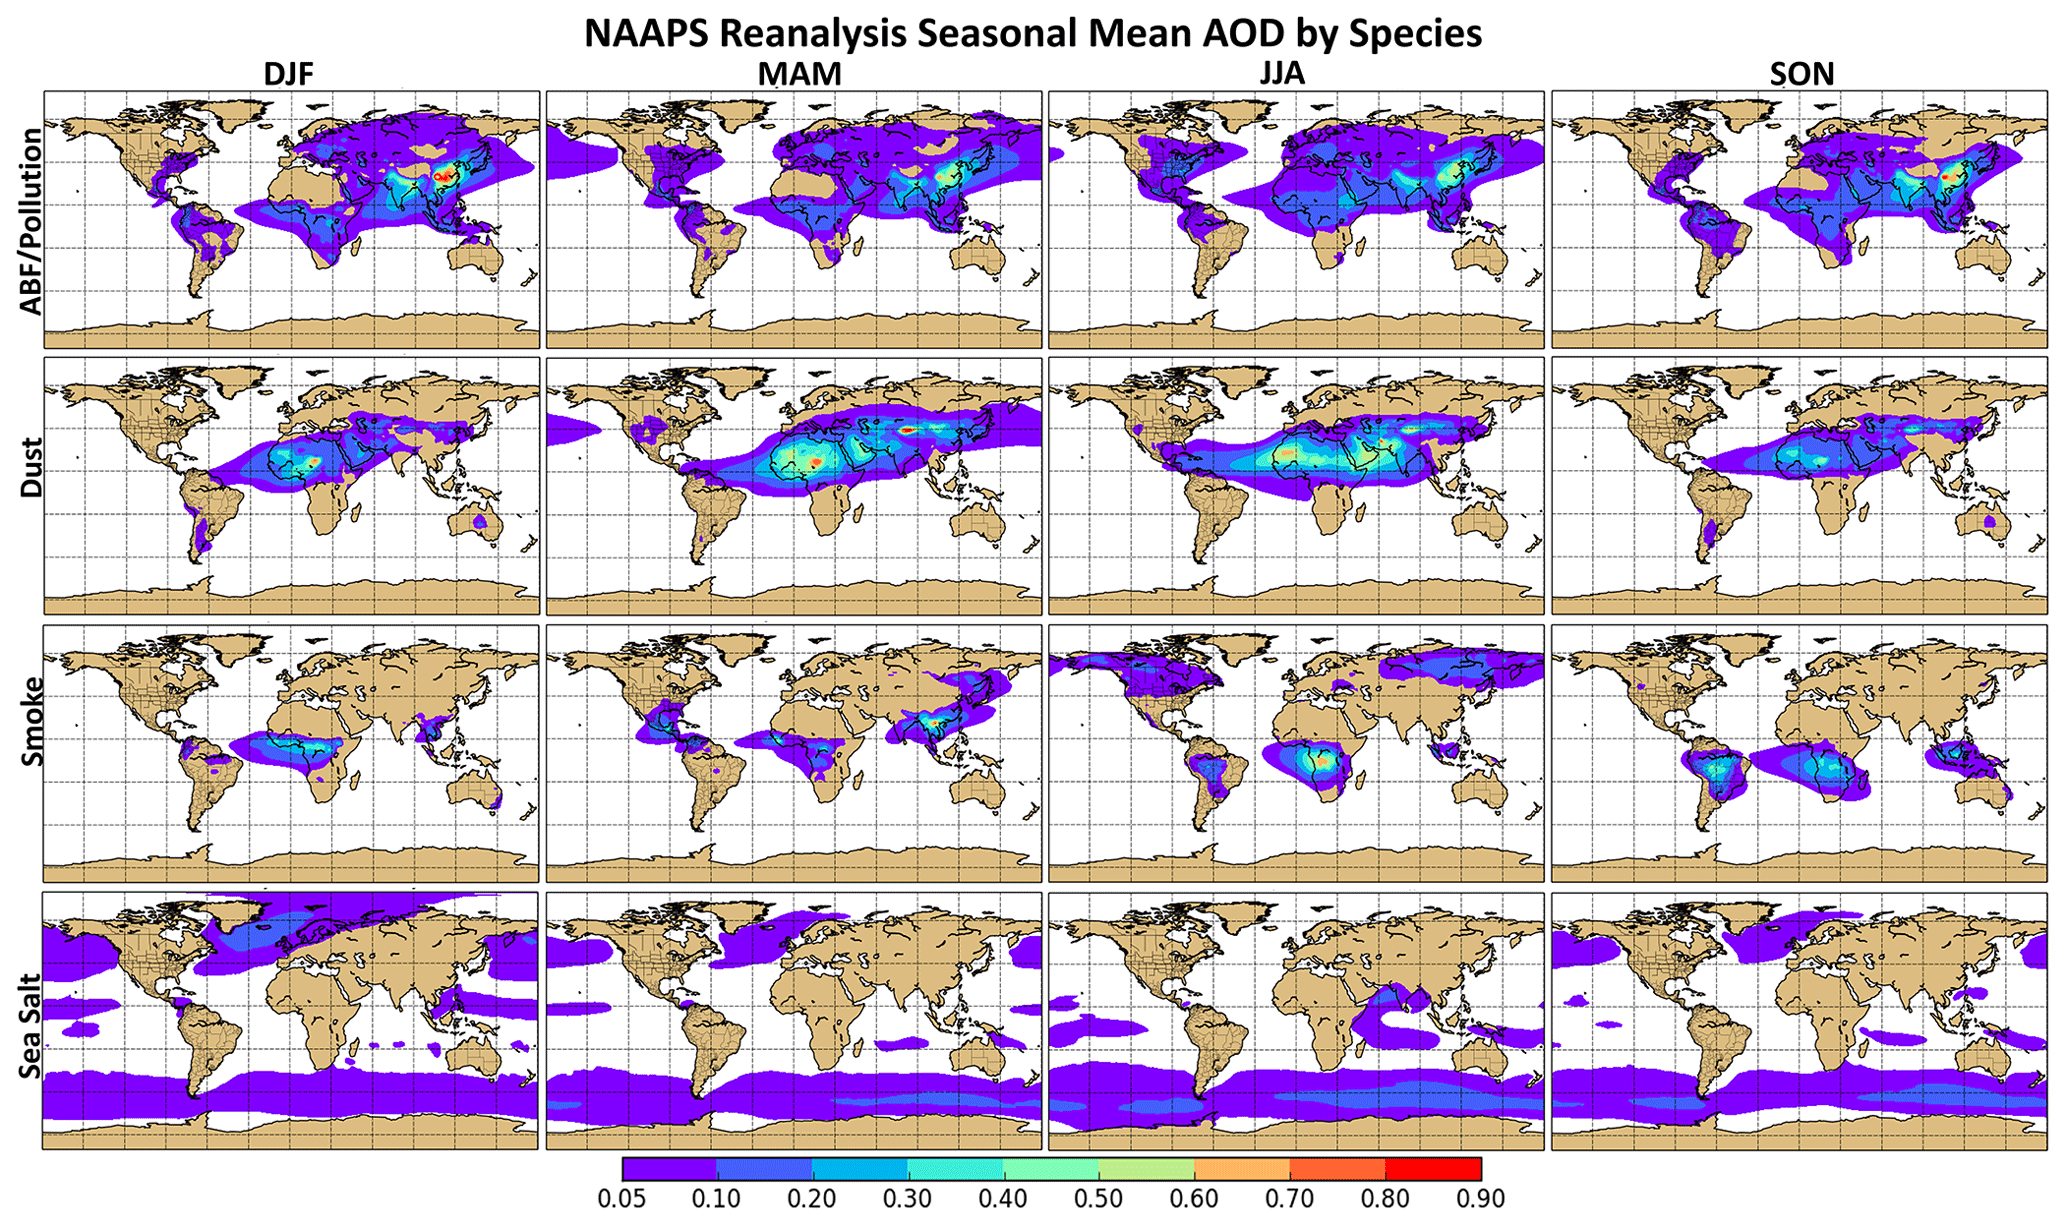
Figure 4NAAPS-RA seasonally averaged AOD by aerosol type, including pollution (anthropogenic and biogenic fine aerosol), dust, smoke, and sea salt.
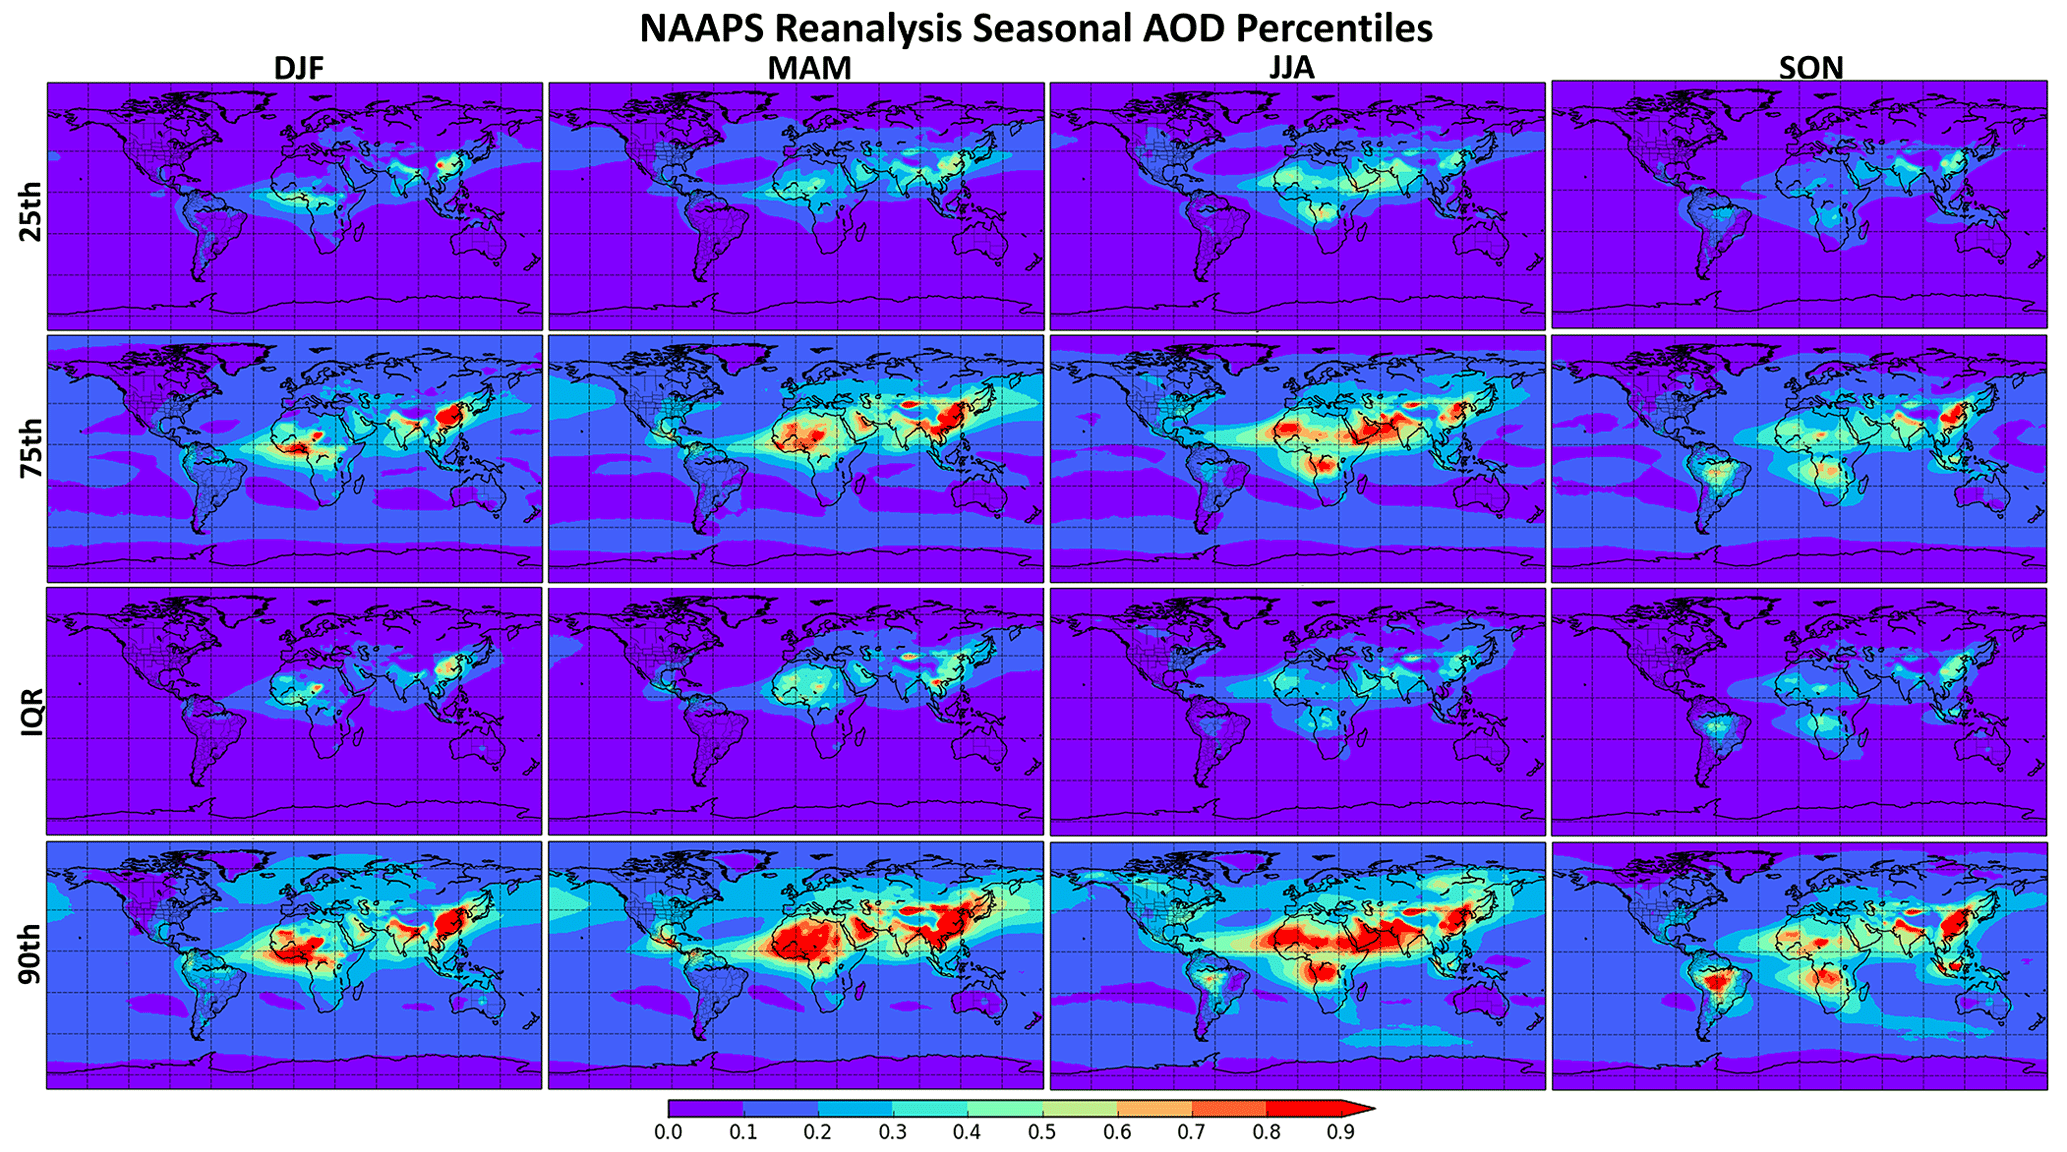
Figure 5NAAPS-RA AOD percentiles by season (DJF, MAM, JJA, SON). The 25th and 75th percentiles are shown, along with the interquartile range (IQR). The 90th percentile is used to show high AOD values at a given location.
3.1 Global patterns of AOD–PW correlation
Overall, the seasonal patterns in both AOD and PW are pretty consistent between AERONET and the NAAPS-RA (Fig. 3). For example, peak AOD values in North America and Europe occur during the summer months in both datasets. Likewise, peak AOD values are found over the Sahel in winter and spring due to a combination of dry-season biomass burning and dust associated with the northeasterly Harmattan winds with shifts in peak AOD further north in summer due to increased dust activity over the Sahara. Like the Sahel, peak AOD values associated with fire activity during regional dry seasons are also found in both datasets for Central and South America, southern Africa, and Southeast Asia. Boreal regions, which also exhibit seasonality due to fires in summer months, are not as well sampled in the AERONET dataset, making it harder to see seasonal shifts in AOD. However, this seasonality is found in the NAAPS-RA. Likewise, northward shifts in PW are seen in AERONET and the NAAPS-RA in the summer and a southward shift in the winter months. A more in-depth discussion of the data by region, which is consistent with verification regions presented in Lynch et al. (2016) and Rubin et al. (2016), is presented below:
-
North America. The largest number of AERONET sites is present in this region, with ∼180 included in the analysis. AERONET data counts are the highest in the summer months (JJA), which also coincides with peak mean AOD and PW values in both the AERONET and NAAPS-RA datasets (Fig. 3). Summertime peak AOD values are associated with ABF and smoke aerosol types, concentrated to the north, and a combination of ABF and transported dust to the south (Fig. 4). Despite JJA being associated with the highest AOD values, the IQR is only around 0.1–0.2 (Fig. 5). The 90th percentile AOD values in JJA for North America are mainly associated with large smoke events, particularly originating from the Pacific Northwest and boreal regions (Fig. 5). High AOD values are also observed in MAM months, concentrated in the Southeastern United States (Figs. 2 and 5), associated with smoke (originating from Central American fires) and ABF/pollution aerosol types (Fig. 5).
-
Europe. Data from ∼125 AERONET sites were included in the analysis in Europe. Like the North American region, peak AERONET data counts occur during JJA months (Fig. 2). Peak AOD values are observed during MAM and JJA (Figs. 3 and 5), mainly associated with pollution in eastern Europe and Mediterranean dust (Fig. 4). PW values also peak during JJA (Figs. 2 and 6). AOD IQR values, like North America, are relatively small and on the order of 0.1–0.2 in JJA and MAM, with 90th percentile AOD events in the 0.3–0.5 range.
-
East Asia. The analysis in East Asia included data from ∼52 AERONET sites. AERONET data counts are relatively consistent throughout the seasons (Fig. 2). AOD values in East Asia are high throughout the year due to the presence of pollution, concentrated to the east, and dust, particularly in the spring and summer (Fig. 4). While pollution aerosol is present throughout the year, AOD values tend to be higher in the winter months than the summer months in the NAAPS-RA (Figs. 3 and 5), with the strength of the East Asian Monsoon being a controlling factor in the spatial distribution and aerosol concentration in the region (Zhang et al., 2010; Yan et al., 2011; Zhu et al., 2012; Mao and Liao, 2017). However, in the AERONET dataset, the highest AOD values are observed in the summer months, consistent with the literature (Eck et al., 2005, 2018). This discrepancy may be related to the satellite data that are assimilated in the NAAPS-RA in the summer months. High AOD values are often misclassified as cloudy by the retrieval algorithms and subsequently screened (Eck et al., 2018), which can contribute to low AOD biases in the model (Reid et al., 2022). The range in AOD values is particularly large over East Asia, as shown by the percentiles in Fig. 5, with peak IQR values of around 0.6–0.7 occurring during DJF.
-
South America. Data from ∼44 AERONET sites were used in the analysis in South America. AERONET data counts are the greatest during JJA and SON months, which is coincident with the highest AOD values. This is particularly the case in SON, which is the dry season in South America when fire activity is increased. The dominance of smoke aerosol is shown in the NAAPS-RA for these months (Fig. 4). Extreme event AOD values (90th percentile) and the IQR are the greatest for SON, again due to fire activity (Fig. 5).
-
Northern Africa. Data from ∼39 sites were used for evaluation in northern Africa. Data counts are relatively consistent across the seasons with the exception of the Banizoumbou site, Niger, with approximately 1600 data points from 16 years of data during the DJF season. The AERONET and reanalysis average AOD values for the northern African Sahel region peaks in the winter and spring months (DJF, MAM) due to a combination of dust and smoke aerosol (Fig. 4). Peak Sahel AOD values coincide with the Intertropical Convergence Zone (ITCZ) being in its most southern position, which is shown in the PW fields (Figs. 3 and 6). Northern Africa, particularly the Sahara, has high AOD in the spring and summer months due to dust outbreaks, with peak AOD values exceeding 1 and IQR values in the 0.4–0.5 range (Fig. 5).
-
Southern Africa. The analysis in southern Africa included data from ∼30 AERONET sites. AERONET data counts are pretty consistent throughout the year; however, there are fewer sites available for analysis during the DJF months. AOD values in southern Africa are the highest in JJA and SON, which is coincident with peak fire activity in the region.
-
Arabian Peninsula. AERONET data counts from ∼20 sites are consistent across the seasons in this region. While dust emissions are present through the year, peak dust activity occurs in the summer months as shown in the AERONET and NAAPS-RA AOD mean and percentile values (Figs. 3 and 5).
-
India. The number of AERONET sites was ∼20 in India, with locations concentrated towards the north for sampling the Indo-Gangetic Plain in which pollution-dominated AOD is present throughout the year, with peak AOD values exceeding 1 during all seasons (Figs. 3–5). Dust aerosol from the Thar Desert and the Arabian Peninsula is transported to western India, particularly in the MAM and JJA seasons, while smoke aerosol contributes to AOD in eastern India in MAM. AOD and PW are heavily influenced by the summer monsoon season in which peak PW is observed (Figs. 3 and 6).
-
Southeast Asia. Data from ∼21 sites were available for the analysis in Southeast Asia. The number of sites used is greatest in the spring (Fig. 2), coincident with the peninsular Southeast Asia fire season in which peak AOD values exceed 1 and large IQR values are present (Fig. 5). Peak AOD values shift towards insular Southeast Asia during the SON months in which fire activity increases. Pollution is also present throughout the year.
Regressions of AOD and PW for the daily data by season, including correlation coefficients and slopes, and the statistically significant difference in mean PW between the distribution associated with high-AOD events only and the full PW distribution for both the NAAPS-RA and AERONET daily data are presented in Fig. 7, with confidence intervals on the Theil–Sen slopes shown in Fig. 8. Red regions/sites indicate a positive correlation in which higher PW is associated with higher AOD values, and blue regions indicate a negative relationship in which lower PW is associated with high AOD values. For all evaluations in Fig. 7, the predominant signal is positive (i.e., red) in both the AERONET observations and the NAAPS-RA, with the strongest correlations varying by season and/or aerosol regime. In the AERONET dataset, the strongest positive correlations are summarized in Tables 1–4 for DJF, MAM, JJA, and SON, respectively. Also included are NAAPS-RA values for these sites as a means of comparison. For winter months (DJF), the strongest positive correlations (>0.6) occur at sites in the Southeastern United States and East Asia and select sites in the Middle East such as Dhadnah, UAE (Table 1). In the spring months (MAM), dominant positive relationships occur at mostly eastern US sites and the Nainital site in India (Table 2). Southern Africa sites associated with smoke aerosol, eastern European sites, and select sites in the eastern United States have the strongest positive correlations in the summer months (JJA) (Table 3, Fig. 7). In the fall (SON), AERONET positive correlations are strongest for the eastern United States, select European sites, and a site at Dhadnah, UAE.
Table 1AOD and PW relationship evaluation results for DJF at select AERONET sites that exhibited the strongest AERONET correlations, positive and negative. The site name and latitude–longitude information are shown, as well as the correlation (R), the change in AOD with PW (slope), and the statistically significant difference in mean PW for high-AOD events (PW diff) for both AERONET and the NAAPS-RA.


Figure 6NAAPS-RA PW percentiles by season (DJF, MAM, JJA, SON). The 25th and 75th percentiles are shown, along with the interquartile range (IQR). The 90th percentile is used to show high PW values at a given location.
The NAAPS-RA daily correlations (Fig. 7) within seasonal aggregates indicate similar but not identical spatial patterns relative to the AERONET dataset. The dominant positive-correlation regions include the Eastern/Southeastern United States, as is found in AERONET. Likewise, stronger European AOD and PW correlations are found in the summer months (JJA), in eastern Asia in the winter season (DJF), and the Middle East in the fall (SON). The NAAPS-RA results are helpful in that they provide a more complete perspective on the AOD and PW relationships. In addition to strong positive correlations in Southeastern United States and East Asia during DJF, the NAAPS-RA also indicates strong positive correlations in parts of Southwest Asia (Iran, Afghanistan, and Pakistan), India, South America, and southern Africa, which are minimally if not at all sampled by AERONET. The spatial extent of the observationally sampled relationships can also be seen. For example in MAM, the AERONET correlation at the Tamanrasset site in Algeria is 0.55, with a consistent NAAPS-RA correlation of 0.53. In the reanalysis, the correlations, greater than 0.5, extend to the east of Tamanrasset. Likewise, the spatial extent of correlations for maritime regions can be seen in the reanalysis, where AERONET sites are rare. In JJA months, correlations at the Dakhla site in Morocco are 0.45 in the AERONET dataset. Although the NAAPS-RA correlation at Dakhla is weaker (R=0.31), the positive relationship observed in both datasets on the west coast of Africa can be seen extending out into the Atlantic ocean in the reanalysis, consistent with dust transport pathways. Correlations associated with aerosol transport are also seen in southern Africa in the reanalysis, extending out into the ocean.
Table 2AOD and PW relationship evaluation results for MAM at select AERONET sites that exhibited the strongest AERONET correlations, positive and negative. The site name and latitude–longitude information are shown, as well as the correlation (R), the change in AOD with PW (slope), and the statistically significant difference in mean PW for high-AOD events (PW diff) for both AERONET and the NAAPS-RA.
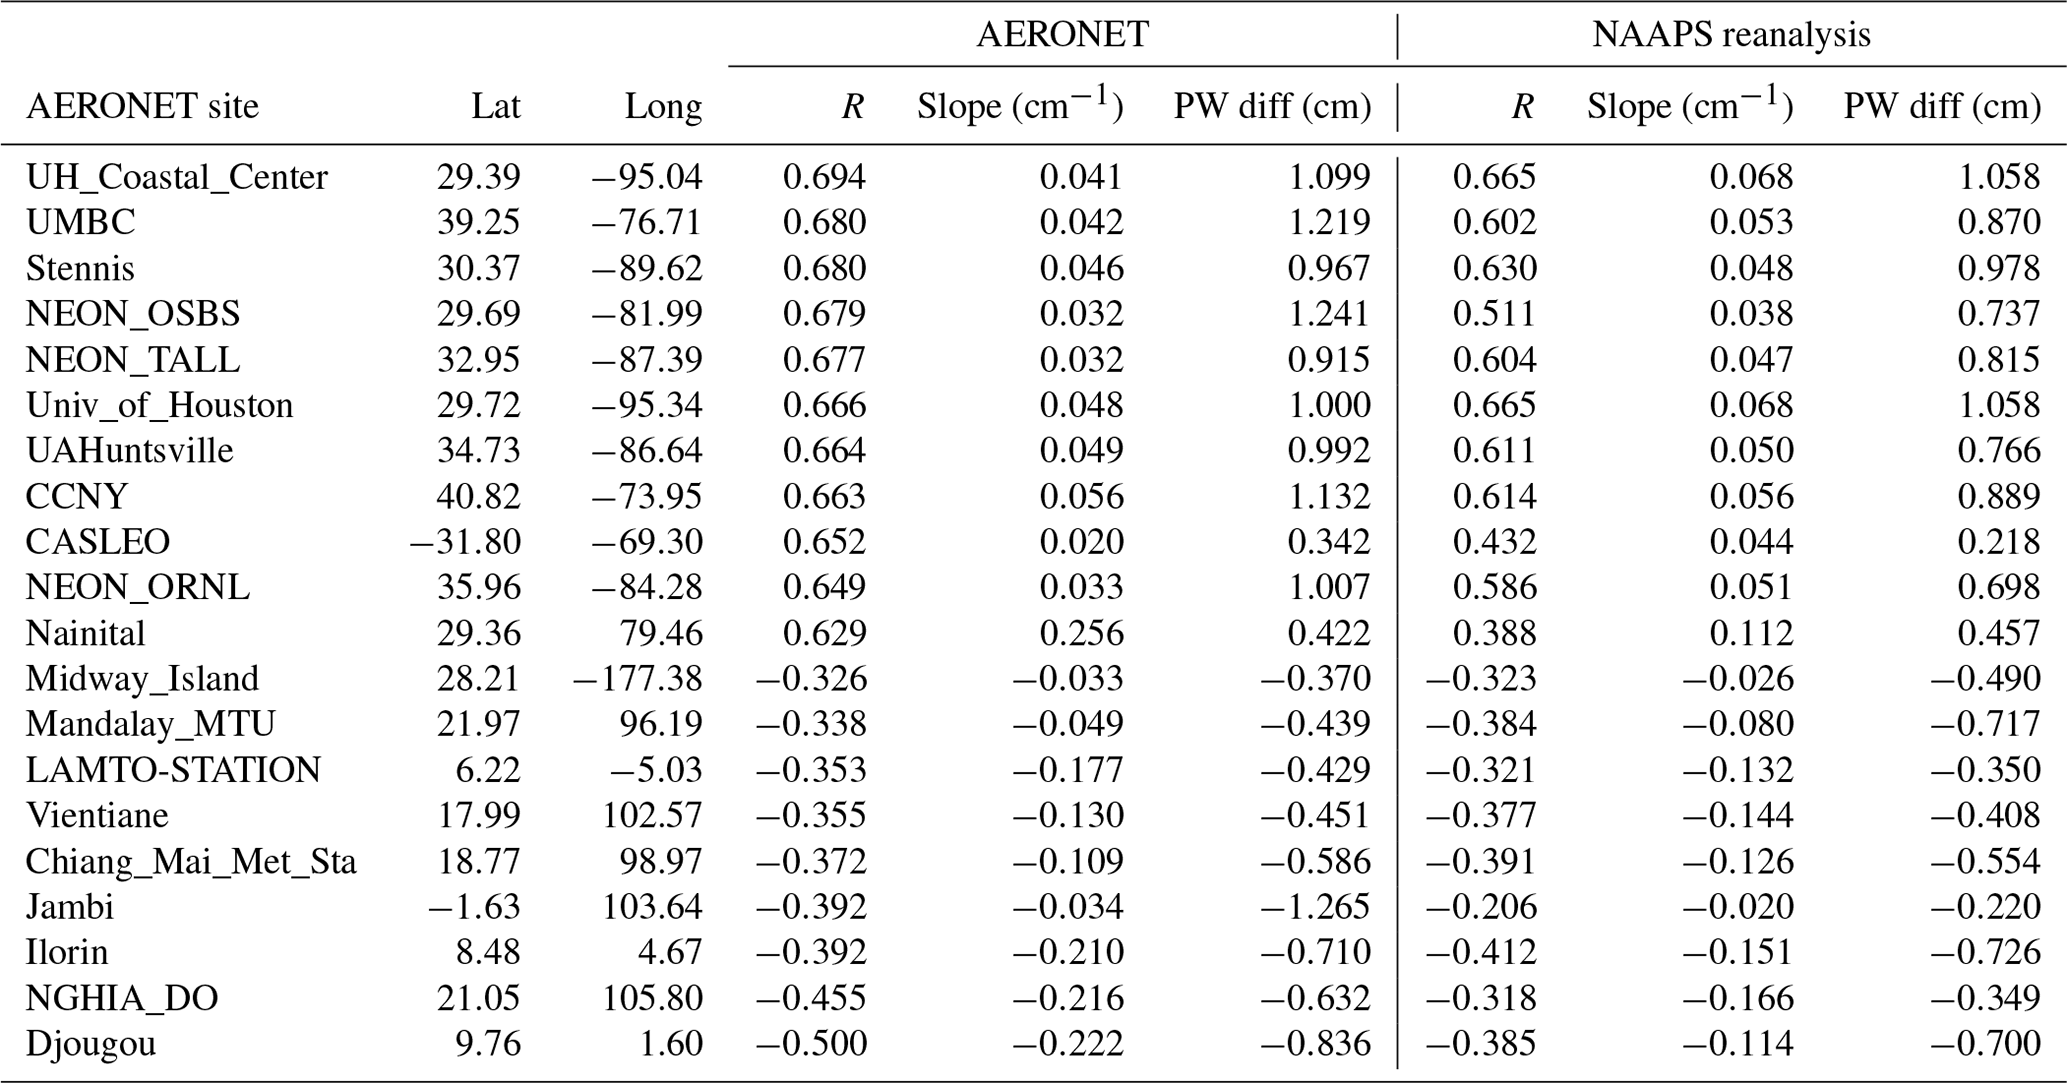
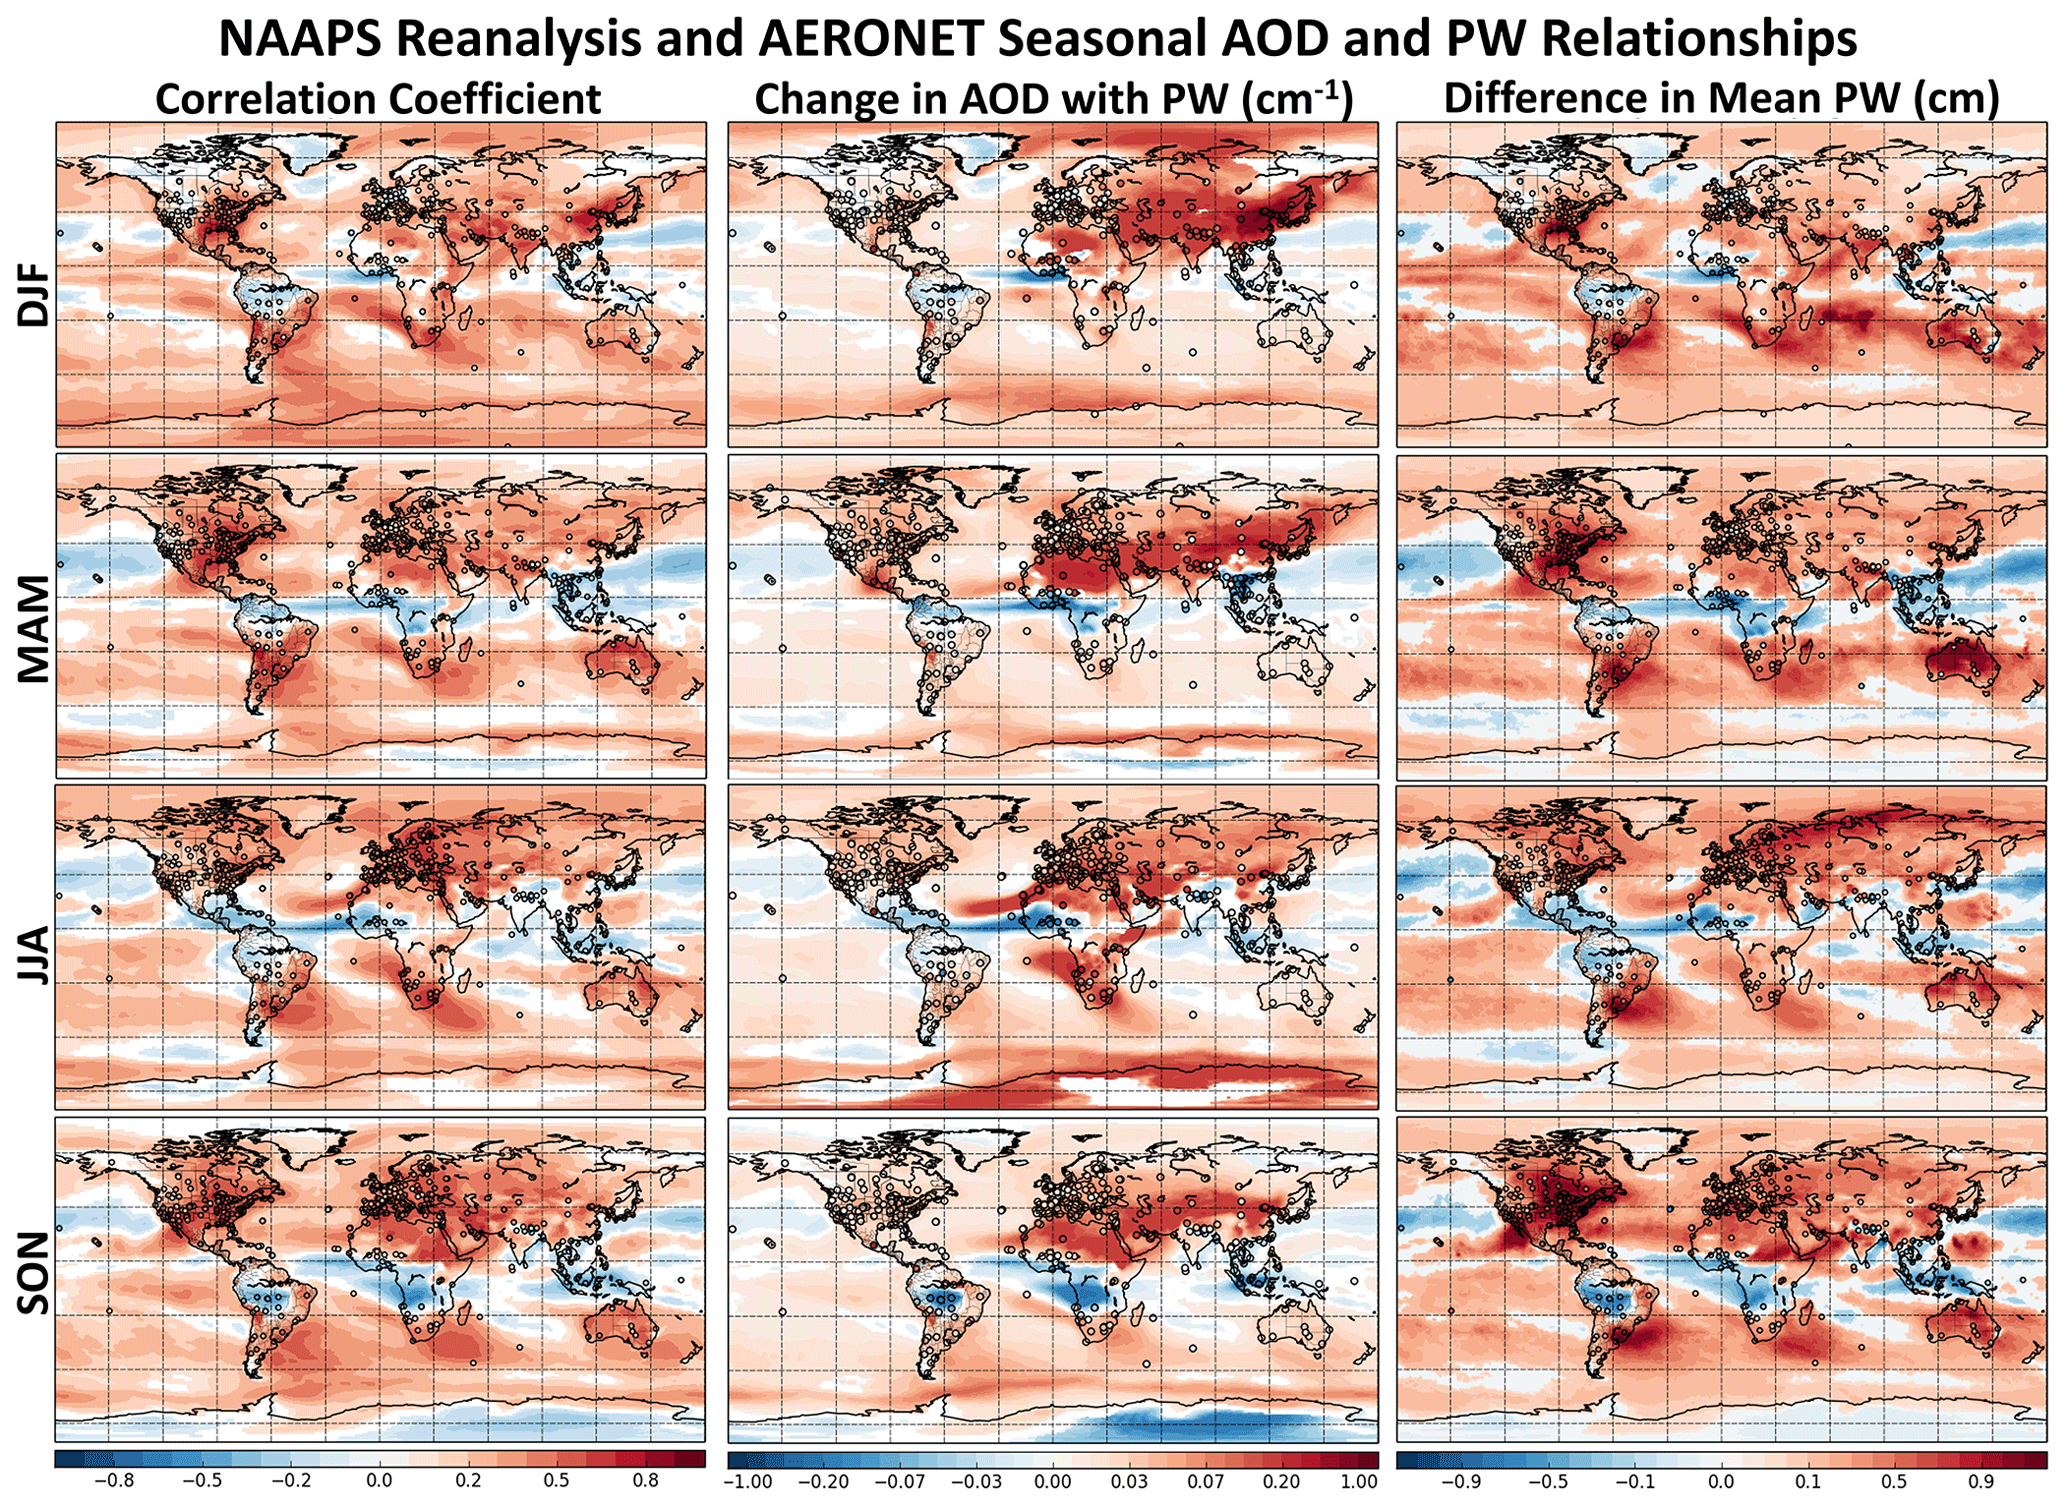
Figure 7Seasonal AOD and PW relationships based on AERONET data (circles) and the NAAPS-RA (global map) shown as (1) correlation coefficients between daily-averaged AOD and PW (non-zero values are statistically significant at the 95 % level), (2) Theil–Sen regression slopes (change in AOD with PW) between daily-averaged AOD and PW (in cm−1) at locations where the correlation is statistically significant, and (3) the statistically significant difference in mean PW (cm) between the PW distribution associated with high-AOD events (>1 standard deviation above mean) and the PW distribution for all AOD values. Red regions indicate a positive relationship between AOD and PW (higher moisture conditions for higher AOD events), and blue regions indicate a negative relationship (drier conditions for higher AOD events).
Although positive correlations are dominant throughout the world, negative correlations were also identified in both the AERONET and NAAPS-RA datasets from daily data. In the AERONET dataset, negative correlations are limited to the tropic/subtropics, with negatively correlated regions mostly associated with biomass burning. The strongest negative correlations in the AERONET dataset are shown in Tables 1–4, with NAAPS-RA values shown for comparison. During all seasons, negative correlations are found in the Sahel region in both AERONET and the NAAPS-RA, with the negative relationships extending further northwards in the boreal spring and summer months. This results in an exceptionally strong dipole between Saharan and Sahelian outflow and is likely related to shifts in the ITCZ. This points to aerosol sources (biomass burning and dust) and scavenging as a cause of the negative AOD and PW relationship. The NAAPS-RA shows these negative correlations extending into the Atlantic Ocean with seasonally dependent differences. Negative correlations extend into the Caribbean in JJA and to the northern parts of South America in MAM, consistent with seasonal transport pathways. Other negative-correlation regions include Southeast Asia, South America, and southern Africa. For these regions, the strongest negative correlations are associated with the respective dry, burning seasons. For example, negative correlations are strongest in peninsular Southeast Asia in MAM and in insular Southeast Asia and South America in SON. In these cases, negative AOD and PW relationships are likely a result of higher aerosol emission occurring under dry conditions, which lead to more fire activity. Southern Africa is an exception during JJA, in which smoke aerosol is dominant (Fig. 4). However, this is consistent with previous studies which have found elevated free tropospheric water vapor levels associated with southern African smoke events (Adebiyi et al., 2015; Pistone et al., 2021). Correlations in both AERONET and the NAAPS-RA are positive in JJA and negative in MAM and SON when smoke aerosol is also present but not at its peak. One of the largest AERONET negative correlations occurs at the Jomson site, Nepal, in JJA, with a value of −0.65 (Table 3), although nearby sites show small or statistically insignificant correlations. The Jomson site is located at 2825 m, with maximum PW values around 2, while the nearby Pokhara site is 2000 m lower in altitude, with maximum PW values around 5; therefore, Jomson is likely a regional outlier due to altitude effects. For Jomsom and the surrounding regions, the NAAPS-RA indicates no statistically significant correlation. While NAAPS and AERONET are in general agreement in the locations of negative correlations, this discrepancy is likely related to mesoscale or small-scale features that are not captured in a global, 1∘ model.
Table 3AOD and PW relationship evaluation results for JJA at select AERONET sites that exhibited the strongest AERONET correlations, positive and negative. The site name and latitude–longitude information are shown, as well as the correlation (R), the change in AOD with PW (slope), and the statistically significant difference in mean PW for high-AOD events (PW diff) for both AERONET and the NAAPS-RA. PW difference values of 0 in the NAAPS-RA indicate the change was not statistically significant.
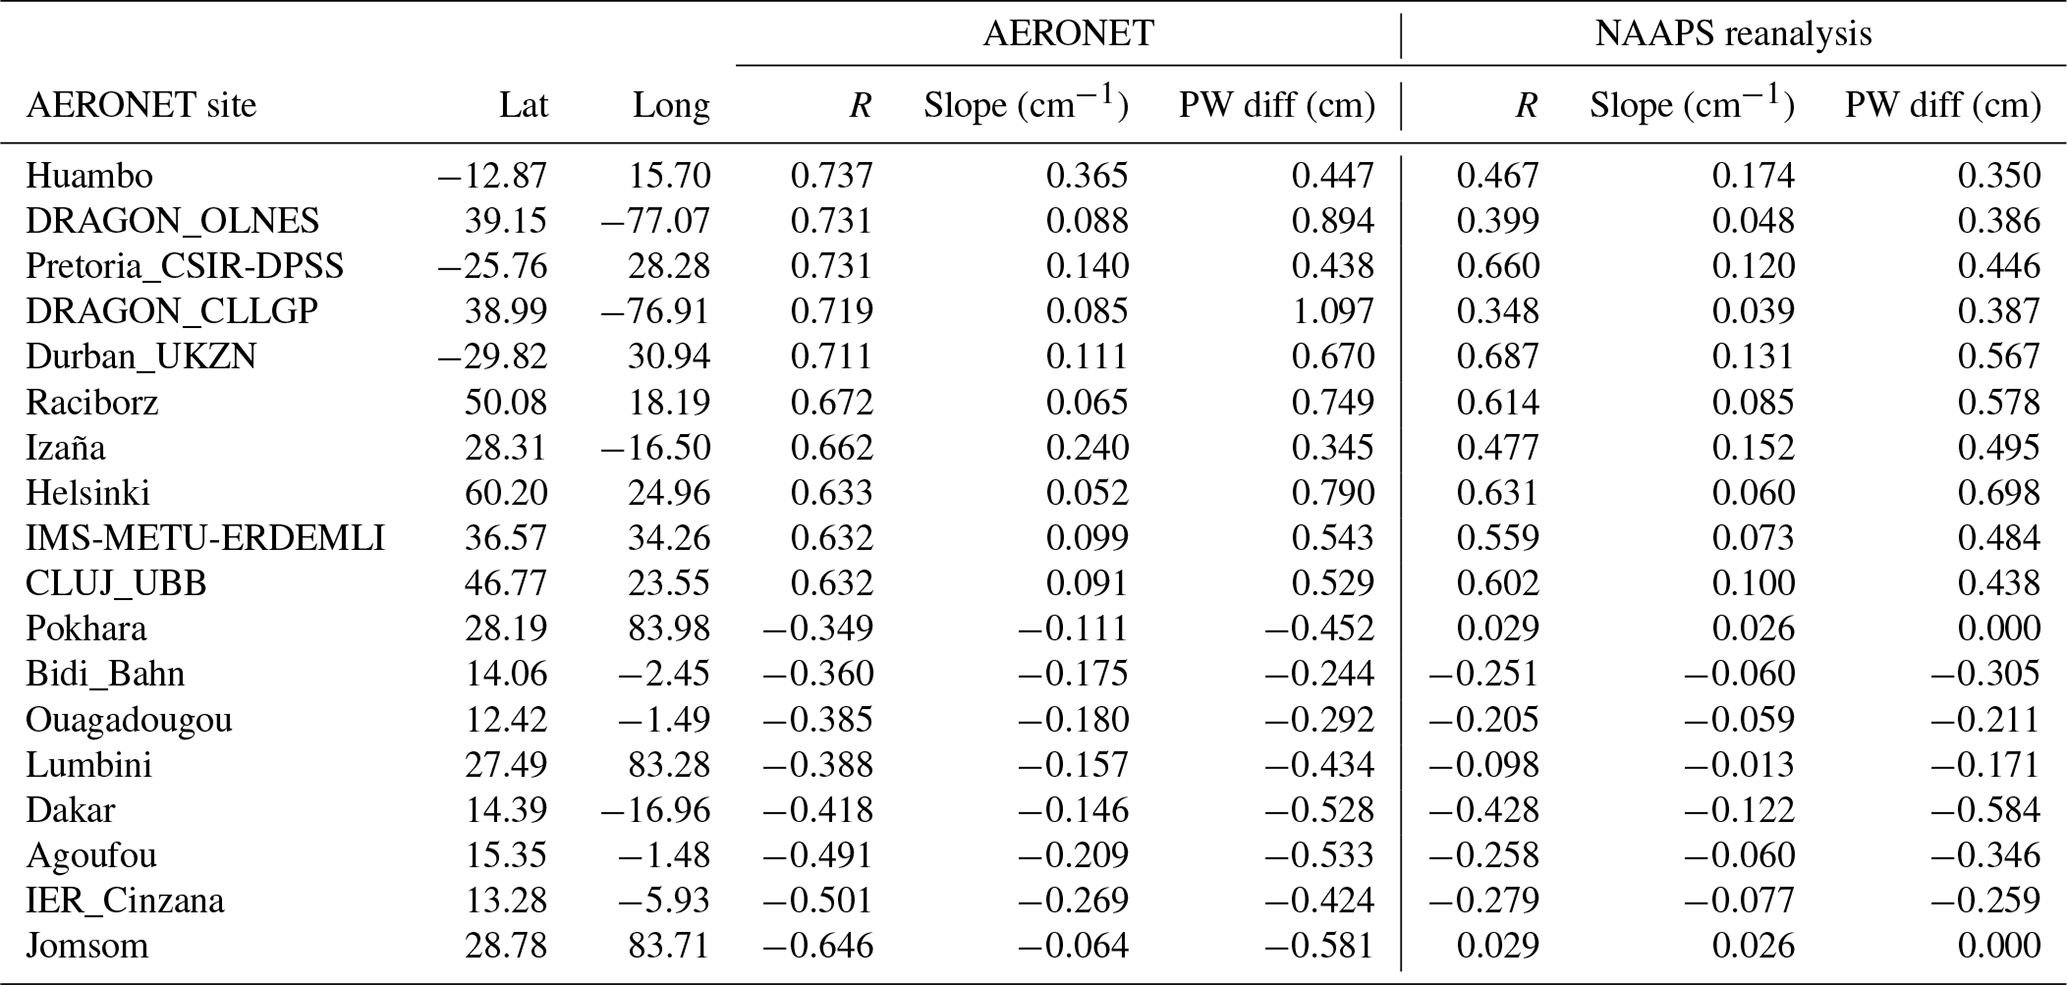

Figure 8The 95 % confidence interval in the Theil–Sen change in AOD with PW (cm−1) for DJF, MAM, JJA, and SON. The confidence intervals are shown for both the NAAPS-RA and AERONET.
3.2 Consistency between AERONET and NAAPS-RA
While the global plots of AERONET and NAAPS-RA AOD and PW relationships give a sense of spatial agreement, a scatterplot comparison of the quantitative values generated from the two datasets is used to take a closer look at the consistency between the observed and predicted relationships. A seasonal comparison of AERONET and NAAPS-RA regressions is shown as a scatterplot in Fig. 9, including site-by-site (a) correlations, (b) Theil–Sen slopes, and (c) the PW mean difference for high-AOD events. In addition to the three scatterplot comparisons, all locations for which for the sign of the AOD and PW relationships differed between the AERONET and the NAAPS-RA datasets were identified. For these identified sites, the distribution of AERONET correlations is plotted by season in Fig. 9d. This is included as a means to examine the strength of the observed AOD–PW relationship under conditions when the datasets disagree. Overall, the observations and model are in general agreement in the sign of the correlations (Fig. 9a), with similar results found for the Theil–Sen slope and the PW mean differences for high-AOD events (Fig. 9b, c). Differences in the sign of the correlation are found for 15.5 %, 9.5 %, 10.2 %, and 10.1 % of analyzed AERONET sites for the DJF, MAM, JJA, and SON months, respectively. For all seasons except JJA, these differences are mostly associated with a negative correlation in the AERONET data and a positive value in the NAAPS-RA. Differences in correlation sign occur for sites in which the AERONET-generated correlations are weak, mostly falling below 0.20 (Fig. 9d), with the exception of the Jomson AERONET site in JJA in which AERONET indicated a strong negative correlation and the reanalysis had a slight positive but statistically insignificant relationship, as previously discussed. For the strongest correlation sites, AERONET and NAAPS are in good agreement in DJF and MAM (Tables 1 and 2). For JJA and SON, NAAPS-RA has a tendency to produce weaker correlations relative to AERONET (Tables 3 and 4). Some differences are expected given that the event sampling is different between the AERONET observations and the 16-year NAAPS-RA. However, the overall agreement in the correlations between the two datasets provides some confidence in the NAAPS-RA for generating regionally and seasonally varying AOD and PW relationships on a global scale.
Table 4AOD and PW relationship evaluation results for SON at select AERONET sites that exhibited the strongest AERONET correlations, positive and negative. The site name and latitude–longitude information are shown, as well as the correlation (R), the change in AOD with PW (slope), and the statistically significant difference in mean PW for high-AOD events (PW diff) for both AERONET and the NAAPS-RA. PW difference values of 0 in the NAAPS-RA indicate the change was not statistically significant.

3.3 Slope evaluation
With the consistency between AERONET and NAAPS-RA established, a more thorough evaluation of the strength of the slope of AOD–PW relationship has been conducted. As previously discussed, the AOD and PW relationship in both the AERONET and NAAPS-RA datasets was quantified using a Theil–Sen regression in order to fit a slope to the change in AOD per centimeter PW (Figs. 7 and 8). Examples of NAAPS-RA and AERONET Theil–Sen fittings for eight AERONET sites scattered over the globe, each with their own unique aerosol environment, are shown in Fig. 10. Included are positive- and negative-correlation examples shown for each season (DJF – Beijing, China, and Lamto, Côte D'Ivoire; MAM – Houston, Texas, and Ilorin, Nigeria; JJA – Helsinki, Finland, and Dakar, Senegal; and SON – Dhadnah, UAE, and Palangkaraya, Indonesia), with the selected sites having some of the strongest correlations for the respective seasons in the AERONET and NAAPS-RA datasets (Tables 1–4). Good agreement is shown between the NAAPS-RA and AERONET-generated Theil–Sen slopes at the selected sites with the largest differences occurring at the Lamto and Palangkaraya sites in which relatively fewer AERONET observations are available. These fittings are calculated for each grid and AERONET site and are used to generate the results in Figs. 7 and 8. The examples in Fig. 10 show the insensitivity of the Theil–Sen regression to outliers, while the correlation coefficient is quite sensitive to such values. In DJF, Beijing exhibits a large change in AOD with PW, as high-AOD events are more frequent at this location (Figs. 5 and 10). However, places like Houston, Helsinki, and Dhadnah have relatively smaller Theil–Sen slopes as a result of high-AOD events, with values around 1 occurring less frequently and not influencing the slope. For these locations, the range of frequently observed AOD events is much smaller (Figs. 5 and 10), resulting in small changes in AOD with PW. Although there is certainly scatter in the data points in Fig. 10, statistically significant trends exist. The scatter in the data points occurs more so at negative-correlation locations (Fig. 10), resulting in smaller correlation coefficients. While the relationships for both positive and negatively correlated locations are statistically significant and the Theil–Sen regression gives an overall trend, the scatter indicates that differences in AOD and PW relationships will occur from day to day. This is expected as the AOD–PW relationship is based on a combination of transport covariance and local meteorology–source relationships.

Figure 9Scatterplot comparisons of the NAAPS-RA and AERONET: (a) AOD and PW correlations at AERONET sites, (b) the change in AOD with PW (cm−1) at AERONET sites, and (c) the statistically significant difference in mean PW associated with high-AOD events compared to the full PW distribution at AERONET sites. The comparisons are shown by season (DJF, MAM, SON, JJA), and correlations between the datasets are included. Additionally, the distribution of AERONET site correlations for which sign differences were found between NAAPS and AERONET calculated AOD–PW relationships is shown seasonally in (d).
The global and seasonal patterns in the positive and negative Theil–Sen slopes are consistent with the correlation analysis results (Figs. 7 and 8). The biggest Theil–Sen slopes tend to occur where larger IQR ranges are present (Fig. 5), as was shown for the Beijing Theil–Sen slope example in Fig. 10. The largest slopes in both datasets are centered on Beijing in the DJF months, with values exceeding 1 cm−1. Beijing consistently has some of the largest positive changes in AOD with PW in the AERONET dataset for all seasons with values, including 95 % confidence intervals, of 1.1(1.0–1.2), 0.35(0.32–0.38), 0.46(0.43–0.51), and 0.26(0.22–0.3) cm−1 for DJF, MAM, JJA, and SON, respectively. The NAAPS-RA is largely consistent with AERONET for the DJF and MAM months, with corresponding values of 1.13(1.08–1.18), and 0.31(0.29–0.33) cm−1. Less sensitivity to PW is found in the reanalysis for JJA and SON, with corresponding values at Beijing of 0.13(0.11–0.14), and 0.18 (0.17–0.20) cm−1. This is likely due to an underestimation of haze formation within NAAPS, as with other global models (e.g., Sessions et al., 2015; Xian et al., 2019), and also possibly due to the underestimation of AOD in summer from NAAPS due to a low AOD bias in the assimilated satellite AOD datasets in the East Asian region (Eck et al., 2018). Large positive changes in AOD with PW extend through Asia, the Middle East, and northern Africa, all regions impacted by high-AOD events. As is the case in the correlation results, the strong dipole in slopes is clear over northern Africa with positive slopes to the north and negative slopes in the southern Sahel region. Likewise, negative slopes are mainly associated with burning regions, with the exception of southern Africa in JJA. Statistically significant correlations and slopes at high latitudes, particularly Antarctica, indicate aerosol–water vapor transport in the model since local sources are limited, although AOD and PW values are low (Figs. 5 and 6).

Figure 10Seasonal examples of NAAPS-RA and AERONET Theil–Sen regression calculations for positive-correlation locations (Beijing, Houston, Helsinki, Dhadnah) and negative-correlation locations (Lamto, Ilorin, Dakar, Palangkaraya). The black dots are the AOD and PW pairs from the NAAPS-RA or AERONET, and the red line is the Theil–Sen fitting, which is the median of the slopes for the range of data pairings. The location name, correlation coefficient (R), and the Theil–Sen slope (Slope) are included with each plot.
Recall that the scatterplot comparison of AERONET- and NAAPS-generated changes in AOD with PW is shown in Fig. 9b. Again, there is generally good agreement between the datasets, consistent with the correlation comparison. The signs of the slopes are the same with the exception of 14.6 %, 9.2 %, 12.3 %, and 8.1 % of sites for DJF, MAM, JJA, and SON, respectively. Sites where differences in sign are observed have weak correlations (Fig. 8d). The NAAPS-RA has a tendency to underpredict negative changes in AOD with PW relative to AERONET for SON months where peak negative slopes are generated from AERONET. This is also shown in Table 4 as well as the global maps in Fig. 7 where differences can be seen, particularly in the Sahel and Southeast Asia. At the Kuching site in Borneo in SON, the AERONET-generated slope is to −0.28) cm−1, with a reanalysis value of to −0.09) cm−1, likely due to strong mesoscale variability and poor constraints on biomass burning in Borneo (Reid et al., 2013; Wang et al., 2013). Additionally, this could again be due to satellite retrieval screening of smoke as cloud and NAAPS failing to simulate the highest AOD smoke events in Borneo, especially in the dry El Niño years such as 2015 (Eck et al., 2019; Shi et al., 2019). The reanalysis also tends to underpredict positive slopes for JJA at the AERONET sites where the largest slopes are observed. This difference is not restricted to a particular region but can be seen in East Asia, Africa, and Mexico City (Fig. 7). As an example, the Tamanrasset site in Algeria exhibits slopes in the AERONET data of 0.26(0.23–0.30) cm−1 and in the reanalysis of 0.07(0.06–0.08). Likewise, at the Lubango site in Angola, the slope is 0.27(0.21–0.34) cm−1 in the AERONET data and 0.13(0.12–0.14) cm−1 in the reanalysis. The Tamanrasset site is at 1377 m altitude in the Ahaggar Mountains, which is significantly higher than the surrounding terrain in the Sahara. The Lubango site in Angola is at 2047 m, also higher than a portion of the surrounding terrain. This terrain/altitude influence is likely a factor in the discrepancies. The differences in slopes for JJA are also shown in Table 3.
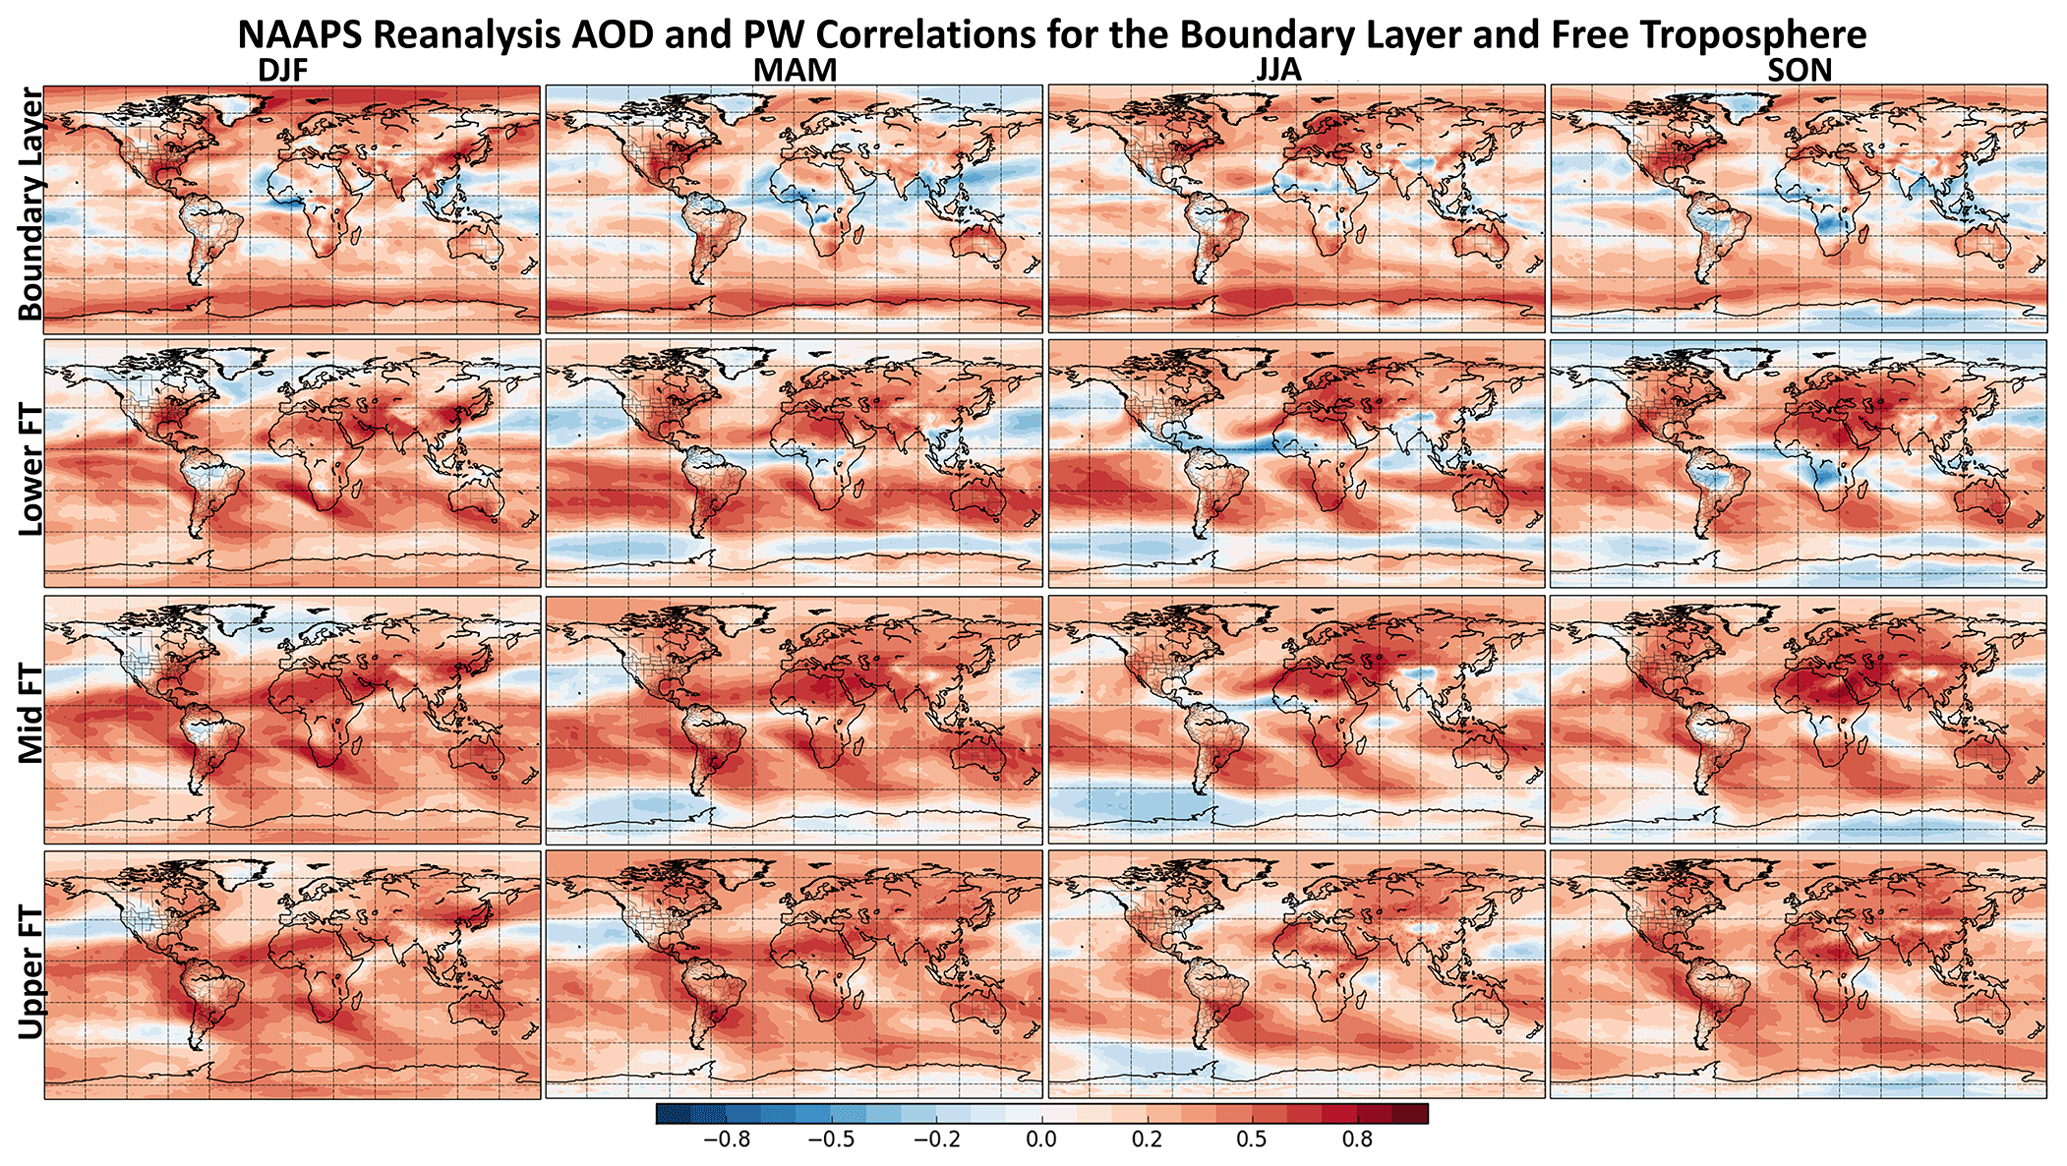
Figure 11NAAPS-RA seasonal correlations (DJF, MAM, JJA, SON) between vertically integrated total aerosol extinction and specific humidity in the boundary layer, lower free troposphere, middle free troposphere, and upper free troposphere. Red values indicate a positive correlation, and blue values indicate a negative correlation.
3.4 Evaluation of the AOD and PW probability distribution
While the correlation and slope evaluation is used to define a seasonal AOD and PW relationship across the datasets, it is expected that variations in the aerosol and water vapor relationship will exist across air masses. As a result, a probability distribution evaluation is another useful way to examine the data. The seasonal evaluation of the probability distributions is included in Fig. 7, next to the correlation and slope results. The plots show the statistically significant difference in the mean for the PW distribution associated with high-AOD events (AOD values more than 1 standard deviation above the mean) and the full PW distribution. Red regions/sites indicate that the PW mean for high-AOD events is statistically higher than the full distribution mean (i.e., higher moisture levels). Blue regions/sites indicate a lower PW mean for high-AOD events (i.e., drier conditions). Regions or sites in white have no statistically significant difference. The spatial pattern in the probability distribution evaluation is similar to the correlation and slope analysis; however, the probability distribution evaluation highlights different regions than the previous analyses. For example, across all seasons, larger changes in PW for high-AOD events are observed in Argentina, South America, including at the CEILAP-BA (Buenos Aires, Argentina), with values of 0.88, 0.94, 1.01, and 1.00 cm for DJF, MAM, JJA, and SON in the AERONET dataset and values of 0.61, 0.35, 0.95, and 0.73 cm in the NAAPS-RA dataset. This is a region that is impacted by both local pollution and transported biomass burning (Resquin et al., 2018). Larger changes in PW for high-AOD events are also observed over northern Australia during MAM, which is consistent with peak bushfire season in the region. Larger changes in PW are also found over the United States and Canada, consistent with patterns in the correlation evaluation but with more pronounced values relative to other locations. ABF is generally the dominant aerosol type, with biomass burning from Central America and western US/boreal regions during the MAM and JJA seasons, respectively. Likewise, Eurasian boreal regions associated with biomass burning activity during JJA are more pronounced in the PW distribution evaluation. The peak in values in the Southeastern United States is found during the DJF season. During MAM and SON, the peak areas include most of the eastern United States, extending into Canada and Central America. However, regions that were more pronounced in the correlation and slope evaluation have smaller differences in mean PW for high-AOD events, Beijing being a good example of this. Based on AERONET, the difference in mean PW at Beijing is 0.21 cm, while the difference is 0.35 cm in the NAAPS-RA for DJF when the strongest correlations and largest slopes were found. However, sites like Stennis, Mississippi (Table 1) which had a much smaller slope than Beijing (0.04 cm−1 compared to 1.1 cm−1) have a much larger difference in mean PW, with an AERONET value of 1.08 cm and a NAAPS value of 1.16 cm. This is because the probability distribution evaluation is taking into account those infrequent, outlier events that do not affect the Theil–Sen slopes. Locations where the IQR is relatively small, such as the United States, Europe, Australia, and parts of South America and southern Africa, have greater differences in mean PW, despite having small Theil–Sen slopes, due to the impact of outlier events. For many of these regions, the outliers are associated with biomass burning, indicating that PW is a useful tracer for such events.
Like the correlation and slope evaluation, a comparison of AERONET- and NAAPS-generated differences in mean PW was conducted by season. Similar to the previous two comparisons, AERONET and NAAPS are in agreement in the sign of PW difference for most locations, demonstrated by the global plots in Fig. 7 and the scatterplots in Fig. 8c. The percentage of sites that have differences in sign between the two datasets is 8.9 %, 6.87 %, 5.86 %, and 4.15 % for DJF, MAM, JJA, and SON, respectively. These percentages are smaller than those of sites with differences in the correlation and slope analysis. However, like the previous evaluations, most sites that exhibit sign differences between AERONET and NAAPS had weak AOD and PW relationships (R<0.20, Fig. 8d), with the exception of some outliers in which small-scale features that cannot be resolved in the global model may be at play. The comparisons between AERONET and NAAPS-RA across the different evaluations indicate that NAAPS is generating AOD and PW relationships that are pretty consistent with the observational data. Although differences in magnitude are present, the direction of the relationships is very consistent, providing confidence in the use of the NAAPS-RA for further exploring the AOD and PW relationship, particularly in the vertical and accounting for hygroscopic affects.
3.5 Vertical evaluation of the AOD and PW relationship
In addition to calculating the full column-integrated AOD and PW correlations in the NAAPS-RA, the correlations were also evaluated by vertically integrating the extinction and specific humidity through previously defined pressure levels in the atmosphere that correspond to a boundary layer and the lower, middle, and upper free troposphere. This evaluation was conducted seasonally, like the fully integrated analysis, with results shown in Fig. 11. In addition to the global plots, histograms of the AOD and PW correlations for the full column and the vertical components of the atmosphere are shown in Fig. 12. It is notable that stronger positive correlations exist when looking at limited parts of the atmosphere compared to the fully integrated column. This is most evident in the global plots for ocean regions, particularly in the Southern Hemisphere, where correlations exceeding 0.5 occur compared to the fully integrated correlations that are on the order of 0.2. This result is not unexpected given that the vertical components of the atmosphere look different depending on things like vertical mixing, a local aerosol and water vapor source compared to a long-range transport event, and the relative humidity profile. Additionally, some regions exhibit stronger correlations in certain portions of the atmosphere. For example, dust-dominated regions such as the Sahara, Arabian Peninsula, and the Gobi and Taklimakan deserts have the strongest correlations in the MT. This is higher up in the atmosphere than expected, given for example, studies have shown East Asian dust heights to range from 1.9 to 3.1 km (Liu et al., 2019), and the typical description of the Saharan Air Layer (SAL) includes dust-laden air between approximately 850 and 500 hPa (Karyampudi et al., 1999), with several other studies identifying Saharan dust up to ∼5 km for summertime dust transport (Mortier et al., 2016; Veselovskii et al., 2016; Tesche et al., 2011). This indicates that the model may be transporting too much dust aerosol and water vapor higher into the atmosphere and that this transport is well correlated. Correlations over North America and eastern Europe are strongest in the BL to LT. Wintertime correlations over East Asia/Beijing are pretty consistent throughout the column. Negative-correlation regions associated with smoke aerosol, including the Sahel, southern Africa, and Southeast Asia, have the strongest correlations in the LT and largely disappear beyond this point. The shift in correlations with vertical location is also evident in the histograms (Fig. 12) when compared to the full column distribution. This is particularly the case for the lower and middle free troposphere, where the number of grids with correlations greater than 0.5 increases. Additionally, the shift of the correlations to mostly positive can be seen in the middle and upper free troposphere histograms.

Figure 12AOD and PW correlation histograms by season for the full integrated column (total) and vertical components of the atmosphere (boundary layer and lower, middle, and upper free troposphere (FT)).
3.6 Impact of hygroscopic growth on AOD and PW relationships
The final consideration in this work is hygroscopicity. Although the effects of clouds on the AOD and PW relationship are also important to understand, this effect cannot be investigated using NAAPS since the model does not account for the processing of aerosol in cloud droplet, rapid gas-to-particle conversion in cloud droplets, or the high RH halo in the immediate vicinity of clouds. However, this should be considered in follow-on work. While relationships between AOD and PW have been demonstrated, this signal can be either from co-transport or a confounding relationship between enhanced PW and RH. The correlation between RH and PW is shown in Fig. 13 by season and for the boundary layer and parts of the free troposphere. The largest spatial variations in the PW and RH correlation occur in the boundary layer, as anticipated, with strong correlations found over Africa, extending into the Indian Ocean/India, located further north during JJA and further south during DJF, and similar patterns during MAM and SON. Other regions of high correlation in the boundary layer include the region off the coast of South America, parts of Australia, and limited locations in the tropical oceans. Beyond the boundary layer, the overall patterns are generally consistent throughout the vertical column, with strong correlations in the subtropics and tropics (>0.9) and some variations on the extent by season. In JJA, for example, this high correlation region extends further north, while in DJF the high correlation region extends further into the Southern Hemisphere. In this highly correlated region, hygroscopic growth is expected to be a significant driver in AOD and PW relationships when dust is not the dominant aerosol type. RH and PW correlations are higher over ocean regions than over land in the Northern Hemisphere, which should be impactful for sea salt aerosol and PW correlations. The impact of the RH and PW correlations on the AOD and PW relationship is shown in calculated seasonal relationships between “dry” AOD, which excludes the impact of hygroscopic growth, and PW in the NAAPS-RA in Fig. 14. This figure includes the correlations, the slope of the “dry” AOD and PW relationship, and the statistically significant different in mean PW for high “dry” AOD events. The removal of hygroscopic growth from the AOD calculation had the following outcomes on the resulting correlations: (1) the previously positive correlation was reduced in magnitude, (2) the previously negative correlation coefficient became more negative, (3) the sign of the correlation flipped from positive to negative, and (4) there was little to no change in the correlation. Regions such as the eastern United States and Europe fall into the first category, where positive AOD and PW correlations are found for all seasons, but the correlation coefficient is greatly reduced. For the eastern United States, peak correlation coefficients were in the approximate 0.6–0.7 range with hygroscopic growth and fell below 0.5 without it. This is especially true in JJA when RH and PW correlations are the strongest. Likewise, positive correlations in Europe are still present but weakened. In these cases, hygroscopic growth amplifies an existing positive relationship that is somewhat weak when evaluating seasonal data by correlation. In regard to the second category, this corresponds to regions dominated by smoke aerosol that previously exhibited negative AOD and PW relationships, such as peninsular Southeast Asia during the MAM months and insular Southeast Asia during the SON months. Additionally, increases in negative correlations are found for aerosol transport from Asia across the Pacific Ocean. In these cases, hygroscopic growth reduces an existing negative relationship between aerosol and water vapor. Ocean regions mostly account for the third category, where the correlation flipped from a weak positive to negative value. Regions that are dominated by dust, including the Sahara and Arabian Peninsula, fell into the fourth category as there is no hygroscopic growth for dust in NAAPS.
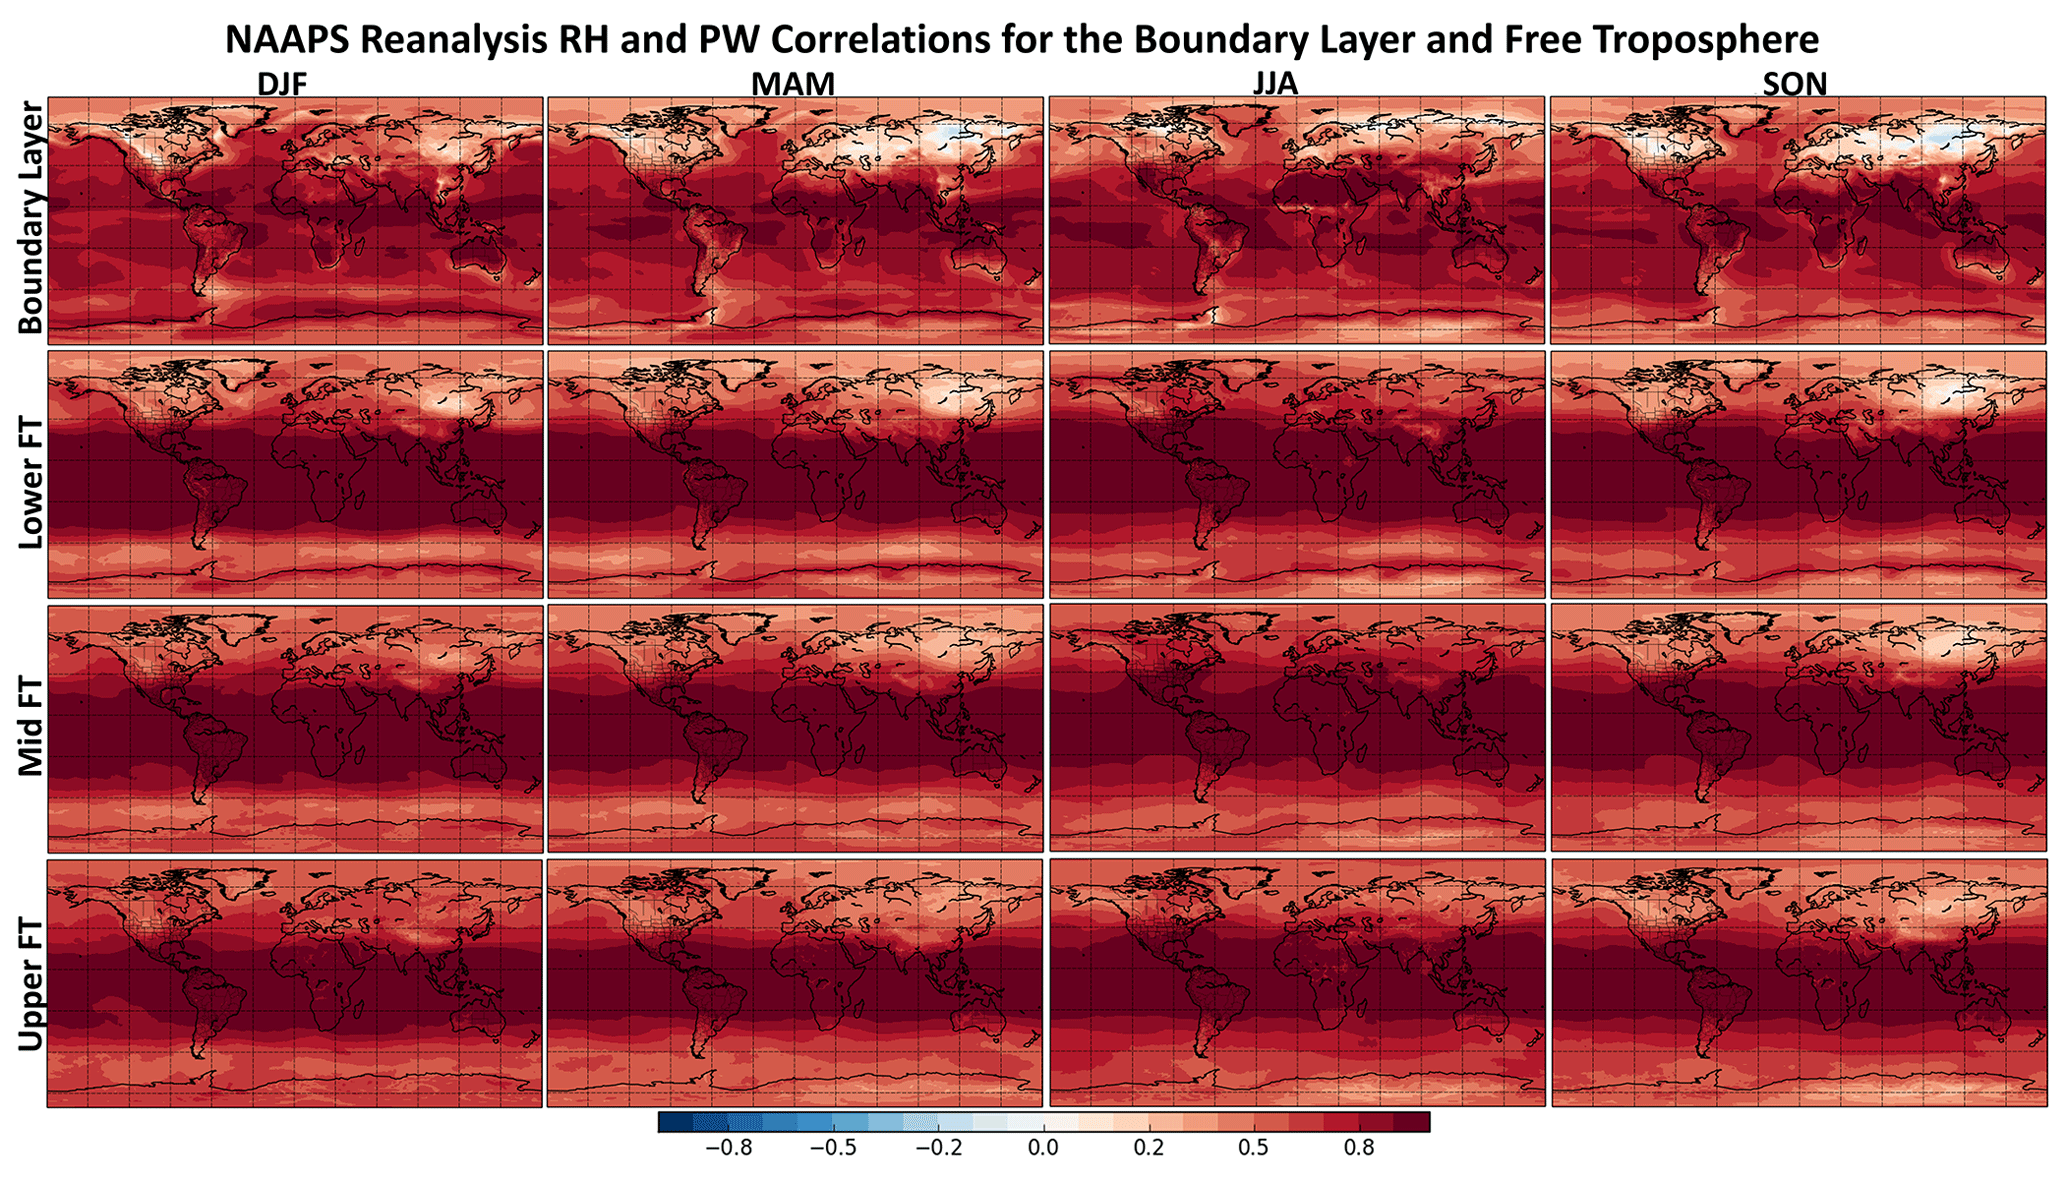
Figure 13NAAPS-RA seasonal correlations (DJF, MAM, JJA, SON) between vertically integrated relative humidity (integrated specific humidity divided by the integrated saturation specific humidity) and specific humidity in the boundary layer, lower free troposphere, middle free troposphere, and upper free troposphere.
In regard to the slope of “dry” AOD and PW, the same categories apply with similar spatial patterns relative to the correlation analysis. Additionally, the same is true when examining the difference in mean PW for high “dry” AOD cases. In this case, it is found that (1) an increase in PW is still statistically significant, but the difference in mean PW is much less; (2) a decrease in PW for high “dry” AOD cases is still statistically significant, with a larger decrease when not considering hygroscopic growth; (3) the sign of the difference flipped from an increase in PW to a decrease, or the difference became statistically insignificant; or (4) the PW difference did not change much due to dust-dominated conditions. While the modeled differences in PW are statistically significant when excluding hygroscopic growth, they are small, with peak differences on the order of a few millimeters. The results here indicate that hygroscopic growth of aerosol plays an important role in the AOD and PW relationship. While PW is still a good tracer for AOD as shown in this work, it should be kept in mind that there is a difference in water vapor as a tracer for AOD and for aerosol mass. It is expected that the relationship between “dry” AOD and PW would be a closer representation of the dry aerosol mass to PW relationship.
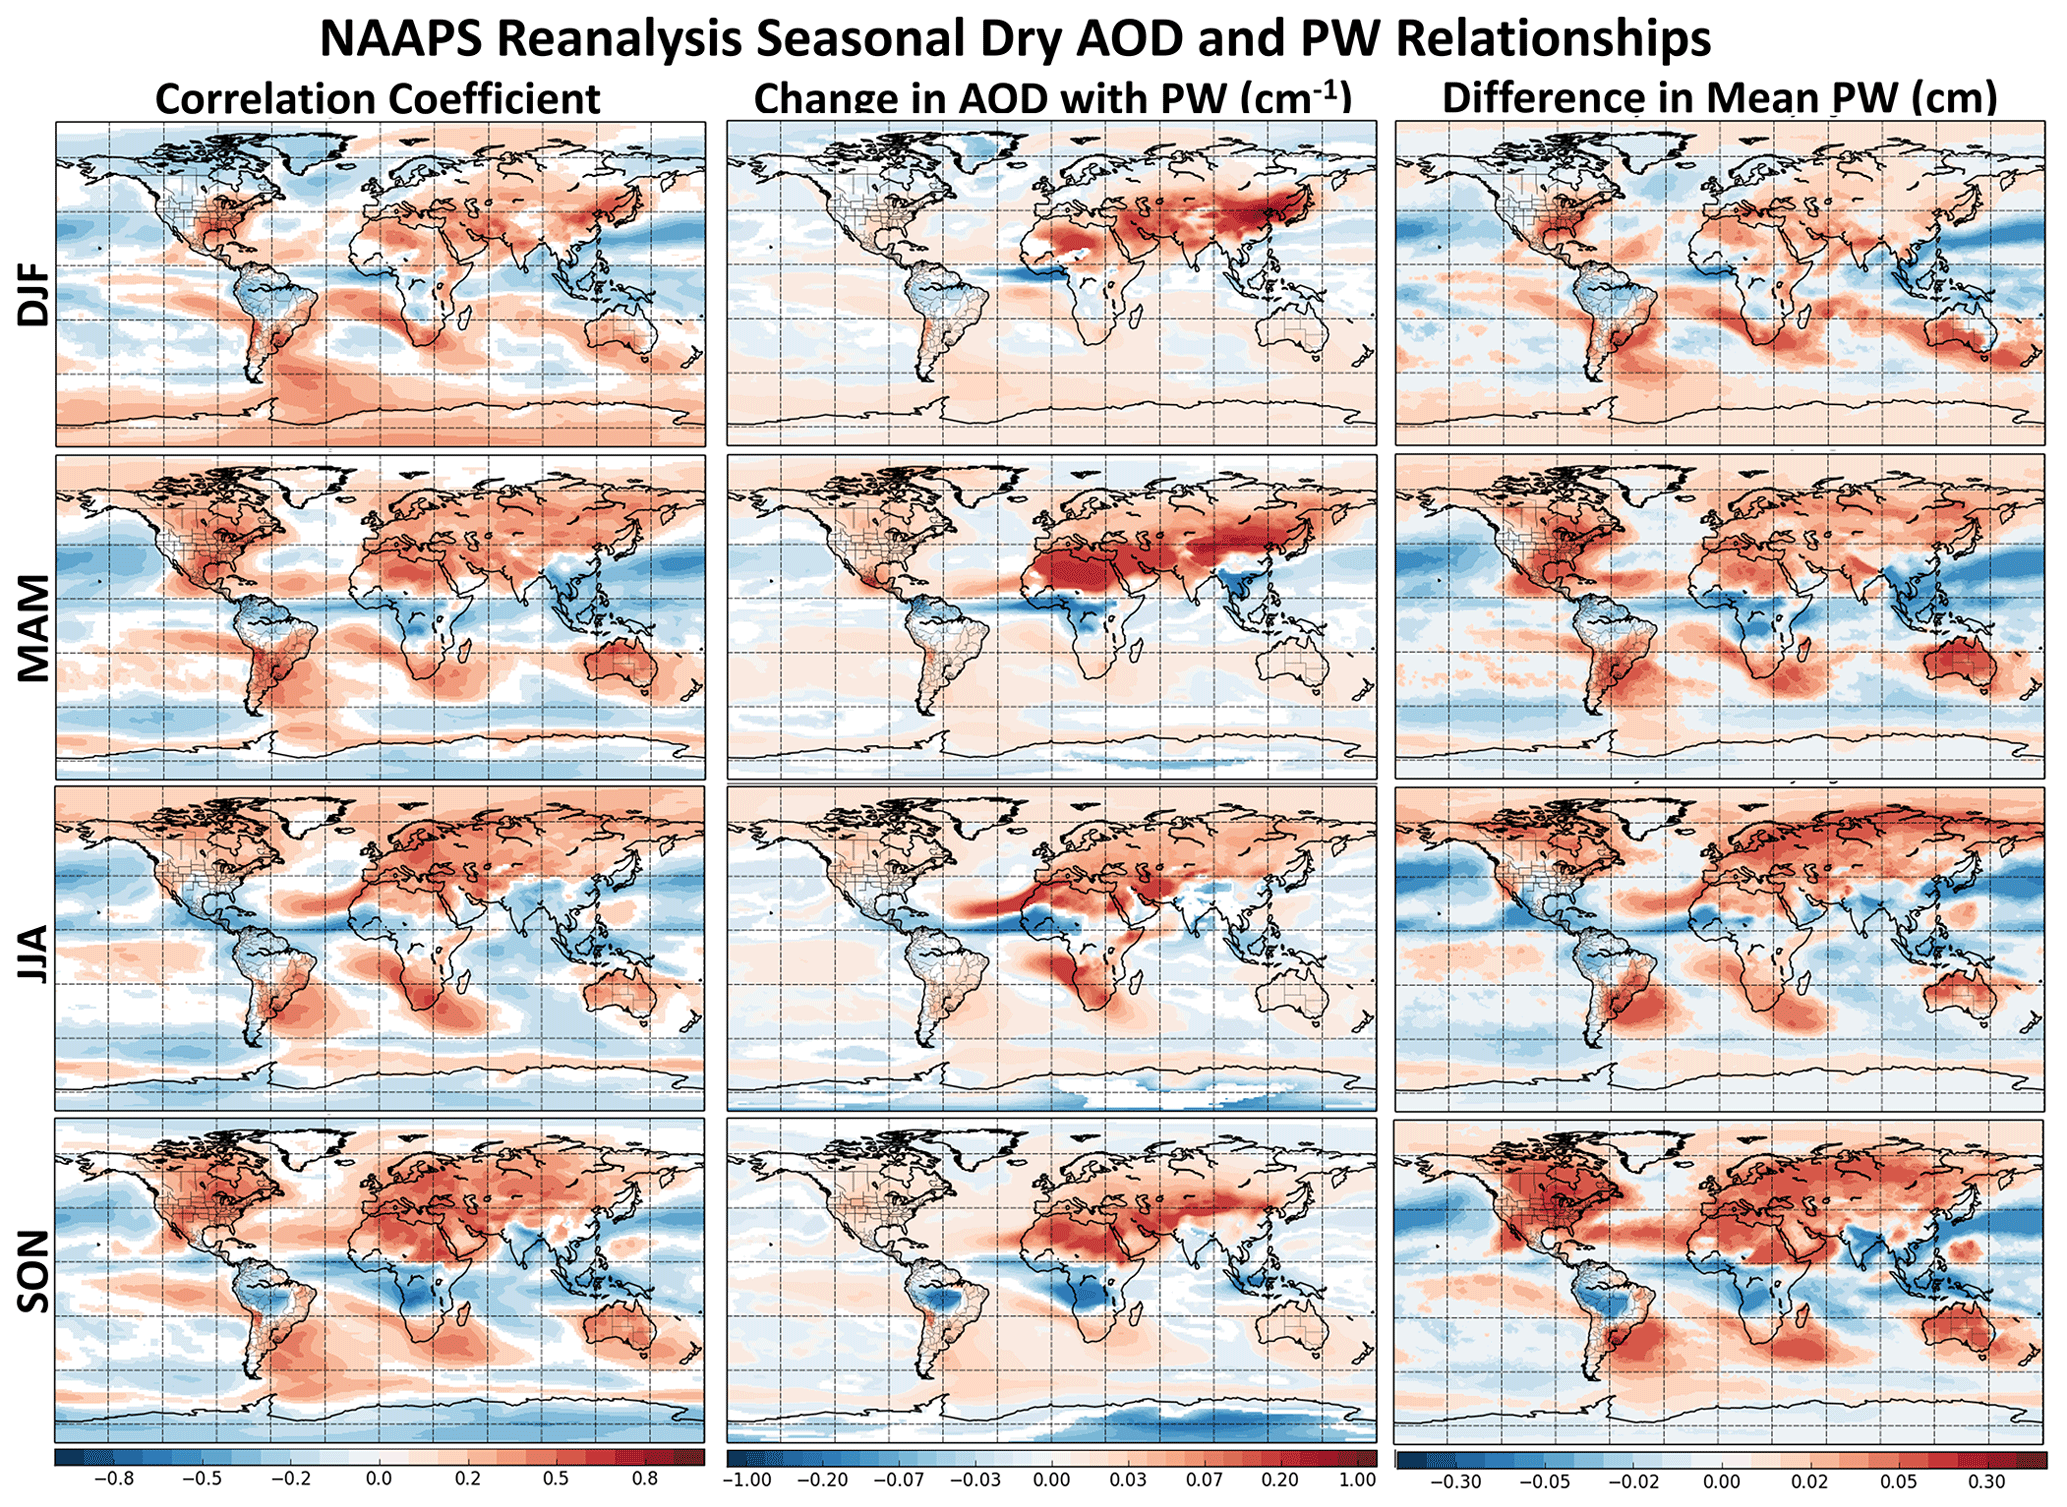
Figure 14Seasonal dry AOD and PW relationships based on the NAAPS-RA shown as (1) correlation coefficients between daily-averaged dry AOD and PW (non-zero values are statistically significant at the 95 % level), (2) Theil–Sen regression slopes (change in AOD with PW) between daily-averaged dry AOD and PW (in cm−1) at locations where the correlation is statistically significant, and (3) the statistically significant difference in mean PW (cm) between the PW distribution associated with high dry AOD events (>1 standard deviation above mean) and the PW distribution for all AOD values. Red regions indicate a positive relationship between dry AOD and PW, and blue regions indicate a negative relationship.
3.7 Discussion through example cases at individual AERONET sites
In order to further understand regional differences in observed AOD and PW relationships, individual sites in which strong AOD and PW relationships were identified and that had several years of observational data available were selected for further analysis. These sites included (1) Tallahassee, Florida for Southeastern US pollution (Fig. 15); (2) Beijing, China, for Asian haze and dust (Fig. 16); (3) Izaña, Canary Islands, for Saharan dust (Fig. 17); and Alta Floresta, Brazil, for South American biomass burning (Fig. 18). For the four identified AERONET sites, the daily-averaged AOD and PW time series are examined for seasons in which correlations were found to be strong. This includes DJF for the Tallahassee and Beijing sites and JJA for Izaña. At these sites, the identified relationships between AOD and PW were positive. The Alta Floresta site, which exhibited negative AOD and PW relationships in the presented results, is further examined for the SON biomass burning season. The daily-averaged data are included since this is what was analyzed in the previous analyses. Additionally, the AERONET data, without any averaging, are further examined for individual cases from the site-specific time series for which peaks in AOD and/or PW were found. NAAPS-RA AOD and PW fields are also shown for the selected cases (Figs. 15–18).

Figure 15AOD and PW time series at the Tallahassee site, Florida, in which strong positive correlations are observed during the DJF season. The daily-average AOD and PW time series are shown for the 2018–2019 DJF season, with red arrows indicating select events for which joint peaks in AOD and PW are observed (a). Time series of AERONET data (non-averaged, all data) for dates identified with red arrows are shown in time series (b–d). Additionally, NAAPS-RA AOD and PW (cm) fields are shown for the same dates, with the AERONET site marked with a yellow star (e).
At the Tallahassee site, the predominant aerosol type is ABF/pollution, and although AOD values are generally low during DJF (mean values in the 0.1–0.2 range, Fig. 3), strong AOD and PW relationships were found, with correlations of 0.74 in the AERONET dataset and 0.66 in the NAAPS-RA and PW mean differences around 1 cm for high-AOD events (Table 1). The daily-averaged AOD and PW time series for the 2018–2019 DJF season are shown in Fig. 15a. The time series indicate, consistent with the correlation analysis, that the daily-average AOD and PW generally move together. There are several joint peaks in AOD and PW that occur during the time period, and three selected cases are examined further, including 1 January, 7 February, and 17 February 2019, with these events identified in the Fig. 15a time series using red arrows. The AERONET AOD and PW time series for these three cases are shown in Fig. 15b–d, respectively. The 17 February case has the least data points available, making it harder to evaluate diurnal changes in AOD and PW; however, the 1 January and 7 February cases have a good number of data points throughout the afternoon and later into the evening. For these two cases in particular, the changes in AOD and PW throughout the day are generally consistent with each other, indicating that the AOD and PW relationships can extend to sub-daily timescales. AOD and PW plots for the three identified cases are shown from the NAAPS-RA in Fig. 15e as a means to assess the types of aerosol events that are impacting Tallahassee when coordinated peaks in AOD and PW are observed. For all three cases, coincident transport of AOD and PW is observed in the reanalysis fields, associated with a frontal system. This type of frontal transport was commonly found for events in which coincident PW and AOD peaks are observed at Tallahassee. As the DJF season in the Southeastern United States has significant frontal activity, this is likely an important factor in enhanced AOD–PW relationships during this season.
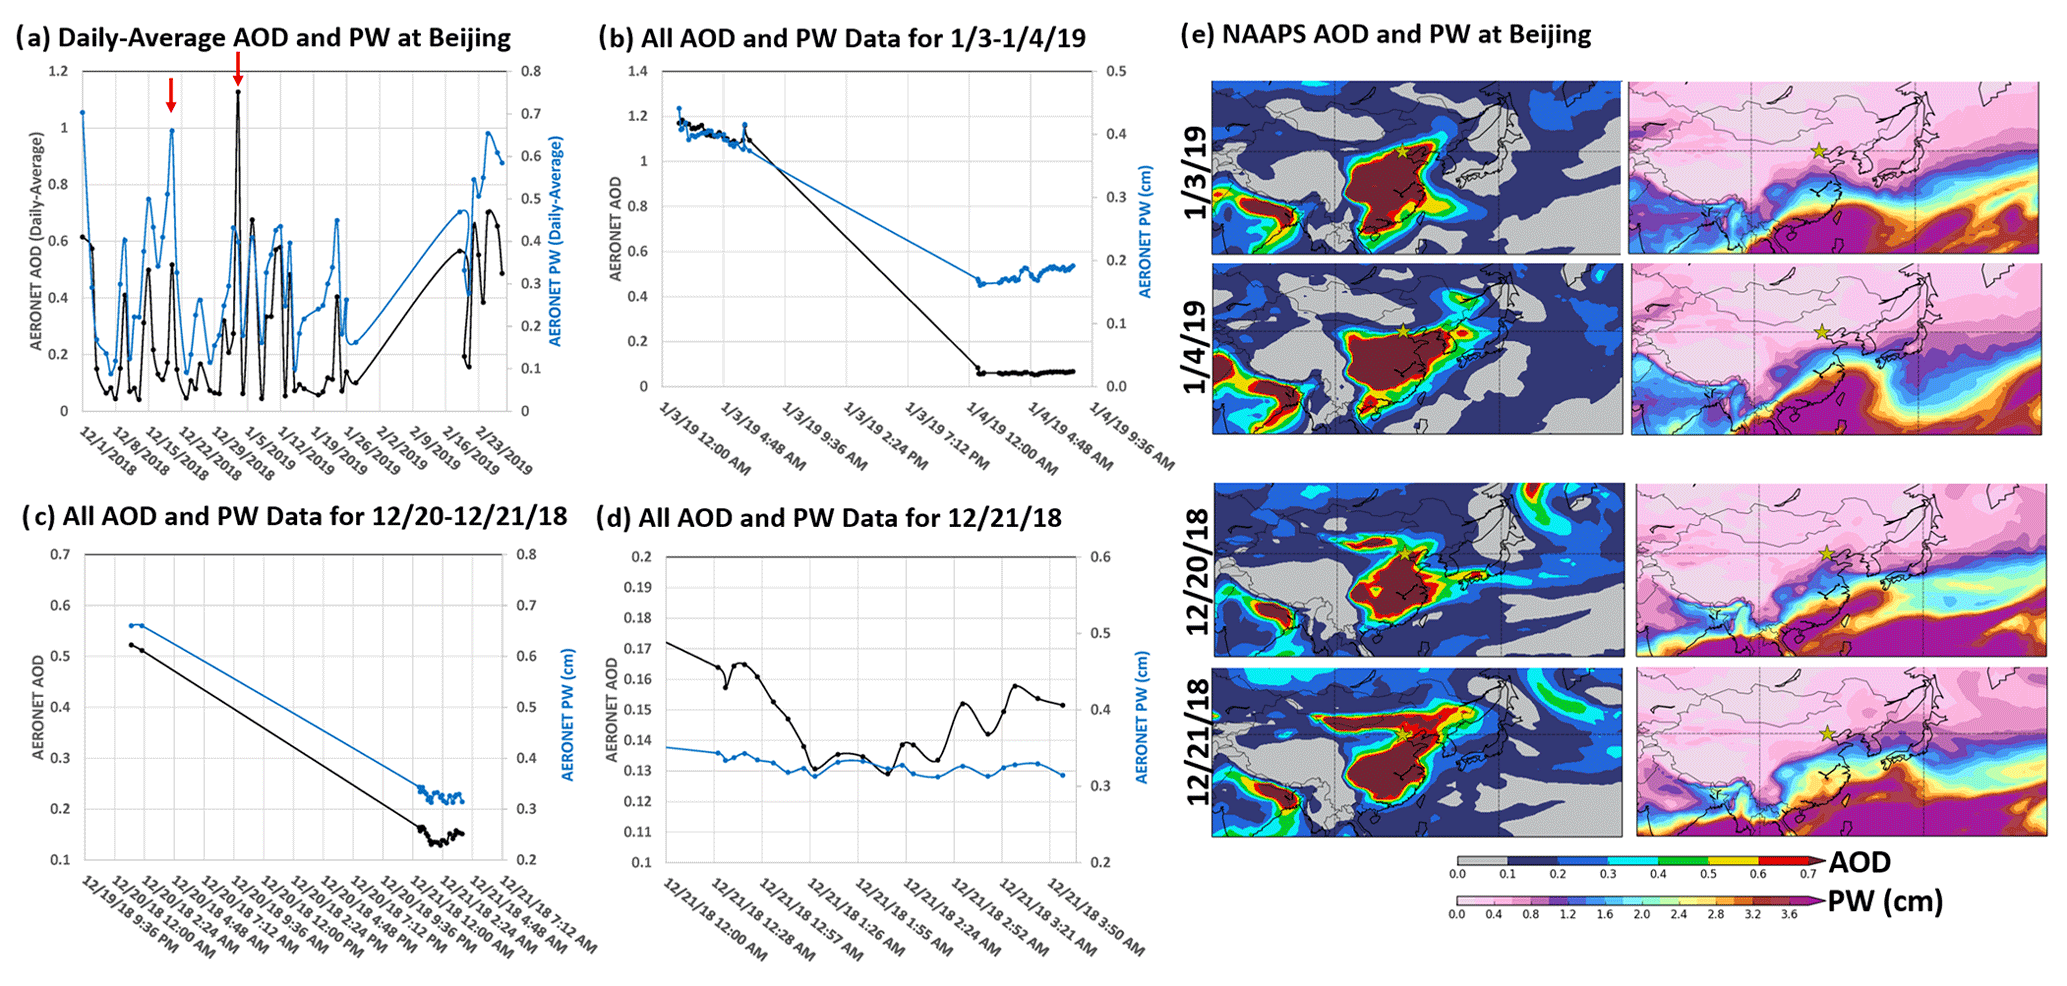
Figure 16AOD and PW time series at the Beijing site, China, in which strong positive correlations are observed during the DJF season. The daily-average AOD and PW time series are shown for the 2018–2019 DJF season, with red arrows indicating select events for which joint peaks in AOD and PW are observed (a). Time series of AERONET data (non-averaged, all data) for dates identified with red arrows are shown in time series (b–d). Additionally, NAAPS-RA AOD and PW (cm) fields are shown for the same dates, with the AERONET site marked with a yellow star (e), including the air mass movement for 3–4 January 2019 and 20–21 December 2018.
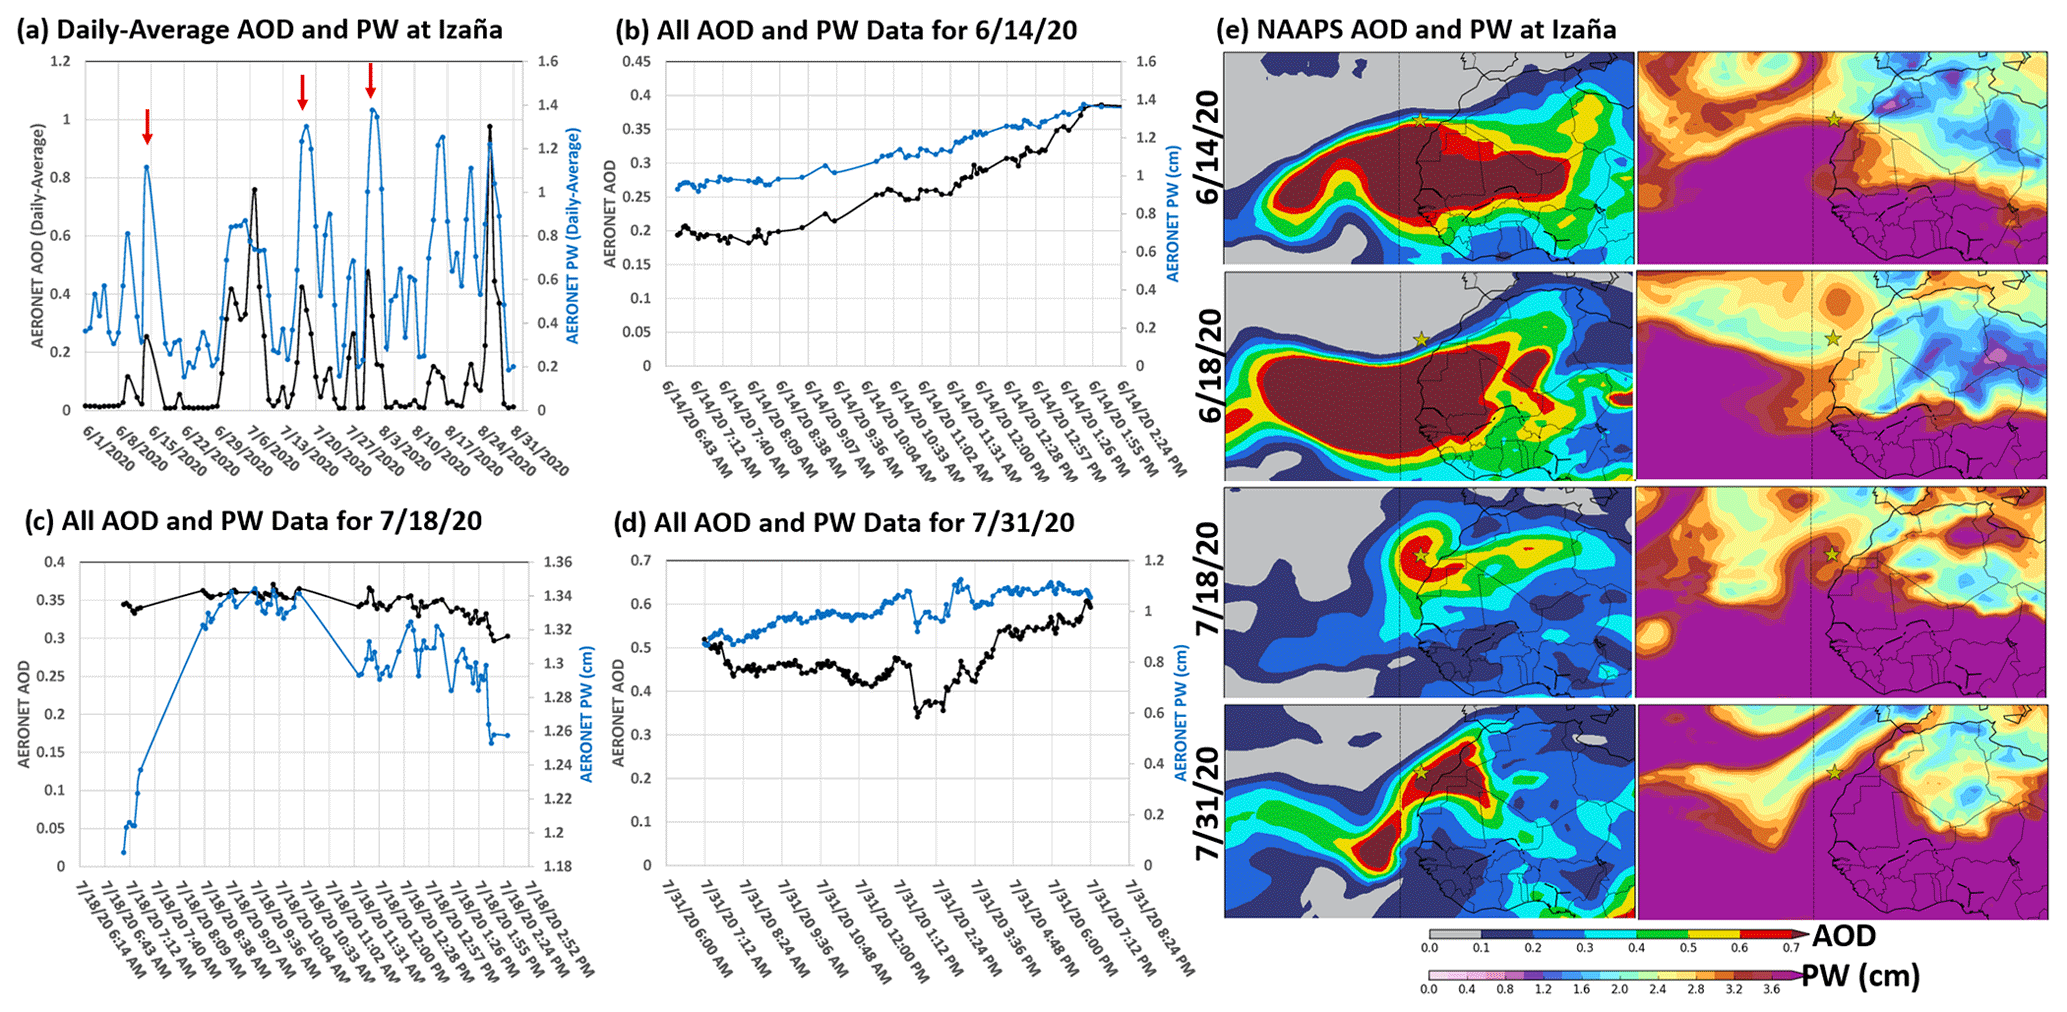
Figure 17AOD and PW time series at the Izaña site, Canary Islands, in which strong positive correlations are observed during the JJA season. The daily-average AOD and PW time series are shown for the 2020 JJA season, with red arrows indicating select events for which joint peaks in AOD and PW are observed (a). Time series of AERONET data (non-averaged, all data) for dates identified with red arrows are shown in time series (b–d). Additionally, NAAPS-RA AOD and PW (cm) fields are shown for the same dates, with the AERONET site marked with a yellow star (e). The fields for 18 June 2020 are also included which show the joint dip in AOD and PW in the (a) time series after the 14 June event.
Beijing is an urban site that commonly experiences high-AOD levels related to pollution, as well as transported dust and smoke events. Wintertime events are notorious for exhibiting some of the worst air quality in the world for a major population center (e.g., Wang et al., 2014; Gao et al., 2016; Zhang et al., 2018). Additionally, Beijing has the benefit of a long AERONET data record, with measurements dating back to 2001. Like Tallahassee, the AOD and PW time series at Beijing are evaluated for the 2018–2019 DJF season (Fig. 16), with strong positive relationships identified in both the AERONET and NAAPS datasets with correlations of 0.71 and 0.76, respectively, and the change in AOD with PW exceeding 1 cm−1 (Table 1). As indicated in Fig. 4, ABF/pollution is the dominant aerosol type, with some dust present and much higher AOD values observed at this location (Figs. 3 and 5). In East Asia, pollution buildup often occurs under stagnant weather conditions, where a stable atmosphere leads to limited vertical mixing (Wang et al., 2014; Li et al., 2019); the monsoon is also an important factor in determining synoptic conditions. In particular, the East Asian winter monsoon (EAWM) has been shown to be a controlling factor in aerosol concentrations during the winter season (Li et al., 2016; Jeong et al., 2017). With a strong EAWM, reduced aerosol concentration occurs over northern East Asia, including Beijing, due to stronger northerly winds. In weaker EAWM years, increased aerosol concentrations occur in the north due to weakened winds and more stagnant conditions. The daily-averaged AERONET AOD and PW time series for 2018–2019 DJF are shown in Fig. 16a. Consistent with the previously presented evaluations, the daily-average time series for this particular DJF time period are well correlated with AOD and PW moving up and down together. As was done for the Tallahassee site, several peaks in AOD and PW were selected for further evaluation and are highlighted with red arrows in Fig. 16a, including the peak on 3 January and its subsequent decrease on 4 January 2019 and the peak on 20 December 2018 and its subsequent decrease on 21 December 2018. The non-averaged AERONET AOD and PW time series for these two cases are shown in Fig. 16b and c, respectively, with a zoomed-in view of 21 December on Fig. 16d. For both of these events, high AOD from ABF/pollution and high PW values are observed, with a subsequent drop-off the following day, which is well coordinated in the full dataset. A closer look at the data on 21 December 2018 (Fig. 16d), like the previous Tallahassee examples, shows consistent movement between the measured AOD and PW, indicating the presence of correlations on short timescales. For both of these events, the NAAPS-RA AOD and PW fields are shown for both the peak and subsequent drop-off in Fig. 16e. The movement of the large-scale air mass can be seen in both the AOD and PW fields. For the 3–4 January 2019 event, NAVGEM meteorological fields indicate weakened northerly winds due to a region of high pressure over the eastern portion of the continent, leading to stagnant conditions at the surface in Beijing and local pollution and water vapor build-up. On the following day, the high-pressure system moved eastward. As a result, the Siberian High northerlies were no longer suppressed, and a more typical wintertime circulation resumes, with the winds jointly pushing the aerosol and water vapor southward and away from Beijing. For the 20–21 December 2018 case, extensive multi-level cloud cover can be seen in both MODIS Terra and Aqua images on 20 December, indicating that this may be a case where clouds played a role in gas-to-particle conversion in the polluted air and/or enhanced particle humidification in the high RH fields associated with the clouds, consistent with the findings of Eck et al. (2018). As the air mass moves on 21 December, a joint reduction in both AOD and PW is observed at Beijing, demonstrating the impact of large-scale transport. Thus in the Beijing case, the overall regional weather patterns are an important factor in the AOD and PW relationship.
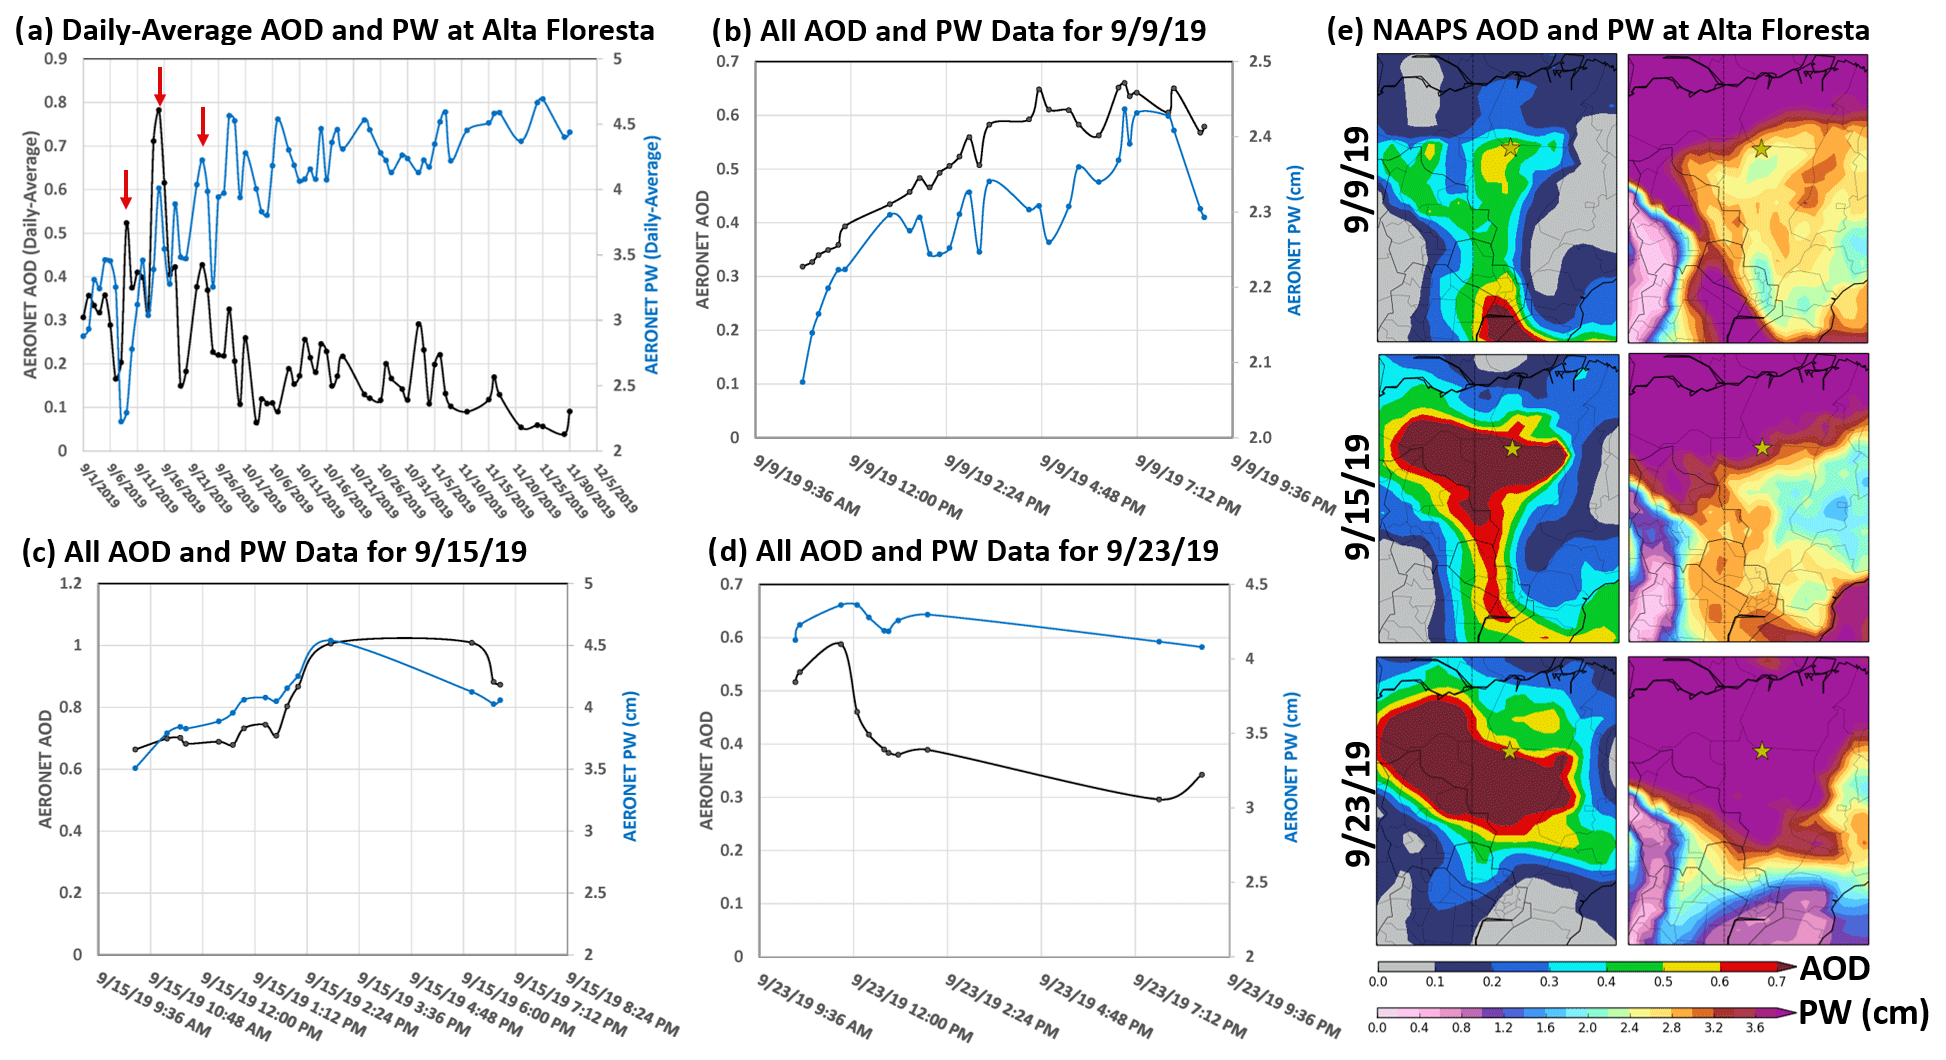
Figure 18AOD and PW time series at the Alta Floresta site in Brazil in which negative AOD and PW correlations were identified in the seasonal analysis. The daily-average AOD and PW time series are shown for the 2019 SON season, with red arrows indicating select events for further evaluation (a). AERONET AOD and PW time series (non-averaged, all data) for the selected events are shown in time series (b–d). Additionally, NAAPS-RA AOD and PW (cm) fields are shown for the same dates, with the AERONET site marked with a yellow star (e).
The third site that is examined is Izaña in the Canary Islands (Fig. 17). The Izaña site, which is located approximately 300 km west of the African coast, is particularly useful for evaluating aerosol and water vapor relationships for free tropospheric dust. It has also been noted in the community that against a Saharan Air Layer free subsidence regime, the infrared signals of Saharan Air Layer dust are quite small relative to co-transported water vapor (Gutleben et al., 2019; Ryder, 2021; Barreto et al., 2022). Nevertheless, forecasters find the water vapor signal useful in tracking dust events (Kuciauskas et al., 2018). Izaña is a mountain site located at approximately 2400 m, above a strong subtropical temperature inversion layer, which makes it ideal for monitoring free tropospheric plumes. In the summer months, frequent and intense Saharan air mass outbreaks in the subtropical free troposphere impact the site. Particularly large AOD dust storms were observed transporting Saharan dust across the Atlantic in the summer of 2020, including the so-called “Godzilla” dust event in June that has been examined in detail in previous studies (Francis et al., 2020). As a result, this time period was evaluated in further detail at Izaña, with a focus on several dust events. In the analysis conducted in this work, positive relationships between AOD and PW were found in both the AERONET and NAAPS datasets at Izaña during the JJA season, with the AERONET dataset having a correlation of 0.66 and the NAAPS-RA indicating a weaker correlation of 0.48 (Table 3). As noted for other sites, this difference may be due to altitude effects at the Izaña site which may not be captured in NAAPS. The daily-average AOD and PW time series for the 2020 JJA season at Izaña are shown in Fig. 17a. The AOD and PW are pretty well correlated, although there are PW peaks present without the presence of aerosol. As sources of aerosol and water vapor are different, this is not unexpected. Three of the joint AOD and PW peaks from the time series, as indicated by the red arrows in Fig. 17a, were selected for further evaluation. This includes 14 June, 18 July, and 31 July 2020 with time series shown in Fig. 17b–d, respectively. As was shown for the previous pollution cases, the AOD and PW are well correlated in the non-averaged dataset, showing the presence of correlations for dust events on timescales less than a day. The NAAPS-RA AOD and PW fields are shown for the 14 June 2020 case in addition to the associated drop-off of both AOD and PW on 18 June 2020, as well as for the 18 and 31 July 2020 events in Fig. 17e. For the 14 June 2020 case, CALIPSO indicates dust tops near Izaña at around 5 km. A cutoff low was present to the northwest of Africa and a subtropical high over the western coast of Africa, which resulted in increased dust generation and recirculation. The southwesterly winds transport the dust to Izaña on 14 June, and at the same time, moist ocean air shown by the PW fields is transported to Izaña as well, resulting in a spike in both AOD and PW at the AERONET site. On 18 June, the moisture and dust begin pushing south and west across the Atlantic, resulting in decreases in AOD and PW at the same time at Izaña. Similar examples of dust and water vapor co-transport are shown for 18 and 31 July 2020 cases. These results are consistent with previous studies which have indicated enhanced water vapor mixing ratios associated with the dust in Saharan Air Layer events (Marsham et al., 2008; Jung et al., 2013; Kanitz et al., 2014). Thus, Izaña is a good example of subtropical free tropospheric co-transport of water vapor and dust.
The final site evaluated was Alta Floresta, Brazil, for the 2019 SON season, when biomass burning is the dominant aerosol type. Here, there is a strong seasonal dependency: drier seasonal conditions are associated with a July–October biomass burning season. At this site and other regions of biomass burning, negative correlations between AOD and PW were identified in the presented evaluations. For Alta Floresta, SON correlations of −0.38 and −0.47 were generated from the AERONET and NAAPS-RA datasets, respectively (Table 4). The daily-average AOD and PW time series are shown in Fig. 18a. An important thing to note about this time series is that a clear downward shift in the PW fields occurs during October, consistent with monthly site climatologies from AERONET (3.61 cm in September, 4.15 cm in October, 4.5 cm in November). As fires are associated with dry conditions, the AOD fields decrease as the water vapor increases. This shift towards wetter and decreased aerosol conditions is driving the seasonal negative correlations for biomass burning regions. However, despite this overall shift, peaks in AOD and PW are generally positively correlated. Several such cases are highlighted in the time series, including 15 and 23 September 2019. The 9 September 2019 event is also highlighted in which the daily-averaged AOD peaks and the PW is at a low. For all three cases, the AOD and PW time series shown in Fig. 18b–d show good positive correlations, with AOD and PW changing in the 9 September 2019 case; this appears to be a more locally driven event with the extent of the smoke being more limited and the air being drier than the surrounding areas, suggesting a different air mass (Fig. 18e). Additionally, there is much more small-scale variability in the AOD and PW fields (Fig. 18b). For this type of event, the daily-average PW fields might not be as good of an indicator of what is going on with AOD. For the other two cases, the NAAPS-RA plots indicate larger spatial extent of the smoke with more moisture associated with the air mass. In this case, daily-average PW is a better indicator for large-scale smoke events. However, for all three smoke cases, AOD and PW are correlated on an event level. Thus, in this case the AOD–PW relationship identified in the previously presented AERONET and NAAPS-RA evaluations represents the end of the burning season, with wet-season onset in the middle of a “climatological season”. However, PW is a good positive indicator of AOD associated with smoke on an event level, consistent with what has previously been shown in the literature for case study evaluations.
The relationship between AOD and PW was evaluated globally at seasonal and daily timescales using approximately 20 years of AERONET observational data and the 16-year NAAPS-RA v1.0 model fields. As AERONET observations have small measurement uncertainties, the observational analysis provides a best estimate of the AOD and PW relationships. The observational analysis was combined with the NAAPS-RA in order to provide a complete global perspective on the AOD and PW relationship as well as to provide an avenue for further exploration, including what the likely drivers of these relationships are, what the relationships look like when taking the vertical location into account, and the impact of hygroscopic growth on the AOD and PW correlations.
The major findings of this work include the following:
-
Seasonal relationships between AOD and PW are present across the globe at both seasonal and daily levels. Most often, AOD and PW relationships are strongly positive at seasonal to daily timescales, especially for species such as pollution and dust. Biomass burning, however, has negative seasonal relationships due to fire proclivity in dry seasons. Nevertheless, positive daily relationships are observed, associated with transport. For regions like the Sahel, negative relationships between AOD and PW were found, with spatial patterns consistent with shifts in the ITCZ in which convection leads to aerosol scavenging.
-
Midlatitude relationships between AOD and PW appear to be driven by frontal activity, while tropical/subtropical relationships are driven by seasonal monsoon activity, ITCZ, and dry-season patterns. Dust transport associated with African easterly waves and cyclones is the link between aerosol and water vapor for the Sahara.
-
The observed correlations between the AOD and PW were stronger when evaluated by vertical level, with the strongest correlations identified in the free troposphere, consistent with large-scale aerosol and water vapor transport. The location of the strongest correlations varied by aerosol type, with dust-dominated regions having the strongest correlations in the middle free troposphere and smoke-dominated regions having the strongest correlations in the lower free troposphere.
-
Hygroscopic growth of aerosol particles, which is associated with increased relative humidity and often occurs with increasing PW, has a large influence on the observed covariability between AOD and PW, particularly in the midlatitudes and for non-dust aerosol species. While transport covariance between AOD and PW is present, the embedded RH-to-PW relationship is the dominant term. This indicates that PW is a good tracer for AOD but not necessarily aerosol mass. This finding has relevance for data assimilation applications as well as PM retrievals.
-
Covariability between AOD and PW for dust-dominated events is statistically significant, and hygroscopic growth is not an important factor.
Overall, this evaluation provides a global perspective on AOD and PW relationships. As has been previously shown for individual case studies in the literature, this work reaffirms that PW is a useful tracer for aerosol transport, and such relationships are present across the globe. The seasonal AOD and PW evaluations conducted in this work highlight regions and seasons for which AOD and PW relationships are expected to be more prevalent. In particular, regions and seasons for which strong correlations and impacts on the PW distribution for high-AOD events are found are associated with synoptic-scale aerosol events, including large-scale pollution and smoke events over the continental United States (CONUS) and Europe; Saharan dust events over the Atlantic; biomass burning events during regional dry seasons in South and Central America, Africa, and Southeast Asia; and Asian dust/haze events. This is confirmed when evaluating AOD and PW relationships on an event basis in different parts of the world in which coincident peaks in daily-averaged AOD and PW were associated with large-scale aerosol transport events. The vertical evaluation of the AOD and PW relationship provides further evidence that a strong contributor to the identified relationship is synoptic-scale aerosol transport in the free troposphere, where the relationships were found to be stronger than the fully integrated vertical column. These signals were present for all aerosol types evaluated, indicating PW can be a useful tracer for AOD associated with all aerosol types as long as sources of both and a common linking transport mechanism are present. For example, in the United States, fronts were the linking transport mechanism, while in East Asia, monsoonal patterns controlled joint transport. Likewise, dust transport associated with African easterly waves and cyclones linked aerosol and water vapor for the Sahara. Regions identified with strong correlations indicate the frequent presence of such synoptic-scale co-transport events, while the PW distribution evaluation for high-AOD events highlights regions in which such events are present but can be infrequent, as was the case for boreal smoke events in summertime.
This work provides a first step in understanding the important aerosol and water vapor relationship on a global scale. While aerosol and water vapor relationships will vary from air mass to air mass, this analysis provides an understanding of where and when AOD and PW relationships are expected to be of importance and can be exploited (1) in the use of water vapor as an aerosol tracer, (2) in data assimilation applications, and (3) for radiative transfer studies in which collocated aerosol and water vapor can impact results. These findings are also valuable in identifying locations with potential for PM retrieval from space in which hygroscopic growth was not found to be an important factor in the AOD and PW relationship. While this analysis provides a quantitative estimate of the aerosol and water vapor relationship in a big-picture sense, the next step is to further understand the aerosol and water vapor relationships on an event level. This is particularly important for data assimilation in which an understanding of how this relationship temporally and spatially evolves for individual air masses needs to be developed. As such, a follow-on study will be conducted to investigate the evolution of aerosol and water vapor in space and time on an event level, with a focus on specific regions identified in this work.
AERONET observations are available for download through https://aeronet.gsfc.nasa.gov/ (AERONET, 2021), and the NAAPS reanalysis data in NetCDF format can be downloaded through the US Global Ocean Data Assimilation Experiment (GODAE) server (https://usgodae.org/cgi-bin/datalist.pl?dset=nrl_naaps_reanalysis&summary=Go, Xian, 2022).
JIR and JSR planned the analysis, while JIR conducted the majority of the analyses presented in this work. PX provided the NAAPS-RA dataset and provided help in using the data. JSR, JIR, CMS, and TFE helped in interpreting the results of the study, with CMS focusing on the meteorological aspect and TFE providing important feedback on the evaluation using AERONET data.
The contact author has declared that none of the authors has any competing interests.
Publisher’s note: Copernicus Publications remains neutral with regard to jurisdictional claims in published maps and institutional affiliations.
The authors acknowledge all those involved with making the AERONET data available. The authors also acknowledge the NRL Base Program and the Office of Naval Research Code 322 for support of this work as well as the development of NAAPS and the associated reanalysis. Thomas Eck is funded through the NASA AERONET project, which is supported by the Radiation Science Program.
This research has been supported by the U.S. Naval Research Laboratory.
This paper was edited by N'Datchoh Evelyne Touré and reviewed by two anonymous referees.
AERONET: Aerosol Robotic network, [data set], https://aeronet.gsfc.nasa.gov/ last access: 4 April 2021.
Adebiyi, A. A., Zuidema, P., and Abel, S. J.: The Convolution of Dynamics and Moisture with the Presence of Shortwave Absorbing Aerosols over the Southeast Atlantic, J. Climate, 28, 1997–2024, https://doi.org/10.1175/JCLI-D-14-00352.1, 2015.
Arola, A., Eck, T. F., Kokkola, H., Pitkänen, M. R. A., and Romakkaniemi, S.: Assessment of cloud-related fine-mode AOD enhancements based on AERONET SDA product, Atmos. Chem. Phys., 17, 5991–6001, https://doi.org/10.5194/acp-17-5991-2017, 2017.
Barreto, Á., Cuevas, E., García, R. D., Carrillo, J., Prospero, J. M., Ilić, L., Basart, S., Berjón, A. J., Marrero, C. L., Hernández, Y., Bustos, J. J., Ničković, S., and Yela, M.: Long-term characterisation of the vertical structure of the Saharan Air Layer over the Canary Islands using lidar and radiosonde profiles: implications for radiative and cloud processes over the subtropical Atlantic Ocean, Atmos. Chem. Phys., 22, 739–763, https://doi.org/10.5194/acp-22-739-2022, 2022.
Benedetti, A., Morcrette, J.-J., Boucher, O., Dethof, A., Engelen, R. J., Fisher, M., Flentje, H., Huneeus, N., Jones, L., Kaiser, J. W., Kinne, S., Mangold, A., Razinger, M., Simmons, A. J., and Suttie, M.: Aerosol analysis and recast in the European centre for Medium-Range Weather Forecasts Integrated Forecast System: 2. Data assimilation, J. Geophys. Res., 114, D13205, https://doi.org/10.1029/2008JD011115, 2009.
Charlson, R. J., Schwartz, S. E., Hales, J. M., Cess, R. D., Coakley Jr., J. A., Hansen, J. E., and Hoffman, D. J.: Climate forcing by anthropogenic aerosols, Science, 255, 423–430, https://doi.org/10.1126/science.255.5043.423, 1992.
Daley, R. and Barker, E.: NAVDAS: Formulation and diagnostics, Mon. Weather Rev., 129, 869–883, https://doi.org/10.1175/1520-0493(2001)129, 2001.
Deaconu, L. T., Ferlay, N., Waquet, F., Peers, F., Thieuleux, F., and Goloub, P.: Satellite inference of water vapour and above-cloud aerosol combined effect on radiative budget and cloud-top processes in the southeastern Atlantic Ocean, Atmos. Chem. Phys., 19, 11613–11634, https://doi.org/10.5194/acp-19-11613-2019, 2019.
DeSouza-Machado, S. G., Strow, L. L., Hannon, S. E., and Motteler, H. E.: Infrared dust spectral signatures from AIRS, Geophys. Res. Lett., 33, L03801, https://doi.org/10.1029/2005GL024364, 2006.
De Tomasi, F. and Perrone, M. R.: Lidar measurements of tropospheric water vapor and aerosol profiles over southeastern Italy, J. Geophys. Res., 108, 4286, https://doi.org/10.1029/2002JD002781, 2003.
Eck, T. F. and Holben, B. N.: AVHRR split window temperature differences and total precipitable water over land surfaces, Int. J. Remote Sens., 15, 567–582, https://doi.org/10.1080/01431169408954097, 1994.
Eck, T. F., Holben B. N., Reid, J. S., Dubovik, O., Smirnov, A., O'Neill, N. T., Slutsker, I., and Kinne, S.: Wavelength dependence of the optical depth of biomass burning, urban, and desert dust aerosols, J. Geophys. Res., 104, 31333–31349, https://doi.org/10.1029/1999JD900923, 1999.
Eck, T. F., Holben, B. N., Reid, J. S., Giles, D. M., Rivas, M. A., Singh, R. P., Tripathi, S. N., Bruegge, C. J., Platnick, S., Arnold, G. T., Krotkov, N. A., Carn, S. A., Sinyuk, A., Dubovik, O., Arola, A., Schafer, J. S., Artaxo, P., Smirnov, A., Chen, H., and Goloub, P.: Fog- and cloud-induced aerosol modification observed by the Aerosol Robotic Network (AERONET), J. Geophys. Res., 117, D07206, https://doi.org/10.1029/2011JD016839, 2012.
Eck, T. F., Holben, B. N., Reid, J. S., Arola, A., Ferrare, R. A., Hostetler, C. A., Crumeyrolle, S. N., Berkoff, T. A., Welton, E. J., Lolli, S., Lyapustin, A., Wang, Y., Schafer, J. S., Giles, D. M., Anderson, B. E., Thornhill, K. L., Minnis, P., Pickering, K. E., Loughner, C. P., Smirnov, A., and Sinyuk, A.: Observations of rapid aerosol optical depth enhancements in the vicinity of polluted cumulus clouds, Atmos. Chem. Phys., 14, 11633–11656, https://doi.org/10.5194/acp-14-11633-2014, 2014.
Eck, T. F., Holben, B. N., Reid, J. S., Xian, P.,Giles, D. M., Sinyuk, A., Smirnov, A., Schafer, J. S., Slutsker, I., Kim, J., Koo, J.-H., Choi, M., Kim, K. C., Sano, I., Arola, A., Sayer, A. M., Levy, R. C., Munchak, L. A., O'Neill, N. T., Lyapustin, A., Hsu, N. C., Randles, C. A., Da Silva, A. M., Buchard, V., Govindaraju, R. C., Hyer, E., Crawford, J. H., Wang, P., and Xia, X.: Observations of the interaction and transport offine mode aerosols with cloud and/or fog in Northeast Asia from Aerosol Robotic Network and satellite remote sensing, J. Geophys. Res.-Atmos., 123, 5560–5587, https://doi.org/10.1029/2018JD028313, 2018.
Eck, T. F., Holben, B. N., Giles, D. M., Slutsker, I., Sinyuk, A., Schafer, J. S., Smirnov, A., Sorokin, M., Reid, J. S., Sayer, A. M., Hsu, N. C., Shi, Y. R., Levy, R. C., Lyapustin, A., Rahman, M. A., Liew, S.-C., Cortijo, S. V. S., Li, R., Kalbermatter, D., Keong, K. L., Yuggotomo, M. E., Aditya, F., Mohamad, M., Mahmud, M., Chong, T. K., Lim, H.-S., Choon, Y. E., Deranadyan, G., Kusumaningtyas, S. D. A., and Aldrian, E.: AERONET Remotely Sensed Measurements and Retrievals of Biomass Burning Aerosol Optical Properties During the 2015 Indonesian Burning Season, J. Geophys. Res., 124, 4722–4740, https://doi.org/10.1029/2018JD030182, 2019.
Francis, D., Fonseca, R., Nelli, N., Cuesta, J., Weston, M., Evan, A., and Temimi, M.: The atmospheric drivers of the major Saharan dust storm in June 2020, Geophys. Res. Lett., 47, e2020GL090102, https://doi.org/10.1029/2020GL090102, 2020.
Frouin, R. J., Franz, B. A., Ibrahim, A., Knobelspiesse, K., Ahmad, Z., Cairns, B., Chowdhary, J., Dierssen, H. M., Tan, J., Dubovik, O., Huang, X., Davis, A. B., Kalashnikova, O., Thompson, D. R., Remer, L. A., Boss, E., Coddington, O., Deschamps, P.-Y., Gao, B.-C., Gross, L., Hasekamp, O., Omar, A., Pelletier, B., Ramon, D., Steinmetz, F., and Zhai, P.-W.: Atmospheric correction of satellite ocean-color imagery during the PACE Era, Front. Earth Sci., 7, 145, https://doi.org/10.3389/feart.2019.00145, 2019.
Gao, M., Carmichael, G. R., Saide, P. E., Lu, Z., Yu, M., Streets, D. G., and Wang, Z.: Response of winter fine particulate matter concentrations to emission and meteorology changes in North China, Atmos. Chem. Phys., 16, 11837–-11851, https://doi.org/10.5194/acp-16-11837-2016, 2016.
Giles, D. M., Sinyuk, A., Sorokin, M. G., Schafer, J. S., Smirnov, A., Slutsker, I., Eck, T. F., Holben, B. N., Lewis, J. R., Campbell, J. R., Welton, E. J., Korkin, S. V., and Lyapustin, A. I.: Advancements in the Aerosol Robotic Network (AERONET) Version 3 database – automated near-real-time quality control algorithm with improved cloud screening for Sun photometer aerosol optical depth (AOD) measurements, Atmos. Meas. Tech., 12, 169–-209, https://doi.org/10.5194/amt-12-169-2019, 2019.
Granados-Muñoz, M. J., Sicard, M., Román, R., Benavent-Oltra, J. A., Barragán, R., Brogniez, G., Denjean, C., Mallet, M., Formenti, P., Torres, B., and Alados-Arboledas, L.: Impact of mineral dust on shortwave and longwave radiation: evaluation of different vertically resolved parameterizations in 1-D radiative transfer computations, Atmos. Chem. Phys., 19, 523–-542, https://doi.org/10.5194/acp-19-523-2019, 2019.
Gutleben, M., Groß, S., Wirth, M., Emde, C., and Mayer, B.: Impacts of water vapor on Saharan air layer radiative heating, Geophys. Res. Lett., 46, 14854–14862, https://doi.org/10.1029/2019GL085344, 2019.
Haywood, J. M., Bellouin, N., Jones, A., Boucher, O., Wild, M., and Shine, K. P.: The roles of aerosol, water vapor and cloud in future global dimming/brightening, J. Geophys. Res., 116, D20203, https://doi.org/10.1029/2011JD016000, 2011.
Hänel, G.: The properties of atmospheric aerosol particles as functions of the relative humidity at thermo-dynamic equilibrium with the surrounding moist air, Adv. Geophys. 19, 73–18, https://doi.org/10.1016/S0065-2687(08)60142-9, 1976.
He Q., Ma, J., Zheng, X., Wang, Y., Wang Y., Mu, H., Cheng, T., He, R., Huang, G., and Liu, D.: Formation and dissipation dynamics of the Asian tropopause aerosol layer, Environ. Res. Lett, 16, 014015, https://doi.org/10.1088/1748-9326/abcd5d, 2021.
Heo, J.-H., Ryu, G.-H., and Jang, J.-D.: Optimal Interpolation of Precipitable Water Using Low Earth Orbit and Numerical Weather Prediction Data, Remote Sens., 436, https://doi.org/10.3390/rs10030436, 2018.
Hogan, T. F., Liu, M., Ridout, J. S., Peng, M. S., Whitcomb, T. R., Ruston, B. C., Reynolds, C. A., Eckermann, S. D., Moskaitis, J. R., Baker, N. L., McCormack, J. P., Viner, K. C., McLay, J. G., Flatau, M. K., Xu, L., Chen, C., and Chang, S. W.: The Navy Global Environmental Model, Oceanography, Special Issue on Navy Operational Models, 27, 116–125, https://doi.org/10.5670/oceanog.2014.73, 2014.
Holben, B. N., Eck, T. F., Slutsker, I., Tanré, D., Buis, J. P., Setzer, A., Vermote, E., Reagan, J. A., Kaufman, Y. J., Nakajima, T., Lavenu, F., Jankowiak, I., and Smirnov, A.: AERONET – A federated instrument network and data archive for aerosol characterization, Remote Sens. Environ., 66, 1–16, https://doi.org/10.1016/S0034-4257(98)00031-5, 1998.
Huttunen, J., Arola, A., Myhre, G., Lindfors, A. V., Mielonen, T., Mikkonen, S., Schafer, J. S., Tripathi, S. N., Wild, M., Komppula, M., and Lehtinen, K. E. J.: Effect of water vapor on the determination of aerosol direct radiative effect based on the AERONET fluxes, Atmos. Chem. Phys., 14, 6103–6110, https://doi.org/10.5194/acp-14-6103-2014, 2014.
Ibrahim, A., Franz, B. A., Ahmad, Z., and Bailey, S. W.: Multiband atmospheric correction algorithm for ocean color retrievals, Front. Earth Sci., 7, 116, https://doi.org/10.3389/feart.2019.00116, 2019.
Ichoku, C., Allen Chu, D., Mattoo, S., Kaufman, Y. J., Remer, L. A., Tanre, D., Slutsker, I., and Holben, B. N.: A spatio-temporal approach for global validation and analysis of MODIS aerosol products, Geophys. Res. Lett., 29, https://doi.org/10.1029/2001GL013206, 2002.
Jeong, J. I. and Park, R. J.: Winter monsoon variability and its impact on aerosol concentrations in East Asia, Environ. Pollut., 221, 285–292, https://doi.org/10.1016/j.envpol.2016.11.075, 2017.
Jung, E., Albrecht, B., Prospero, J. M., Jonsson, H. H., and Kreidenweis, S. M.: Vertical structure of aerosols, temperature, and moisture associated with an intense African dust event observed over the eastern Caribbean, J. Geophys. Res.-Atmos., 118, 4623–4643, https://doi.org/10.1002/jgrd.50352, 2013.
Kahn, R. A., Gaitley, B. J., Martonchik, J. V., Diner, D. J., Crean, K. A., and Holben, B.: Multiangle Imaging Spectroradiometer (MISR) global aerosol optical depth validation based on 2 years of coincident Aerosol Robotic Network (AERONET) observations, J. Geophys. Res., 110, D10S04, https://doi.org/10.1029/2004JD004706, 2005.
Kanitz, T., Ansmann, A., Seifert, P., Engelmann, R., Kalisch, J., and Althausen, D.: Radiative effect of aerosols above the northern and southern Atlantic Ocean as determined from shipborne lidar observations, J. Geophys. Res.-Atmos., 118, 12556–12565, https://doi.org/10.1002/2013jd019750, 2013.
Kanitz, T., Engelmann, R., Heinold, B., Baars, H., Skupin, A., and Ansmann, A.: Tracking the Saharan air layer with shipborne lidar across the tropical atlantic, Geophys. Res. Lett., 41, 1044–1050, https://doi.org/10.1002/2013gl058780, 2014.
Kannemadugu, H. B. S., Varghese, A. O., Mukkara, S. R., Joshi, A. K., and Moharil, S. V.: Discrimination of Aerosol Types and Validation of MODIS Aerosol and Water Vapour Products Using a Sun Photometer over Central India, Aerosol Air Qual. Res., 15, 682–693, https://doi.org/10.4209/aaqr.2014.04.0088, 2015.
Karyampudi, V. M., Palm, S. P., Reagen, J. A., Fang, H., Grant, W. B, Hoff, R. M., Moulin, C., Pierce, H. F., Torres, O., Browell, E. V., and Melfi, S. H.: Validation of the Saharan dust plume conceptual model using Lidar, Meteosat, and ECMWF data, B. Am. Meteorol. Soc., 80, 1045–1074, https://doi.org/10.1175/1520-0477(1999), 1999.
Kaufman, Y. J. and Fraser, R. S.: The effect of smoke particles on clouds and climate forcing, Science, 277, 1636–1639, https://doi.org/10.1126/science.277.5332.1636, 1997.
Kim, S.-W., Chazette, P., Dulac, F., Sanak, J., Johnson, B., and Yoon, S.-C.: Vertical structure of aerosols and water vapor over West Africa during the African monsoon dry season, Atmos. Chem. Phys., 9, 8017–8038, https://doi.org/10.5194/acp-9-8017-2009, 2009.
Kleinman, L. I. and Daum, P. H.: Vertical distribution of aerosol particles, water vapor, and insoluble trace gases in convectively mixed air, J. Geophys. Res.-Atmos., 96, 991–1005, https://doi.org/10.1029/90JD02117, 1991.
Kuciauskas, A. P., Xian, P., Hyer, E. J., Oyola, M. I., and Campbell, J. R.: Supporting Weather Forecasters in Predicting and Monitoring Saharan Air Layer Dust Events as They Impact the Greater Caribbean, B. Am. Meteorol. Soc., 99, 259–268, https://doi.org/10.1175/BAMS-D-16-0212.1, 2018.
Kumar, K. R., Sivakumar, V., Reddy, R. R., Gopal, K. R., and Adesina, A. J.: Inferring wavelength dependence of AOD and Ångström exponent over a sub-tropical station in South Africa using AERONET data: Influence of meteorology, long-range transport and curvature effect, Sci. Total Environ., 461, 397–408, https://doi.org/10.1016/j.scitotenv.2013.04.095, 2013.
Kumar, K. R., Kang, N., Sivakumar, V., and Griffith, D.: Temporal characteristics of columnar aerosol optical properties and radiative forcing (2011–2015) measured at AERONET's Pretoria_CSIR_DPSS site in South Africa, Atmos. Environ., 165, 274–289, https://doi.org/10.1016/j.atmosenv.2017.06.048, 2017.
Lee, E., Županski, M., Županski, D., and Park, S. K.: Impact of the OMI aerosol optical depth on analysis increments through coupled meteorology–aerosol data assimilation for an Asian dust storm, Remote Sens. Environ., 193, 38–53, https://doi.org/10.1016/j.rse.2017.02.013, 2017.
Li, Q., Zhang, R., and Wang, Y.: Interannual variation of the wintertime fog-haze days across central and eastern China and its relation with East Asian winter monsoon, Int. J. Clim., 36, 346–354, https://doi.org/10.1002/joc.4350, 2016.
Li, J., Liao, H., Hu, J., and Li, N.: Severe particulate pollution days in China during 2013–2018 and the associated typical weather patterns in Beijing-Tianjin-Hebei and the Yangtze River Delta regions, Environ. Pollut., 248, 74–81, https://doi.org/10.1016/j.envpol.2019.01.124, 2019.
Liu, Z., Liu, Q., Lin, H. C., Schwartz, C. S., Lee, Y. H., and Wang, T.: Three-dimensional variational assimilation of MODIS aerosol optical depth: Implementation and application to a dust storm over East Asia, J. Geophys. Res.-Atmos., 116, 1–19, https://doi.org/10.1029/2011JD016159, 2011.
Liu, D., Zhao, T., Boiyo, R., Chen, S., Lu, Z., Wu, Y., and Zhao, Y.: Vertical structures of dust aerosols over East Asia based on CALIPSO retrievals. Remote Sens., 11, 701, https://doi.org/10.3390/rs11060701, 2019.
Livingston, J. M., Russell, P. B., Reid, J. S., Redemann, J., Schmidt, B., Allen, D. A., Torres, O., Levy, R. C., Remer, L. A., Holben, B. N., Smirnov, A., Dubovik, O., Welton, E. J., Campbell, J. R., Wang, J., and Christopher, S. A.: Airborne Sun photometer measurements of aerosol optical depth and columnar water vapor during the Puerto Rico Dust Experiment and comparison with land, aircraft, and satellite measurements, J. Geophys. Res., 108, 8588, https://doi.org/10.1029/2002JD002520, 2003.
Luo, B., Minnett, P. J., Gentemann, C., and Szczodrak, G.: Improving satellite retrieved night-time infrared sea surface temperatures in aerosol contaminated regions, Remote Sens. Environ., 223, 8–20, https://doi.org/10.1016/j.rse.2019.01.009, 2019.
Lynch, P., Reid, J. S., Westphal, D. L., Zhang, J., Hogan, T. F., Hyer, E. J., Curtis, C. A., Hegg, D. A., Shi, Y., Campbell, J. R., Rubin, J. I., Sessions, W. R., Turk, F. J., and Walker, A. L.: An 11-year global gridded aerosol optical thickness reanalysis (v1.0) for atmospheric and climate sciences, Geosci. Model Dev., 9, 1489–1522, https://doi.org/10.5194/gmd-9-1489-2016, 2016.
Marsham, J. H., Parker, D. J., Grams, C. M., Johnson, B. T., Grey, W. M. F., and Ross, A. N.: Observations of mesoscale and boundary-layer scale circulations affecting dust transport and uplift over the Sahara, Atmos. Chem. Phys., 8, 6979–6993, https://doi.org/10.5194/acp-8-6979-2008, 2008.
Marsham, J. H., Parker, D. J., Todd, M. C., Banks, J. R., Brindley, H. E., Garcia-Carreras, L., Roberts, A. J., and Ryder, C. L.: The contrasting roles of water and dust in controlling daily variations in radiative heating of the summertime Saharan heat low, Atmos. Chem. Phys., 16, 3563–3575, https://doi.org/10.5194/acp-16-3563-2016, 2016.
Martins, V. S., Novo, E. M. L. M., Lyapustin, A., Aragao, L. E. O. C., Freitas, S. R., and Barbosa, C. C. F.: Seasonal and interannual assessment of cloud cover and atmospheric constituents across the Amazon (2000–2015): Insights for remote sensing and climate analysis, ISPRS J. Photogr. Remote Sens., 145, 309–327, https://doi.org/10.1016/j.isprsjprs.2018.05.013, 2018.
Ménard, R., Gauthier, P., Rochon, Y., Robichaud, A., de Grandpré, J., Yang, Y., Charrette, C., and Chabrillat, S.: Coupled Stratospheric Chemistry–Meteorology Data Assimilation, Part II: Weak and Strong Coupling, Atmosphere, 10, 798, https://doi.org/10.3390/atmos10120798, 2019.
Mortier, A., Goloub, P., Derimian, Y., Tanre, D., Podvin, T., Blarel, L., Deroo, C., Marticorena, B., Diallo, A., and Ndiaye, T.: Climatology of aerosol properties and clear-sky shortwave radiative effects using Lidar and Sun photometer observations in the Dakar site, J. Geophys. Res.-Atmos., 121, 6489–6510, https://doi.org/10.1002/2015JD024588, 2016.
O'Neill, N. T., Royer, A., Coté, P., and McArthur, L. J. B.: Relations between optically derived aerosol parameters, humidity, and air-quality data in an urban atmosphere, J. Appl Meteor., 32, 1484–1498, https://doi.org/10.1175/1520-0450(1993)032<1484:RBODAP>2.0.CO;21993, 1993.
Patadia, F., Levy, R. C., and Mattoo, S.: Correcting for trace gas absorption when retrieving aerosol optical depth from satellite observations of reflected shortwave radiation, Atmos. Meas. Tech., 11, 3205–3219, https://doi.org/10.5194/amt-11-3205-2018, 2018.
Perez-Ramirez, D., Whiteman, D. N., Smirnov, A., Lyamani, H., Holben, B. N., Pinker, R., Andrade, M., and Alados-Arboledas, L.: Evaluation of AERONET precipitable water vapor versus microwave radiometry, GPS, and radiosondes at ARM sites, J. Geophys. Res.-Atmos, 119, 9596–9613, https://doi.org/10.1002/2014JD021730, 2014.
Perry, K. D. and Hobbs P. V.: Influences of isolated cumulus clouds on the humidity of their surroundings, J. Atmos. Sci., 53, 159–174, 1996.
Pistone, K., Praveen, P. S., Thomas, R. M., Ramanathan, V., Wilcox, E. M., and Bender, F. A.-M.: Observed correlations between aerosol and cloud properties in an Indian Ocean trade cumulus regime, Atmos. Chem. Phys., 16, 5203–5227, https://doi.org/10.5194/acp-16-5203-2016, 2016.
Pistone, K., Zuidema, P., Wood, R., Diamond, M., da Silva, A. M., Ferrada, G., Saide, P. E., Ueyama, R., Ryoo, J.-M., Pfister, L., Podolske, J., Noone, D., Bennett, R., Stith, E., Carmichael, G., Redemann, J., Flynn, C., LeBlanc, S., Segal-Rozenhaimer, M., and Shinozuka, Y.: Exploring the elevated water vapor signal associated with the free tropospheric biomass burning plume over the southeast Atlantic Ocean, Atmos. Chem. Phys., 21, 9643–9668, https://doi.org/10.5194/acp-21-9643-2021, 2021.
Radke, L. F. and Hobbs, P. V.: Humidity and particle fields around some small cumulus clouds, J. Atmos. Sci., 48, 1190–1193, https://doi.org/10.1175/1520-0469(1991), 1991.
Reid, J. S., Kinney, J. E., Westphal, D. L., Holben, B. N., Welton, E. J., Tsay, S.-C., Christopher, S. A., Eleuterio, D. P., Campbell, J. R., Jonsson, H. H., Livingston, J. M., Maring, H. B., Meier, M., Pilewskie, P., Reid, E. A., Russell, P. B., Savoie, D., Smironov, A., and Tanré, D.: Analysis of measurements of Saharan dust by airborne and ground-based remote sensing methods during the Puerto Rico Dust Experiment (PRIDE), J. Geophys. Res., 108, 8586, https://doi.org/10.1029/2002JD002493, 2003.
Reid, J. S., Piketh, S., Burger, R., Ross, K., Jensen, T., Bruintjes, R., Walker, A., Al Mandoos, A., Miller, S., Hsu, C., Kuciauskas, A., and Westphal, D. L.: An overview of UAE2flight operations: Observations of summertime atmospheric thermodynamic and aerosol profiles of the southern Arabian Gulf, J. Geophys. Res., 113, D14213, https://doi.org/10.1029/2007JD009435, 2008.
Reid, J. S., Hyer, E. J., Johnson, R., Holben, B. N., Yokelson, R. J., Zhang, J., Campbell, J. R., Christopher, S. A., Di Girolamo, L., Giglio, L., Holz, R. E., Kearney, C., Miettinen, J., Reid, E. A., Turk, F.J., Wang, J., Xian, P., Zhao, G., Balasubramanian, R., Chew, B. N., Janjai, S., Lagrosas, N., Lestari, P., Lin, N.-H., Mahmud, M., Nguyen, A. X., Norris, B., Oanh, N. T. K., Oo, M., Salinas, S. V., Welton, E. J., and Liew, S. C.: Observing and understanding the Southeast Asian aerosol system by remote sensing: An initial review and analysis for the Seven Southeast Asian Studies (7SEAS) program, Atmos. Res., 122, 403–468, https://doi.org/10.1016/j.atmosres.2012.06.005, 2013.
Reid, J. S., Posselt, D. J., Kaku, K., Holz, R. A., Chen, G., Eloranta, E. W., Kuehn, R. E., Woods, S., Zhang, J., Anderson, B., Bui, T. P., Diskin, G. S., Minnis, P., Newchurch, M. J., Tanelli, S., Trepte, C. R., Thornhill, K. L., and Ziemba, L. D.: Observations and hypotheses related to low to middle free tropospheric aerosol, water vapor and altocumulus cloud layers within convective weather regimes: a SEAC4RS case study, Atmos. Chem. Phys., 19, 11413–11442, https://doi.org/10.5194/acp-19-11413-2019, 2019.
Reid, J. S., Gumber, A., Zhang, J., Holz, R. E., Rubin, J. I., Xian, P., Smirnov, A., Eck, T. F., O'Neill, N. T., Levy, R. C., Reid, E. A., Colarco, P. R., Benedetti, A., and Tanaka, T.: A Coupled Evaluation of Operational MODIS and Model Aerosol Products for Maritime Environments Using Sun Photometry: Evaluation of the Fine and Coarse Mode, Remote Sens., 14, 2978, https://doi.org/10.3390/rs14132978, 2022.
Remer, L. A., Tanre, D., Kaufman, Y. J., Ichoku, C., Mattoo, S., Levy, R., Chu, D. A., Holben, B., Dubovik, O., Smirnov, A., Martins, J. V., Li, R.-R, and Ahmad, Z.: Validation of MODIS aerosol retrieval over ocean, Geophys. Res. Lett., 29, 1618, https://doi.org/10.1029/2001GL013204, 2002.
Resquin, M. D., Santagata, D., Gallardo, L., Gomez, D., Rossler, C., and Dawidowski, L.: Local and remote black carbon sources in the Metropolitan Area of Buenos Aires, Atmos. Environ., 182, 105–114, https://doi.org/10.1016/j.atmosenv.2018.03.018, 2018.
Rosário, N. E., Yamasoe, M. A., Brindley, H., Eck, T. F., and Schafer, J.: Downwelling solar irradiance in the biomass burning region of the southern Amazon: Dependence on aerosol intensive optical properties and role of water vapor, J. Geophys. Res., 116, D18304, https://doi.org/10.1029/2011JD015956, 2011.
Rubin, J. I., Reid, J. S., Hansen, J. A., Anderson, J. L., Collins, N., Hoar, T. J., Hogan, T., Lynch, P., McLay, J., Reynolds, C. A., Sessions, W. R., Westphal, D. L., and Zhang, J.: Development of the Ensemble Navy Aerosol Analysis Prediction System (ENAAPS) and its application of the Data Assimilation Research Testbed (DART) in support of aerosol forecasting, Atmos. Chem. Phys., 16, 3927–3951, https://doi.org/10.5194/acp-16-3927-2016, 2016.
Ryder, C. L.: Radiative effects of increased water vapor in the upper Saharan Air Layer associated with enhanced dustiness, J. Geophys. Res.-Atmos., 126, e2021JD034696, https://doi.org/10.1029/2021JD034696, 2021.
Sano, I., Mukai, S., Yamauo, M., Takamura, T., Nakajima, T., and Holben, B.: Calibration and Validation of Retrieved Aerosol Properties Based on AERONET and SKYNET, Adv. Space Res., 32, 2159–2164, https://doi.org/10.1016/S0273-1177(03)00685-9, 2003.
Schneider, T., O'Gorman, P. A., and Levine, X. J.: Water vapor and the dynamics of climate changes, Rev. Geophys., 48, RG3001, https://doi.org/10.1029/2009RG000302, 2010.
Seinfeld, J. H. and Pandis, S. N.: Atmospheric Chemistry and Physics: From Air Pollution to Climate Change, 2nd ed., John Wiley and Sons, 1203 pp., 2006.
Sessions, W. R., Reid, J. S., Benedetti, A., Colarco, P. R., da Silva, A., Lu, S., Sekiyama, T., Tanaka, T. Y., Baldasano, J. M., Basart, S., Brooks, M. E., Eck, T. F., Iredell, M., Hansen, J. A., Jorba, O. C., Juang, H.-M. H., Lynch, P., Morcrette, J.-J., Moorthi, S., Mulcahy, J., Pradhan, Y., Razinger, M., Sampson, C. B., Wang, J., and Westphal, D. L.: Development towards a global operational aerosol consensus: basic climatological characteristics of the International Cooperative for Aerosol Prediction Multi-Model Ensemble (ICAP-MME), Atmos. Chem. Phys., 15, 335–362, https://doi.org/10.5194/acp-15-335-2015, 2015.
Sherwood, S. C., Roca, R., Weckwerth, T. M., and Andronova, N. G.: Tropospheric water vapor, convection, and climate, Rev. Geophys., 48, RG2001, https://doi.org/10.1029/2009RG000301, 2010.
Shi, Y. R., Levy, R. C., Eck, T. F., Fisher, B., Mattoo, S., Remer, L. A., Slutsker, I., and Zhang, J.: Characterizing the 2015 Indonesia fire event using modified MODIS aerosol retrievals, Atmos. Chem. Phys., 19, 259–274, https://doi.org/10.5194/acp-19-259-2019, 2019.
Smirnov, A., Royer, A., O'Neill, N. T., and Tarussov, A.: A study of the link between synoptic air mass type and atmospheric optical parameters, J. Geophys. Res., 99, 20967–20982, https://doi.org/10.1029/94JD01719, 1994.
Sobrino, J. A., Li, Z.-L., and Stoll, M. P.: Impact of the atmospheric transmittance and total water vapor content in the algorithms for estimating satellite sea surface temperatures, IEEE T. Geosci. Remote, 31, 946–952, https://doi.org/10.1109/36.263765, 1993.
Späth, F., Behrendt, A., Muppa, S. K., Metzendorf, S., Riede, A., and Wulfmeyer, V.: 3-D water vapor field in the atmospheric boundary layer observed with scanning differential absorption lidar, Atmos. Meas. Tech., 9, 1701–1720, https://doi.org/10.5194/amt-9-1701-2016, 2016.
Spyrou, C.: Direct radiative impacts of desert dust on atmospheric water content, Aerosol Sci. Technol., 52, 693–701, https://doi.org/10.1080/02786826.2018.1449940, 2018.
Stull, R. B. and Eloranta, E. W.: Boundary Layer Experiment 1983, B. Am. Meteorol. Soc., 65, 450–456, 1984.
Su, H., Jiang, J. H., Liu, X., Penner, J. E., Read, W. G., Massie, S., Schoeberl, M. R., Colarco, P., Livesey, N. J., and Santee, M. L.: Observed increase of TTL temperature and water vapor in polluted clouds over Asia, J. Climate, 24, 2728–2736, https://doi.org/10.1175/2010JCLI3749.1, 2011.
Ten Hoeve, J. E., Remer, L. A., and Jacobson, M. Z.: Microphysical and radiative effects of aerosols on warm clouds during the Amazon biomass burning season as observed by MODIS: impacts of water vapor and land cover, Atmos. Chem. Phys., 11, 3021–3036, https://doi.org/10.5194/acp-11-3021-2011, 2011.
Tesche, M., Gross, S., Ansmann, A., Muller, D., Althausen, D., Freudenthaler, V., and Esselborn, M.: Profiling of Saharan dust and biomass-burning smoke with multiwavelength polarization Raman lidar at Cape Verde, Tellus, 63, 649–676, https://doi.org/10.1111/j.1600-0889.2011.00548.x, 2011.
Turner D. D., Ferrare, R. A., Heilman Brasseur, L. A., Feltz, W. F., and Tooman, T. P.: Automated Retrievals of Water Vapor and Aerosol Profiles from an Operational Raman Lidar, J. Atmos. Ocean. Tech., 19, 37–50, https://doi.org/10.1175/1520-0426(2002), 2002.
Veselovskii, I., Goloub, P., Podvin, T., Bovchaliuk, V., Derimian, Y., Augustin, P., Fourmentin, M., Tanre, D., Korenskiy, M., Whiteman, D. N., Diallo, A., Ndiaye, T., Kolgotin, A., and Dubovik, O.: Retrieval of optical and physical properties of African dust from multiwavelength Raman lidar measurements during the SHADOW campaign in Senegal, Atmos. Chem. Phys., 16, 7013–7028, https://doi.org/10.5194/acp-16-7013-2016, 2016.
Wang, Y., Hua, D., Wang, L., Tang, J., Mao, J., and Kobayashi, T.: Observations and analysis of relationship between water vapor and aerosols using raman lidar, Jpn. J. Appl. Phys., 51, 102401, https://doi.org/10.1143/JJAP.51.102401, 2012.
Wang, J., Gei, C., Yang, Z., Hyer, E. J., Reid, J. S., Chew, B. N., and Mahmud M.: Mesoscale modeling of smoke transport over the Southeast Asian Maritime Continent: interplay of sea breeze, trade wind, typhoon, and topography, Atmos. Res., 122, 486–503, https://doi.org/10.1016/j.atmosres.2012.05.009, 2013.
Wang, H., Xu, J., Zhang, M., Yang, Y., Shen, X., Wang, Y., Chen, D., and Guo, J.: A Study of the meteorological causes of a prolonged and severe haze episode in January 2013 over central-eastern China, Atmos. Environ., 98, 146–157, https://doi.org/10.1016/j.atmosenv.2014.08.053, 2014.
Wang, L. T., Wei, Z., Yang, J., Zhang, Y., Zhang, F. F., Su, J., Meng, C. C., and Zhang, Q.: The 2013 severe haze over southern Hebei, China: model evaluation, source apportionment, and policy implications, Atmos. Chem. Phys., 14, 3151–3173, https://doi.org/10.5194/acp-14-3151-2014, 2014.
Wimmers, A. J. and Velden, C. S.: Seamless Advective Blending of Total Precipitable Water Retrievals from Polar-Orbiting Satellites, J. Appl. Meteor. Clim., 50, 1024–1036, https://doi.org/10.1175/2010JAMC2589.1, 2011.
Wong, S., Dessler, A. E., Mahowald, N. M., Yang, P., and Feng, Q.: Maintenance of lower tropospheric temperature inversion in the Saharan air layer by dust and dry anomaly, J. Climate, 22, 5149–5162, https://doi.org/10.1175/2009jcli2847.1, 2009.
Yu, S., Alapaty, K., Mathur, R., Pleim, J., Zhang, Y., Nolte, C., Eder, B., Foley, K., and Nagashima, T.: Attribution of the United States “warming hole”: Aerosol indirect effect and precipitable water vapor, Sci. Rep., 4, 6929, https://doi.org/10.1038/srep06929, 2014.
Yu, L., Zhang, M., Wang, L., Lu, Y., and Li, J.: Effects of aerosols and water vapour on spatial-temporal variations of the clear-sky surface solar radiation in China, Atmos. Res., 248, 105162, https://doi.org/10.1016/j.atmosres.2020.105162, 2021.
Yufeng, W., Qiang, F., Meina, Z., Fei, G., Huige, D., Yuehui, S., and Dengxin, A.: UV multifunctional Raman lidar system for the observation and analysis of atmospheric temperature, humidity, aerosols and their conveying characteristics over Xi'an, J. Quant. Spectrosc. Ra., 205, 114–126, https://doi.org/10.1016/j.jqsrt.2017.10.001, 2018.
Xian, P., Reid, J., Hyer, E., Sampson, C. Rubin, J., Ades, M., Asencio, N., Basart, S., Benedetti, A., Bhattacharjee, P. S., Brooks, M. E., Colarco, P. R., da Silva, A. M., Eck, T. F., Guth, J., Jorba, O., Kouznetsov, R., Kipling, Z., Sofiev, M., Perez Garcia-Pando, C., Pradhan, Y., Tanaka, T., Wang, J., Westphal, D. L., Yumimoto, K., and Zhang, J.: Current state of the global operational aerosol multi-model ensemble: An update from the International Cooperative for Aerosol Prediction (ICAP), Q. J. Roy. Meteor. Soc., 145, 176-209, https://doi.org/10.1002/qj.3497, 2019.
Xian, P., Klotzbach, P. J., Dunion, J. P., Janiga, M. A., Reid, J. S., Colarco, P. R., and Kipling, Z.: Revisiting the relationship between Atlantic dust and tropical cyclone activity using aerosol optical depth reanalyses: 2003–2018, Atmos. Chem. Phys., 20, 15357–15378, https://doi.org/10.5194/acp-20-15357-2020, 2020.
Xian, P.: USGODAE Data Catalog – Selected Data Sets, NRL Monterey [data set], https://usgodae.org/cgi-bin/datalist.pl?dset=nrl_naaps_reanalysis&summary=Go, last access: 27 February 2022.
Zeng, Z.-C., Zhang, Q., Natraj, V., Margolis, J. S., Shia, R.-L., Newman, S., Fu, D., Pongetti, T. J., Wong, K. W., Sander, S. P., Wennberg, P. O., and Yung, Y. L.: Aerosol scattering effects on water vapor retrievals over the Los Angeles Basin, Atmos. Chem. Phys., 17, 2495–2508, https://doi.org/10.5194/acp-17-2495-2017, 2017.
Zhang, J., Reid, J. S., Westphal, D. L., Baker, N. L., and Hyer, E. J.: A system for operational aerosol optical depth data assimilation over global oceans, J. Geophys. Res.-Atmos., 113, D10208, https://doi.org/10.1029/2007JD009065, 2008.
Zhang, J., Wang, S., Guo, Y., Zhang, R., Qin, X., Huang, K., Wang, D., Fu, Q., Wang, J., and Zhou, B.: Aerosol vertical profile retrieved from ground-based MAX-DOAS observation and characteristic distribution during the wintertime in Shanghai, China, Atmos. Environ., 192, 193–205, https://doi.org/10.1016/j.atmosenv.2018.08.051, 2018.
Zhu, J., Che, H., Xia, X., Yu, X., and Wang, J.: Analysis of water vapor effects on aerosol properties and direct radiative forcing in China, Sci. Total Environ., 650, 257–266, https://doi.org/10.1016/j.scitotenv.2018.09.022, 2019.