the Creative Commons Attribution 4.0 License.
the Creative Commons Attribution 4.0 License.
 | 03 Apr 2023
Potential of TROPOMI for understanding spatio-temporal variations in surface NO2 and their dependencies upon land use over the Iberian Peninsula
Marc Guevara
Steven Compernolle
Dene Bowdalo
Pierre-Antoine Bretonnière
Santiago Enciso
Oriol Jorba
Franco Lopez
Albert Soret
Carlos Pérez García-Pando
In orbit since late 2017, the Tropospheric Monitoring Instrument (TROPOMI) is offering new outstanding opportunities for better understanding the emission and fate of nitrogen dioxide (NO2) pollution in the troposphere. In this study, we provide a comprehensive analysis of the spatio-temporal variability of TROPOMI NO2 tropospheric columns (TrC-NO2) over the Iberian Peninsula during 2018–2021, considering the recently developed Product Algorithm Laboratory (PAL) product. We complement our analysis with estimates of NOx anthropogenic and natural soil emissions. Closely related to cloud cover, the data availability of TROPOMI observations ranges from 30 %–45 % during April and November to 70 %–80 % during summertime, with strong variations between northern and southern Spain. Strongest TrC-NO2 hotspots are located over Madrid and Barcelona, while TrC-NO2 enhancements are also observed along international maritime routes close the strait of Gibraltar, and to a lesser extent along specific major highways. TROPOMI TrC-NO2 appear reasonably well correlated with collocated surface NO2 mixing ratios, with correlations around 0.7–0.8 depending on the averaging time.
We investigate the changes of weekly and monthly variability of TROPOMI TrC-NO2 depending on the urban cover fraction. Weekly profiles show a reduction of TrC-NO2 during the weekend ranging from −10 % to −40 % from least to most urbanized areas, in reasonable agreement with surface NO2. In the largest agglomerations like Madrid or Barcelona, this weekend effect peaks not in the city center but in specific suburban areas/cities, suggesting a larger relative contribution of commuting to total NOx anthropogenic emissions. The TROPOMI TrC-NO2 monthly variability also strongly varies with the level of urbanization, with monthly differences relative to annual mean ranging from −40 % in summer to +60 % in winter in the most urbanized areas, and from −10 % to +20 % in the least urbanized areas. When focusing on agricultural areas, TROPOMI observations depict an enhancement in June–July that could come from natural soil NO emissions. Some specific analysis of surface NO2 observations in Madrid show that the relatively sharp NO2 minimum used to occur in August (drop of road transport during holidays) has now evolved into a much broader minimum partly de-coupled from the observed local road traffic counting; this change started in 2018, thus before the COVID-19 outbreak. Over 2019–2021, a reasonable consistency of the inter-annual variability of NO2 is also found between both datasets.
Our study illustrates the strong potential of TROPOMI TrC-NO2 observations for complementing the existing surface NO2 monitoring stations, especially in the poorly covered rural and maritime areas where NOx can play a key role, notably for the production of tropospheric O3.
- Article
(22667 KB) - Full-text XML
- BibTeX
- EndNote


Nitrogen dioxide (NO2) is a harmful trace gas emitted from both anthropogenic (incomplete combustion processes) and natural (soils and lightning) sources that plays a key role in tropospheric chemistry, especially in the formation of ozone (O3) and secondary aerosols. Given its relatively short chemical lifetime, NO2 is often used to investigate the spatio-temporal variability of NOx emissions from prominent sectors such as road transport or industry. The monitoring of surface NO2 pollution essentially relies on official air quality (AQ) surface stations (passive and low-cost sensors being two other sources of information, although of lower temporal resolution and poorer quality, respectively). These reference observations benefit from good precision, high temporal resolution (typically hourly) and long-term time coverage (exceeding 10 years for many stations across Europe). Nonetheless, they suffer from persistent limitations, including (1) the sparsity of existing AQ networks (e.g., one station per 1056 km2 on average over the Iberian Peninsula in 2018–2021); (2) the low-to-moderate accuracy induced by the intrinsic systematic uncertainties of the commonly used chemiluminescence-based measurement technique prone to positive artifacts related to NOz species, especially in rural areas (e.g., Dunlea et al., 2007; Villena et al., 2012); and to a lesser extent (3) the potential inconsistencies among the stations as they are operated by numerous different teams. In this context, satellite observations offer a valuable complement for monitoring the spatio-temporal variability of NO2 by providing consistent NO2 measurements relying on one single instrument, with full geographical coverage under cloud-free conditions.
Built upon the heritage of Aura OMI (Levelt et al., 2018), Envisat SCIAMACHY (Bovensmann et al., 1999) and MetOp-A/B/C GOME-2 (Valks et al., 2011) missions, the Tropospheric Monitoring Instrument (TROPOMI) on board the Copernicus Sentinel-5 Precursor (S5P) satellite is a last-generation nadir viewing shortwave spectrometer able to measure with high sensitivity and spatial resolution in the ultraviolet-visible, near infrared and shortwave infrared (Veefkind et al., 2012). Among other key chemical species, TROPOMI is providing groundbreaking information on NO2 tropospheric column (hereafter referred to as TrC-NO2) and thus offers unprecedented opportunities for monitoring and investigating NO2 pollution and sources. In the ultraviolet, TROPOMI provides observations at a better signal-to-noise ratio than its predecessor OMI (van Geffen et al., 2022b; De Smedt et al., 2021), with an improvement of spatial resolution of about a factor of 16 (in area). Among others, it has been used to map industrial point sources (e.g., Griffin et al., 2019; Beirle et al., 2021), detect individual ship plumes (Georgoulias et al., 2020), identify soil NO emissions (Huber et al., 2020), investigate the impact of the COVID-19-related lockdown (e.g., Bauwens et al., 2020; Barré et al., 2021) and analyze lightning NOx emissions (Pérez-Invernón et al., 2022). In addition, TROPOMI TrC-NO2 observations have been used in several studies to infer surface NO2 concentrations using geo-statistical (e.g., Zhang et al., 2022) or geophysical (e.g., Cooper et al., 2020) models.
The present study aims at characterizing the spatio-temporal variability of TrC-NO2 as seen by TROPOMI over the period 2018–2021. We focus on the Iberian Peninsula, including both Spain and Portugal, where more than 80 % of the surface monitoring stations keep reporting NO2 (and O3, on which NOx play a key role) levels well above the guidelines (10 and 25 µg m−3 on annual and daily average, respectively) recommended by the World Health Organization (Bowdalo et al., 2022). Our study provides a detailed analysis of the spatial distribution of NO2, along with its monthly and weekly variability (so-called weekend effect) at both regional and city scales. Such a comprehensive observation-based exploration of the spatio-temporal variability of NO2 pollution represents a first crucial step for better identifying and characterizing the NOx emission sources of main importance over the peninsula. We show how temporal variability of TROPOMI TrC-NO2 depends upon the urban land cover fraction, as well as the crop cover fraction (specifically for the monthly variability). Our analysis of TROPOMI data is complemented with the in situ NO2 observations available at the surface and estimates of primary NOx anthropogenic and natural soil emissions. Considering the persistent uncertainties affecting emission inventories (e.g., Pope et al., 2022; Zara et al., 2021; Goldberg et al., 2021b); a detailed analysis of the weekly variability provides key information about the joint contribution of specific emission sectors (in this case, commuting-related road transport and part of the industries) relative to total emissions. Overall, our study also aims at shedding light on specific patterns of interest, then susceptible to guide diagnostic-oriented chemistry-transport model (CTM) evaluations. Given the specificities of TROPOMI observations, first and foremost their columnar nature and their incomplete sampling, analyzing space-based TrC-NO2 jointly with surface-based NO2 is also key for assessing the potential and limitations of such data to reliably describe the NO2 variability prevailing at the surface where most physico-chemical processes and adverse impacts of NO2 pollution are of strongest importance.
The dataset and methods are introduced in Sect. 2. Results are presented in Sect. 3. An overall discussion and some conclusions are given in Sect. 4.
2.1 TROPOMI TrC-NO2 data
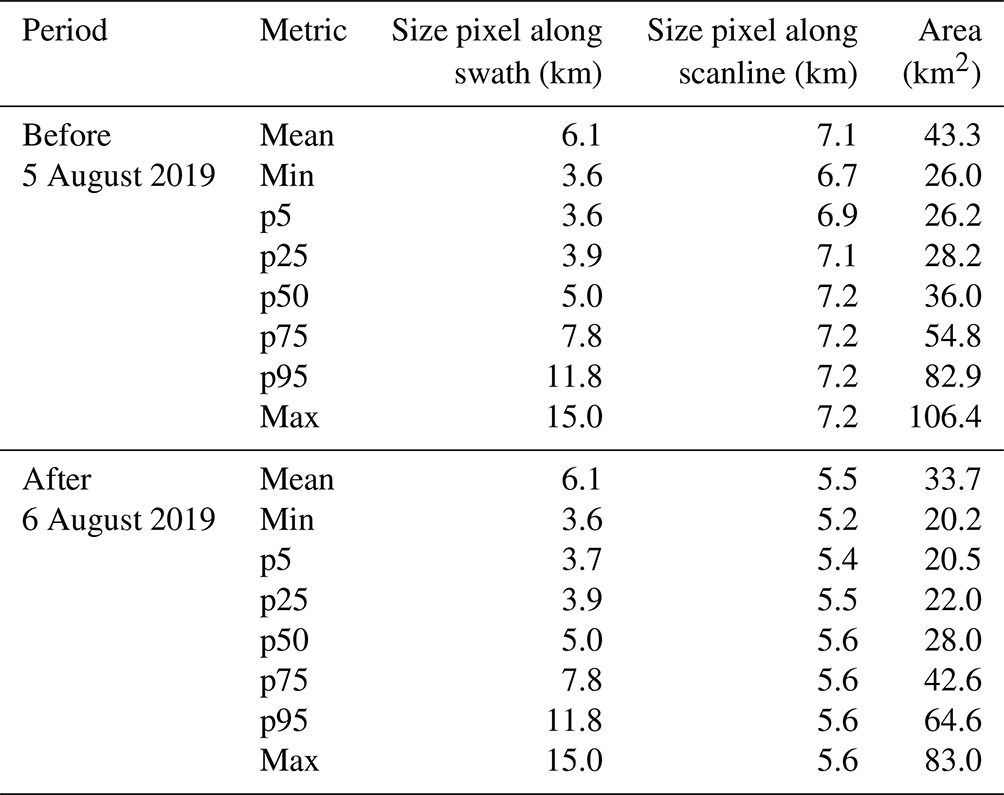
Launched in late 2017, the TROPOMI instrument on board the S5P satellite provides daily tropospheric column measurements of several important trace gases, including NO2, at an overpass time of 13:30 local solar time, with global coverage every day (under cloud-free conditions) (Veefkind et al., 2012). TROPOMI TrC-NO2 were initially measured at a spatial resolution of 7.2×3.5 km2 at nadir, refined to 5.6×3.5 km2 from 6 August 2019 onwards. More information on the typical dimensions of TROPOMI pixels along an orbit is given in Table A1 in the Appendix A. On average, this change of resolution reduced the mean TROPOMI pixel area from 43 to 34 km2 (−22 %).
So-called reprocessed (RPRO) and offline (OFFL) TrC-NO2 products covering the periods 30 April–17 October 2018 and 17 October 2018–present, respectively (Copernicus Sentinel-5P, 2018, 2021), are publicly delivered as L2 products along S5P orbits on the S5P hub (https://scihub.copernicus.eu/, last access: 10 March 2022); more details about these products can be found in the algorithm theoretical basis document (van Geffen et al., 2022a), the product user manual (Eskes et al., 2022) and the product readme file (Eskes and Eichmann, 2022). In late 2021, the so-called Product Algorithm Laboratory (PAL) TrC-NO2 product covering the period 1 May 2018–14 November 2021 has been made publicly available (https://data-portal.s5p-pal.com/; last access: 21 June 2022) (Eskes et al., 2021). Based on the last processor version available at that time (namely the version 2.03.01), PAL offers a consistent TrC-NO2 product free from previously identified cloud issues (Compernolle et al., 2021; van Geffen et al., 2022b) that can be consistently combined with the most recent (beyond 14 November 2021) OFFL TrC-NO2 data.
In the present study, we used this PAL TrC-NO2 products combined with OFFL products after 14 November 2021 (until 31 December 2021, the end of our period of study). Our TROPOMI TrC-NO2 dataset can thus be considered as fully consistent. For information purposes, a comparison of the PAL and OFFL + RPRO TrC-NO2 dataset during their overlapping period is given in Sect. B in the Appendix. As expected from the PAL documentation, TrC-NO2 show a good consistency with Pearson correlation coefficients (PCCs) above 0.98 and slightly higher TrC-NO2 values in PAL, especially in most polluted areas and/or during wintertime (as shown by normalized mean biases between +1 % and +5 % depending on the season and linear regression slopes around 1.02–1.09).
To facilitate analysis, we gridded the L2 products on a fixed regular grid of 0.025°×0.025° longitude–latitude resolution covering the Iberian Peninsula (longitudes range from 10° W to 5° E, latitudes range from 35 to 45° N). Following the guidelines provided in the product user manual, all TROPOMI individual pixels with quality indicator values (qa_value) below or equal to 0.75 have been discarded, which removed pixels with too-strong cloud coverage, with the presence of snow or ice or that are affected by other types of retrieval errors. All orbit files were regridded on the target grid with the xesmf python package (Zhuang et al., 2022) using a conservative method and merged through an area-weighted averaging in order to properly account for the overlap of neighboring orbits at the edges of the swath. All the analysis and comparisons performed in this study are based on these regridded TROPOMI data.
Over the last years, the TROPOMI TrC-NO2 OFFL/RPRO products have been extensively evaluated against ground-based MAX-DOAS TrC-NO2 observations, highlighting a substantial negative bias ranging between −23 % and −37 % in clean or slightly polluted areas and increasing to −51 % over highly polluted areas (Verhoelst et al., 2021); regular validation updates can be found in Lambert et al. (2022). Among other reasons (e.g., differences in representativeness, treatment of clouds and aerosols), a substantial part of this negative bias is attributed to the overly coarse (1°×1°) a priori profiles used in the S5P retrieval algorithm (Verhoelst et al., 2021) but can at least partly be reduced using a priori of higher resolution, as shown for instance by Tack et al. (2021) and Douros et al. (2022). In the present study, we kept the original TROPOMI products, although we acknowledge that near-future studies should probably explore such a use of alternative a priori profiles.
2.2 Surface air quality observations
Hourly observations of surface NO2 and O3 mixing ratios are taken from the European Environmental Agency (EEA) AIRBASE and AQ eReporting (EEA, 2020); O3 observations in this study are only briefly used in Sect. 3.1 for discussing the availability of TROPOMI TrC-NO2 observations during O3 episodes. A quality assurance procedure is applied using the GHOST (Globally Harmonised Observational Surface Treatment) metadata, GHOST being a project developed at the Earth Sciences Department of the Barcelona Supercomputing Center that aims at harmonizing global surface atmospheric observations and metadata, for the purpose of facilitating quality-assured comparisons between observations and models within the atmospheric chemistry community. More details on the quality assurance filtering are given in Appendix D. Based on these hourly observations, a minimum data availability criteria of 75 % (i.e., 18 over 24 h) has been chosen for computing daily scale statistics. At an hourly (daily) scale, the quality assurance filtering removed 4 % (5 %) of the background stations and 16 % (20 %) of the NO2 observations. The choice of the most appropriate timescale to consider for the surface-based NO2 in their comparison against space-based TrC-NO2 is not straightforward given the very different (much larger) spatio-temporal representativeness of TROPOMI columns compared to point stations observations. Therefore, in the present study, we consider several timescales for surface NO2 mixing ratios, including the daily 24 h mean NO2 (hereafter referred to as d timescale), the daily 1 h maximum NO2 (d1max) and the daily TROPOMI-overpass-time NO2 (dop) which corresponds to the hourly NO2 mixing ratio observed around 13:30 local solar time. Although they might not provide the best consistency with TROPOMI observations, the two first timescales are chosen for their strong interest in terms of air pollution monitoring and regulatory aspects.
To facilitate the analysis and comparisons, the surface NO2 observations are gridded on the same target grid as TROPOMI, with all stations in a given cell averaged together. Given the spatial resolution of TROPOMI TrC-NO2, only background stations are taken into account here, which includes rural, sub-urban and urban background stations but excludes industrial and traffic stations. This is expected to limit the problem of representativeness when comparing TROPOMI and surface observations.
2.3 Anthropogenic and natural soil NOx emissions
Besides surface NO2 and TROPOMI TrC-NO2 observations, we also discuss in this study the variability of NOx emissions. Anthropogenic NOx emissions are taken from the annual European CAMS-REG-AP_v5.1 emission inventory (Kuenen et al., 2022) and preprocessed with the HERMESv3_GR emission model (Guevara et al., 2019), using an updated version (v3.2) of the CAMS-REG-TEMPOv2.1 temporal profiles described in Guevara et al. (2021). Compared to the CAMS-REG-TEMPOv2.1 that was relying on traffic counts data, the update proposed in CAMS-REG-TEMPOv3.2 notably includes an improvement of the road transport emission temporal profiles through the use of TomTom traffic congestion statistics from about 50 countries (https://www.tomtom.com/traffic-index/, last access: 1 September 2022). For a more detailed analysis over industrial areas, the HERMESv3 Spanish industrial point source database is considered. The inventory reports the exact geographic location and hourly emissions per individual facility based on the national reporting of air pollutant emissions from large point sources, the PRTR-Spain database and activity-based temporal profiles used to downscale original annual emissions to the hourly level (Guevara et al., 2020).
Besides anthropogenic NOx emissions, NO is also emitted by soils through complex microbial (e.g., nitrification and denitrification) and chemical processes, notably controlled by fertilizer nitrogen inputs to the ecosystem, temperature, soil water content and soil pH (Butterbach-Bahl et al., 2013). Here, we computed the natural soil NO emissions in 2019 with the Model of Emissions of Gases and Aerosols from Nature (MEGAN) version 2.1 (Guenther et al., 2012), fed by meteorological input obtained from the WRF-ARW version 3.6 model (Skamarock et al., 2008) configured as described in Pay et al. (2019).
2.4 Ancillary data
In this study, NO2 observations are analyzed in combination with land cover data in order to further investigate how the weekly and monthly variability of NO2 varies spatially depending on the local environment. These land cover data are taken from the high-resolution (native resolution of 100 m) global-scale Copernicus Land Monitoring Service land cover dataset (https://land.copernicus.eu/global/products/lc, last access: 20 January 2020) and include information about urban area, bare, crops, grass, moss, shrub, snow, tree and water (Buchhorn et al., 2020). They are currently obtained from the PROBA-V space sensor that should be replaced in the near future by data from the Sentinel-2 satellite.
To help the interpretation of specific situations, we also sporadically use some meteorological information (e.g., 2 m temperature, 10 m surface wind speed) taken from the ERA5 reanalysis (Hersbach et al., 2020) provided by the European Centre for Medium-Range Weather Forecasts (ECMWF). ERA5 data have a native spatial resolution of about 31 km, although data were downloaded on a 0.25°×0.25° regular longitude–latitude grid from the Climate Data Store (Copernicus Climate Change Service (C3S), 2023) (https://www.ecmwf.int/en/forecasts/datasets/reanalysis-datasets/era5, last access: 18 July 2022).
To support our discussion, we also use some statistical information about tourism in Spain, including the monthly inter-regional movements of Spanish residents publicly available in the ETR database and the monthly arrival of international tourists publicly available in the FRONTUR database (both databases being freely available at https://www.dataestur.es/apidata/, last access: 8 August 2022).
Finally, the maps shown in this study make use of different types of geographical information, including the nomenclature of territorial units for statistics (NUTS) administrative boarders shapefiles freely provided by Eurostat (https://ec.europa.eu/eurostat/web/gisco/geodata/reference-data/administrative-units-statistical-units/nuts, last access: 11 January 2022), the Spanish road network shapefiles obtained from the HERMESv3_BU model database (Guevara et al., 2020) (https://earth.bsc.es/gitlab/es/hermesv3_bu, last access: 1 August 2022), as well as the GHSL-OECD functional urban areas produced by the European Joint Research Center (Schiavina et al., 2019) (https://ghsl.jrc.ec.europa.eu/ghs_fua.php, last access: 1 June 2022). Functional urban areas identify the geographical extent of a given major city and its surrounding administrative units and commuting area, which typically largely exceeds the limits of the metropolitan area itself.
We first provide some insights on the impact of cloud cover on the TROPOMI data availability (Sect. 3.1) and analyze the distribution of TROPOMI TrC-NO2 data over the Iberian Peninsula (Sect. 3.2). We then investigate their correlation with surface NO2 mixing ratios (Sect. 3.3). We finally characterize the TrC-NO2 variability at weekly (Sect. 3.4), monthly (Sect. 3.5) and inter-annual (Sect. 3.6) scales. A map of the administrative regions and main cities over the Iberian Peninsula is provided in Fig. G1 in the Appendix.
3.1 Impact of cloud cover on data availability
Compared to surface monitoring stations, space sensors like TROPOMI benefit from an incomparable geographical coverage but are unfortunately not able to deliver reliable data in the presence of clouds or snow and ice at the surface. In this section, we analyze to which extent this limitation impacts the availability of TROPOMI TrC-NO2 data throughout the year over the Iberian Peninsula. The monthly scale availability of TROPOMI TrC-NO2 data over the Iberian Peninsula is reported in Table 1. Overall, TROPOMI TrC-NO2 observations are available during around 55 %–60 % of the days over the Iberian Peninsula, with a relatively similar availability in Spain and Portugal. Data availability depends upon cloud cover and strongly varies along the year, with the lowest values in April and November (∼ 30 %–45 %), low-to-moderate values in wintertime (∼ 45 %–60 %) and higher values in summertime (∼ 70 %–80 %). The mean annual map shown in Fig. 1 highlights strong regional contrasts, with availability above 70 % over both the southern part of the peninsula and the arid Ebro Valley within the Aragon region in the northeast and around 35 % over the Cantabric coast and the Pyrenees (the availability by region is given in Table G1 in the Appendix). Over our domain of study, the availability of TROPOMI TrC-NO2 data is highest over the sea/ocean along the Spanish southern coast.
Despite some substantial data gaps due to cloud cover, TROPOMI TrC-NO2 data benefit from a high availability during O3 episodes in the Iberian Peninsula, which typically occur under anticyclonic conditions with low cloud cover. Indeed, the TROPOMI TrC-NO2 availability at days and locations where the so-called O3 target threshold is exceeded (daily 8 h maximum O3 above 120 µg m−3; 14 649 events) is 85 % and reaches 100 % for the O3 information threshold exceedances (daily 1 h maximum O3 above 180 µg m−3; 22 events). In contrast, the availability of TROPOMI TrC-NO2 data is reduced to 66 % when and where NO2 target thresholds (daily 1 h maximum NO2 above 40 µg m−3; 45 750 events) are exceeded at the surface, essentially because high NO2 episodes occur preferably during the cold season when cloud coverage is typically higher.
Table 1Mean data availability of TROPOMI TrC-NO2 over Spain and Portugal, on average over 2018–2021.
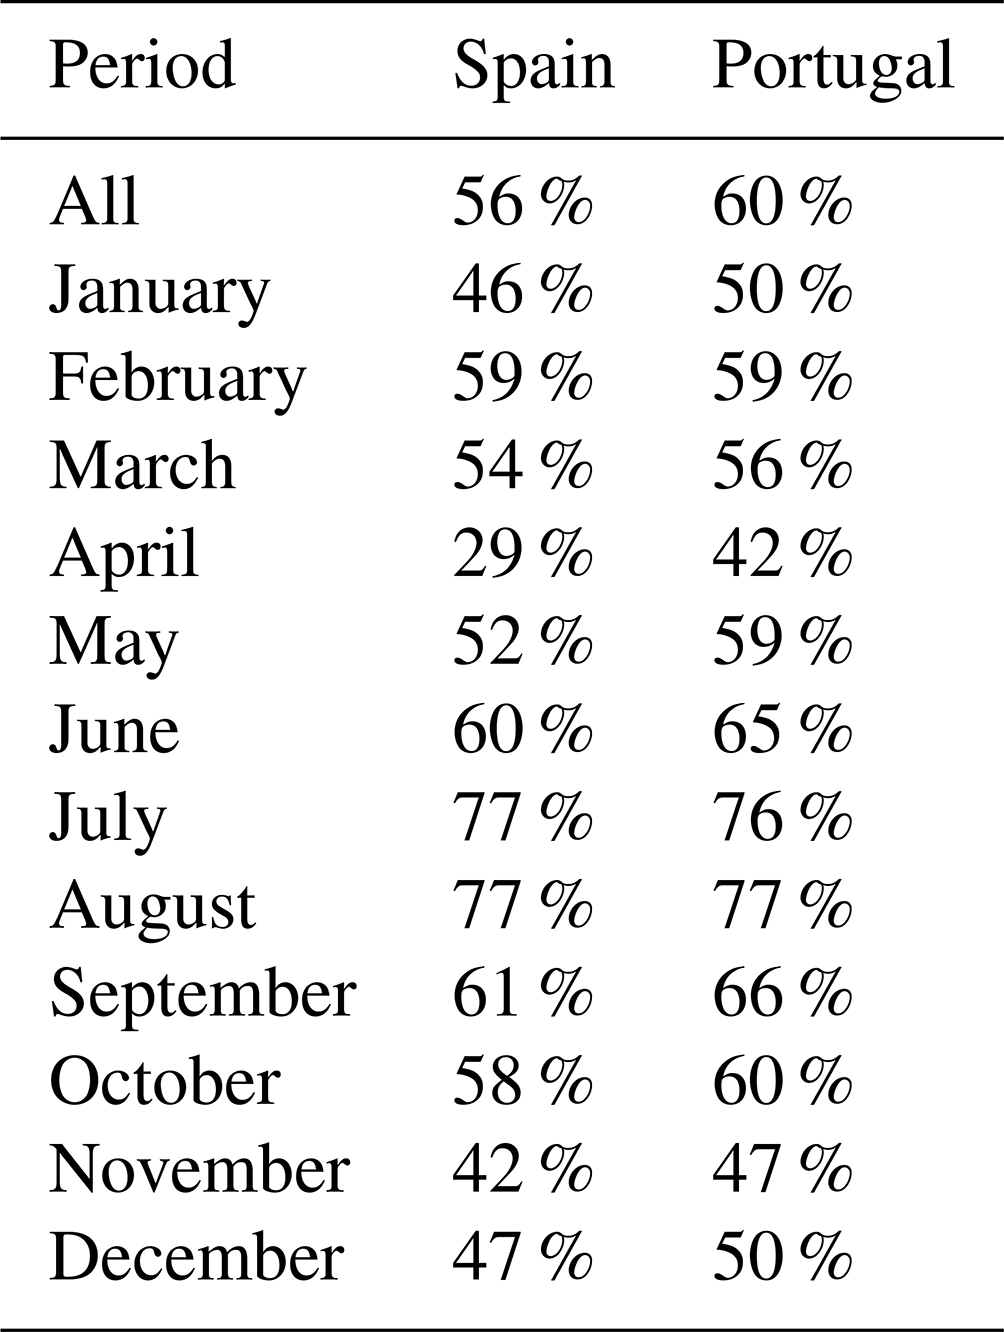
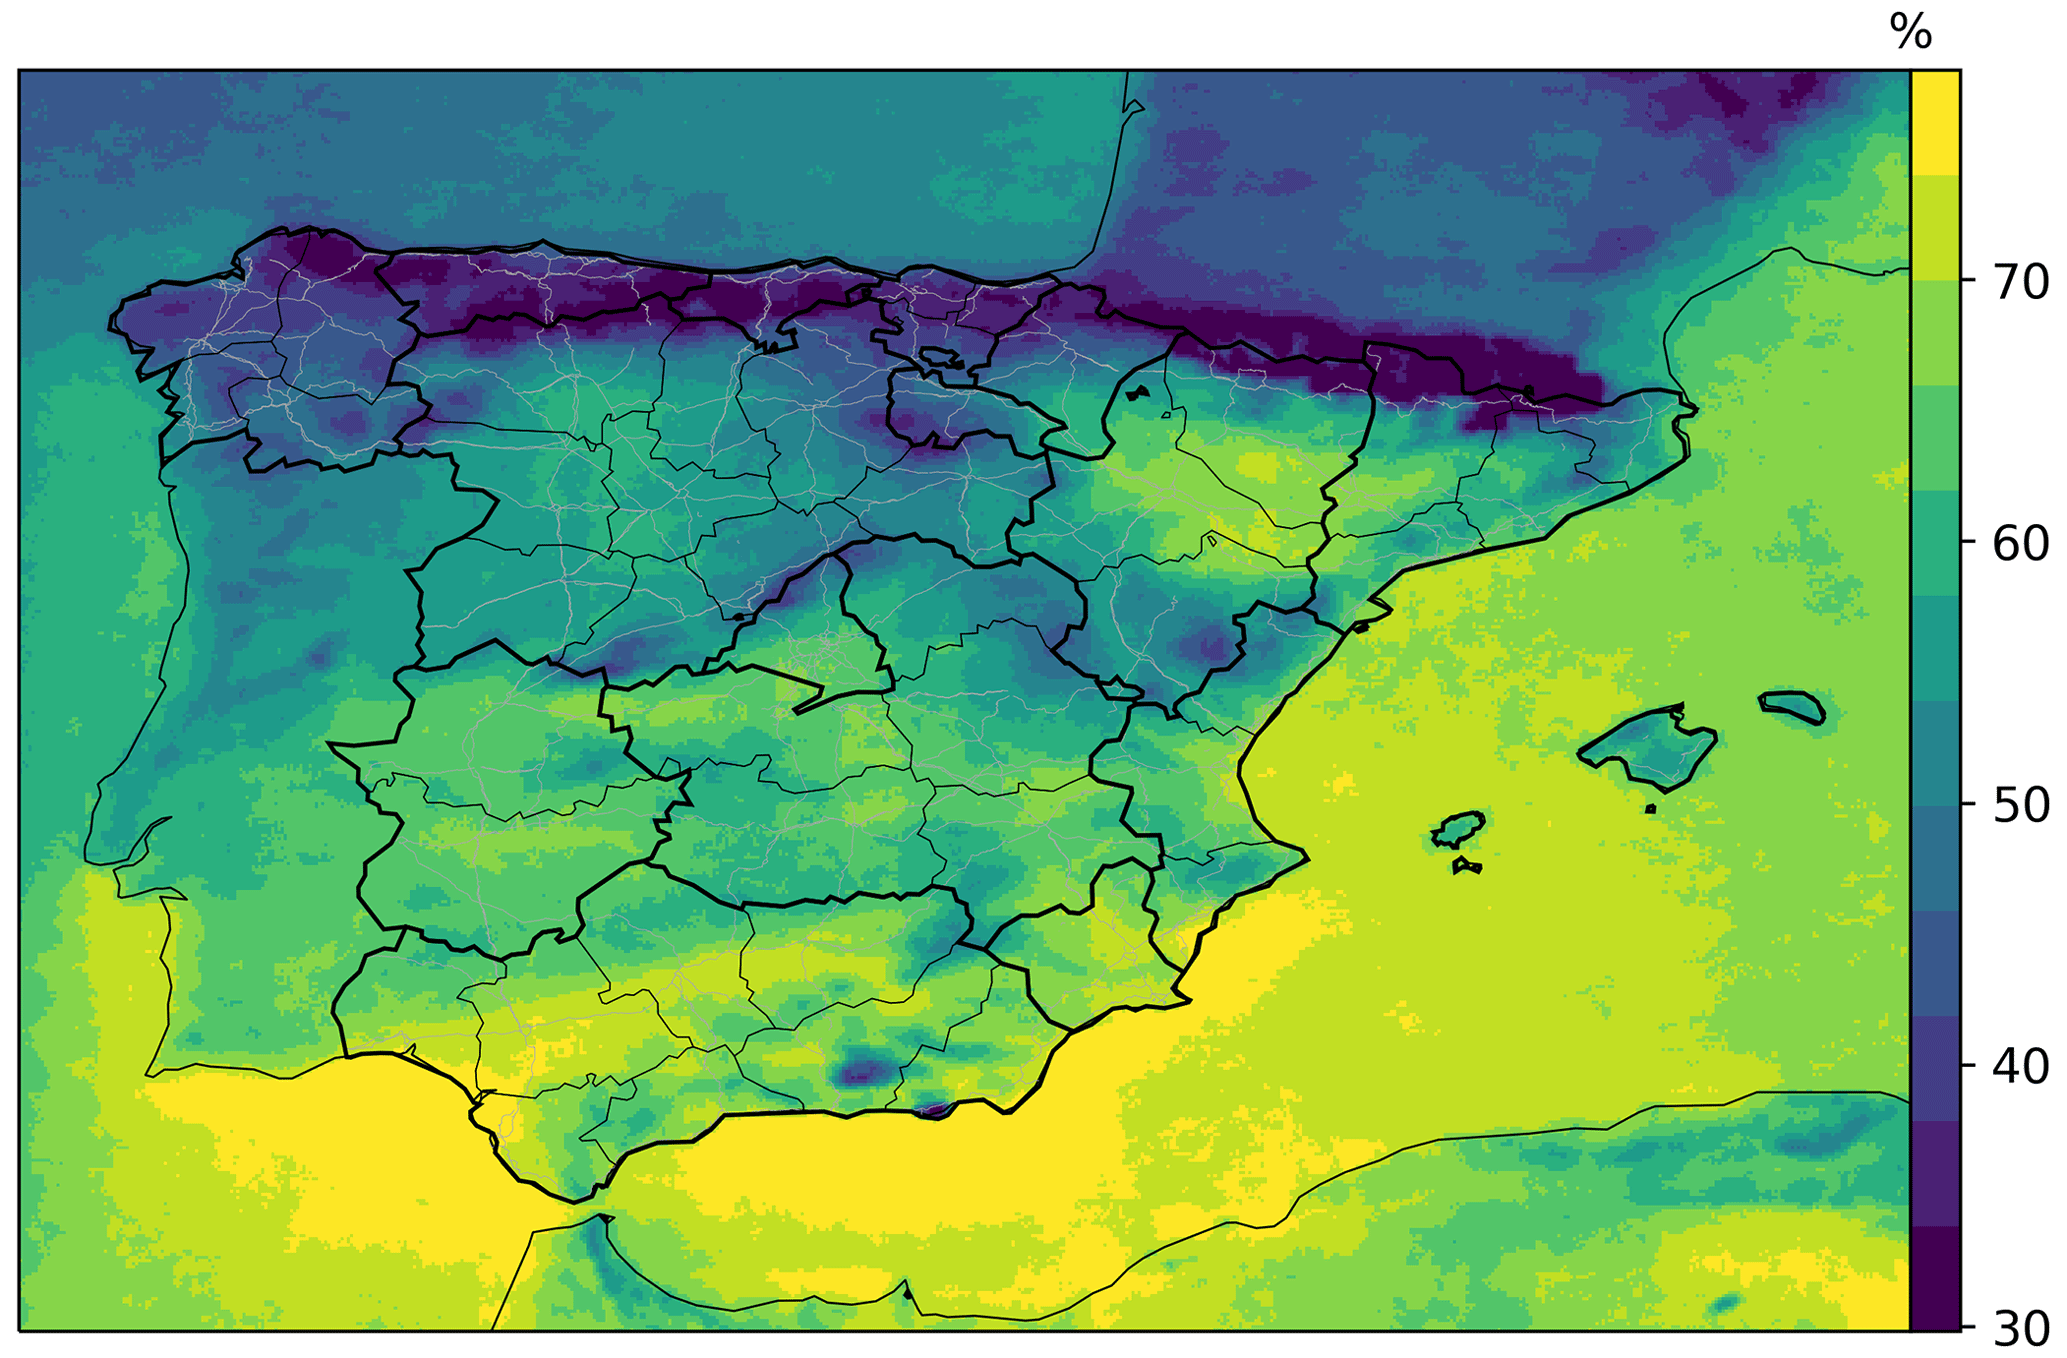
Figure 1Mean data availability of TROPOMI TrC-NO2 (on average from May 2018 to December 2021). Black and grey lines correspond to administrative borders and Spanish major roads, respectively (sources: see Sect. 2.4).
3.2 Spatial distribution of TROPOMI TrC-NO2
The mean TrC-NO2 spatial distribution over the Iberian Peninsula is shown in Fig. 2. Strong hotspots appear in the most important cities, first and foremost Madrid and Barcelona, with secondary hotspots over smaller cities (e.g., Lisbon, Porto, Valencia, Seville, Granada, Bilbao, Gijón). A zoom of the mean TrC-NO2 over the functional urban area of the most important Iberian Peninsula cities is given in Fig. 3. Note that these functional urban areas are defined by the European Union as “sets of contiguous local (administrative) units composed of a city and its surrounding, less densely populated local units that are part of the city's labor market (commuting zone)” and thus typically extend much beyond the administrative limits of the agglomeration. On average over the entire period (May 2018 to December 2021), maximum TrC-NO2 values reach about 8.5 Pmolec cm−2 in Madrid; 7 Pmolec cm−2 in Barcelona; 4–4.5 Pmolec cm−2 in Lisbon, Valencia, Porto, Granada and Seville; and 2 Pmolec cm−2 in Zaragoza and Palma de Mallorca. The spatial resolution of TROPOMI is fine enough to reveal the presence of large natural areas within the largest metropolitan areas, including the Casa de Campo park in western Madrid and the Serra de Collserola and Serralada natural areas in Barcelona.
Although not as clearly as in Algeria, a few highways can be distinguished over the Iberian Peninsula, including those linking Zaragoza/Logroño/Vitoria-Gasteiz (AP-68), Valladolid/Vitoria-Gasteiz (A62), and Valencia/Alicante/Murcia (A35-A31-A7-A7S). Regionally, the lowest TrC-NO2 values are found in intermediate- (southern Aragon, eastern Castilla-La-Mancha and eastern Andalucia) and high-altitude regions (Pyrenees, Picos de Europa, Sierra de Gredos at west of Madrid) with low population densities. The major shipping route passing through Gibraltar can be clearly identified, especially in the Mediterranean.
The distribution of TrC-NO2 values at daily, monthly and annual timescales is described in Table 2. The historical maximum TrC-NO2 observed by TROPOMI over the Iberian Peninsula reached the extreme value of 63 Pmolec cm−2 and occurred in early January 2021 in Madrid a few days after Filomena – the largest snowstorm since 1971 – hit central Spain (Tapiador et al., 2021), but could be at least partly impacted by some artifacts related to residual presence of snow and/or cloud shadowing effects (see Sect. E in the Appendix for a more detailed discussion of this episode). Apart from this extraordinary situation, more than 99.9 % of the TrC-NO2 values over the Iberian Peninsula typically remain below 11 Pmolec cm−2 at a daily scale (and below 8 and 7 Pmolec cm−2 at a monthly and annual scale, respectively). Note that due to noise in the TROPOMI measurements, a few TrC-NO2 values are negative (1.3 % of the daily TrC-NO2 and 0.3 % of the monthly TrC-NO2).
We saw in Sect. 3.1 that missing days in the TROPOMI dataset are not randomly distributed, which may thus bias the climatological averages. In order to provide some insights on this potential issue, we compared the climatological daily mean surface NO2 considering all available days to the climatological daily mean surface NO2 considering only the days with available TROPOMI observations. The comparison is thus here based on all the cells containing surface monitoring stations (N=283). Both climatologies appear very consistent (PCC =0.99, nRMSE =8 %), but a small positive bias (+4 %) is found to be induced by the TROPOMI missing days. Although we typically expect a negative bias of space-based TrC-NO2 due to the typically larger cloud cover during wintertime when NO2 levels are highest (as found in, e.g., Compernolle et al., 2020 for OMI), our results with TROPOMI show a small overestimation, which seems to be due to the specificity of the TROPOMI data availability over the Iberian Peninsula where the minimum availability is reached in April and November rather than during the coldest winter months.
Table 2Distribution of TrC-NO2 values (in Pmolec cm−2) over the Iberian Peninsula (Spain and Portugal) at daily, monthly and annual scales.
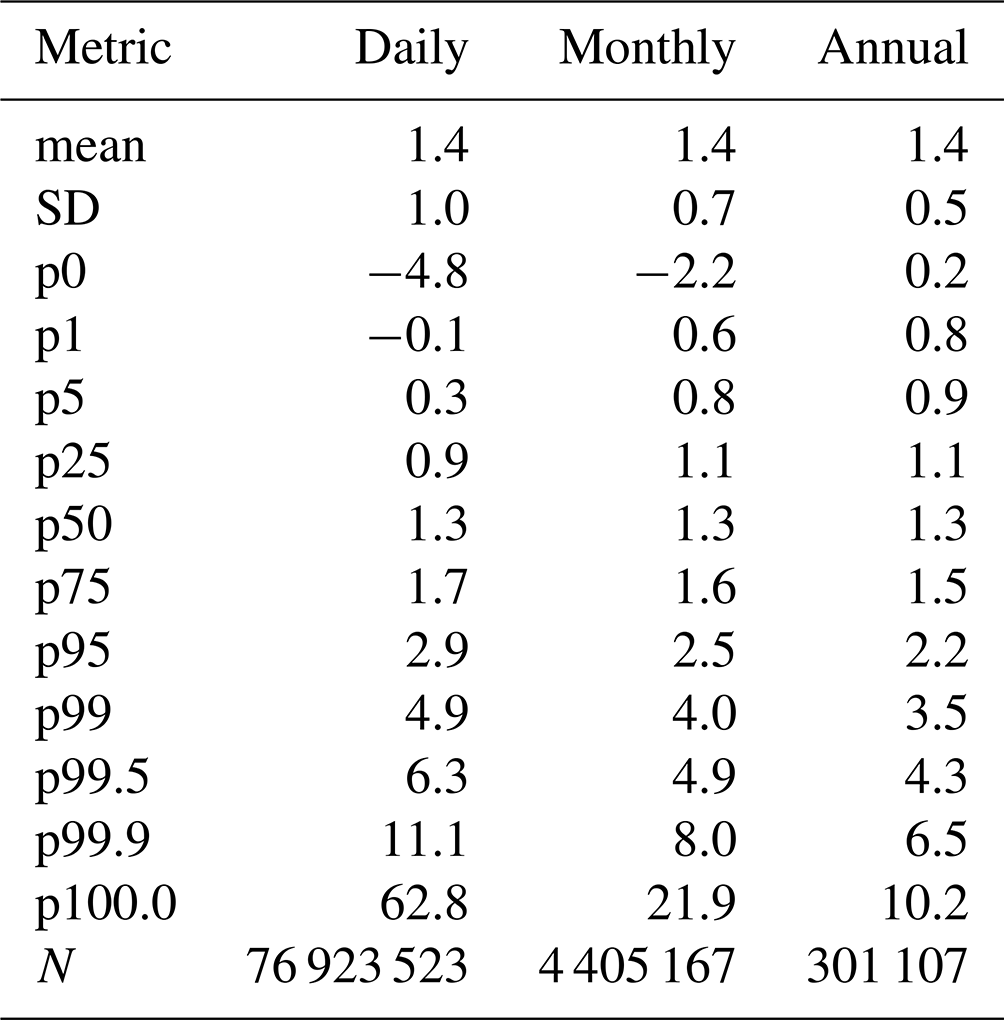
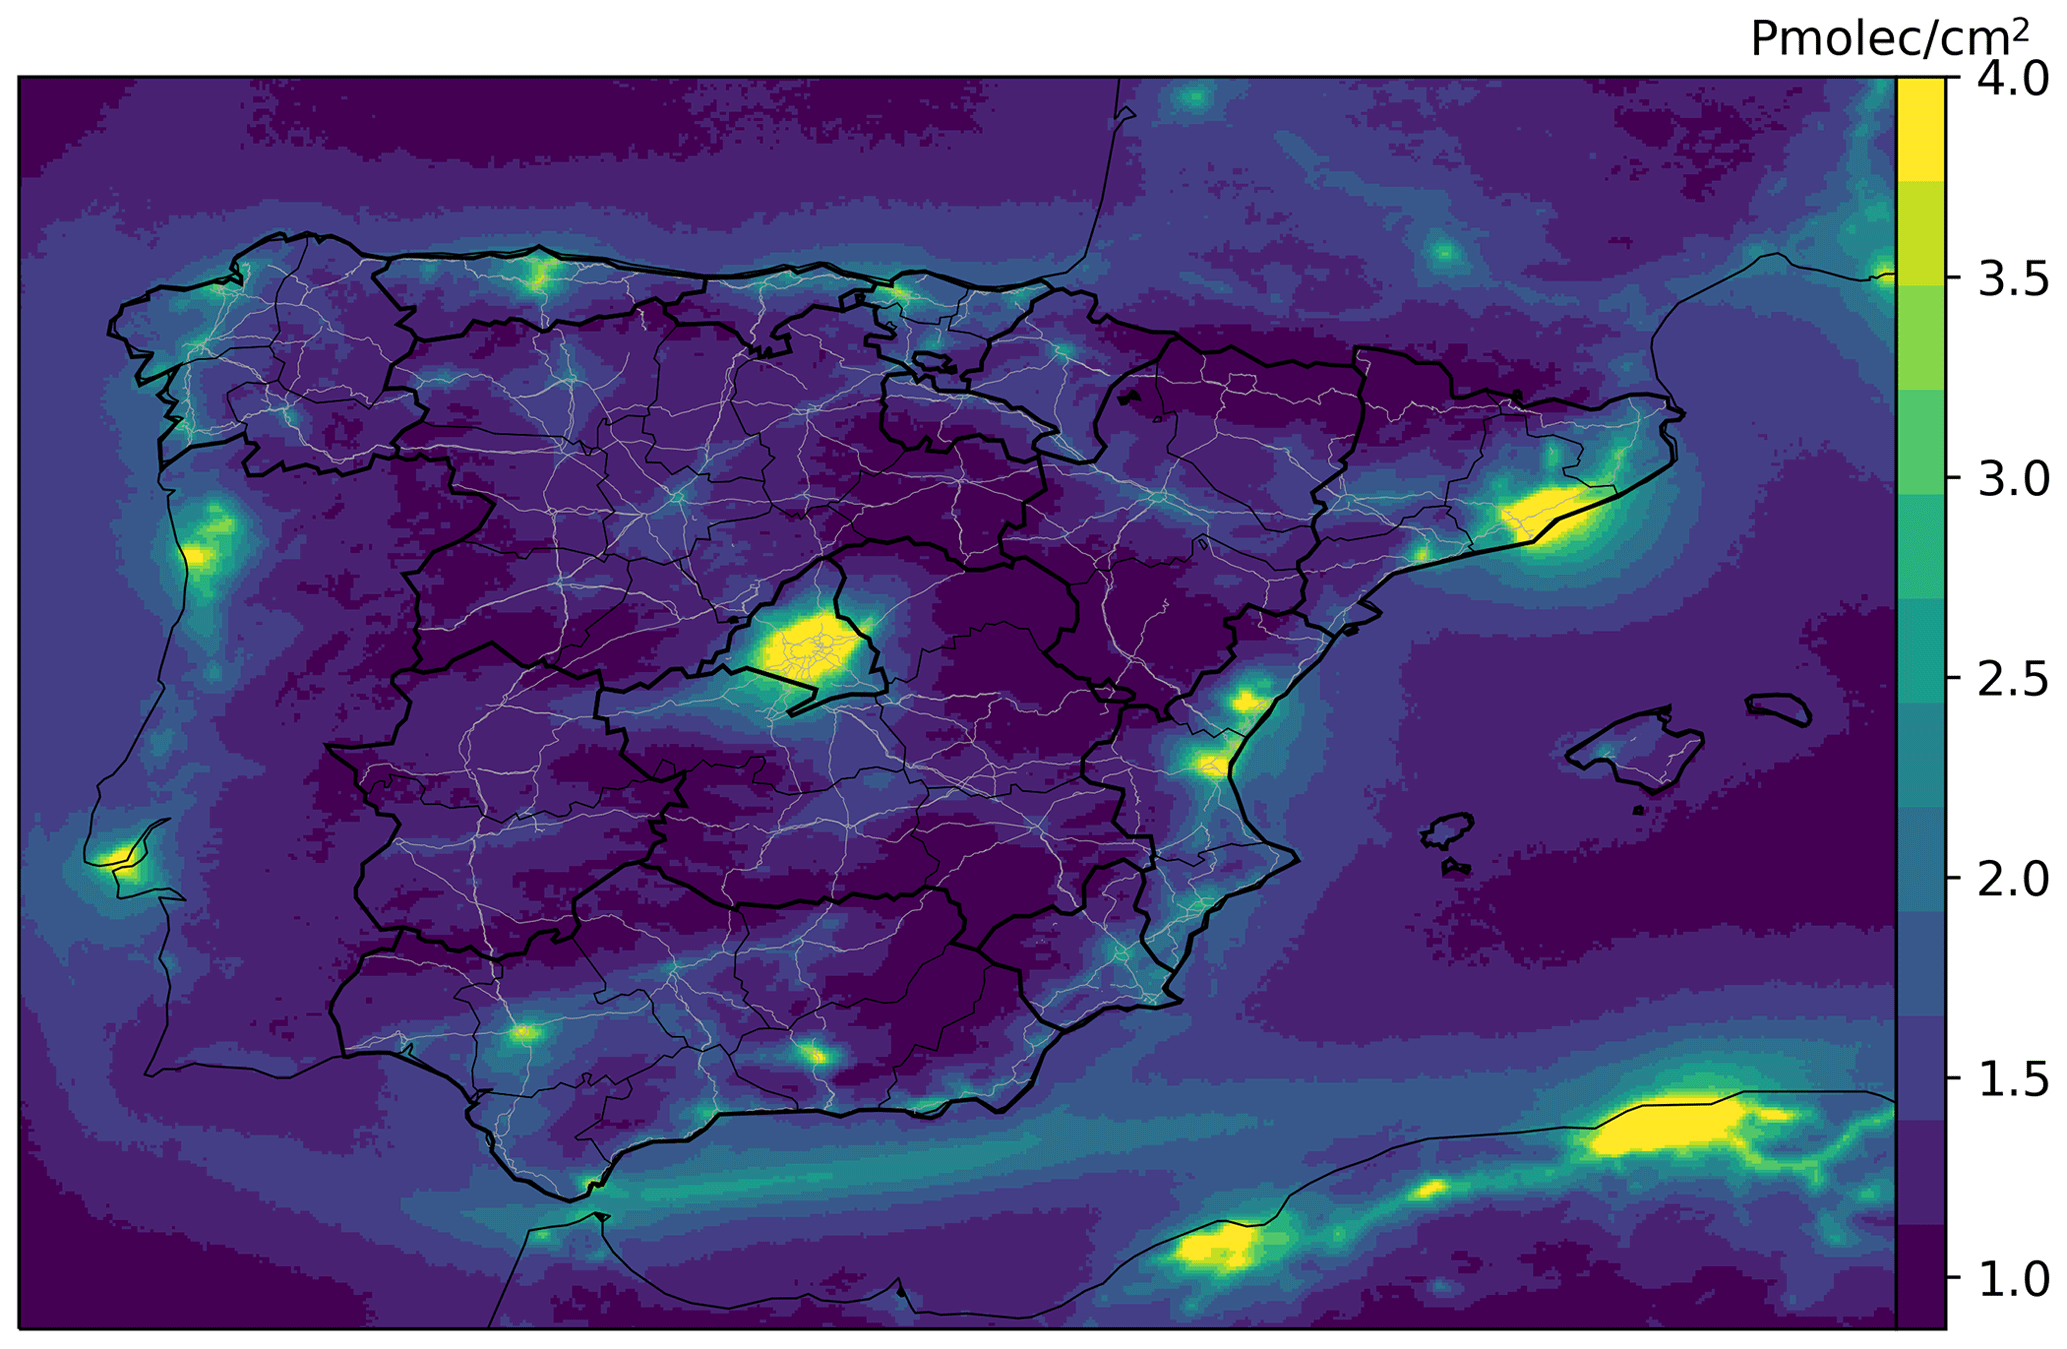
Figure 2Climatological mean of TROPOMI TrC-NO2 (on average from May 2018 to December 2021). Black lines and grey lines correspond to administrative borders and Spanish major roads, respectively (sources: see Sect. 2.4).
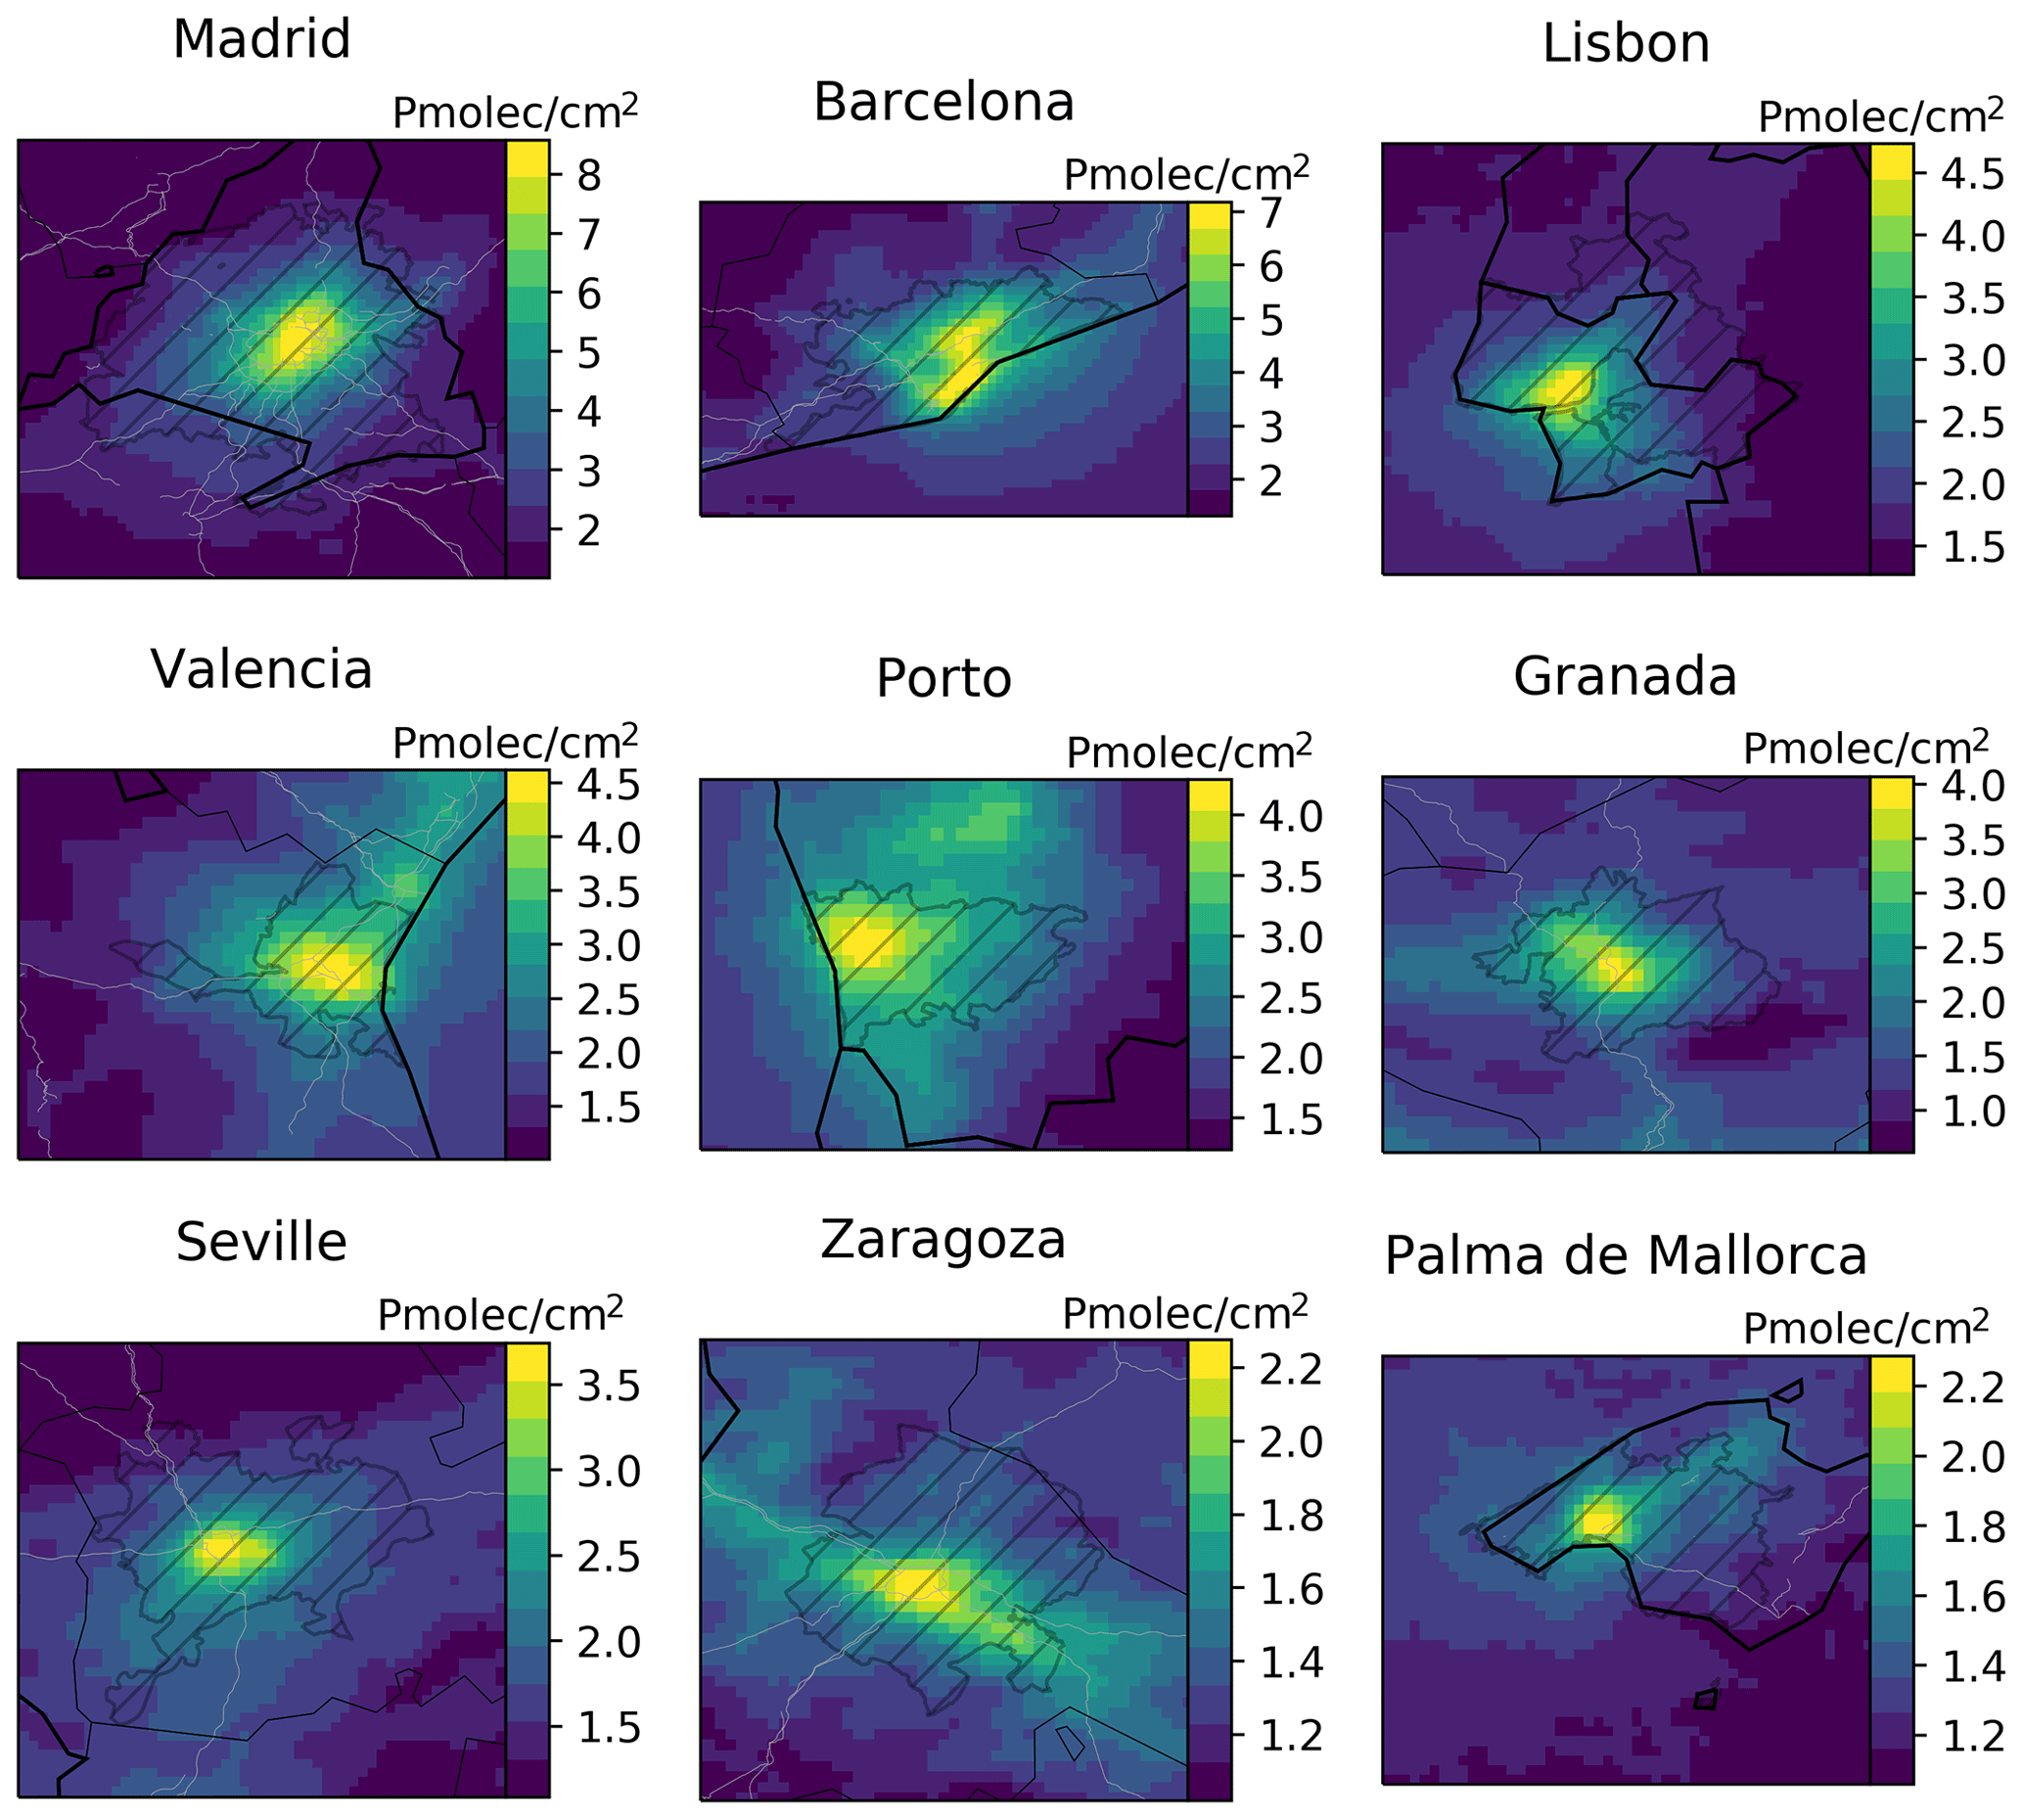
Figure 3Mean TROPOMI TrC-NO2 over main Iberian Peninsula cities (on average from May 2018 to December 2021). Black lines, grey lines and hatched areas correspond to administrative borders, Spanish major roads and functional urban areas, respectively (sources: see Sect. 2.4). Pixels are shown at their 0.025°×0.025° resolution.
3.3 TROPOMI TrC-NO2 versus surface NO2 mixing ratios
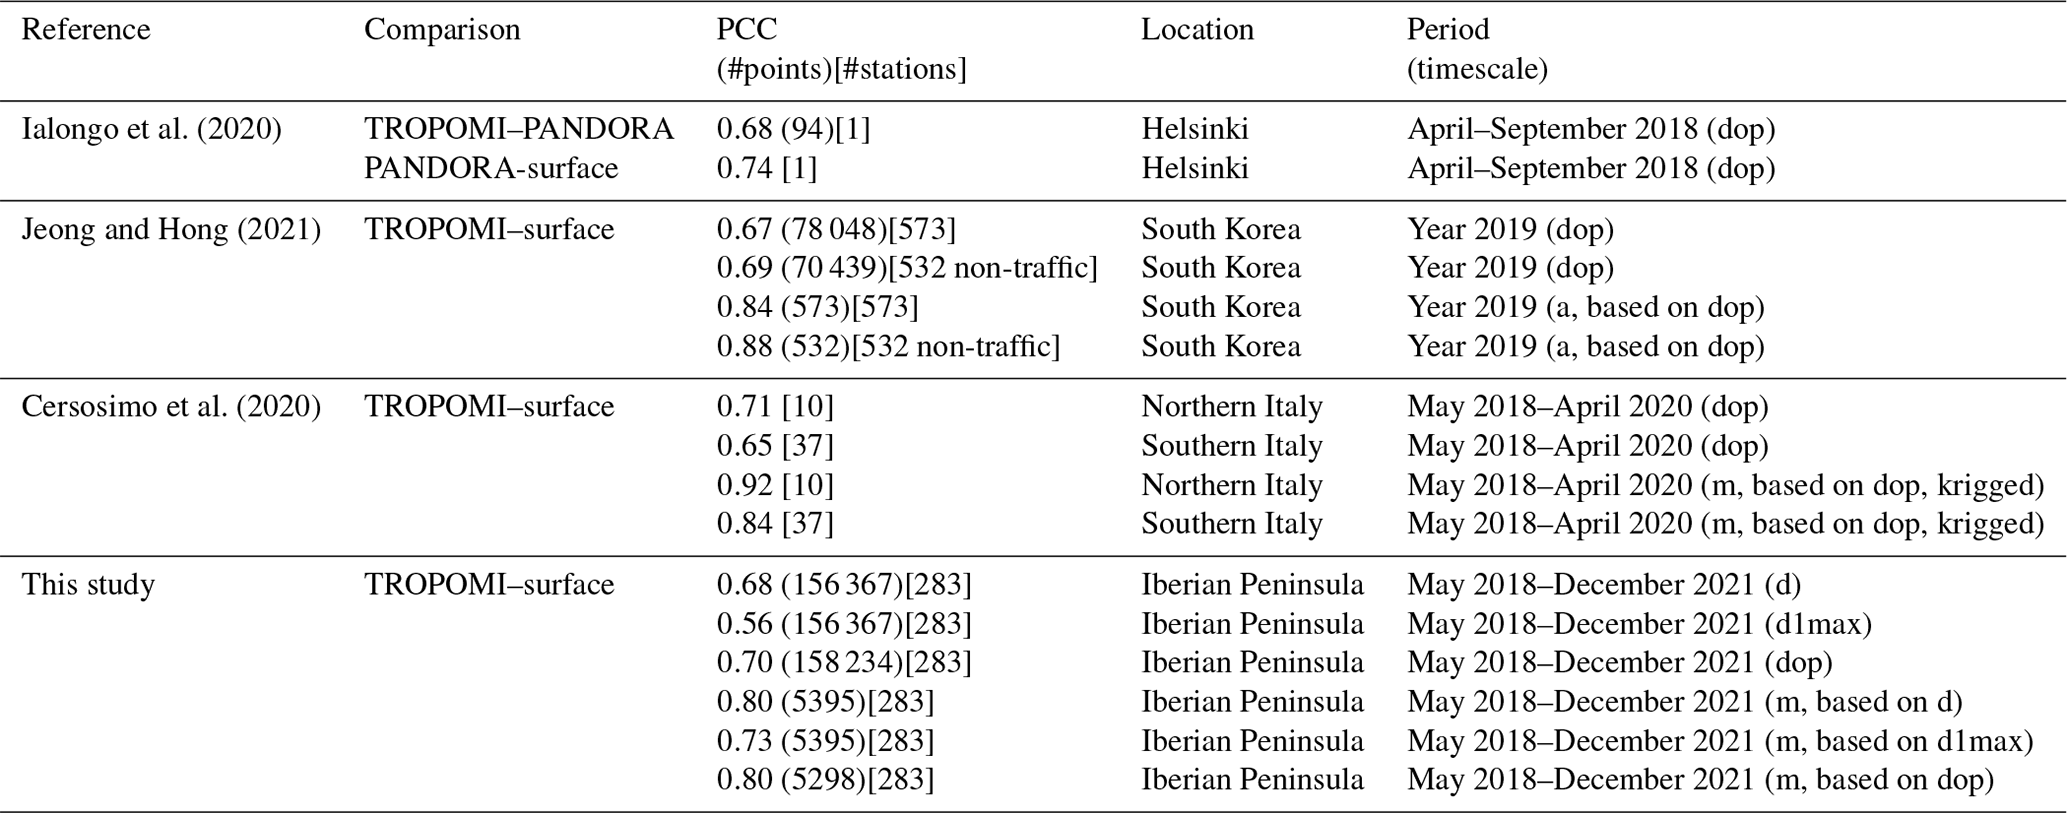
Given its relative short chemical lifetime, NO2 levels remain high close to emission sources, which typically induces a reasonable co-variability of surface NO2 mixing ratios and space-based TrC-NO2, as illustrated for instance by both mean daily time series averaged over the entire domain (Fig. G8 in the Appendix). Nonetheless, this co-variability is adversely affected by the intrinsically different nature and representativeness of both types of measurement, as well as the noise of TrC-NO2 observations. In this section, we investigate these aspects by analyzing the correlation between TROPOMI-based TrC-NO2 observations and surface NO2 mixing ratios measured by monitoring stations, in order to highlight to which extent the variability of NO2 observed from space with TROPOMI is consistent with the one observed at the surface. Given that the aforementioned noise may impact the correlation between both variables, their correlation is here analyzed considering different averaging windows, from 1 to 365 d. Density scatter plots of TrC-NO2 versus surface NO2 at TROPOMI overpass time are given in Fig. 4. In addition, Fig. 5 shows the evolution of the PCC when averaging TrC-NO2 and surface NO2 over different windows, with a data availability criteria of 50 %. On a daily basis (i.e., window of 1 d), both TrC-NO2 and surface NO2 are reasonably well correlated, with a PCC of 0.70. When increasing the time window, the PCC progressively increases, which illustrates the progressive improvement of the TROPOMI signal-to-noise ratio. It reaches its maximum value at windows of 90–120 d (i.e., 3–4 months) and then starts to decrease, potentially due to a more limited sample size. Similarly, the intercept of the linear regression of TROPOMI TrC-NO2 versus surface NO2 progressively improves when averaging over larger windows. Relatively consistent results are obtained for the daily mean and daily 1 h maximum, although PCC values are typically lower especially for the last one. These results are consistent with the correlations found in the recent literature, as shown in Table 3 (note however that our results are typically based on a much larger number of points).
Ialongo et al. (2020)Jeong and Hong (2021)Cersosimo et al. (2020)Table 3Pearson correlation coefficients (PCCs) between TROPOMI-based or PANDORA-based TrC-NO2 and surface-based NO2 mixing ratios in the recent literature, considering different timescales: daily mean (d), daily 1 h maximum (d1max), daily TROPOMI overpass (dop) and monthly (m). When available, information on the number of points and stations is reported.
Therefore, although it only measures NO2 tropospheric columns, TROPOMI is able to provide very useful information regarding the spatio-temporal variability of surface NO2, especially when considering sufficiently large time windows. Nevertheless, the persistent scatter clearly highlights that the relationship between TROPOMI TrC-NO2 and surface NO2 mixing ratios is more complex than a simple linear relationship. Based on the linear regression of daily TrC-N02 versus surface NO2, we analyzed the corresponding residuals (here defined as the distance in Pmolec cm−2 between a given point and the linear regression line). Residuals range between −19 and +44 Pmolec cm−2, with 1th, 5th, 50th, 95th and 99th percentiles of −5, −3, 0, +3 and +9 Pmolec cm−2, respectively. The high positive residuals correspond to situations where strong TrC-NO2 were measured by TROPOMI, while relatively low NO2 mixing ratios were measured by surface background stations. The location of the 10 % largest positive residuals is shown in Fig. G7 in the Appendix: more frequent during cold months, these residuals occur preferentially over large urban areas (e.g., Madrid, Barcelona). Although they could be explained by the possible presence of NO2 pollution aloft in the boundary layer, they are more probably associated with conditions of low dispersion, leading to substantial spatial heterogeneities of surface NO2 over the TROPOMI pixel area.
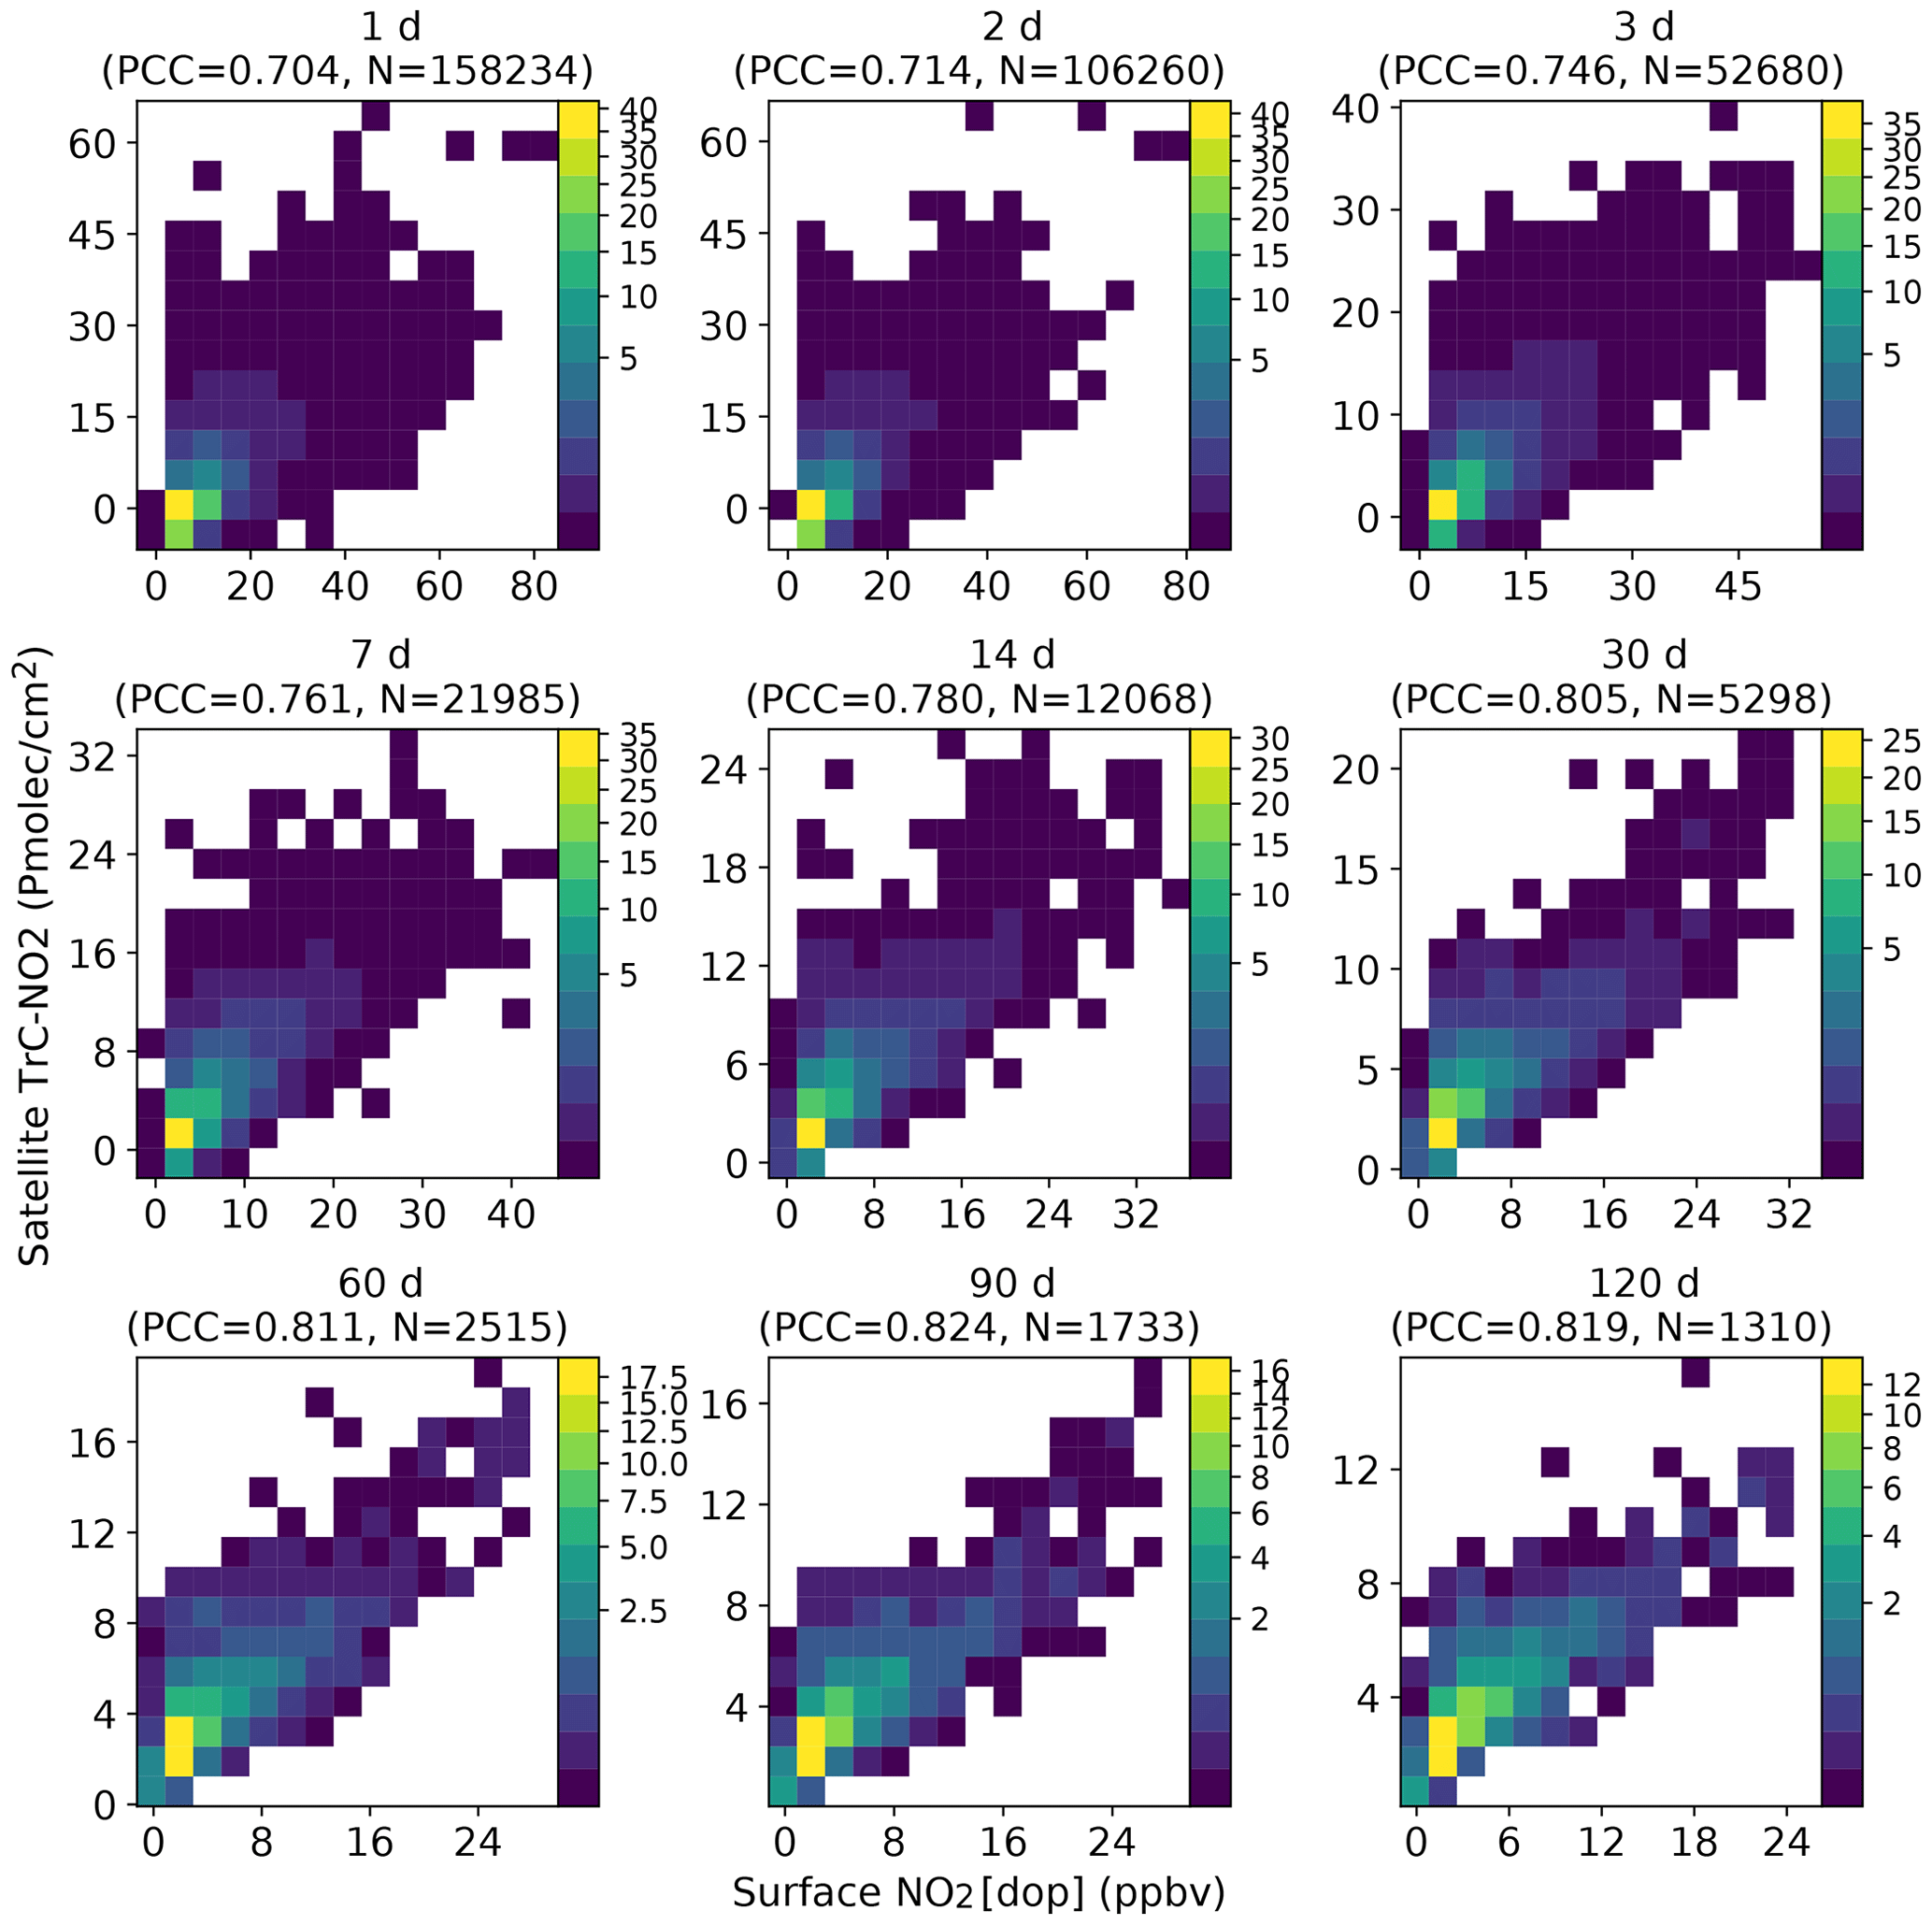
Figure 4Density scatter plot of TROPOMI TrC-NO2 against surface NO2 mixing ratios at TROPOMI overpass time (dop timescale), averaged over different time windows.
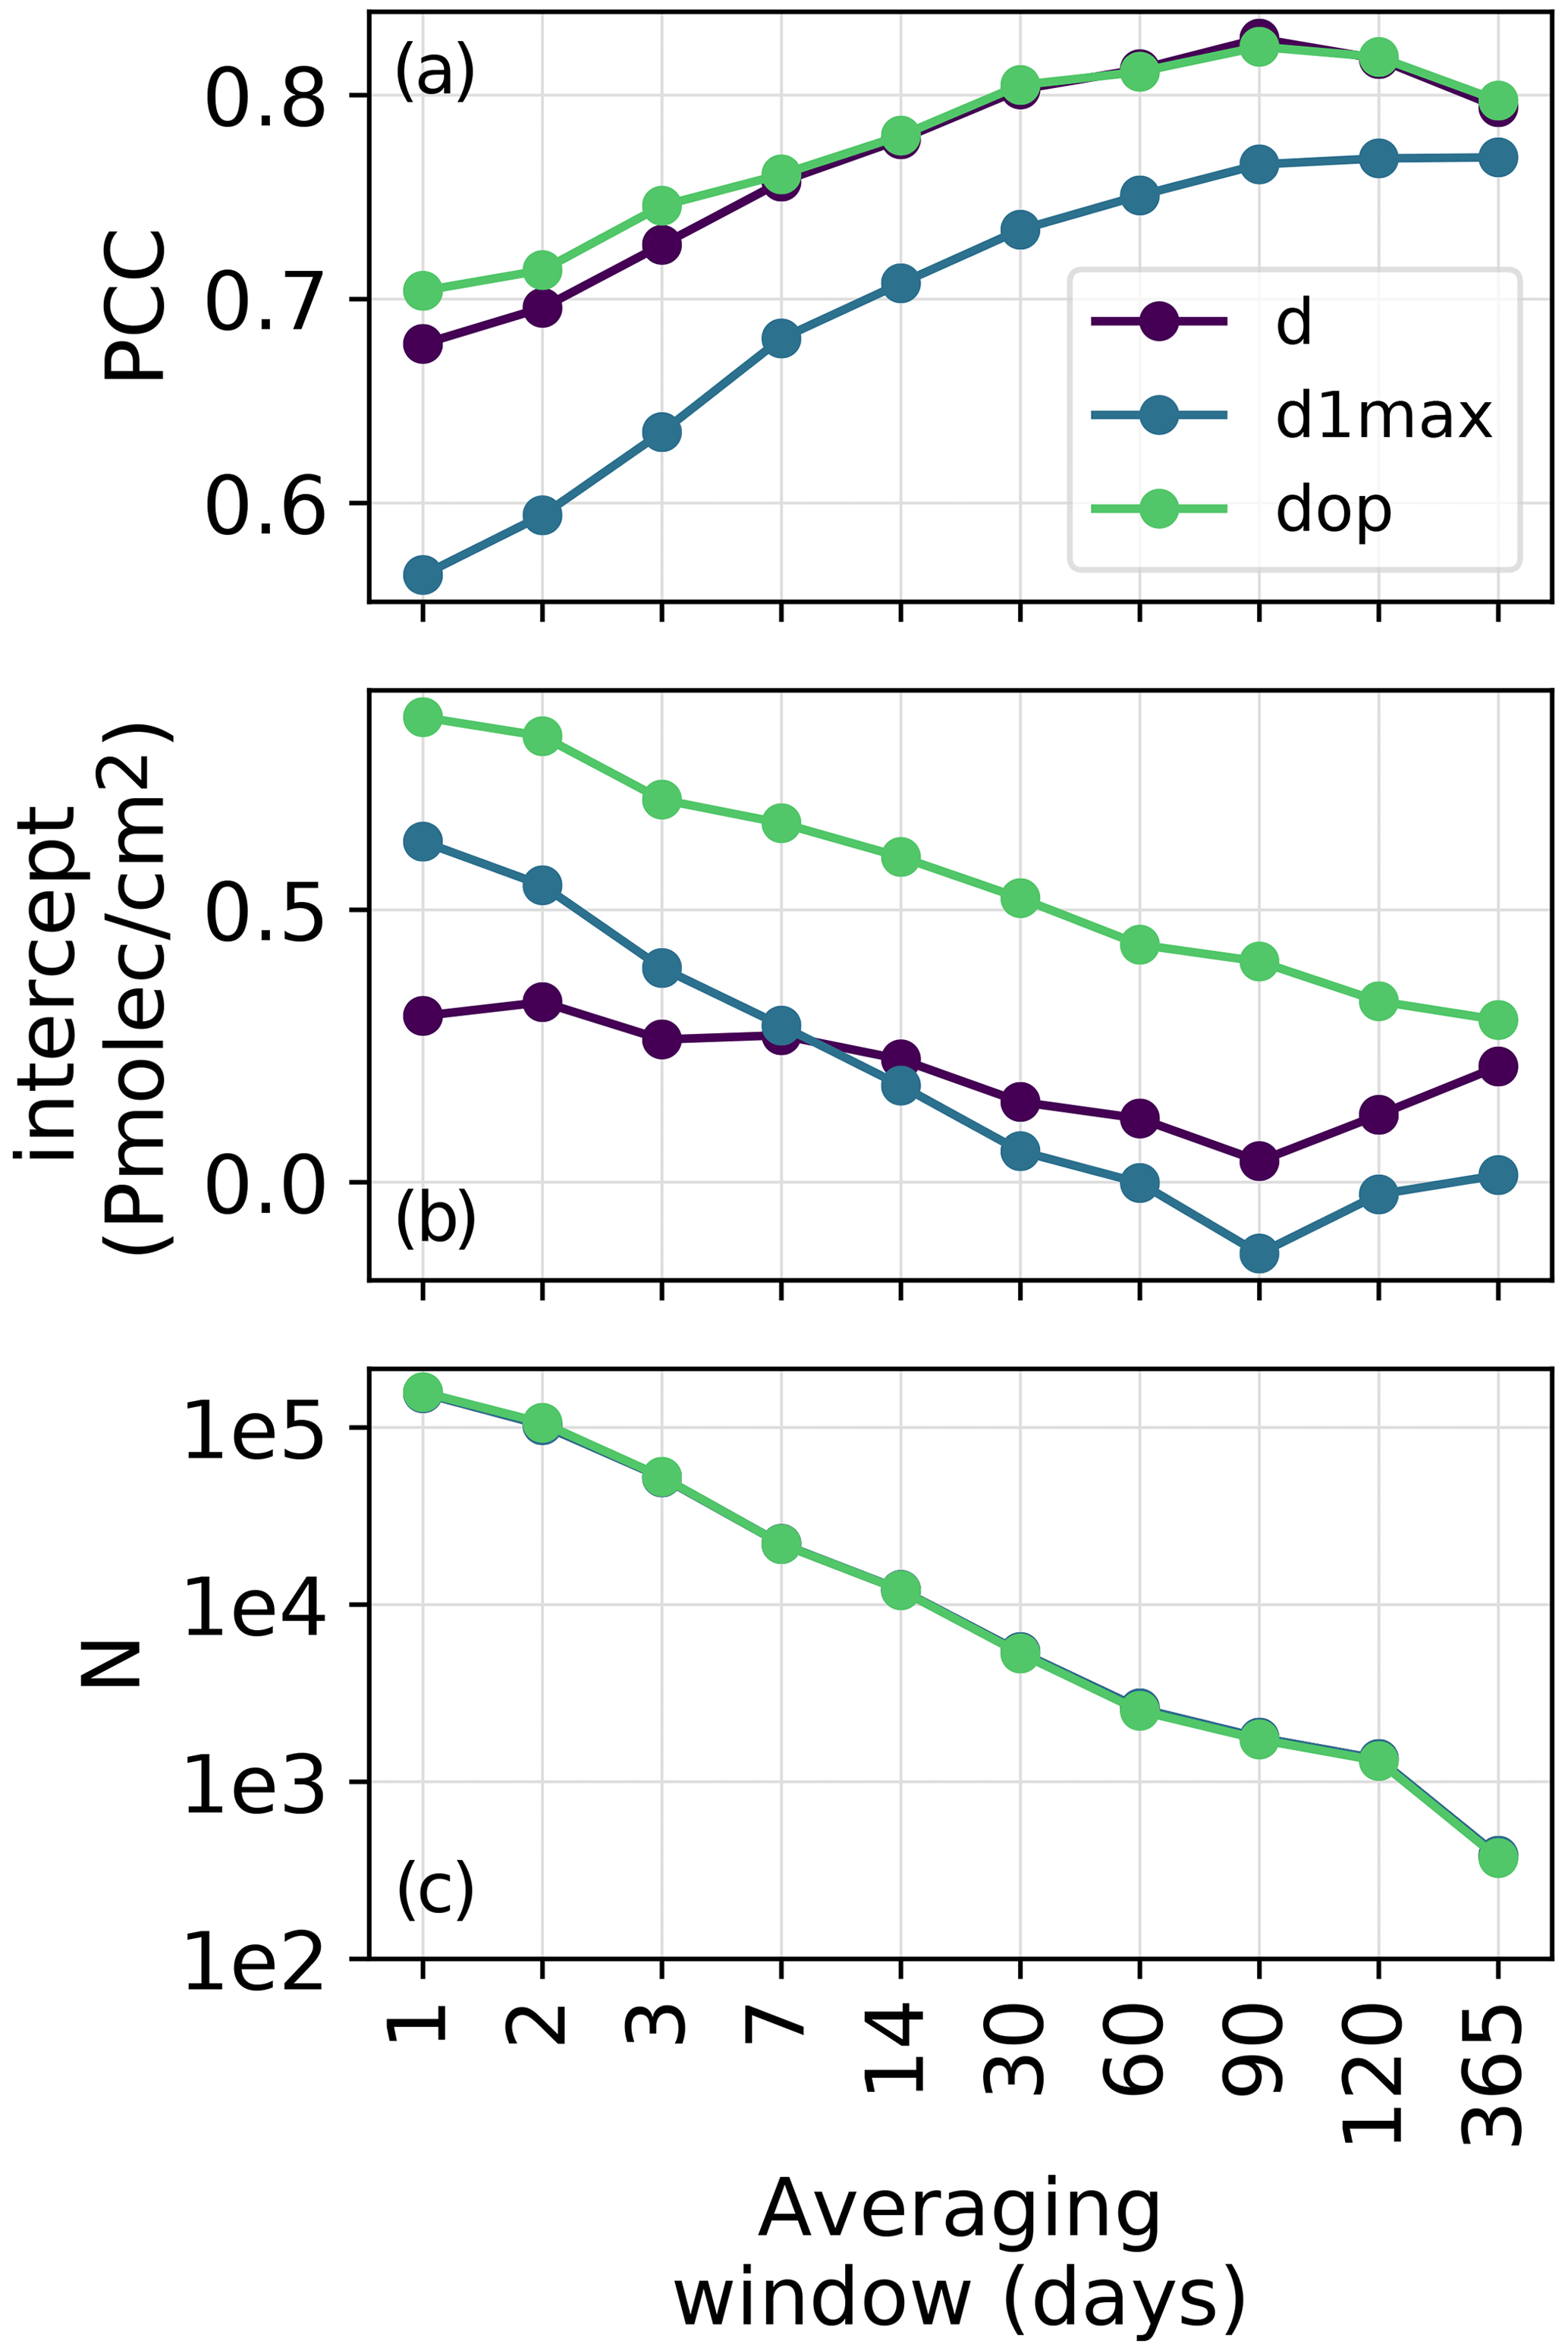
Figure 5Pearson correlation coefficient (a), intercept (b) and number of points (c) of the least square linear regression of TROPOMI TrC-NO2 versus surface NO2 mixing ratio for different time windows. Results are shown at daily mean (d) and daily 1 h maximum (d1max) scales as well as during daily TROPOMI overpass times (dop).
3.4 Weekly variability
3.4.1 TrC-NO2 weekly variability and its dependency upon urban land cover fraction
The mean weekly profiles of TROPOMI TrC-NO2 over the Iberian Peninsula are shown in Fig. 6, averaged over cells of different urban cover fractions (see this urban cover fraction map in Fig. G2 in the Appendix). More specifically, TROPOMI data are averaged over 10 groups of grid cells gathered according to 10 bins of urban cover fraction (0 %–10 %, 10 %–20 %, …90 %–100 %). More urbanized areas typically show both higher TrC-NO2 values and stronger reduction during the weekend, relative to weekdays. Hereafter, the mean relative difference of NO2 levels between weekdays and the weekend (or only Saturday or Sunday) is referred to as the weekend effect and is calculated as , with being the mean NO2 during weekdays (Monday to Friday if not specified) and being the mean NO2 during the weekend (Saturday–Sunday if not specified) or Saturday or Sunday taken individually. Over the areas exceeding 90 % of urban fraction, this weekend effect reaches around −30 % during the weekend, with stronger reductions on Sunday (−36 %) than on Saturday (−25 %). Interestingly, the same TROPOMI-based weekly profiles over the first strict COVID-19 lockdown (here defined as the period 15 March–31 May 2020) highlight a few noticeable differences (see Fig. G4 in the Appendix), including (1) a quite substantial NO2 reduction on Friday over the most urbanized area (up to −15 %), (2) a similar NO2 reduction on both Saturday and Sunday whatever the urban fraction (corresponding to a stronger decrease on Saturday compared to the previously discussed weekly profiles) and (3) a stronger weekend effect over areas below 10 % urban fraction; the same weekly profiles obtained considering only the cells with surface observations available are apparently much less robust, likely due to an overly low number of points, but in agreement with the corresponding profiles observed at the surface.
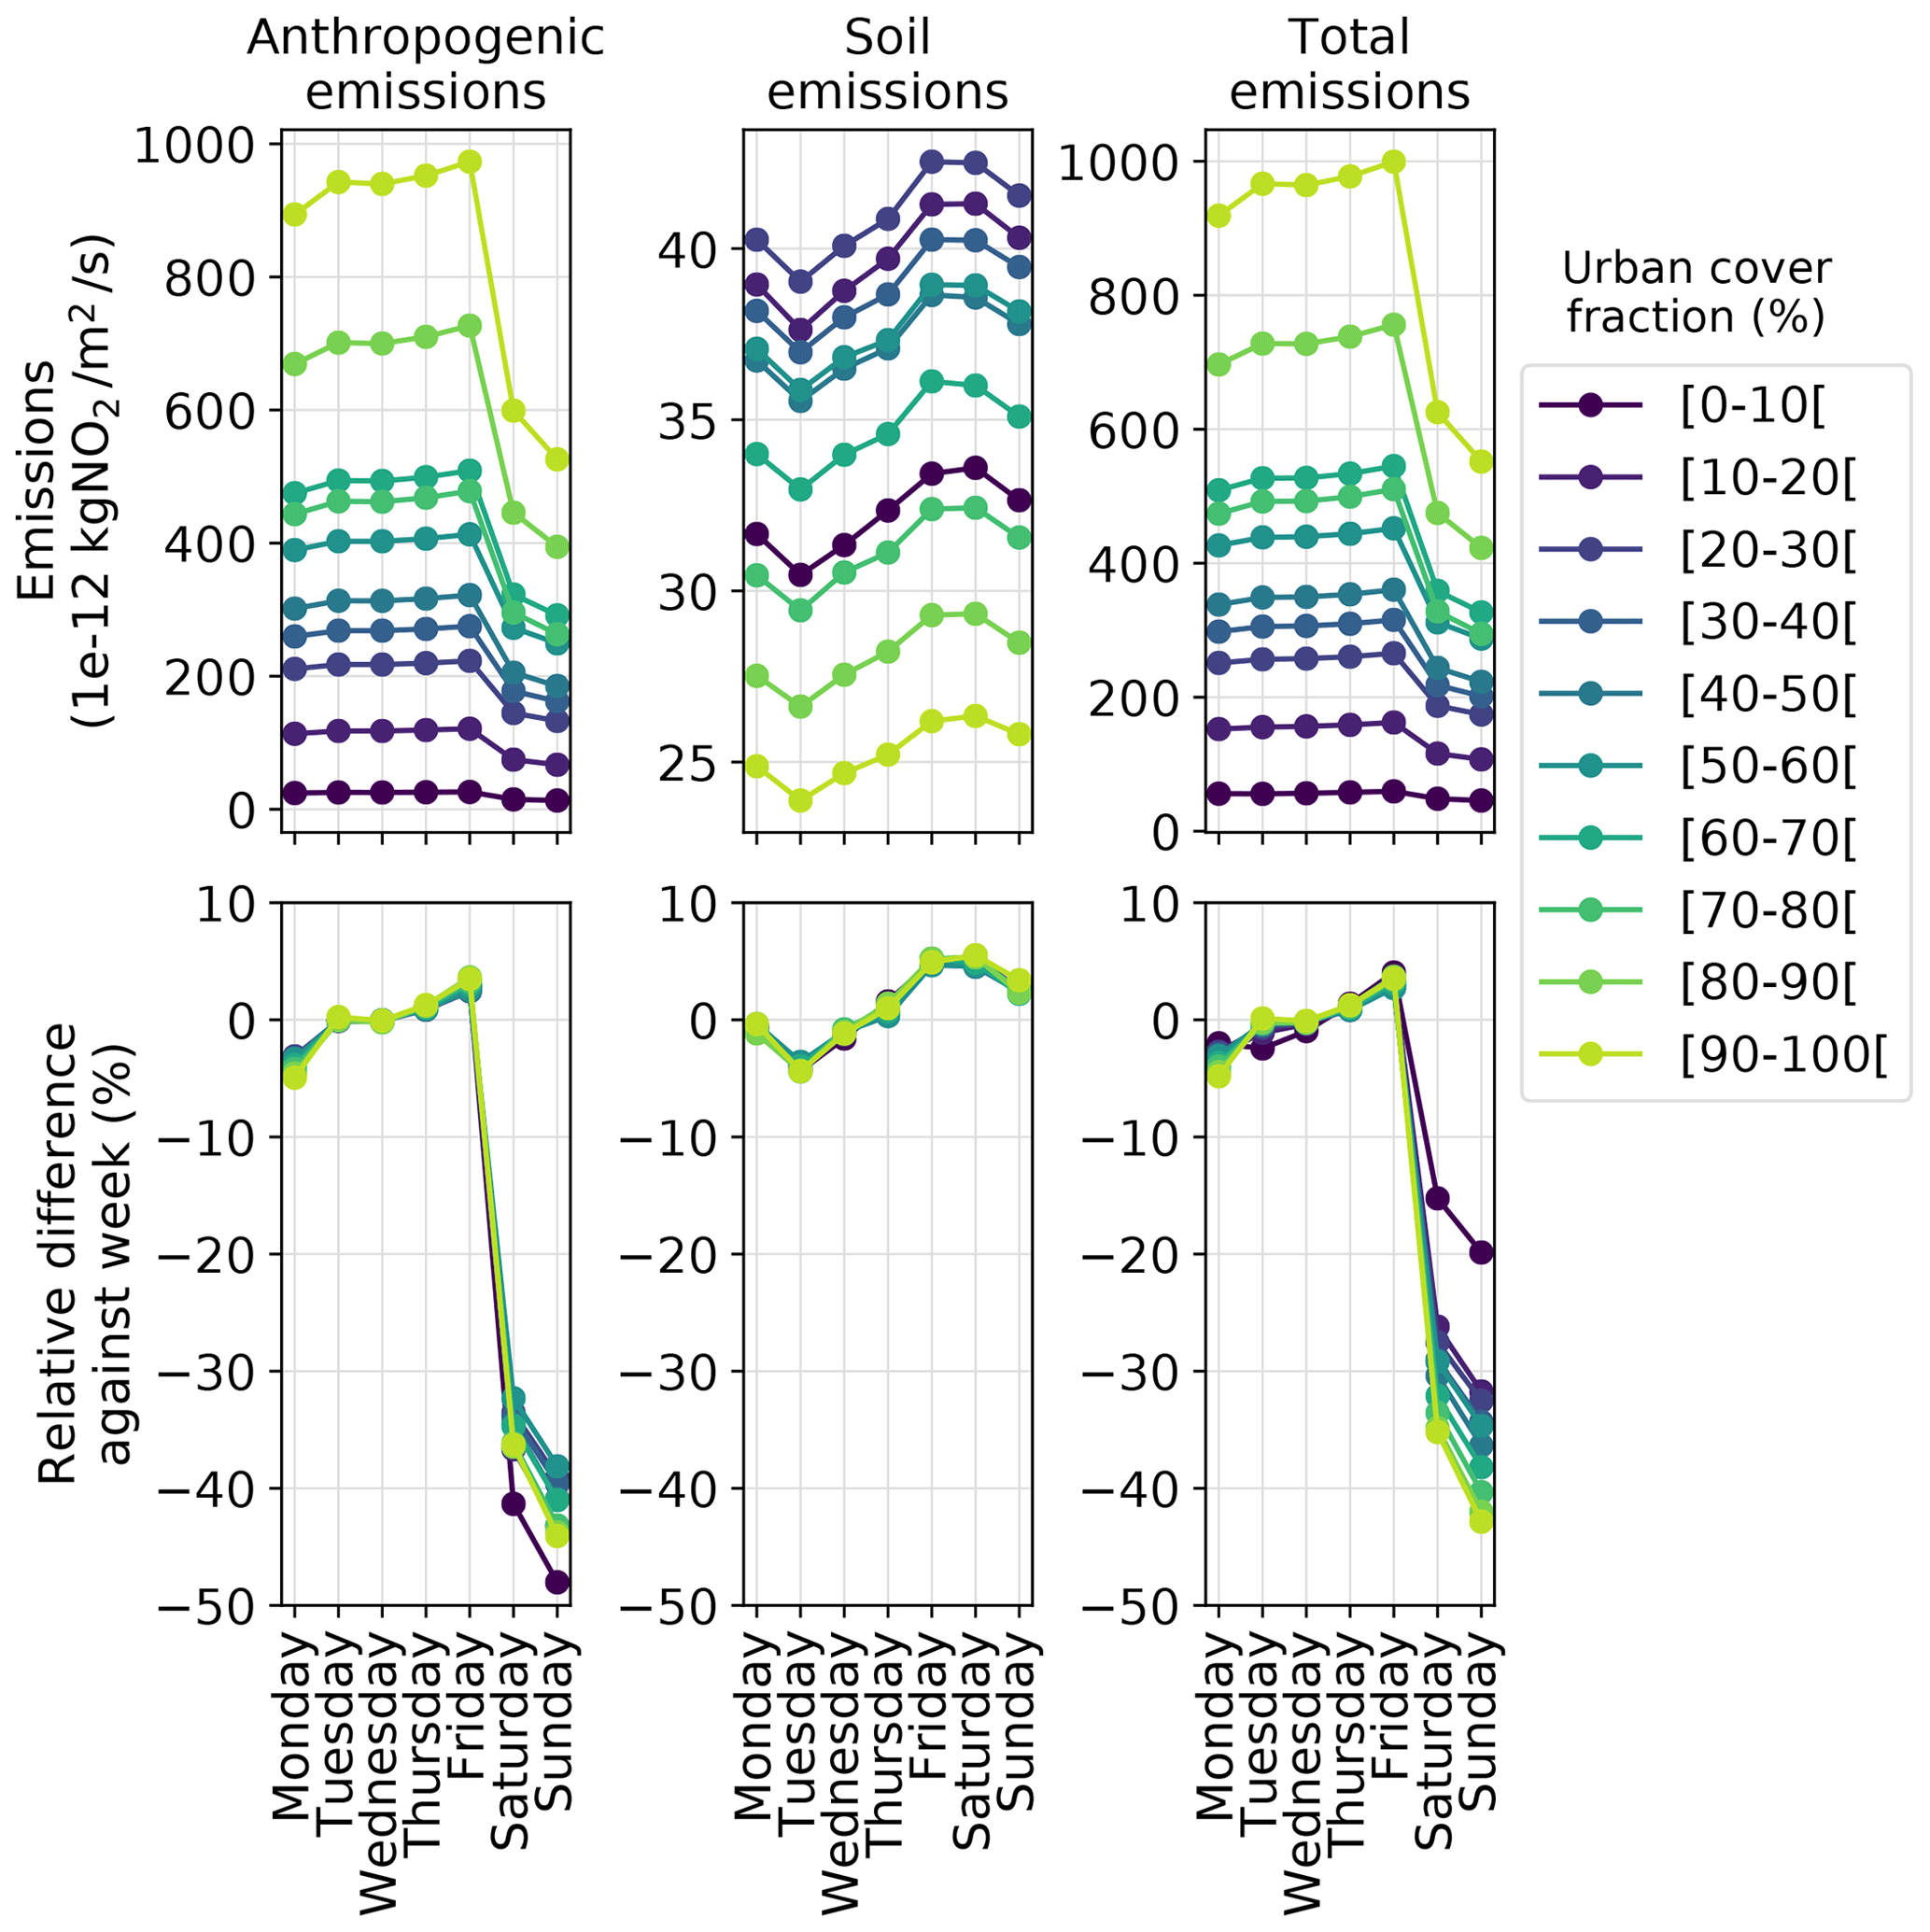
Over the areas with less than 10 % urban cover, the weekly profile is flattened with weekend reductions around −10 % and only small differences between Saturday and Sunday. Such a persistence of the weekend effect in rural areas can be at least partly attributed to (1) the transport of NO2 pollution from urban to rural areas leading to a smoother but persistent weekly variability in downwind rural areas and (2) the weekly variability of total NOx emissions in rural areas. Regarding the variability of emissions, the estimated total (anthropogenic and natural soil) NOx emissions indeed highlight lower emissions during the weekend, around −20 %, as shown in Fig. 7; note that the strongest weekend reduction of anthropogenic emissions is found in the least urbanized areas due to the predominant contribution of road transport (inter-urban roads and highways), while other emission sectors (e.g., residential) with smoother weekend reduction have a higher contribution in more urbanized areas. While natural soil NOx emissions do not follow any clear weekly variability, the anthropogenic emissions prevailing in rural areas (from, e.g., road and non-road transport, agriculture, isolated industrial facilities) do show a substantial relative change during the weekend, down to −50 %, and are high enough to induce some weekly variability to total NOx emissions, although it is worth reminding here that both anthropogenic and natural soil NOx emissions remain affected by substantial uncertainties. Although not directly comparable, the weekend effect of total NOx emissions is roughly consistent but slightly stronger than the one observed in TROPOMI TrC-NO2, whatever the urban cover fraction.
Among weekdays, a minor but still noticeable variability is observed in TrC-NO2 data, with slightly lower TrC-NO2 values on Monday and slightly higher TrC-NO2 on Tuesday. NOx emissions also show slightly lower emissions on Monday but higher ones on Friday, maybe driven by higher traffic intensity and traffic congestion before the weekend. Here, the TROPOMI-based weekly profile might hide this feature due to a too-early overpass time (13:30 local solar time).
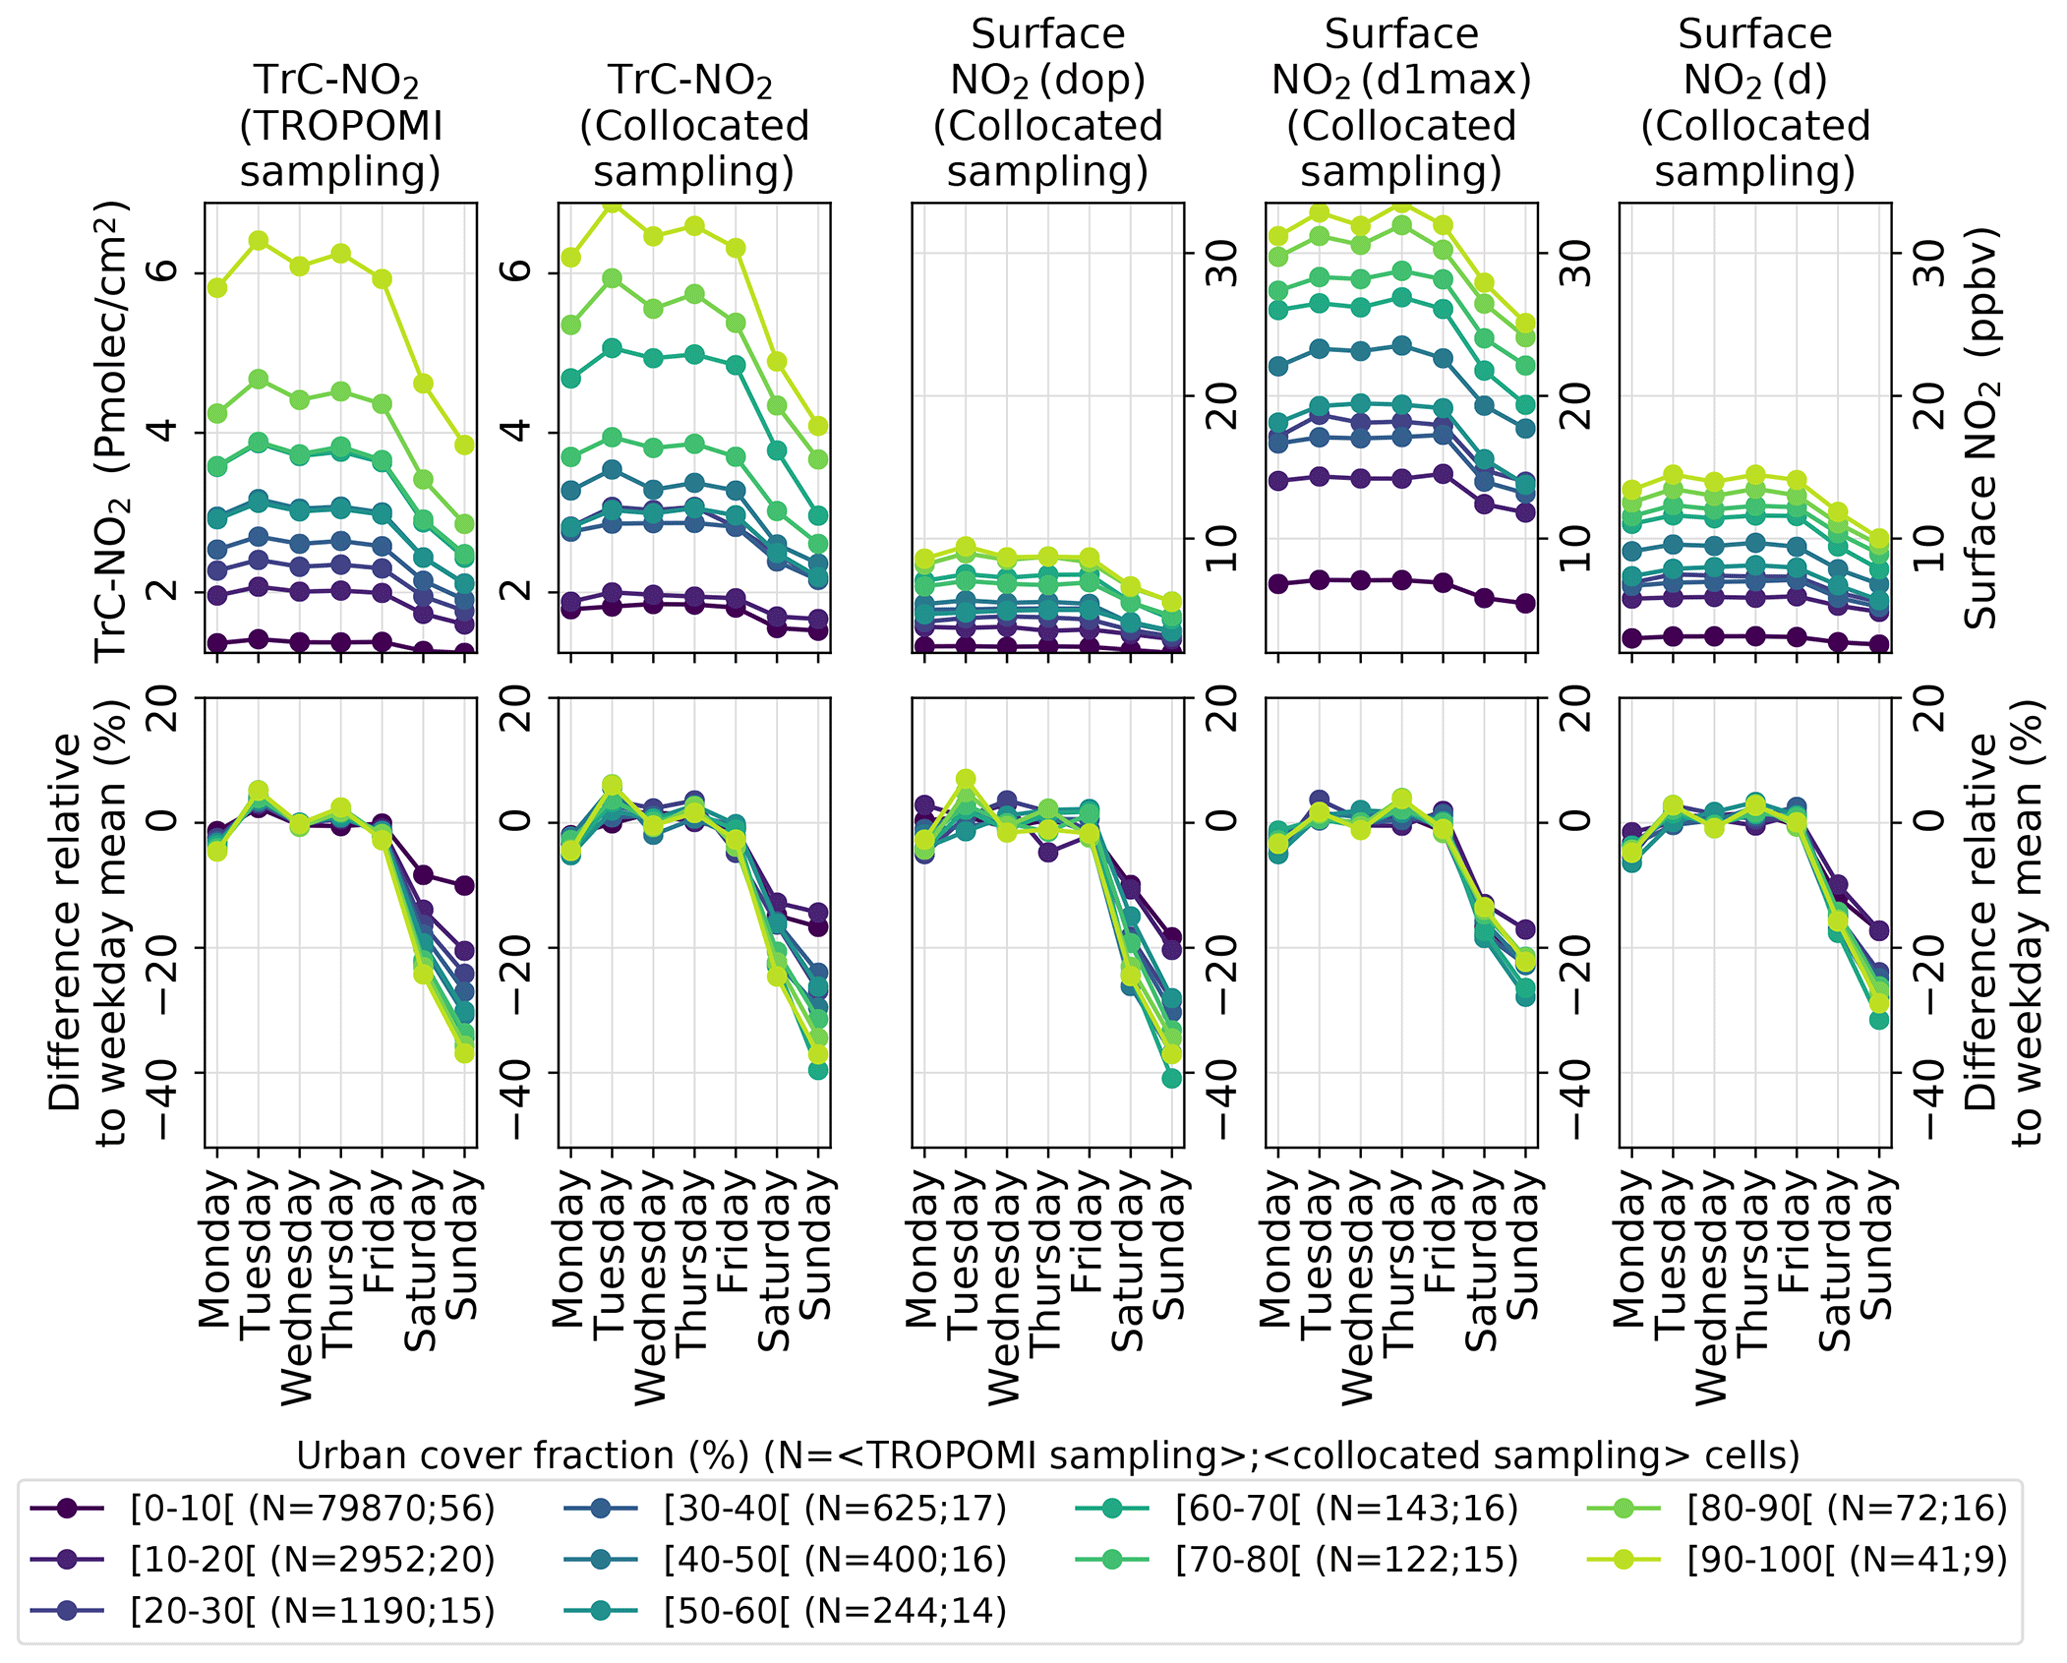
Figure 6Mean weekly profiles (top panels) and differences relative to weekday (Monday–Friday) mean (bottom panels) for different levels of urban cover fraction considering (from left to right panels) TROPOMI TrC-NO2 full dataset, TROPOMI TrC-NO2 collocated with surface stations, surface NO2 mixing ratios collocated with TROPOMI at daily TROPOMI overpass time (dop), and daily 1 h maximum (d1max) and daily 24 h mean (d) timescales. The collocation of TROPOMI-based and surface-based observations is here performed both spatially and temporally (on a daily basis); the corresponding numbers of cells (averaged over the different days of the week) are indicated in the legend. Urban cover fractions are here binned in bins of 10 %.
3.4.2 Spatial distribution of the TrC-NO2 weekend effect
In terms of spatial distribution (Fig. 8), the weekend effect thus clearly peaks over the largest cities of the Iberian Peninsula. In addition, a few major highways also depict some weekend effect, although this could also be due to minor urbanization along the highway. International shipping emissions are not affected by any significant weekly variability, as demonstrated by the absence of the weekend effect along the major maritime routes around Gibraltar despite high TrC-NO2 levels. A more detailed view of the main agglomerations is given in Fig. 9. The weekend effect is limited to −20 % in Palma de Mallorca and Zaragoza but reaches −30 % to −40 % in the other cities. The unprecedentedly high spatial resolution of TROPOMI allows here to be revealed the substantial gradients of the weekend effect not only between the agglomerations and their surroundings, but also within the agglomeration itself (remind however that functional urban areas cover a much larger area than the agglomerations alone). In particular, in some agglomerations such as Madrid, Barcelona, Valencia or Granada, the strongest weekend effect is not observed above the city center but rather in specific surrounding areas. At a given location, the weekend effect is expected to be mainly driven by (1) the relative share between weekly variable local (anthropogenic) NOx emissions and weekly independent local (anthropogenic and natural) NOx emissions and (2) the weekly variability of the NO2 background advected from the surrounding cells. This emission-related driver may dominate in Madrid or Barcelona where some suburbs can be affected by a stronger relative contribution of commuting (and possibly industry) into the anthropogenic NOx emissions, up to compensating for the lower relative contribution of anthropogenic over total NOx emissions that usually peaks in city centers. Conversely, the transport-related driver may be the most important one in the case of Granada as suggested by the clear west-northwest dominant winds, allowing the maximum weekend effect to extend eastward from the city center, down to an area of more complex orography and relatively lower population density. Therefore, summarizing the intensity of the weekend effect in a given city by one single value as done for instance in Goldberg et al. (2021a) over the US or in Stavrakou et al. (2020) over worldwide agglomerations provides a useful first level of information but can hide substantial intra-agglomeration variations, especially in the largest metropolitan areas.
Apart from the Iberian Peninsula, a weekend effect can also be observed over French cities (Marseille, Toulouse, Bordeaux), although not as strong as in Iberian Peninsula cities. Over Morocco, only a small and diffuse weekend effect can eventually be distinguished in small areas located south of the Ceuta and Melilla Spanish territories. Surprisingly, although Morocco follows the same working days as Spain (i.e., weekend on Saturday–Sunday), no clear weekend effect is observed over Tanger (a relatively large coastal city of Morocco located on the northern point close to Gibraltar), which could partly be due to a substantial contribution of weekly independent international shipping emissions to ambient NO2 levels. In contrast with Morocco and the European countries, Algeria follows a different working days pattern, with Friday–Saturday corresponding to the “weekend”, and Friday to the “Sunday”, which clearly appears over the Algiers and Oran cities when mapping the weekend effect accordingly (see Figs. G5 and G6 in the Appendix). Note that, thanks to the use of traffic congestion data from many countries including some Muslim ones in the updated CAMS-REG-TEMPOv3.2 emission profiles, our estimated NOx anthropogenic emissions in Algiers correctly depict a reduction during Friday–Saturday (−26 % and −29 %, respectively), at least qualitatively. However, the weekly profiles used in other important NOx emission sectors such as energy or manufacturing industry do not yet take into account this distribution of the weekdays–weekend, which leads to a persistent reduction on Sunday (−9 %), in disagreement with the TROPOMI TrC-NO2 observations (−35 %, −15 % and −1 % on Friday, Saturday and Sunday, respectively). This illustrates the interest of TROPOMI observations for identifying issues potentially affecting emission temporal profiles in geographical areas where limited activity data information is available.
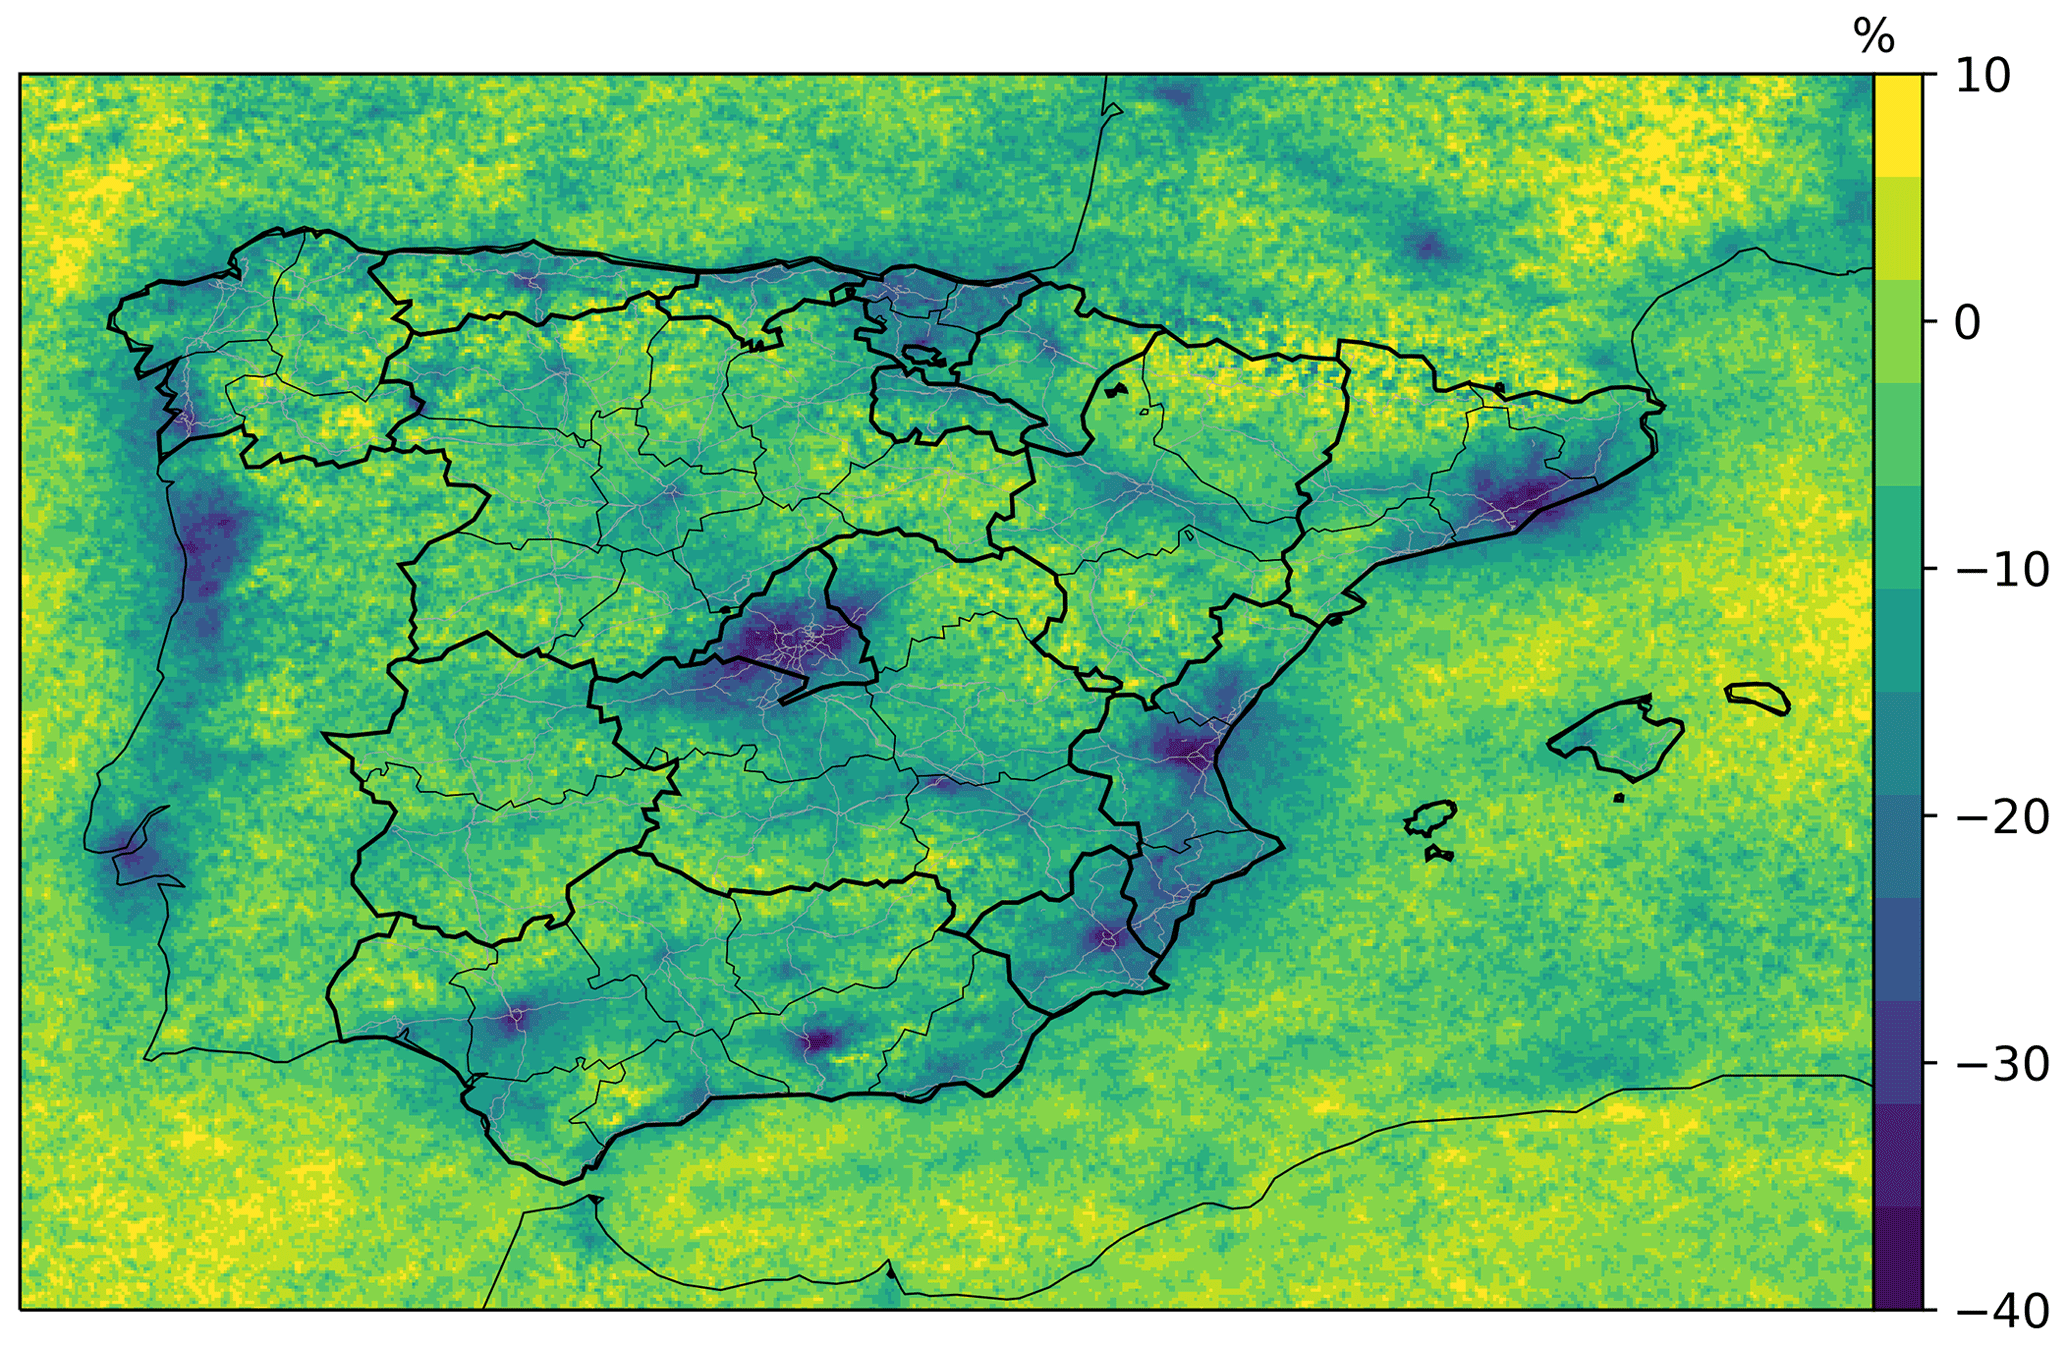
Figure 8Mean relative change of TROPOMI TrC-NO2 during the weekend (Saturday–Sunday) relative to the week (Monday–Friday), over the Iberian Peninsula. Black lines and grey lines correspond to administrative borders and Spanish major roads, respectively (sources: see Sect. 2.4).
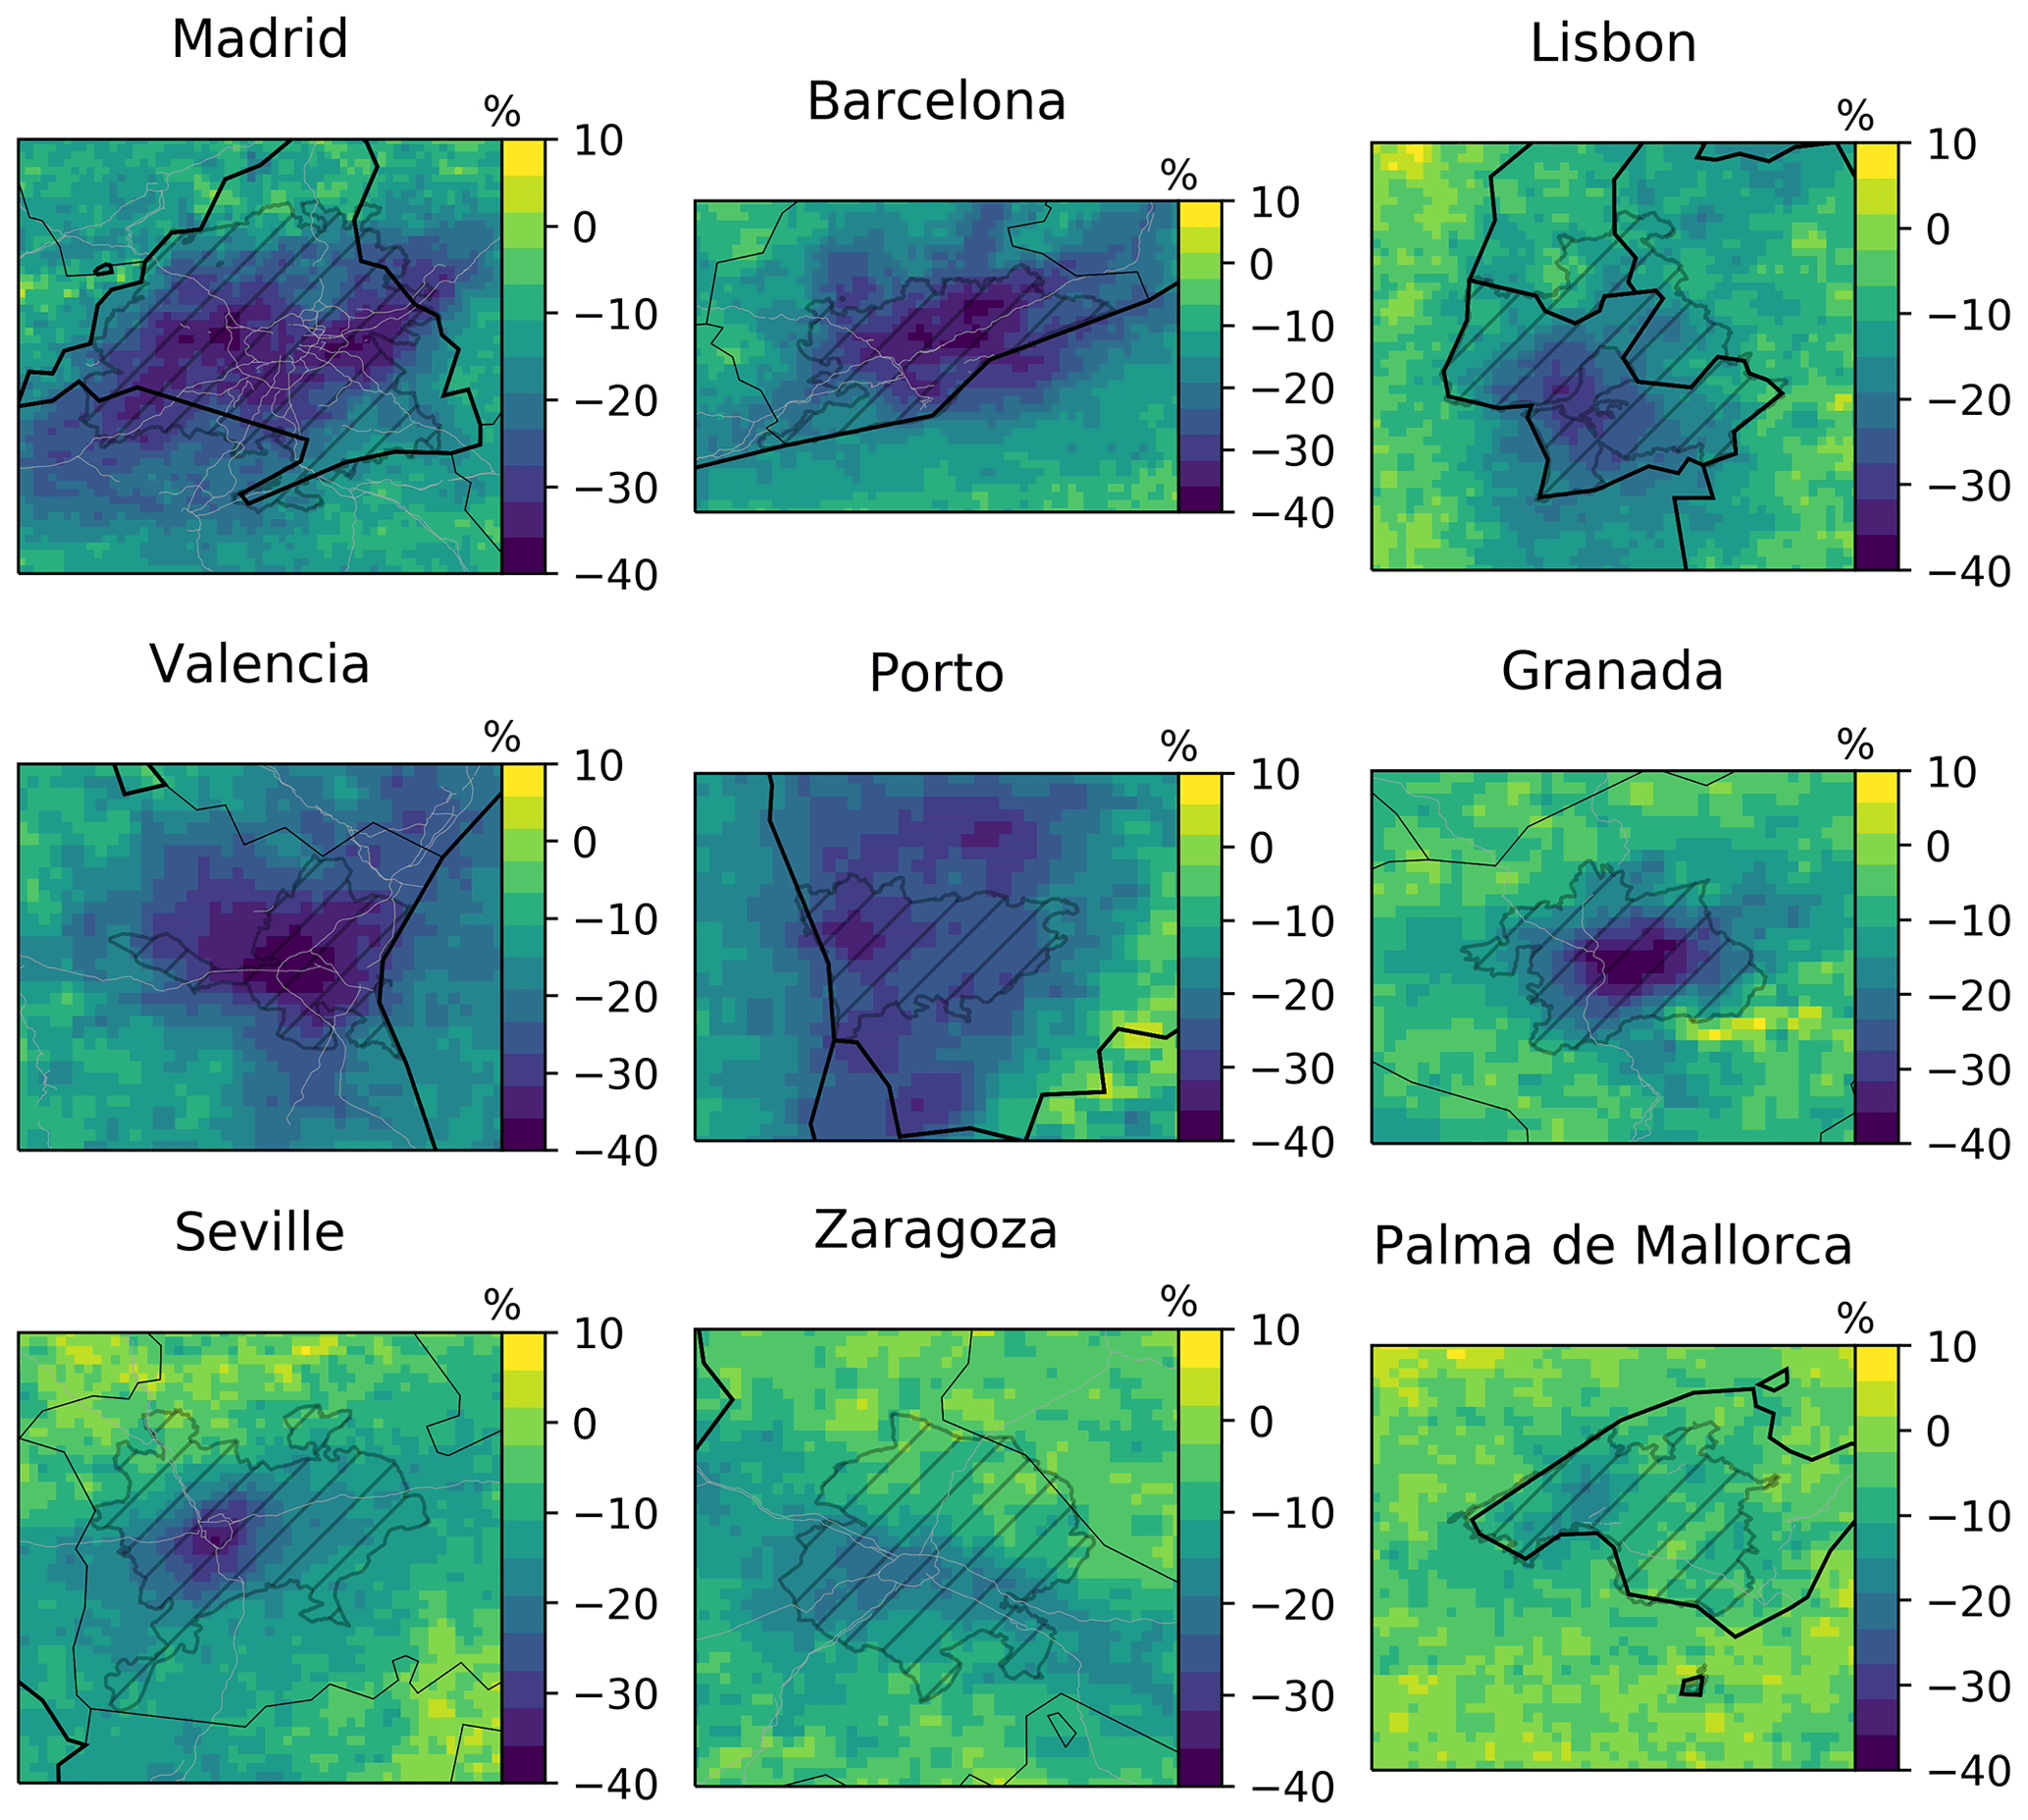
Figure 9Mean relative change of TROPOMI TrC-NO2 during the weekend relative to the week over the main Iberian Peninsula cities. Black lines, grey lines and hatched areas correspond to administrative borders, Spanish major roads and functional urban areas, respectively (sources: see Sect. 2.4). Pixels are shown at their 0.025°×0.025° resolution.
3.4.3 TrC-NO2 weekly variability above industrial sites
We previously mentioned the industry as a potential contributor to the weekly variability of NO2. In order to explore this aspect, we computed the mean weekend reduction at the location of all 5139 industrial point sources emitting NOx in Spain (see Table G3 in the Appendix). Although results cannot be attributed solely to industry since part of these factories are surrounded by urban area and/or are located downwind, TrC-NO2 values over these point sources are on average 20 % and 31 % lower on Saturday and Sunday, respectively (25 % over the entire weekend), which would be consistent with the expected decrease of activity during the weekend in most industrial sectors. Interestingly, this mean TrC-NO2 weekend effect progressively decreases when focusing on the largest industrial point sources, down to −20 % for the 10th largest NOx emitters (−16 % and −24 % on Saturday and Sunday, respectively). Even lower (down to −15 %) weekend effects are observed above heavy industries like cement plants, power plants or refineries.
3.4.4 Weekly variability of NO2 in surface monitoring stations
The weekly variability derived from the surface NO2 measurements also clearly highlights a reduction during the weekend (Fig. 6; third to fifth column panels). Due to diurnal variability of NO2 pollution, these weekly profiles can change substantially depending on the timescale considered. Depending on the urban cover fraction, the relative reduction of daily mean (d) NO2 ranges between −10 % and −20 % on Saturday and between −18 % and −32 % on Sunday. At a daily 1 h maximum (d1max) timescale, the reduction tends to be slightly higher on Saturday and slightly lower on Sunday.
In order to compare these results with TROPOMI, the TrC-NO2 weekly profiles are calculated considering only TROPOMI pixels collocated in time and space with surface NO2 observations (Fig. 6; second column panels). Compared to the weekly profiles obtained with full TROPOMI sampling, the weekly profiles obtained with the so-called collocated sampling are found to be relatively similar. One difference is the slightly overestimated reduction of TrC-NO2 during the weekend in least urbanized areas. Also, the relationship between the urban cover fraction and the TrC-NO2 weekend effect is a bit more noisy compared to the results obtained over the entire domain, which could be a consequence of the much lower number of points.
The consistency of the weekly variability between TROPOMI TrC-NO2 and surface NO2 is typically better when considering NO2 surface mixing ratios at the hour of TROPOMI overpasses (dop), with reductions reaching −40 % on Sunday in urbanized areas. In the least urbanized areas, surface NO2 show larger differences between Saturday and Sunday compared to TROPOMI TrC-NO2. Among weekdays, both surface NO2 and TROPOMI TrC-NO2 also show relatively consistent variations, but again with slightly stronger differences over least urbanized areas.
3.4.5 Comparison with previous studies
Based on OMI (TROPOMI) observations during the period 2005–2017 (May 2018–April 2019), Stavrakou et al. (2020) found Saturday/Sunday relative decreases of −11 %/−32 % (−9 %/−30 %) in Barcelona, −0 %/−18 % (−8 %/−17 %) in Cordoba, −22 %/−36 % (−8 %/−34 %) in Madrid and +13 %/−10 % (−9 %/−25 %) in Valencia. Stavrakou et al. (2020) mentioned a flattening of the NO2 weekday–weekend variability over the North America, Europe and Japan due to (1) a decrease of the relative contribution of anthropogenic NOx emissions to total NOx emissions and (2) an increase of NO2 chemical lifetime driven by the reduction of total NOx emissions and the subsequent decrease of OH levels. Over the United States, this flattening of the weekend reduction is supported by the recent TROPOMI-based study of Goldberg et al. (2021a). For the specific case of the Iberian Peninsula, we investigated the long-term evolution of the weekend effect as observed at the surface, considering both urban background and traffic stations (here taken individually, not gridded as in the rest of our study). Results are given in Table G2 in the Appendix. Over the period 1990–2021, the mean annual surface NO2 mixing ratios during the weekend have indeed strongly decreased over Spain and Portugal, from about 10–40 ppbv in the 1990s (but fewer stations) to 10–20 ppbv in the 2000s and 5–10 ppbv over the most recent years. Nonetheless, even discarding the 1990s when results are less robust due to a limited number of stations, rather than a decrease, results highlight an increase of the weekend effect over the last 2 decades, although it should be emphasized that a substantial inter-annual variability is also affecting these results.
Reasons for such a trend are not clearly identified, but according to the official national inventory of Spain, from 2000 to 2020 the relative contribution of the road transport sector remained unchanged (35 %), slightly increased in the industry sector (from 14 % to 16 %) and in the other agricultural sources (from 7 % to 12 %), and strongly decreased in the public power sector (from 21 % to 5 %). This last decrease resulted from several European Union regulations (e.g., Directive 2001/80/EC, Directive 2010/75/EU) and the shift from coal to natural gas in the electricity sector. In terms of the emission weekly profile, the weekend reduction in the public power sector is much weaker than in other major emission sectors such as road transport (−25 % on Saturday–Sunday compared to the mean Monday–Friday, against −57 % for road transport). Therefore, its decreasing relative contribution may explain at least part of the increasing weekend effect of NO2 concentrations observed at the surface. In addition, heavy-duty vehicles have been banned from circulating on certain highways and entering main Spanish urban areas on Sundays (e.g., Real Decreto 1428/2003), which may have also contributed to the increasing weekend effect, at least on this specific day.
3.5 Monthly variability
3.5.1 TROPOMI-based TrC-NO2 monthly variability against urban land cover fraction
The monthly profiles of TROPOMI TrC-NO2 and surface in situ NO2 observations are shown in Fig. F1. As for the weekly variability, TrC-NO2 show a stronger monthly variability over most urbanized areas, with higher and lower values during winter and summer, respectively. When the urban cover fraction exceeds 90 %, the differences relative to the annual mean reach +50 % during winter and −40 % during summer. Over the least urbanized areas, they remain below ± 20 %. Again, a consistent picture is obtained when focusing only on the few cells with available surface observations (Fig. F1; second column panels), except over the least urbanized cells where the seasonal amplitude is slightly higher (but these specific profiles are expected to be less comparable given the very different number of accounted cells, 52 against 79 852).
3.5.2 Monthly variability in surface NO2 from monitoring stations
Surface NO2 observations over most urbanized areas also show higher values in winter and lower values in summer. A much larger amplitude of this monthly profile is found when considering surface NO2 at TROPOMI overpass times compared to daily mean or daily 1 h maximum. TROPOMI TrC-NO2 and surface NO2 at TROPOMI overpass times are very consistent over the least urbanized areas (from −25 % in summer to +30 % in winter). Over the more urbanized areas, the amplitude of the surface NO2 monthly profile is also in general agreement with TROPOMI, although slightly higher. The most noticeable differences concern the overall shape of the monthly profile since surface observations show a broad flat minimum during April–August (against June–August in TROPOMI) and a sharp maximum in December–January (against a relatively broad maximum in October–February in TROPOMI). Besides potential limitations in terms of robustness (due to the relatively low number of cells taken into account in these comparisons), these differences could originate from monthly variations of the representativeness of the surface observation over the TROPOMI pixel area, but could also reflect some monthly variability in the (normalized) NO2 vertical distribution.
The aforementioned broad flat minimum of NO2 found during summertime was not expected, given that lower road traffic emissions were expected in August, at least in areas not too strongly affected by tourism. A detailed analysis of the specific case of Madrid is provided in Sect. F in the Appendix. While traffic counting is indeed clearly dropping in August, we highlighted that surface NO2 observations were showing such a clear August minimum only up to the year 2017 but then transitioned to a broad flat minimum spanning over late spring and summer.
3.5.3 TrC-NO2 monthly variability over cropland
As previously mentioned, besides anthropogenic sources, soils are another well-known source of NO emissions (Butterbach-Bahl et al., 2013), especially over agricultural areas due to the application of fertilizers (Skiba et al., 2020). Monthly profiles of TrC-NO2 are given in Fig. 10 for different levels of crops cover fraction (see this crops cover fraction map in Fig. G3 in the Appendix). Interestingly, besides the expected larger values observed during cold months, a moderate but noticeable enhancement of TrC-NO2 becomes more visible in June–July as the crop cover fraction increases. We hypothesize that this increase is due to soil emissions, which are known to be very active in summer (Wang et al., 2021). This shows how TROPOMI can provide extremely valuable information given that very few surface NO2 monitoring stations exist in agricultural areas where this enhancement is likely significant; Fig. 10b, d shows the lack of stations over areas with crop cover fraction above 70 % (for reference, the slight summer increase in the TROPOMI data starts to be visible from a crop cover fraction of 60 %–70 %).
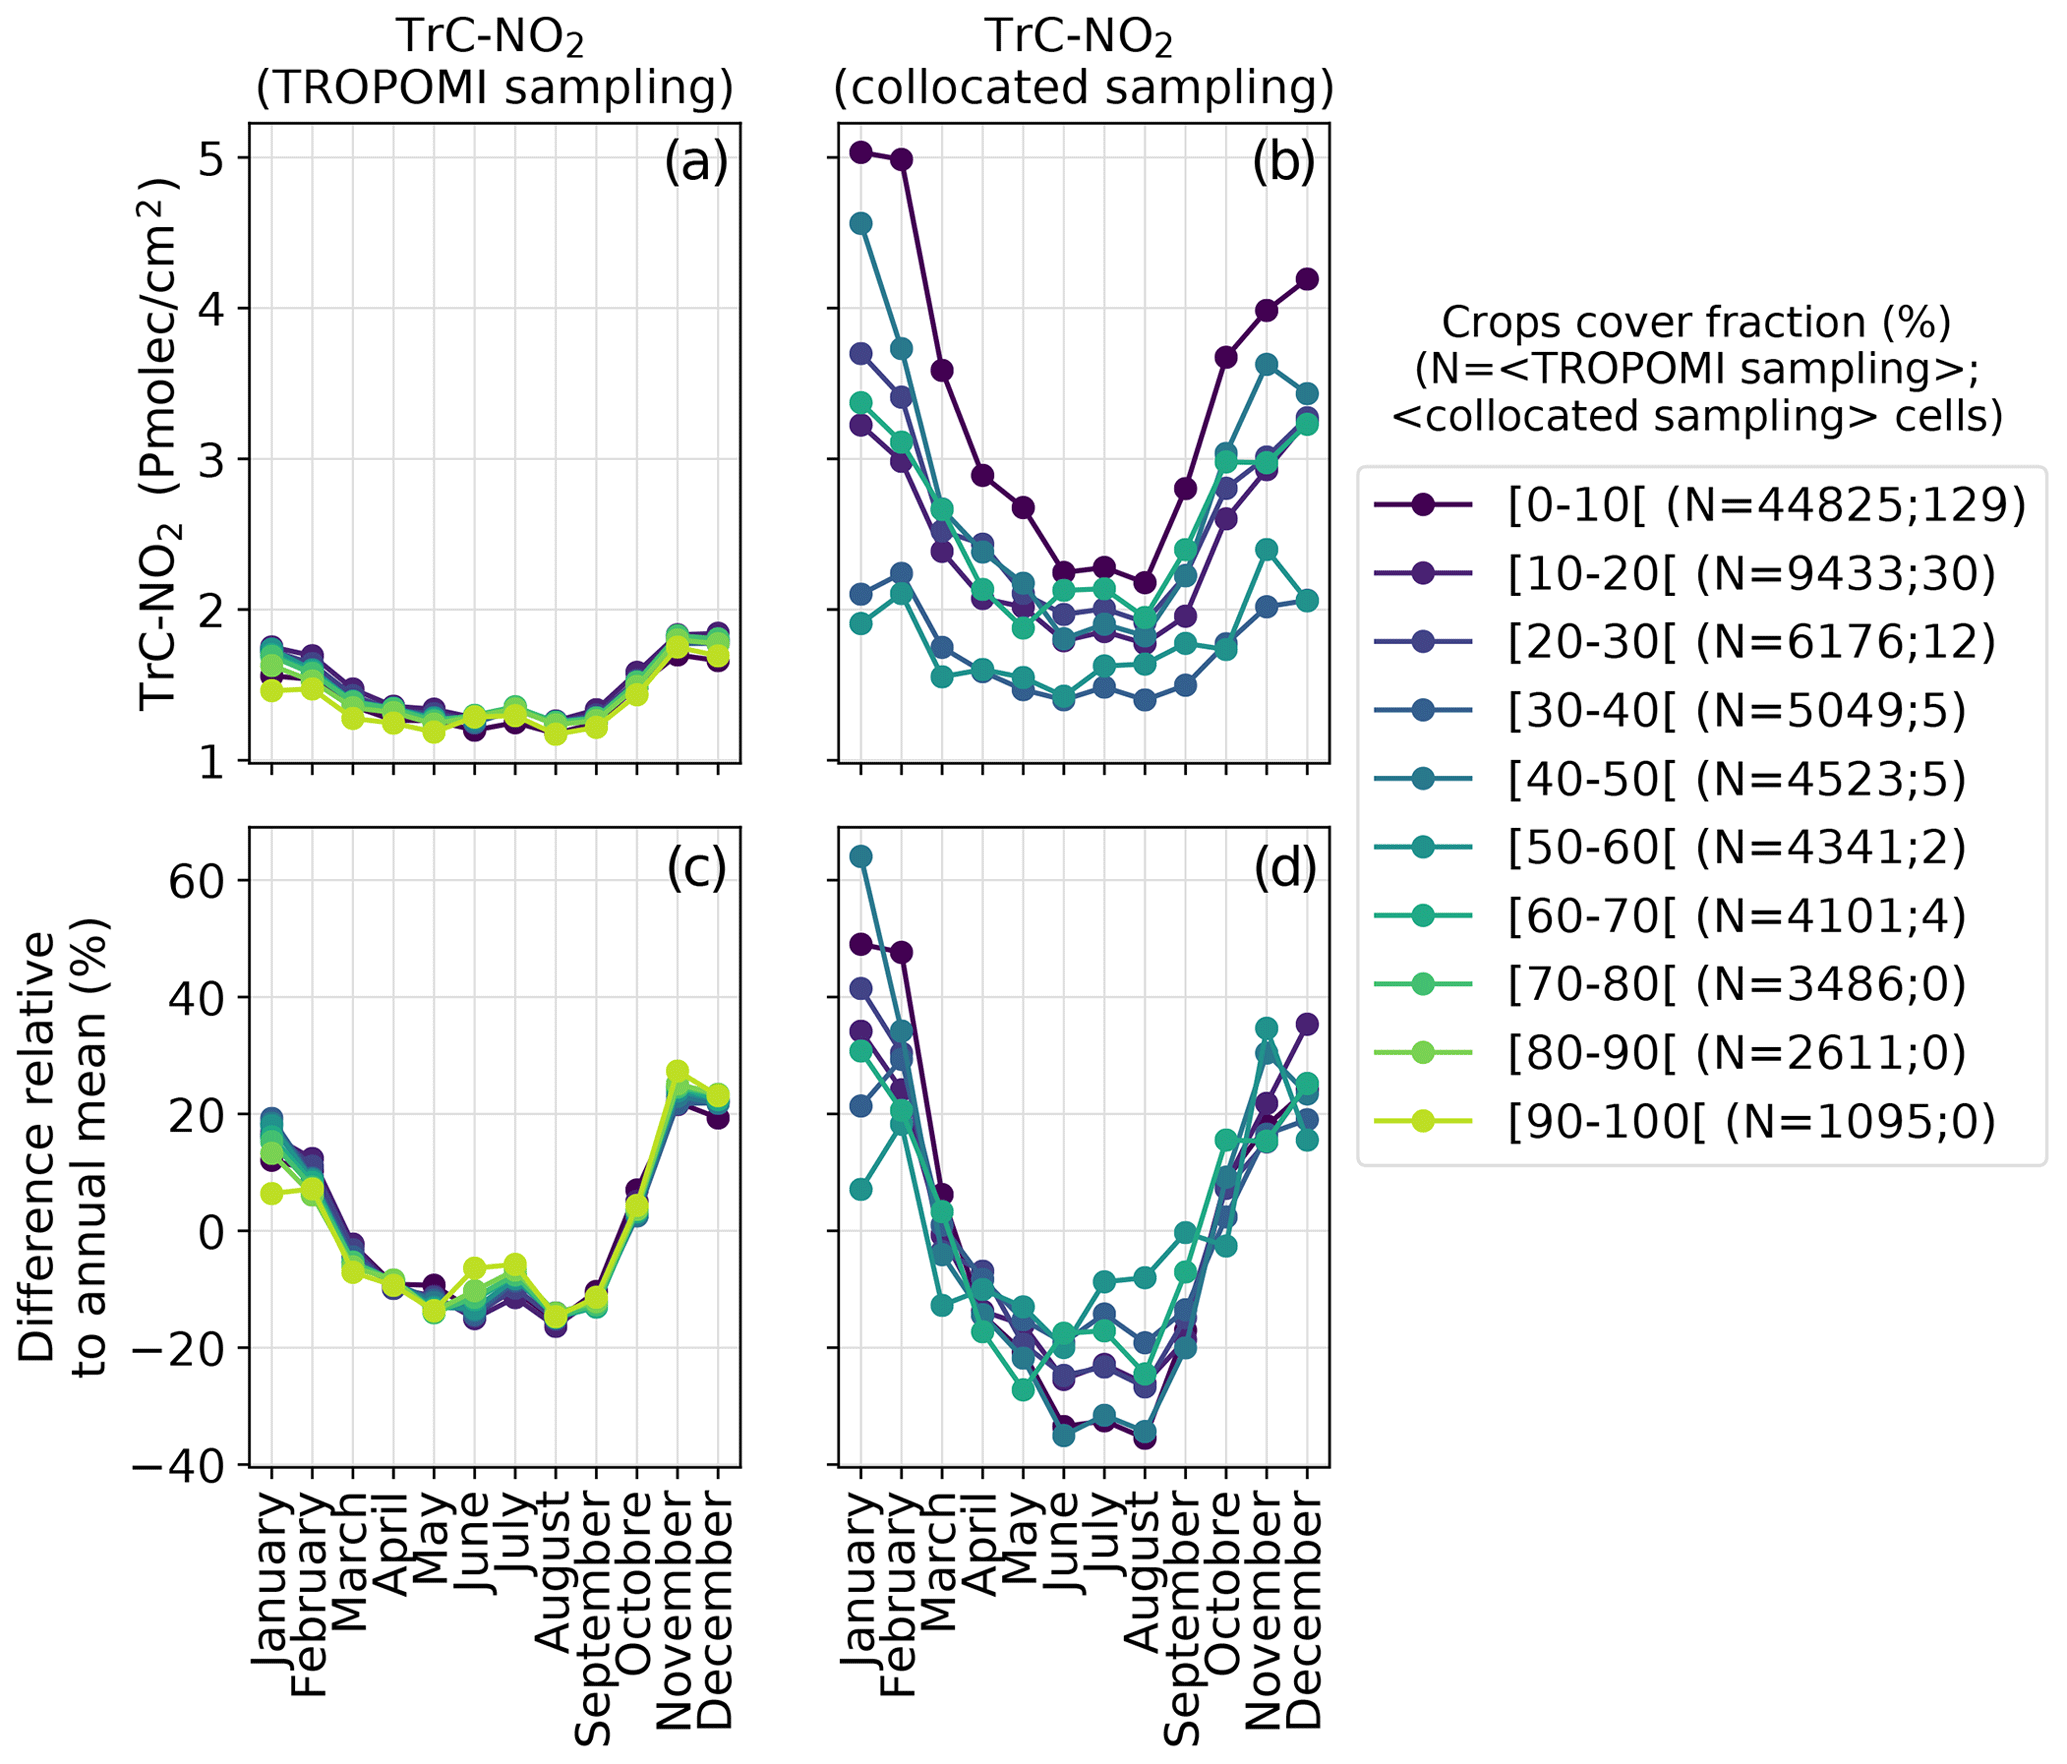
Figure 10Mean monthly profiles (a, b) and differences relative to annual mean (c, d), for different levels of crops cover fraction, considering the TROPOMI TrC-NO2 full dataset (a, c) and TROPOMI TrC-NO2 collocated with surface stations (b, d). The collocation of TROPOMI-based and surface-based observations is here performed both spatially and temporally (on a daily basis); the corresponding numbers of cells (averaged over the different months of the year) are indicated in the legend. Crops cover fractions are here binned in bins of 10 %.
3.6 Inter-annual variability
In this final section, we briefly investigate which NO2 inter-annual variability (IAV) is obtained from TROPOMI and surface monitoring stations, although the number of years is still quite limited. In addition, only years with data available in all 12 months are retained, thus excluding 2018. Results are given in Fig. 11, again for different levels of urban cover fraction. In order to partly overcome potential differences of data availability from one year to another, annual averages are here computed from monthly averages.
Considering the entire TROPOMI dataset (left panels), the strongest relative IAV is observed in most urbanized areas where TrC-NO2 clearly decreased from 2019–2020 but also from 2020–2021, although more smoothly. The relative IAV keeps showing such a pattern but continuously weakens as we look at regions of lower urban cover fraction. The only exception concerns the least urbanized areas that depict a small relative increase in 2020, but absolute variations are here very low.
TROPOMI results collocated with surface observations are roughly similar, in particular for most and least urbanized areas. For the intermediate urban cover fraction, results are slightly more varying but remain in general agreement with the variability obtained with the full TROPOMI dataset. The main difference concerns one specific bin of urban cover fraction (30 %–40 %) showing a substantial increase in 2021. Overall, although the amplitude of the relative IAV can be a bit different from TROPOMI for specific ranges of urban cover fraction, the IAV of collocated surface NO2 mixing ratios at the dop timescale remains quite consistent, with a substantial decrease from 2019–2020 and a weaker decrease from 2020–2021. Interestingly, in agreement with TROPOMI, a slight increase in 2021 is also observed for urban cover fractions of 30 %–40 %. The most noticeable difference here concerns the least urbanized areas, where surface NO2 keep showing this persistent decrease all along the 3 years, but as for TROPOMI, absolute variations here are very small so differences might not be significant.
Results at the d1max and d timescales also appear quite consistent, the main difference being that NO2 mixing ratios in 2021 often remain similar or slightly higher than in 2020. Therefore, the whole diurnal profile of surface NO2 does not follow exactly the same IAV, which is likely related to the fact that all emission sectors (each of them following its own IAV) are not contributing equally all along the day.
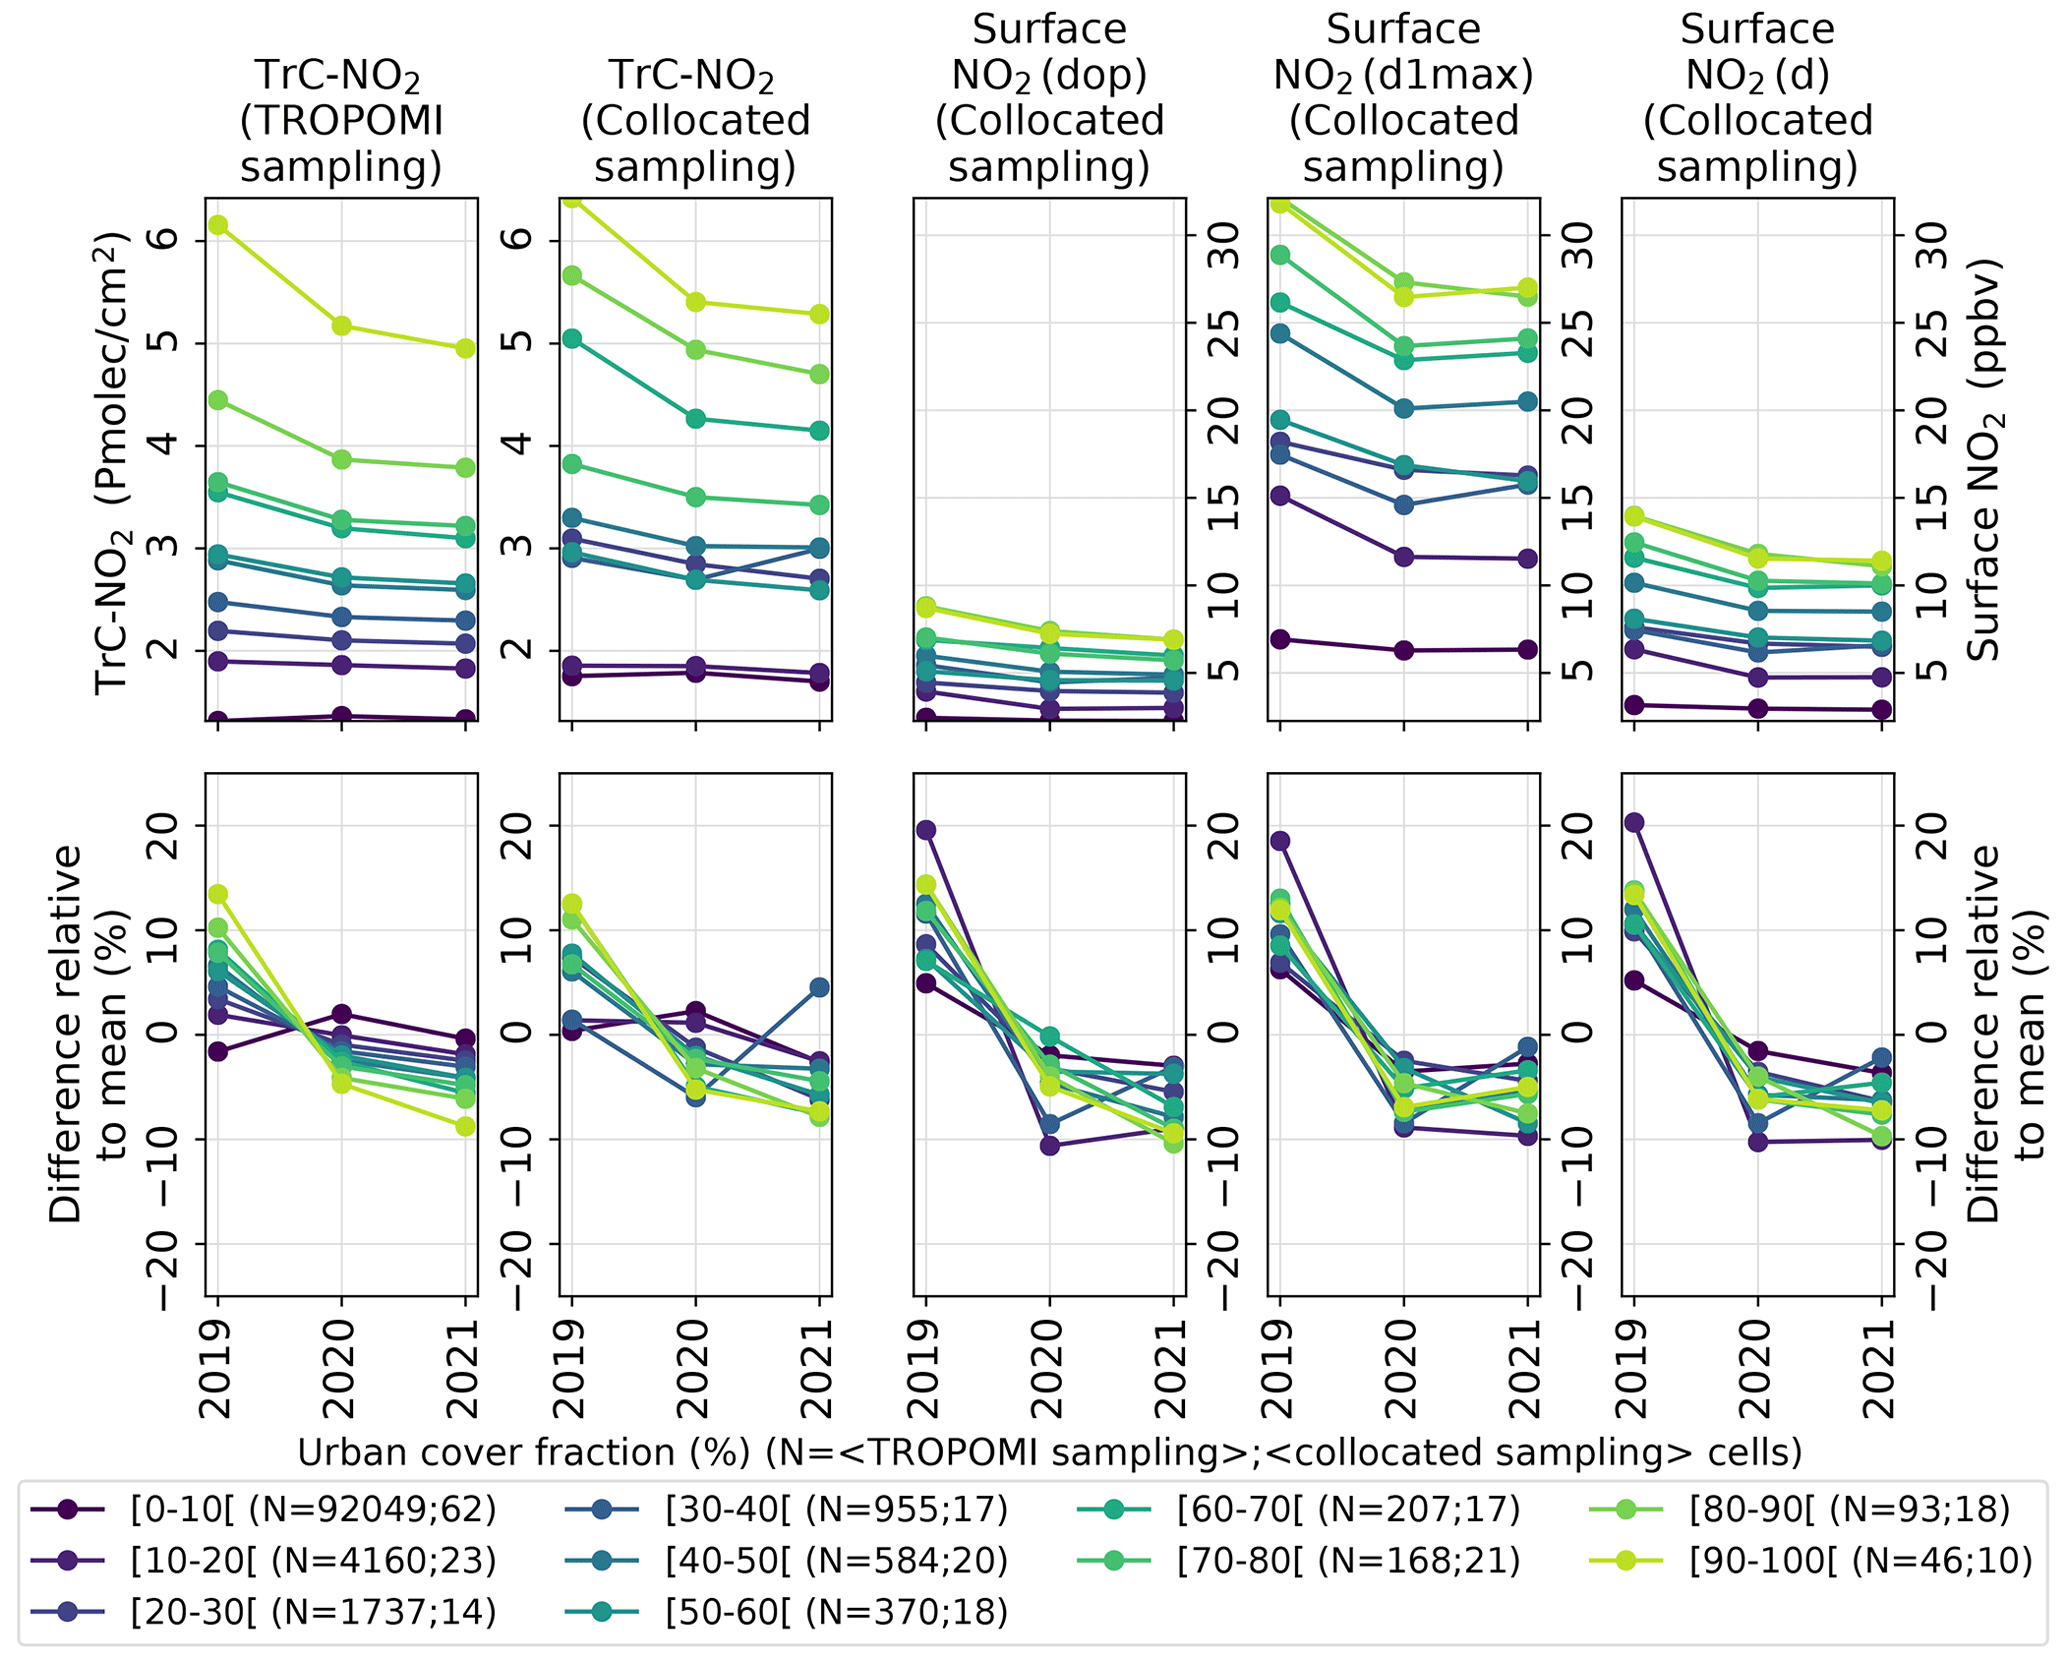
Figure 11Mean annual profiles (top panels) and differences relative to multi-annual mean (bottom panels) for different levels of urban cover fraction, considering the TROPOMI TrC-NO2 full dataset (left panels) and TROPOMI TrC-NO2 collocated with surface stations (right panels). The collocation of TROPOMI-based and surface-based observations is here performed both spatially and temporally (on a daily basis); the corresponding numbers of cells (averaged over the different months of the year) are indicated in the legend. Crops cover fractions are here binned in bins of 10 %.
In this study, we comprehensively analyzed the TROPOMI TrC-NO2 observations over the Iberian Peninsula, using the recently developed PAL product to ensure consistency across our period of study (2018–2021).
The potential of TROPOMI for supporting the monitoring of NO2 pollution primarily depends on its ability to provide a sufficiently large number of observations, which is intrinsically related to the cloud coverage affecting the Peninsula. Over 2018–2021, the data availability was estimated to range between 30 % and 80 % depending on the season and location. Importantly, it was found to be high enough for providing space-based information on NO2 pollution during 66 % of the days and locations where the NO2 target threshold is exceeded; this coverage increases up to 80 %–100 % for high O3 episodes in which local NOx play a key role. On a longer-term perspective and for monitoring purposes, it appears important to watch the evolution of the data availability and its impact of climatological TrC-NO2, which appears especially important over Spain where decreasing trends of total cloud cover were reported by Sanchez-Lorenzo et al. (2012) and Sanchez-Lorenzo et al. (2017) since the 1960s (despite an increasing trend in fall).
Analyzed at both regional and intra-urban scales, the climatological distribution of TrC-NO2 over the Iberian Peninsula highlights the strongest pollution hotspots over Madrid, closely followed by Barcelona (around 7–9 Pmolec cm−2), while the other cities typically show lower TrC-NO2 levels (below 5 Pmolec cm−2). As an interesting case study, TROPOMI observations were able to capture an extreme and very atypical pollution episode in Madrid during the Filomena snowstorm, predominantly attributed to residential heating NOx emissions combined with very low dispersive conditions during several days, in the absence of significant traffic emissions (yet the dominant source in the city). Besides urban areas that are typically covered by at least a few surface monitoring stations, the strongest potential of TROPOMI likely lies in its observations over rural areas and seas. This appears especially important for the Iberian Peninsula due to an atypically low population density (and thus very scarce surface monitoring network) in a large part of the interior lands excepting Madrid – a phenomenon typically referred to as the “empty Spain” (Llorent-Bedmar et al., 2021) – and the conversely high population density on the coast, often close to major international shipping routes relating the Atlantic Ocean to the Mediterranean Sea where intense NOx emissions adversely impact the nearby populations, notably through the production of tropospheric O3. More specifically in rural areas, we highlighted the potential of TROPOMI for detecting the still highly uncertain natural soil NO emissions prevailing notably over agricultural areas. In these NOx-limited regions where no surface stations exist, TROPOMI offers an outstanding source of information for supporting the chemistry-transport modeling efforts and ultimately better characterizing this emission source of potentially strong impact on O3 production (Lupaşcu and Butler, 2019; Lu et al., 2021).
We characterized in detail the weekly variability of TrC-NO2 and its link with the level of urbanization, highlighting a clear flattening of the weekend NO2 reduction (relative to weekdays) from −30 % to −40 % over the most urbanized areas to −10 % over the least urbanized areas. We attributed this persistent small weekend effect (on average) over rural areas to the short- and medium-range transport from the NO2 hotspots and to a small weekly variability in the (low) total (anthropogenic and natural soil) NOx emissions. Focusing on a set of large agglomerations, we found that the weekend effect does not systematically occur in the city center but can in some cases (e.g., Madrid, Barcelona) be observed in some specific suburbs, which could reflect a stronger relative contribution of commuting to total NOx anthropogenic emissions. Again, such discoveries at an intra-urban scale are made possible by the high spatial resolution of TROPOMI and should support the development and validation of both emission inventories and chemistry-transport models. More specifically, we showed the potential of TROPOMI for supporting the development and evaluation of the emission profiles used to disaggregate the annual anthropogenic emissions provided by emission inventories. However, using TROPOMI observations to better constrain the weekly disaggregation profiles require additional information (or assumptions) to take into account the differences of diurnal variability between weekdays and weekend. Indeed, polar-orbiting satellites like S5P with at best one single overpass every day unfortunately cannot provide relevant information, at least over the Iberian Peninsula. Over higher-latitude regions, several S5P overpasses overlap every day, which could in principle provide more insights on the diurnal variability of NO2, but other specific limitations arise (e.g., more frequent presence of snow and clouds, high solar zenith angles, short daylight duration during a large part of the year) (Schneider et al., 2021). Geostationary missions such as Sentinel 4, TEMPO and GEMS are expected to provide more useful information at the diurnal scale.
In terms of monthly variability, we highlighted a clear increase of the seasonal amplitude in most urbanized areas. We also discovered that the relatively sharp minimum NO2 that was typically occurring in August has evolved over the most recent years toward a broader minimum spanning from late spring to late summer (this change started in 2018, before some additional variability was introduced by the COVID and post-COVID situation). Despite an overall consistency, we highlighted some specific differences between surface NO2 and TROPOMI TrC-NO2, especially during spring and fall. Over the short period 2019–2021, we also found a reasonable consistency of the inter-annual variability of NO2 between TROPOMI and surface monitoring stations, especially over most urbanized areas.
Although some differences between TROPOMI and surface monitoring stations are not yet clearly understood, this study demonstrates the importance of analyzing jointly space-based and surface-based observations whenever possible. This may provide additional insights on the vertical distribution of NO2, which remains very poorly constrained due to the critical lack of routine airborne observations, although this might change in the near future with the planned In-service Aircraft for a Global Observing System (IAGOS-CORE) routine NOx measurements on board commercial aircraft (Berkes et al., 2018).
Following this observation-based study, the important next step is to assess the ability of state-of-the-art chemistry-transport models fed with the most recent anthropogenic and natural emissions to reproduce the spatio-temporal variability of TrC-NO2 over the Iberian Peninsula, including its dependency on urban and crops cover fraction. Douros et al. (2022) recently highlighted some substantial discrepancies between the CAMS regional air quality ensemble and TROPOMI TrC-NO2, especially during wintertime, which could nonetheless point toward issues in both models and TROPOMI retrievals. Considering the aforementioned lack of surface monitoring stations in agricultural areas but the potentially strong impact of soil NO emissions on the production of tropospheric O3, evaluating CTMs against TROPOMI in these specific areas is of particular interest, although this likely comes with some challenges due to the relatively weak and diffuse signal of this specific emission source compared to other anthropogenic sources. Finally, another important aspect to evaluate is the temporal disaggregation currently used to distribute annual anthropogenic emissions at a monthly and daily scale. Although it is often not possible to isolate specific emission sectors, a joint analysis with CTMs and TROPOMI observations can help identify the most critical deficiencies and therefore guide the future efforts for improving these temporal profiles, especially in the sectors (e.g., manufacturing industry, agriculture) where only limited information is available on the temporal variability.
Table A1Statistics on the pixel dimensions of a given TROPOMI L2 file before and after 6 August 2019. pX here corresponds to the Xth percentile.
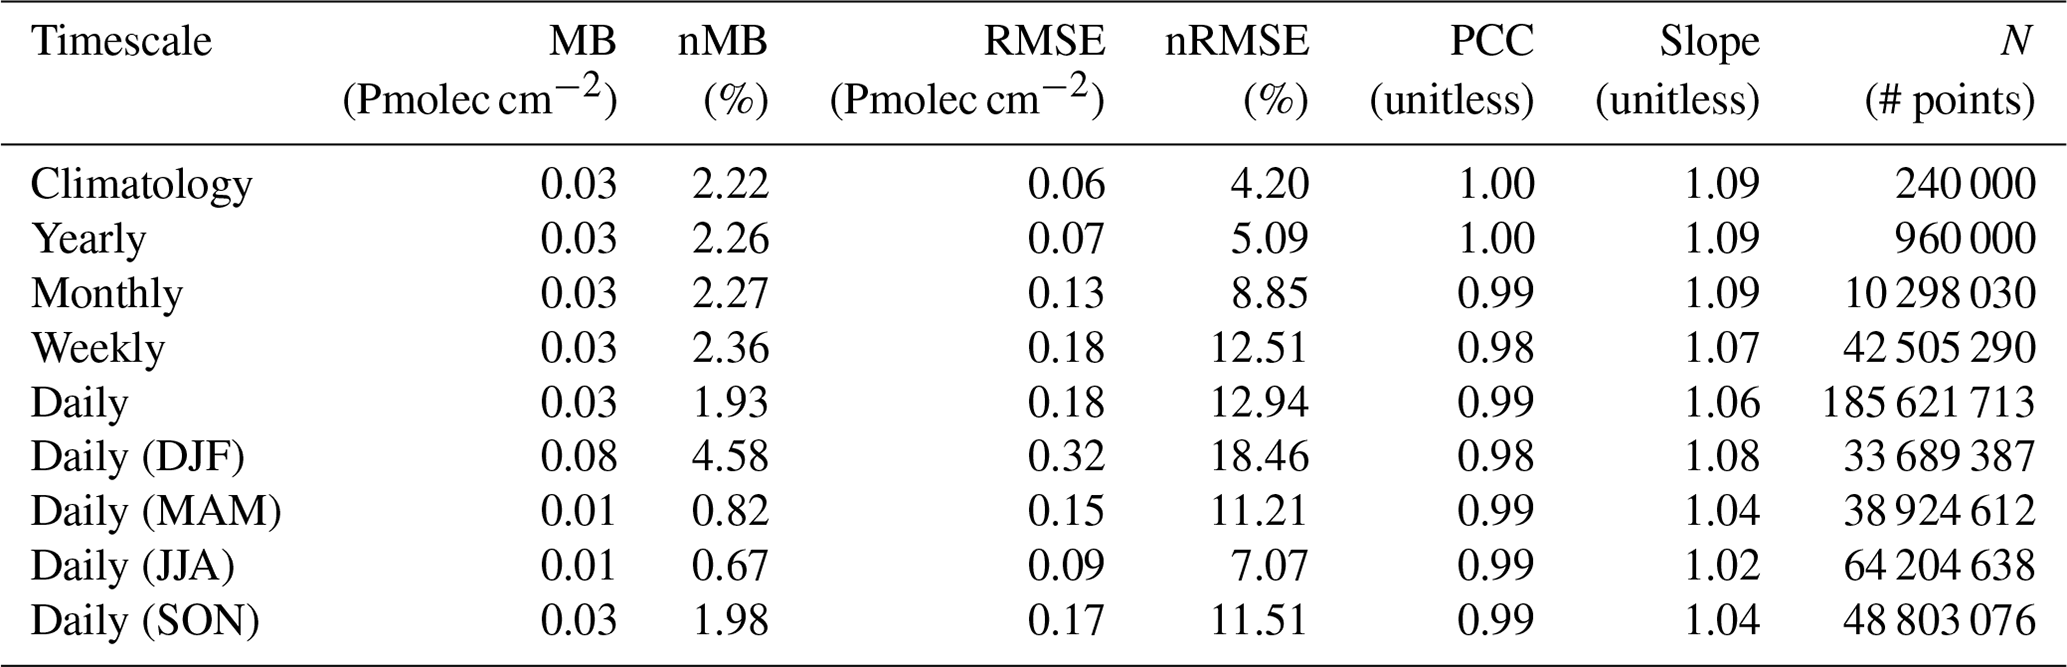
In this section, we compare PAL and OFFL + RPRO TROPOMI TrC-NO2 regridded products over their overlapping period 1 May 2018–14 November 2021, focusing on the Iberian Peninsula domain. Taking arbitrarily OFFL + RPRO as the reference, we computed the absolute and normalized mean bias (MB and nMB), the absolute and normalized root mean square error (RMSE and nRMSE), the Pearson correlation coefficient (PCC) and the PAL-versus-OFFL + RPRO linear regression slope (slope) (the formulas of these metrics are given in Sect. C in the Appendix). Results are summarized in Table B1.
Overall, both datasets depict a very consistent spatial and temporal variability, with PCC above 0.98. As expected from its official documentation (https://data-portal.s5p-pal.com/product-docs/no2/PAL_reprocessing_NO_2_v02.03.01_20211215.pdf, last access: 1 September 2022), PAL is showing slightly higher TrC-NO2 values than OFFL + RPRO, with normalized mean differences around +2 %. The PAL-versus-OFFL + RPRO linear regression slopes range between 1.06 and 1.09 depending on the timescale. Therefore, the positive increment of TrC-NO2 in PAL tends to be stronger under high TrC-NO2 conditions. However, it is worth noting that this increment does not strictly depend on these TrC-NO2 levels, as illustrated by the variability found among different cities, with mean relative differences between PAL and OFFL + RPRO reaching +15 %, +7 %, +5 % and +5 % in the city center of Barcelona, Porto, Madrid (yet the most polluted city) and Lisbon, respectively. The root mean square differences range between 4 % at a climatological scale (i.e., when comparing the mean TrC-NO2 maps) and 13 % at a daily scale. Consistently with the PAL documentation, the differences between both dataset substantially depends on the season, with larger differences in winter (nMB, nRMSE and slope of +5 %, 18 % and 1.08, respectively) than in summer (nMB, nRMSE and slope of +1 %, 7 % and 1.02). Note that according to the documentation, the differences are much larger over polluted areas such as China (5 %–10 % in summer, up to 20 %–50 % in winter). These differences are notably due to an improved representation of the cloud properties (cloud pressure and cloud radiance fraction) in the FRESCO cloud processor (the mean cloud pressure being substantially overestimated in OFFL + RPRO) (van Geffen et al., 2022b; Compernolle et al., 2021).
Table B1Statistics of TROPOMI TrC-NO2 PAL products compared to OFFL + RPRO (taken here arbitrarily as the reference).
As mentioned in Sect. 2.1, the TROPOMI TrC-NO2 dataset used in the rest of the study is composed of the PAL products until 14 November 2021 combined with the OFFL products after 15 November 2021 and can thus be seen as fully consistent over the period 2018–2021.
The statistical metrics used in this study are defined as follows:
with mi and oi the predicted and observed mixing ratios, and their corresponding mean, σm and σo their corresponding standard deviation, and N the number of points.
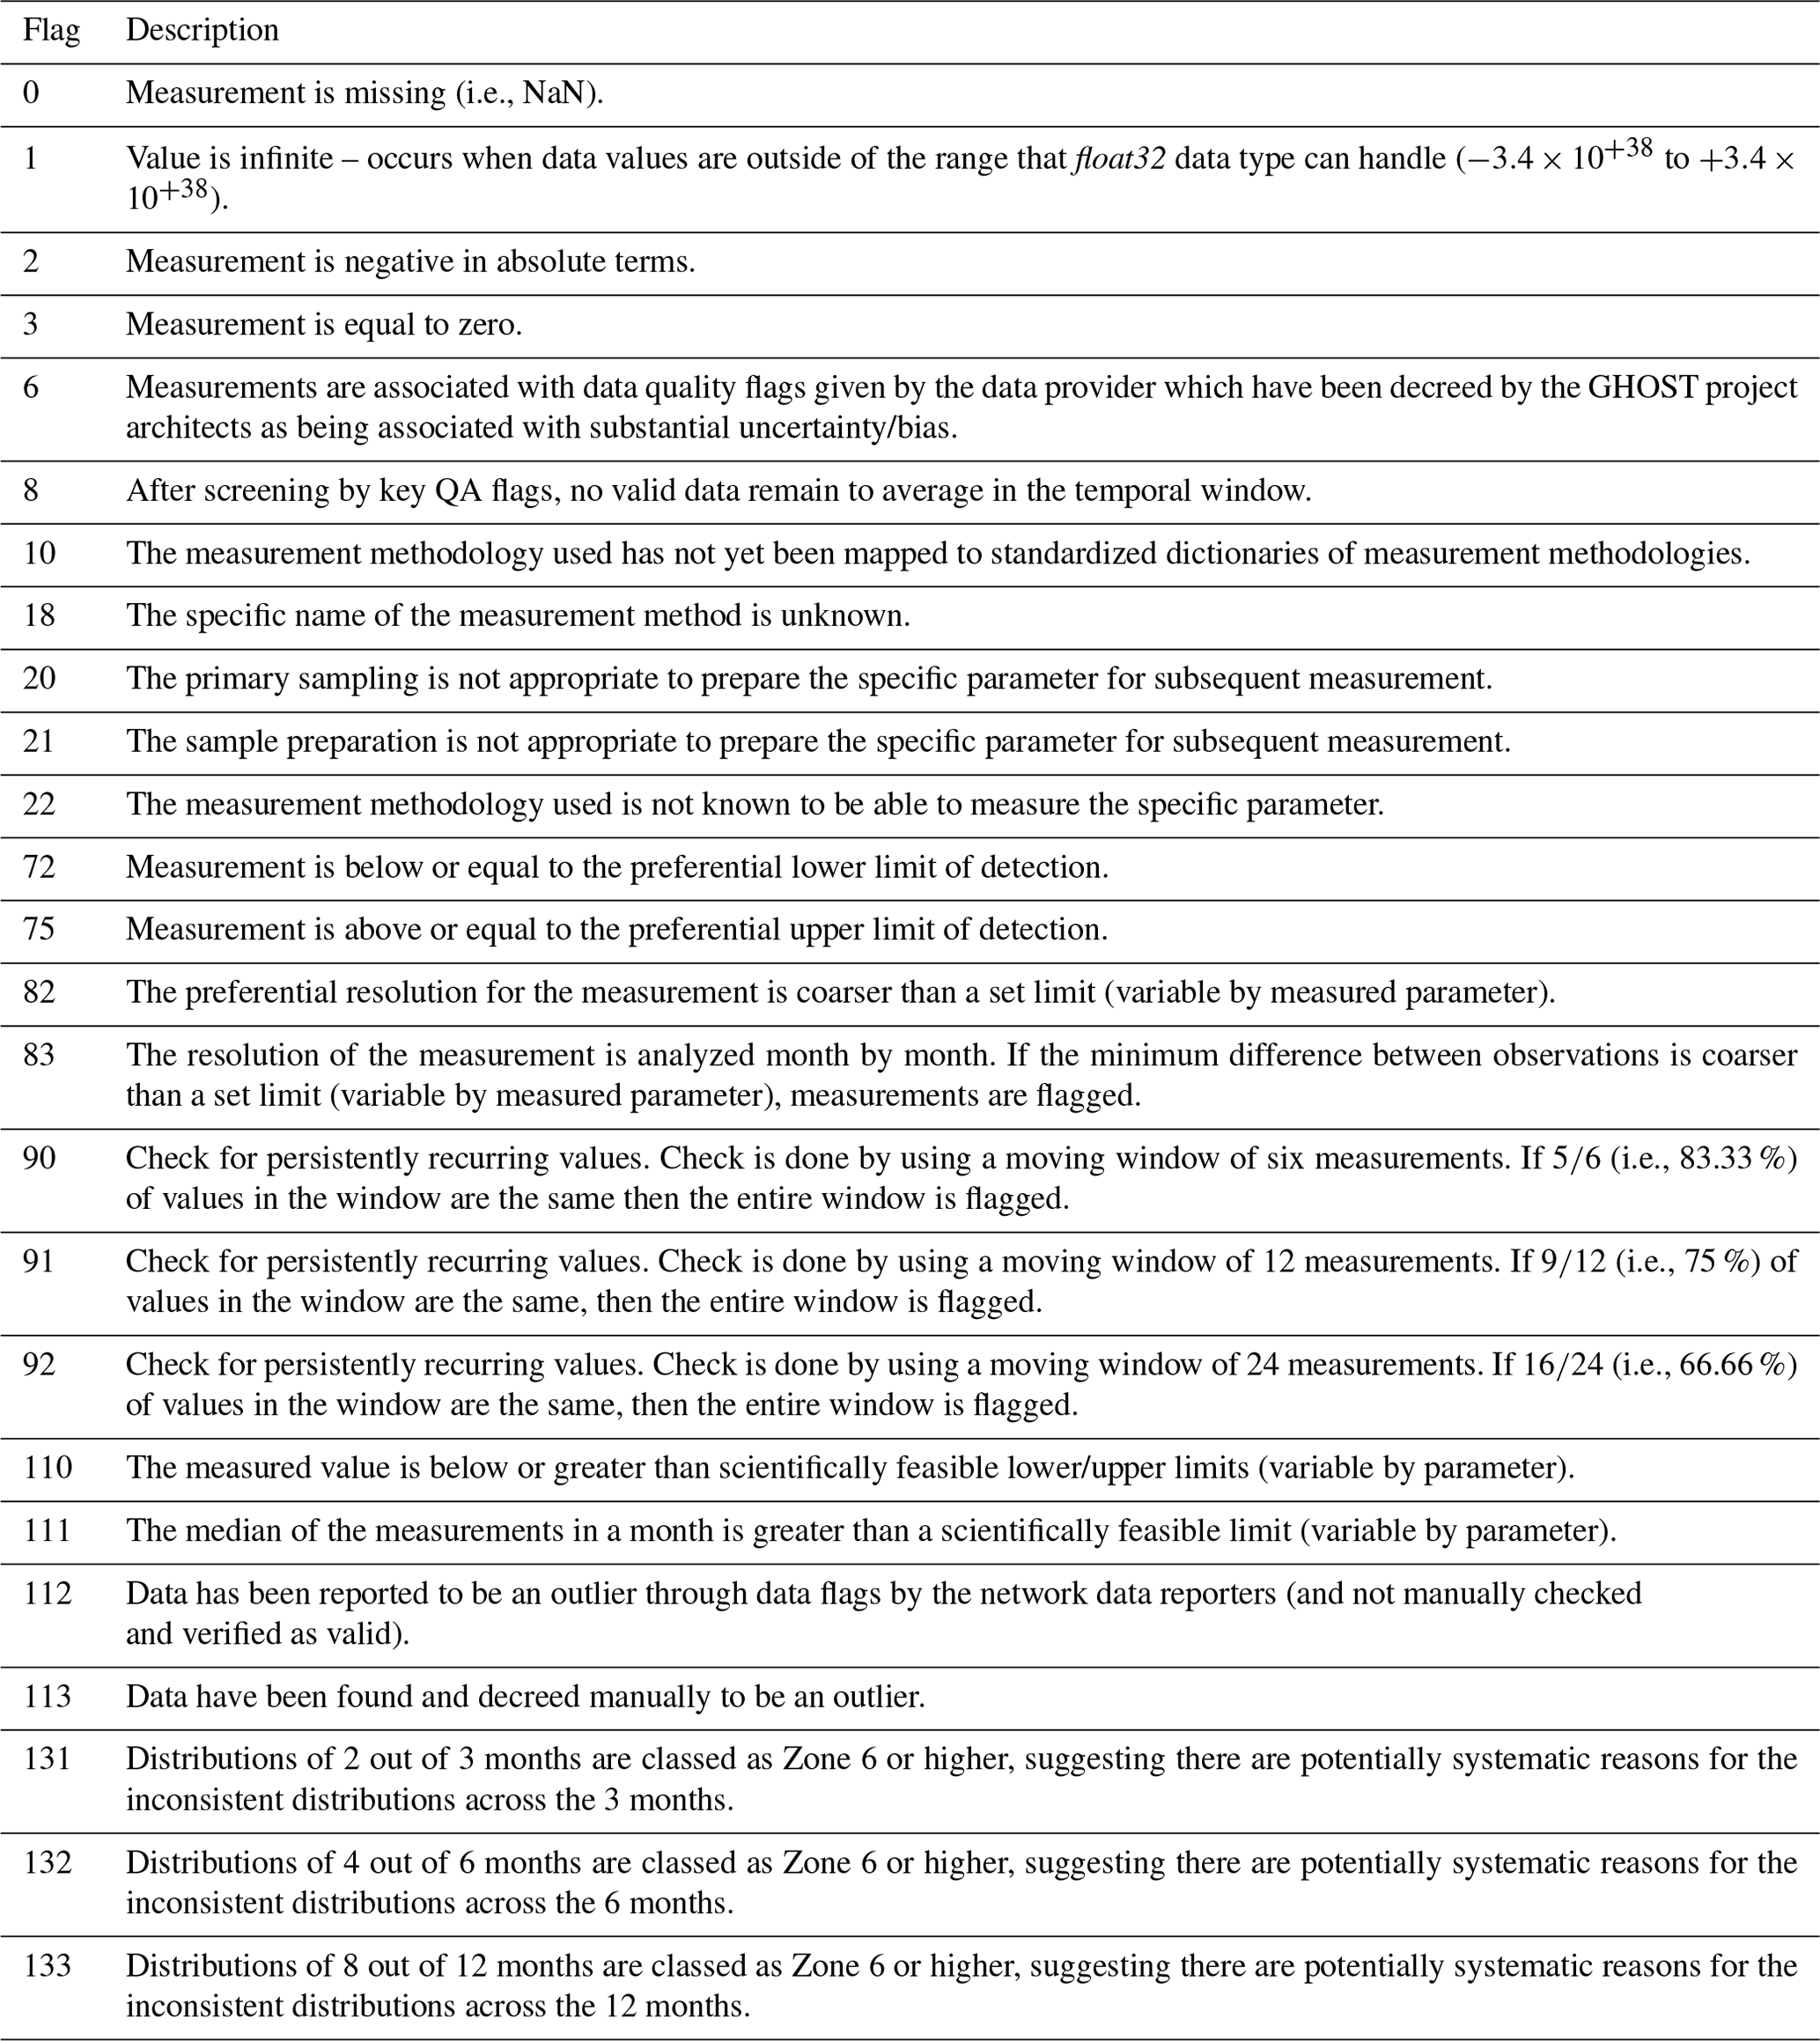
Using the metadata available in GHOST (Globally Harmonised Observational Surface Treatment), a quality assurance screening is applied to NO2 hourly observations. A description of the GHOST quality assurance flags used here is given in Table D1.
Table D1Description of the GHOST quality assurance flags used on the EEA air quality observational dataset.
The historical maximum TrC-NO2 across the Iberian Peninsula reached 63 Pmolec cm−2. Interestingly, it occurred in early January 2021 in Madrid a few days after Filomena – the largest snowstorm since 1971 – hit central Spain (Tapiador et al., 2021) (see the day-to-day evolution of TrC-NO2 during this event in Fig. E1). During and right after this extreme event, local road transport NOx emissions were very low due to an exceptional snow coverage, preventing cars from circulating in business-as-usual conditions. On average over the 7–11 January 2021, traffic count observations over Madrid indeed show a reduction of 70 % compared to the same period in 2019 (Madrid open data portal, https://datos.madrid.es/, last access: 1 August 2022). In spite of that, TROPOMI measured unusually high TrC-NO2 values (pixels with substantial snow coverage are expected to be already filtered with the qa_value), which thus appears to be explained by the accumulation of NO2 pollution originating from other sources, first and foremost residential combustion for heating (mainly with gas in Madrid) in a very stable and shallow boundary layer (whose daily mean height ranges between 42 and 108 m during these days according to ERA5 reanalysis). Similarly, very high surface NO2 mixing ratios were observed by surface stations during this event, with daily mean values often exceeding the 99.9th percentile (48 ppbv) over all surface NO2 observations over the domain and period of study. As this high TrC-NO2 was measured in pixels close to (filtered) cloudy pixels, it is also worth mentioning here that it might be affected by some biases related to cloud shadowing effects. Indeed, recent studies on the 3-dimensional cloud structure and the corresponding impact of shadowing on NO2 retrievals in pixels neighboring clouds estimated that biases typically remain below 10 % for low (below 40°) solar zenith angles but can reach tens of percent for larger angles (Yu et al., 2022; Emde et al., 2022; Kylling et al., 2022). In addition, the residual presence of snow (unfiltered with qa_value threshold of 0.75) might also partly affect the extreme TrC-NO2 values observed during that period.
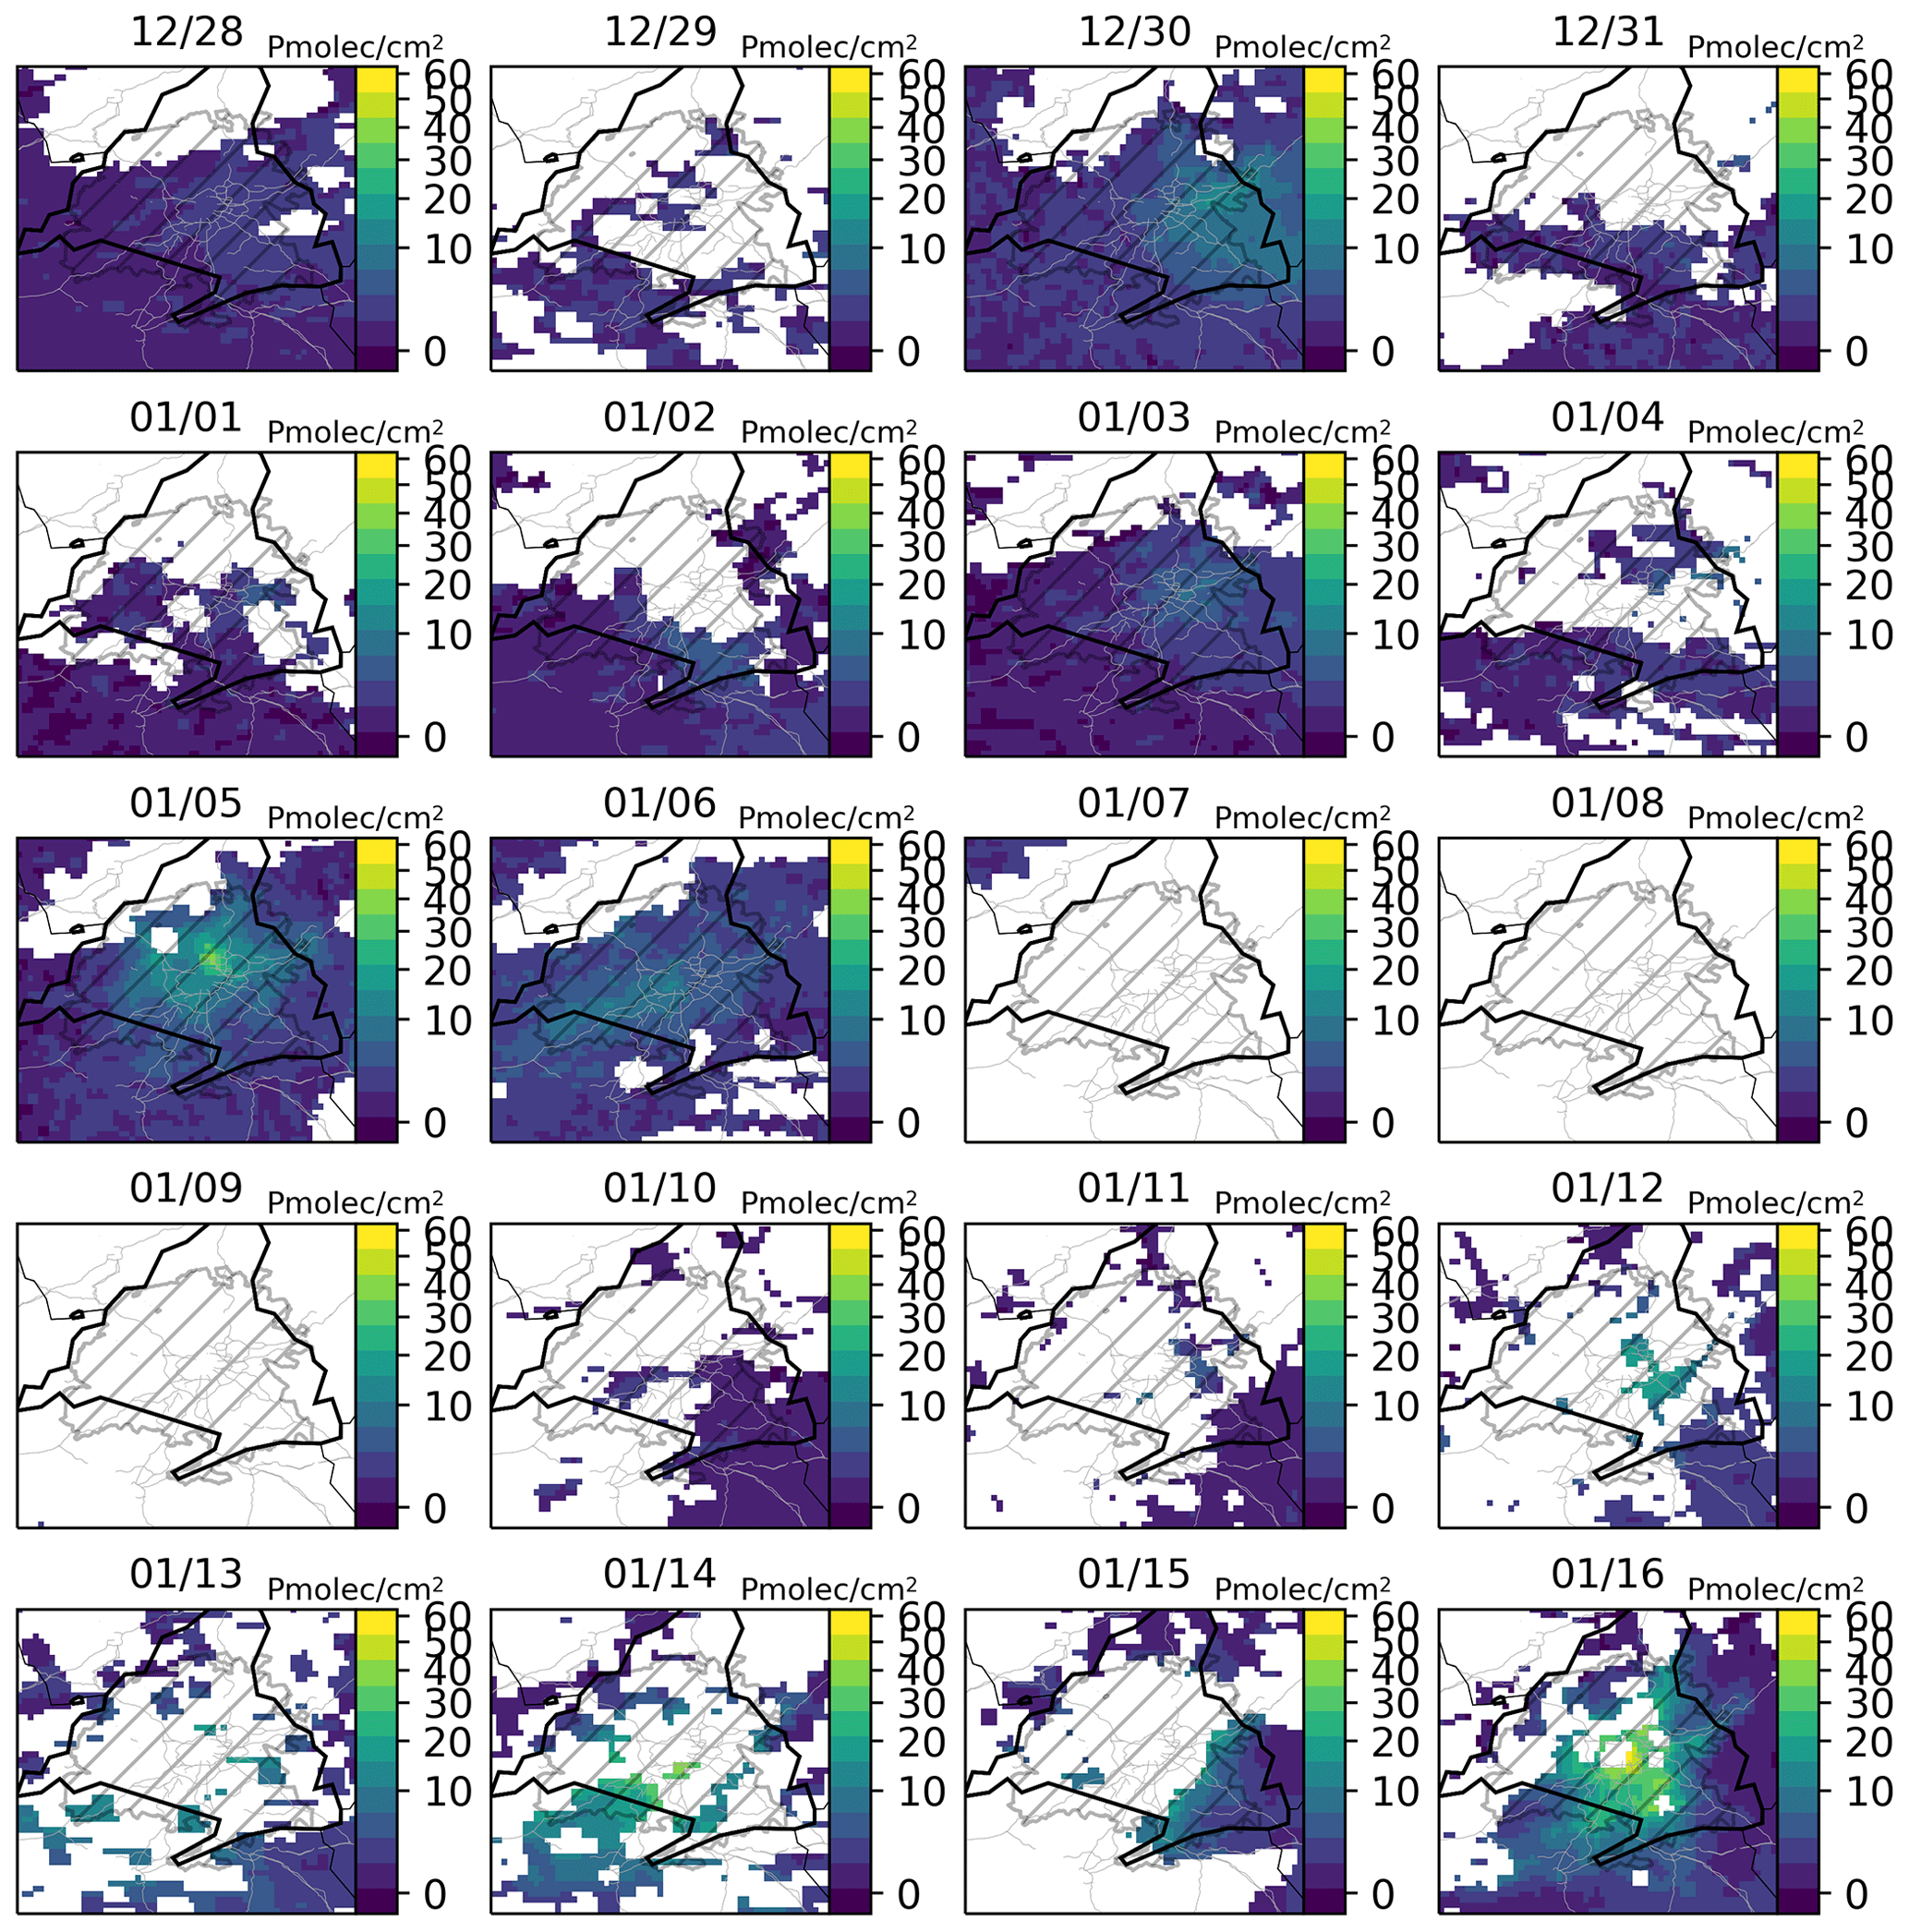
Figure E1TrC-NO2 measured by TROPOMI over the Madrid region during the two weeks preceding the 16 January 2021, the day of historical maximum TROPOMI TrC-NO2 over the Iberian Peninsula. The Filomena snowstorm occurred mainly between 7–11 January 2021 (cloudy). Note that the color scale is not linear. Black lines, grey lines and hatched areas correspond to administrative borders, Spanish major roads and functional urban areas, respectively (sources: see Sect. 2.4).
We found a broad flat minimum over most urbanized areas during summer. Such a result was not expected given that road transport in many cities is known to be substantially reduced in August when many people go on holidays, although this can be at least partly compensated by the arrival of national and international tourists, especially on the Spanish coast. In this section, we investigate more deeply this aspect, using the case of Madrid as an illustration.
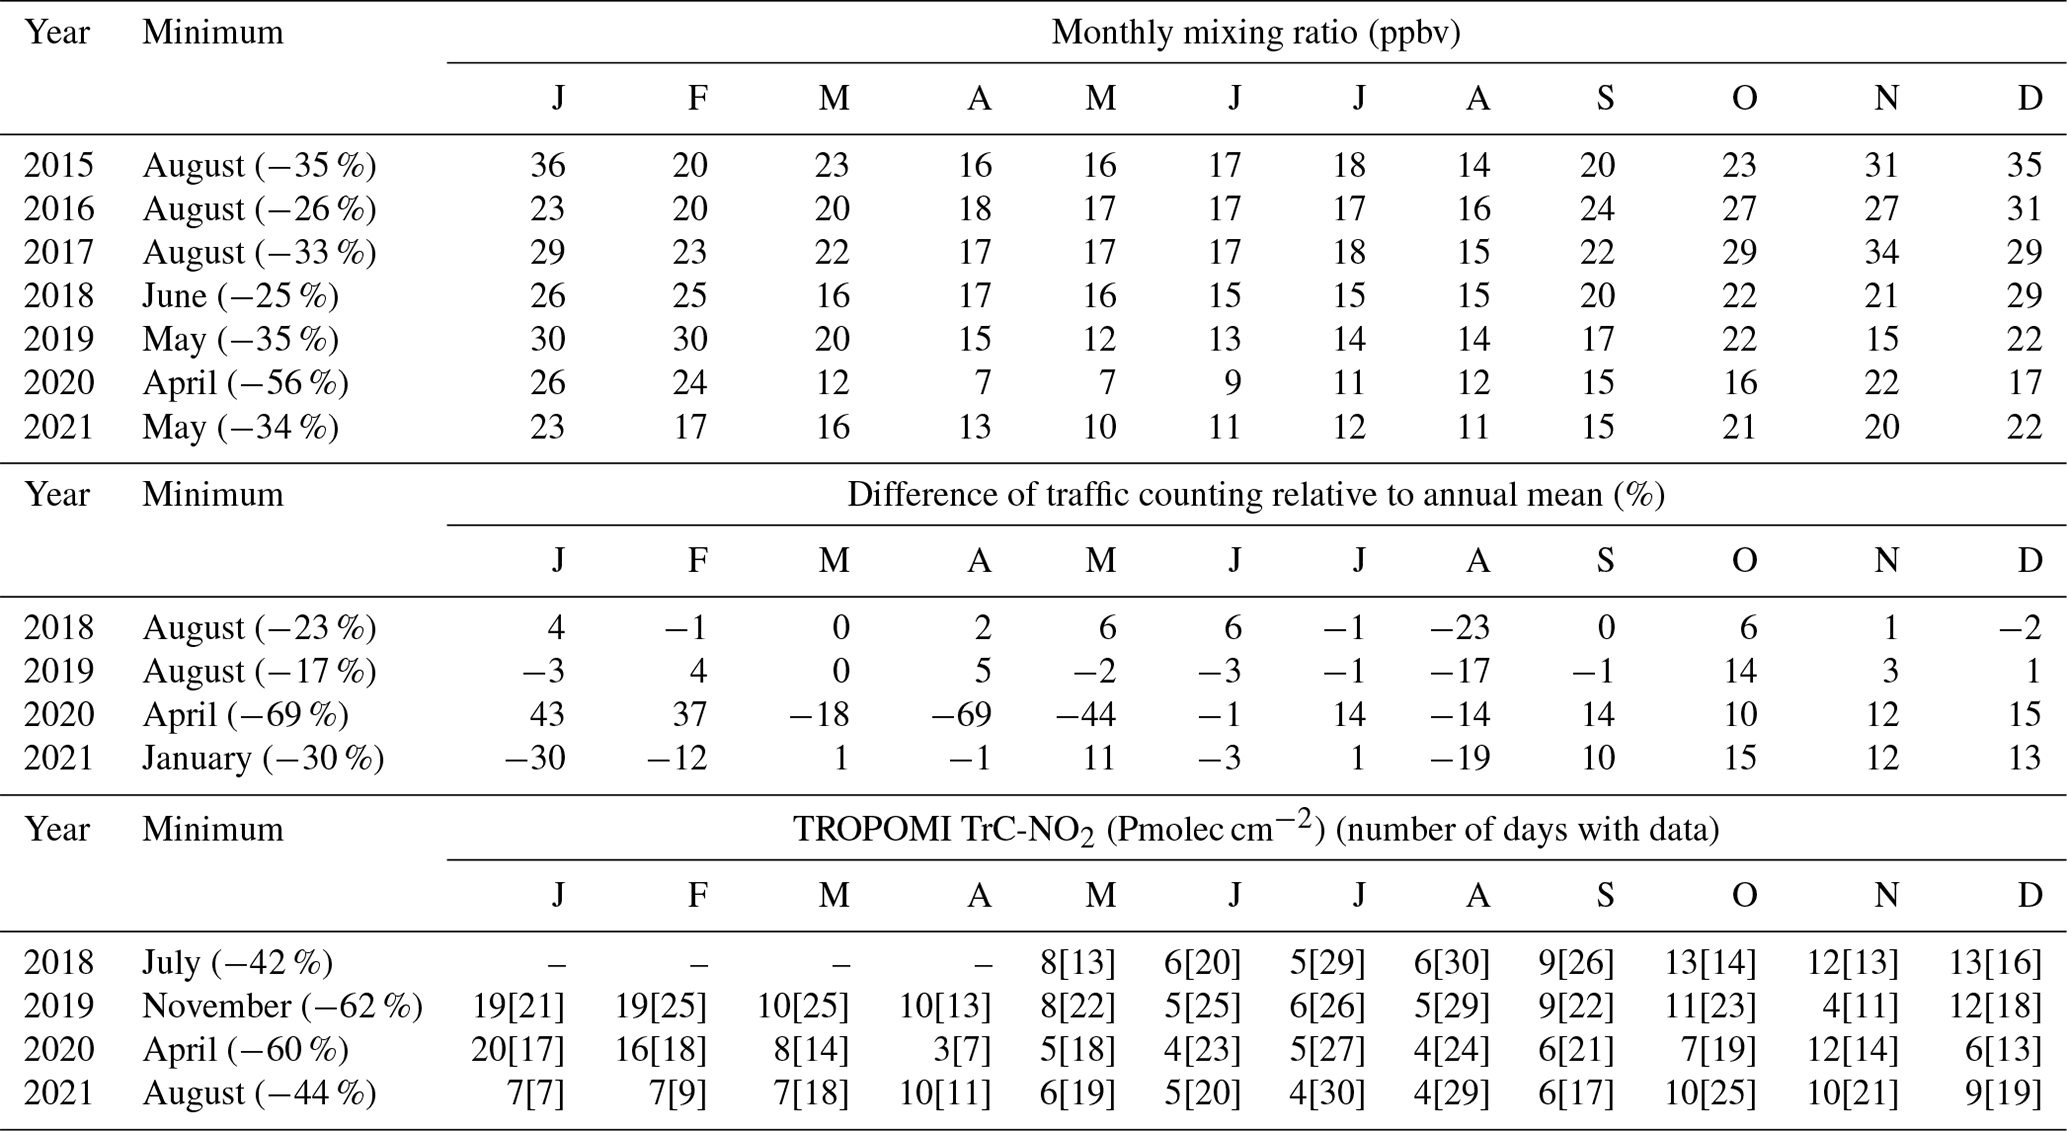
According to ETR and FRONTUR information, the net annual movement of Spanish residents toward the Madrid region over 2015–2021, expressed in number of travelers and days spent in the region, is always minimum in August (−38 735 640 person days on average), only slightly compensated by the arrival of international tourists (around +2 362 590 person days, considering a mean duration of 6 d). This typically induces a clear drop of traffic intensity during August in Madrid, at least in the pre-pandemic era (Table F1, middle part); traffic counts in Madrid are freely available on the Madrid open data portal (Tráfico. Histórico de datos del tráfico desde 2013 dataset available on https://datos.madrid.es/, last access: 1 August 2022). Combined with the fact that road transport remains the dominant NOx emission sector in Madrid (42 % of total NOx emissions in 2019, in constant decrease over the last decades, according to the official emission inventory of the Madrid region), this naturally implied a minimum of surface NO2 concentrations typically in August, as shown until 2017 (Table F1, top part). However, starting from 2018 (therefore, before the COVID-19 outbreak), the picture starts to be more ambiguous and variable, with some de-correlations appearing between traffic intensity monthly anomalies and surface NO2 changes. Indeed, apart from the specific year of 2020 strongly impacted by the COVID-19 pandemic (giving a minimum surface NO2 of −56 % in April), surface NO2 monthly levels show a broad minimum over late spring and summer, with the lowest values in June or May over 2018–2021.
Note that TROPOMI observations above Madrid (Table F1, bottom part) show quite a similar picture to the one obtained in areas exceeding 90 % of urban cover fraction (Sect. 3.5). Excluding the year 2020, a broad minimum is typically observed in summer. The minimum of 2019 found here in November is likely not representative due to an especially high cloud cover during this specific period (explaining the small number of days with available observations). In 2021, the minimum occurs in August but with TrC-NO2 values close to those observed in June and July.
Table F1Monthly mean surface NO2 mixing ratios over 2015–2021, on average over individual monitoring stations located within around 10 km from the city center of Madrid (here including both traffic and urban background stations) and the month of minimum NO2 levels (with relative difference against the annual mean into parentheses). Below, we provide the relative differences (against annual mean) of traffic counting in the Madrid region available over 2018–2021. In the bottom, monthly mean TROPOMI TrC-NO2 in Madrid are also given (with the number of days with available data into brackets).
Reasons for this relative flattening of the seasonal minimum of NO2 remain unclear but may include the continuously decreasing contribution of road transport to total NOx emissions in Madrid and the associated increasing relative contribution of other emission sectors presenting a distinct monthly variability (and no clear drop in August). Specifically in May 2019, the relatively low NO2 mixing ratios observed at the surface do not appear to be explained by specific meteorological conditions (monthly anomalies of surface temperature and geopotential at 500 hPa in the ERA5 reanalysis are only +0.8° and +150 dam compared to the 2012–2021 climatology). Some specific chemical conditions might eventually play a role, but mean surface O3 mixing ratios during this month remained close (+0.5 ppbv) to their climatological value.

Figure F1Mean monthly profiles (top panels) and differences relative to annual mean (bottom panels) for different levels of urban cover fraction, considering (from left to right panels) the TROPOMI TrC-NO2 full dataset, TROPOMI TrC-NO2 collocated with surface stations, surface NO2 mixing ratios collocated with TROPOMI at daily TROPOMI overpass time (dop) and daily 1 h maximum (d1max) and daily 24 h mean (d) timescales. The collocation of TROPOMI-based and surface-based observations is here performed both spatially and temporally (on a daily basis); the corresponding numbers of cells (averaged over the different months of the year) are indicated in the legend. Urban cover fractions are here binned in bins of 10 %.
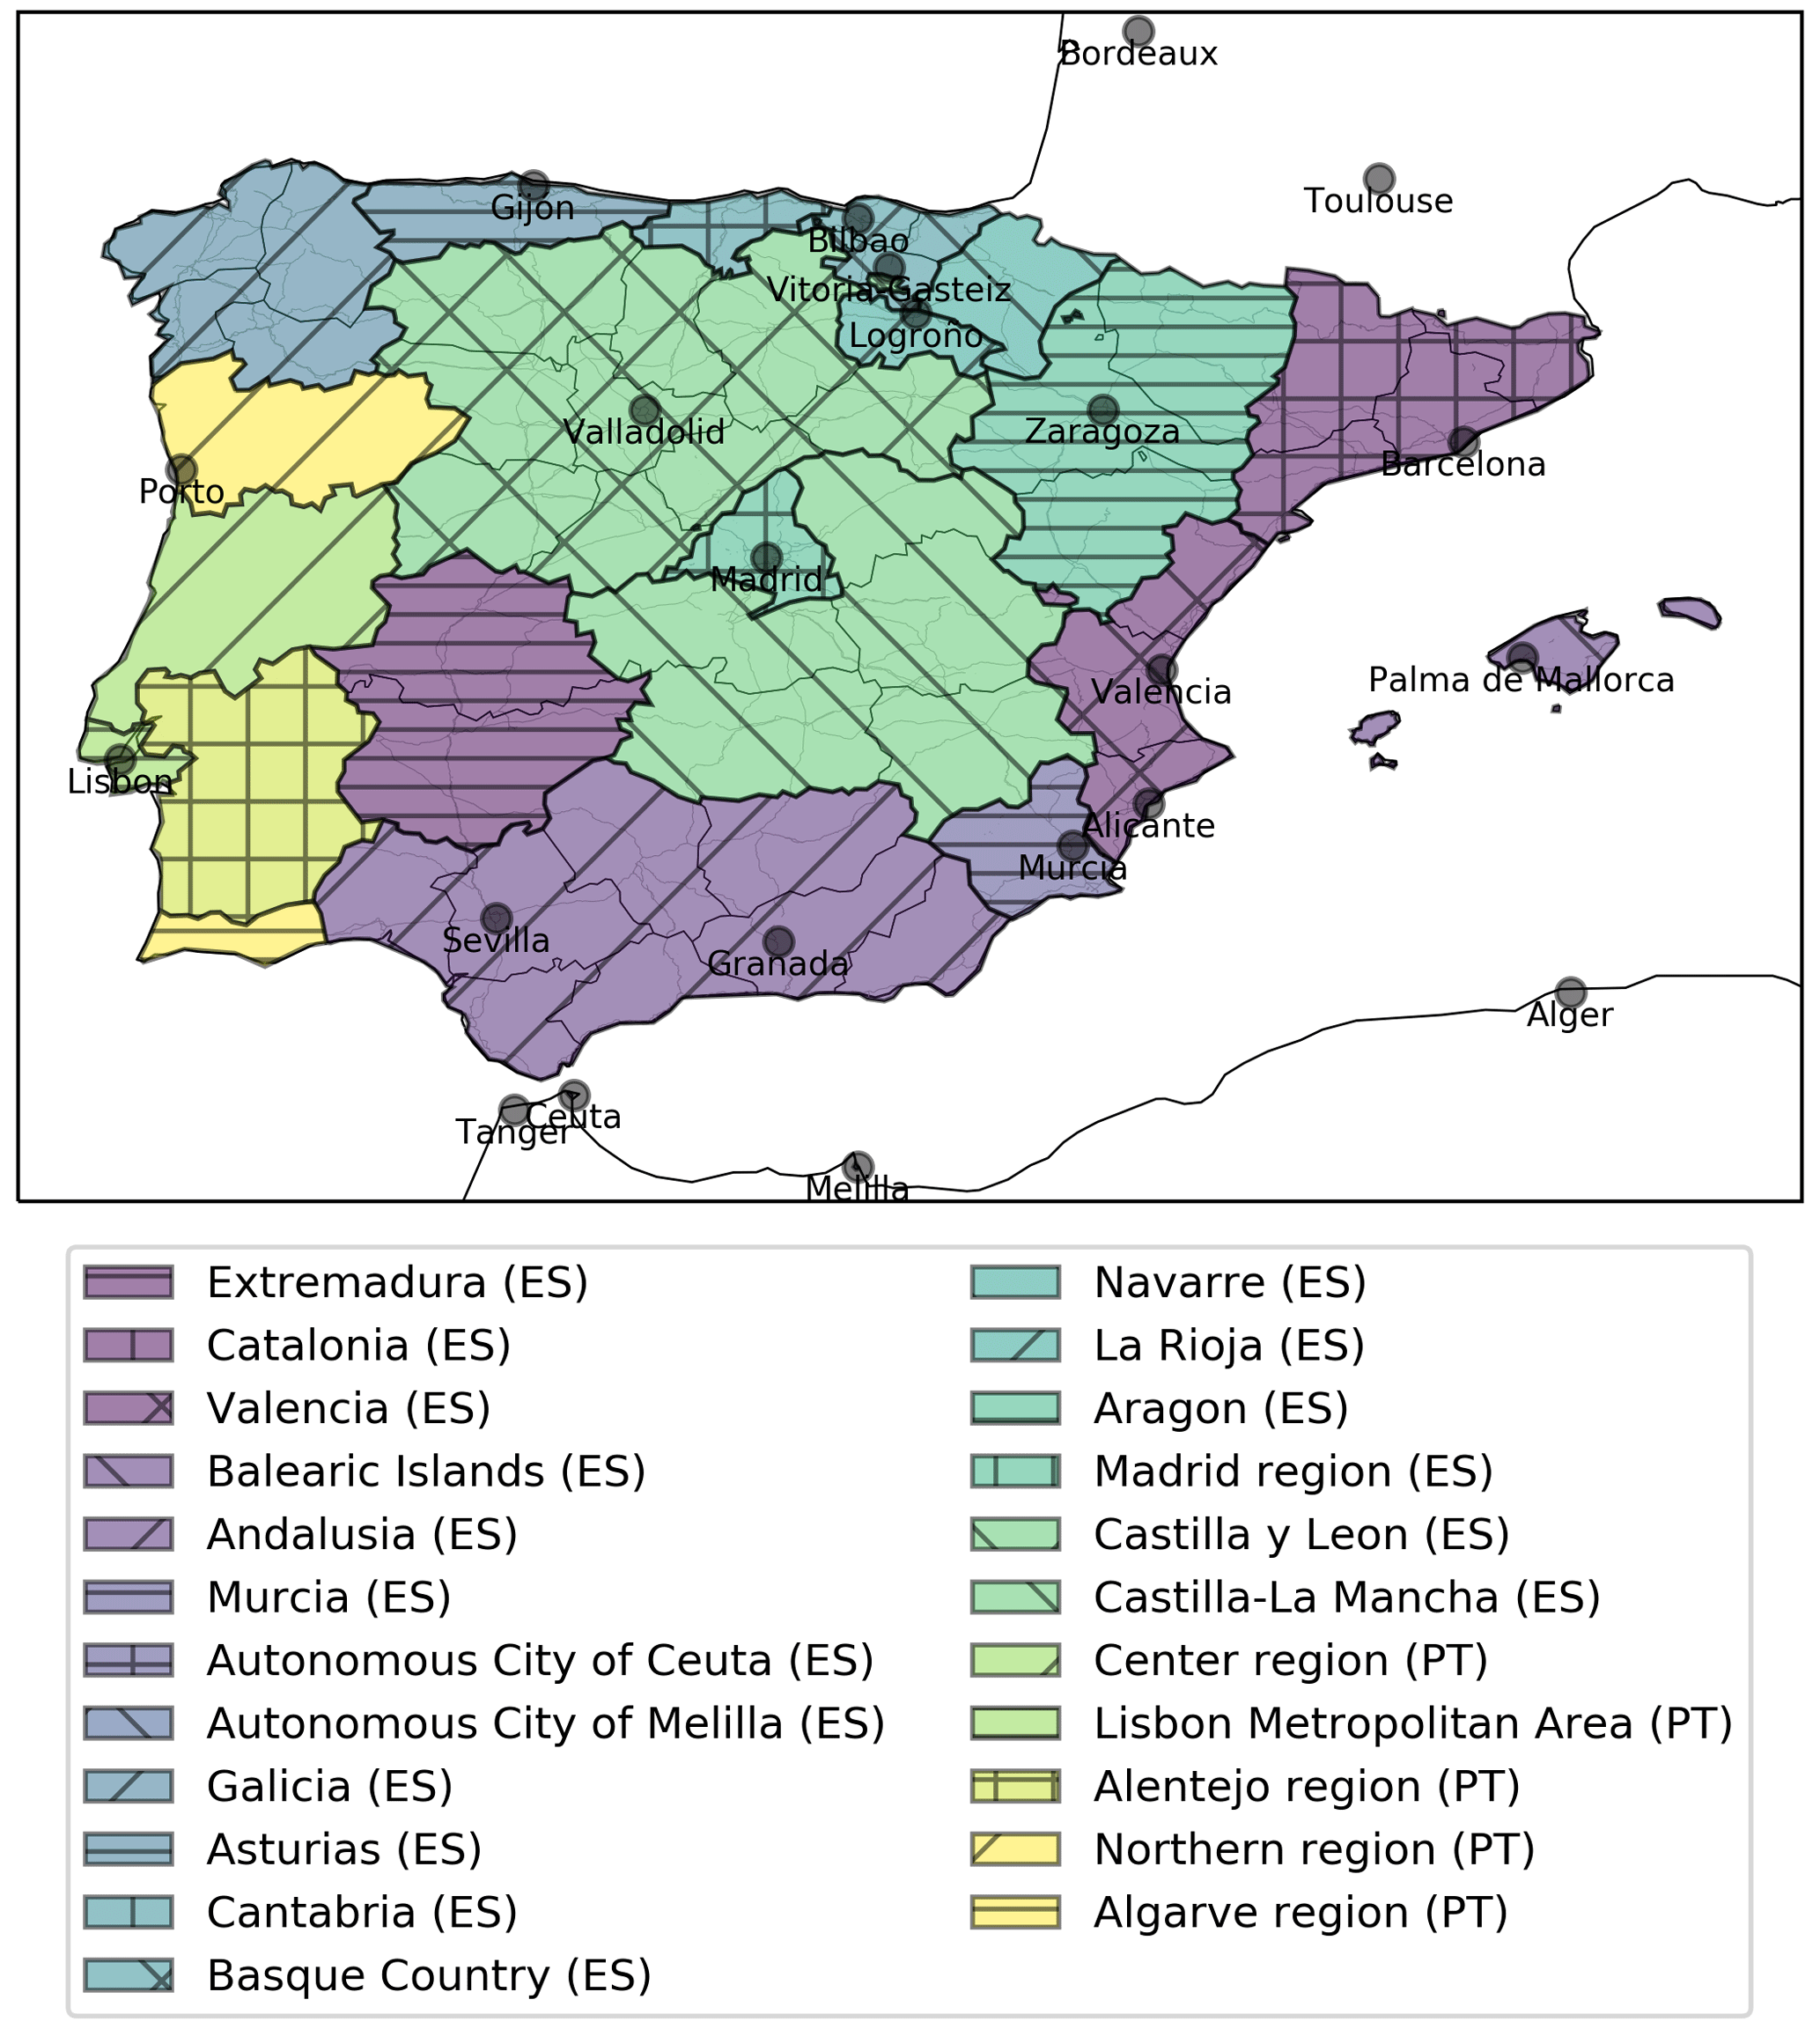
Figure G1Administrative regions of the Iberian Peninsula and main cities over the domain of study.
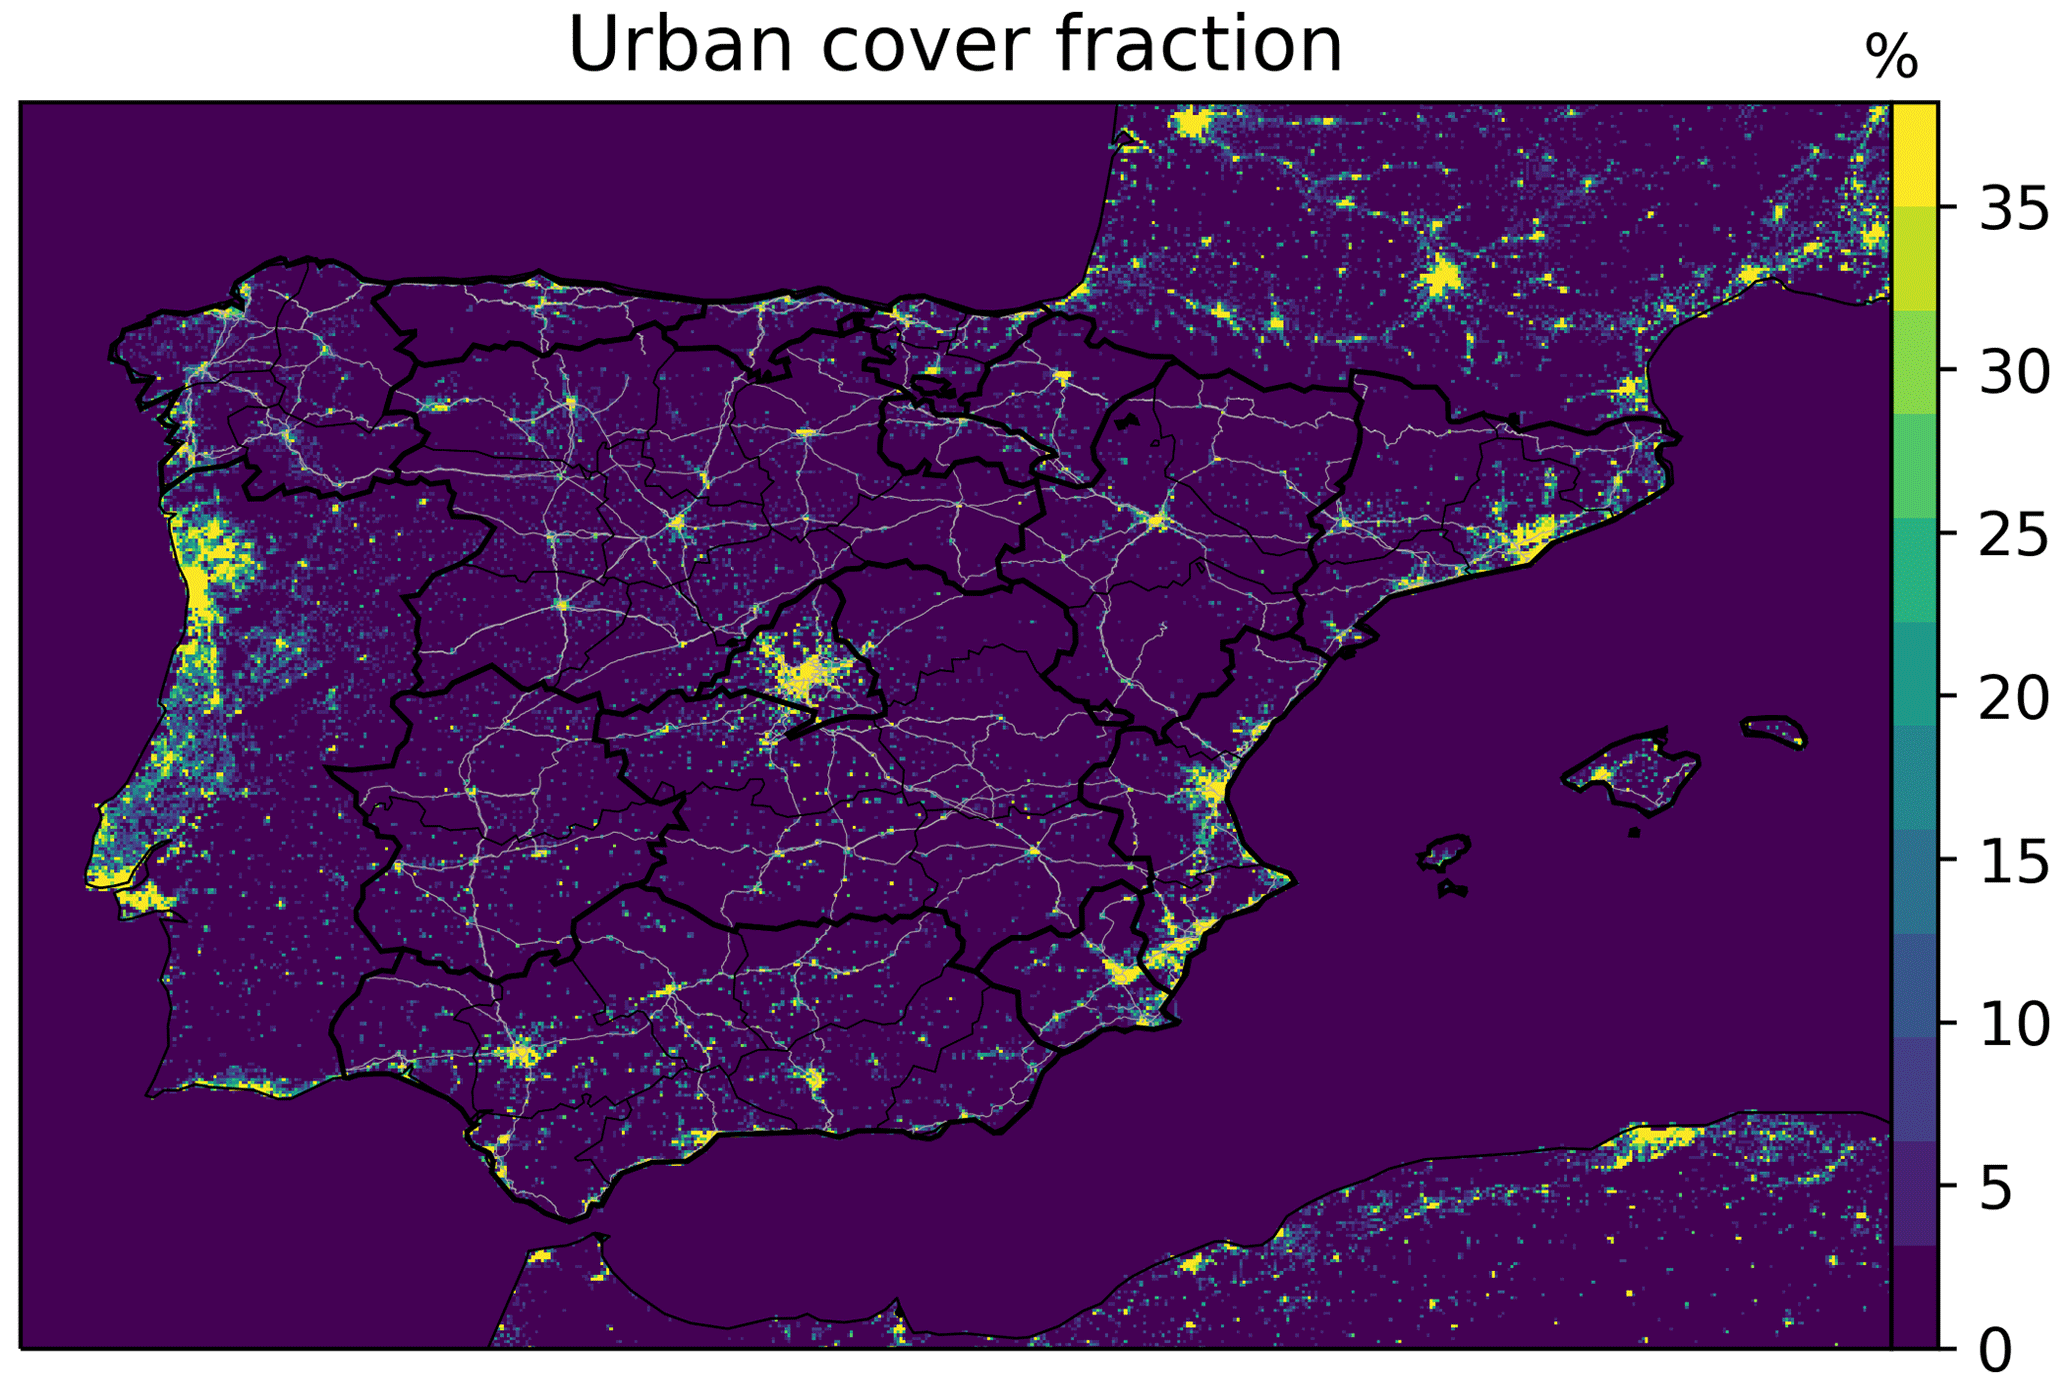
Figure G2Urban land cover fraction.
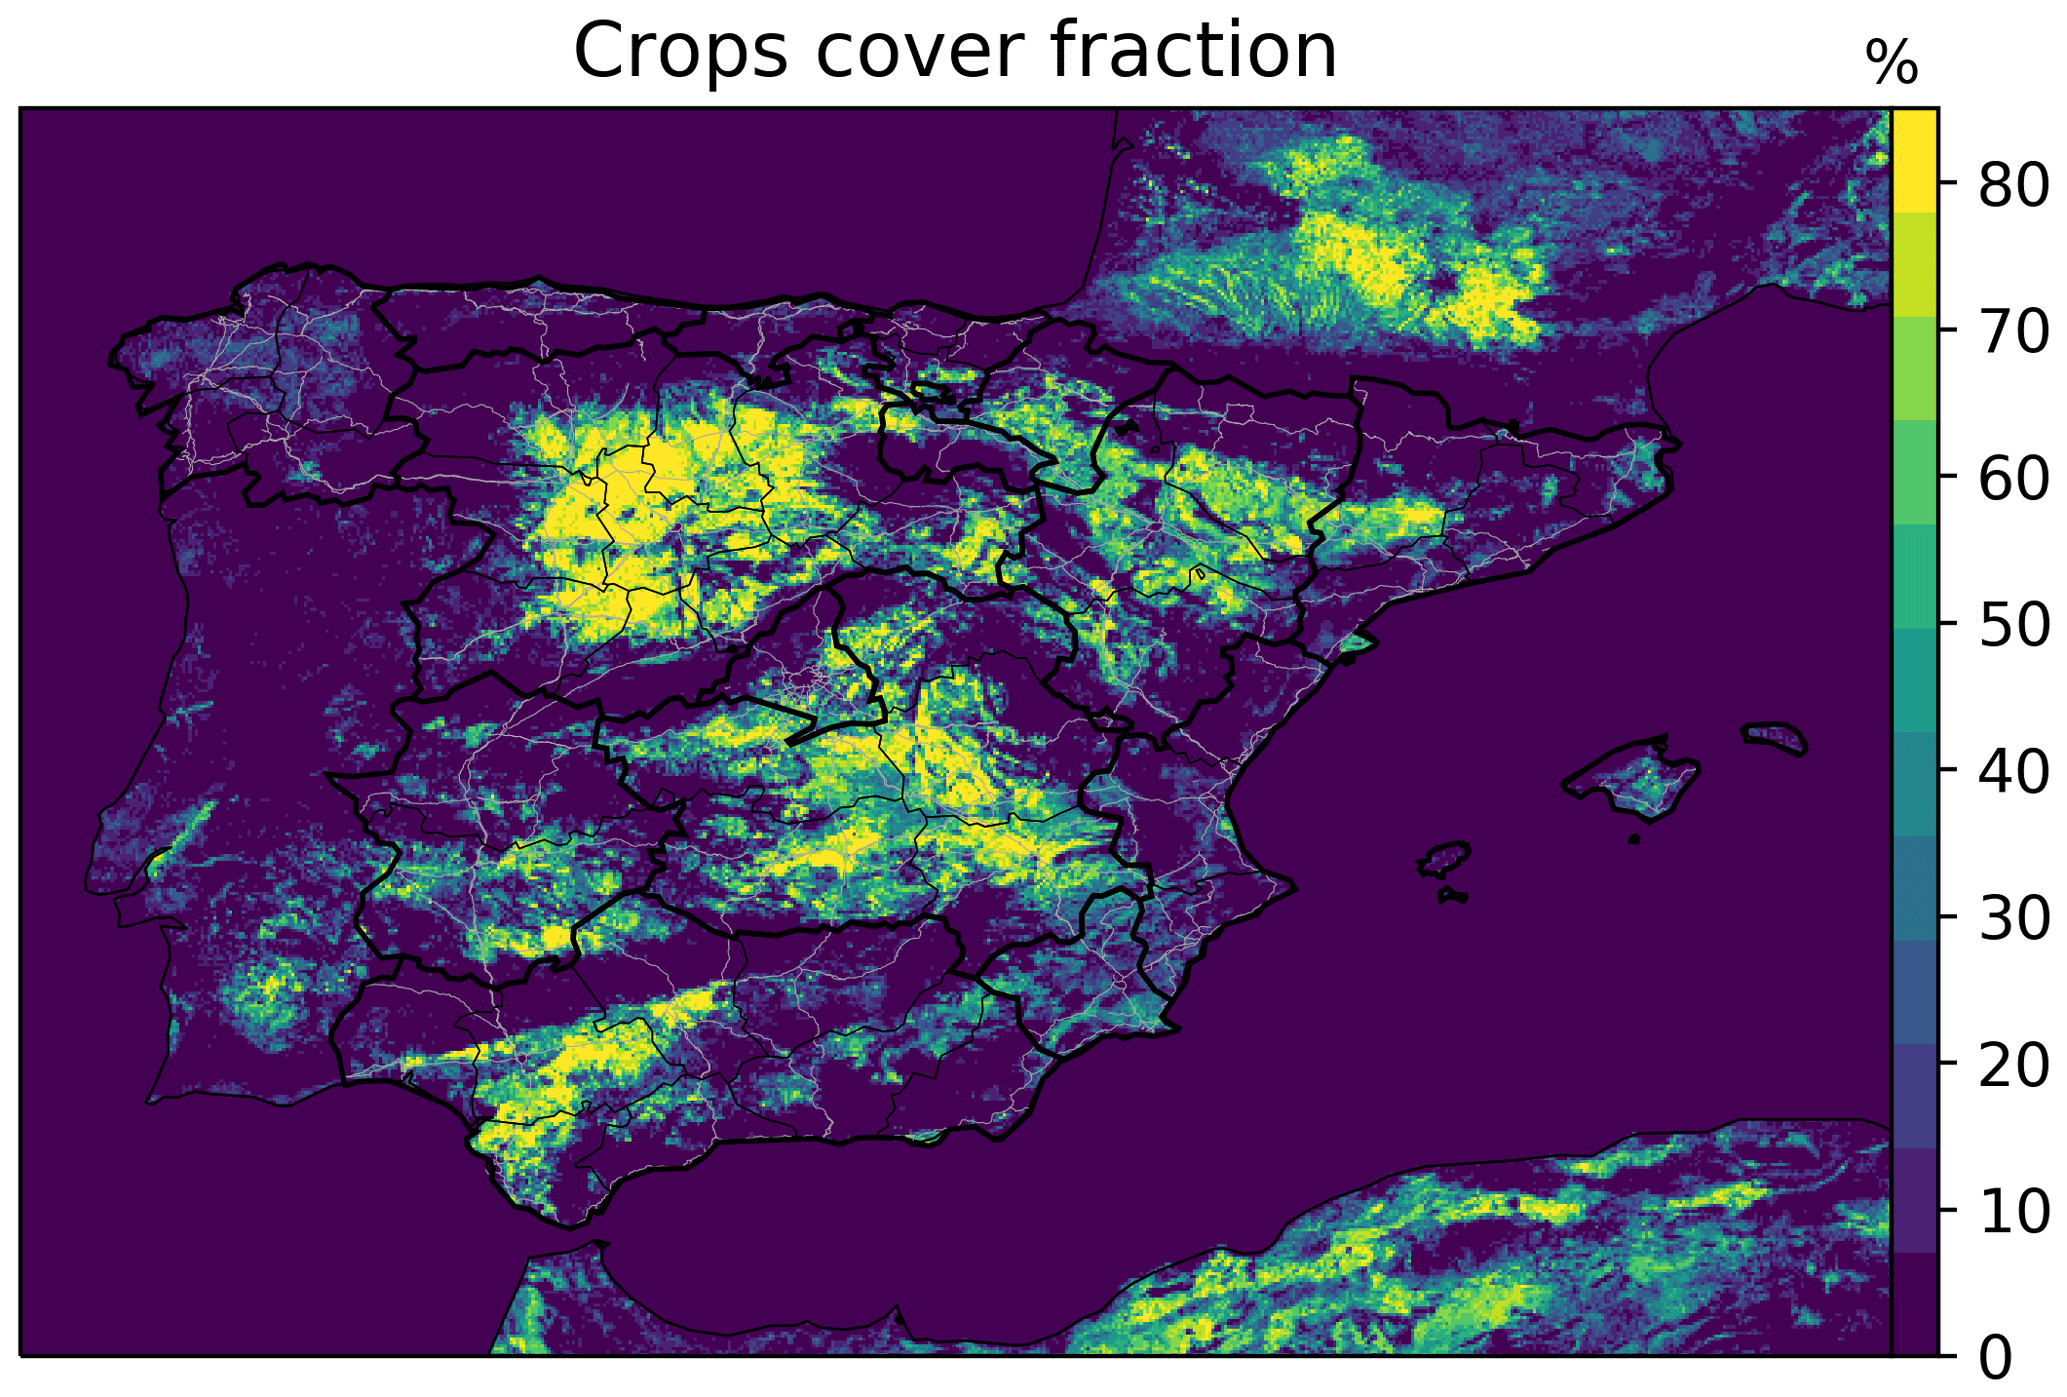
Figure G3Crops land cover fraction.
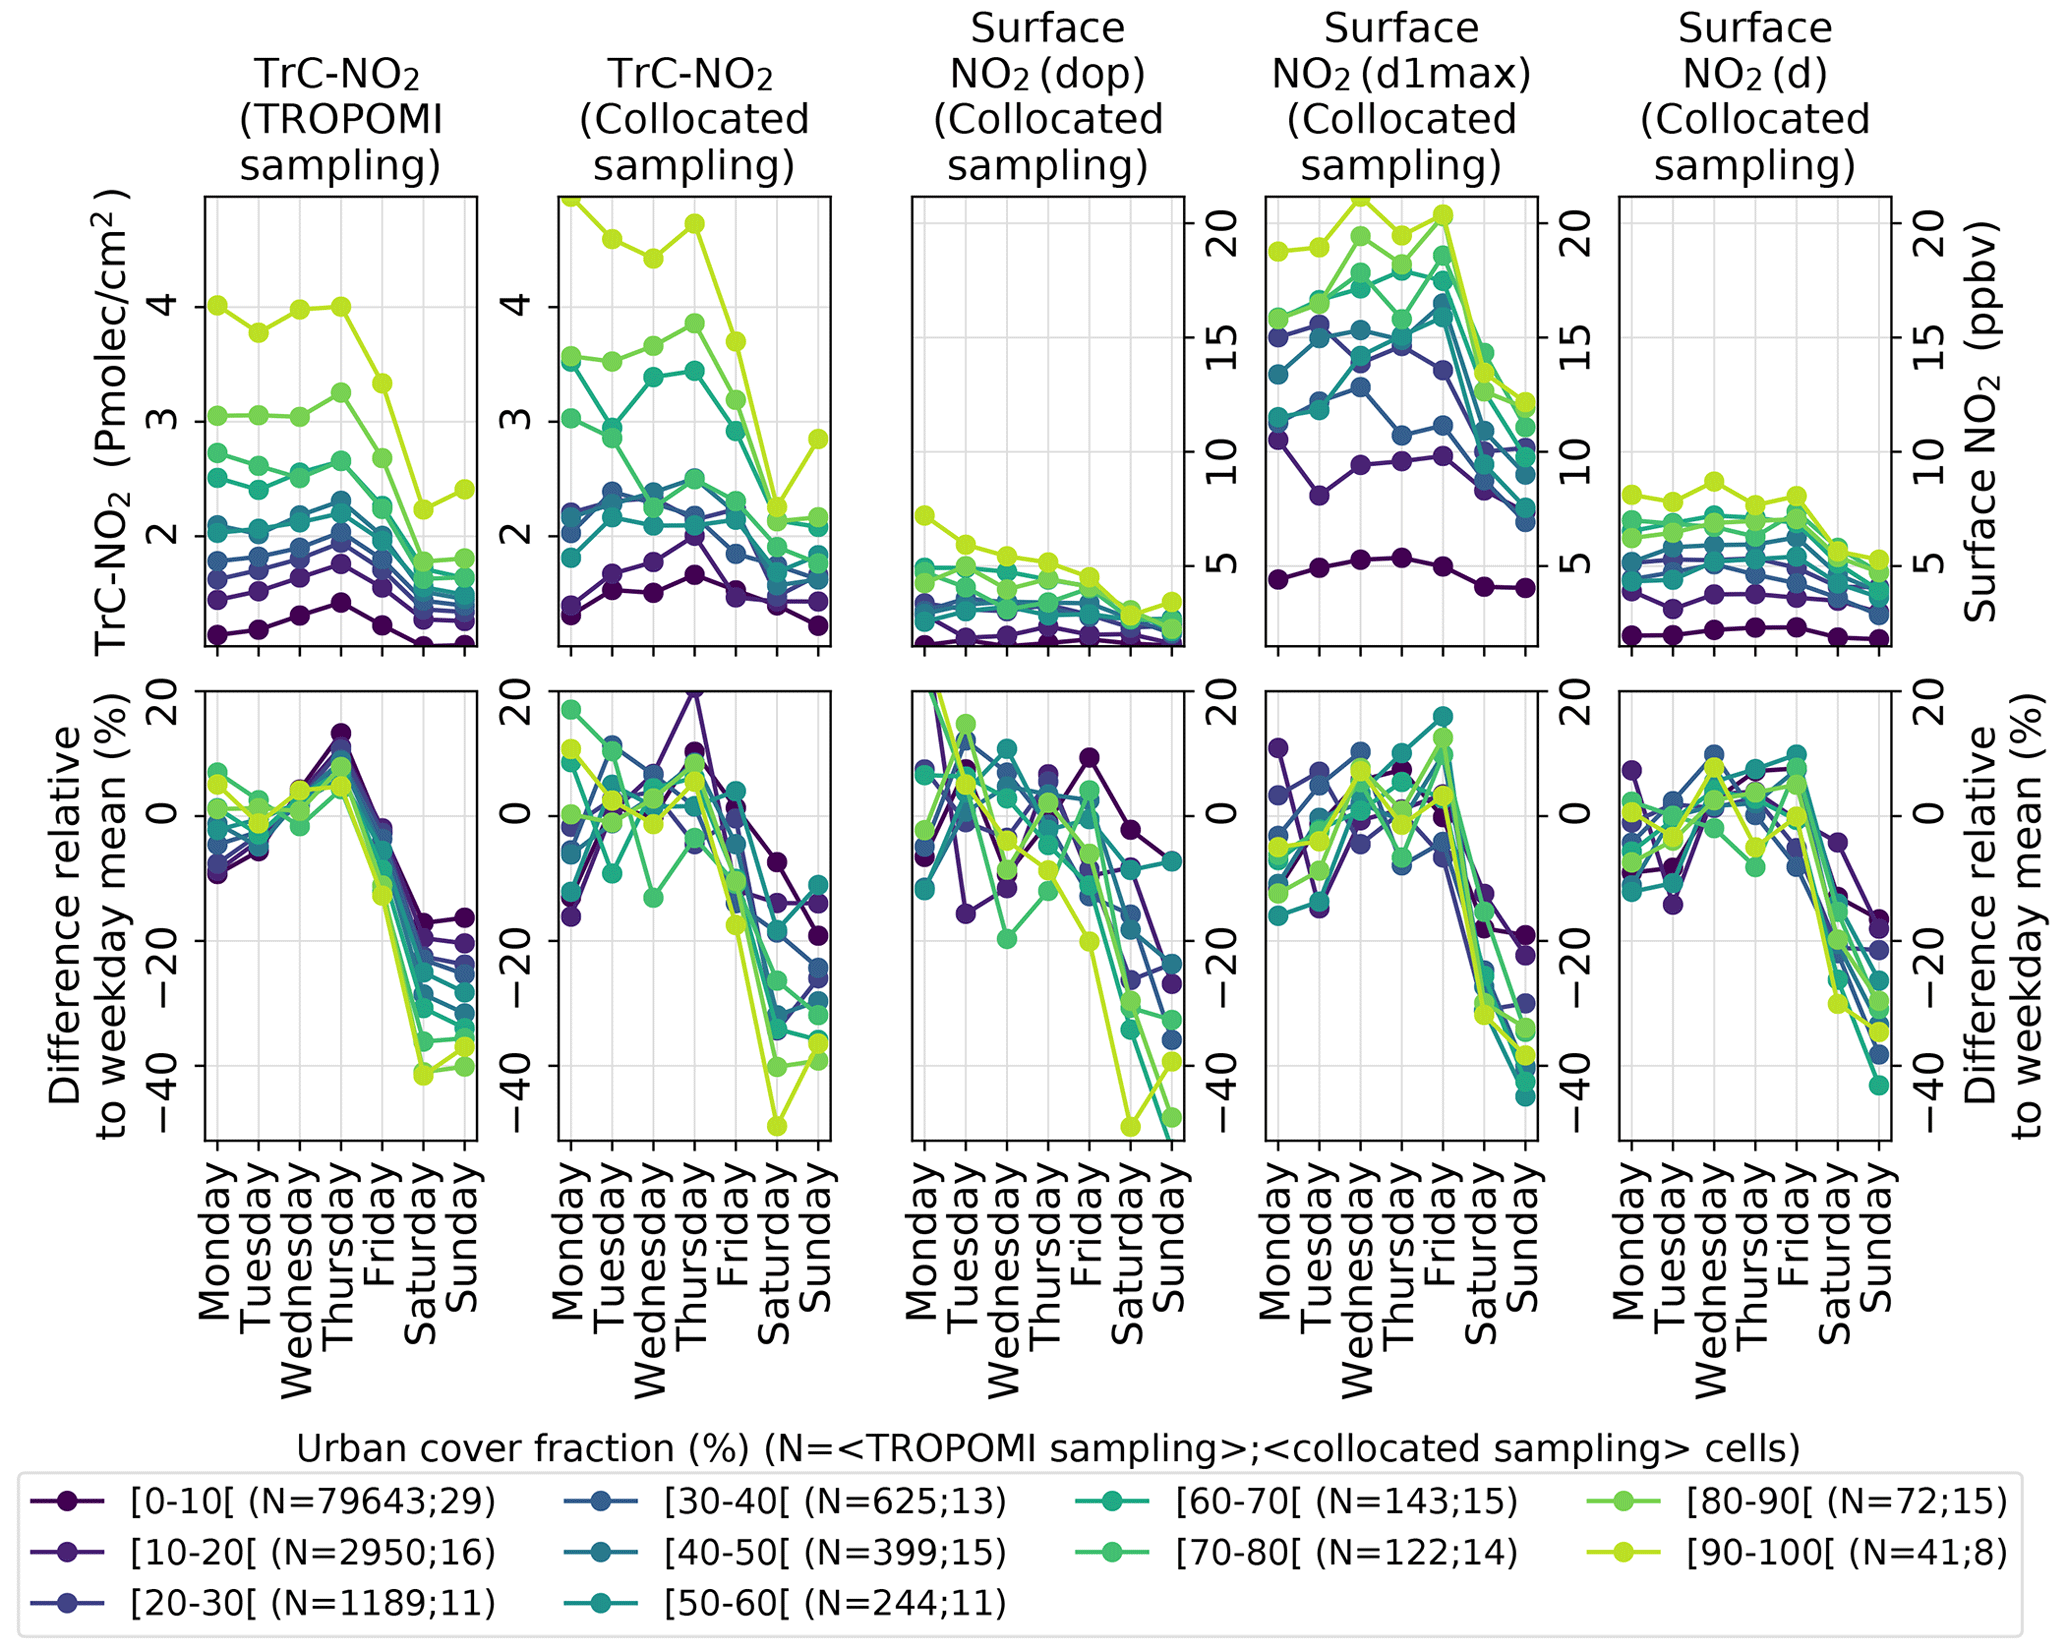
Figure G4Mean weekly profiles (top panels) and differences relative to weekday (Monday–Friday) mean (bottom panels) during the first strict COVID-19 lockdown (15 March–31 May 2020) for different levels of urban cover fraction, considering (from left to right panels) the TROPOMI TrC-NO2 full dataset, TROPOMI TrC-NO2 collocated with surface stations, surface NO2 mixing ratios collocated with TROPOMI at daily TROPOMI-overpass-time (dop), and daily 1 h maximum (d1max) and daily 24 h mean (d) timescales. The collocation of TROPOMI-based and surface-based observations is here performed both spatially and temporally (on a daily basis); the corresponding numbers of cells (averaged over the different days of the week) are indicated in the legend. Urban cover fractions are here binned in bins of 10 %.
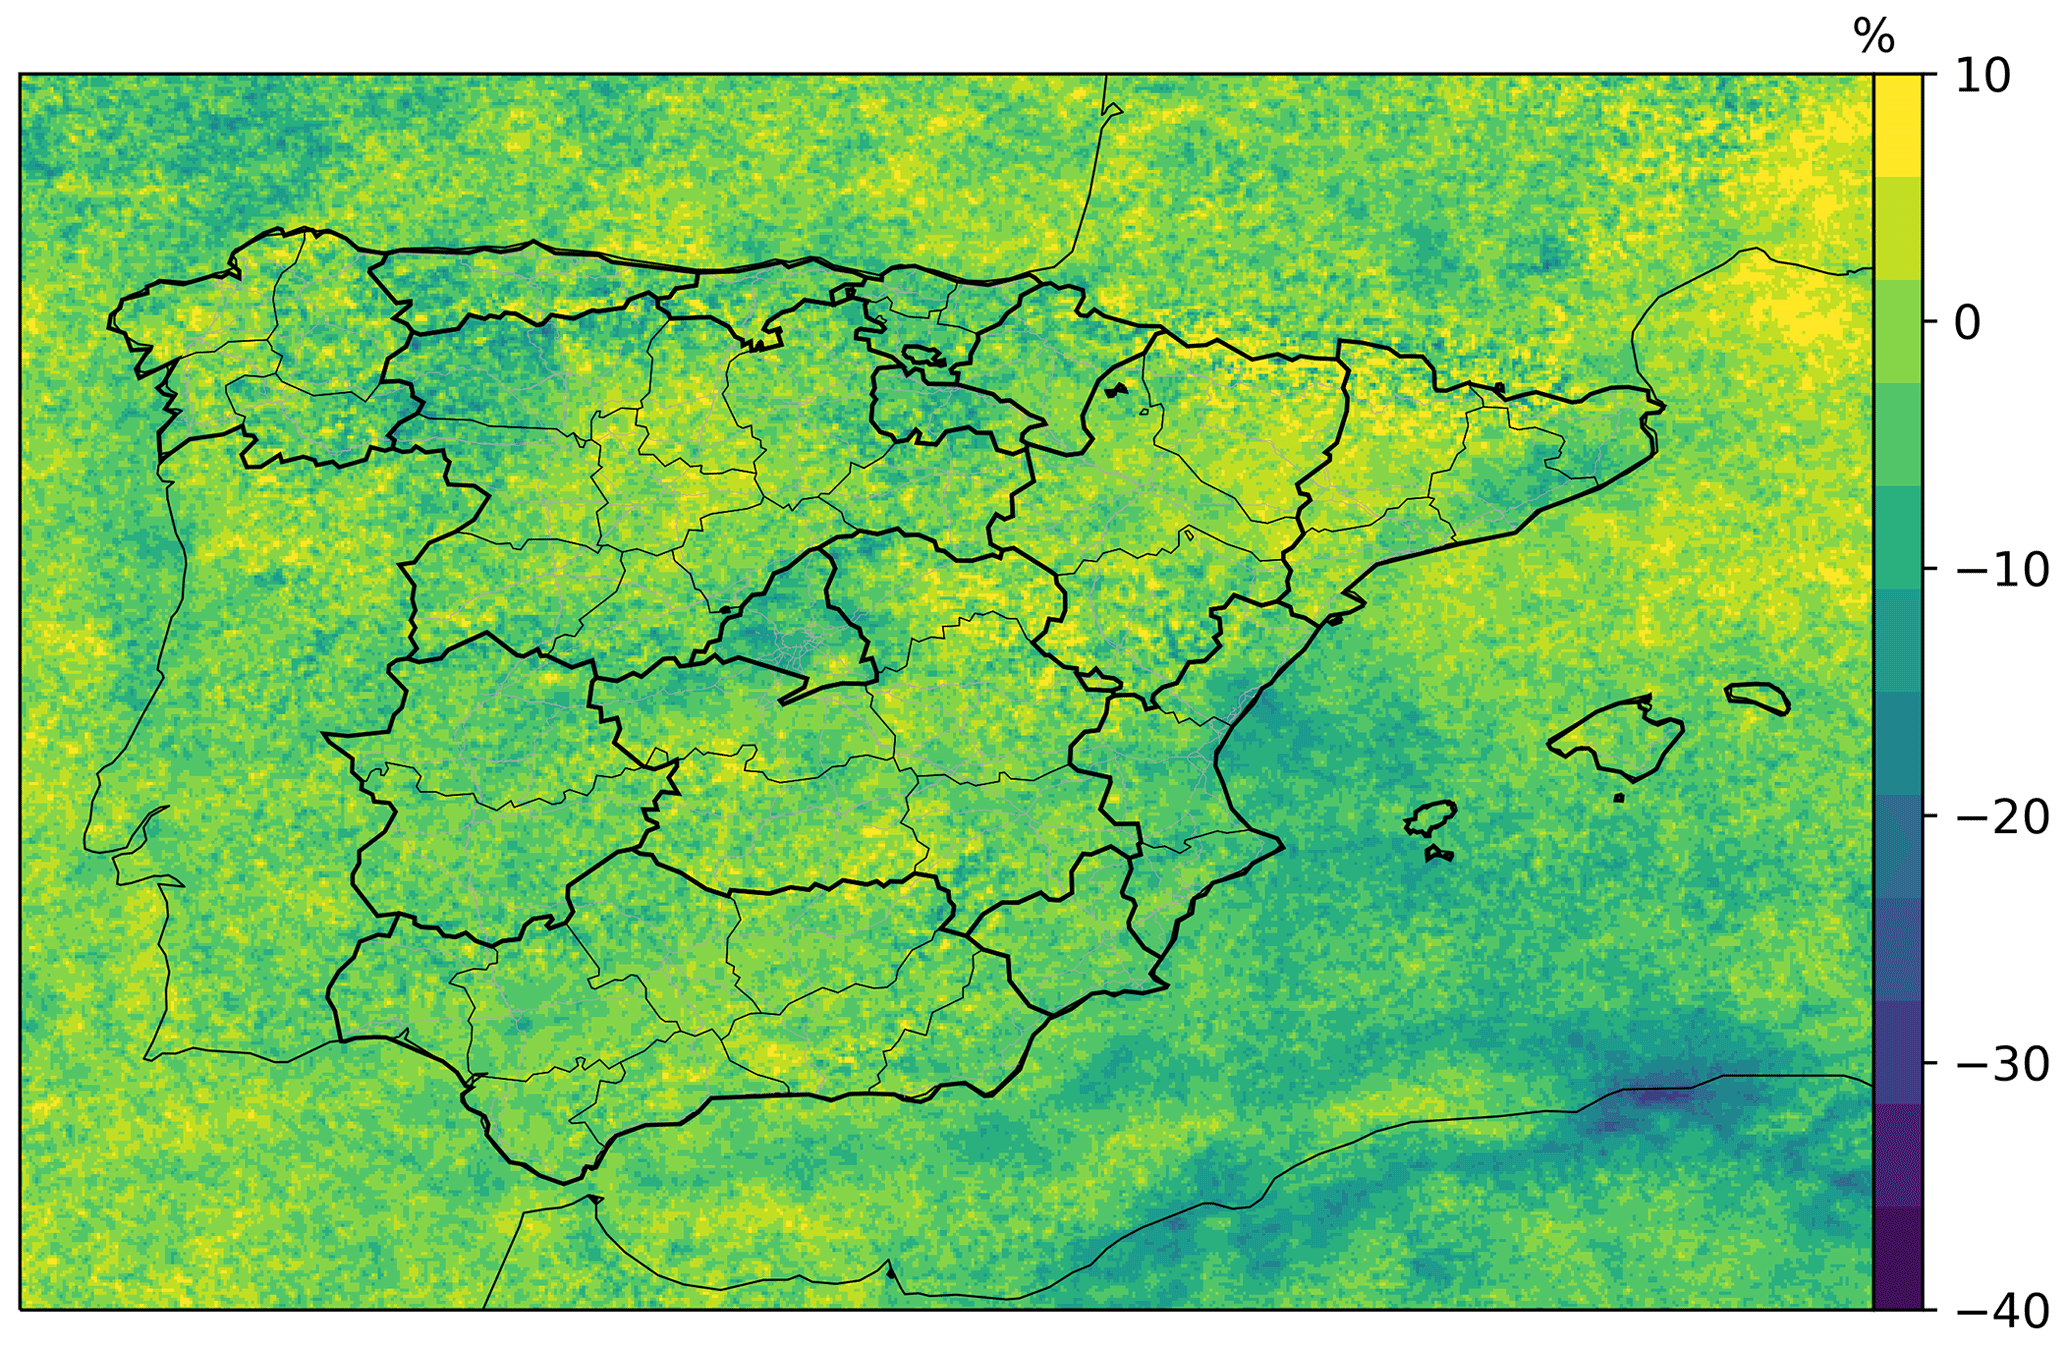
Figure G5Mean relative change of TROPOMI TrC-NO2 on Friday–Saturday (which corresponds to the occidental “weekend” in Algeria), relative to the other days (Monday–Tuesday–Wednesday–Thursday–Sunday). Note that weekends in Morocco are similar to Spain.
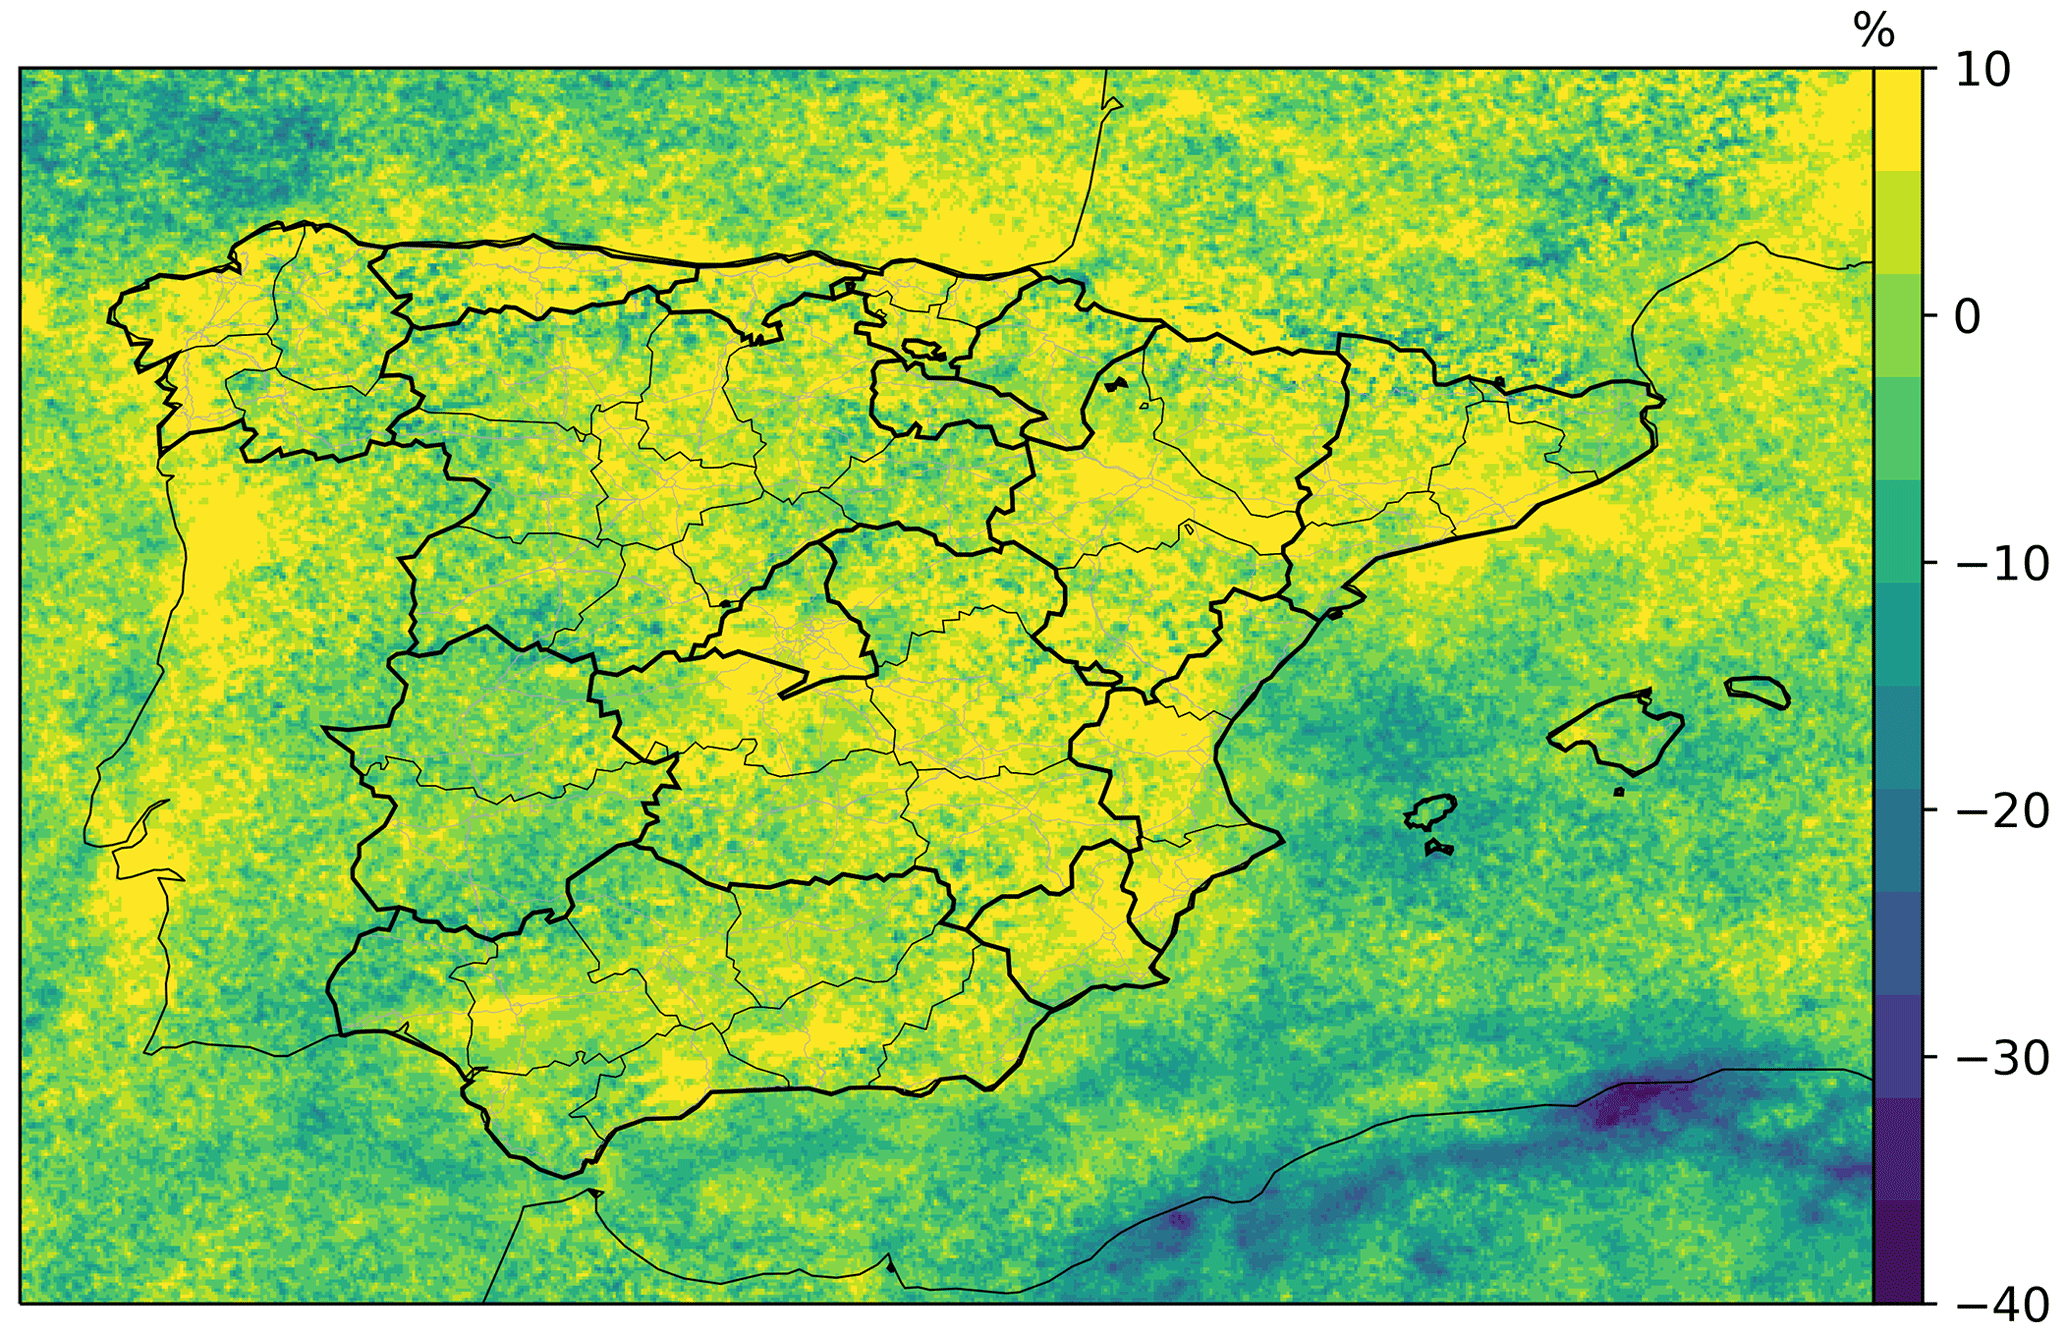
Figure G6Mean relative change of TROPOMI TrC-NO2 on Friday (which corresponds to the occidental “Sunday” in Algeria), relative to the other days (Monday–Tuesday–Wednesday–Thursday–Sunday). Black lines, grey lines and hatched areas correspond to administrative borders, Spanish major roads and functional urban areas, respectively (sources: see Sect. 2.4).
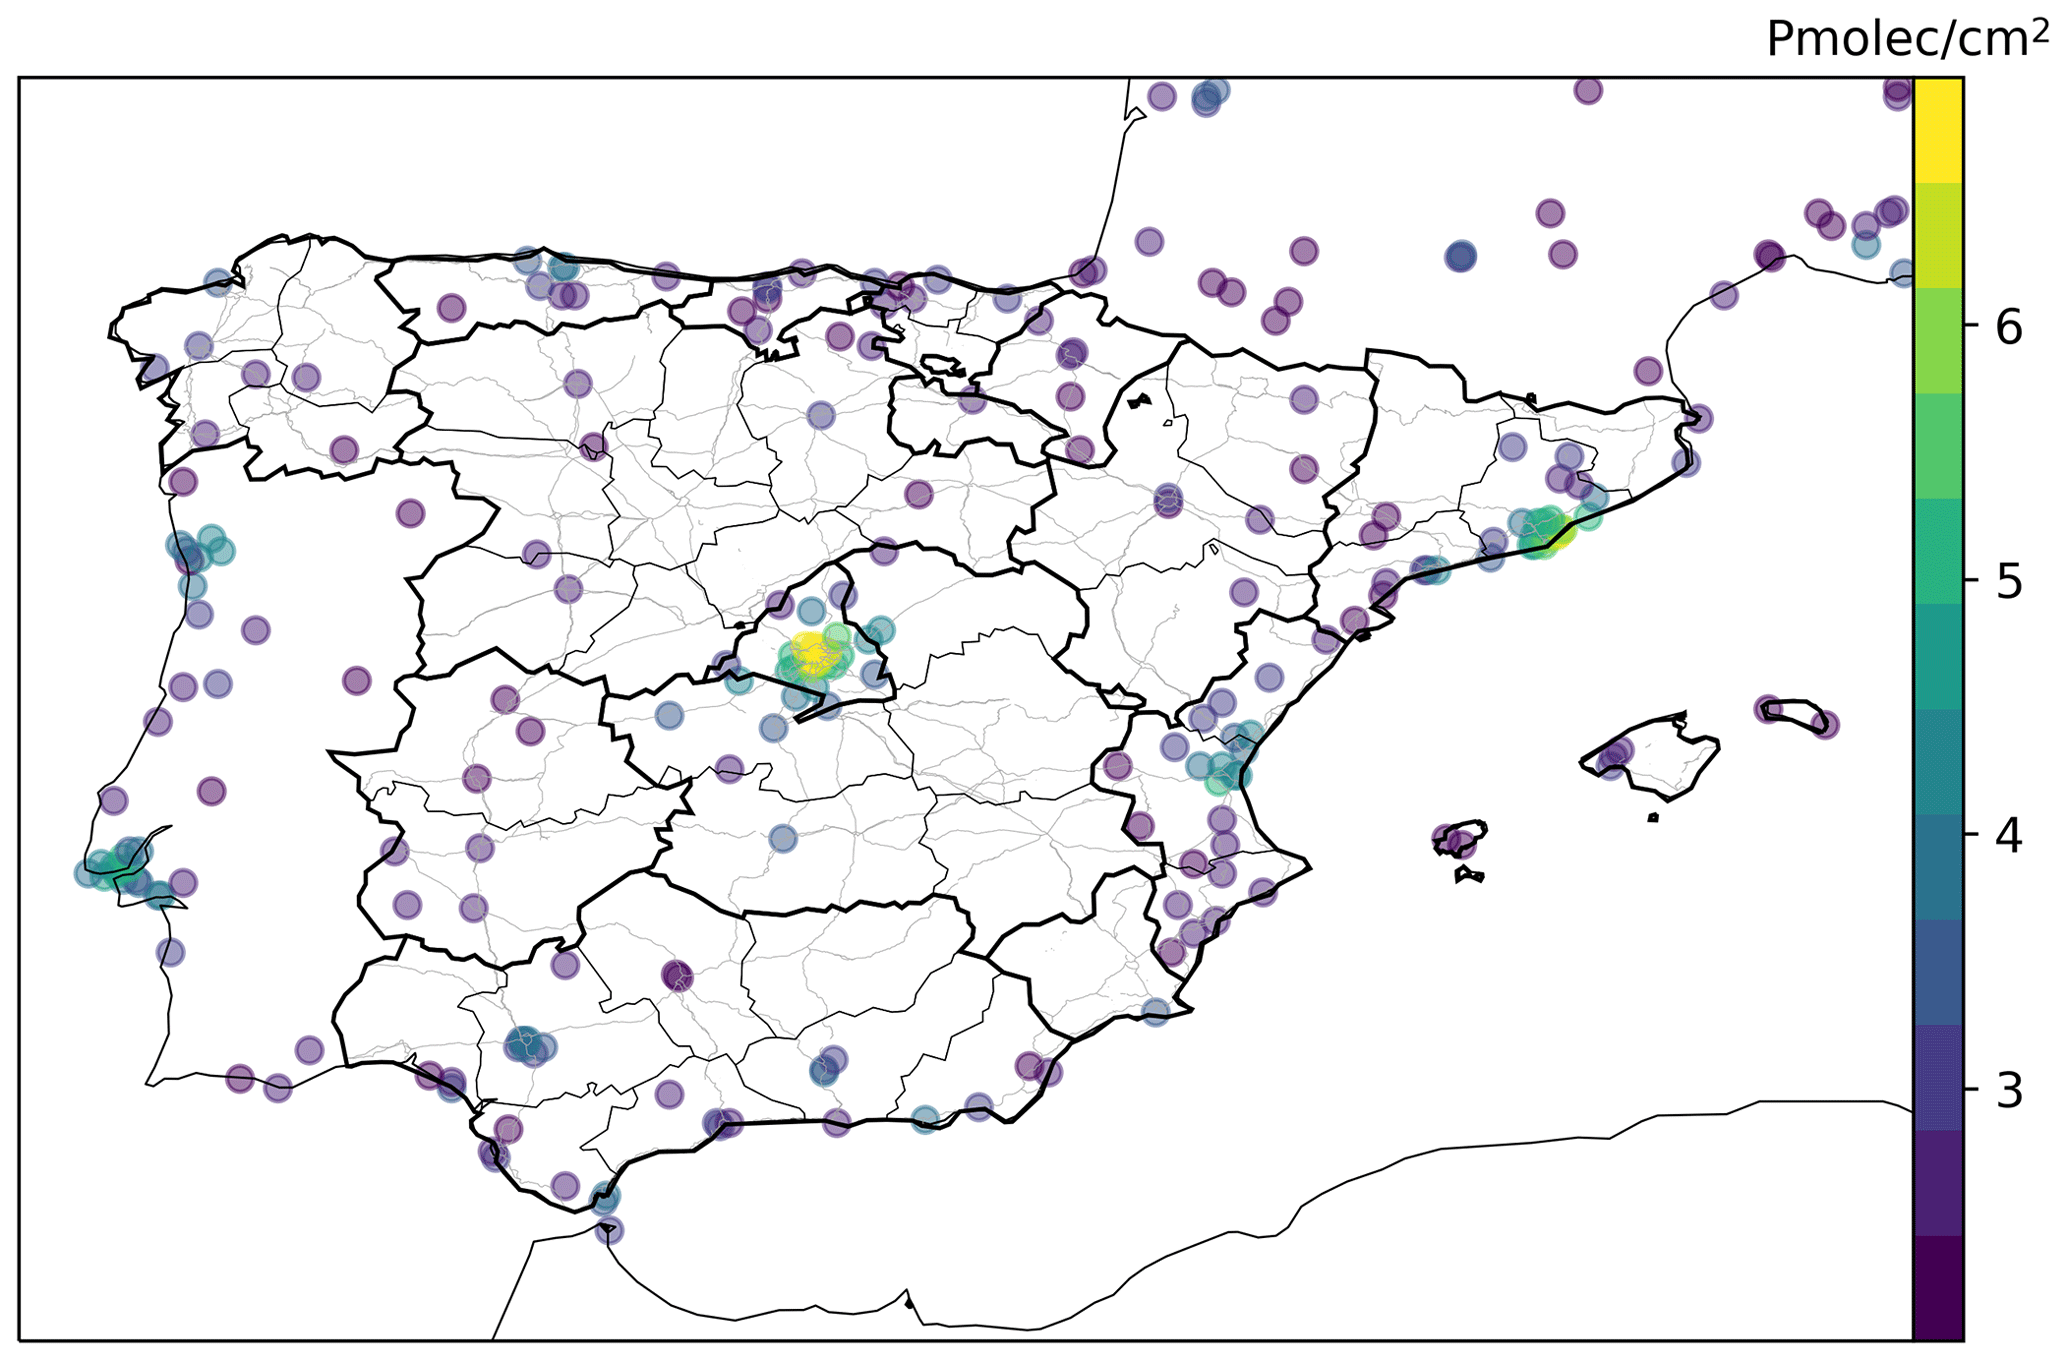
Figure G7Mean TrC-NO2 coincident with the 10 % largest residuals of the daily scale TrC-NO2 versus surface NO2 linear regression, these high residuals correspond to situations where strong TrC-NO2 were measured by TROPOMI, while comparatively lower NO2 mixing ratios were measured by surface background stations (see text in Sect. 3.3). Black and grey lines correspond to administrative borders and Spanish major roads, respectively (sources: see Sect. 2.4).
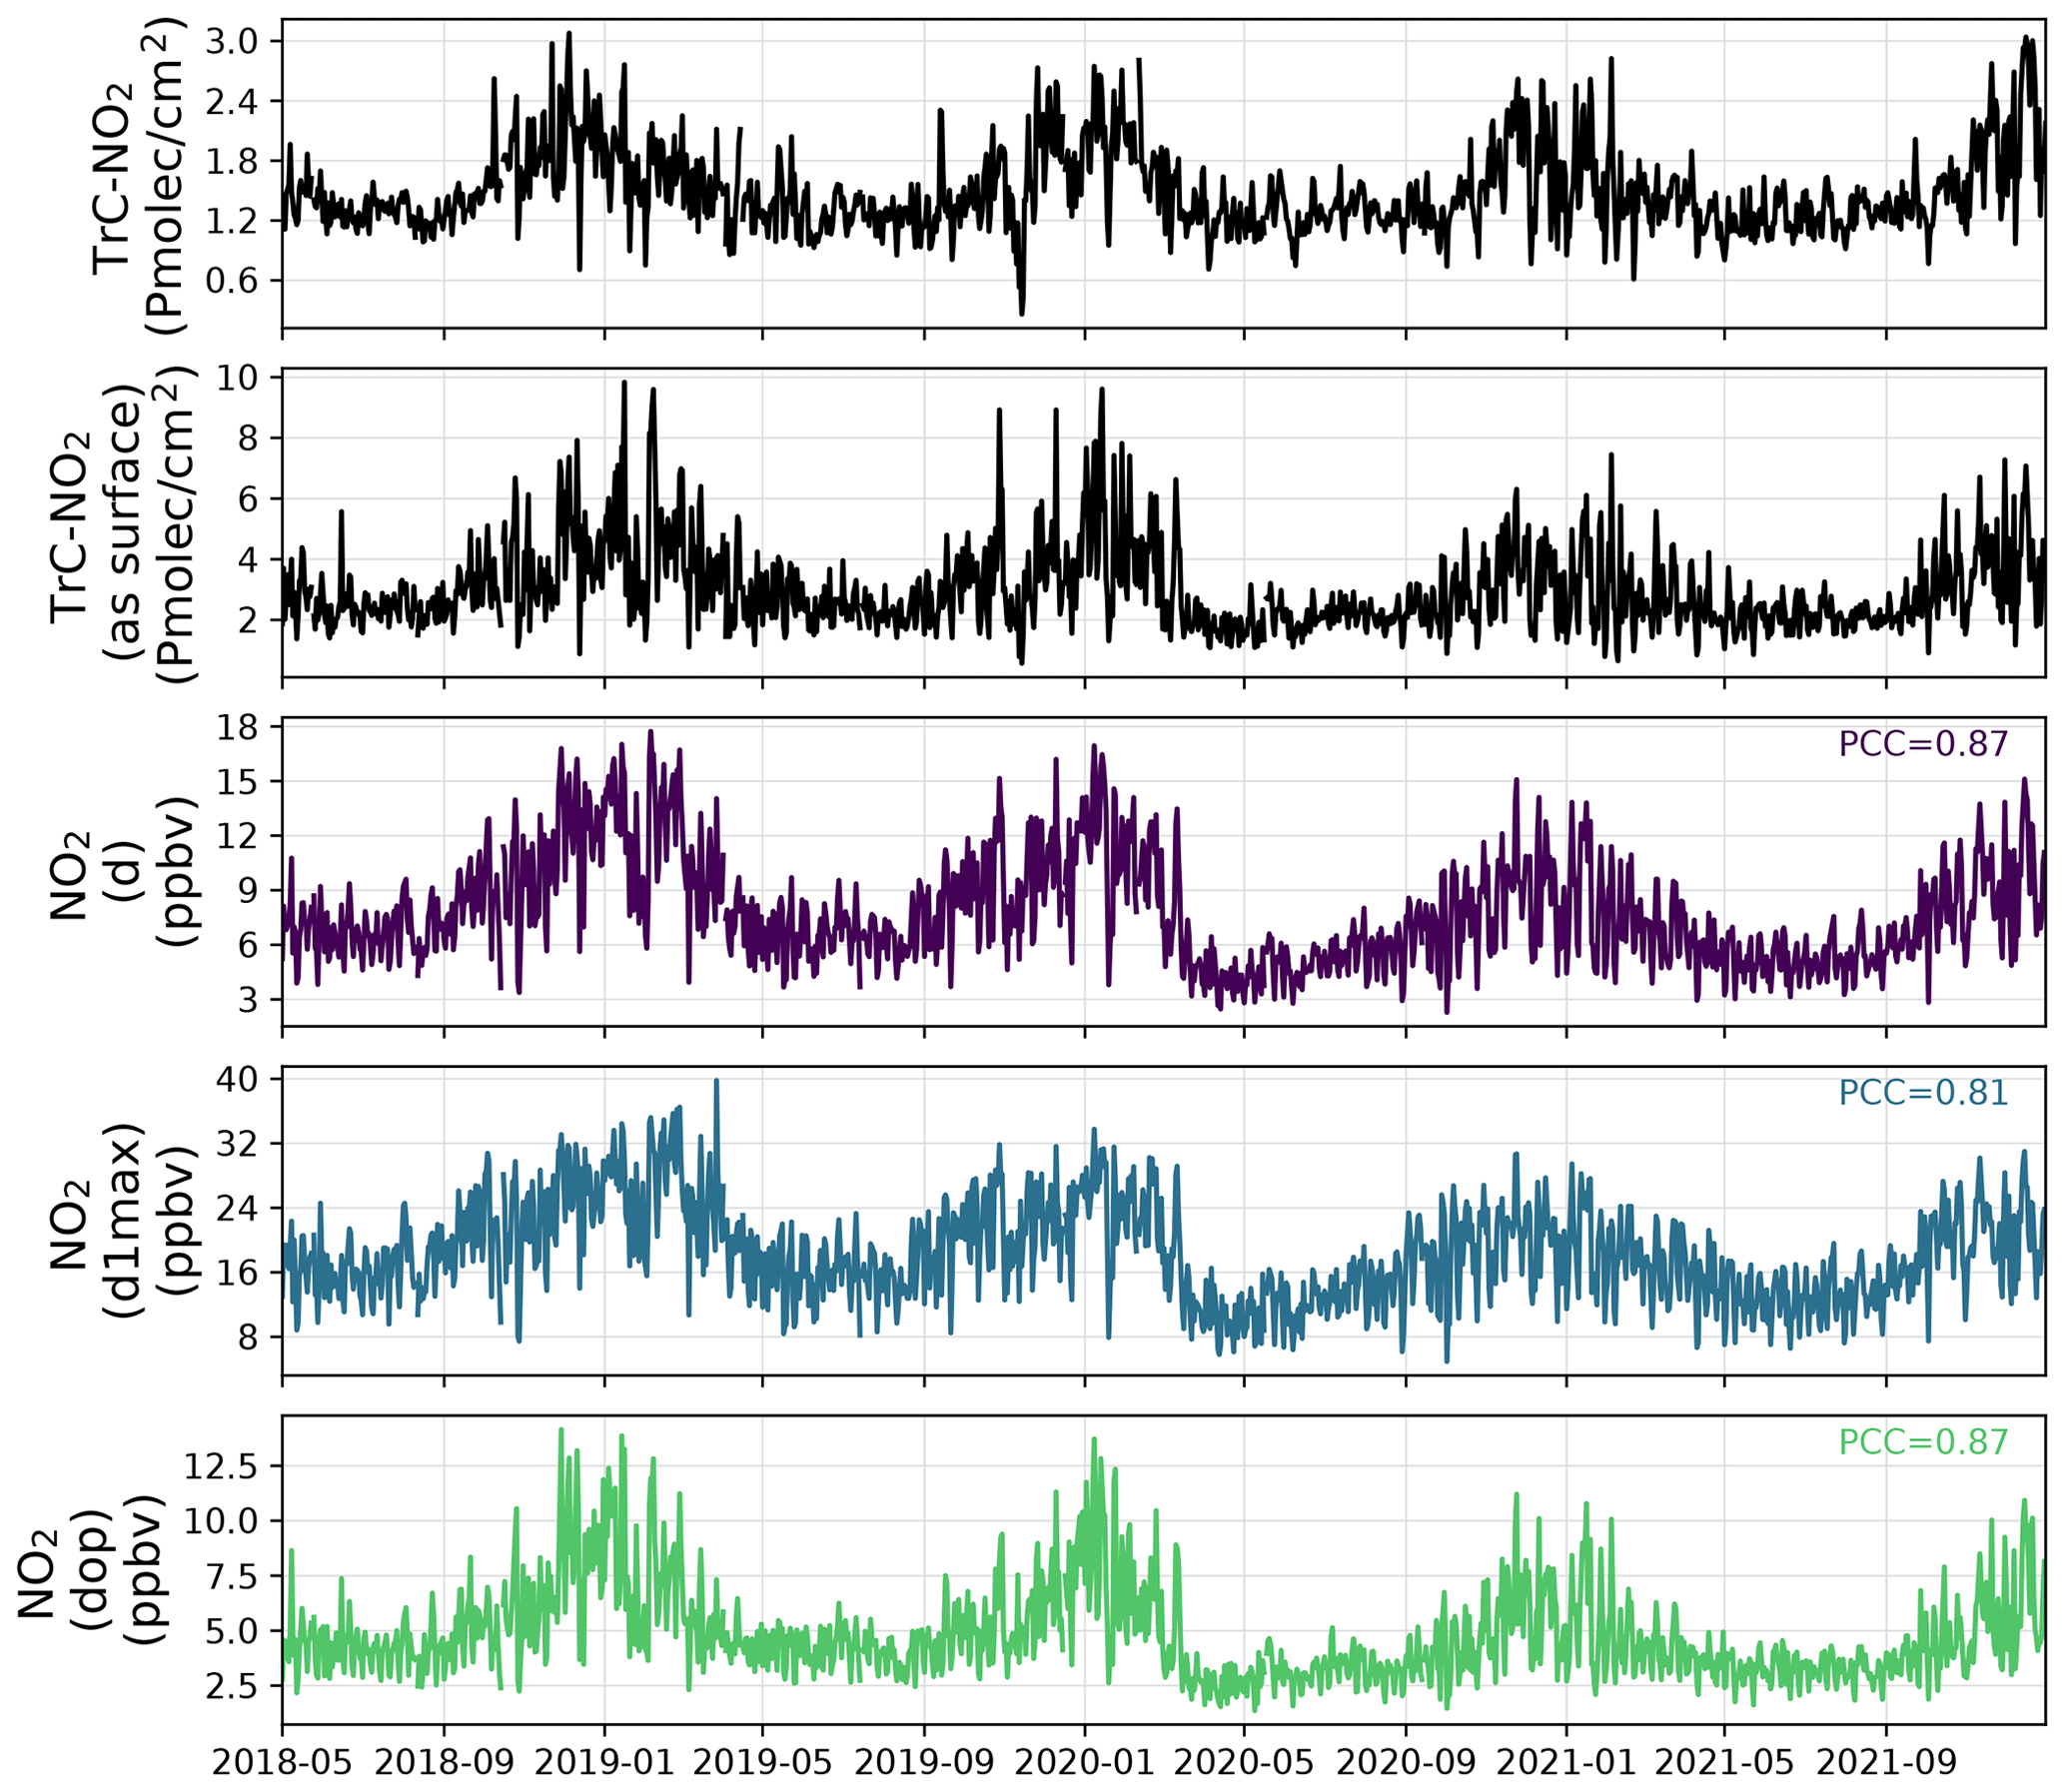
Figure G8Mean daily time series of TROPOMI TrC-NO2 (over the entire domain or restricted to cells with surface observations available; top 2 panels) and surface NO2 mixing ratios at daily (d) and daily 1 h maximum (d1max) and collocated with daily TROPOMI overpasses (dop) (bottom 3 panels). The Pearson correlation coefficients (PCCs) of surface NO2 mixing ratios against TROPOMI TrC-NO2 restricted to cells with surface observations available are indicated.
Table G1Mean data availability of TROPOMI TrC-NO2 over the different regions of the Iberian Peninsula, on average over 2018–2021.
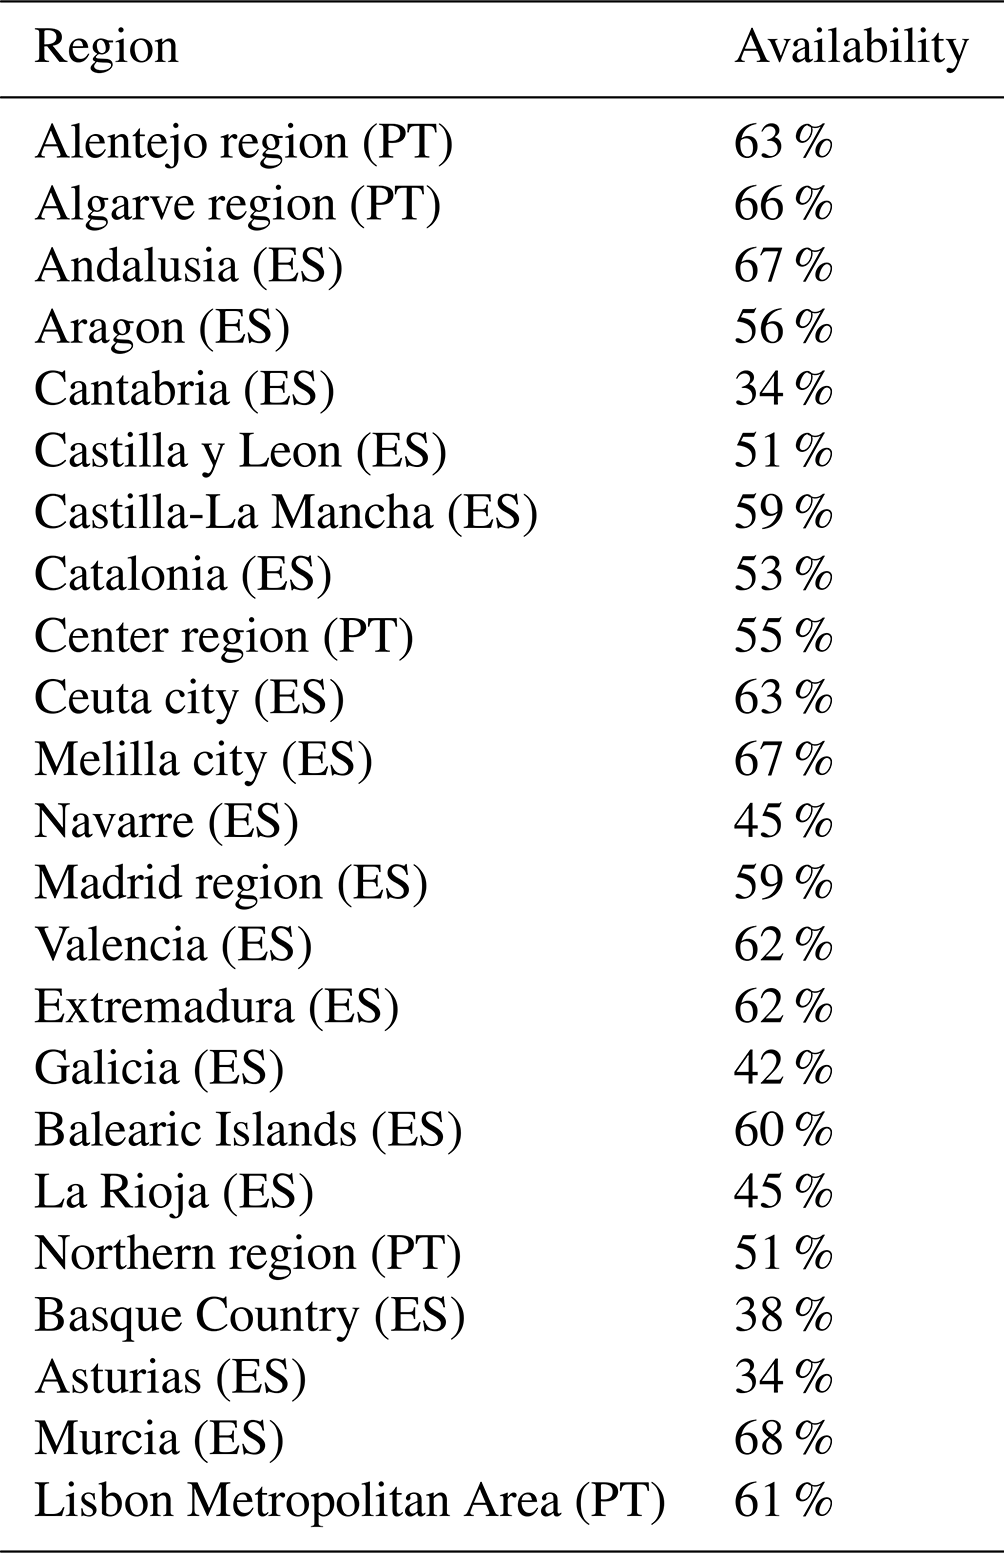
Table G2Annual evolution of the entire weekend (as well as Saturday/Sunday taken individually, in parentheses) mean surface NO2 mixing ratios and change, relative to weekdays (Monday to Friday), over the period 1990–2021 in Spain.
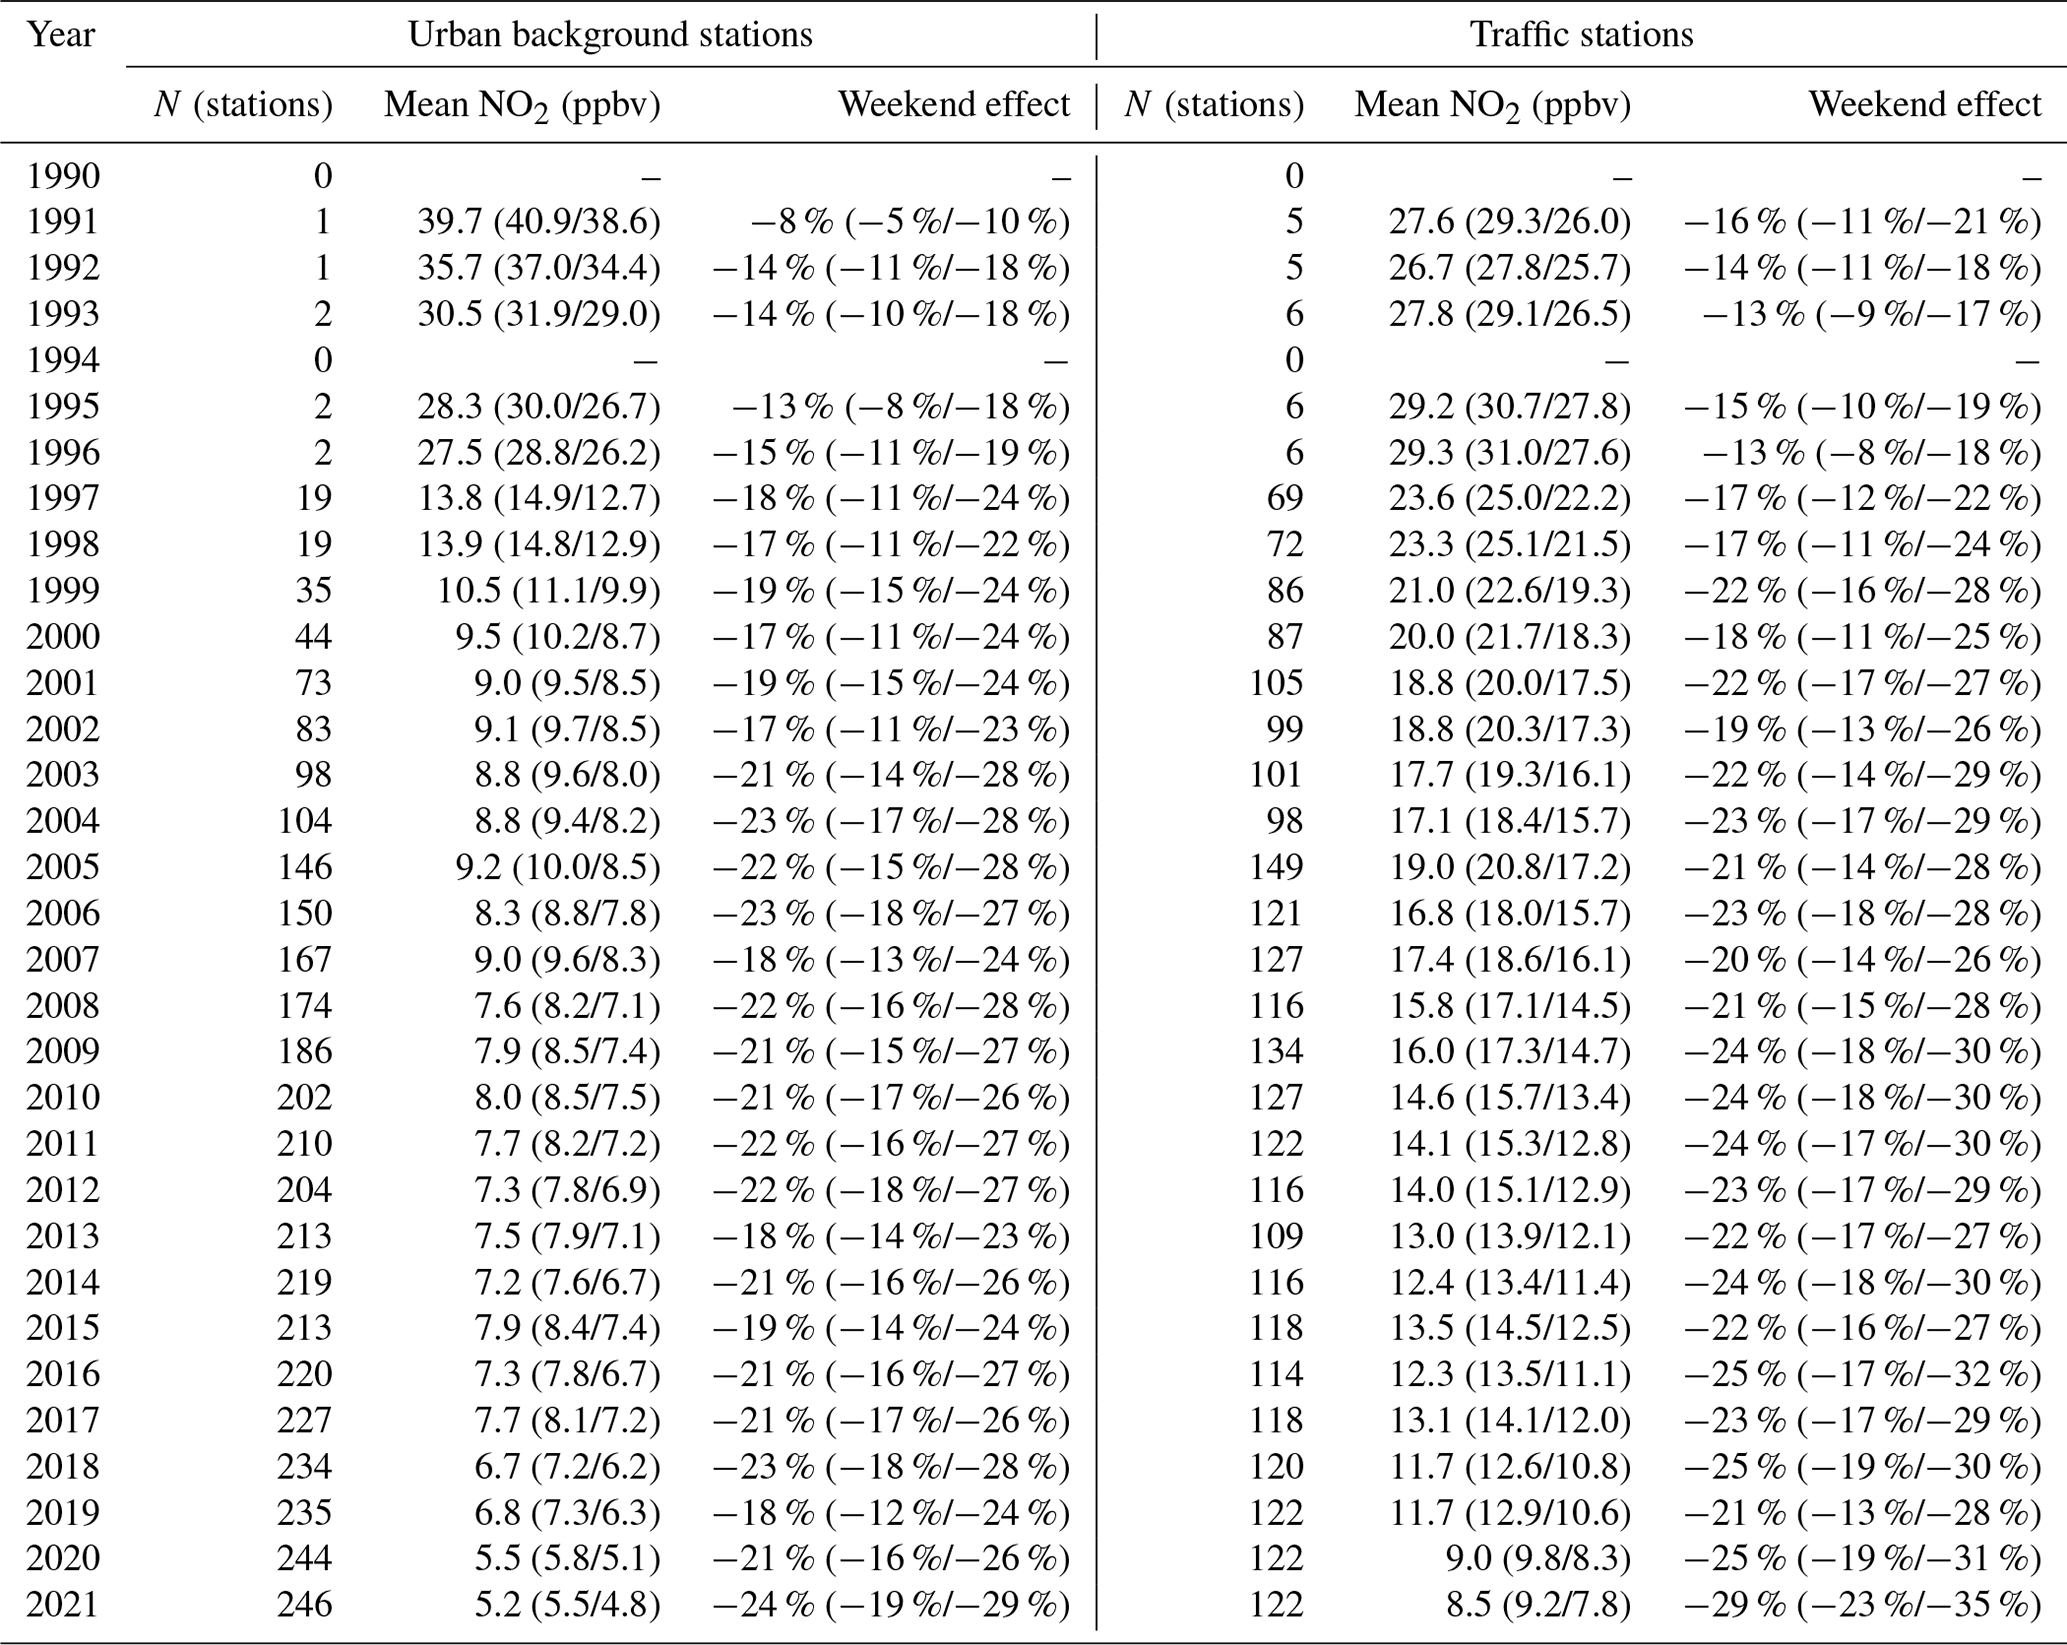
Table G3Mean TROPOMI-based TrC-NO2 weekend effect above different groups of industrial point sources across Spain. pX here corresponds to the Xth percentile of the mean emission of the different industrial point sources. Specific industrial activities were grouped according to the Selected Nomenclature for Air Pollution (SNAP) classification system.
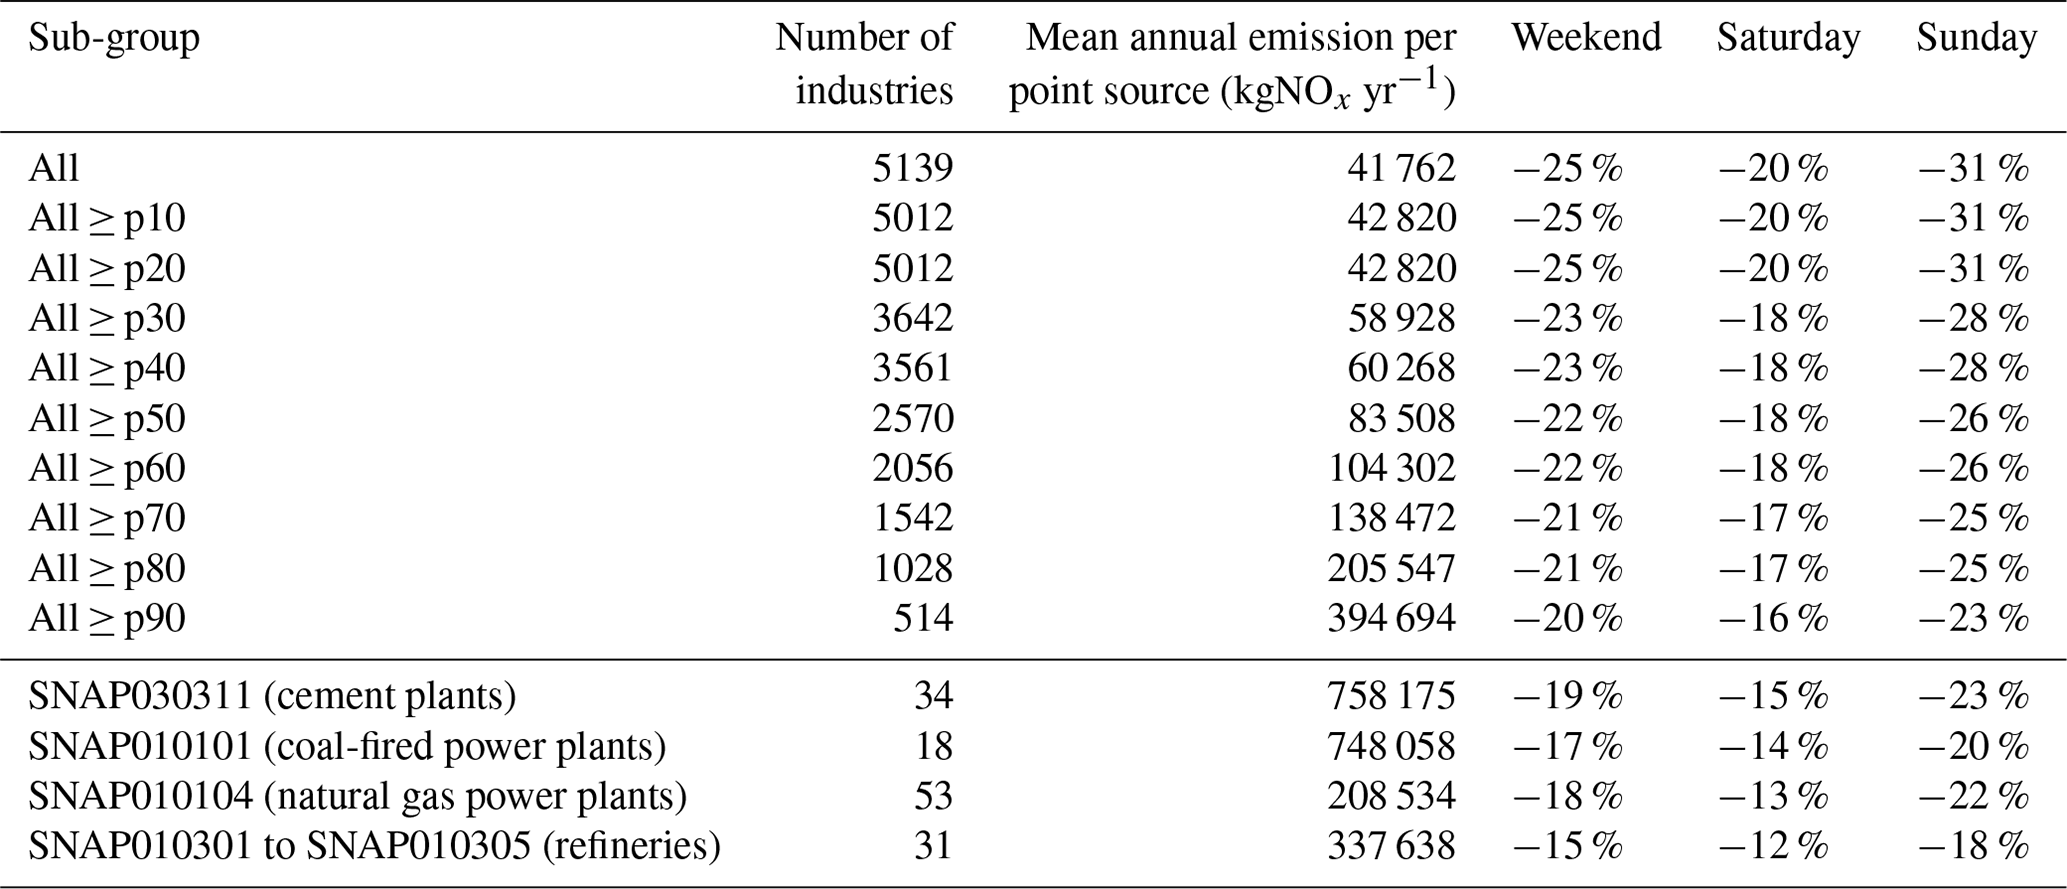
Sentinel-5p RPRO + OFFL TrC-NO2 data are freely available on the Sentinel-5P Pre-Operations Data Hub (https://scihub.copernicus.eu/; Copernicus Sentinel-5P, 2018, 2021; last access: 10 March 2022). Sentinel-5P PAL TrC-NO2 data are freely available on the S5P-PAL data portal (https://data-portal.s5p-pal.com/, last access: 21 June 2022).
HP designed the study and carried out the analysis. PAB was responsible for downloading the TROPOMI and meteorological data. DB was responsible for the acquisition and preprocessing of the air quality data through the GHOST project. MG and SE were responsible for computing the anthropogenic and natural NOx emissions. HP was responsible for writing the article. MG contributed especially on the discussion related to emissions. SC reviewed the discussion related to TROPOMI data. HP, CPGP, SC, OJ, AS, MG and FL contributed to the interpretation of results and the review of the article.
The contact author has declared that none of the authors has any competing interests.
Publisher’s note: Copernicus Publications remains neutral with regard to jurisdictional claims in published maps and institutional affiliations.
We acknowledge the RES (AECT-2022-1-0008, AECT-2022-2-0003) for awarding us access to the MareNostrum supercomputer in the Barcelona Supercomputing Center, and we also acknowledge the support from the Red Temática ACTRIS España (CGL2017-90884-REDT) and the H2020 ACTRIS IMP (no. 871115). SC acknowledges support from BELSPO through BRAIN-BE 2.0 project LEGO-BEL-AQ (contract B2/191/P1/LEGO-BEL-AQ). Last but not least, we gratefully acknowledge the outstanding work done by the Python development teams behind some specific libraries, including numpy, pandas, xarray, matplotlib, cartopy and xESMF.
This research has received funding from the Ramon y Cajal grant (RYC2021-034511-I, MCIN/AEI/10.13039/501100011033 and European Union NextGenerationEU/PRTR), the MITIGATE (grant no. PID2020-113840RA-I00 funded by MCIN/AEI/10.13039/501100011033) and VITALISE (PID2019-108086RA-I00 MCIN/AEI/10.13039/501100011033) projects from the Agencia Estatal de Investigación (AEI), the European Union's Horizon 2020 research and innovation program under grant agreement no. 870301 (AQ-WATCH H2020 project), and the AXA Research Fund.
This paper was edited by Jayanarayanan Kuttippurath and reviewed by three anonymous referees.
Barré, J., Petetin, H., Colette, A., Guevara, M., Peuch, V.-H., Rouil, L., Engelen, R., Inness, A., Flemming, J., Pérez García-Pando, C., Bowdalo, D., Meleux, F., Geels, C., Christensen, J. H., Gauss, M., Benedictow, A., Tsyro, S., Friese, E., Struzewska, J., Kaminski, J. W., Douros, J., Timmermans, R., Robertson, L., Adani, M., Jorba, O., Joly, M., and Kouznetsov, R.: Estimating lockdown-induced European NO2 changes using satellite and surface observations and air quality models, Atmos. Chem. Phys., 21, 7373–7394, https://doi.org/10.5194/acp-21-7373-2021, 2021. a
Bauwens, M., Compernolle, S., Stavrakou, T., Müller, J., Gent, J., Eskes, H., Levelt, P. F., A, R., Veefkind, J. P., Vlietinck, J., Yu, H., and Zehner, C.: Impact of Coronavirus Outbreak on NO2 Pollution Assessed Using TROPOMI and OMI Observations, Geophys. Res. Lett., 47, 11, https://doi.org/10.1029/2020GL087978, 2020. a
Beirle, S., Borger, C., Dörner, S., Eskes, H., Kumar, V., de Laat, A., and Wagner, T.: Catalog of NOx emissions from point sources as derived from the divergence of the NO2 flux for TROPOMI, Earth Syst. Sci. Data, 13, 2995–3012, https://doi.org/10.5194/essd-13-2995-2021, 2021. a
Berkes, F., Houben, N., Bundke, U., Franke, H., Pätz, H.-W., Rohrer, F., Wahner, A., and Petzold, A.: The IAGOS NOx instrument – design, operation and first results from deployment aboard passenger aircraft, Atmos. Meas. Tech., 11, 3737–3757, https://doi.org/10.5194/amt-11-3737-2018, 2018. a
Bovensmann, H., Burrows, J., Buchwitz, M., Frerick, J., Noël, S., Rozanov, V., Chance, K., and Goede, A.: SCIAMACHY: Mission objectives and measurement modes, J. Atmos. Sci., 56, 127–150, https://doi.org/10.1175/1520-0469(1999)056<0127:SMOAMM>2.0.CO;2, 1999. a
Bowdalo, D., Petetin, H., Jorba, O., Guevara, M., Soret, A., Bojovic, D., Terrado, M., Querol, X., and Pérez García-Pando, C.: Compliance with 2021 WHO air quality guidelines across Europe will require radical measures, Environ. Res. Lett., 17, 021002, https://doi.org/10.1088/1748-9326/ac44c7, 2022. a
Buchhorn, M., Smets, B., Bertels, L., De Roo, B., Lesiv, M., Tsendbazar, N. E., Herold, M., and Fritz, S.: Copernicus Global Land Service: Land Cover 100 m: collection 3: epoch 2019: Globe, Tech. Rep. [data set], https://doi.org/10.5281/zenodo.3939050, 2020. a
Butterbach-Bahl, K., Baggs, E. M., Dannenmann, M., Kiese, R., and Zechmeister-Boltenstern, S.: Nitrous oxide emissions from soils: how well do we understand the processes and their controls?, Philos. T. R. Soc. B, 368, 20130122, https://doi.org/10.1098/rstb.2013.0122, 2013. a, b
Cersosimo, A., Serio, C., and Masiello, G.: TROPOMI NO2 Tropospheric Column Data: Regridding to 1 km Grid-Resolution and Assessment of their Consistency with In Situ Surface Observations, Remote Sens., 12, 2212, https://doi.org/10.3390/rs12142212, 2020. a
Compernolle, S., Verhoelst, T., Pinardi, G., Granville, J., Hubert, D., Keppens, A., Niemeijer, S., Rino, B., Bais, A., Beirle, S., Boersma, F., Burrows, J. P., De Smedt, I., Eskes, H., Goutail, F., Hendrick, F., Lorente, A., Pazmino, A., Piters, A., Peters, E., Pommereau, J.-P., Remmers, J., Richter, A., van Geffen, J., Van Roozendael, M., Wagner, T., and Lambert, J.-C.: Validation of Aura-OMI QA4ECV NO2 climate data records with ground-based DOAS networks: the role of measurement and comparison uncertainties, Atmos. Chem. Phys., 20, 8017–8045, https://doi.org/10.5194/acp-20-8017-2020, 2020. a
Compernolle, S., Argyrouli, A., Lutz, R., Sneep, M., Lambert, J.-C., Fjæraa, A. M., Hubert, D., Keppens, A., Loyola, D., O'Connor, E., Romahn, F., Stammes, P., Verhoelst, T., and Wang, P.: Validation of the Sentinel-5 Precursor TROPOMI cloud data with Cloudnet, Aura OMI O2–O2 MODIS, and Suomi-NPP VIIRS, Atmos. Meas. Tech., 14, 2451–2476, https://doi.org/10.5194/amt-14-2451-2021, 2021. a, b
Cooper, M. J., Martin, R. V., McLinden, C. A., and Brook, J. R.: Inferring ground-level nitrogen dioxide concentrations at fine spatial resolution applied to the TROPOMI satellite instrument, Environ. Res. Lett., 15, 104013, https://doi.org/10.1088/1748-9326/aba3a5, 2020. a
Copernicus Climate Change Service (C3S): ERA5 hourly data on single levels from 1940 to present. Copernicus Climate Change Service (C3S) Climate Data Store (CDS), https://www.doi.org/10.24381/cds.adbb2d47 (last access: 18 July 2022), 2023. a
Copernicus Sentinel-5P (processed by ESA): TROPOMI Level 2 Nitrogen Dioxide total column products, Version 01, European Space Agency [data set], https://doi.org/10.5270/S5P-s4ljg54, 2018. a
Copernicus Sentinel-5P (processed by ESA): TROPOMI Level 2 Nitrogen Dioxide total column products, Version 02, European Space Agency [data set], https://doi.org/10.5270/S5P-9bnp8q8, 2021. a
De Smedt, I., Pinardi, G., Vigouroux, C., Compernolle, S., Bais, A., Benavent, N., Boersma, F., Chan, K.-L., Donner, S., Eichmann, K.-U., Hedelt, P., Hendrick, F., Irie, H., Kumar, V., Lambert, J.-C., Langerock, B., Lerot, C., Liu, C., Loyola, D., Piters, A., Richter, A., Rivera Cárdenas, C., Romahn, F., Ryan, R. G., Sinha, V., Theys, N., Vlietinck, J., Wagner, T., Wang, T., Yu, H., and Van Roozendael, M.: Comparative assessment of TROPOMI and OMI formaldehyde observations and validation against MAX-DOAS network column measurements, Atmos. Chem. Phys., 21, 12561–12593, https://doi.org/10.5194/acp-21-12561-2021, 2021. a
Douros, J., Eskes, H., van Geffen, J., Boersma, K. F., Compernolle, S., Pinardi, G., Blechschmidt, A.-M., Peuch, V.-H., Colette, A., and Veefkind, P.: Comparing Sentinel-5P TROPOMI NO2 column observations with the CAMS-regional air quality ensemble, EGUsphere [preprint], https://doi.org/10.5194/egusphere-2022-365, 2022. a, b
Dunlea, E. J., Herndon, S. C., Nelson, D. D., Volkamer, R. M., San Martini, F., Sheehy, P. M., Zahniser, M. S., Shorter, J. H., Wormhoudt, J. C., Lamb, B. K., Allwine, E. J., Gaffney, J. S., Marley, N. A., Grutter, M., Marquez, C., Blanco, S., Cardenas, B., Retama, A., Ramos Villegas, C. R., Kolb, C. E., Molina, L. T., and Molina, M. J.: Evaluation of nitrogen dioxide chemiluminescence monitors in a polluted urban environment, Atmos. Chem. Phys., 7, 2691–2704, https://doi.org/10.5194/acp-7-2691-2007, 2007. a
EEA: Air Quality e-Reporting Database, European Environment Agency, http://www.eea.europa.eu/data- and-maps/data/aqereporting-8, last access: 1 May 2020. a
Emde, C., Yu, H., Kylling, A., van Roozendael, M., Stebel, K., Veihelmann, B., and Mayer, B.: Impact of 3D cloud structures on the atmospheric trace gas products from UV–Vis sounders – Part 1: Synthetic dataset for validation of trace gas retrieval algorithms, Atmos. Meas. Tech., 15, 1587–1608, https://doi.org/10.5194/amt-15-1587-2022, 2022. a
Eskes, H., van Geffen, J., Sneep, M., Veefkind, P., Niemeijer, S., and Zehner, C.: S5P Nitrogen Dioxide v02.03.01 intermediate reprocessing on the S5P-PAL system: Readme file, Tech. Rep., https://data-portal.s5p-pal.com/product-docs/no2/PAL_reprocessing_NO_2_v02.03.01_20211215.pdf (last access: 21 June 2022), 2021. a
Eskes, H., van Geffen, J., Boersma, F., Eichmann, K.-U., Apituley, A., Pedergnana, M., Sneep, M., Veefkind, J. P., and Loyola, D.: Sentinel-5 precursor/TROPOMI Level 2 Product User Manual Nitrogen dioxide, Tech. Rep., https://sentinel.esa.int/documents/247904/2474726/Sentinel-5P-Level-2-Product-User-Manual-Nitrogen-Dioxide.pdf (last access: 1 September 2022), 2022. a
Eskes, H. J. and Eichmann, K.-U.: S5P Mission Performance Centre Nitrogen Dioxide [L2 NO2] Readme, Tech. Rep., https://sentinel.esa.int/documents/247904/3541451/Sentinel-5P-Nitrogen-Dioxide-Level-2-Product-Readme-File (last access: 1 September 2022), 2022. a
Georgoulias, A. K., Boersma, K. F., van Vliet, J., Zhang, X., van der A, R., Zanis, P., and de Laat, J.: Detection of NO2 pollution plumes from individual ships with the TROPOMI/S5P satellite sensor, Environ. Res. Lett., 15, 124037, https://doi.org/10.1088/1748-9326/abc445, 2020. a
Goldberg, D. L., Anenberg, S. C., Kerr, G. H., Mohegh, A., Lu, Z., and Streets, D. G.: TROPOMI NO2 in the United States: A Detailed Look at the Annual Averages, Weekly Cycles, Effects of Temperature, and Correlation With Surface NO2 Concentrations, Earth's Future, 9, 4, https://doi.org/10.1029/2020EF001665, 2021a. a, b
Goldberg, D. L., Anenberg, S. C., Lu, Z., Streets, D. G., Lamsal, L. N., E McDuffie, E., and Smith, S. J.: Urban NOx emissions around the world declined faster than anticipated between 2005 and 2019, Environ. Res. Lett., 16, 115004, https://doi.org/10.1088/1748-9326/ac2c34, 2021b. a
Griffin, D., Zhao, X., McLinden, C. A., Boersma, F., Bourassa, A., Dammers, E., Degenstein, D., Eskes, H., Fehr, L., Fioletov, V., Hayden, K., Kharol, S. K., Li, S.-M., Makar, P., Martin, R. V., Mihele, C., Mittermeier, R. L., Krotkov, N., Sneep, M., Lamsal, L. N., ter Linden, M., van Geffen, J., Veefkind, P., and Wolde, M.: High-Resolution Mapping of Nitrogen Dioxide With TROPOMI: First Results and Validation Over the Canadian Oil Sands, Geophys. Res. Lett., 46, 1049–1060, https://doi.org/10.1029/2018GL081095, 2019. a
Guenther, A. B., Jiang, X., Heald, C. L., Sakulyanontvittaya, T., Duhl, T., Emmons, L. K., and Wang, X.: The Model of Emissions of Gases and Aerosols from Nature version 2.1 (MEGAN2.1): an extended and updated framework for modeling biogenic emissions, Geosci. Model Dev., 5, 1471–1492, https://doi.org/10.5194/gmd-5-1471-2012, 2012. a
Guevara, M., Tena, C., Porquet, M., Jorba, O., and Pérez García-Pando, C.: HERMESv3, a stand-alone multi-scale atmospheric emission modelling framework – Part 1: global and regional module, Geosci. Model Dev., 12, 1885–1907, https://doi.org/10.5194/gmd-12-1885-2019, 2019. a
Guevara, M., Tena, C., Porquet, M., Jorba, O., and Pérez García-Pando, C.: HERMESv3, a stand-alone multi-scale atmospheric emission modelling framework – Part 2: The bottom–up module, Geosci. Model Dev., 13, 873–903, https://doi.org/10.5194/gmd-13-873-2020, 2020. a, b
Guevara, M., Jorba, O., Tena, C., Denier van der Gon, H., Kuenen, J., Elguindi, N., Darras, S., Granier, C., and Pérez García-Pando, C.: Copernicus Atmosphere Monitoring Service TEMPOral profiles (CAMS-TEMPO): global and European emission temporal profile maps for atmospheric chemistry modelling, Earth Syst. Sci. Data, 13, 367–404, https://doi.org/10.5194/essd-13-367-2021, 2021. a
Hersbach, H., Bell, B., Berrisford, P., Hirahara, S., Horányi, A., Muñoz‐Sabater, J., Nicolas, J., Peubey, C., Radu, R., Schepers, D., Simmons, A., Soci, C., Abdalla, S., Abellan, X., Balsamo, G., Bechtold, P., Biavati, G., Bidlot, J., Bonavita, M., Chiara, G., Dahlgren, P., Dee, D., Diamantakis, M., Dragani, R., Flemming, J., Forbes, R., Fuentes, M., Geer, A., Haimberger, L., Healy, S., Hogan, R. J., Hólm, E., Janisková, M., Keeley, S., Laloyaux, P., Lopez, P., Lupu, C., Radnoti, G., Rosnay, P., Rozum, I., Vamborg, F., Villaume, S., and Thépaut, J.: The ERA5 global reanalysis, Q. J. Roy. Meteorol. Soc., 146, 1999–2049, https://doi.org/10.1002/qj.3803, 2020. a
Huber, D. E., Steiner, A. L., and Kort, E. A.: Daily Cropland Soil NOx Emissions Identified by TROPOMI and SMAP, Geophys. Res. Lett., 47, 22, https://doi.org/10.1029/2020GL089949, 2020. a
Ialongo, I., Virta, H., Eskes, H., Hovila, J., and Douros, J.: Comparison of TROPOMI/Sentinel-5 Precursor NO2 observations with ground-based measurements in Helsinki, Atmos. Meas. Tech., 13, 205–218, https://doi.org/10.5194/amt-13-205-2020, 2020. a
Jeong, U. and Hong, H.: Assessment of Tropospheric Concentrations of NO2 from the TROPOMI/Sentinel-5 Precursor for the Estimation of Long-Term Exposure to Surface NO2 over South Korea, Remote Sens., 13, 1877, https://doi.org/10.3390/rs13101877, 2021. a
Kuenen, J., Dellaert, S., Visschedijk, A., Jalkanen, J.-P., Super, I., and Denier van der Gon, H.: CAMS-REG-v4: a state-of-the-art high-resolution European emission inventory for air quality modelling, Earth Syst. Sci. Data, 14, 491–515, https://doi.org/10.5194/essd-14-491-2022, 2022. a
Kylling, A., Emde, C., Yu, H., van Roozendael, M., Stebel, K., Veihelmann, B., and Mayer, B.: Impact of 3D cloud structures on the atmospheric trace gas products from UV–Vis sounders – Part 3: Bias estimate using synthetic and observational data, Atmos. Meas. Tech., 15, 3481–3495, https://doi.org/10.5194/amt-15-3481-2022, 2022. a
Lambert, J.-C., Keppens, A., Compernolle, S., Eichmann, K.-U., de Graaf, M., Hubert, D., Langerock, B., Ludewig, A., Sha, M., Verhoelst, T., Wagner, T., Ahn, C., Argyrouli, A., Balis, D., Chan, K., Smedt, I. D., Eskes, H., Fjæraa, A., Garane, K., Gleason, J., Goutail, F., Granville, J., Hedelt, P., Heue, K.-P., Jaross, G., Kleipool, Q., Koukouli, M., Delgado, A. L., Lutz, R., Michailidis, K., Nanda, S., Niemeijer, S., Pazmiño, A., Pinardi, G., Pommereau, J.-P., Richter, A., Rozemeijer, N., Sneep, M., Zweers, D. S., Theys, N., Tilstra, G., Torres, O., Valks, P., van Geffen, J., Vigouroux, C., Wang, P., and Weber, M.: Quarterly Validation Report of the Copernicus Sentinel-5 Precursor Operational Data Products 15: April 2018–May 2022, Tech. Rep., S5P MPC Routine Operations Consolidated Validation Report series, Issue 15, Version 15.01.00, https://mpc-vdaf.tropomi.eu/ProjectDir/reports//pdf/S5P-MPC-IASB-ROCVR-15.01.00_20220713_signed.pdf (last access: 1 September 2022), 2022. a
Levelt, P. F., Joiner, J., Tamminen, J., Veefkind, J. P., Bhartia, P. K., Stein Zweers, D. C., Duncan, B. N., Streets, D. G., Eskes, H., van der A, R., McLinden, C., Fioletov, V., Carn, S., de Laat, J., DeLand, M., Marchenko, S., McPeters, R., Ziemke, J., Fu, D., Liu, X., Pickering, K., Apituley, A., González Abad, G., Arola, A., Boersma, F., Chan Miller, C., Chance, K., de Graaf, M., Hakkarainen, J., Hassinen, S., Ialongo, I., Kleipool, Q., Krotkov, N., Li, C., Lamsal, L., Newman, P., Nowlan, C., Suleiman, R., Tilstra, L. G., Torres, O., Wang, H., and Wargan, K.: The Ozone Monitoring Instrument: overview of 14 years in space, Atmos. Chem. Phys., 18, 5699–5745, https://doi.org/10.5194/acp-18-5699-2018, 2018. a
Llorent-Bedmar, V., Cobano-Delgado Palma, V. C., and Navarro-Granados, M.: The rural exodus of young people from empty Spain. Socio-educational aspects, J. Rural Stud., 82, 303–314, https://doi.org/10.1016/j.jrurstud.2021.01.014, 2021. a
Lu, X., Ye, X., Zhou, M., Zhao, Y., Weng, H., Kong, H., Li, K., Gao, M., Zheng, B., Lin, J., Zhou, F., Zhang, Q., Wu, D., Zhang, L., and Zhang, Y.: The underappreciated role of agricultural soil nitrogen oxide emissions in ozone pollution regulation in North China, Nat. Commun., 12, 5021, https://doi.org/10.1038/s41467-021-25147-9, 2021. a
Lupaşcu, A. and Butler, T.: Source attribution of European surface O3 using a tagged O3 mechanism, Atmos. Chem. Phys., 19, 14535–14558, https://doi.org/10.5194/acp-19-14535-2019, 2019. a
Pay, M. T., Gangoiti, G., Guevara, M., Napelenok, S., Querol, X., Jorba, O., and Pérez García-Pando, C.: Ozone source apportionment during peak summer events over southwestern Europe, Atmos. Chem. Phys., 19, 5467–5494, https://doi.org/10.5194/acp-19-5467-2019, 2019. a
Pérez-Invernón, F. J., Huntrieser, H., Erbertseder, T., Loyola, D., Valks, P., Liu, S., Allen, D. J., Pickering, K. E., Bucsela, E. J., Jöckel, P., van Geffen, J., Eskes, H., Soler, S., Gordillo-Vázquez, F. J., and Lapierre, J.: Quantification of lightning-produced NOx over the Pyrenees and the Ebro Valley by using different TROPOMI-NO2 and cloud research products, Atmos. Meas. Tech., 15, 3329–3351, https://doi.org/10.5194/amt-15-3329-2022, 2022. a
Pope, R. J., Kelly, R., Marais, E. A., Graham, A. M., Wilson, C., Harrison, J. J., Moniz, S. J. A., Ghalaieny, M., Arnold, S. R., and Chipperfield, M. P.: Exploiting satellite measurements to explore uncertainties in UK bottom-up NOx emission estimates, Atmos. Chem. Phys., 22, 4323–4338, https://doi.org/10.5194/acp-22-4323-2022, 2022. a
Sanchez-Lorenzo, A., Calbó, J., and Wild, M.: Increasing cloud cover in the 20th century: review and new findings in Spain, Clim. Past, 8, 1199–1212, https://doi.org/10.5194/cp-8-1199-2012, 2012. a
Sanchez-Lorenzo, A., Enriquez-Alonso, A., Calbó, J., González, J.-A., Wild, M., Folini, D., Norris, J. R., and Vicente-Serrano, S. M.: Fewer clouds in the Mediterranean: consistency of observations and climate simulations, Sci. Rep., 7, 41475, https://doi.org/10.1038/srep41475, 2017. a
Schiavina, M., Moreno-Monroy, A., Maffenini, L., and Veneri, P.: GHSL-OECD Functional Urban Areas, https://doi.org/10.2760/67415, 2019. a
Schneider, P., Hamer, P. D., Kylling, A., Shetty, S., and Stebel, K.: Spatiotemporal Patterns in Data Availability of the Sentinel-5P NO2 Product over Urban Areas in Norway, Remote Sens., 13, 2095, https://doi.org/10.3390/rs13112095, 2021. a
Skamarock, W. C., Klemp, J. B., Dudhia, J., Gill, D. O., Barker, D. M., Wang, W., and Powers, J. G.: A Description of the Advanced Research WRF Version 3 (No. NCAR/TN-475+STR), University Corporation for Atmospheric Research, https://doi.org/10.5065/D68S4MVH, 2008. a
Skiba, U., Medinets, S., Cardenas, L. M., Carnell, E. J., Hutchings, N., and Amon, B.: Assessing the contribution of soil NOx emissions to European atmospheric pollution, Environ. Res. Lett., 16, 2, https://doi.org/10.1088/1748-9326/abd2f2, 2020. a
Stavrakou, T., Müller, J.-F., Bauwens, M., Boersma, K. F., and van Geffen, J.: Satellite evidence for changes in the NO2 weekly cycle over large cities, Sci. Rep., 10, 10066, https://doi.org/10.1038/s41598-020-66891-0, 2020. a, b, c
Tack, F., Merlaud, A., Iordache, M.-D., Pinardi, G., Dimitropoulou, E., Eskes, H., Bomans, B., Veefkind, P., and Van Roozendael, M.: Assessment of the TROPOMI tropospheric NO2 product based on airborne APEX observations, Atmos. Meas. Tech., 14, 615–646, https://doi.org/10.5194/amt-14-615-2021, 2021. a
Tapiador, F. J., Villalba-Pradas, A., Navarro, A., Martín, R., Merino, A., García-Ortega, E., Sánchez, J. L., Kim, K., and Lee, G.: A Satellite View of an Intense Snowfall in Madrid (Spain): The Storm “Filomena” in January 2021, Remote Sens., 13, 2702, https://doi.org/10.3390/rs13142702, 2021. a, b
Valks, P., Pinardi, G., Richter, A., Lambert, J.-C., Hao, N., Loyola, D., Van Roozendael, M., and Emmadi, S.: Operational total and tropospheric NO2 column retrieval for GOME-2, Atmos. Meas. Tech., 4, 1491–1514, https://doi.org/10.5194/amt-4-1491-2011, 2011. a
van Geffen, J., Eskes, H., Boersma, K., and Veefkind, J.: TROPOMI ATBD of the total and tropospheric NO2 data products, Tech. Rep., https://sentinel.esa.int/documents/247904/2476257/sentinel-5p-tropomi-atbd-no2-data-products (last access: 1 September 2022), 2022a. a
van Geffen, J., Eskes, H., Compernolle, S., Pinardi, G., Verhoelst, T., Lambert, J.-C., Sneep, M., ter Linden, M., Ludewig, A., Boersma, K. F., and Veefkind, J. P.: Sentinel-5P TROPOMI NO2 retrieval: impact of version v2.2 improvements and comparisons with OMI and ground-based data, Atmos. Meas. Tech., 15, 2037–2060, https://doi.org/10.5194/amt-15-2037-2022, 2022b. a, b, c
Veefkind, J. P., Aben, I., McMullan, K., Förster, H., de Vries, J., Otter, G., Claas, J., Eskes, H., de Haan, J., Kleipool, Q., van Weele, M., Hasekamp, O., Hoogeveen, R., Landgraf, J., Snel, R., Tol, P., Ingmann, P., Voors, R., Kruizinga, B., Vink, R., Visser, H., and Levelt, P.: TROPOMI on the ESA Sentinel-5 Precursor: A GMES mission for global observations of the atmospheric composition for climate, air quality and ozone layer applications, Remote Sens. Environ., 120, 70–83, https://doi.org/10.1016/j.rse.2011.09.027, 2012. a, b
Verhoelst, T., Compernolle, S., Pinardi, G., Lambert, J.-C., Eskes, H. J., Eichmann, K.-U., Fjæraa, A. M., Granville, J., Niemeijer, S., Cede, A., Tiefengraber, M., Hendrick, F., Pazmiño, A., Bais, A., Bazureau, A., Boersma, K. F., Bognar, K., Dehn, A., Donner, S., Elokhov, A., Gebetsberger, M., Goutail, F., Grutter de la Mora, M., Gruzdev, A., Gratsea, M., Hansen, G. H., Irie, H., Jepsen, N., Kanaya, Y., Karagkiozidis, D., Kivi, R., Kreher, K., Levelt, P. F., Liu, C., Müller, M., Navarro Comas, M., Piters, A. J. M., Pommereau, J.-P., Portafaix, T., Prados-Roman, C., Puentedura, O., Querel, R., Remmers, J., Richter, A., Rimmer, J., Rivera Cárdenas, C., Saavedra de Miguel, L., Sinyakov, V. P., Stremme, W., Strong, K., Van Roozendael, M., Veefkind, J. P., Wagner, T., Wittrock, F., Yela González, M., and Zehner, C.: Ground-based validation of the Copernicus Sentinel-5P TROPOMI NO2 measurements with the NDACC ZSL-DOAS, MAX-DOAS and Pandonia global networks, Atmos. Meas. Tech., 14, 481–510, https://doi.org/10.5194/amt-14-481-2021, 2021. a, b
Villena, G., Bejan, I., Kurtenbach, R., Wiesen, P., and Kleffmann, J.: Interferences of commercial NO2 instruments in the urban atmosphere and in a smog chamber, Atmos. Meas. Tech., 5, 149–159, https://doi.org/10.5194/amt-5-149-2012, 2012. a
Wang, Y., Ge, C., Castro Garcia, L., Jenerette, G. D., Oikawa, P. Y., and Wang, J.: Improved modelling of soil NOx emissions in a high temperature agricultural region: role of background emissions on NO2 trend over the US, Environ. Res. Lett., 16, 084061, https://doi.org/10.1088/1748-9326/ac16a3, 2021. a
Yu, H., Emde, C., Kylling, A., Veihelmann, B., Mayer, B., Stebel, K., and Van Roozendael, M.: Impact of 3D cloud structures on the atmospheric trace gas products from UV–Vis sounders – Part 2: Impact on NO2 retrieval and mitigation strategies, Atmos. Meas. Tech., 15, 5743–5768, https://doi.org/10.5194/amt-15-5743-2022, 2022. a
Zara, M., Boersma, K. F., Eskes, H., Denier van der Gon, H., Vilà-Guerau de Arellano, J., Krol, M., van der Swaluw, E., Schuch, W., and Velders, G. J.: Reductions in nitrogen oxides over the Netherlands between 2005 and 2018 observed from space and on the ground: Decreasing emissions and increasing O3 indicate changing NOx chemistry, Atmos. Environ., 9, 100104, https://doi.org/10.1016/j.aeaoa.2021.100104, 2021. a
Zhang, C., Liu, C., Li, B., Zhao, F., and Zhao, C.: Spatiotemporal neural network for estimating surface NO2 concentrations over north China and their human health impact, Environ. Pollut., 307, 119510, https://doi.org/10.1016/j.envpol.2022.119510, 2022. a
Zhuang, J., Dussin, R., Huard, D., Bourgault, P., Banihirwe, A., Raynaud, S., Malevich, B., Schupfner, M., Levang, S., Jüling, A., Almansi, M., Filipe, RichardScottOZ, RondeauG, Rasp, S., Stachelek, J., Bell, R., Smith, T. J., and Li, X.: pangeo-data/xESMF: v0.7.0 (v0.7.0), Tech. Rep., Zenodo, https://doi.org/10.5281/zenodo.7447707, 2022. a
- Abstract
- Introduction
- Data and methods
- Results
- Discussion and conclusions
- Appendix A: Spatial resolution of TROPOMI pixels
- Appendix B: Comparison between PAL and OFFL + RPRO
- Appendix C: Statistical metrics
- Appendix D: Quality assurance with GHOST
- Appendix E: NO2 pollution in Madrid during the Filomena event
- Appendix F: Case study of Madrid for illustrating the flattening of the NO2 pollution seasonal peak
- Appendix G: Other figures and tables
- Data availability
- Author contributions
- Competing interests
- Disclaimer
- Acknowledgements
- Financial support
- Review statement
- References