the Creative Commons Attribution 4.0 License.
the Creative Commons Attribution 4.0 License.
 | 31 Mar 2023
Vehicular ammonia emissions: an underappreciated emission source in densely populated areas
Yifan Wen
Jiming Hao
On-road ammonia (NH3) emissions play a significant role in fine particulate matter (PM2.5) formation in urban areas, posing severe risks for human health. Limited studies have depicted the spatial and temporal variations of on-road NH3 emissions, in particular lacking detailed quantification of their contributions within densely populated areas. In this study, we established a comprehensive vehicular NH3 emission model and compiled a gridded on-road NH3 emission inventory with high spatial (3 km × 3 km) and temporal (monthly) resolution for mainland China. China's annual vehicular NH3 emissions are estimated to increase from 32.8 ± 1.7 to 87.1 ± 37.5 kt during the period of 2000–2019. Vehicular NH3 emissions are significantly concentrated in densely populated areas, where agricultural emissions have relatively lower intensity. It is found that vehicular NH3 emissions could exceed agricultural emissions in the grids containing 23.0 ± 2.1 % of the Chinese population in 2019 (approximately 326.6 ± 25.4 million people), and this ratio is up to 29.4 ± 3.0 % in winter. For extremely populous megacities such as Beijing and Shanghai, vehicular NH3 emissions exceed agricultural emissions, where 69.2 ± 1.2 % and 72.0 ± 1.3 % of the population resides, respectively. Thus, the significant role of on-road NH3 emissions in populated areas may have been underappreciated. This study gave a better insight into the absolute value and relative importance of on-road NH3 emissions for different regions, seasons and population densities in China; this is important in terms of the implications for air quality.
- Article
(6069 KB) - Full-text XML
-
Supplement
(971 KB) - BibTeX
- EndNote


As the leading alkaline gas and one of the major reactive nitrogen species in the atmosphere, ammonia (NH3) plays a vital role in fine particulate matter (PM2.5) pollution and nitrogen deposition. NH3 readily neutralizes with acidic species from precursors of sulfur dioxide (SO2) and nitrogen oxides (NOx) to form secondary organic aerosols (SOAs) (Lv et al., 2022; Chu et al., 2016), which not only enhances regional haze but also threatens public health (Huang et al., 2014; Ru-Jin et al., 2014; Pan et al., 2016). It is found that NH3 emissions contributed a larger amount to PM2.5 than NOx emission globally and in most countries, indicating that PM2.5 is more strongly NH3-limited than NOx-limited (Gu et al., 2021). There is increasing evidence indicating that the reduction of NH3 emissions should be more efficient than other particle precursors at mitigating haze pollution (Fu et al., 2017; Gu et al., 2021), highlighting the priority for ammonia regulation. After removal from atmosphere, NH3 and ammonium (NH) from both wet and dry deposition may also contribute to soil acidification, eutrophication and even a reduction of biodiversity (Stevens et al., 2004; Li et al., 2016). Therefore, efforts to better understand and control NH3 emissions are essential.
Although agriculture dominates the total anthropogenic NH3 emissions at global scales (Paulot et al., 2014), increasing studies have pointed out the significant role of on-road NH3 emissions in urban areas (Chang et al., 2016; Farren et al., 2020; Fenn et al., 2018; Sun et al., 2017b). On-road NH3 emissions are highly concentrated in densely populated areas, where agricultural emissions rarely exist (Sun et al., 2017a). It is reported that on-road NH3 emissions have exceeded agricultural emissions where nearly half of the US population resides (Sun et al., 2017a; Fenn et al., 2018). Pronounced bimodal diurnal variations in NH3 concentration consistent with traffic patterns were also observed in many megacities, suggesting a significant contribution of on-road NH3 emissions in urban areas (Wang et al., 2015; Pandolfi et al., 2012). Moreover, on-road NH3 emissions are co-emitted with NOx in dense, highly urbanized areas and may have a more effective pathway to particle formation than agricultural NH3 emitted in rural, low-NOx areas (Farren et al., 2020). Thus, on-road NH3 emissions could be critical for public health in urban areas due to their contribution to PM2.5 formation, since more than half of the global population lives in cities (World Bank Group, 2022).
There are two major sources for vehicular NH3 emissions – gasoline vehicles equipped with three-way catalysts (TWCs) and diesel vehicles equipped with selective catalytic reduction (SCR). NH3 is the by-product from the reduction of nitric oxide (NO) for gasoline vehicles equipped with TWCs (Livingston et al., 2009; Bishop and Stedman, 2015). Also, NH3 leakage during the injection of urea into the SCR system, commonly termed “ammonia slip”, is gaining importance with the extensive applications of SCR in diesel vehicles (Suarez-Bertoa et al., 2017; Mendoza-Villafuerte et al., 2017; He et al., 2020). With the extensive equipment of TWCs and SCR due to the latest emission standards, NH3 has been contributing increasing fractions of the reactive nitrogen species emitted by vehicles in the recent decade (Bishop et al., 2010; Sun et al., 2017b; Fenn et al., 2018). However, regulations for on-road NH3 emissions are far behind other traffic-related pollutants (i.e., NOx, PM, CO and HC) (Wu et al., 2017b). Currently, the heavy-duty Euro VI and China VI are the only emission standards that legislate an NH3 emission cap (10 ppm as the cycle-average slip limit), aiming at restraining SCR slip (Sun et al., 2017a). To respond to the increasing concern regarding vehicular NH3 emissions, stringent limits of 20 mg km−1 for light-duty vehicles and 65 mg kWh−1 for heavy-duty vehicles have been introduced in a proposal version of future Euro 7/VII regulations (European Commission et al., 2022). The introduction of NH3 emission limits will require installation of specific aftertreatment devices; for example, ammonia slip catalysts (ASCs) and clean-up catalysts (CUCs) are expected to ensure that Euro 7/VII vehicles comply with these proposed limits (Torp et al., 2021).
NH3 emission inventories can significantly affect the accuracy of PM2.5 modeling and play a crucial role in the refinement of mitigation strategies. Numerous studies have established NH3 emission inventories on a global level (Meng et al., 2017), national level (Fenn et al., 2018; Xing et al., 2013; Kang et al., 2016; Li et al., 2021) and regional level (Zhao et al., 2012; Zheng et al., 2012). However, these studies failed to take into account the spatial distribution of on-road NH3 emissions and the potential for relatively higher emissions from mobile sources in dense, highly urbanized areas. Also, NH3 emissions from the transportation sector are thought to be highly underestimated globally (Meng et al., 2017), in the United States (Sun et al., 2017b) and in the UK (Farren et al., 2020), mainly due to the large uncertainties that remain in vehicular NH3 emission factors (EFs) and traffic activity data (Meng et al., 2017). The exact contribution of traffic sources to NH3 emissions on various spatial scales is still an area of debate, especially in densely populated areas. Therefore, comprehensive vehicular NH3 EFs and high-quality on-road NH3 emission inventories are urgently required for air quality modeling and future NH3 regulations.
In this study, we established a comprehensive vehicular NH3 emission factor (EF; in units of mg km−1) model that includes both gasoline and diesel vehicles. The long-term trend of vehicular NH3 emissions from 2000 to 2019 was estimated based on the EF factors and province-level traffic activity data. Then, a highly resolved vehicular NH3 emission inventory with high spatial (3 km × 3 km) and temporal (monthly) resolution was compiled for mainland China, and the relative contribution of on-road vehicles to total anthropogenic NH3 emissions was analyzed among different seasons and population densities. This study is aimed to give a better insight into the absolute value and relative importance of on-road NH3 emissions for different regions, seasons and population densities; this is important in terms of the implications for air quality.
2.1 Establishment of a vehicular NH3 emission factor model
We developed a comprehensive vehicular NH3 EF model for both gasoline and diesel vehicles based on local exhaust measurement data in China. Nine vehicle categories and six emission standards (i.e., China 1/I to China 6/VI) were divided up according to the official vehicle registration rules in China (see Table S1).
For gasoline vehicles, Huang et al. (2018) revealed the strong correlation between NH3 emissions and modified combustion efficiency (MCE), an indicator calculated based on CO and CO2 emissions. In this study, CO and CO2 EFs for gasoline vehicles were obtained from the EMBEV model, the archetype model for China's National Emission Inventory Guidebook (Zhang et al., 2014). Several studies have found a significant temperature dependence of NH3 emissions from light-duty gasoline vehicles (LDGVs) that increased as the temperature decreased, mainly linked to rich combustion during cold-start operations (Selleri et al., 2022; Suarez-Bertoa et al., 2017). The latest version of EMBEV updated the cold-start sub-module and developed comprehensive ambient temperature corrections that can characterize the spatial and monthly variations in EFs across China (Wen et al., 2021), enabling us to estimate NH3 EFs for various seasons and provinces.
For diesel vehicles, we obtained NH3 measurement data from a fleet of heavy-duty diesel vehicles (HDDVs) (China III to China V) using portable emissions measurement systems (PEMSs) and dynamometers (He et al., 2020). As China VI had not been widely implemented until 2020, the NH3 EFs for HDDVs were categorized into pre-China IV (without SCR) and China IV/V (majorly equipped with SCR). The test results indicated that the introduction of SCR systems to diesel fleets might risk higher NH3 emissions, though NH3 emissions varied significantly among tested HDDVs. NH3 EFs of other diesel vehicles were calculated based on the relative fuel consumption compared with HDDVs. We did not introduce temperature corrections due to the lack of measurements.
As for the uncertainties in NH3 EFs, we referred to the error bars of NH3 emission measurements from various studies (Tables S2 and S3) to estimate the uncertainty ranges of gasoline and diesel vehicles under different emission standards, shown in Table S4. For diesel vehicles, the large uncertainty ranges in SCR-equipped EFs have included the impacts of abnormal urea uses and different SCR control strategies.
2.2 Bottom-up estimation of long-term vehicular NH3 emissions
In this study, vehicular NH3 emissions inventories by province and month were calculated for mainland China from 2000 to 2019 based on a bottom-up method, including vehicle population, vehicle kilometers traveled (VKT) and NH3 EFs by province, calendar year, month and vehicle category, as Eq. (1) illustrates.
where is the monthly vehicular NH3 emissions of province p in calendar year y from 2000 to 2019 (in units of t); is the vehicle population of province p in calendar year y, defined by vehicle category v, fuel type f and emission standard es (in units of number of vehicles); is the corresponding annual-average VKT (in units of km yr−1); and is the NH3 EFs in province p and month m, defined by vehicle category v, fuel type f and emission standard es (in units of mg km−1). The province-level vehicle population data were obtained from the National Bureau of Statistics of China (NBSC) and further processed to match up with the resolution and scale of this study (method reported by Wu et al., 2016). The annual-average VKT for various vehicle categories was estimated based on previous survey results regarding vehicle usage in China (Wu et al., 2016, 2017a; Zhang et al., 2014). The NH3 EFs by province, month and vehicle category are obtained from the vehicular NH3 emission factor model established in Sect. 2.1.
To validate the accuracy of bottom-up estimations, we compared the NH3 emissions from gasoline vehicles with the top-down estimation based on annual gasoline consumption and fuel-based EFs from related studies, as Eq. (2) illustrates.
where Etop-down,y is the top-down estimation of NH3 emissions from gasoline vehicles in calendar year y (in units of t); FCy is the annual gasoline consumption in calendar year y (in units of t); FCy is then converted to CO2 emissions based on the carbon content (0.85 g kg−1) of gasoline and the molar mass ratio of CO2 and carbon; is the fuel-based NH3 EFs of gasoline fleet in China in calendar year y from Sun et al. (2017b) (in units of ppbv ppmv−1 CO2); and M(CO2), M(C) and M(NH3) are the molar masses of CO2, carbon and NH3, respectively (in units of g mol−1). The annual gasoline consumption data were obtained from the National Bureau of Statistics of China (NBSC, 2019).
2.3 Compilation of the gridded NH3 emission inventories
NH3 emission data from other anthropogenic sources by province were obtained from the updated work of Zheng et al. (2019). The agricultural and vehicular NH3 emissions were compiled at 3 km × 3 km and monthly resolution for mainland China in 2019. Monthly variations in agricultural emissions are from Zhang et al. (2018). Emissions from fertilizer applications and livestock productions were presented at the provincial level first and then allocated by grassland areas and rural residential areas, referring to Li et al. (2021). The land cover data with a resolution of 1 km were obtained from China's National Land Use and Cover Change (CNLUCC) dataset (Xu et al., 2018).
For on-road NH3 emissions, we allocated the total vehicular NH3 emissions of each province to 3 km × 3 km grids based on the relative ratio of traffic indicator in each grid (see Eqs. 3 and 4).
where i represents grid ID; p represents province; n is the grid number in each province; Ep is the total vehicular NH3 emissions of province p in 2019 (in units of t); Ep,i is the vehicular NH3 emissions allocated to grid i (in units of t); Rtraffic,i is the traffic indicator in grid i, defined by the road length of different road types (Lrank,i, where ranks 1–3 represent highway, arterial road and residential road) and the urban area ratio (Rurban area,i); and a–e are allocating factors, referring to the traffic flow ratio of different road types in urban and rural areas in Beijing (Yang et al., 2019). Here, a–e are 1, 0.4, 0.3, 0.8, and 0.2, respectively. The digital road map was obtained from the latest OpenStreetMap data for China (OpenStreetMap, 2022). The urban area ratio was calculated based on the urban residential areas within each grid.
We compared the gridded allocation results of on-road NH3 emissions with the estimations based on link-level inventories in four megacities in China (i.e., Beijing (Yang et al., 2019), Shanghai (An et al., 2021), Shenzhen (Wen et al., 2020) and Chengdu (Wen et al., 2022)), shown in Fig. S1. Link-level NH3 emission inventories were calculated based on the traffic profiles of the whole road network obtained in our previous studies (Wen et al., 2022, 2020; Yang et al., 2019) and NH3 EFs derived in Sect. 2.1. The coefficient of determination (R2) varied from 0.63 to 0.80 among the four megacities, demonstrating the accuracy of the allocation method for on-road emissions. We also compared the monthly variations of total anthropogenic NH3 emissions derived in this study with surface NH3 observations obtained from the Ammonia Monitoring Network in different regions of China given in Kong et al. (2019), shown in Fig. S2. The monthly variations compare well with NH3 observations over different regions in China, demonstrating the accuracy of both spatial and monthly allocations.
3.1 Historical trend of vehicular NH3 emissions in China
NH3 EFs of LDGVs and HDDVs derived in this study are compared with relative literature covering studies that used dynamometers, remote sensing, PEMSs and other field measurement techniques, as shown in Fig. 1 (details listed in Tables S2 and S3). NH3 EFs of LDGVs decreased significantly with the upgrading of vehicle emission standards, consistent with trends in other literature. Note that the derivations of EFs in milligrams per kilometer (mg km−1) from grams per kilometer (g kg−1) have not been adjusted to account for different driving conditions and fuel consumption (see notes of Tables S2 and S3), whilst dynamometer measurements may be lower than on-road emissions. Also, impacts of various ambient environment and driving conditions and interferences from high-emitting or other vehicle types may account for the differences (Davison et al., 2020). NH3 EFs of HDDVs without SCR are negligible (4.4 ± 2.4 mg km−1), while the introduction of SCR systems greatly increased the risk of ammonia slip (73.9 ± 118.7 mg km−1). The introduction of ammonia slip catalysts (ASCs) in the heavy-duty China VI emission standard would significantly reduce NH3 emissions of HDDVs (Mendoza-Villafuerte et al., 2017). Since China VI HDDVs had not been deployed nationwide until July 2021, HDDVs equipped with SCR and ASCs were not included in the calculation of NH3 emission inventories.
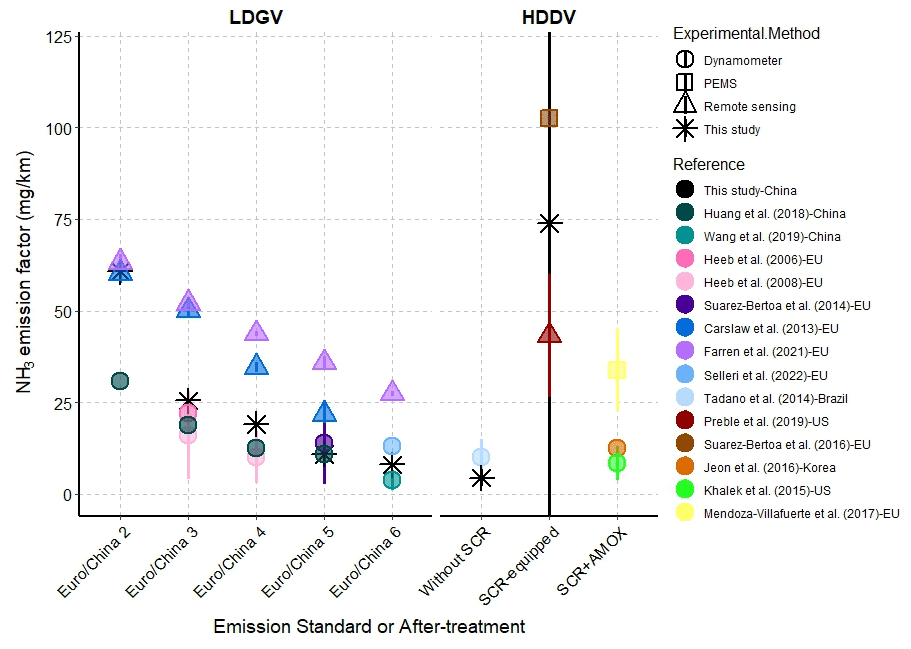
Figure 1Comparison of distance-based NH3 EFs for of LDGVs and HDDVs in this study and other relative studies, disaggregated by emission standard or after-treatment technology.
Taking the phase of emission standards into consideration, the trends of annual- and fleet-average NH3 EFs for gasoline and diesel vehicles in China from 2000 to 2019 are shown in Fig. S3. NH3 EFs for gasoline vehicles decreased from 66.6 ± 2.6 in 2000 to 16.0 ± 3.9 mg km−1 in 2019 due to the continuous upgrading of emission standards. NH3 EFs of diesel fleet were negligible before 2014, while they started to increase with the national implementation of China IV in 2014. The fleet-average NH3 EFs of diesel vehicles surpassed gasoline vehicles in 2016 and increased to 36.5 ± 29.2 mg km−1 in 2019.
The annual vehicular NH3 emissions increased from 32.8 ± 1.7 to 87.1 ± 37.5 kt yr−1 from 2000 to 2019 in China, as shown in Fig. 2. The continuous increase from 2000 to 2010 mainly resulted from the rapid growth of gasoline vehicle ownership. However, emissions from gasoline vehicles have started to decrease with the upgrading of emission standards in the past decade. NH3 emissions of gasoline vehicles estimated based on bottom-up method agreed well with the top-down estimations based on annual gasoline consumption and fuel-based EFs (see Fig. S4). Emissions from diesel vehicles have grown significantly under the joint effects of increasing HDDV numbers and the rapid introduction of SCR systems since 2014. The emission proportion of diesel fleet grew significantly from less than 3 ± 2 % before 2014 to 33 ± 26 % in 2019. With the implementation of the heavy-duty China VI emission standard in 2020, NH3 emissions from diesel vehicles should be well controlled. Gasoline vehicles (mainly LDGVs) will keep dominating the total on-road NH3 emissions in the near future.
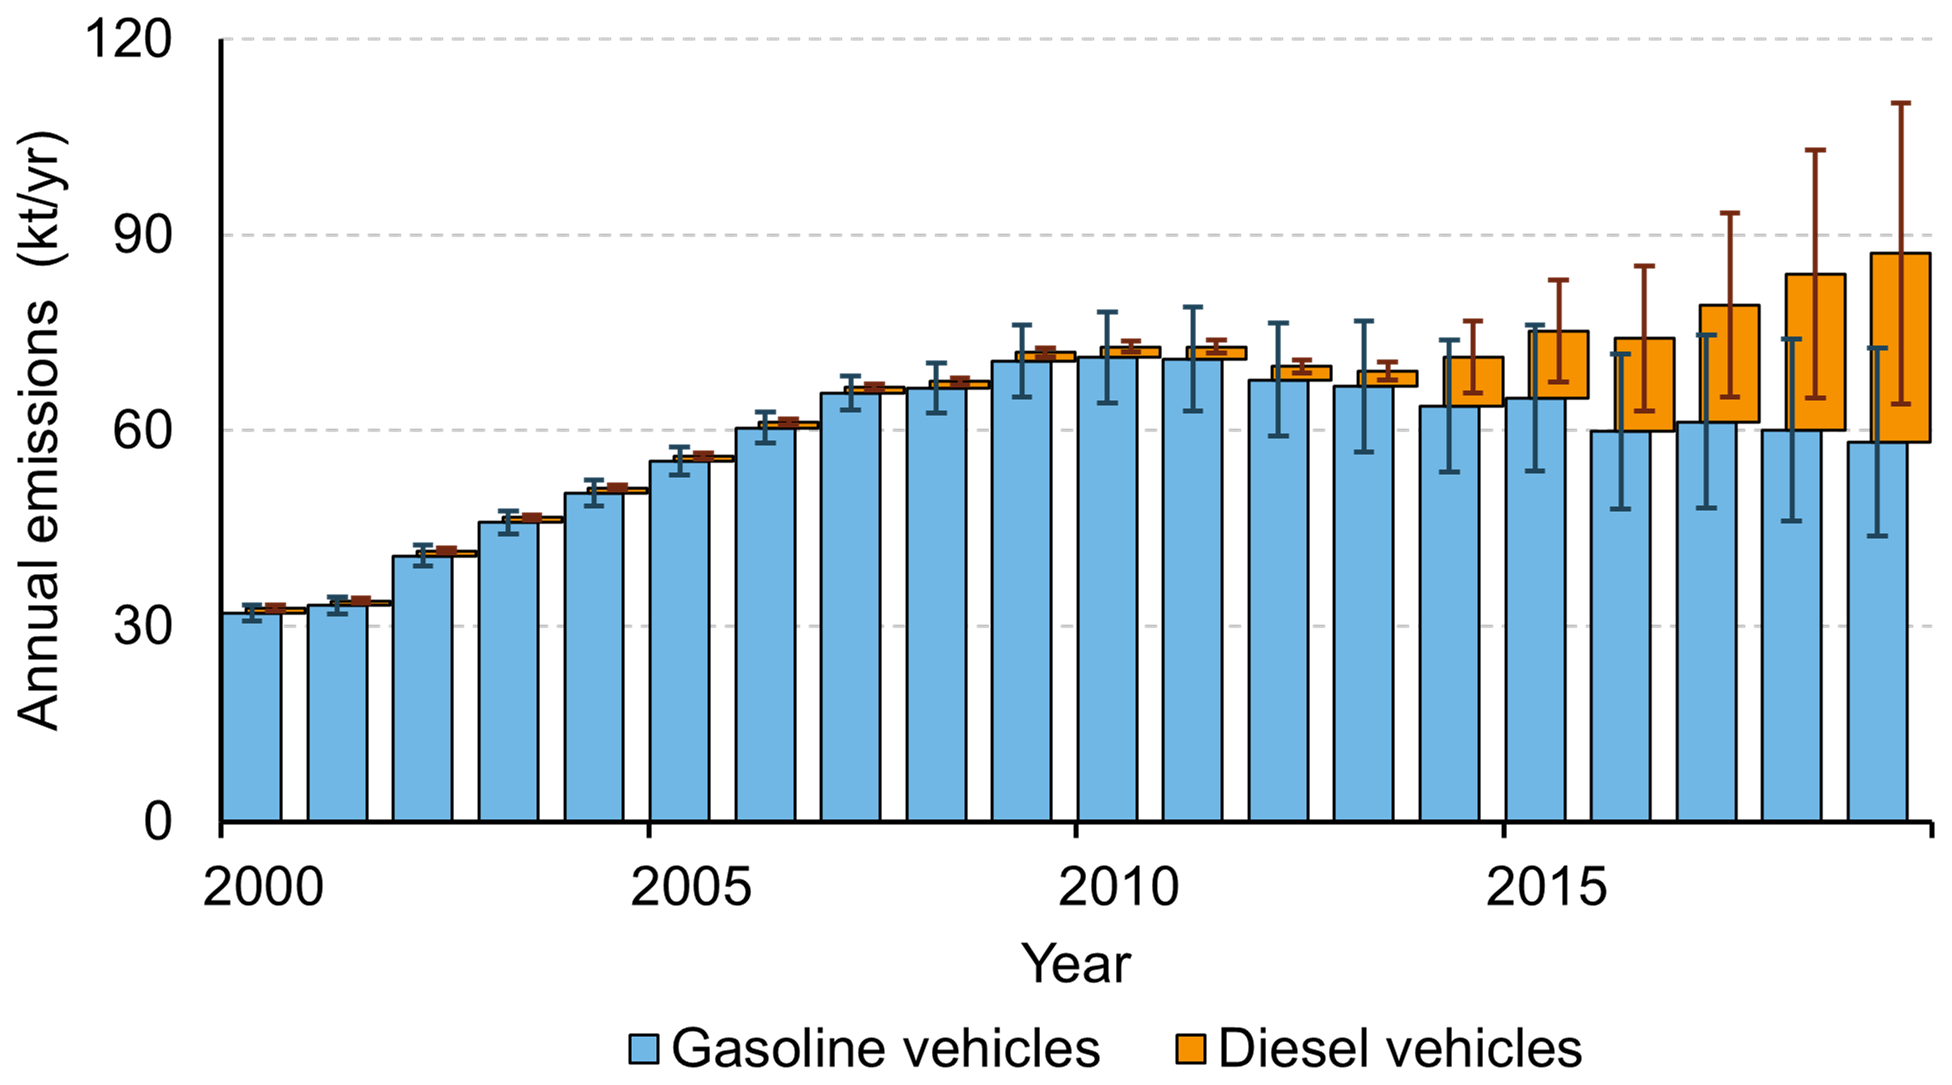
Figure 2Annual vehicular NH3 emissions by fuel type in China with uncertainty ranges, 2000–2019.
3.2 Spatial and temporal distribution of on-road NH3 emissions in China
Highly spatially resolved (3 km × 3 km) vehicular NH3 emission intensities in China in 2019 are illustrated in Fig. 3. On-road emissions are distributed along the road network, and the emission hotspots are highly correlated with densely populated areas, which is different from the spatial distribution of agricultural emissions (see Fig. S5). On-road NH3 emissions in two of the most populous regions, i.e., the Beijing–Tianjin–Hebei (BTH) region and the Yangtze River Delta (YRD), are also illustrated in Fig. 3b and c. The average on-road NH3 emission intensities in mainland China, BTH and YRD are 9.3 ± 4.0, 42.4 ± 18.2 and 46.5 ± 20.0 kg km−2 yr−1, with average population densities of 146, 511 and 668 persons per km2 in 2019, respectively. Note that on-road NH3 emissions are positive correlated with population density, which will be further analyzed in Sect. 3.3.
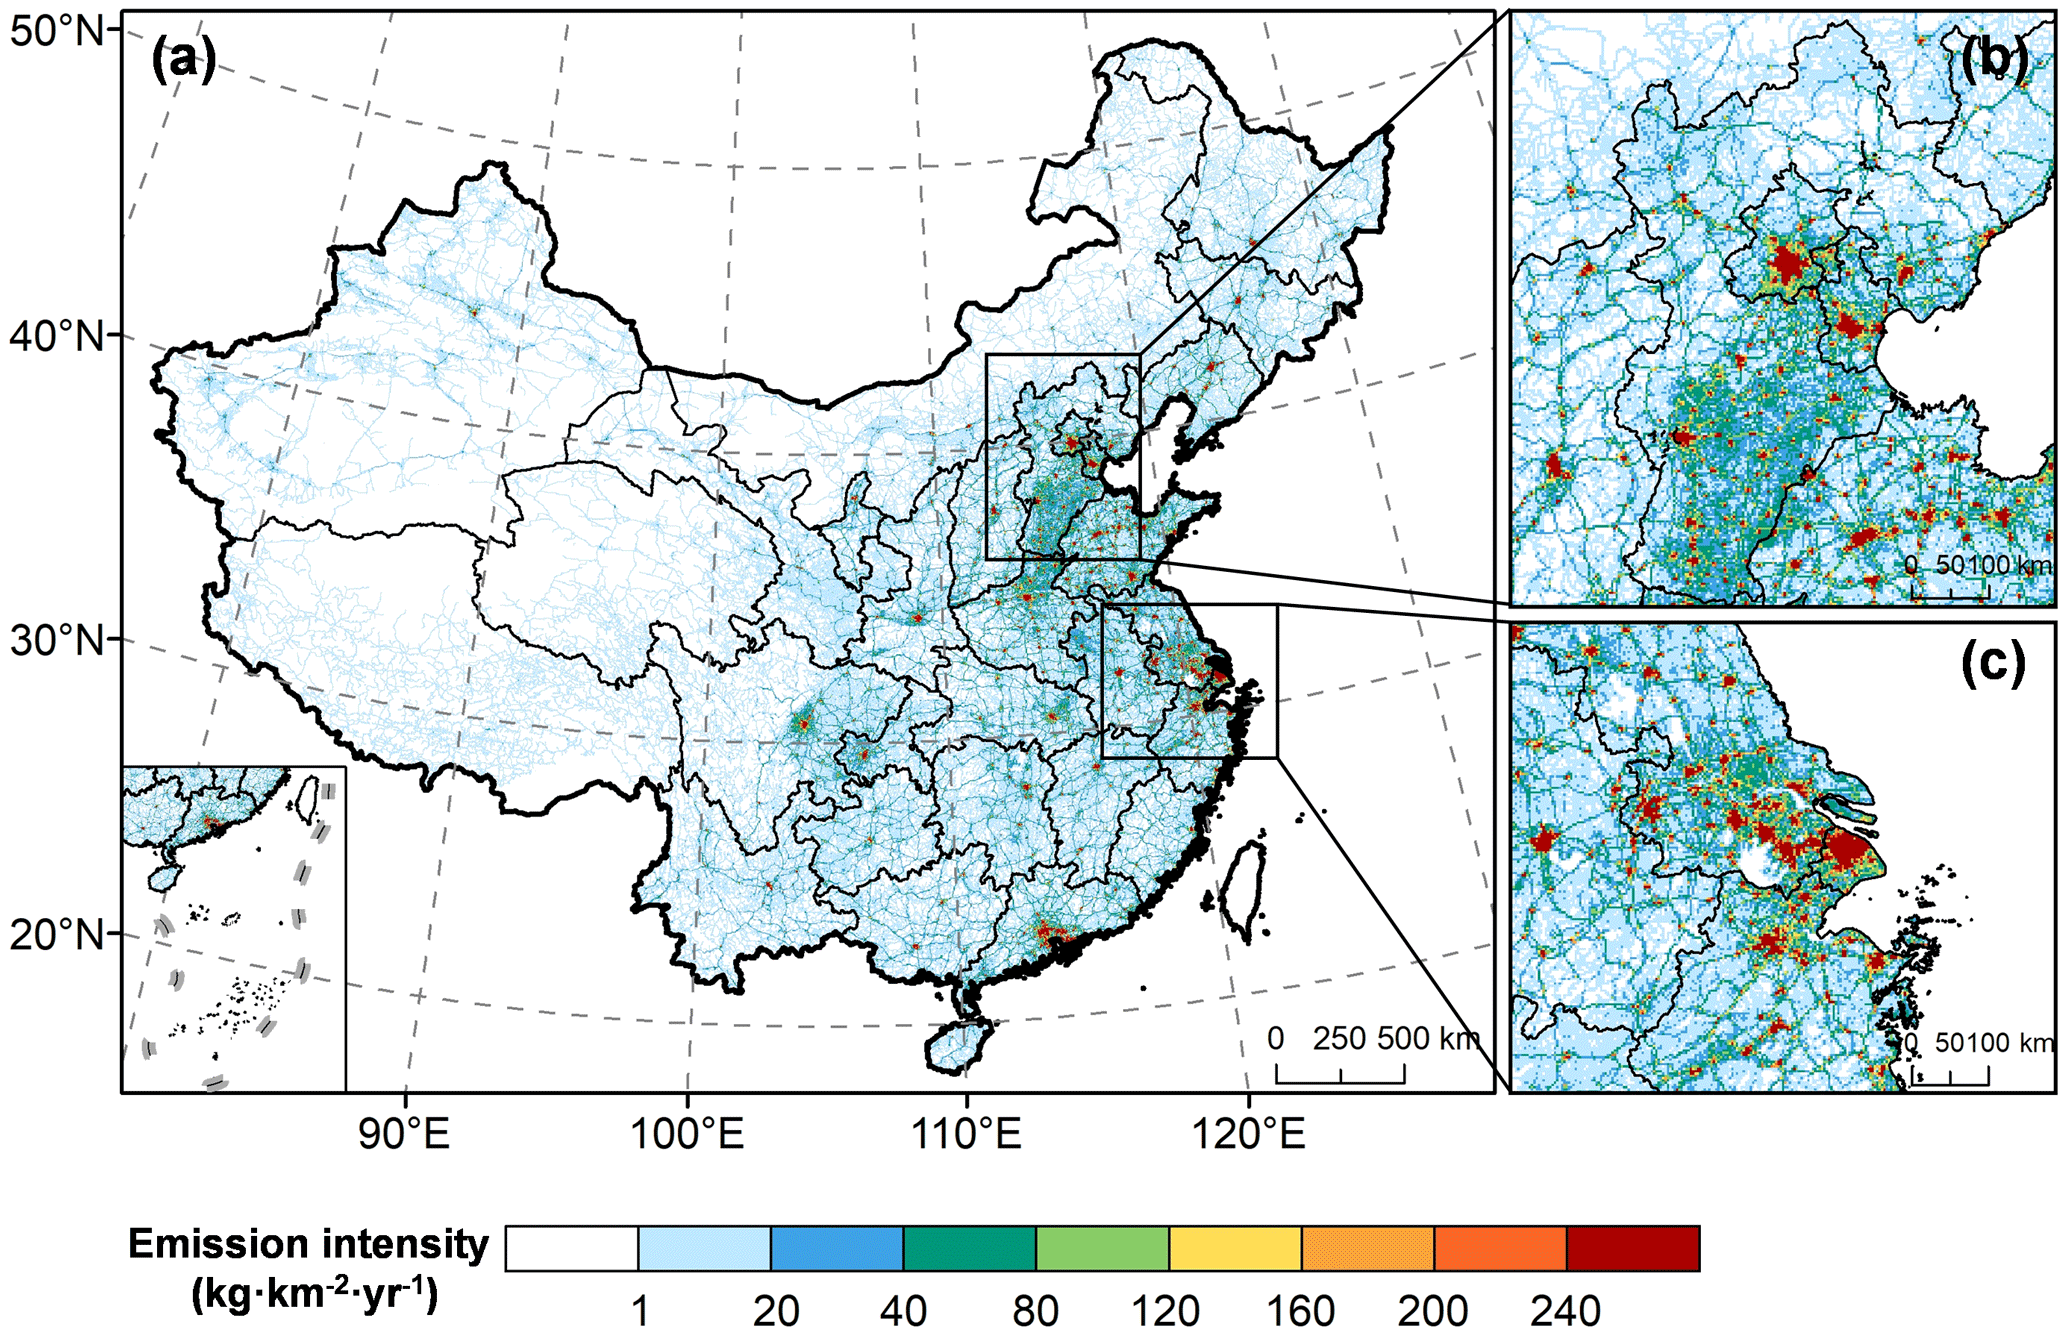
Figure 3Spatial distribution of on-road NH3 emission intensities in (a) mainland China, (b) the Beijing–Tianjin–Hebei (BTH) region and (c) the Yangtze River Delta (YRD) in 2019.
We analyzed the contribution of on-road NH3 emissions to total anthropogenic emissions in 2019. Agriculture (including livestock and fertilizer) dominated the total anthropogenic NH3 nationwide (>90 %), and the contribution of vehicular NH3 emissions is insignificant compared with agricultural emissions (<1 %). However, the proportion of vehicular emissions varied significantly (from 0.36 ± 0.16 % to 8.91 ± 3.83 %) among provinces (see Fig. S6). Beijing and Shanghai are the top two provinces with the highest vehicular NH3 emission contributions in China, which are 8.91 ± 3.83 % and 7.33 ± 3.15 %, respectively, compared with the nationwide level of 0.95 ± 0.42 %. Beijing and Shanghai are not only core cities in the BTH and YRD regions but also two of the most populous megacities in China (with residential populations of over 20 million). Thus, we chose Beijing and Shanghai as typical cities to discuss hereinafter.
Though several studies have pointed out the significant temperature dependence of NH3 emissions from LDGVs (Selleri et al., 2022; Suarez-Bertoa et al., 2017), few studies have considered the seasonal variation of on-road NH3 emissions in either inventory or air quality modeling. In this study, the temperature impacts on NH3 emissions have been depicted by the comprehensive EF model. Figure 4 illustrates the monthly variations in NH3 EFs for LDGVs of various emission standards in Beijing and Shanghai. The fleet-average NH3 EFs of gasoline vehicles in February were 1.50 and 1.41 times of those in August for Beijing and Shanghai, respectively, consistent with the NH3 emission ratio of 1.4–2.1 reported in dynamometer measurements conducted under −7∘C relative to 23∘C (Selleri et al., 2022; Suarez-Bertoa et al., 2017). As the monthly variations of agricultural emissions (higher in summer than winter) are opposite to vehicular emissions, the vehicle emission proportions are significantly higher in winter. As shown in Fig. S7, the city-scale vehicular NH3 emission proportions are up to 14 % and 12 % in winter in Beijing and Shanghai, respectively, nearly twice the annual-average ratio of 8.9 % and 7.3 %. The proportion would be even larger in urban areas, posing substantial risks for haze episodes during the wintertime.
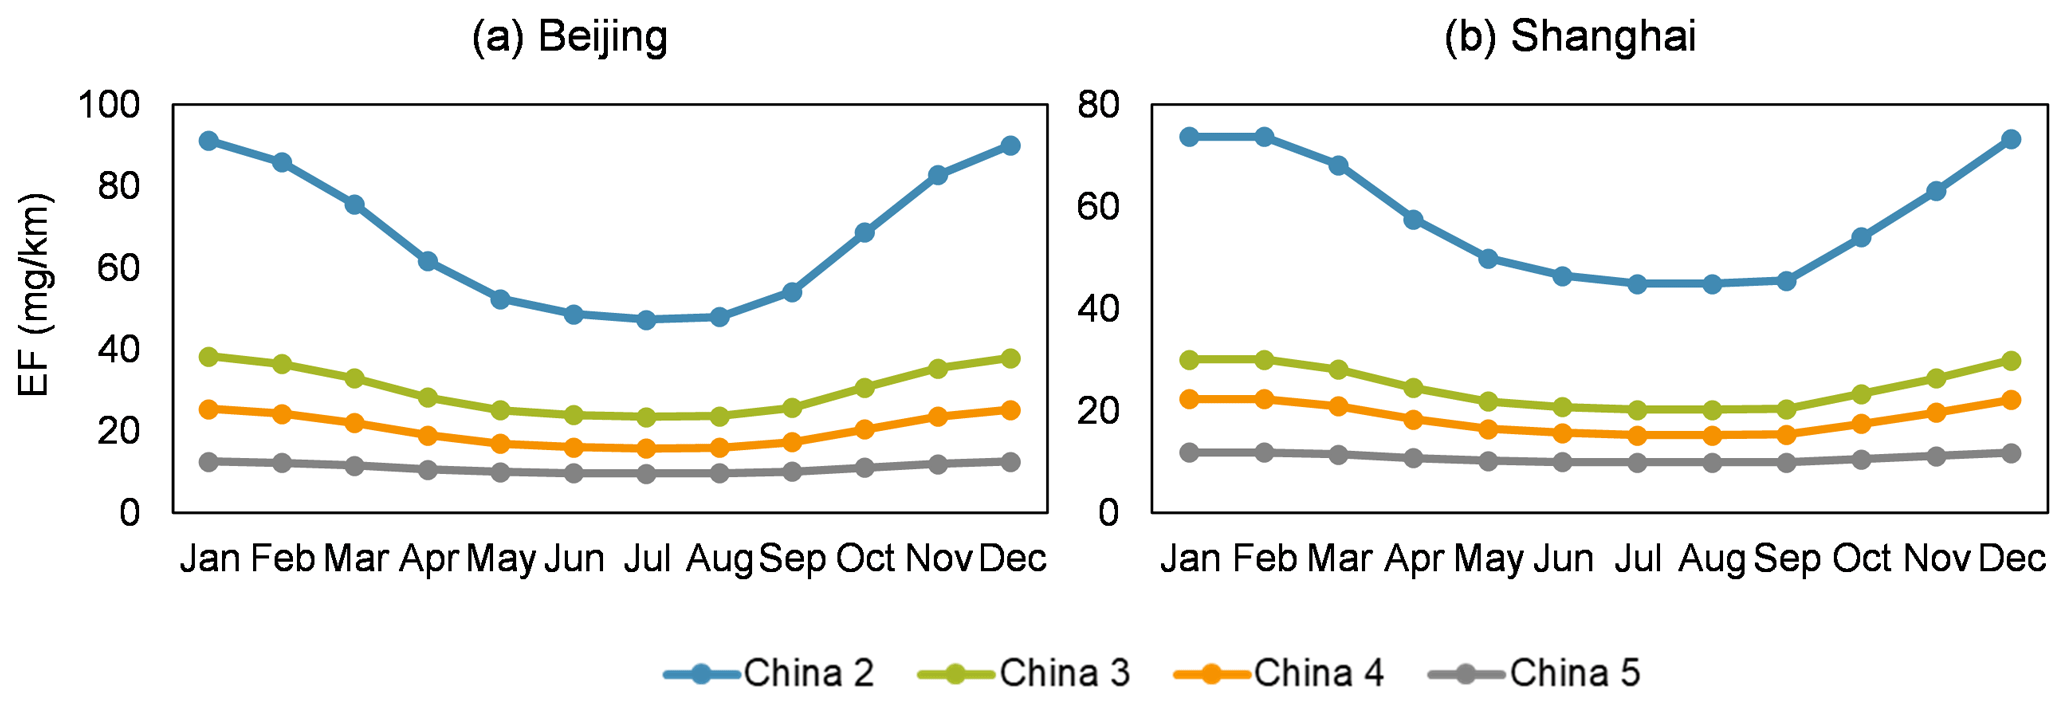
Figure 4Monthly NH3 EFs for LDGVs of various emission standards in (a) Beijing and (b) Shanghai in 2019.
3.3 Relative contribution of on-road and agricultural NH3 emissions among different population densities
The highly spatially resolved NH3 emission inventory enables us to distinguish the relative contribution of vehicular and agricultural emissions among various population densities. Population density data in mainland China were extracted from WorldPop (Tatem, 2017) at a spatial resolution of 100 m and then aggregated into 3 km to match the resolution of emission inventories. As shown in Fig. 5, the distribution of on-road NH3 emission intensity is positively correlated with population density, while the trend in agricultural emission is the opposite. NH3 emission intensities of on-road traffic are much lower than agriculture for less populated areas, but the median will surpass agricultural sources in grids with a population density higher than 10 000 persons per km2. For extremely populous grids (population density >20 000 persons per km2), agricultural emissions are less important compared with on-road traffic emissions.

Figure 5Distribution of agricultural and on-road NH3 emissions among different population densities in 2019.
According to the statistics based on gridded emission inventories and population density, on-road NH3 emissions exceed agricultural emissions in grids containing 23.0 ± 2.1 % of the Chinese population in 2019 (approximately 326.6 ± 25.4 million people), and this number is up to 29.4 ± 3.0 % in winter. For densely populated areas with a population density higher than 2000 persons per km2, on-road NH3 emissions exceed agricultural emissions where 53.3 ± 3.6 % of the population resides (approximately 287.8 ± 19.5 million people), and this is up to 66.2 ± 3.1 % in winter. As two of the most populous megacities in the world, Beijing and Shanghai had 21.9 and 24.8 million residents in 2019. As shown in Fig. 6, on-road NH3 emissions in Beijing and Shanghai are significantly concentrated in densely populated areas where agricultural emissions seldom exist, and gasoline vehicles accounted for most of these emissions due to the strict restrictions on heavy-duty trucks in central urban areas. The statistics show that on-road NH3 emissions exceed agricultural emissions where 69.2 ± 1.2 % and 72.0 ± 1.3 % of the population resides in Beijing and Shanghai, respectively. Thus, the significant role of on-road NH3 emissions in populated areas and in winter may have been underappreciated without taking into account the temporal and spatial variations of on-road emission inventories. Note that residential emissions also serve as an important source for anthropogenic NH3 emissions in Beijing and Shanghai (see Fig. S7). However, residential NH3 emissions (i.e., mainly from human excrement and domestic fuel combustion) are mostly attributed to human activities in rural residential areas for megacities like Beijing and Shanghai (Streets et al., 2003). Thus, even with high emission contributions in the whole city, residential emissions may not be as influential as traffic emissions in urban areas. As another important reactive nitrogen species besides NOx, the significance of NH3 emission control has not been fully addressed. Serving as a major contributor to both NOx and NH3 emissions in urban areas, a multipollutant control strategy for vehicular NOx and NH3 emissions may be a more effective pathway to mitigating PM2.5 pollution in densely populated areas.
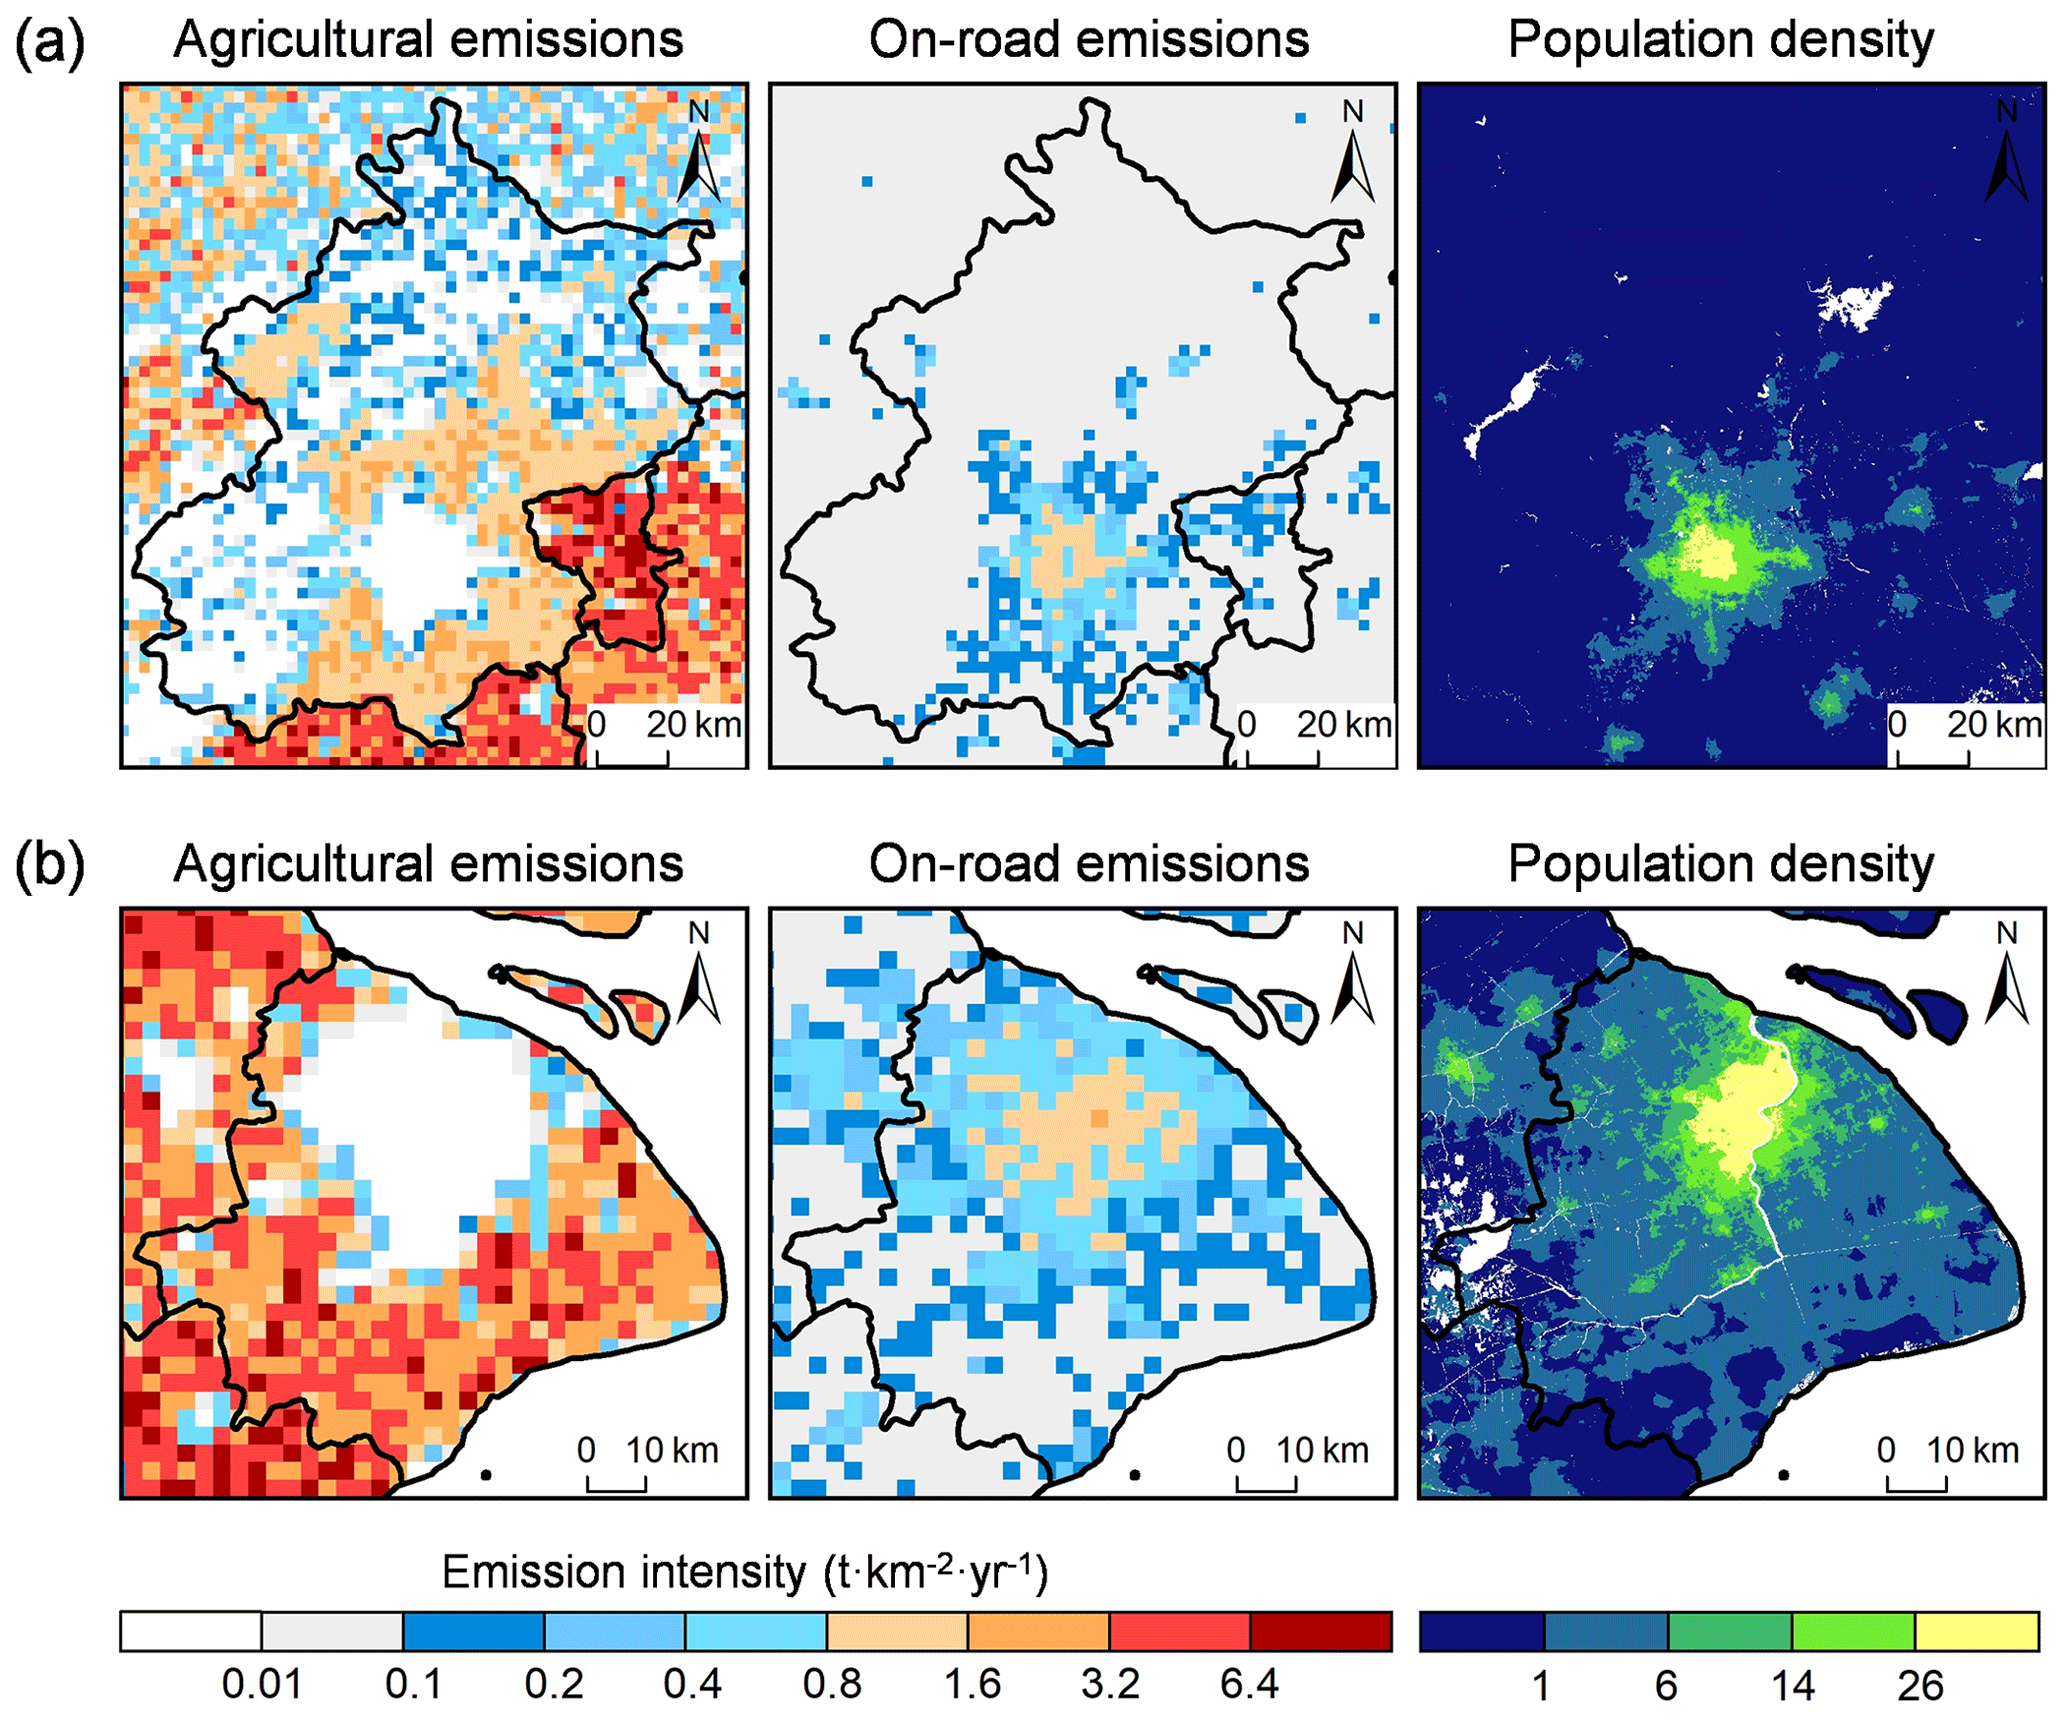
Figure 6Spatial distribution of agricultural and on-road NH3 emission intensities and population density in (a) Beijing and (b) Shanghai in 2019.
In this study, we established a comprehensive vehicular NH3 emission factor model and compiled a gridded on-road NH3 emission inventory with high spatial (3 km × 3 km) and temporal (monthly) resolution for mainland China. NH3 EFs for gasoline vehicles decreased from 66.6 in 2000 to 16.0 mg km−1 in 2019 due to the continuous upgrading of emission standards. The annual vehicular NH3 emissions increased from 32.8 ± 1.7 to 87.1 ± 37.5 kt yr−1 from 2000 to 2019 in China, mainly resulted from the rapid growth of gasoline vehicle ownership. On-road NH3 emissions are significantly concentrated in densely populated areas, where agricultural emissions seldom exist. It is found that on-road NH3 emissions exceed agricultural emissions in grids containing 23.0 ± 2.1 % of the Chinese population in 2019 (approximately 326.6 million people), and this ratio is up to 29.4 ± 3.0 % in winter. For extremely populous cities such as Beijing and Shanghai, on-road NH3 emissions exceed agricultural emissions, where 69.2 ± 1.2 % and 72.0 ± 1.3 % of the population resides, respectively.
This study gave a better insight into the absolute value and relative importance of on-road NH3 emissions for different regions, seasons and population densities in China; this is important in terms of the implications for air quality. We emphasized the significant role of on-road NH3 emissions in populated urban areas, which may have been underappreciated previously, highlighting the necessity to consider vehicular NH3 emissions in air quality simulations. In addition, we clearly depicted the seasonal variation of on-road NH3 emissions in our inventory by considering temperature dependence of NH3 emissions from LDGVs. As the monthly variations of agricultural emissions (higher in summer than winter) are opposite to vehicular emissions (higher in winter than summer), the city-scale vehicular NH3 emission proportions in winter are nearly twice the annual-average ratio in Beijing and Shanghai. This finding reminds us of the possibly more severe risks for haze episodes during the wintertime. Precise air quality simulations based on the highly resolved NH3 emission inventory are required to quantify the relative contribution of on-road NH3 emissions to urban PM2.5 pollution in different seasons.
Although several pathways for agricultural emission abatement have been raised (Sha et al., 2021), the regulation for agricultural NH3 emissions is difficult due to both the technical gap and potential obstruction from stakeholders (Plautz, 2018). However, mitigating vehicular NH3 emissions could be more feasible compared with the control of agricultural emissions. With the implementation of the heavy-duty Euro VI and China VI emission standards, NH3 emissions from diesel vehicles are expected to be well controlled (see Fig. 1). The NH3 emission problems from petrol vehicles have also been addressed by the upcoming Euro 7/VII standard (European Commission et al., 2022), and there are proven aftertreatments to ensure that Euro 7/VII vehicles comply with these proposed limits (Torp et al., 2021). Except for regulations from emission standards, traffic management of the passenger vehicle fleet and the promotion of electric vehicles can also significantly mitigate vehicular NH3 emissions in urban areas. Therefore, the control of on-road NH3 emissions can be a feasible and cost-effective way of mitigating haze pollution in urban areas, calling for greater priority to strengthen regulations for vehicular NH3 emissions worldwide.
Note there are some limitations about this study. Firstly, impacts of driving condition were not included in this study. It is well documented that LDGV NH3 emissions are strongly dependent on driving conditions (Huang et al., 2018). Higher LDGV NH3 emissions are found under both low-speed (Farren et al., 2021) and aggressive highway driving cycles (Huang et al., 2018). For urban areas with complex driving conditions and that are easily affected by traffic congestion, vehicular NH3 emissions are further enhanced. It is important to address the impacts of traffic conditions on vehicular NH3 emissions in urban areas if real-world speed monitoring data are available in future works (Wang et al., 2023). Secondly, we estimated EFs of other diesel vehicles based on the relative fuel consumption compared with HDDVs due to the lack of measurement data. This approach has obvious limitations and can be improved if more measurement data are available. Nevertheless, HDDVs accounted for 89.8 % of the total NH3 emissions from diesel vehicles in 2019. Thus, the uncertainties brought by EFs of other diesel vehicles are limited.
The vehicular NH3 measurement data are protected by the data confidentiality agreement. The gridded NH3 emission inventory is available from the corresponding authors upon request (zhsjun@tsinghua.edu.cn).
The supplement related to this article is available online at: https://doi.org/10.5194/acp-23-3819-2023-supplement.
YiW: data curation, methodology, visualization and writing (original draft preparation). SZ: conceptualization, writing (review and editing) and supervision. YeW: supervision. JH: supervision.
The contact author has declared that none of the authors has any competing interests.
Publisher’s note: Copernicus Publications remains neutral with regard to jurisdictional claims in published maps and institutional affiliations.
We are grateful to the National Key Research and Development Program of China (grant no. 2022YFC3703600), the Chinese National Postdoctoral Program for Innovative Talents (no. BX20220179) and the Shuimu Tsinghua Scholar Program (no. 2022SM011). All the authors are grateful to Elsevier Language Editing Services for polishing the English expressions in an earlier version of this paper.
This research has been supported by the National Key Research and Development Program of China (grant no. 2022YFC3703600), the National Postdoctoral Program for Innovative Talents (grant no. BX20220179), the Shuimu Tsinghua Scholar Program (grant no. 2022SM011) and the Tsinghua-Toyota Joint Research Institute Cross-discipline Program.
This paper was edited by Kimitaka Kawamura and reviewed by three anonymous referees.
An, J., Huang, Y., Huang, C., Wang, X., Yan, R., Wang, Q., Wang, H., Jing, S., Zhang, Y., Liu, Y., Chen, Y., Xu, C., Qiao, L., Zhou, M., Zhu, S., Hu, Q., Lu, J., and Chen, C.: Emission inventory of air pollutants and chemical speciation for specific anthropogenic sources based on local measurements in the Yangtze River Delta region, China, Atmos. Chem. Phys., 21, 2003–2025, https://doi.org/10.5194/acp-21-2003-2021, 2021.
Bishop, G. A. and Stedman, D. H.: Reactive Nitrogen Species Emission Trends in Three Light-/Medium-Duty United States Fleets, Environ. Sci. Technol., 49, 11234–11240, https://doi.org/10.1021/acs.est.5b02392, 2015.
Bishop, G. A., Peddle, A. M., Stedman, D. H., and Zhan, T.: On-road emission measurements of reactive nitrogen compounds from three California cities, Environ. Sci. Technol., 44, 3616–3620, https://doi.org/10.1021/es903722p, 2010.
Chang, Y., Zou, Z., Deng, C., Huang, K., Collett, J. L., Lin, J., and Zhuang, G.: The importance of vehicle emissions as a source of atmospheric ammonia in the megacity of Shanghai, Atmos. Chem. Phys., 16, 3577–3594, https://doi.org/10.5194/acp-16-3577-2016, 2016.
Chu, B., Zhang, X., Liu, Y., He, H., Sun, Y., Jiang, J., Li, J., and Hao, J.: Synergetic formation of secondary inorganic and organic aerosol: effect of SO2 and NH3 on particle formation and growth, Atmos. Chem. Phys., 16, 14219–14230, https://doi.org/10.5194/acp-16-14219-2016, 2016.
Davison, J., Bernard, Y., Borken-Kleefeld, J., Farren, N. J., Hausberger, S., Sjodin, A., Tate, J. E., Vaughan, A. R., and Carslaw, D. C.: Distance-based emission factors from vehicle emission remote sensing measurements, Sci. Total Environ., 739, 139688, https://doi.org/10.1016/j.scitotenv.2020.139688, 2020.
European Commission, Directorate-General for Internal Market, I., Entrepreneurship, and SMEs: Technical studies for the development of Euro 7: testing, pollutants and emission limits, Publications Office of the European Union, https://doi.org/10.2873/97170, 2022.
Farren, N. J., Davison, J., Rose, R. A., Wagner, R. L., and Carslaw, D. C.: Underestimated Ammonia Emissions from Road Vehicles, Environ. Sci. Technol., 54, 15689–15697, https://doi.org/10.1021/acs.est.0c05839, 2020.
Farren, N. J., Davison, J., Rose, R. A., Wagner, R. L., and Carslaw, D. C.: Characterisation of ammonia emissions from gasoline and gasoline hybrid passenger cars, Atmospheric Environment: X, 11, 100117, https://doi.org/10.1016/j.aeaoa.2021.100117, 2021.
Fenn, M. E., Bytnerowicz, A., Schilling, S. L., Vallano, D. M., Zavaleta, E. S., Weiss, S. B., Morozumi, C., Geiser, L. H., and Hanks, K.: On-road emissions of ammonia: An underappreciated source of atmospheric nitrogen deposition, Sci. Total Environ., 625, 909–919, https://doi.org/10.1016/j.scitotenv.2017.12.313, 2018.
Fu, X., Wang, S., Xing, J., Zhang, X., Wang, T., and Hao, J.: Increasing Ammonia Concentrations Reduce the Effectiveness of Particle Pollution Control Achieved via SO2 and NOx Emissions Reduction in East China, Environ. Sci. Tech. Let., 4, 221–227, https://doi.org/10.1021/acs.estlett.7b00143, 2017.
Gu, B., Zhang, L., Dingenen, R. V., Vieno, M., Grinsven, H. J. V., Zhang, X., Zhang, S., Chen, Y., Wang, S., Ren, C., Rao, S., Holland, M., Winiwarter, W., Chen, D., Xu, J., and Sutton, M. A.: Abating ammonia is more cost-effective than nitrogen oxides for mitigating PM2.5 air pollution, Science, 374, 758–762, https://doi.org/10.1126/science.abf8623, 2021.
He, L. Q., Zhang, S. J., Hu, J. N., Li, Z., Zheng, X., Cao, Y., Xu, G., Yan, M., and Wu, Y.: On-road emission measurements of reactive nitrogen compounds from heavy-duty diesel trucks in China, Environ. Pollut., 262, 114280, https://doi.org/10.1016/j.envpol.2020.114280, 2020.
Huang, C., Hu, Q., Lou, S., Tian, J., Wang, R., Xu, C., An, J., Ren, H., Ma, D., Quan, Y., Zhang, Y., and Li, L.: Ammonia Emission Measurements for Light-Duty Gasoline Vehicles in China and Implications for Emission Modeling, Environ. Sci. Technol., 52, 11223–11231, https://doi.org/10.1021/acs.est.8b03984, 2018.
Huang, R. J., Zhang, Y. L., Bozzetti, C., Ho, K. F., Cao, J. J., Han, Y. M., Daellenbach, K. R., Slowik, J. G., Platt, S. M., Canonaco, F., Zotter, P., Wolf, R., Pieber, S. M., Bruns, E. A., Crippa, M., Ciarelli, G., Piazzalunga, A., Schwikowski, M., Abbaszade, G., Schnelle-Kreis, J., Zimmermann, R., An, Z. S., Szidat, S., Baltensperger, U., El Haddad, I., and Prevot, A. S. H.: High secondary aerosol contribution to particulate pollution during haze events in China, Nature, 514, 218–222, https://doi.org/10.1038/nature13774, 2014.
Kang, Y., Liu, M., Song, Y., Huang, X., Yao, H., Cai, X., Zhang, H., Kang, L., Liu, X., Yan, X., He, H., Zhang, Q., Shao, M., and Zhu, T.: High-resolution ammonia emissions inventories in China from 1980 to 2012, Atmos. Chem. Phys., 16, 2043–2058, https://doi.org/10.5194/acp-16-2043-2016, 2016.
Kong, L., Tang, X., Zhu, J., Wang, Z. F., Pan, Y. P., Wu, H. J., Wu, L., Wu, Q. Z., He, Y. X., Tian, S. L., Xie, Y. Z., Liu, Z. R., Sui, W. X., Han, L. N., and Carmichael, G.: Improved Inversion of Monthly Ammonia Emissions in China Based on the Chinese Ammonia Monitoring Network and Ensemble Kalman Filter, Environ. Sci. Technol., 53, 12529–12538, 2019.
Li, B., Chen, L., Shen, W., Jin, J., Wang, T., Wang, P., Yang, Y., and Liao, H.: Improved gridded ammonia emission inventory in China, Atmos. Chem. Phys., 21, 15883–15900, https://doi.org/10.5194/acp-21-15883-2021, 2021.
Li, Y., Schichtel, B. A., Walker, J. T., Schwede, D. B., Chen, X., Lehmann, C. M. B., Puchalski, M. A., Gay, D. A., and Collett, J. L.: Increasing importance of deposition of reduced nitrogen in the United States, P. Natl. Acad. Sci. USA, 113, 5874–5879, https://doi.org/10.1073/pnas.1525736113, 2016.
Livingston, C., Rieger, P., and Winer, A.: Ammonia emissions from a representative in-use fleet of light and medium-duty vehicles in the California South Coast Air Basin, Atmos. Environ., 43, 3326–3333, https://doi.org/10.1016/j.atmosenv.2009.04.009, 2009.
Lv, S., Wang, F., Wu, C., Chen, Y., Liu, S., Zhang, S., Li, D., Du, W., Zhang, F., Wang, H., Huang, C., Fu, Q., Duan, Y., and Wang, G.: Gas-to-Aerosol Phase Partitioning of Atmospheric Water-Soluble Organic Compounds at a Rural Site in China: An Enhancing Effect of NH3 on SOA Formation, Environ. Sci. Technol., 56, 3915–3924, https://doi.org/10.1021/acs.est.1c06855, 2022.
Mendoza-Villafuerte, P., Suarez-Bertoa, R., Giechaskiel, B., Riccobono, F., Bulgheroni, C., Astorga, C., and Perujo, A.: NOx, NH3, N2O and PN real driving emissions from a Euro VI heavy-duty vehicle. Impact of regulatory on-road test conditions on emissions, Sci. Total Environ., 609, 546–555, https://doi.org/10.1016/j.scitotenv.2017.07.168, 2017.
Meng, W., Zhong, Q., Yun, X., Zhu, X., Huang, T., Shen, H., Chen, Y., Chen, H., Zhou, F., Liu, J., Wang, X., Zeng, E. Y., and Tao, S.: Improvement of a Global High-Resolution Ammonia Emission Inventory for Combustion and Industrial Sources with New Data from the Residential and Transportation Sectors, Environ. Sci. Technol., 51, 2821–2829, https://doi.org/10.1021/acs.est.6b03694, 2017.
National Bureau of Statistics of China (NBSC): Annual Statistics Data of China, http://www.stats.gov.cn/enGliSH/Statisticaldata/ (last access: 27 February 2023), 2019.
OpenStreetMap: OpenStreetMap data for China, http://download.geofabrik.de/asia/china.html, last access: 14 April 2022.
Pan, Y., Tian, S., Liu, D., Fang, Y., Zhu, X., Zhang, Q., Zheng, B., Michalski, G., and Wang, Y.: Fossil Fuel Combustion-Related Emissions Dominate Atmospheric Ammonia Sources during Severe Haze Episodes: Evidence from 15N-Stable Isotope in Size-Resolved Aerosol Ammonium, Environ. Sci. Technol., 50, 8049–8056, https://doi.org/10.1021/acs.est.6b00634, 2016.
Pandolfi, M., Amato, F., Reche, C., Alastuey, A., Otjes, R. P., Blom, M. J., and Querol, X.: Summer ammonia measurements in a densely populated Mediterranean city, Atmos. Chem. Phys., 12, 7557–7575, https://doi.org/10.5194/acp-12-7557-2012, 2012.
Paulot, F., Jacob, D. J., Pinder, R. W., Bash, J. O., Travis, K., and Henze, D. K.: Ammonia emissions in the United States, European Union, and China derived by high-resolution inversion of ammonium wet deposition data: Interpretation with a new agricultural emissions inventory (MASAGE_NH3), J. Geophys. Res.-Atmos., 119, 4343–4364, 2014.
Plautz, J.: Piercing the haze, Science, 361, 1060–1063, https://doi.org/10.1126/science.361.6407.1060, 2018.
Ru-Jin, H., Yanlin, Z., Carlo, B., Kin-Fai, H., Jun-Ji, C., Yongming, H., Daellenbach, K. R., Slowik, J. G., Platt, S. M., and Francesco, C.: High secondary aerosol contribution to particulate pollution during haze events in China, Nature, 514, 218–222, 2014.
Selleri, T., Melas, A., Bonnel, P., and Suarez-Bertoa, R.: NH3 and CO Emissions from Fifteen Euro 6d and Euro 6d-TEMP Gasoline-Fuelled Vehicles, Catalysts, 12, 245, https://doi.org/10.3390/catal12030245, 2022.
Sha, Z. P., Liu, H. J., Wang, J. X., Ma, X., Liu, X. J., and Misselbrook, T.: Improved soil-crop system management aids in NH3 emission mitigation in China, Environ. Pollut., 289, 117844, https://doi.org/10.1016/j.envpol.2021.117844, 2021.
Streets, D., Bond, T., Carmichael, G., Fernandes, S., Fu, Q., He, D., Klimont, Z., Nelson, S., Tsai, N. Y., Wang, M., Woo, J., and Yarber, K.: An inventory of gaseous and primary aerosol emissions in Asia in the year 2000, J. Geophys. Res.-Atmos., 108, 8809, https://doi.org/10.1029/2002jd003093, 2003.
Stevens, C. J., Dise, N. B., Mountford, J. O., and Gowing, D. J.: Impact of nitrogen deposition on the species richness of grasslands, Science, 303, 1876–1879, https://doi.org/10.1126/science.1094678, 2004.
Suarez-Bertoa, R., Mendoza-Villafuerte, P., Riccobono, F., Vojtisek, M., Pechout, M., Perujo, A., and Astorga, C.: On-road measurement of NH3 emissions from gasoline and diesel passenger cars during real world driving conditions, Atmos. Environ., 166, 488–497, https://doi.org/10.1016/j.atmosenv.2017.07.056, 2017.
Sun, K., Tao, L., Miller, D. J., Pan, D., Golston, L. M., Zondlo, M. A., Griffin, R. J., Wallace, H. W., Leong, Y. J., Yang, M. M., Zhang, Y., Mauzerall, D. L., and Zhu, T.: Vehicle Emissions as an Important Urban Ammonia Source in the United States and China, Environ. Sci. Technol., 51, 2472–2481, https://doi.org/10.1021/acs.est.6b02805, 2017a.
Sun, K., Tao, L., Miller, D. J., Pan, D., Golston, L. M., Zondlo, M. A., Griffin, R. J., Wallace, H. W., Leong, Y. J., Yang, M. M., Zhang, Y., Mauzerall, D. L., and Zhu, T.: Vehicle Emissions as an Important Urban Ammonia Source in the United States and China, Environ. Sci. Technol., 51, 2472–2481, https://doi.org/10.1021/acs.est.6b02805, 2017b.
Tatem, A. J.: WorldPop, open data for spatial demography, Sci. Data, 4, 170004, https://doi.org/10.1038/sdata.2017.4, 2017.
Torp, T. K., Hansen, B. B., Vennestrøm, P. N. R., Janssens, T. V. W., and Jensen, A. D.: Modeling and Optimization of Multi-functional Ammonia Slip Catalysts for Diesel Exhaust Aftertreatment, Emission Control Science and Technology, 7, 7–25, https://doi.org/10.1007/s40825-020-00183-x, 2021.
Wang, S., Nan, J., Shi, C., Fu, Q., Gao, S., Wang, D., Cui, H., Saiz-Lopez, A., and Zhou, B.: Atmospheric ammonia and its impacts on regional air quality over the megacity of Shanghai, China, Scientific Reports, 5, 15842, https://doi.org/10.1038/srep15842, 2015.
Wang, Y., Wen, Y., Zhang, S., Zheng, G., Zheng, H., Chang, X., Huang, C., Wang, S., Wu, Y., and Hao, J.: Vehicular Ammonia Emissions Significantly Contribute to Urban PM2.5 Pollution in Two Chinese Megacities, Environ. Sci. Technol., 57, 2698–2705, https://doi.org/10.1021/acs.est.2c06198, 2023.
Wen, Y., Zhang, S., Zhang, J., Bao, S., Wu, X., Yang, D., and Wu, Y.: Mapping dynamic road emissions for a megacity by using open-access traffic congestion index data, Appl. Energ., 260, 114357, https://doi.org/10.1016/j.apenergy.2019.114357, 2020.
Wen, Y., Zhang, S., He, L., Yang, S., Wu, X., and Wu, Y.: Characterizing start emissions of gasoline vehicles and the seasonal, diurnal and spatial variabilities in China, Atmos. Environ., 245, 118040, https://doi.org/10.1016/j.atmosenv.2020.118040, 2021.
Wen, Y., Wu, R., Zhou, Z., Zhang, S., Yang, S., Wallington, T. J., Shen, W., Tan, Q., Deng, Y., and Wu, Y.: A data-driven method of traffic emissions mapping with land use random forest models, Appl. Energ., 305, 117916, https://doi.org/10.1016/j.apenergy.2021.117916, 2022.
World Bank Group: World Development Indicators: Urbanization, World Bank Group [data set], http://wdi.worldbank.org/table/3.12, last access: 14 April 2022.
Wu, X., Wu, Y., Zhang, S., Liu, H., Fu, L., and Hao, J.: Assessment of vehicle emission programs in China during 1998–2013: Achievement, challenges and implications, Environ. Pollut., 214, 556–567, https://doi.org/10.1016/j.envpol.2016.04.042, 2016.
Wu, Y., Zhang, S., Hao, J., Liu, H., Wu, X., Hu, J., Walsh, M. P., Wallington, T. J., Zhang, K. M., and Stevanovic, S.: On-road vehicle emissions and their control in China: A review and outlook, Sci. Total Environ., 574, 332–349, https://doi.org/10.1016/j.scitotenv.2016.09.040, 2017a.
Wu, Y., Zhang, S., Hao, J., Liu, H., Wu, X., Hu, J., Walsh, M. P., Wallington, T. J., Zhang, K. M., and Stevanovic, S.: On-road vehicle emissions and their control in China: A review and outlook, Sci. Total Environ., 574, 332–349, 2017b.
Xing, J., Pleim, J., Mathur, R., Pouliot, G., Hogrefe, C., Gan, C.-M., and Wei, C.: Historical gaseous and primary aerosol emissions in the United States from 1990 to 2010, Atmos. Chem. Phys., 13, 7531–7549, https://doi.org/10.5194/acp-13-7531-2013, 2013.
Xu, X., Liu, J., Zhang, S., Li, R., Yan, C., Wu, S. J. R., and Environment Data Cloud Platform: Beijing, C.: China's multi-period land use land cover remote sensing monitoring data set (CNLUCC), https://doi.org/10.12078/2018070201, 2018.
Yang, D., Zhang, S., Niu, T., Wang, Y., Xu, H., Zhang, K. M., and Wu, Y.: High-resolution mapping of vehicle emissions of atmospheric pollutants based on large-scale, real-world traffic datasets, Atmos. Chem. Phys., 19, 8831–8843, https://doi.org/10.5194/acp-19-8831-2019, 2019.
Zhang, L., Chen, Y., Zhao, Y., Henze, D. K., Zhu, L., Song, Y., Paulot, F., Liu, X., Pan, Y., Lin, Y., and Huang, B.: Agricultural ammonia emissions in China: reconciling bottom-up and top-down estimates, Atmos. Chem. Phys., 18, 339–355, https://doi.org/10.5194/acp-18-339-2018, 2018.
Zhang, S., Wu, Y., Wu, X., Li, M., Ge, Y., Liang, B., Xu, Y., Zhou, Y., Liu, H., Fu, L., and Hao, J.: Historic and future trends of vehicle emissions in Beijing, 1998–2020: A policy assessment for the most stringent vehicle emission control program in China, Atmos. Environ., 89, 216–229, https://doi.org/10.1016/j.atmosenv.2013.12.002, 2014.
Zhao, B., Wang, P., Ma, J. Z., Zhu, S., Pozzer, A., and Li, W.: A high-resolution emission inventory of primary pollutants for the Huabei region, China, Atmos. Chem. Phys., 12, 481–501, https://doi.org/10.5194/acp-12-481-2012, 2012.
Zheng, H., Zhao, B., Wang, S., Wang, T., Ding, D., Chang, X., Liu, K., Xing, J., Dong, Z., Aunan, K., Liu, T., Wu, X., Zhang, S., and Wu, Y.: Transition in source contributions of PM2.5 exposure and associated premature mortality in China during 2005–2015, Environ. Int., 132, 105111, https://doi.org/10.1016/j.envint.2019.105111, 2019.
Zheng, J. Y., Yin, S. S., Kang, D. W., Che, W. W., and Zhong, L. J.: Development and uncertainty analysis of a high-resolution NH3 emissions inventory and its implications with precipitation over the Pearl River Delta region, China, Atmos. Chem. Phys., 12, 7041–7058, https://doi.org/10.5194/acp-12-7041-2012, 2012.