the Creative Commons Attribution 4.0 License.
the Creative Commons Attribution 4.0 License.
 | 23 Mar 2023
Elucidating ozone and PM2.5 pollution in the Fenwei Plain reveals the co-benefits of controlling precursor gas emissions in winter haze
Chunshui Lin
Ru-Jin Huang
Haobin Zhong
Jing Duan
Zixi Wang
Wei Huang
The Fenwei Plain, home to 50 million people in central China, is one of the most polluted regions in China. In 2018, the Fenwei Plain was designated as one of the three key regions for the “Blue Sky Protection Campaign”, along with the Beijing–Tianjin–Hebei (BTH) and Yangtze River Delta (YRD) regions. However, compared to BTH and YRD, our understanding of the current status of air pollution in the Fenwei Plain is limited partly due to a lack of detailed analysis of the transformation from precursor gases to secondary products including secondary organic aerosol (SOA) and ozone. Through the analysis of 7 years (2015–2021) of surface monitoring of the air pollutants in Xi'an, the largest city in the Fenwei Plain, we show that roughly two-thirds of the days exceeded either the PM2.5 or the O3 level-1 air quality standard, highlighting the severity of air pollution. Moreover, an increase in O3 pollution in the winter haze was also revealed, due to the constantly elevated reactive oxygenated volatile organic compounds (OVOCs), in particular formaldehyde, with an ozone formation potential of over 50 µg m−3, in combination with the reduced NO2. The abrupt decrease of NO2, as observed during the lockdown in 2020, provided real-world evidence of the control measures, targeting only NOx (70 % decrease on average), and were insufficient to reduce ozone pollution because reactive OVOCs remained constantly high in a volatile organic compound (VOC)-limited regime. Model simulation results showed that with NO2 reduction from 20 %–70 %, the self-reaction rate between peroxy radicals, a pathway for SOA formation, was intensified by up to 75 %, while the self-reaction rate was only reduced with a further reduction of VOCs of > 50 %. Therefore, a synergic reduction in PM2.5 and O3 pollution can only be achieved through a more aggressive reduction of their precursor gases. This study elucidates the status of ozone and PM2.5 pollution in one of the most polluted regions in China, revealing a general trend of increasing secondary pollution, i.e., ozone and SOA in winter haze. Controlling precursor gas emissions is anticipated to curb both ozone and SOA formation, which will benefit not just the Fenwei Plain but also other regions in China.
- Article
(1678 KB) - Full-text XML
-
Supplement
(4038 KB) - BibTeX
- EndNote


The Fenwei Plain (about 760 km in length and 40–100 km in width) is the largest plain in the middle reaches of the Yellow River. It is home to over 50 million people in central China, surrounded by the Chinese Loess Plateau to the northwest and Qinling Mountains to the south. The rapid growth and urbanization of the Fenwei Plain are accompanied by air pollution that is characterized by high concentrations of fine particulate matter (PM2.5) in the heating season and high concentrations of ground-level ozone in the warm season (Elser et al., 2016; Lin et al., 2021; Song et al., 2021; Lin et al., 2022a, b). Recently, air pollution in the Fenwei Plain has been found to be more severe than in the Beijing–Tianjin–Hebei (BTH) region, Yangtze River Delta (YRD) region, and Pearl River Delta (PRD) region, making the Fenwei Plain one of the most polluted regions in China (Cao and Cui, 2021). In addition to being the emission hotspot of air pollutants, the unique topography of the Fenwei Plain is favorable for accumulating the air pollutants inside the basin (Cao and Cui, 2021), rapidly building up high levels of air pollutants, e.g., under typical cold-haze conditions in calm weather with a wind speed of less than 2 m s−1. In 2018, the Fenwei Plain was designated as one of the three key regions for the “Blue Sky Protection Campaign” (the other two are the BTH and YRD regions). To evaluate the effectiveness of the clean air policies and to further develop cost-effective mitigation policies in the Fenwei Plain, a better understanding of the trend in pollution patterns, sources, and formation mechanism of key pollutants, i.e., PM2.5 and ozone, is required.
As the largest city in the Fenwei Plain, Xi'an is home to over 12 million people, with severe winter haze pollution events being recorded frequently, featuring high PM2.5 concentration levels rivaling those in Beijing (Elser et al., 2016; Lin et al., 2021; M. Wang et al., 2022b). However, ozone is generally viewed as a summertime problem, with very low concentrations in winter (Li et al., 2019). Most ozone studies in the Fenwei Plain were conducted in summer, with few studies performed in winter (Song et al., 2021; Yan et al., 2021; J. Li et al., 2022a). In a recent study, Li et al. (2021) show a tendency of increasing winter–spring ozone with winter haze events in the North China Plain due to the reduced NOx emission, while the emission of reactive volatile organic compounds (VOCs) remained constantly high. In particular, the increased association of high ozone with winter haze events is highlighted during the strict lockdown period in January and February 2020, whereas the formation of secondary organic aerosol (SOA), a major fraction of PM2.5, which is produced from the oxidation of VOCs, was found to be largely increased (He et al., 2020; Zhao et al., 2020; Duan et al., 2021; Li et al., 2021; Zhong et al., 2021). The city- to nationwide lockdown provides a real-world experiment to study the impact of emission control, which mostly targeted NOx (Li et al., 2021), on haze and ozone pollution, which, however, does not appear to be abating in the Fenwei Plain (Duan et al., 2021; Zhong et al., 2021).
Reactive VOCs and oxygenated VOCs (OVOCs) are key precursor gases of ozone and SOA (C. Li et al., 2022; R. Wang et al., 2022), the formation of which involves a series of photochemical reactions of VOCs/OVOCs and NOx. Briefly, upon solar radiation at wavelength < 424 nm, NO2 is photolyzed in the atmosphere (Li et al., 2019; C. Li et al., 2022). Following the photolysis of NO2, the resulting O atom quickly becomes ozone, while NO2 is formed from the oxidation of NO by peroxy radicals, including the peroxy radical (RO2) and hydroperoxyl radical (HO2), which are initiated by the oxidation of VOCs/OVOCs by the hydroxyl radical (OH) (Wang et al., 2009, 2019; C. Li et al., 2022). High levels of NOx, as currently experienced in most Chinese cities, can contribute to radical termination (e.g., OH + NO2) (C. Li et al., 2022; T. Wang et al., 2022), while, in NOx-poor environments, RO2 mainly reacts with other peroxy radicals (i.e., self-reactions), some of which can lead to SOA formation, though this is not the only way (Zhao et al., 2018; Lyu et al., 2022). Previous studies in the Fenwei Plain mostly focus on hydrocarbon-like VOCs, while the OVOCs were rarely studied partly due to the limitation of sampling instrumentation (Song et al., 2021; J. Li et al., 2022a). However, OVOCs were found to be the dominant species in other urban areas in China, showing high ozone and SOA formation potential (Li et al., 2019; Luo et al., 2020; Li et al., 2021). With the development of state-of-the-art instruments, e.g., Vocus proton-transfer-reaction time-of-flight (PTR-TOF) mass spectrometers (Krechmer et al., 2018), a better characterization of OVOCs is crucial for the co-benefits of ozone and PM2.5 reduction in the Fenwei Plain. This is particularly important as the synergic control of ozone and PM2.5 pollution is one of the key policies to improve air quality during the period of the 14th Five-Year Plan (2021–2025).
In this study, a trend analysis of PM2.5 and ozone from 2015–2021 were performed to understand the current status of air pollution. To disentangle the meteorological impacts on the measured trend of PM2.5 and ozone, a machine-learning-based (Grange et al., 2018; Dai et al., 2021; Shi et al., 2021) meteorological normalization technique was applied, revealing the trend of deweathered PM2.5 and ozone. Under the background of decreasing anthropogenic emissions, changes in the chemical composition of PM2.5 and the organic aerosol (OA) factors were investigated based on the available studies using online aerosol mass spectrometry (Elser et al., 2016; Zhong et al., 2020; Duan et al., 2021, 2022). As a case study, the ozone formation potential of OVOCs was analyzed based on its reactivity (Carter, 2010), while the SOA formation potential was analyzed using a 0-D chemical box modeling (Wolfe et al., 2016) in different NOx and VOC reduction scenarios. Based on the ground surface and satellite observation, in combination with the modeling results, the reduction of reactive VOCs/OVOCs for the co-benefits of ozone and the reduction of PM2.5 are discussed.
2.1 Surface measurement data
Hourly O3, PM2.5, NO2, SO2, and CO were continuously monitored at 13 sites within the city center of Xi'an from 2015–2021 (Fig. S1). Measurements of these pollutants were routinely managed by the China National Environmental Monitoring Centre. The distance between the sampling sites is up to 40 km. Despite the distance, the time series of PM2.5 and O3 monitored at different sites were well correlated with similar magnitude in concentrations (Fig. S2). The consistency of the measurements between different sampling sites confirmed the data quality. The data from 13 sites were averaged to get the citywide mean concentration of each pollutant and were used to perform the trend analysis.
VOCs and OVOCs were measured using a Vocus PTR instrument, which was equipped with a long time-of-flight (LToF) mass analyzer, from 24 January to 6 February 2021, along with a high-resolution long time-of-flight aerosol mass spectrometer (AMS). The equipped LToF mass analyzer of the Vocus PTR instrument had a mass-resolving power of approximately 12 000. The Vocus PTR instrument measured organic vapors with a wide range of volatilities using a low-pressure reagent ion source and a focusing ion–molecule reactor (FIMR). The FIMR focused ions to the central axis efficiently with the quadrupole radio frequency (RF) field inside, greatly improving the detection efficiency of product ions. Moreover, no humidity dependence for sensitivity was found for the Vocus PTR instrument since a high-water mixing ratio was applied in the FIMR. To protect the microchannel plate detector from degrading too quickly, the big segmented quadrupole (BSQ) was set up as a high-pass band filter because the focusing effect of RF fields caused the low mass signal to be very high. More instrument details are available in Krechmer et al. (2018). In this study, the Vocus PTR instrument was calibrated with a VOC / OVOC standard mixture (Table S1). The sensitivity of the Vocus PTR instrument towards uncalibrated VOC compounds was calculated from the kinetic rate constant following Krechmer et al. (2018). Uncertainties for the calibrated VOC/OVOC species were 15 %, while the uncertainty was 30 % for the uncalibrated VOC compounds (Table S2) with a known reaction rate constant (kPTR) (https://kb.tofwerk.com/tofware/; last access: 1 March 2023). Due to the low transmission efficiency for low-mass molecules that caused high uncertainties in quantification, formaldehyde (HCHO) was scaled to the mean concentration of the surface HCHO based on satellite observation using the empirical relationship (Zhang et al., 2012). Vocus PTR data were only available in 2021 and were used as a case study to perform an analysis of ozone formation potential and 0-D box modeling of self-reaction rate between peroxy radicals in different scenarios.
The chemical composition of non-refractory particulate matter (NR-PM) was measured using an AMS or an aerosol chemical speciation monitor (ACSM) at the old campus of the Institute of Earth Environment, Chinese Academy of Sciences (Table S3), in the winter of 2012–2014 (Zhong et al., 2020) (Elser et al., 2016) and, more recently, in 2018–2019 (Duan et al., 2022), 2020 (Duan et al., 2021), and 2021 (this study; Fig. S3). For AMS measurement, Elser et al. (2016) first deployed an AMS with a PM2.5 inlet and comprehensively evaluated its performance during the winter campaign in Xi'an. Based on the same design, a soot particle AMS (SP-AMS) equipped with a PM2.5 inlet was recently deployed at the same sampling site, quantifying PM2.5 chemical composition with high mass and temporal resolution (Lin et al., 2021; Duan et al., 2022). OA factors were apportioned using positive matrix factorization (PMF) with the Multilinear Engine (ME-2) (Elser et al., 2016; Zhong et al., 2020; Duan et al., 2021, 2022), Similarly, OA source apportionment was performed for the 2021 dataset using the Igor Pro-based (WaveMetrics Inc.) interface of SoFi (version 8.2.1) (Canonaco et al., 2013). The apportioned factors explained the input OA matrix well (Figs. S4–S6).
2.2 Satellite and meteorological data
Vertical column densities (molecules cm−2) of tropospheric formaldehyde and NO2 were obtained from the Sentinel-5P Level-3 Near Real-Time dataset based on the observation of the TROPOspheric Monitoring Instrument (TROPOMI) using Google Earth Engine (Gorelick et al., 2017). This dataset was used to study the spatiotemporal variation of reactive OVOCs as a response to strict lockdown measures implemented in 2020. As a comparison, satellite images were also obtained for the same period in 2019 and 2021.
Boundary layer height (BLH) and downward ultraviolet (UV) radiation at the surface were accessed from the European Centre for Medium-Range Weather Forecasts (ECMWF) Reanalysis v5 (ERA5). Wind speed, wind direction, relative humidity, and air temperature were obtained from the Integrated Surface Database (ISD).
2.3 Meteorological normalization
A machine-learning-based meteorological normalization using the random forest (RF) algorithm (Grange et al., 2018) was used to decouple the meteorological impacts on the observed O3 and PM2.5. Firstly, the random forest was grown using the meteorological and time variables as input. The meteorological variables included the data obtained from ERA5 and ISD, while time variables included Unix date, Julian day, weekday, hour of the day, and day of the lunar year. A proportion of 80 % of the dataset was randomly selected to train the model, while 20 % was used to validate the model. The “rmweather” R package was applied during the random forest modeling (Grange et al., 2018). As shown in Figs. S7 and S8, the predicted and measured O3 and PM2.5 were well correlated (R2 > 0.89), suggesting the developed model rebuilt the measurements very well.
RF-based meteorological normalization was first introduced by Grange and Carslaw (2019). However, it is not straightforward to investigate the seasonal variation in the trends of deweathered air pollutants using the proposed normalization method (Grange and Carslaw, 2019). Vu et al. (2019) enhanced the meteorological normalization procedure by repeatedly resampling the meteorological variables for a particular time point within a 4-week period, and the resampled variables were fed to the developed RF model. The meteorological normalization method proposed by Vu et al. (2019), is widely applied in different sampling sites (Dai et al., 2021; Shi et al., 2021). In this study, we resampled the meteorological variables by averaging the meteorological variables for the same time point across 7 years. Our proposed method was more straightforward and subject to less variation given that meteorological variables varied a lot over a 4-week period (e.g., see the comparison between the resampled and observed temperatures in Fig. S19). Also, our method is less time-consuming. Therefore, meteorological normalization technology assumed the meteorological variables were invariant among the years. In this scenario, the predicted values represent the changes in air pollutant concentrations that were not affected by meteorological variables (i.e., deweathered pollutants).
2.4 0-D box modeling
The Master Chemical Mechanism (MCM) v3.3.1 (Jenkin et al., 2003, 2019) was incorporated in a chemical box model using the Framework for 0-D Atmospheric Modeling (F0AM) version 4.2.2 (Wolfe et al., 2016). Surface observational data were averaged for the overlapping period with OVOC measurements to get the diurnal profiles of each pollutant. The averaged air pollutants, including NO2, O3 (not included when it was simulated; Fig. S10), CO, and the measured VOC/OVOCs (Table S2), were used to constrain the model at hourly resolution (base run). The box model reproduced the measured ozone reasonably well (Fig. S10) after optimizing the correction of the simulated photolysis rate. However, due to the uncertainties of the box model which did not consider factors like regional transport and heterogenous chemistry, as well as the parameterized ozone deposition, the modeling results were only used to understand the atmospheric chemistry involving OVOCs by comparing different scenarios. Note that HCHO was not included when it was being simulated. Using the averaged diurnal profiles reduced modeling uncertainty caused by occasional data flaws and data gaps due to instrument maintenance. The photolysis frequencies were calculated based on tropospheric ultraviolet and visible (TUV) v5.2 solar spectra. For each scenario simulation, the box model was set to spin up for 48 h.
3.1 Ozone pollution spreading into the late-winter haze season
Figure 1 shows the observed exceedance frequency (in days per month) of China's National Ambient Air Quality Standard (NAAQS level-1) for 24 h PM2.5 (35 µg m−3) and for maximum daily 8 h (MDA8) ozone (100 µg m−3), averaged for 2015–2018 and 2019–2021 in the biggest city (i.e., Xi'an) in the Fenwei Plain in central China (Fig. S1). For the observed PM2.5, most exceedances were observed in the heating season from November to March, with over two-thirds of the days in individual months exceeding the 24 h PM2.5 standard (Fig. 1a). In contrast, for surface ozone, most exceedances were observed in the warm season from May to August, with approximately two-thirds of the days in individual months exceeding the MDA8 ozone standard (Fig. 1b). Combined, over two-thirds of the days throughout the year (except October) exceeded either the ozone or the PM2.5 standard, reflecting the severe air pollution in the Fenwei Plain (Fig. 1c), despite the decreasing trend found for PM2.5 (Fig. S11). A similar trend was observed for the deweathered ozone and PM2.5, suggesting meteorological conditions were not affecting the trend significantly (Fig. S12). Moreover, in terms of exceedance of the NAAQS level-2 standard (i.e., 75 µg m−3 for 24 h PM2.5 and 160 µg m−3 for MDA8 ozone), similar pollution patterns were observed, although the exceedance frequency was less due to the relatively loose standard (Fig. S13).
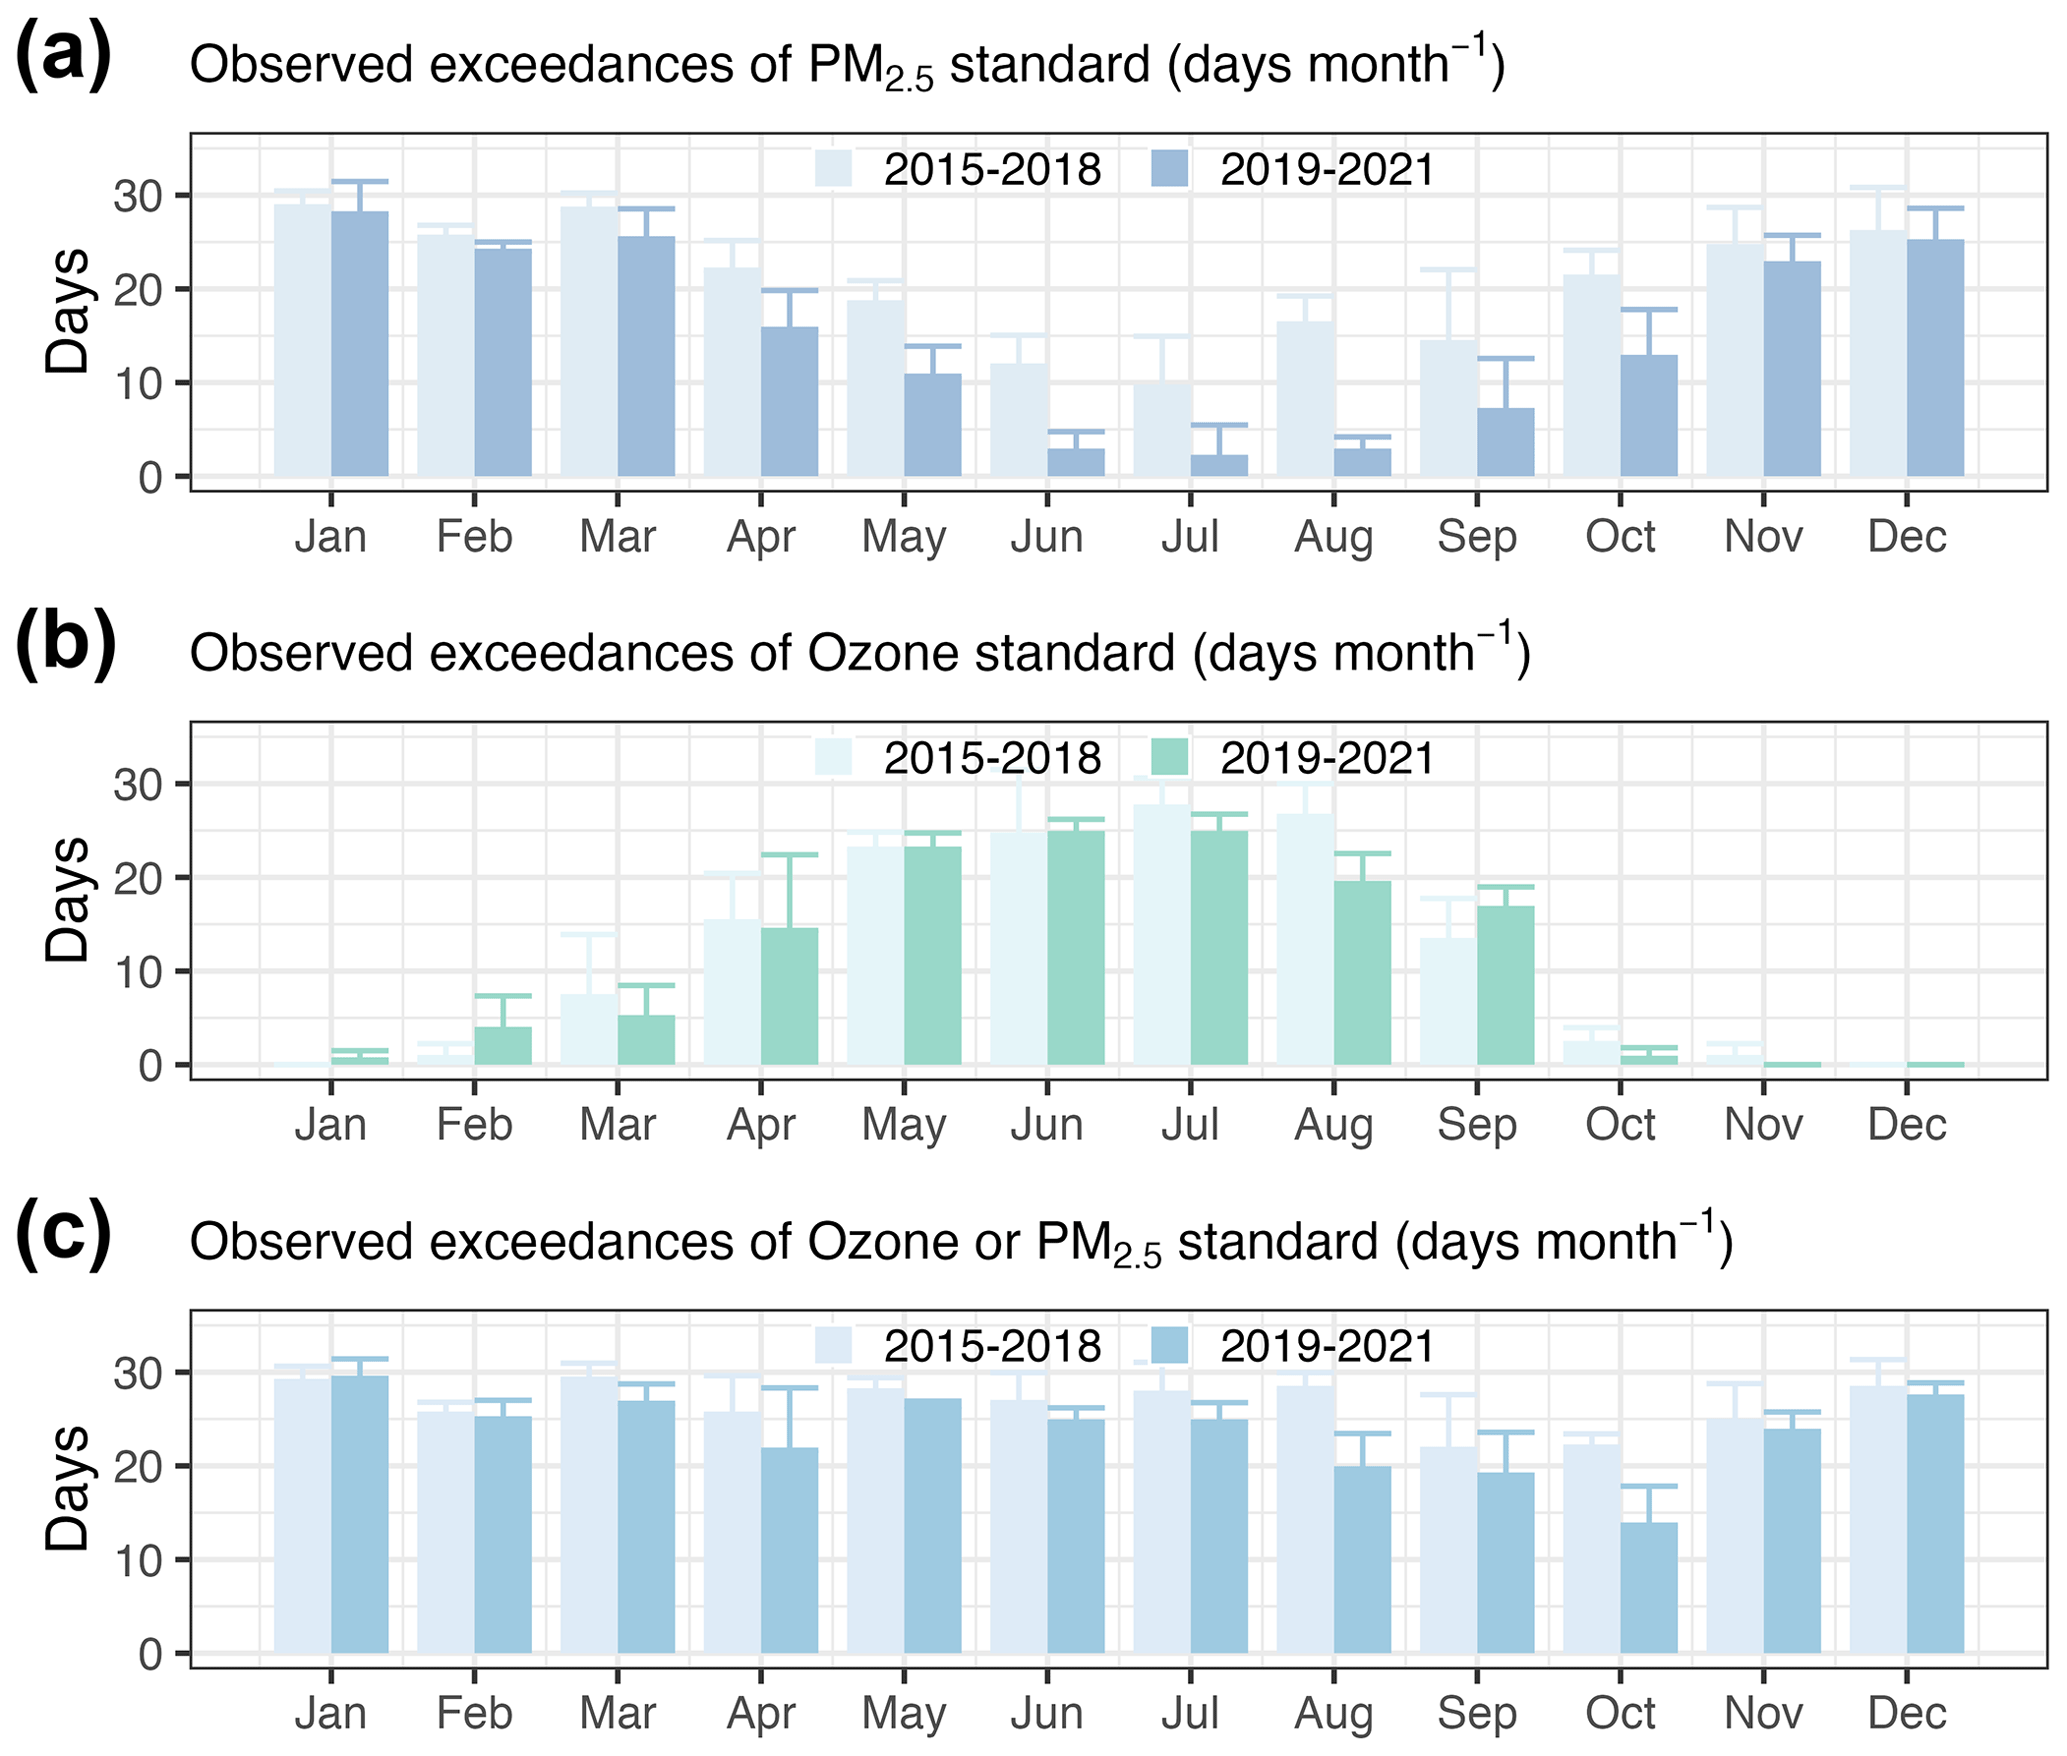
Figure 1Observed exceedance frequency (in days per month) of PM2.5 (a), ozone (b), and ozone or PM2.5 (c) standard (NAAQS level-1) in the biggest city (i.e., Xi'an) in the Fenwei Plain, averaged over 2015–2018 and 2019–2021. Ozone and PM2.5 were averaged from 13 monitoring sites in Xi'an. Error bar represents 1 standard deviation.
Compared to 2015–2018, the observed exceedances of PM2.5 standard during the warm season in 2019–2021 decreased largely, e.g., by over 10 d in August (Fig. 1a), while the differences in the observed exceedances of PM2.5 standard were only marginal during the heating season in 2019–2021, i.e., less than 3 d for an individual month in winter. In particular, the exceedance for January in 2019–2021 even increased by approximately 1 d (Fig. 1a). Compared to PM2.5, the difference in the observed exceedances of the ozone standard between 2015–2018 and 2019–2021 was small, with values mostly below 5 d per month (Fig. 1b). In contrast to the slightly decreasing trend of PM2.5, the observed exceedances of ozone standard even increased by 1–4 d per month for January and February in 2019–2021 compared to 2015–2018 (Figs. 1b and S14). Therefore, while the winter particulate pollution has not appeared to be abating in recent years in terms of frequency of exceedance of PM2.5 standard, the spread of ozone pollution into the late winter (i.e., January and February) may aggravate the air pollution issue in the Fenwei Plain.
Figure 2 shows the observed and deweathered (using a machine-learning-based deweathering technique; see Method section) diurnal cycle of PM2.5 and O3 in late winter (January–February) averaged over 2015–2018 and 2019–2021. For the observed PM2.5, elevated concentrations (> 100 µg m−3) were observed from the evening to noon the next day (20:00–12:00; Fig. 2a). The elevated concentration in the evening and morning was due to the primary emission from various sources and secondary particulate formation (discussed in Sect. 3.3), coupled with a shallow boundary layer (Fig. S15) and the topography of the Fenwei Plain (Cao and Cui, 2021), favoring the buildup of air pollutants. However, PM2.5 started to decrease at 12:00, reaching the lowest concentrations (< 100 µg m−3) at 16:00–18:00. The decrease in the afternoon was likely due to the reduced primary emission and increased boundary layer height (BLH). The increasing BLH in the afternoon diluted the air pollutants, which was confirmed by the decreased CO at the same time (Fig. S16). The ΔCO-corrected PM2.5 first showed an increase at noon and decreased afterward (Fig. S16), probably because the PM2.5 emissions and/or secondary formation were insufficient to counter the diluting effects in the afternoon. Compared to 2015–2018, the observed PM2.5 in 2019–2021 showed a larger decrease (10 µg m−3) in the late evening and morning, while the decrease in the afternoon was less significant (∼ 5 µg m−3; Fig. 2). A similar trend was also observed for the deweathered PM2.5, suggesting the reduction in PM2.5 in recent years was mainly caused by emission reduction.
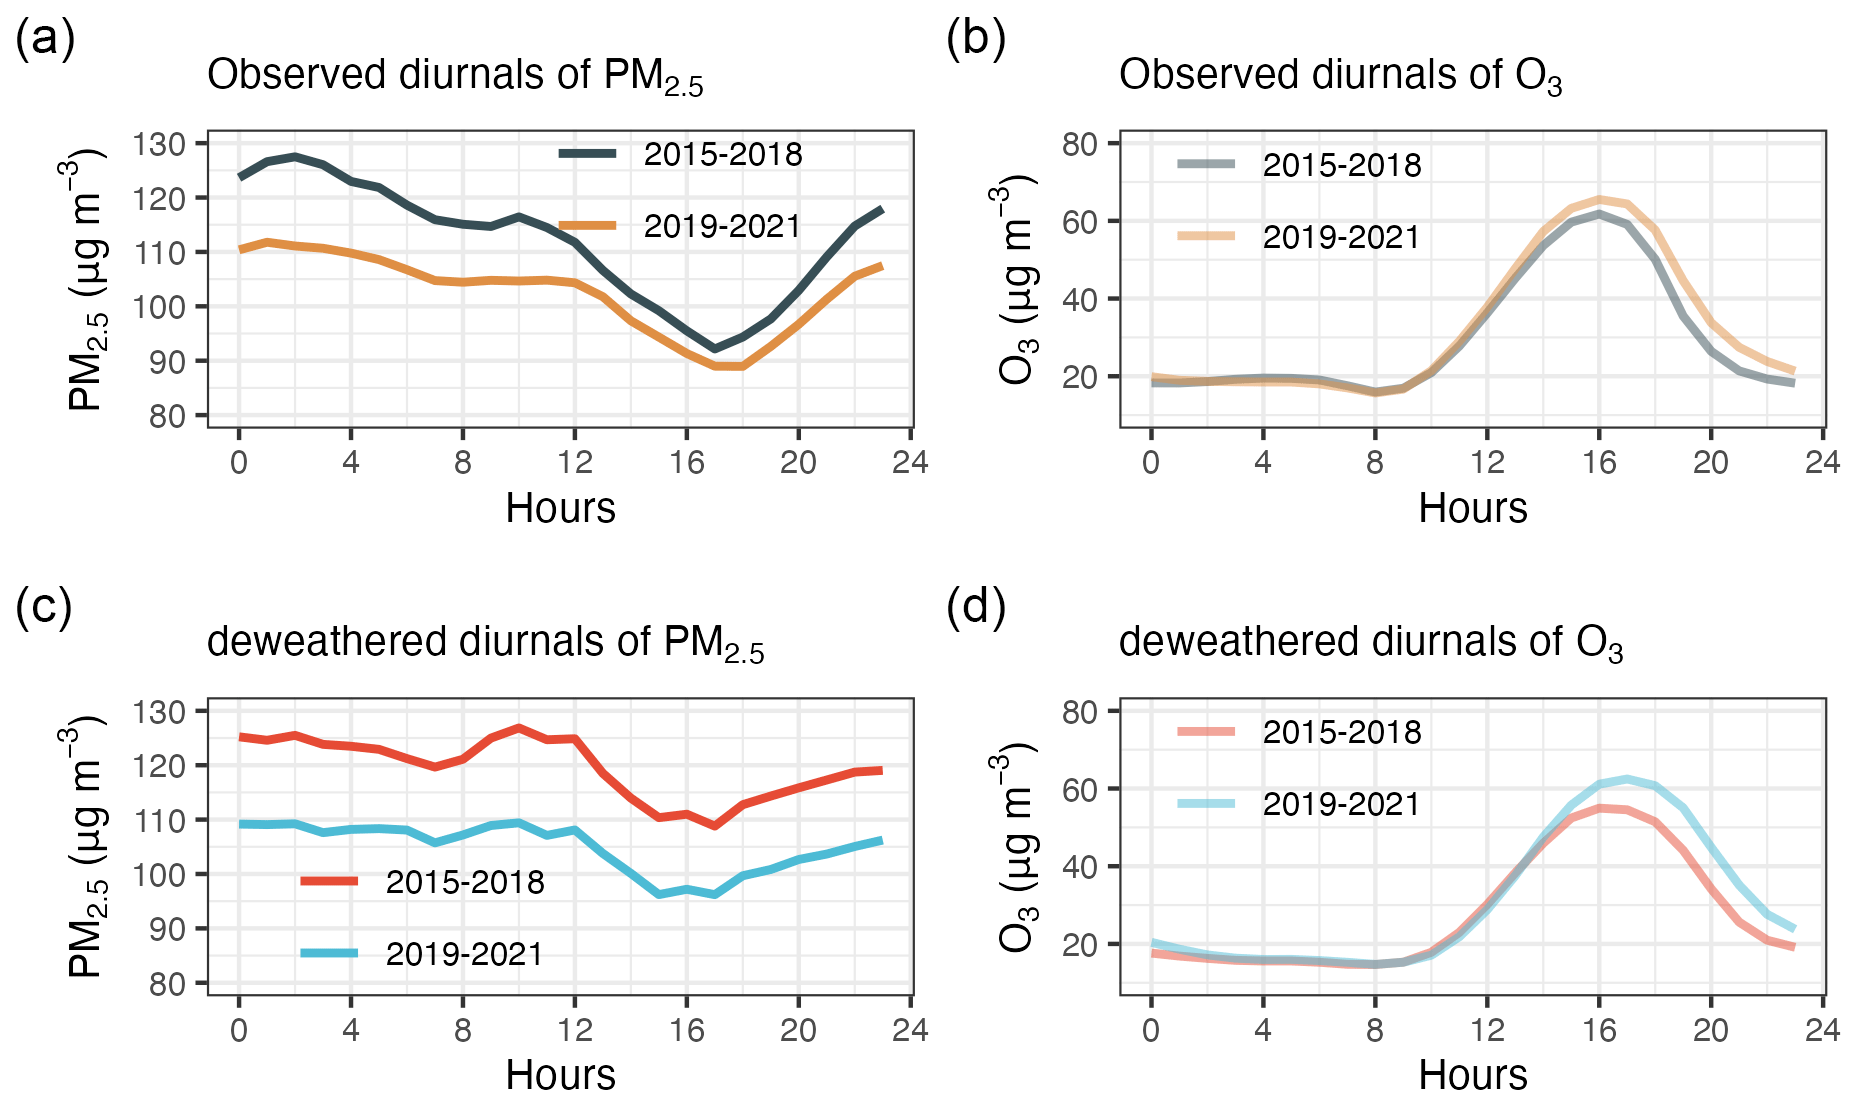
Figure 2Observed and deweathered diurnal patterns for PM2.5 (a,c) and O3 (b, d) for January–February in 2015–2018 and 2019–2021.
Different from PM2.5, both the observed (Fig. 2b) and deweathered O3 (Fig. 2d) showed small differences between 2019–2021 and 2015–2018 during the morning hours (00:00–12:00; sunrise at 08:00) when PM2.5 showed the largest reduction. In contrast, the increase in O3 concentration in 2019–2021 was most prominent in the afternoon when PM2.5 reduction was less prominent. Given that the observed NO2 also showed the largest reduction (20 µg m−3, Fig. S17) in the afternoon, the increase in O3 in the afternoon for 2019–2021 was likely caused by the reduced titration effects, coupled with the reduced PM2.5 that scavenged fewer ROx (OH + HO2+ RO2) radicals. This is consistent with the VOC-limited regime for the O3 formation in the Fenwei Plain for 2019–2021 (discussed in Sect. 3.4). In particular, for a VOC-limited regime, a moderate decrease in NOx emission is accompanied by an increase in O3.
3.2 OVOCs and ozone formation potential in the winter: a case study
To understand the formation processes of ozone in winter, precursor gases of VOCs and OVOCs were measured using a Vocus PTR instrument in Xi'an from 24 January to 6 February 2021 (Sect. 2.1). Table 1 shows the top 10 VOC/OVOC species that were quantified, along with the ozone formation potential (OFP) that was estimated using the maximum incremental reactivity (MIR) (Carter, 2010). Formaldehyde (HCHO) was the most dominant OVOC, with a mean concentration of 4.16 ppb. Its ozone formation potential (OFP) was also the highest (54.4 µg m−3), reflecting its high reactivity. The important role of formaldehyde in ozone formation is consistent with the findings in the North China Plain (Li et al., 2021). Note that formaldehyde can be directly emitted from incomplete combustion of, e.g., biomass and fossil fuel, while it can also be produced from the oxidation of reactive VOCs (Su et al., 2019).
Table 1Top 10 volatile organic compounds (VOCs)/oxygenated VOCs (OVOCs) and the ozone formation potential (OFP).
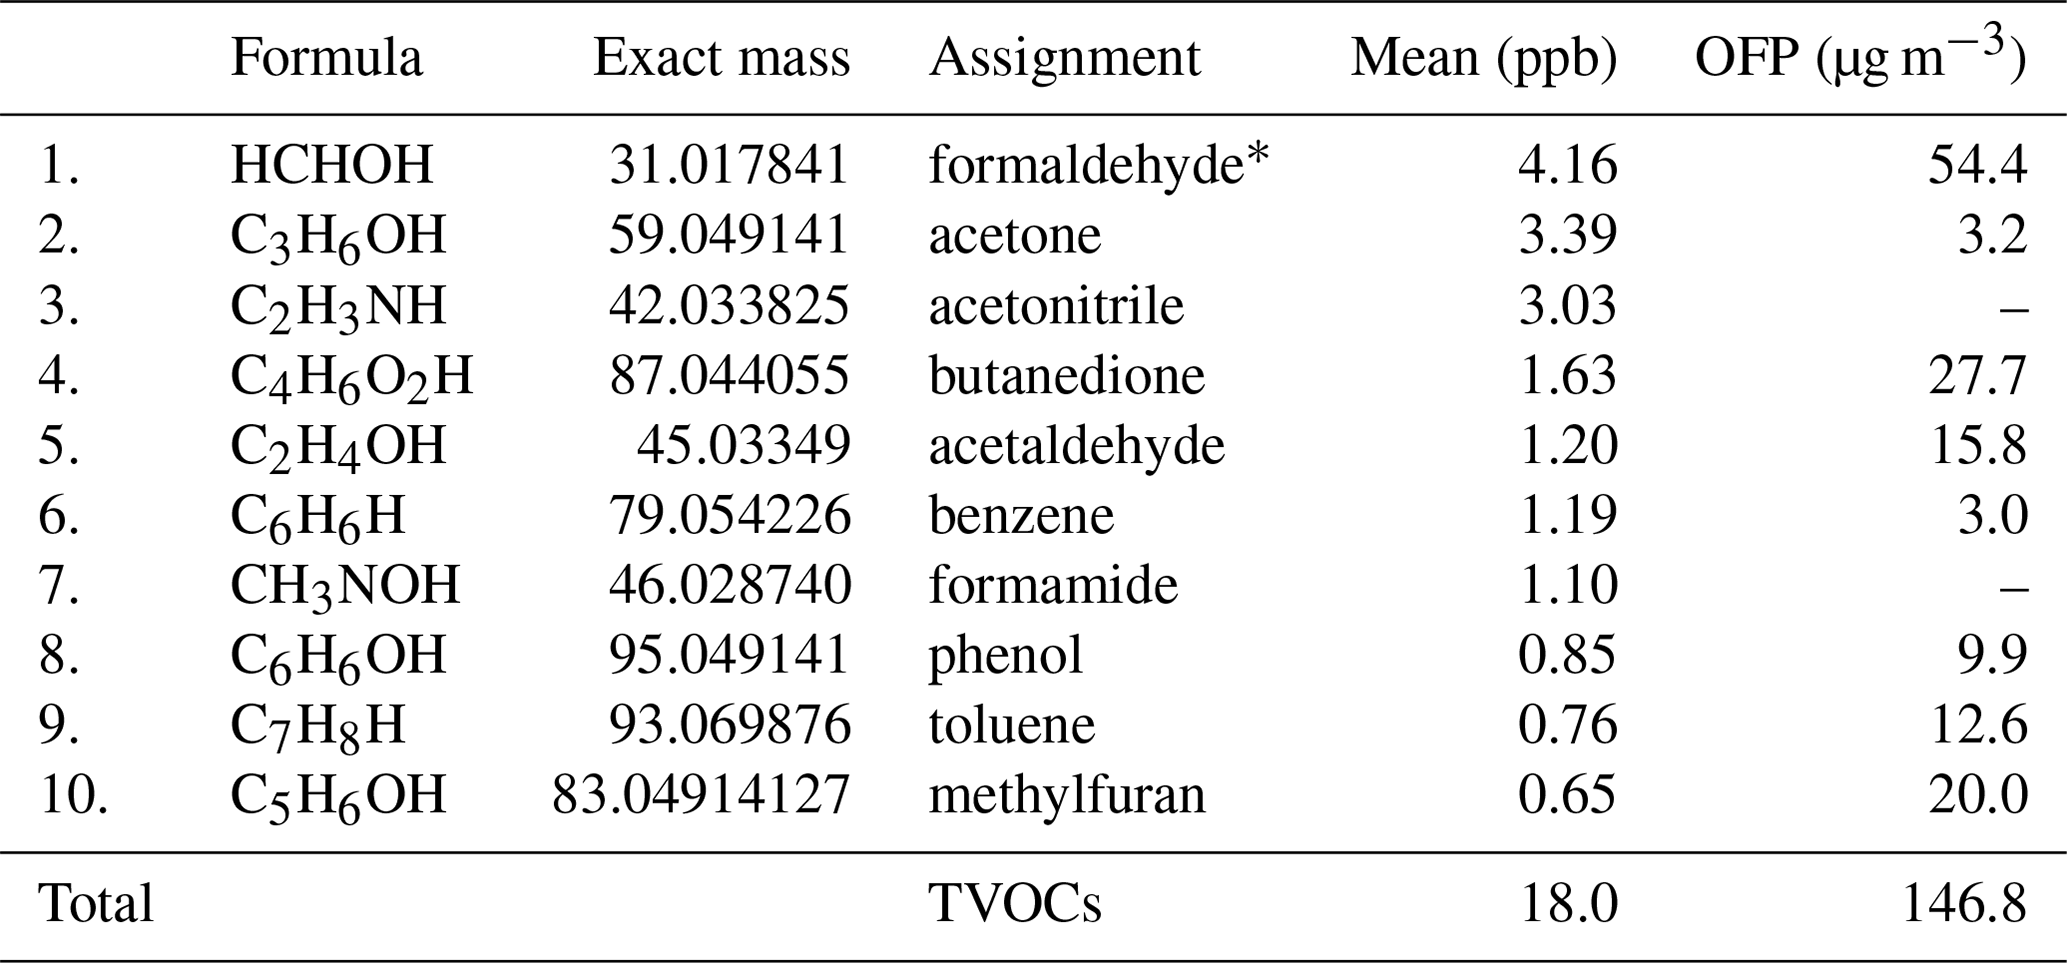
* Formaldehyde concentration was scaled using the vertical column concentration.
By constraining ozone and other VOCs/OVOCs (except formaldehyde) in a 0-D box model, the secondary formation of formaldehyde, fueled by photochemical reaction, was simulated (Fig. 3). Compared to the mixing ratio of the measured formaldehyde, the model reproduced the measured formaldehyde at a similar level of around 4.2 ppb. However, compared to the simulated formaldehyde, the elevated concentration of the observed formaldehyde in the evening and morning (22:00–08:00; Fig. 3) was likely associated with the primary emission from biomass and fossil fuel combustion, coupled with a shallow boundary layer (Fig. S15). Note that the primary emission of formaldehyde as well as the regional transport was not considered in the box model. The modeled formaldehyde showed an increased mixing ratio at noon (Fig. 3a), corresponding to the increased local formation as indicated by the increased solar radiation and OH radicals (Fig. 3b). This is because the box model only considered photochemical formation, not taking into account the scavenging effects of ROx (OH + HO2+ RO2). High levels of PM2.5 (> 80 µg m−3) were observed in the morning (Fig. 2), which were likely playing an important role in scavenging ROx radicals (Shao et al., 2021). Therefore, the modeled spike in formaldehyde at noon was not observed. Similarly, the highest concentration of ozone was coincident with the lowest level of PM2.5 in the late afternoon (15:00–17:00), likely due to the reduced scavenging effects which were associated with reduced PM2.5 concentration. As a comparison, the highest level of downward solar radiation or the estimated OH radical was at midday (12:00–14:00), corresponding to the highest ozone production rate simulated in the box model (Fig. S18).
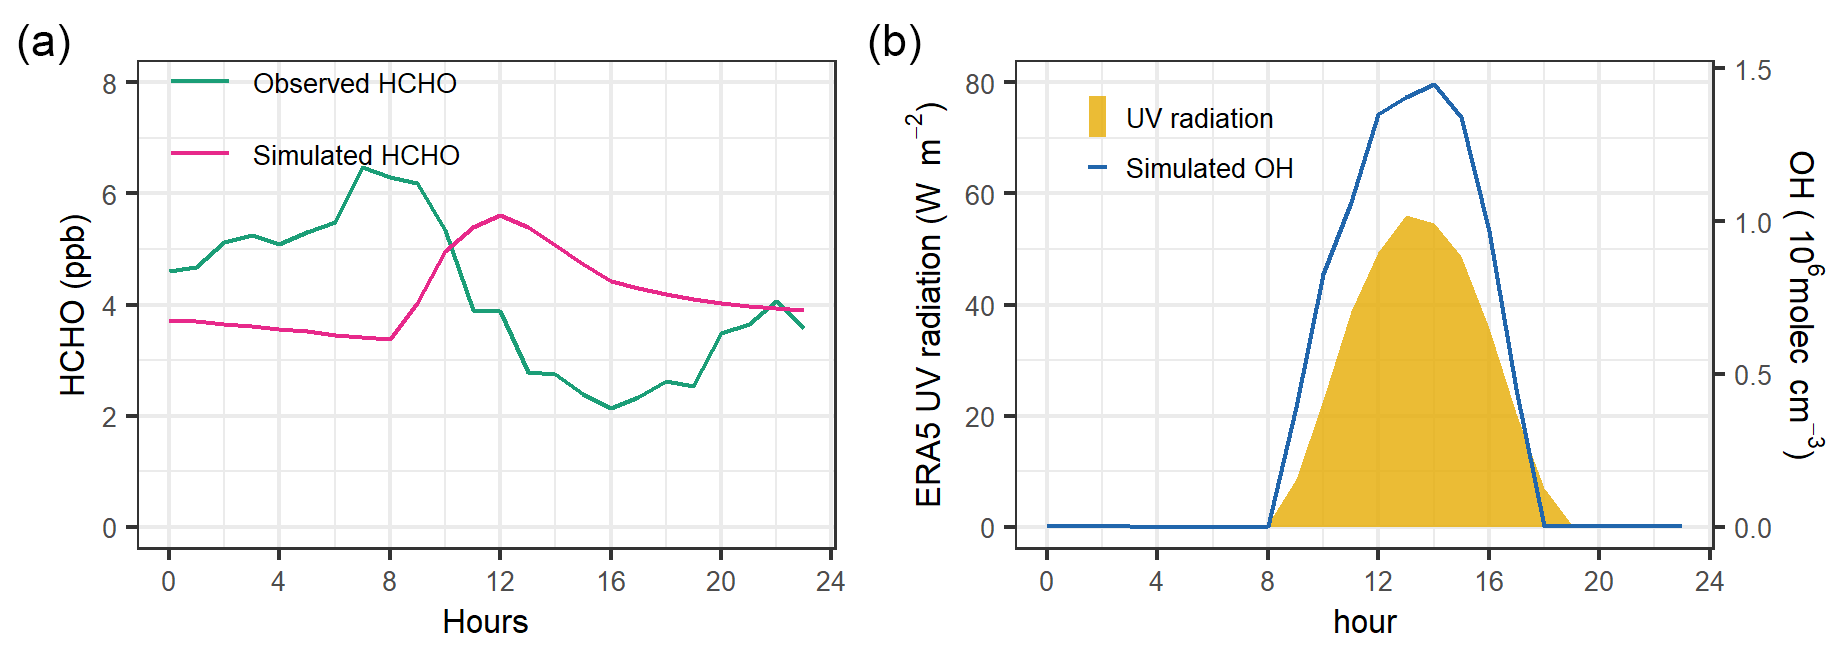
Figure 3(a) Observed and simulated formaldehyde (HCHO) and (b) the EAR5 UV radiation flux and the simulated OH radical in the box model.
Acetone was the second most abundant OVOC, with a mean mixing ratio of 3.3 ppb. However, due to the low reactivity of acetone, its OFP was less significant (3.2 µg m−3). Acetone was also found to be one of the most abundant OVOCs in a summer campaign conducted in Xi'an, although the acetone mixing ratio in this study was at the lower end of the concentration range (2.1–6.6 ppb) sampled in summer 2019 (Song et al., 2021). Nitrogen-containing VOCs of acetonitrile (mean: 3.0 ppb) and formamide (1.1 ppb) were also abundant. However, these nitrogen-containing VOCs were generally considered minor contributors to ozone formation (Carter, 2010), and their OFPs were not evaluated here. Other important ozone precursors include butanedione (1.6 ppb), acetaldehyde (1.2 ppb), and methyl furans (0.65 ppb).
Aromatics including benzene (1.2 ppb), phenol (0.85 ppb), and toluene (0.76 ppb) were also the top VOCs or OVOCs, contributing to OFPs of 3.0, 9.9, and 12.6 µg m−3, respectively (Table 1). Toluene (0.76 ppb) was largely reduced compared to the values (1.9–10.5 ppb) reported previously, e.g., in autumn to winter 2017 (J. Li et al., 2022a), although the concentrations were not directly comparable given the different sampling techniques and time. The large reduction was partly due to the reduction in emission intensities. It is important to note that, without the high-mass-resolution Vocus PTR instrument, toluene can be largely overestimated due to the dominant ion (C3H8O3H+) at the same nominal mass-to-charge () ratio as toluene, i.e., at 93 (Fig. S19). In this study, aromatics were estimated to contribute to 17 % of the total OFP, slightly higher than its mass fraction (16 %) in VOCs.
3.3 An increased role of secondary particulate formation in winter haze
To understand the changes in PM2.5 and organic aerosol (OA) sources in the winter season, the chemical composition of non-refractory particulate matter (NR-PM) and the corresponding OA factors were compiled (Fig. 4 and Table S3) based on the available studies conducted at the same sampling site in urban Xi'an using an online AMS or ACSM (Table S4). Compared to the winter mean NR-PM concentration (261.2 µg m−3) in 2012–2014, a reduction of over 60 % in the NR-PM concentration (100.6 µg m−3) in 2018–2021 was observed (Fig. 4). Such a large reduction was mainly due to the reduction in primary particulate emissions including primary OA and chloride, as well as the reduction in the precursor gases of, e.g., SO2 that can form secondary species of sulfate, starting from the implementation of the Clean Air Act in 2013 and the Blue Sky Protection Campaign in 2018. For example, the mean of CO, a surrogate of primary emission due to the incomplete combustion of fossil and biomass burning, showed a similar level of (60 %) reduction from 2015–2021 (Fig. S20). For the same period, an approximately 60 % reduction in citywide SO2 was also seen where SO2 is mainly associated with fossil fuel combustion (Fig. S20). Despite the large reduction in NR-PM concentrations, exceedances of NAAQS standards were still frequently observed (see Sect. 3.1).
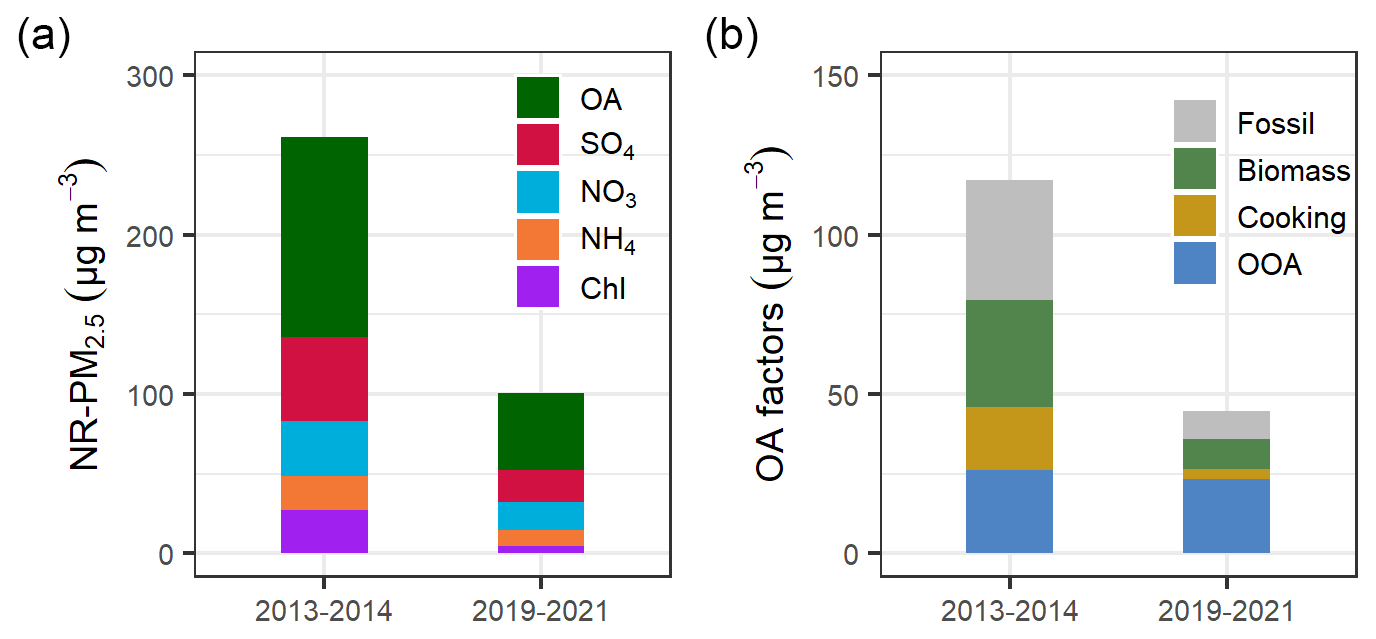
Figure 4(a) Mean chemical composition of non-refractory particulate matter (NR-PM2.5) and the OA factor for winter in 2012–2014 and 2018–2021.
In terms of chemical composition, the OA fraction in NR-PM remained similar, accounting for approximately half of the NR-PM for both periods (Fig. 4a), although its absolute concentration decreased by 62 % from 117.1 µg m−3 in 2012–2014 to 44.6 µg m−3 in 2018–2021. The reduction in OA concentration was mainly due to the large reduction in primary OA, while oxygenated OA remained at a similar level (Fig. 4b). Specifically, the primary fossil fuel OA factor was reduced by 77 % (28.9 µg m−3), while biomass burning OA was reduced by 72 % (24.2 µg m−3). The reduction in fossil fuel and biomass burning was consistent with the reduction in CO and SO2, as discussed above. Similarly, the primary cooking OA factor was also largely reduced by 84 % (16.4 µg m−3). The reduction in cooking emissions could be partly due to upgraded kitchen facilities (Liu et al., 2022), although we note that the sampling time and duration of the compiled studies were not the same (Table S3), causing uncertainties in the evaluations of changes in OA factors years. Future studies with long-term continuous measurements, e.g., using ACSM (Chen et al., 2022), will improve the understanding of trends in OA factors in this region. Nevertheless, compared to primary organic aerosol (POA) factors, oxygenated organic aerosol (OOA) was marginally reduced by 11 % (3.0 µg m−3). Due to the larger reduction in primary OA factors, the OOA fraction accounted for over half (52 %) of the total OA in 2018–2021, twice higher in terms of fractional contribution compared to the value (22 % of OA) in 2012–2014. Biomass burning OA (21 % of OA) and fossil fuel OA (20 % of OA) had similar contributions to the total OA (Fig. 4b) in 2018–2021. The increased fractional contribution of OOA in recent years was likely due to the emission of its precursor VOCs that were not decreasing in the Fenwei Plain and the increased oxidizing capacity as indicated by the increased ozone concentration. The increase in secondary OA was consistently observed in other areas in China (J. Li et al., 2022b; Nie et al., 2022), which may change of volatility and viscosity of OA (Feng et al., 2023).
Among the inorganic components of NR-PM, chloride showed the largest reduction (84 % or 22.9 µg m−3) in the 2018–2021 winter compared to that in 2012–2014 (Fig. 4a). Chloride was mainly associated with the primary emission from coal and biomass burning. The large reduction in chloride was consistent with the reduction in the primary fossil fuel and biomass burning OA factors (Fig. 4b). Sulfate showed a reduction of 61 % (32.3 µg m−3), while nitrate showed a reduction of 50 % (17.3 µg m−3). Ammonium showed a reduction of 51 % (10.8 µg m−3). The reduction in sulfate was consistent with the reduction in its precursor SO2 (Fig. S20). Because nitrate reduction was less significant, nitrate increased its fractional contribution (17 % of NR-PM2.5) in 2018–2021 from 13 % of NR-PM2.5 in 2012–2014. Compared to SO2, the reduction in NO2 was only observed in recent years (from 2018–2021), while NO2 showed a slight increase from 2015–2018 (Fig. S20). Therefore, nitrate is likely to increase its fractional contribution to the total PM2.5 mass because NO2 was not decreasing as significantly as SO2. Also, the increased oxidizing capacity leads to enhanced nitrogen oxidation ratio and thus enhanced nitrate yield.
3.4 Impact of control policies on ozone and secondary aerosol formation: observation-based modeling
As a response to the coronavirus pandemic (i.e., COVID-19), the lockdown measures, which were implemented in the Fenwei Plain from 24 January to 28 February 2020, provided a unique opportunity to investigate the impact of strict emission control on ozone and SOA formation potential in comparison to that before (2019) and after the pandemic (2021). Figure 5 shows the vertical column density of NO2, a surrogate of anthropogenic emission, and formaldehyde, a surrogate of reactive OVOCs, over the same period (24 January–28 February) for 3 consecutive years from 2019–2021. Compared to NO2 (18–25 × 1015 molecules cm−2) before the pandemic in 2019, the mean vertical column density of NO2 during the lockdown (6–10 × 1015 molecules cm−2) in Xi'an 2020 reduced by up to over 70 %. However, without the lockdown measures in 2021, the NO2 column density bounced back quickly but with a slightly lower density in the city center of Xi'an (16–20 × 1015 molecules cm−2). In particular, the NO2 in other cities in the Fenwei Plain was only 70 %–80 % (or 14–20 × 1015 molecules cm−2) of that in 2019 (Fig. 5).

Figure 5Tropospheric NO2 column densities, a surrogate of anthropogenic emissions, and tropospheric HCHO column densities, a surrogate of OVOCs, measured by the TROPOMI satellite instrument in January–February in 2019, 2020, and 2021.
The large reduction in NO2 during the lockdown period in 2020 implies a sharp reduction of anthropogenic emissions. However, different from NO2, the vertical column concentration for formaldehyde remained at the same level for the lockdown year in 2020 compared to before the lockdown in 2019, with densities in the range of 8–10 × 1015 molecules cm−2 in urban Xi'an (Fig. 5), suggesting a weaker reduction of the reactive OVOC despite the significant reduction in anthropogenic activities, including traffic and some industries that were not operative during the pandemic in 2020. In 2021, the formaldehyde densities even increased a little bit compared to 2019 (Fig. 5). Due to the large ozone formation potential from formaldehyde (as discussed in Sect. 3.3) and the reduced NOx emissions (titration effects), surface ozone concentrations increased the NAAQS exceedance frequency in recent winters, as demonstrated in Fig. 1. This is also consistent with the fact that ozone formation pathways in the city centers of the Fenwei Plain are in the VOC-limited regime as corroborated by the low TROPOMI HCHO NO2 ratios with values below 1 (Fig. S21). The low HCHO NO2 values in the Fenwei Plain were consistent with those observed in most Chinese cities, where O3 was in the VOC-limited region (C. Li et al., 2022; Tan and Wang, 2022).
To examine the response of in situ photochemistry to up to 70 % reduction in NO2 as the scenario of the strict emission control during the lockdown, simulations of the changes in the mean rate of self-reaction between peroxy radicals were performed using a box model. Figure 6 shows that the mean self-reaction rate between peroxy radicals increased by 12 %–75 % in response to the reduction of 20 %–70 % of NO2, while the VOCs were constant. Self-reaction between peroxy radicals includes the autooxidation of RO2 (RO2+ RO2) and HO2 (HO2 + HO2) and cross-reactions (RO2+ HO2), some of which lead to SOA formation (Zhao et al., 2018). Given that self-reaction between peroxy radicals is an important pathway for SOA formation potential, the increase in self-reaction rate can partly explain the increase in SOA formation potential in recent winters (Fig. 3). In addition to the self-reaction, a part of the reaction between NOx NO3 and peroxy radicals can also produce organic nitrate that could partition to the particle phase (Lin et al., 2021). However, such formation pathways were likely playing a less important role when NOx emissions were largely reduced. In a scenario of a further 20 % reduction in VOCs, the self-reaction rate was reduced as compared to the reduction of NO2 alone. This is because reducing VOCs reduces the availability of peroxy radicals, while the competition between peroxy radicals and NOx was also reduced at the same time. However, the rate is still 14 % higher than the base case. A large reduction (50 %–80 %) in the self-reaction rate can be only achieved in response to a further 50 %–70 % reduction of VOCs as compared to the base case. The modeling results imply the co-benefits of controlling VOCs in reducing ozone and SOA pollution.
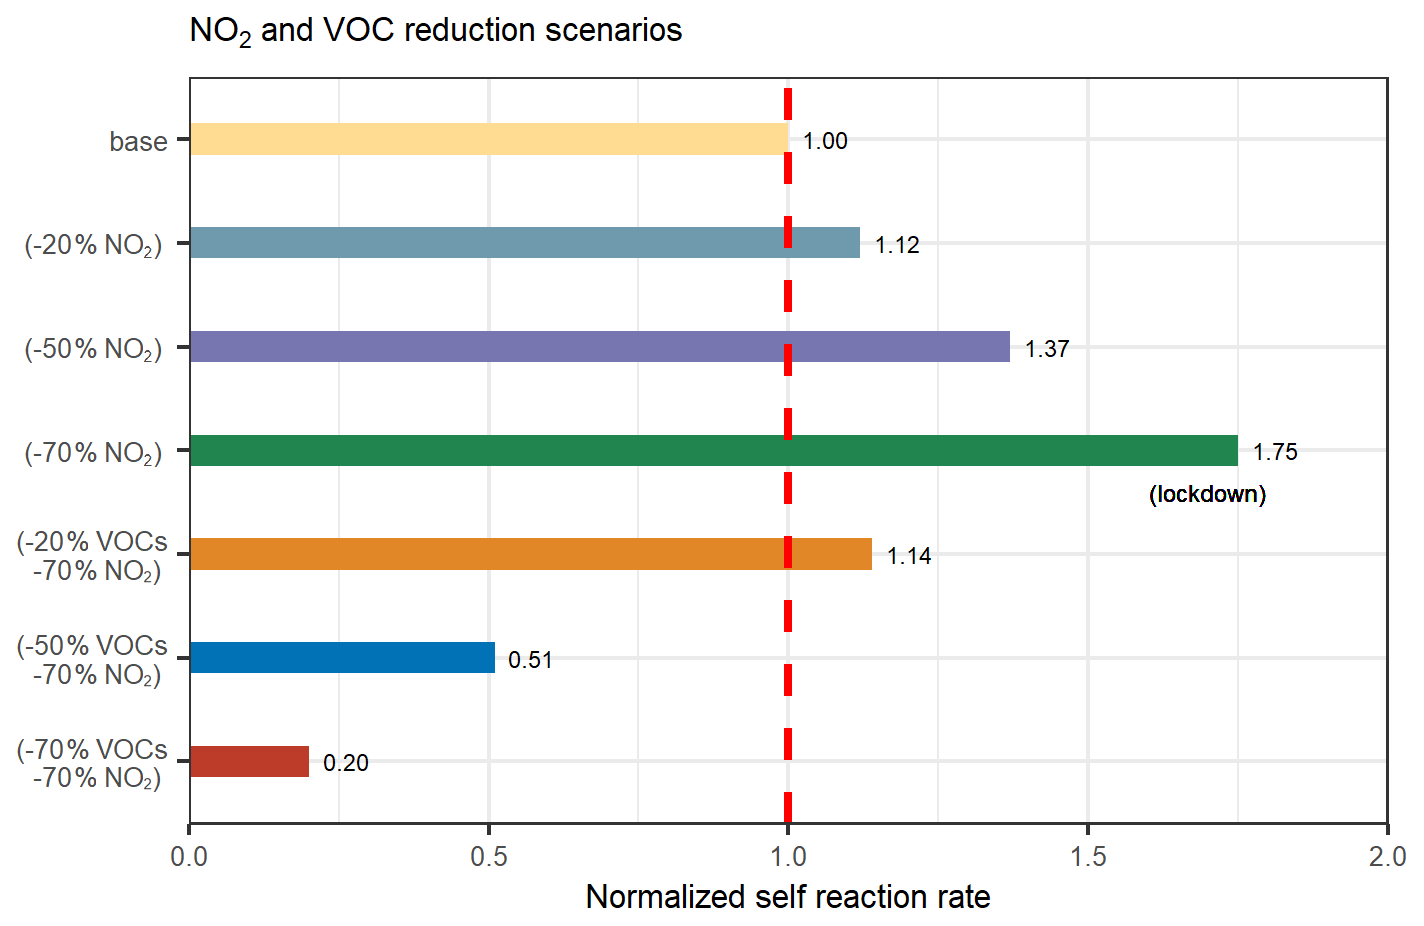
Figure 6Changes in the self-reaction rate between peroxy radicals with 20 %–70 % reduction in NO2 and a further 20 %–70 % reduction in VOC. The COVID-19 lockdown in 2020 corresponded to a reduction in NO2 of 70 %. The reaction rate in different reduction scenarios was normalized to the value in the base run (guided by the dashed red line).
3.5 Atmospheric implication
The increase of ozone pollution in winter, concurrent with haze pollution in the Fenwei Plain, is concerning since ozone pollution is generally considered a summertime problem (Li et al., 2019; C. Li et al., 2022). To make things worse, the increase in ozone pollution would stimulate the formation of secondary PM2.5, including SOA, nitrate, and sulfate, and, therefore, partly negating the efforts to reduce haze pollution in winter. This is demonstrated in this study as the secondary pollutants and, in particular, SOA and nitrate have been becoming increasingly important in recent winter haze. Due to the unique topology of the Fenwei Plain (Cao and Cui, 2021), the air pollutants, both locally emitted/produced and regionally transported, are favorably trapped inside the basin on winter nights when the boundary layer height is less than 100 m, causing air pollutants to accumulate to a health-threatening level. With the development of the boundary layer after sunrise, ozone formation is increased in the late afternoon. As a result of the increased O3, secondary particle pollutants are further increased and subsequently accumulated at night. Such a feedback loop makes it more challenging to reduce ozone and PM2.5 in the Fenwei Plain than in other regions, e.g., North China Plain. If inappropriate emission control measures are implemented, one may expect more frequent ozone–PM2.5 pollution in winter.
The increase of ozone in winter haze is explained by the in situ photochemical reaction caused by the reduction of NOx, while reactive OVOCs remain constantly elevated. The abrupt decrease of NOx, as observed during the lockdown in 2020, provides real-world evidence of the side effects of implementing inappropriate emission-control measures, targeting NOx but letting VOCs loose. Here, we also show that NO2 levels without the lockdown in 2021 were still reduced by 10 %–20 % compared to before the pandemic in 2019, while the reduction of reactive HCHO was even higher. Such a trend needs to be reversed in order to achieve the synergic reduction of O3 and PM2.5.
The complexity of the O3–PM2.5 interaction also needs to be considered because PM2.5 scavenges HO2 radicals that would otherwise produce O3. Such an interaction is more important when the starting PM2.5 concentration is high (> 40 µg m−3) (Shao et al., 2021). Here, we show that, although the citywide mean PM2.5 concentration has decreased in recent years, the PM2.5 concentration is still above 80 µg m−3 for both observed and deweathered PM2.5; i.e., it is still in the range of PM2.5 concentration where the reduction of PM2.5 can increase O3 due to the reduced scavenging effect. Since the reduction in PM2.5 in Xi'an is slower (−3.3 % yr−1) (M. Wang et al., 2022b) than in other areas, e.g., Beijing (−7.8 % yr−1) (Vu et al., 2019) and Shanghai (−6.4 % yr−1) (M. Wang et al., 2022a), a large increase in O3 in winter is expected as PM2.5 is only reduced at a similarly slow rate in the near future. Only with a more aggressive reduction of the precursor gases can we achieve the goal of the synergic reduction of O3 and PM2.5 pollution in the Fenwei Plain.
In this study, an increase in O3 pollution in winter haze was revealed through the analysis of citywide mean concentrations of air pollutants for 7 years (2015–2021). The increased O3 was not due to the changes in meteorological variations, as confirmed by the trend of deweathered O3, but was due to the constantly elevated reactive OVOCs and, in particular, formaldehyde, in combination with the reduced NO2. An increase in O3 stimulated the formation of secondary aerosols, including SOA and nitrate, which were shown to increase their fractional contributions to the total PM2.5. A further extension of ozone pollution in winter haze is expected if NOx and PM2.5 are reduced at the current rate and reactive OVOCs are not reduced. Through scenario analysis in a chemical box model, we show the co-benefits of reducing NOx and VOCs simultaneously in reducing ozone and SOA. The complex interaction between O3 and PM2.5, coupled with the topology of the Fenwei Plain and the evolution of the boundary layer height, highlights the challenges in further reducing particulate pollution in winter despite years of efforts to reduce emissions. A synergic reduction in PM2.5 and O3 pollution can only be achieved through a more aggressive reduction of their precursor gases.
All data needed to evaluate the conclusions in the paper are present in the paper and/or the Supplement. Also, all data used in the study are available from the corresponding author upon request.
The supplement related to this article is available online at: https://doi.org/10.5194/acp-23-3595-2023-supplement.
CL and RJH designed the study. CL, JD, and HZ conducted measurements, data analysis, and source apportionment. CL prepared the manuscript, with contributions from all co-authors.
The contact author has declared that none of the authors has any competing interests.
Publisher’s note: Copernicus Publications remains neutral with regard to jurisdictional claims in published maps and institutional affiliations.
This work was supported by the National Natural Science Foundation of China (NSFC; grant nos. 42277092, 42107126, 42207137, and 41925015), the Strategic Priority Research Program of the Chinese Academy of Sciences (grant no. XDB40000000), the Chinese Academy of Sciences (grant no. ZDBS-LY-DQC001), the Institute of Earth Environment (grant no. E051QB2837), and the Cross Innovative Team fund from the State Key Laboratory of Loess and Quaternary Geology (grant no. SKLLQGTD1801).
This research has been supported by the National Natural Science Foundation of China (grant nos. 42277092, 42107126, 41925015, and 42207137); the Strategic Priority Research Program of the Chinese Academy of Sciences (grant no. XDB40000000); the Chinese Academy of Sciences (grant no. ZDBS-LY-DQC001); the Institute of Earth Environment, Chinese Academy of Sciences (grant no. E051QB2837); and the Cross Innovative Team fund from the State Key Laboratory of Loess and Quaternary Geology, Chinese Academy of Sciences (grant no. SKLLQGTD1801).
This paper was edited by Dantong Liu and reviewed by two anonymous referees.
Canonaco, F., Crippa, M., Slowik, J. G., Baltensperger, U., and Prévôt, A. S. H.: SoFi, an IGOR-based interface for the efficient use of the generalized multilinear engine (ME-2) for the source apportionment: ME-2 application to aerosol mass spectrometer data, Atmos. Meas. Tech., 6, 3649–3661, https://doi.org/10.5194/amt-6-3649-2013, 2013.
Cao, J. J. and Cui, L.: Current Status, Characteristics and Causes of Particulate Air Pollution in the Fenwei Plain, China: A Review, J. Geophys. Res.-Atmos., 126, e2020JD034472, https://doi.org/10.1029/2020JD034472, 2021.
Carter, W. P. L.: Development of the SAPRC-07 chemical mechanism, Atmos. Environ., 44, 5324–5335, https://doi.org/10.1016/j.atmosenv.2010.01.026, 2010.
Chen, G., Canonaco, F., Tobler, A., Aas, W., Alastuey, A., Allan, J., Atabakhsh, S., Aurela, M., Baltensperger, U., Bougiatioti, A., De Brito, J. F., Ceburnis, D., Chazeau, B., Chebaicheb, H., Daellenbach, K. R., Ehn, M., El Haddad, I., Eleftheriadis, K., Favez, O., Flentje, H., Font, A., Fossum, K., Freney, E., Gini, M., Green, D. C., Heikkinen, L., Herrmann, H., Kalogridis, A.-C., Keernik, H., Lhotka, R., Lin, C., Lunder, C., Maasikmets, M., Manousakas, M. I., Marchand, N., Marin, C., Marmureanu, L., Mihalopoulos, N., Močnik, G., Nęcki, J., O'Dowd, C., Ovadnevaite, J., Peter, T., Petit, J.-E., Pikridas, M., Matthew Platt, S., Pokorná, P., Poulain, L., Priestman, M., Riffault, V., Rinaldi, M., Różański, K., Schwarz, J., Sciare, J., Simon, L., Skiba, A., Slowik, J. G., Sosedova, Y., Stavroulas, I., Styszko, K., Teinemaa, E., Timonen, H., Tremper, A., Vasilescu, J., Via, M., Vodička, P., Wiedensohler, A., Zografou, O., Cruz Minguillón, M., and Prévôt, A. S. H.: European Aerosol Phenomenology – 8: Harmonised Source Apportionment of Organic Aerosol using 22 Year-long ACSM/AMS Datasets, Environ. Int., 166, 107325, https://doi.org/10.1016/j.envint.2022.107325, 2022.
Dai, Q., Hou, L., Liu, B., Zhang, Y., Song, C., Shi, Z., Hopke, P. K., and Feng, Y.: Spring Festival and COVID-19 Lockdown: Disentangling PM Sources in Major Chinese Cities, Geophys. Res. Lett., 48, e2021GL093403, https://doi.org/10.1029/2021GL093403, 2021.
Duan, J., Huang, R.-J., Chang, Y., Zhong, H., Gu, Y., Lin, C., Hoffmann, T., and O'Dowd, C.: Measurement report of the change of PM2.5 composition during the COVID-19 lockdown in urban Xi'an: enhanced secondary formation and oxidation, Sci. Total Environ., 791, 148126, https://doi.org/10.1016/j.scitotenv.2021.148126, 2021.
Duan, J., Huang, R. J., Gu, Y., Lin, C., Zhong, H., Xu, W., Liu, Q., You, Y., Ovadnevaite, J., Ceburnis, D., Hoffmann, T., and O'Dowd, C.: Measurement report: Large contribution of biomass burning and aqueous-phase processes to the wintertime secondary organic aerosol formation in Xi'an, Northwest China, Atmos. Chem. Phys., 22, 10139–10153, https://doi.org/10.5194/acp-22-10139-2022, 2022.
Elser, M., Huang, R. J., Wolf, R., Slowik, J. G., Wang, Q., Canonaco, F., Li, G., Bozzetti, C., Daellenbach, K. R., Huang, Y., Zhang, R., Li, Z., Cao, J., Baltensperger, U., El-Haddad, I., and André, P.: New insights into PM2.5 chemical composition and sources in two major cities in China during extreme haze events using aerosol mass spectrometry, Atmos. Chem. Phys., 16, 3207–3225, https://doi.org/10.5194/acp-16-3207-2016, 2016.
Feng, T., Wang, Y., Hu, W., Zhu, M., Song, W., Chen, W., Sang, Y., Fang, Z., Deng, W., Fang, H., Yu, X., Wu, C., Yuan, B., Huang, S., Shao, M., Huang, X., He, L., Lee, Y. R., Huey, L. G., Canonaco, F., Prevot, A. S. H., and Wang, X.: Impact of aging on the sources, volatility, and viscosity of organic aerosols in Chinese outflows, Atmos. Chem. Phys., 23, 611–636, https://doi.org/10.5194/acp-23-611-2023, 2023.
Gorelick, N., Hancher, M., Dixon, M., Ilyushchenko, S., Thau, D., and Moore, R.: Google Earth Engine: Planetary-scale geospatial analysis for everyone, Remote Sens. Environ., 202, 18–27, https://doi.org/10.1016/j.rse.2017.06.031, 2017.
Grange, S. K. and Carslaw, D. C.: Using meteorological normalisation to detect interventions in air quality time series, Sci. Total Environ., 653, 578–588, https://doi.org/10.1016/j.scitotenv.2018.10.344, 2019.
Grange, S. K., Carslaw, D. C., Lewis, A. C., Boleti, E., and Hueglin, C.: Random forest meteorological normalisation models for Swiss PM10 trend analysis, Atmos. Chem. Phys., 18, 6223–6239, https://doi.org/10.5194/acp-18-6223-2018, 2018.
He, G., Pan, Y., and Tanaka, T.: The short-term impacts of COVID-19 lockdown on urban air pollution in China, Nat. Sustain., 3, 1005–1011, https://doi.org/10.1038/s41893-020-0581-y, 2020.
Jenkin, M. E., Saunders, S. M., Wagner, V., and Pilling, M. J.: Protocol for the development of the Master Chemical Mechanism, MCM v3 (Part B): tropospheric degradation of aromatic volatile organic compounds, Atmos. Chem. Phys., 3, 181–193, https://doi.org/10.5194/acp-3-181-2003, 2003.
Jenkin, M. E., Valorso, R., Aumont, B., and Rickard, A. R.: Estimation of rate coefficients and branching ratios for reactions of organic peroxy radicals for use in automated mechanism construction, Atmos. Chem. Phys., 19, 7691–7717, https://doi.org/10.5194/acp-19-7691-2019, 2019.
Krechmer, J., Lopez-Hilfiker, F., Koss, A., Hutterli, M., Stoermer, C., Deming, B., Kimmel, J., Warneke, C., Holzinger, R., Jayne, J., Worsnop, D., Fuhrer, K., Gonin, M., and de Gouw, J.: Evaluation of a New Reagent-Ion Source and Focusing Ion–Molecule Reactor for Use in Proton-Transfer-Reaction Mass Spectrometry, Anal. Chem., 90, 12011–12018, https://doi.org/10.1021/acs.analchem.8b02641, 2018.
Li, C., Zhu, Q., Jin, X., and Cohen, R. C.: Elucidating Contributions of Anthropogenic Volatile Organic Compounds and Particulate Matter to Ozone Trends over China, Environ. Sci. Technol., 56, 12906–12916, https://doi.org/10.1021/acs.est.2c03315, 2022.
Li, J., Deng, S., Tohti, A., Li, G., Yi, X., Lu, Z., Liu, J., and Zhang, S.: Spatial characteristics of VOCs and their ozone and secondary organic aerosol formation potentials in autumn and winter in the Guanzhong Plain, China, Environ. Res., 211, 113036, https://doi.org/10.1016/j.envres.2022.113036, 2022a.
Li, J., Han, Z., Wu, J., Tao, J., Li, J., Sun, Y., Liang, L., Liang, M., and Wang, Q. G.: Secondary organic aerosol formation and source contributions over east China in summertime, Environ. Pollut., 306, 119383, https://doi.org/10.1016/j.envpol.2022.119383, 2022b.
Li, K., Jacob, D. J., Liao, H., Zhu, J., Shah, V., Shen, L., Bates, K. H., Zhang, Q., and Zhai, S.: A two-pollutant strategy for improving ozone and particulate air quality in China, Nat. Geosci., 12, 906–910, https://doi.org/10.1038/s41561-019-0464-x, 2019.
Li, K., Jacob, D. J., Liao, H., Qiu, Y., Shen, L., Zhai, S., Bates, K. H., Sulprizio, M. P., Song, S., Lu, X., Zhang, Q., Zheng, B., Zhang, Y., Zhang, J., Lee, H. C., and Kuk, S. K.: Ozone pollution in the North China Plain spreading into the late-winter haze season, P. Natl. Acad. Sci. USA, 118, e2015797118, https://doi.org/10.1073/pnas.2015797118, 2021.
Lin, C., Huang, R.-J., Duan, J., Zhong, H., and Xu, W.: Primary and Secondary Organic Nitrate in Northwest China: A Case Study, Environ. Sci. Technol. Lett., 8, 947–953, https://doi.org/10.1021/acs.estlett.1c00692, 2021.
Lin, C., Huang, R.-J., Duan, J., Zhong, H., and Xu, W.: Polycyclic aromatic hydrocarbons from cooking emissions, Sci. Total Environ., 818, 151700, https://doi.org/10.1016/j.scitotenv.2021.151700, 2022a.
Lin, C., Huang, R.-J., Duan, J., Zhong, H., Xu, W., Wu, Y., and Zhang, R.: Large contribution from worship activities to the atmospheric soot particles in northwest China, Environ. Pollut., 299, 118907, https://doi.org/10.1016/j.envpol.2022.118907, 2022b.
Liu, Q., Son, Y. J., Li, L., Wood, N., Senerat, A. M., and Pantelic, J.: Healthy home interventions: Distribution of PM2.5 emitted during cooking in residential settings, Build Environ., 207, 108448, https://doi.org/10.1016/j.buildenv.2021.108448, 2022.
Luo, H., Li, G., Chen, J., Lin, Q., Ma, S., Wang, Y., and An, T.: Spatial and temporal distribution characteristics and ozone formation potentials of volatile organic compounds from three typical functional areas in China, Environ. Res., 183, 109141, https://doi.org/10.1016/j.envres.2020.109141, 2020.
Lyu, X., Guo, H., Zou, Q., Li, K., Xiong, E., Zhou, B., Guo, P., Jiang, F., and Tian, X.: Evidence for Reducing Volatile Organic Compounds to Improve Air Quality from Concurrent Observations and In Situ Simulations at 10 Stations in Eastern China, Environ. Sci. Technol., 56, 15356–15364, https://doi.org/10.1021/acs.est.2c04340, 2022.
Nie, W., Yan, C., Huang, D. D., Wang, Z., Liu, Y., Qiao, X., Guo, Y., Tian, L., Zheng, P., Xu, Z., Li, Y., Xu, Z., Qi, X., Sun, P., Wang, J., Zheng, F., Li, X., Yin, R., Dallenbach, K. R., Bianchi, F., Petäjä, T., Zhang, Y., Wang, M., Schervish, M., Wang, S., Qiao, L., Wang, Q., Zhou, M., Wang, H., Yu, C., Yao, D., Guo, H., Ye, P., Lee, S., Li, Y. J., Liu, Y., Chi, X., Kerminen, V.-M., Ehn, M., Donahue, N. M., Wang, T., Huang, C., Kulmala, M., Worsnop, D., Jiang, J., and Ding, A.: Secondary organic aerosol formed by condensing anthropogenic vapours over China's megacities, Nat. Geosci., 15, 255–261, https://doi.org/10.1038/s41561-022-00922-5, 2022.
Shao, M., Wang, W., Yuan, B., Parrish, D. D., Li, X., Lu, K., Wu, L., Wang, X., Mo, Z., Yang, S., Peng, Y., Kuang, Y., Chen, W., Hu, M., Zeng, L., Su, H., Cheng, Y., Zheng, J., and Zhang, Y.: Quantifying the role of PM2.5 dropping in variations of ground-level ozone: Inter-comparison between Beijing and Los Angeles, Sci. Total Environ., 788, 147712, https://doi.org/10.1016/j.scitotenv.2021.147712, 2021.
Shi, Z., Song, C., Liu, B., Lu, G., Xu, J., Vu, T. V., Elliott, R. J. R., Li, W., Bloss, W. J., and Harrison, R. M.: Abrupt but smaller than expected changes in surface air quality attributable to COVID-19 lockdowns, Sci. Adv., 7, eabd6696, https://doi.org/10.1126/sciadv.abd6696, 2021.
Song, M., Li, X., Yang, S., Yu, X., Zhou, S., Yang, Y., Chen, S., Dong, H., Liao, K., Chen, Q., Lu, K., Zhang, N., Cao, J., Zeng, L., and Zhang, Y.: Spatiotemporal variation, sources, and secondary transformation potential of volatile organic compounds in Xi'an, China, Atmos. Chem. Phys., 21, 4939–4958, https://doi.org/10.5194/acp-21-4939-2021, 2021.
Su, W., Liu, C., Hu, Q., Zhao, S., Sun, Y., Wang, W., Zhu, Y., Liu, J., and Kim, J.: Primary and secondary sources of ambient formaldehyde in the Yangtze River Delta based on Ozone Mapping and Profiler Suite (OMPS) observations, Atmos. Chem. Phys., 19, 6717–6736, https://doi.org/10.5194/acp-19-6717-2019, 2019.
Tan, Y. and Wang, T.: What caused ozone pollution during the 2022 Shanghai lockdown? Insights from ground and satellite observations, Atmos. Chem. Phys., 22, 14455–14466, https://doi.org/10.5194/acp-22-14455-2022, 2022.
Vu, T. V., Shi, Z., Cheng, J., Zhang, Q., He, K., Wang, S., and Harrison, R. M.: Assessing the impact of clean air action on air quality trends in Beijing using a machine learning technique, Atmos. Chem. Phys., 19, 11303–11314, https://doi.org/10.5194/acp-19-11303-2019, 2019.
Wang, M., Duan, Y., Zhang, Z., Huo, J., Huang, Y., Fu, Q., Wang, T., Cao, J., and Lee, S.-C.: Increased contribution to PM2.5 from traffic-influenced road dust in Shanghai over recent years and predictable future, Environ. Pollut., 313, 120119, https://doi.org/10.1016/j.envpol.2022.120119, 2022a.
Wang, M., Zhang, Z., Yuan, Q., Li, X., Han, S., Lam, Y., Cui, L., Huang, Y., Cao, J., and Lee, S.-C.: Slower than expected reduction in annual PM2.5 in Xi'an revealed by machine learning-based meteorological normalization, Sci. Total Environ., 841, 156740, https://doi.org/10.1016/j.scitotenv.2022.156740, 2022b.
Wang, R., Wang, X., Cheng, S., Zhu, J., Zhang, X., Cheng, L., and Wang, K.: Determining an optimal control strategy for anthropogenic VOC emissions in China based on source emissions and reactivity, J. Environ. Sci., 136, 248–260, https://doi.org/10.1016/j.jes.2022.10.034, 2022.
Wang, T., Wei, X. L., Ding, A. J., Poon, C. N., Lam, K. S., Li, Y. S., Chan, L. Y., and Anson, M.: Increasing surface ozone concentrations in the background atmosphere of Southern China, 1994–2007, Atmos. Chem. Phys., 9, 6217–6227, https://doi.org/10.5194/acp-9-6217-2009, 2009.
Wang, T., Dai, J., Lam, K. S., Nan Poon, C., and Brasseur, G. P.: Twenty-Five Years of Lower Tropospheric Ozone Observations in Tropical East Asia: The Influence of Emissions and Weather Patterns, Geophys. Res. Lett., 46, 11463–11470, https://doi.org/10.1029/2019GL084459, 2019.
Wang, T., Xue, L., Feng, Z., Dai, J., Zhang, Y., and Tan, Y.: Ground-level ozone pollution in China: a synthesis of recent findings on influencing factors and impacts, Environ. Res. Lett., 17, 063003, https://doi.org/10.1088/1748-9326/ac69fe, 2022.
Wolfe, G. M., Marvin, M. R., Roberts, S. J., Travis, K. R., and Liao, J.: The Framework for 0-D Atmospheric Modeling (F0AM) v3.1, Geosci. Model Dev., 9, 3309–3319, https://doi.org/10.5194/gmd-9-3309-2016, 2016.
Yan, Y., Wang, X., Qu, K., Li, X., Shi, W., Peng, Z., and Zhang, Y.: Impacts of synoptic circulations on summertime ozone pollution in Guanzhong Basin, northwestern China, Atmos. Environ., 262, 118660, https://doi.org/10.1016/j.atmosenv.2021.118660, 2021.
Zhang, Q., Shao, M., Li, Y., Lu, S. H., Yuan, B., and Chen, W. T.: Increase of ambient formaldehyde in Beijing and its implication for VOC reactivity, Chinese Chem. Lett., 23, 1059–1062, https://doi.org/10.1016/j.cclet.2012.06.015, 2012.
Zhao, Y., Thornton, J. A., and Pye, H. O. T.: Quantitative constraints on autoxidation and dimer formation from direct probing of monoterpene-derived peroxy radical chemistry, P. Natl. Acad. Sci. USA, 115, 12142–12147, https://doi.org/10.1073/pnas.1812147115, 2018.
Zhao, Y., Zhang, K., Xu, X., Shen, H., Zhu, X., Zhang, Y., Hu, Y., and Shen, G.: Substantial changes in nitrate oxide and ozone after excluding meteorological impacts during the COVID-19 outbreak in mainland China, Environ. Sci. Technol. Lett., 7, 402–408, https://doi.org/10.1021/acs.estlett.0c00304, 2020.
Zhong, H., Huang, R.-J., Chang, Y., Duan, J., Lin, C., and Chen, Y.: Enhanced formation of secondary organic aerosol from photochemical oxidation during the COVID-19 lockdown in a background site in Northwest China, Sci. Total Environ., 778, 144947, https://doi.org/10.1016/j.scitotenv.2021.144947, 2021.
Zhong, H., Huang, R.-J., Duan, J., Lin, C., Gu, Y., Wang, Y., Li, Y., Zheng, Y., Chen, Q., Chen, Y., Dai, W., Ni, H., Chang, Y., Worsnop, D. R., Xu, W., Ovadnevaite, J., Ceburnis, D., and O'Dowd, C. D.: Seasonal variations in the sources of organic aerosol in Xi'an, Northwest China: The importance of biomass burning and secondary formation, Sci. Total Environ., 737, 139666, https://doi.org/10.1016/j.scitotenv.2020.139666, 2020.