the Creative Commons Attribution 4.0 License.
the Creative Commons Attribution 4.0 License.
 | 07 Mar 2023
Characteristics of particulate-bound n-alkanes indicating sources of PM2.5 in Beijing, China
Jiyuan Yang
Guoyang Lei
Chang Liu
Yutong Wu
Kai Hu
Jinfeng Zhu
Junsong Bao
Weili Lin
Jun Jin
The characteristics of n-alkanes and the contributions of various sources of fine particulate matter (PM2.5) in the atmosphere in Beijing were investigated. PM2.5 samples were collected at Minzu University of China between November 2020 and October 2021, and n-alkanes in the samples were analyzed by gas chromatography mass spectrometry. A positive matrix factorization analysis model and source indices (the main carbon peaks, carbon preference indices, and plant wax contribution ratios) were used to identify the sources of n-alkanes, to determine the contributions of different sources, and to explain the differences. The n-alkane concentrations were 4.51–153 ng m−3 (mean 32.7 ng m−3), and the particulate-bound n-alkane and PM2.5 concentrations varied in parallel. There were marked seasonal and diurnal differences in the n-alkane concentrations (p<0.01). The n-alkane concentrations in the different seasons decreased in the order of winter > spring > summer > fall. The mean concentration of each homolog was higher at night than in the day in all seasons. Particulate-bound n-alkanes were supplied by common anthropogenic and biogenic sources, and fossil fuel combustion was the dominant contributor. The positive matrix factorization model results indicated five sources of n-alkanes in PM2.5, which were coal combustion, diesel vehicle emissions, gasoline vehicle emissions, terrestrial plant release, and mixed sources. Vehicle emissions were the main sources of n-alkanes, contributing 57.6 %. The sources of PM2.5 can be indicated by n-alkanes (i.e., using n-alkanes as organic tracers). Vehicle exhausts strongly affect PM2.5 pollution. Controlling vehicle exhaust emissions is key to controlling n-alkanes and PM2.5 pollution in Beijing.
- Article
(2637 KB) - Full-text XML
- BibTeX
- EndNote


Serious air pollution in China is currently caused by a combination of haze and photochemical smog (Ma et al., 2012). The effects of haze on air quality are more obvious than the effects of photochemical pollution, which is relatively invisible. Haze is frequent in urban areas with relatively dense populations and high traffic loads. Fine particulate matter is the main pollutant involved in haze. Fine particulate matter has small particle sizes (aerodynamic equivalent diameter ≤2.5 µm), a long atmospheric retention time, and a complex chemical composition. Fine particulate matter is also a good substrate for chemical reactions, about which there is a great concern because the products can negatively affect the environment and human health (G. H. Wang et al., 2016; Zhu et al., 2005; Zhang et al., 2015). In recent years, measures such as energy structure adjustments, pollutant emission controls, and air pollution prevention have markedly decreased atmospheric pollution and improved air quality in China. For example, the PM2.5 concentration in Beijing, a typical large city in China, has recently decreased markedly. The annual mean PM2.5 concentration decreased from 73 µg m−3 in 2016 to 33 µg m−3 (meeting the requirement of the secondary ambient air quality standard for China, 35 µg m−3) in 2021 (Beijing Ecology and Environment Statement, 2016–2021). Sources of fine particulate matter need to be better understood and controlled to decrease PM2.5 pollution, improve air quality, and meet the primary ambient air quality standard for China (15 µg m−3) and even the World Health Organization standard (5 µg m−3).
It has been found that n-alkanes are important components of organic pollutants in particulate matter and are mainly supplied through anthropogenic emissions such as vehicle exhausts, fossil fuel combustion, and biomass combustion (Liu et al., 2013) or through biogenic emissions such as from microorganisms and terrestrial plants (Simoneit et al., 1989; Rogge et al., 1993). n-Alkanes are non-polar saturated hydrocarbons that are stable and found at high concentrations in the atmosphere. n-Alkanes readily adsorb to particles and can affect the environment and human health (Chen et al., 2019). n-Alkanes can participate in atmospheric chemical reactions, and n-alkane volatility and reactivity decrease as the carbon chain length increases (Aumont et al., 2013). The products of reactions involving short-chain n-alkanes (C ≤16) in the environment strongly contribute to the secondary-organic-aerosol formation (Michoud et al., 2012). Long-chain n-alkanes (C >16) are relatively stable in the environment and generally accumulate in particulate matter (Chrysikou and Samara, 2009). The carbon number ranges, molecular compositions, and distributions of n-alkane mixtures in the particulate matter can be used to assess aerosol migration and particulate matter sources. Particulate-bound n-alkanes play an important role in studying organic aerosols and the sources of PM2.5. The characteristics and sources of n-alkanes in the fine particulate matter are important parameters for developing pollutant control strategies to sustainably decrease haze pollution and to improve air quality.
Previous studies of n-alkanes in atmospheric particulate matter have mainly been focused on concentrations (Wang and Kawamura, 2005; Wang et al., 2006a; Chen et al., 2014; Ren et al., 2017), characteristics (Simoneit et al., 2004; X. R. Li et al., 2013; Kang et al., 2016b), and sources (Kavouras et al., 2001; Bi et al., 2003; Fu et al., 2010; Sun et al., 2021). A wide range of n-alkanes is present in the atmosphere, including highly and poorly volatile n-alkanes with carbon chain lengths between 8 and 40 (Kang et al., 2016b; Aumont et al., 2012). n-Alkane concentrations between tens and hundreds of nanograms per cubic meter have been found in fine particles (Ren et al., 2016; Lyu et al., 2019). The n-alkane concentration is affected by factors such as meteorological conditions and contributing sources and is related to the particulate matter concentration and particle size distribution. The total n-alkane concentrations in particulate matter markedly vary by season, usually being higher in winter and lowest in summer and fall (Lyu et al., 2016; Chen et al., 2019). n-Alkanes from different sources have different molecular compositions and distributions that can be used to indicate the relative contributions of different sources of particulate matter (Han et al., 2018).
In the past few decades, researchers in Zhengzhou (Wang et al., 2017), Guangzhou (Bi et al., 2003; J. Z. Wang et al., 2016), Shanghai (Lyu et al., 2016; Xu et al., 2015), Beijing (Ren et al., 2016; Lyu et al., 2019), Seoul (Kang et al., 2020), and Spain (Caumo et al., 2020) have studied n-alkanes in atmospheric aerosols and determined total n-alkane concentrations, particle size distributions, and the contributions of different sources. However, n-alkanes with different carbon number ranges were analyzed in the different studies. Most studies were focused on n-alkanes containing <30 carbon atoms, but these do not fully reflect the sources of n-alkanes in particulate matter. Air quality in Beijing is gradually improving, and exploring strategies for controlling sources of fine particulate matter further requires more information about n-alkane homolog distributions and variability in fine particulate matter and the relative contributions of different sources. Beijing is a large city with a dense population and high traffic volumes. The sources of n-alkanes and particulate matter in Beijing require attention because of the large number of volatile organic pollutants present, the high levels of vehicle exhaust emissions, and the relatively severe particulate matter pollution. Secondary aerosols have been found to make strong contributions to particulate pollution during haze episodes in urban areas (Presto et al., 2009; Huang et al., 2014). n-Alkanes only contribute a proportion of the total organic matter in the particulate matter but are important contributors to particulate pollution by being important precursors of secondary organic aerosols (Yang et al., 2019). n-Alkanes are also important indicators of the sources of particulate matter.
In this study, the concentrations of C13–C40 n-alkanes in atmospheric fine particulate matter in Beijing between 2020 and 2021 were determined. Diurnal and seasonal variations in n-alkane homolog concentrations were assessed by performing the diurnal and cross-seasonal sampling. The sources of n-alkanes were identified, and the contributions of these sources to the total n-alkane concentrations were determined using source indices and correlation models. The aim was to use n-alkanes to indicate the sources of particulate matter to allow strategies for controlling particulate matter concentrations in urban areas to be developed.
2.1 Sampling site and time
Fine particulate matter samples were collected between November 2020 and October 2021 on the roof (about 20 m above the ground) of the College of Pharmacy at the Minzu University of China (116.19∘ E, 39.57∘ N). Beijing is a typical heavily populated and traffic-intensive Chinese city, with high emission intensities of nitrogen oxides and volatile organic pollutants and relatively serious fine particulate matter pollution. Haidian District is a prosperous urban area in Beijing with intense human activities and busy traffic. The sampling point in Haidian District reflected the influences of human activities and vehicle emissions on fine particulate matter concentrations. Samples were collected between the 23rd and 29th of each month during the study, but the exact sampling periods were adjusted to take into account pollution levels and the weather. Samples were collected in two periods on a sampling day. Daytime samples were collected between 07:00 and 20:00 local time (LT; the time zone for all instances in the text is LT) and nighttime samples were collected between 20:30 and 06:30 the next morning. Diurnal and seasonal variations in n-alkane concentrations in the fine particulate matter were investigated by collecting separate day and night samples and collecting samples in different seasons. The effects of n-alkanes on PM2.5 concentrations were assessed by analyzing the correlation between their concentrations.
2.2 Sample collection and pretreatment
Each fine particulate sample was collected using a TH-16A low-flow sampler (Wuhan Tianhong, Wuhan, China) containing a Whatman QMA quartz fiber filter (Ø 47 mm; GE Healthcare Bio-Sciences, Pittsburgh, PA, USA) using a flow rate of 16.7 L min−1. Before use, the quartz fiber filters were baked at 550 ∘C for 5 h to remove organic matter. Each filter was loosely wrapped in aluminum foil and equilibrated for 24 h at 20 ∘C and 40 % relative humidity and then weighed using a precision electronic balance before being used to collect a sample. Once used, a filter was equilibrated for 24 h at 20 ∘C and 40 % relative humidity, weighed again, and then stored wrapped in aluminum foil at −20 ∘C.
The details for ultrasonic extraction methods used to analyze the samples of n-alkanes in PM2.5 are reported in previous studies (Yang et al., 2019; Kang et al., 2020; Caumo et al., 2020). Each filter was cut into pieces and extracted by ultrasonicating it with 15 mL of dichloromethane for 15 min. The extraction step was repeated five times, and the extracts were combined and evaporated to 2 mL using a rotary evaporator. The extract was then transferred to a 15 mL centrifuge tube and centrifuged at 3000 rpm for 5 min. The supernatant was evaporated just to dryness under a gentle flow of high-purity nitrogen and then redissolved in 100 µL of toluene for instrumental analysis.
2.3 Instrumental analysis
The n-alkanes (C13–C40) were analyzed qualitatively and quantitatively by gas chromatography mass spectrometry using an Agilent 6890N-5975 system (Agilent Technologies, Santa Clara, CA, USA). n-Alkane standards (C8–C40) were purchased from AccuStandard (New Haven, CT, USA). Separation was achieved using an Agilent J&W Scientific DB-5M column (30 m long, 0.25 mm inner diameter, 0.1 µm film thickness; Agilent Technologies). The temperature of the GC inlet was 290 ∘C, splitless injection mode was used, and the injection volume was 1.0 µL. The carrier gas was helium, and the constant flow rate was 1.0 mL min−1. The oven temperature program started at 80 ∘C, which was held for 2 min, then increased at 10 ∘C min−1 to 200 ∘C, and then increased at 15 ∘C min−1 to 300 ∘C, which was held for 30 min. The mass spectrometer was used in electron impact ionization mode and selected-ion detection mode. Ions with mass-to-charge ratios of 85 and 113 (characteristic of n-alkanes) were used to identify and quantify n-alkanes. The data were quantified using ChemStation software (Agilent Technologies).
2.4 Quantitative analysis
Particulate-bound n-alkanes were quantified by an external standard method. We prepared standard solutions of C8–C40 n-alkanes with concentration gradients of 10 ppm, 1 ppm, 500 ppb, 100 ppb, 50 ppb, and 10 ppb. The calibration curves were plotted with the concentrations of the standard solution as the abscissa axis and the corresponding chromatographic response obtained by GC-MS as the ordinate axis; the correlation coefficient of each calibration curve is greater than 0.99. The concentrations of particulate-bound n-alkanes were finally quantified by the calibration curves.
2.5 Quality assurance and control
When extracting n-alkanes from the fine particulate samples, blank samples were extracted with each batch of samples. The concentration of an analyte substance in the blanks was subtracted from the concentration of the analyte in a sample during data processing. The detection and quantification limits of the instrument were defined as 3 and 10 times the signal-to-noise ratio, respectively. The instrument detection limits for the n-alkanes were 1–10 pg.
A spiked-recovery experiment was used to evaluate the recovery efficiency of particulate-bound n-alkanes. A mixed standard solution of C8–C40 n-alkanes (20 µL, 1 ppm) was added to the blank samples; then the blank samples were pre-treated according to the same methods, and the concentrations of n-alkanes were detected by GC-MS. The recovery was calculated based on the theoretical concentrations of the n-alkanes standard solution and the measured concentrations of n-alkanes in the blank spiked samples. The blank spiked-recovery experiments were repeated three times, and the final recovery was averaged over the three experiments; the extraction recovery for n-alkanes ranged from 43.6 % to 128 %, and the relative standard deviation (RSD) for the concentrations of n-alkanes in the parallel samples of the blank spiked-recovery experiments was 3.51 %.
2.6 Data analysis
PM2.5 data were provided by the China Meteorological Administration (https://www.cma.gov.cn/, last access: 31 October 2021). Data analysis (statistical and other analyses of the n-alkane data) was performed using SPSS 26.0 software (IBM, Armonk, NY, USA). Differences in the concentrations of an n-alkane homolog in different groups of samples and differences in the overall n-alkane compositions in different groups of samples were assessed by performing independent sample t tests. Spearman correlations and Pearson correlations (two-tailed tests) were used to identify correlations between groups of data.
Source indices (the carbon maximum number, Cmax; carbon preference index, CPI; and plant wax n-alkane ratio, WNA%) were used to assess the n-alkane sources from the n-alkane molecular compositions and concentration distributions. The Cmax is the homolog with the highest relative concentration in the n-alkane mixture; it is commonly used to distinguish between the contributions of anthropogenic and natural sources of n-alkanes and is related to the degree of thermal evolution that has affected the organic matter supplying n-alkanes. The CPI was defined as the ratio of total odd carbon n-alkanes to even carbon n-alkanes and was developed by Bray and Evans (1961); it can be used to assess the contributions of anthropogenic and biogenic sources of n-alkanes and is the most commonly used empirical parameter for distinguishing between sources of n-alkanes (Marzi et al., 1993). WNA% and PNA% (petrogenic n-alkane ratio) can be used to assess the relative contributions of biological and anthropogenic sources of n-alkanes in particulate matter (Simoneit, 1985); WNA% was calculated by subtraction of the average of the next higher and lower even-numbered carbon homologs, while PNA% was defined as the WNA% subtracted from 100 % (Lyu et al., 2019). The source indices were calculated using Eqs. (1)–(3):
In Eq. (1), C2i+1 was the concentration of the n-alkane with odd carbon atoms ranging from 13–39, while C2i was the concentration of the n-alkane with even carbon atoms ranging from 14–40. In Eq. (2), Cn was the concentration of n-alkanes, taking zero as the negative value of .
A positive matrix factorization (PMF) model was used to identify specific n-alkane sources and the contribution of each source through Environmental Protection Agency PMF 5.0 software (USEPA). The PMF model is a factor analysis technique using multivariate statistical methods. The PMF model is a receptor model, so it can identify and determine the contributions of components of unknown mixtures. The PMF model is one of the source resolution methods recommended by the US Environmental Protection Agency. The PMF model does not require the complex pollutant sources to be determined beforehand, and the treatment process can be optimized while limiting the decomposition matrix elements and sharing the rates of nonnegative matrices. The model can use the chemical composition of particulate matter to identify the sources of particulate matter and to calculate the contributions of the different sources, so it is widely used to investigate the sources of atmospheric particulate matter (Moeinaddini et al., 2014; Liao et al., 2021; Li et al., 2021). The details of PMF have been described in the PMF 5.0 User Guide (US EPA, 2014).
3.1 Concentrations of n-alkanes
A total of 28 n-alkane homologs with carbon chain lengths of C13–C40 were analyzed. C13–C40 n-alkanes were detected in the diurnal fine particulate matter samples collected in all seasons. Among them, C21–C35 n-alkanes were detected in all PM2.5 samples, and other n-alkanes were detected in more than half of the samples.
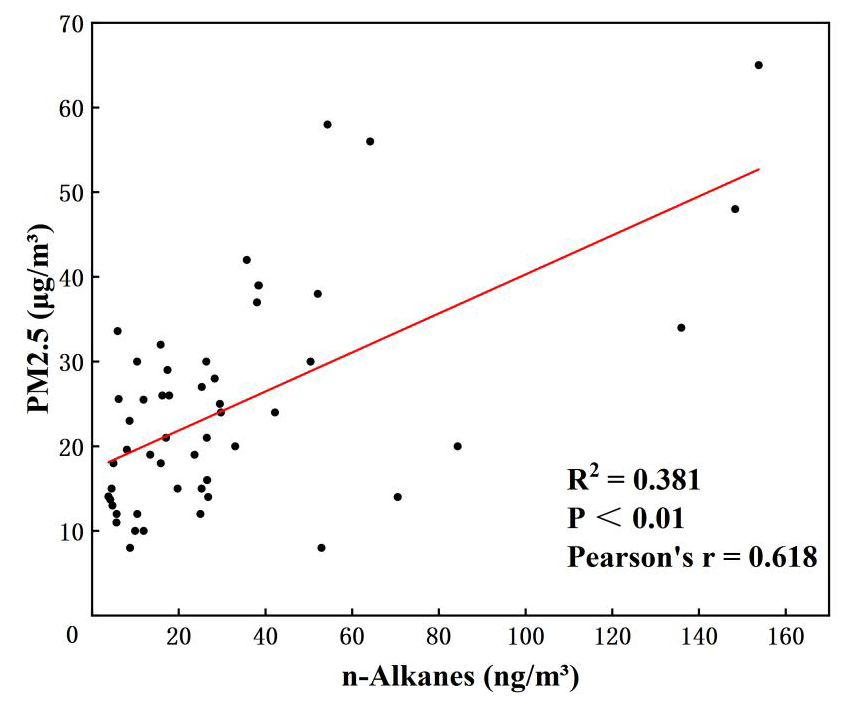
The n-alkane and PM2.5 concentrations in the different seasons are shown in Table 1, and temporal variations in the average concentrations between day and night are shown in Fig. 1. The PM2.5 concentrations throughout the sampling period were 0–134 µg m−3, and the mean was 32.0 µg m−3. The n-alkane concentrations throughout the sampling period were 4.51–153 ng m−3, and the mean was 32.7 ng m−3. As shown in Fig. 2, under the condition of excluding the influence of the sharp rise of PM2.5 concentration in heavy haze days, correlation analysis indicated that the n-alkane and PM2.5 concentrations were significantly positively correlated (p<0.01, r=0.618).
Table 1PM2.5 and particulate-bound n-alkane concentrations in different seasons in Beijing.
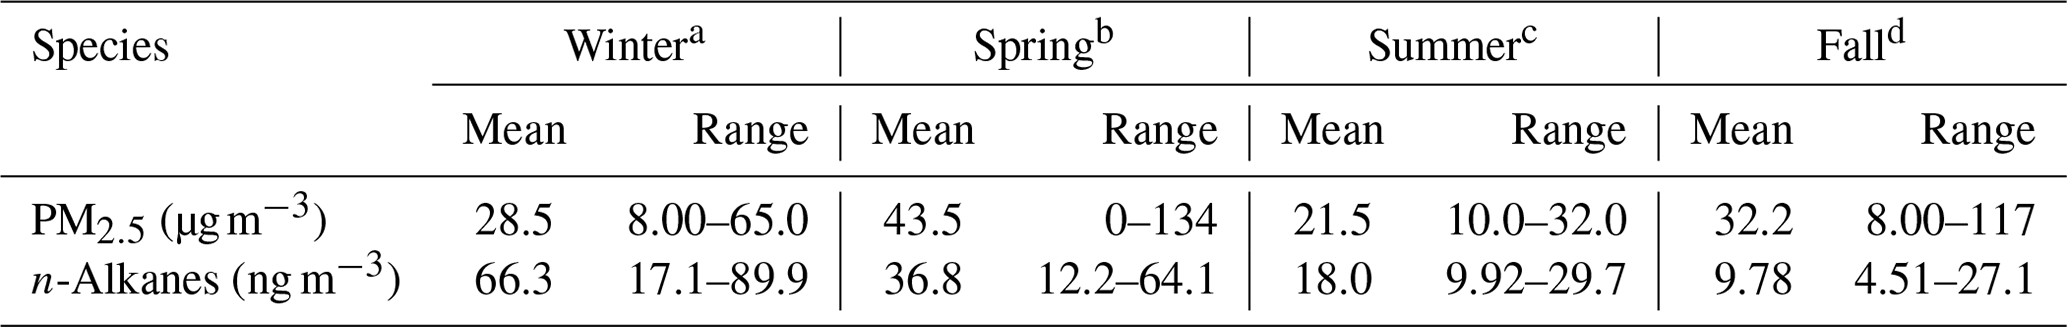
a Winter: November and December in 2020; b spring: March and April in 2021; c summer: June and July in 2021; d fall: September and October in 2021.
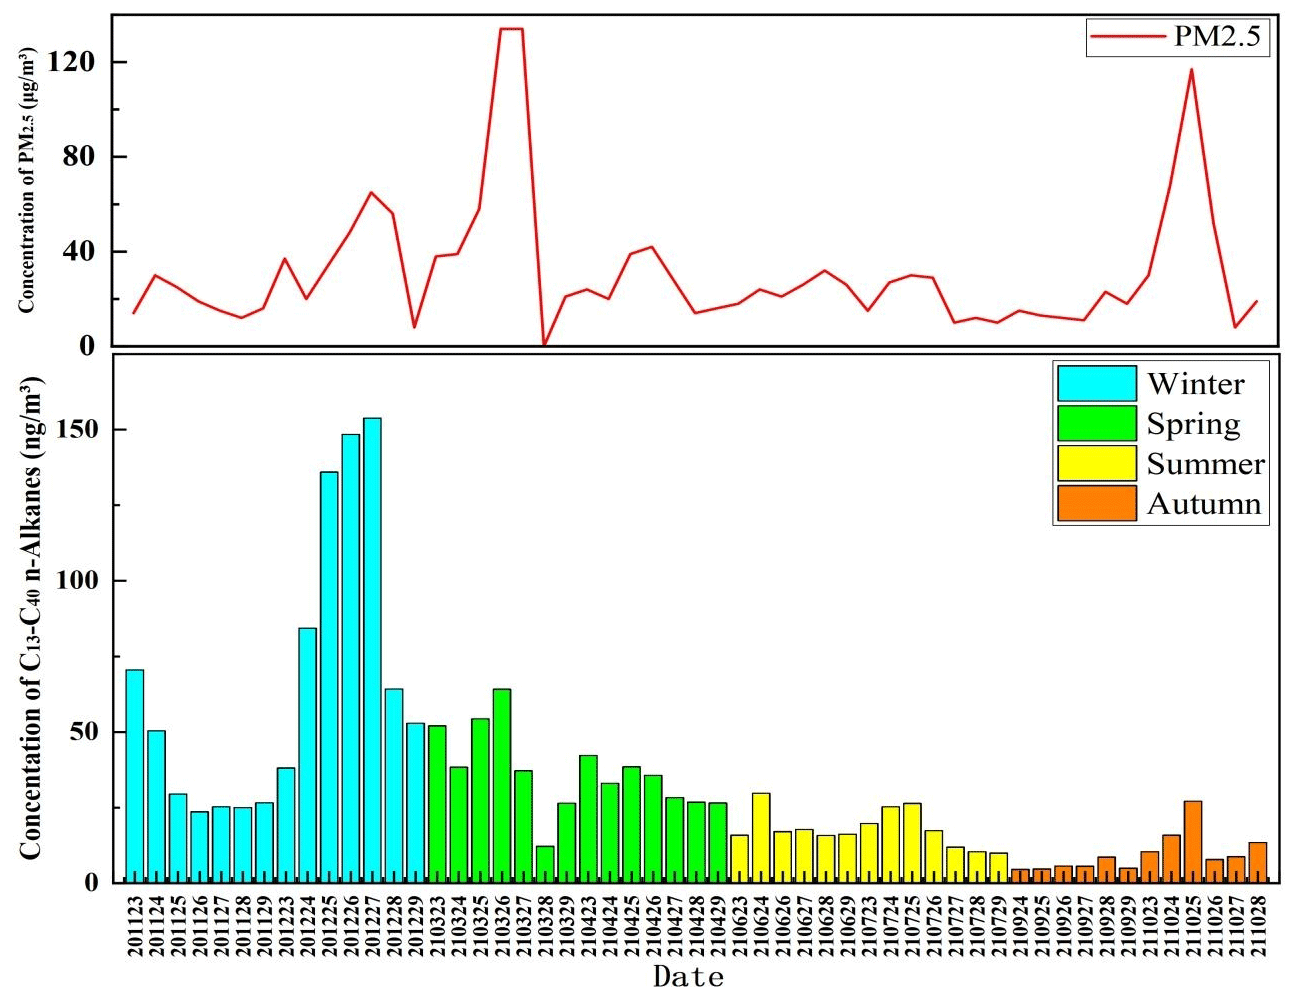
Figure 1Temporal variations in PM2.5 and particulate-bound n-alkane concentrations during the sampling period in Beijing. (The concentrations of C13–C40 n-alkanes and PM2.5 are the average of the day and night.)
3.2 n-Alkane component distributions
The contributions of the individual C13–C40 n-alkane homologs to the total n-alkane concentrations are shown in Fig. 3. The C16–C25 n-alkanes were dominant in winter, and the C26–C31 n-alkane contributions increased markedly in spring, summer, and fall.
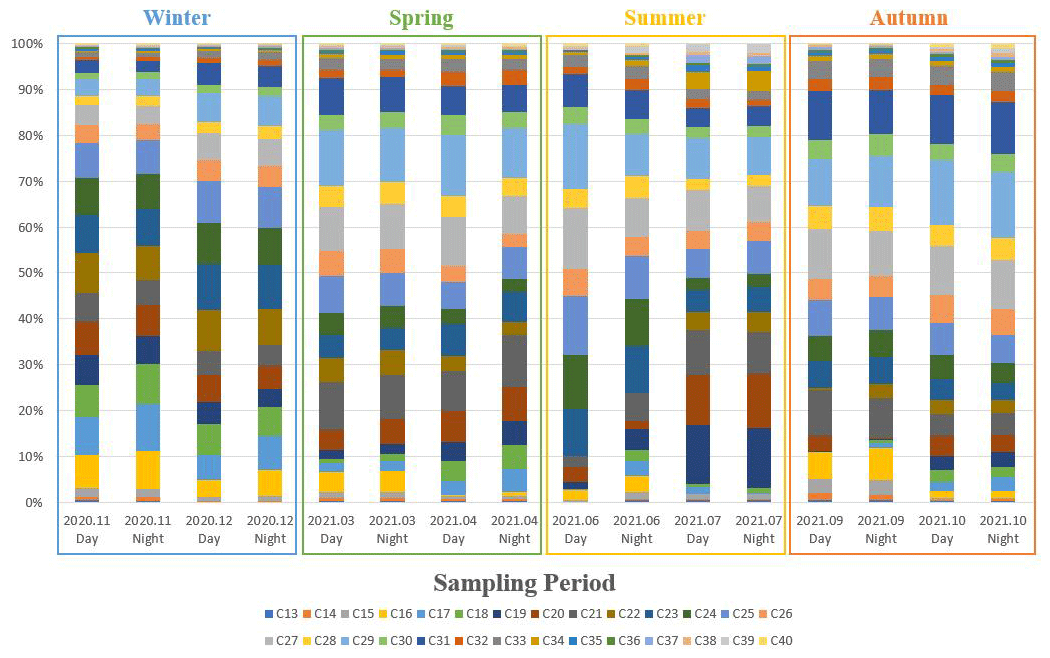
Figure 3Contributions of particulate-bound n-alkane homologs to the total n-alkane concentrations in the day and night samples in the different seasons of Beijing.
The n-alkane homologs can be classed as low molecular weight (LMW), meaning n-alkanes with carbon chain lengths ≤25, and high molecular weight (HMW), meaning n-alkanes with carbon chain lengths >25. As shown in Fig. 4, LMW n-alkanes contributed ∼60 % of the total n-alkane concentrations in winter but only ∼40 % in spring, summer, and fall, indicating that there were marked differences between the compositions in winter and those in the other seasons.
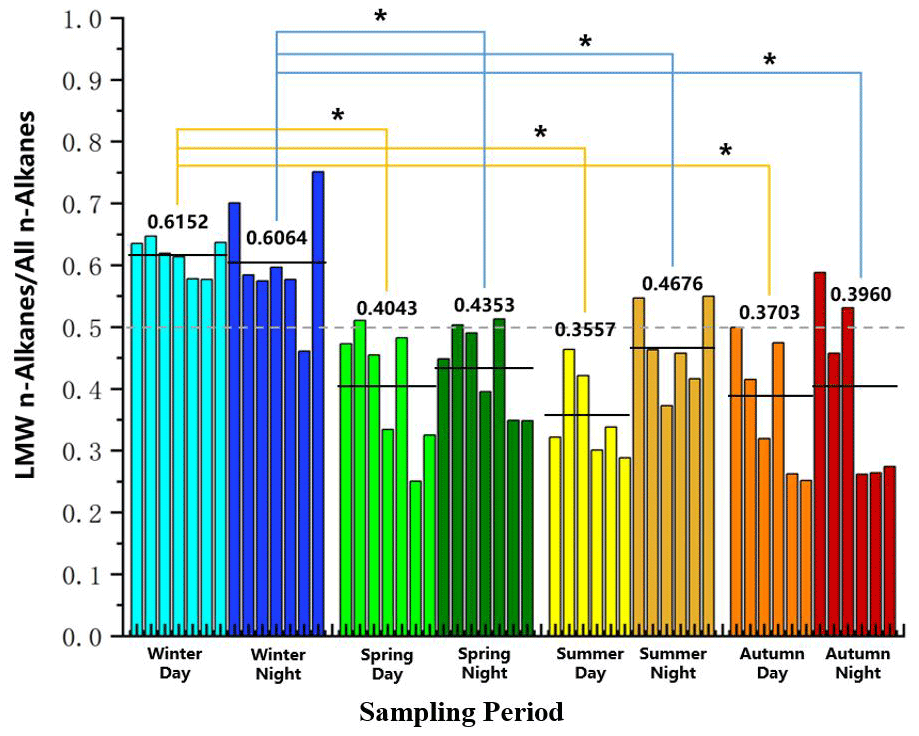
Figure 4Contributions of low-molecular-weight n-alkanes in the day and night samples in the different seasons of Beijing. (* indicates a significant difference, the dashed line represents the 50 % percentage, and the solid line shows the average proportion of LMW n-alkanes.)
3.3 Seasonal and diurnal differences in n-alkane concentrations
The average concentration distributions of C13–C40 n-alkanes in the different seasons are shown in Fig. 5. There were significant differences (p<0.01) between the concentrations of various homologs in the different seasons. The mean n-alkane concentrations for the different seasons decreased in the order of winter > spring > summer > fall. The seasonal differences were more marked for LMW than for HMW n-alkanes. The concentrations of relatively short-chain n-alkanes (C16–C25) were markedly higher in winter than in the other seasons. The concentrations of C27, C29, C31, and C33 n-alkanes were higher than the concentrations of C26, C28, C30, C32, and C34 n-alkanes (i.e., odd-carbon-number dominance occurred) in all of the seasons.
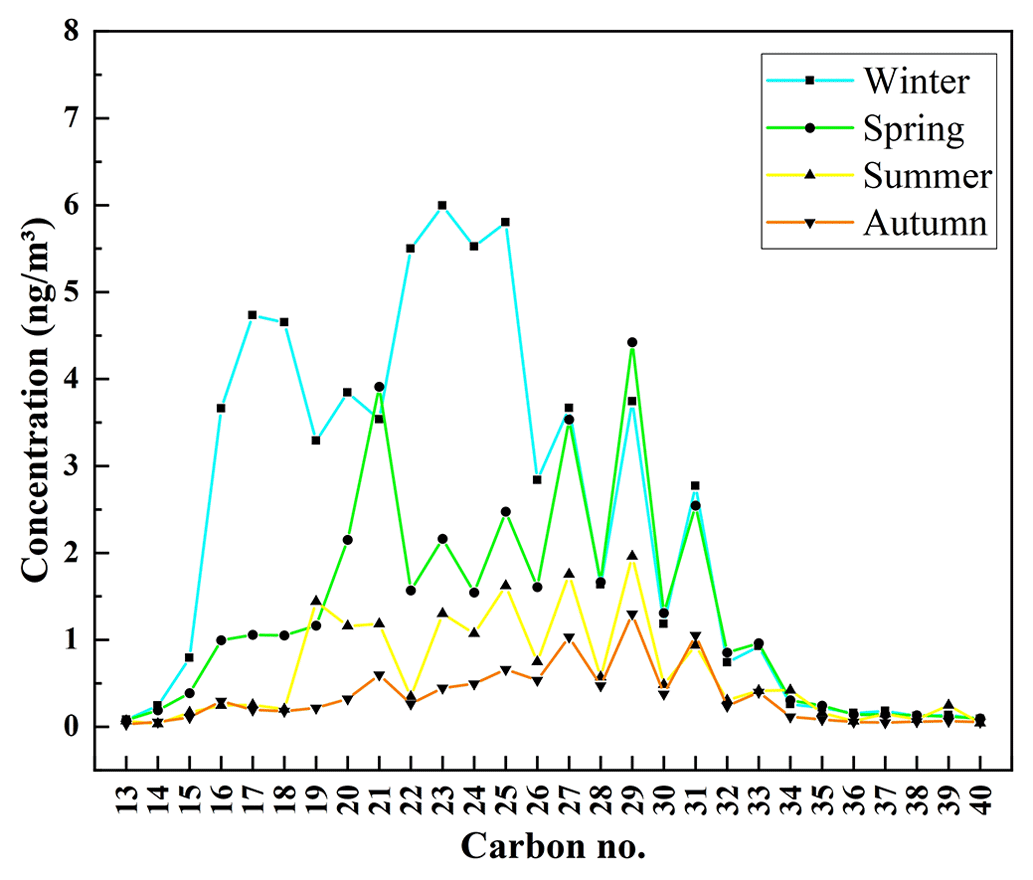
Figure 5Average concentration distributions of the particulate-bound n-alkane homologs in the different seasons of Beijing.
The C13–C40 n-alkane concentrations in the day and night samples are shown in Fig. 6. The mean n-alkane homolog concentrations were higher at night than during the day in all four seasons. The concentrations during the day and night were significantly different (p<0.01). Statistical tests on the differences in the concentrations of individual homologs of n-alkanes between day and night in different seasons showed that there were fewer n-alkane homologs with significant differences in winter (C16, C17) and spring (C21), while there were more n-alkane homologs (C >21) with significant differences in summer and autumn.

Figure 6Concentration distributions of the particulate-bound n-alkane homologs in the day and night in the different seasons of Beijing.
3.4 Source indices and PMF model
Source indices (Cmax, CPI, and WNA %) determined from the C13–C40 n-alkane data were used to assess the n-alkane sources. The PMF model was used to quantify the amounts of n-alkanes in fine particles supplied by the different sources and the relative contributions of the sources. The source index data for n-alkanes in the day and night samples in the different seasons are shown in Table 2.
Table 2Source indices for particulate-bound n-alkane in Beijing.
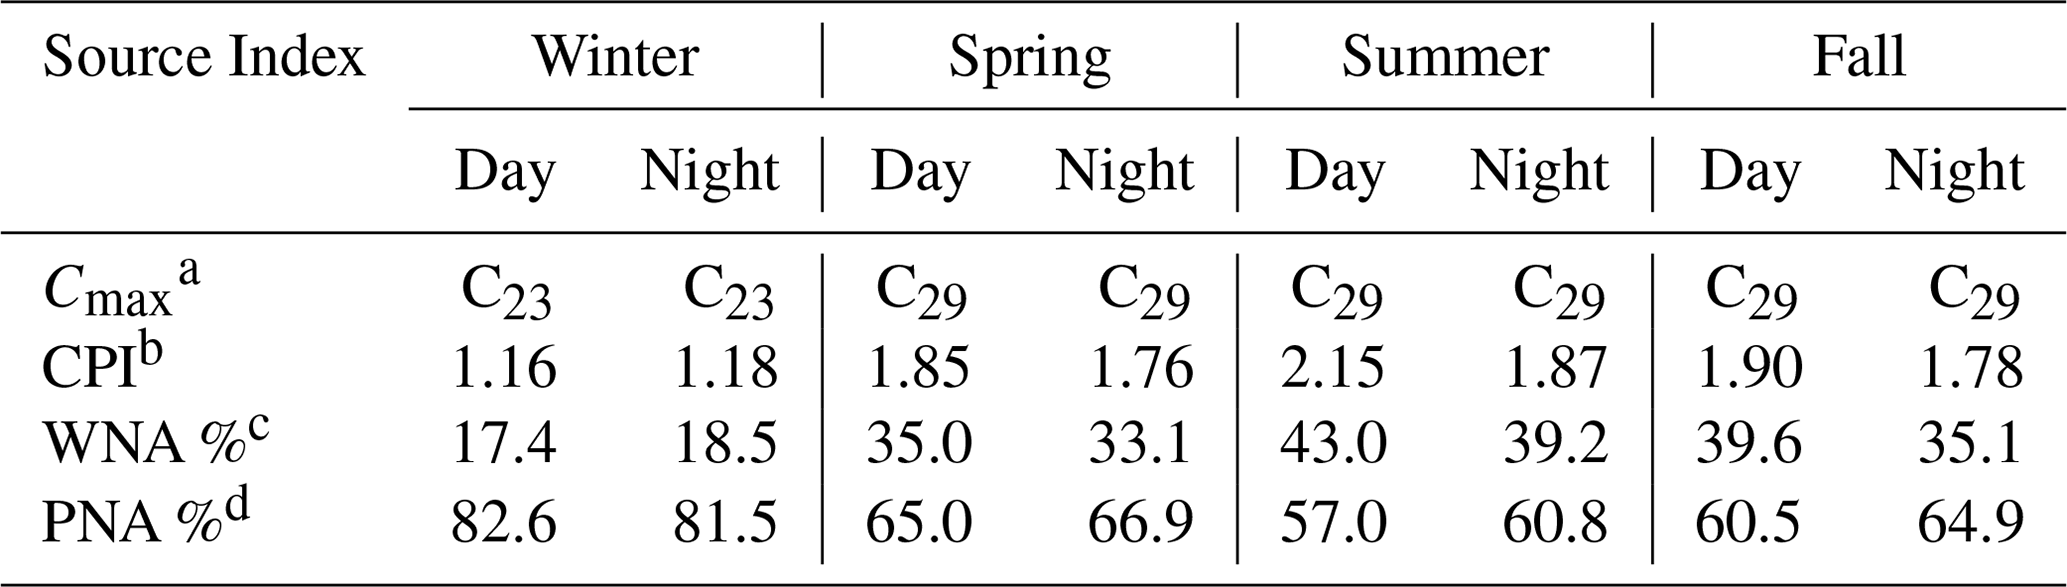
a Cmax: carbon maximum number; b CPI: carbon preference index; c WNA%: plant wax n-alkane ratio; d PNA%: petrogenic n-alkane ratio.
3.4.1 Source indices for n-alkanes
The Cmax for winter was C23, but the Cmax for spring, summer, and fall was C29. The mean CPI for the year the samples were collected was 1.66. The CPI was lowest in winter but higher during the day than during the night in spring, summer, and fall. The mean contribution of plant wax n-alkanes to the total n-alkane concentration during the sampling period was 30.6 %, and the mean contribution of anthropogenic n-alkanes to the total n-alkane concentration was 69.4 %. The plant wax n-alkane contribution was lowest in winter and markedly higher in spring, summer, and fall.
3.4.2 Results of the PMF model
According to the PMF 5.0 User Guide (US EPA, 2014), the daily mean n-alkane concentrations during the sampling period and the corresponding uncertainties were inputted into the PMF model to analyze the sources of n-alkanes in fine particulate matter. Various numbers of factors were tested, and the optimal correlation coefficient for the relationship between the simulated and observed values was found when five factors were used; the average correlation coefficient of n-alkane homologs is 0.832. Q (robust) is an important parameter obtained after the PMF run – it is the goodness-of-fit parameter calculated excluding points not fit by the model (US EPA, 2014). In the process of running the PMF model, we got the lowest Q (robust) values when selecting five factors. This met the requirements to use the PMF model; EPA PMF 5.0 User Guide (US EPA, 2014) has stated that the lowest Q (robust) value represents the most optimal solution from the multiple runs, and it can be a critical parameter for choosing the optimal number of factors. Each factor indicated a source, and the factors could be used to identify the corresponding sources. The n-alkane factor data given by the PMF model are shown in Fig. 7.
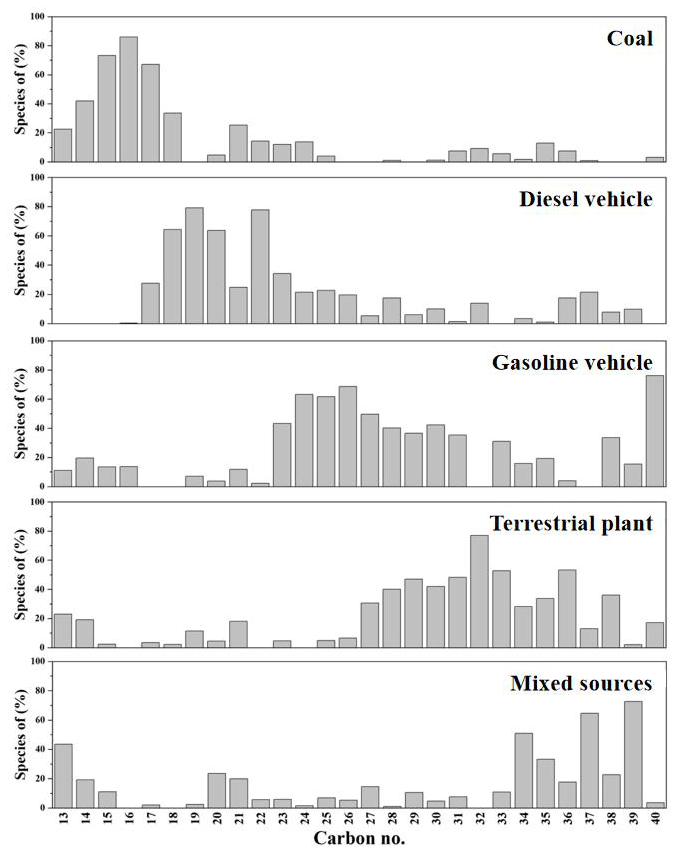
Figure 7Proportions of the different n-alkane homologs in the factors identified by the positive matrix factorization model.
The PMF model indicated that the contributions of factors 1, 2, 3, 4, and 5 to the n-alkane concentrations were 14.8 %, 26.1 %, 31.5 %, 18.6 %, and 9.01 %, respectively. The sources corresponding to the factors identified by the PMF model needed to be identified from the proportions of the different n-alkane homologs present; the sources corresponding to factors 2 and 3 were the main contributors of n-alkanes in particulate matter.
4.1 Sources and contributions of n-alkanes
n-Alkanes in PM2.5 have relatively complex sources, but different n-alkane compositions and distributions indicate different sources. As shown in Fig. 5, marked odd-carbon-number dominance was found in all seasons for the HMW n-alkanes, with n-alkanes with carbon chain lengths of C27, C29, C31, and C33 being dominant. No odd-carbon-number dominance was found for the LMW n-alkanes. It has previously been found that LMW n-alkanes in urban areas are mainly anthropogenic (e.g., emitted during fossil fuel combustion and in vehicle exhaust gases; Simoneit et al., 2004; Kang et al., 2016a), but HMW n-alkanes reflect sources such as biomass combustion and waxes in terrestrial plants (Kawamura et al., 2003). LMW and HMW n-alkane patterns can be used to identify the main sources of n-alkanes in urban areas. The n-alkane patterns in the different seasons indicated that particulate-bound n-alkanes in the atmosphere in Beijing have both anthropogenic and biological sources. The source indices and PMF model results further explained the sources and contributions of n-alkanes.
n-Alkane source indices are often used to identify the origins of n-alkanes. The n-alkane source indices shown in Table 2 indicated that anthropogenic emissions were the main contributors of particulate-bound n-alkanes in Beijing during the study but that there were also biogenic emissions of particulate-bound n-alkanes. The CPI and WNA% data explained this. During the sampling period, the mean CPI was 1.66, indicating that the main sources of particulate-bound n-alkanes were fossil fuel combustion, plants, and biomass combustion. The mean WNA% and PNA% were 30.63 % and 69.37 %, respectively, indicating that anthropogenic emissions contributed more than emissions from biota.
The PMF model can quantify the contributions of specific sources of n-alkanes relatively accurately. The n-alkane homolog contributions to each factor identified by the PMF model were used to analyze and identify the corresponding source. As shown in factor 1 of Fig. 7, the n-alkanes with carbon chain lengths of C13–C18 were dominant, which is similar to the n-alkane homolog (C<20) pattern for emissions during coal combustion found by Oros and Simoneit (2000) and Niu et al. (2005). Therefore, we concluded that factor 1 indicated that n-alkanes emitted through coal combustion. Vehicle emissions are important sources of n-alkanes in particulate matter in urban areas (Lyu et al., 2019). n-Alkanes emitted by vehicles mainly have carbon chain lengths of <30 (Wang et al., 2017). However, there are marked differences between the patterns of n-alkanes emitted in particulates in gasoline vehicles and in diesel vehicle exhaust gases. Cmax for n-alkanes is lower, and the proportion of low-carbon-chain-length n-alkanes is higher for particulates in diesel vehicle exhaust gases than for those in gasoline vehicle exhaust gases. This feature can be used to distinguish between n-alkanes emitted by diesel and gasoline vehicles in fine particulate matter (Fujitani et al., 2012; Yuan et al., 2016). As shown in Fig. 7, the homologs with a higher proportion of n-alkane species in factor 2 are concentrated around C20, while in factor 3, they are concentrated around C27. According to studies by Schauer (1999, 2002), for gasoline and diesel vehicle emissions, we determine that factors 2 and 3 indicated diesel and gasoline vehicle emission sources, respectively. C27–C38 (i.e., high-carbon-chain-length) n-alkanes made large contributions, and low-carbon-chain-length n-alkanes made small contributions to the pattern for factor 4. Studies have shown that C26–C36 n-alkanes are mainly emitted from cuticular waxes in terrestrial plants (Alves et al., 2001; Lyu et al., 2016), so we inferred that factor 4 indicated n-alkanes emitted by terrestrial plants. n-Alkanes do not have an obvious regularity in composition, and there was no clear n-alkane homolog pattern for factor 5, but long-chain n-alkanes with carbon chain lengths of ≥34 were dominant. We found that road dust is one of the sources of particulate-bound n-alkanes (Anh et al., 2019); n-alkanes with ≥ C34 may come from road dust (Daher et al., 2013) and biogenic sources (Liebezeit and Wöstmann, 2009). Therefore, we concluded that factor 5 may be the mixed sources of n-alkanes from road dust and biogenic emissions.
The contributions of the different sources to the n-alkane concentrations are shown in Fig. 8. In summary, n-alkanes in airborne particulate matter in Beijing are both anthropogenic and biogenic. Vehicle exhaust emissions are the main sources of n-alkanes, consistent with the current energy consumption structure in Beijing, and gasoline and diesel vehicles accounted for a relatively large proportion of n-alkanes in airborne particulate matter.

4.2 Characteristics of PM2.5 and n-alkanes
The mean n-alkane concentration during the sampling period was 32.7 ng m−3, which was lower than the C19–C36 n-alkane concentration of 282 ng m−3 found in Beijing in 2006 (Y. S. Li et al., 2013) and the C8–C40 n-alkane concentration of 228 ng m−3 found in Shanghai in 2013 (Lyu et al., 2016). The temporal trends in the n-alkane concentrations were similar to the trends found in previous studies of n-alkanes in Beijing (Rogge et al., 1993; X. R. Li et al., 2013; Ren et al., 2019), the overall n-alkane concentration being highest in winter. The seasonal pattern we found for n-alkanes in Beijing was similar to the pattern found in a previous study of C16–C35 n-alkanes in 14 Chinese cities (Wang et al., 2006b).
The n-alkane pattern varied by season, with LMW n-alkanes being dominant in winter and HMW n-alkanes being more abundant in the other seasons. Cmax and WNA% explained the seasonal differences in the n-alkane patterns. In previous studies, lower Cmax values were found for n-alkanes emitted from very mature organic matter such as coal and petroleum than for n-alkanes emitted from immature organic matter such as plants (Simoneit et al., 1989; Duan et al., 2010). The Cmax for n-alkanes in winter was C23, indicating that LMW n-alkanes were the main n-alkanes. Similar results were found by Lyu et al. (2019) for Beijing in winter. The Cmax for n-alkanes in spring, summer, and fall was C29. Ficken et al. (2000) and Yadav et al. (2013) found that C29 n-alkanes are markers for n-alkanes emitted from the wax layers of terrestrial plants. Stronger n-alkane contributions will be made by plants in spring, summer, and fall than in winter (Rogge et al., 1993; Yadav et al., 2013). This is consistent with the results found in a study performed in Shanghai (Lyu et al., 2016; F. W. Wang et al., 2016). There were significant seasonal differences (p<0.01) in the concentrations of the C13–C40 n-alkane homologs, but the seasonal differences were stronger for LMW n-alkanes than for HMW n-alkanes. Similar results were found by Li et al. (2010) in Tianjin in 2010. The LMW n-alkane concentrations were markedly higher in winter than in the other seasons, similar to the results of a study performed by X. R. Li et al. (2013) in Beijing in 2013. This indicated that there were seasonal differences in n-alkane sources. The PMF model results shown in Fig. 8 indicated that anthropogenic n-alkanes strongly contributed to the total n-alkane concentration in winter. The CPI also indicated that different sources were dominant in winter and the other seasons. The lowest CPI was found for winter, indicating that LMW n-alkanes made stronger contributions to the total n-alkane concentrations in winter than in the other seasons. This may be related to n-alkane emissions caused by fossil fuel combustion for heating in winter. Similar results have been found in Shanghai (Lyu et al., 2016), Zhengzhou (Wang et al., 2017), southeastern Chinese cities (Chen et al., 2019), and Beijing (Kang et al., 2016b).
Meteorological factors affect the concentrations and composition of n-alkanes in different seasons. The mixing-layer height influences the concentration of n-alkanes by affecting the particulate matter; it has been shown that the mixing-layer height is correlated with the concentration of particulate matter, and the peak concentration of particulate matter increases as the mixing-layer height decreases (Wagner and Schäfer, 2017). The atmospheric mixing-layer height in Beijing has obvious seasonal characteristics, shown to be low in winter and high in summer (Wang et al., 2020; Tang et al., 2016). Therefore, the increased concentrations of PM2.5 and n-alkanes in winter were influenced by the mixing-layer height. Wind direction is one of the factors affecting the seasonal differences in particulate matter and n-alkanes: the northwest wind in winter brought the polluted air masses from inland to Beijing, while the southeast wind in summer transported cleaner aerosols from oceans to here (Wei et al., 2020). In addition, the seasonal distribution of n-alkanes is influenced by the temperature. The temperature in Beijing is high in summer and low in winter; when the temperature is lower in winter, gaseous n-alkanes are more likely to partition into particles with the higher partition coefficient of gas–particle partitioning (Lyu et al., 2016; Wick et al., 2002). Therefore, the increase of the LWM n-alkanes proportion in winter is also affected by temperature.
The mean C13–C40 n-alkane homolog concentrations were higher at night than in the day in each season, and the differences were significant (p<0.01). According to a study by Yao et al. (2009), lower average wind speeds, atmospheric mixing-layer height, and poorer atmospheric diffusion conditions can lead to higher concentrations of n-alkanes at night than during the day (Yao et al., 2009). Similar results were found in Liaocheng, Shandong Province (Liu et al., 2019). The differences in the n-alkane concentrations in the night and during the day may also have been caused by differences in pollutant emissions in the night and during the day. Particulate-bound n-alkanes from vehicular emissions are usually of low molecular weight (Lyu et al., 2019), and diesel emissions have higher concentrations of particulate-bound n-alkanes with carbon chain lengths of less than 25 (Schauer et al., 1999). Differences in diurnal concentrations of LMW n-alkanes may reflect the differences in the contribution of anthropogenic sources. We found markedly higher concentrations of some homologs with carbon chain lengths of <25 at night than during the day. This would be consistent with short-chain alkane emissions from diesel vehicles in Beijing being higher at night than during the day.
4.3 PM2.5 sources in Beijing and strategies for controlling PM2.5 concentrations
During the sampling period, the mean daily PM2.5 concentration in Beijing was 32.0 µg m−3, which met the requirement of the secondary ambient air quality standard for China (35.0 µg m−3). According to the Ecology and Environment Statement from the Beijing Municipal Ecology and Environment Bureau (http://sthjj.beijing.gov.cn/, last access: 25 July 2022), the annual mean PM2.5 concentration in Beijing has gradually decreased in the last 5 years. However, little research on n-alkanes in Beijing has been performed during this period. We compared our results with the results of a previous study (Lyu et al., 2019) and found that the n-alkane concentrations decreased in parallel with the PM2.5 concentrations. n-Alkanes are important molecular markers for identifying the sources of PM2.5. Excluding when the PM2.5 concentration increased sharply because of meteorological conditions, the PM2.5 and n-alkane concentrations varied in the same ways. As shown in Fig. 2, a significant positive correlation was found between the PM2.5 and n-alkane concentrations (p<0.01), so n-alkanes could be used as indicators of the sources of PM2.5 in the atmosphere. This method has been widely used to analyze sources of particulate matter (Cass, 1998; Kavouras et al., 2001; Bi et al., 2003; Xu et al., 2013; Zhao et al., 2016; Han et al., 2018). Therefore, we used the PMF model results for n-alkanes to identify the sources of PM2.5 and to explain variations in the sources.
The PMF model results for the contributions of the different sources shown in Fig. 8 indicated that emissions in vehicle exhaust gases and through coal combustion contributed up to 72.4 % of PM2.5 in the sampling area throughout the sampling period. This indicated that anthropogenic PM2.5 emissions are the main sources of PM2.5 in the urban study area. Emissions from gasoline and diesel vehicles were the dominant anthropogenic sources, contributing 57.6 % of total anthropogenic PM2.5 emissions. Vehicles are the main sources of PM2.5 in urban areas and make important contributions to particulate matter in the atmosphere in Beijing. Similar results were found in a previous study of PM2.5 sources in Beijing (Lv et al., 2020; Qi et al., 2018), and the results were consistent with the current energy consumption structure in Beijing (gasoline and diesel fuel make large contributions to total fuel consumption). Human activities make larger contributions to PM2.5 emissions in winter than in the other seasons, indicating that more attention should be paid to emissions caused by fossil fuel combustion in winter than in the other seasons.
It is necessary to improve air quality in Beijing, and vehicle exhausts are key sources of PM2.5. Further improvements in ambient air quality to meet stricter ambient air quality standards will require vehicle emissions to be controlled to decrease particulate matter pollution. The number of vehicles using fossil fuels in Beijing needs to be decreased. Achieving this will require policies for restricting the use of vehicles using fossil fuels and the use of cleaner energy vehicles to be promoted. In summary, controlling and decreasing emissions caused by fossil fuel combustion will decrease PM2.5 emissions and improve ambient air quality in Beijing.
The PM2.5 concentrations and C13–C40 n-alkane concentrations in the fine particulate matter between November 2020 and October 2021 were determined, and the concentrations were compared with concentrations found in previous studies. The PM2.5 and n-alkane concentrations in Beijing have decreased in similar ways in the last 5 years. The mean PM2.5 concentration was 32.0 µg m−3, which met the secondary ambient air quality standard for China. The PM2.5 and C13–C40 n-alkane concentrations varied in similar ways and positively correlated (p<0.01), so long-chain n-alkanes in the particulate matter can be used to assess the sources of particulate matter pollution in urban areas and to develop strategies for controlling particulate matter pollution.
The n-alkane concentrations in the different seasons decreased in the order of winter > spring > summer > fall. There were marked seasonal and diurnal differences in the n-alkane homolog patterns and distributions. The source indices and PMF model results explained these variations in patterns and allowed the sources of n-alkanes to be identified. The source indices indicated that n-alkane concentrations in particulate matter in Beijing are affected by both anthropogenic and biogenic emissions but that anthropogenic emissions are dominant. The PMF model allowed the contributions of the sources of n-alkanes to be quantified and indicated that emissions from vehicles are currently the main sources of PM2.5 and n-alkanes in particulate matter in urban areas.
Controlling PM2.5 and n-alkanes emissions from vehicles is key to decreasing PM2.5 and n-alkanes pollution and improving air quality in urban areas. n-Alkanes in the particulate matter can be used as organic tracers, and PMF model results can indicate the sources of PM2.5 pollution. Further research into the use of this method is required.
The data presented in this article are available from the authors upon request (junjin3799@126.com).
JJ conceived and designed the study, provided direct funding, and helped with revision of the paper. JY mainly conducted the sampling and sample analysis work, as well as writing and revision of the paper. Other authors helped this work by sampling and analysis. All authors read and approved the final paper.
The contact author has declared that none of the authors has any competing interests.
Publisher’s note: Copernicus Publications remains neutral with regard to jurisdictional claims in published maps and institutional affiliations.
We thank Gareth Thomas for his help in the grammatical editing of this paper.
This research has been supported by the National Natural Science Foundation of China (grant no. 91744206) and the Beijing Science and Technology Planning Project (grant no. Z181100005418016).
This paper was edited by Dara Salcedo and reviewed by Omar Amador-Munoz and one anonymous referee.
Alves, C., Pio, C., and Duarte, A.: Composition of extractable organic matter of air particles from rural and urban Portuguese areas, Atmos. Environ., 35, 5485–5496, https://doi.org/10.1016/S1352-2310(01)00243-6, 2001.
Anh, H. Q., Tran, T. M., Thuy, N. T. T., Minh, T. B., and Takahashi, S.: Screening analysis of organic micro-pollutants in road dusts from some areas in northern Vietnam: A preliminary investigation on contamination status, potential sources, human exposure, and ecological risk, Chemoshpere, 224, 428–436, https://doi.org/10.1016/j.chemosphere.2019.02.177, 2019.
Aumont, B., Valorso, R., Mouchel-Vallon, C., Camredon, M., Lee-Taylor, J., and Madronich, S.: Modeling SOA formation from the oxidation of intermediate volatility n-alkanes, Atmos. Chem. Phys., 12, 7577–7589, https://doi.org/10.5194/acp-12-7577-2012, 2012.
Aumont, B., Camredon, M., Mouchel-Vallon, C., La, S., Ouzebidour, F., Valorso, R., Lee-Taylor, J., and Madronich, S.: Modeling the influence of alkane molecular structure on secondary organic aerosol formation, Faraday Discuss., 165, 105–122, https://doi.org/10.1039/C3FD00029J, 2013.
Beijing Municipal Ecology and Environmental Bureau: Beijing Ecology and Environment Statement, 2016–2021, http://sthjj.beijing.gov.cn/, last access: 5 July 2022.
Bi, X. H., Sheng, G. Y., Peng, P. A., Chen, Y. J., Zhang, Z. Q., and Fu, J. M.: Distribution of particulate- and vapor-phase n-alkanes and polycyclic aromatic hydrocarbons in urban atmosphere of Guangzhou, China, Atmos. Environ., 37, 289–298, https://doi.org/10.1016/S1352-2310(02)00832-4, 2003.
Bray, E. E. and Evans, E. D.: Distribution of n-paraffins as a clue to recognition of source beds, Geochim. Cosmochim. Ac., 22, 2–15, https://doi.org/10.1016/0016-7037(61)90069-2, 1961.
Cass, G. R.: Organic molecular tracers for particulate air pollution sources, TrAC - Trend. Anal. Chem., 17, 356–366, https://doi.org/10.1016/S0165-9936(98)00040-5, 1998.
Caumo, S., Bruns, R. E., and Vasconcellos, P. C.: Variation of the Distribution of Atmospheric n-Alkanes Emitted by Different Fuels' Combustion, Atmosphere, 11, 643, https://doi.org/10.3390/atmos11060643, 2020.
Chen, Q., Chen, Y., Luo, X. S., Hong, Y. W., Hong, Z. Y., Zhao, Z., and Chen, J. S.: Seasonal characteristics and health risks of PM2.5-bound organic pollutants in industrial and urban areas of a China megacity, J. Environ. Manage., 245, 273–281, https://doi.org/10.1016/j.jenvman.2019.05.061, 2019.
Chen, Y., Cao, J. J., Zhao, J., Xu, H. M., Arimoto, R., Wang, G. H., Han, Y. M., Shen, Z. X., and Li, G. H.: n-Alkanes and polycyclic aromatic hydrocarbons in total suspended particulates from the southeastern Tibetan Plateau: concentrations, seasonal variations, and sources, Sci. Total Environ., 470–471, 9–18, https://doi.org/10.1016/j.scitotenv.2013.09.033, 2014.
Chrysikou, L. P. and Samara, C. A.: Seasonal variation of the size distribution of urban particulate matter and associated organic pollutants in the ambient air, Atmos. Environ., 43, 4557–4569, https://doi.org/10.1016/j.atmosenv.2009.06.033, 2009.
Daher, N., Saliba, N. A., Shihadeh, A. L., Jaafar, M., Baalbake, R., and Sioutas, C.: Chemical composition of size-resolved particulate matter at near-freeway and urban background sites in the greater Beirut area, Atmos. Environ., 80, 96–106, https://doi.org/10.1016/j.atmosenv.2013.08.004, 2013.
Duan, F. K., He, K. B., and Liu, X. D.: Characteristics and source identification of fine particulate n-alkanes in Beijing, China, J. Environ. Sci., 22, 998–1005, https://doi.org/10.1016/S1001-0742(09)60210-2, 2010.
Ficken, K. J., Li, B., Swain, D. L., and Eglinton, G.: An n-alkane proxy for the sedimentary input of submerged/floating freshwater aquatic macrophytes, Org. Geochem., 31, 745–749, https://doi.org/10.1016/S0146-6380(00)00081-4, 2000.
Fu, P. Q., Kawamura, K., Pavuluri, C. M., Swaminathan, T., and Chen, J.: Molecular characterization of urban organic aerosol in tropical India: contributions of primary emissions and secondary photooxidation, Atmos. Chem. Phys., 10, 2663–2689, https://doi.org/10.5194/acp-10-2663-2010, 2010.
Fujitani, Y., Saitoh, K., Fushimi, A., Takahashi, K., Hasegawa, S., Tanabe, K., Kobayashi, S., Furuyama, A., Hirano, S., and Takami, A.: Effect of isothermal dilution on emission factors of organic carbon and n-alkanes in the particle and gas phases of diesel exhaust, Atmos. Environ., 59, 389–397, https://doi.org/10.1016/j.atmosenv.2012.06.010, 2012.
Han, D., Fu, Q., Gao, S., Li, L., Ma, Y., Qiao, L., Xu, H., Liang, S., Cheng, P., Chen, X., Zhou, Y., Yu, J. Z., and Cheng, J.: Non-polar organic compounds in autumn and winter aerosols in a typical city of eastern China: size distribution and impact of gas–particle partitioning on PM2.5 source apportionment, Atmos. Chem. Phys., 18, 9375–9391, https://doi.org/10.5194/acp-18-9375-2018, 2018.
Huang, R. J., Zhang, Y. L., Bozzetti, C., Ho, K. F., Cao, J. J., Han, Y. M., Daellenbach, R. K., Slowik, J. G., Platt, S. M., Canonaco, F., Zotter, P., Wolf, R., Pieber, S. M., Bruns, E. A., Crippa, M., Ciarelli, G., Piazzalunga, A., Schwikowski, M., Abbaszade, G., Schnelle-Kreis, J., Zimmermann, R., An, Z. S., Szidat, S., Baltensperger, U., Haddad, I. E., and Prévôt, A. S. H.: High secondary aerosol contribution to particulate pollution during haze events in China, Nature, 514, 218–222, https://doi.org/10.1038/nature13774, 2014.
Kang, M. J., Fu, P. Q., Aggarwal, S. G., Kumar, S., Zhao, Y., Sun, Y. L., and Wang, Z. F.: Size distributions of n-alkanes, fatty acids and fatty alcohols in springtime aerosols from New Delhi, India, Environ. Pollut., 219, 957–966, https://doi.org/10.1016/j.envpol.2016.09.077, 2016a.
Kang, M. J., Ren, L. J., Ren, H., Zhao, Y., Kawamura, K., Zhang, H. L., Wei, L. F., Sun, Y. L., Wang, Z. F., and Fu, P. Q.: Primary biogenic and anthropogenic sources of organic aerosols in Beijing, China: Insights from saccharides and n-alkanes, Environ. Pollut., 243, 1579–1587, https://doi.org/10.1016/j.envpol.2018.09.118, 2016b.
Kang, M., Kim, K., Choi, N., Kim, Y. P., and Lee, J. Y.: Recent Occurrence of PAHs and n-Alkanes in PM2.5 in Seoul, Korea and Characteristics of Their Sources and Toxicity, Int. J. Environ. Res. Pub. He., 17, 1397, https://doi.org/10.3390/ijerph17041397, 2020.
Kavouras, I. G, Koutrakis, P., Tsapakis, M., Lagoudaki, E., Stephanou, E. G., Baer, D. V., and Oyola, P.: Source apportionment of urban particulate aliphatic and polynuclear aromatic hydrocarbons (PAHs) using multivariate methods, Environ. Sci. Technol., 35, 2288–2294, https://doi.org/10.1021/es001540z, 2001.
Kawamura, K., Ishimura, Y., and Yamazaki, K.: Four years' observations of terrestrial lipid class compounds in marine aerosols from the western North Pacific, Global Biogeochem. Cy., 17, 1–19, https://doi.org/10.1029/2001GB001810, 2003.
Li, F. X., Gu, J. W., Xin, J. Y., Schnelle-Kreis, J., Wang, Y. S., Liu, Z. R., Shen, R. R., Michalke, B., Abbaszade, G., and Zimmermann, R.: Characteristics of chemical profile, sources and PAH toxicity of PM2.5 in Beijing in autumn-winter transit season with regard to domestic heating, pollution control measures and meteorology, Chemosphere, 276, 130143, https://doi.org/10.1016/j.chemosphere.2021.130143, 2021.
Li, W. F., Peng, Y., and Bai, Z. P.: Distributions and sources of n-alkanes in PM2.5 at urban, industrial and coastal sites in Tianjin, China, J. Environ. Sci., 22, 1551–1557, https://doi.org/10.1016/S1001-0742(09)60288-6, 2010.
Li, X. R., Wang, Y. S., Guo, X. Q., and Wang, Y. F.: Seasonal variation and source apportionment of organic and inorganic compounds in PM2.5 and PM10 particulates in Beijing, China, J. Environ. Sci., 25, 741–750, https://doi.org/10.1016/S1001-0742(12)60121-1, 2013.
Li, Y. S., Cao, J. J., Li, J. J., Zhou, J. M., Xu, H. M., Zhang, R. J., and Ouyang, Z. Y.: Molecular distribution and seasonal variation of hydrocarbons in PM2.5 from Beijing during 2006, Particuology, 11, 78–85, https://doi.org/10.1016/j.partic.2012.09.002, 2013.
Liao, H. T., Lee, C. L., Tsai, W. C., Yu, J. Z., Tsai, S. W., Chou, C. C. K., and Wu, C. F.: Source apportionment of urban PM2.5 using positive matrix factorization with vertically distributed measurements of trace elements and nonpolar organic compounds, Atmos. Pollut. Res., 12, 200–207, https://doi.org/10.1016/j.apr.2021.03.007, 2021.
Liebezeit, G. and Wöstmann, R.: n-Alkanes as indicators of natural and anthropogenic organic matter sources in the Siak River and its Estuary, E Sumatra, Indonesia, B. Environ. Contam. Tox., 83, 403–409, https://doi.org/10.1007/s00128-009-9734-4, 2009.
Liu, L. Y., Wei, G. L., Wang, J. Z., Guan, Y. F., Wong, C. S., Wu, F. C., and Zeng, E. Y.: Anthropogenic activities have contributed moderately to increased inputs of organic materials in marginal seas off China, Environ. Sci. Technol., 47, 11414–11422, https://doi.org/10.1021/es401751k, 2013.
Liu, X. D., Meng, J. J., Hou, Z. F., Yi, Y. N., Wei, B. J., and Fu, M. X.: Pollution Characteristics and Source Analysis of n-alkanes and Saccharides in PM2.5 During the Winter in Liaocheng City, Environ. Sci., 40, 548–557, https://doi.org/10.13227/j.hjkx.201807132, 2019 (in Chinese).
Lv, L. L., Chen, Y. J., Han, Y., Cui, M., Wei, P., Zheng, M., and Hu, J. N.: High-time-resolution PM2.5 source apportionment based on multi-model with organic tracers in Beijing during haze episodes, Sci. Total Environ., 772, 144766, https://doi.org/10.1016/j.scitotenv.2020.144766, 2020.
Lyu, R. H., Shi, Z. B., Alam, M. S., Wu, X. F., Liu, D., Vu, T. V, Stark, C., Xu, R. X., Fu, P. Q., Feng, Y. C., and Harrison, R. M: Alkanes and aliphatic carbonyl compounds in wintertime PM2.5 in Beijing, China, Atmos. Environ., 202, 244–255, https://doi.org/10.1016/j.atmosenv.2019.01.023, 2019.
Lyu, Y., Xu, T. T., Yang, X., Chen, J. M., Cheng, T. T., and Li, X.: Seasonal contributions to size-resolved n-alkanes (C8–C40) in the Shanghai atmosphere from regional anthropogenic activities and terrestrial plant waxes, Sci. Total Environ., 579, 1918–1928, https://doi.org/10.1016/j.scitotenv.2016.11.201, 2016.
Ma, J. Z., Xu, X. B., Zhao, C. S., and Yan, P.: A review of atmospheric chemistry research in China: Photochemical smog, haze pollution, and gas-aerosol interactions, Adv. Atmos. Sci., 29, 1006–1026, https://doi.org/10.1007/s00376-012-1188-7, 2012.
Marzi, R., Torkelson, B. E., and Olson, R. K.: A revised carbon preference index, Org. Geochem., 20, 1303–1306, https://doi.org/10.1016/0146-6380(93)90016-5, 1993.
Michoud, V., Kukui, A., Camredon, M., Colomb, A., Borbon, A., Miet, K., Aumont, B., Beekmann, M., Durand-Jolibois, R., Perrier, S., Zapf, P., Siour, G., Ait-Helal, W., Locoge, N., Sauvage, S., Afif, C., Gros, V., Furger, M., Ancellet, G., and Doussin, J. F.: Radical budget analysis in a suburban European site during the MEGAPOLI summer field campaign, Atmos. Chem. Phys., 12, 11951–11974, https://doi.org/10.5194/acp-12-11951-2012, 2012.
Moeinaddini, M., Sari, A. E., Bakhtiari, A. R., Chan, A. Y. C., Taghavi, S. M., Hawker, D., and Connell, D.: Source apportionment of PAHs and n-alkanes in respirable particles in Tehran, Iran by wind sector and vertical profile, Environ. Sci. Pollut. R., 21, 7757–7772, https://doi.org/10.1007/s11356-014-2694-1, 2014.
Niu, H. Y., Zhao, X., Dai, Z. X., Wang, G. H., and Wang, L. S.: Characterization, source apportionment of particulate matter and n-alkanes in atmospheric aerosols in Nanjing City, Environ. Pollut. Control, 27, 363–366, https://doi.org/10.3969/j.issn.1001-3865.2005.05.014, 2005 (in Chinese).
Oros, D. R. and Simoneit, B. R. T.: Identification and emission rates of molecular tracers in coal smoke particulate matter, Fuel, 79, 515–536, https://doi.org/10.1016/S0016-2361(99)00153-2, 2000.
Presto, A. A., Miracolo, M. A., Kroll, J. H., Worsnop, D. R., Robinson, A. L., and Donahue, N. M.: Intermediate-volatility organic compounds: a potential source of ambient oxidized organic aerosol, Environ. Sci. Technol., 43, 4744–4749, https://doi.org/10.1021/es803219q, 2009.
Qi, M. X., Jiang, L., Liu, Y. X., Xiong, Q. L., Sun, C. Y., Li, X., Zhao, W. J., and Yang, X. C.: Analysis of the Characteristics and Sources of Carbonaceous Aerosols in PM2.5 in the Beijing, Tianjin, and Langfang Region, China, Int. J. Environ. Res. Pub. He., 15, 1438, https://doi.org/10.3390/ijerph15071483, 2018.
Ren, L. J., Fu, P. Q., He, Y., Hou, J. Z., Chen, J., Pavuluri, C. M., Sun, Y. L., and Wang, Z. F.: Molecular distributions and compound-specific stable carbon isotopic compositions of lipids in wintertime aerosols from Beijing, Sci. Rep.-UK, 6, 27481, https://doi.org/10.1038/srep27481, 2016.
Ren, L. J., Hu, W., Hou, J. Z., Li, L. J., Yue, S. Y., Sun, Y. L., Wang, Z. F., Li, X. F., Pavuluri, C. M., Hou, S. J., Liu, C. Q., Kawamura, K., Ellam, R. M., and Fu, P. Q.: Compound-Specific Stable Carbon Isotope Ratios of Terrestrial Biomarkers in Urban Aerosols from Beijing, China, ACS Earth Space Chem., 3, 1896–1904, https://doi.org/10.1021/acsearthspacechem.9b00113, 2019.
Ren, Y. Q., Wang, G. H., Wu, C., Wang, J. Y., Li, J. J., Zhang, L., Han, Y. N., Liu, L., Cao, C., Cao, J. J., He, Q., and Liu, X. C.: Changes in concentration, composition and source contribution of atmospheric organic aerosols by shifting coal to natural gas in Urumqi, Atmos. Environ., 148, 306–315, https://doi.org/10.1016/j.atmosenv.2016.10.053, 2017.
Rogge, W. F., Hildemann, L. M., Mazurek, M. A., Cass, G. R., and Simoneit, B. R. T.: Sources of fine organic aerosol. 4. Particulate abrasion products from leaf surfaces of urban plants, Environ. Sci. Technol., 27, 2700–2711, https://doi.org/10.1021/es00049a008, 1993.
Schauer, J. J., Kleeman, M. J., Cass, G. R., and Simoneit, B. R. T.: Measurement of Emissions from Air Pollution Sources. 2. C1 through C30 Organic Compounds from Medium Duty Diesel Trucks, Environ. Sci. Technol., 33, 1578–1587, https://doi.org/10.1021/es980081n, 1999.
Schauer, J. J., Kleeman, M. J., Cass, G. R., and Simoneit, B. R. T.: Measurement of Emissions from Air Pollution Sources. 5. C1–C32 Organic Compounds from gasoline-Powered Motor Vehicles, Environ. Sci. Technol., 36, 1169–1180, https://doi.org/10.1021/es0108077, 2002.
Simoneit, B. R. T.: Application of Molecular Marker Analysis to Vehicular Exhaust for Source Reconciliations, Int. J. Environ. An. Ch., 22, 203–232, https://doi.org/10.1080/03067318508076422, 1985.
Simoneit, B. R. T.: Organic matter of the troposphere – V: Application of molecular marker analysis to biogenic emissions into the troposphere for source reconciliations, J. Atmos. Chem., 8, 251–275, https://doi.org/10.1007/BF00051497, 1989.
Simoneit, B. R. T., Kobayashi, M., Mochida, M., Kawamura, K., and Huebert, B. J.: Aerosol particles collected on aircraft flights over the northwestern Pacific region during the ACE-Asia campaign: composition and major sources of the organic compounds, J. Geophys. Res., 109, D19S09, https://doi.org/10.1029/2004JD004565, 2004.
Sun, N., Li, X. D., Ji, Y., Huang, H. Y., Ye, Z. L., and Zhao, Z. Z.: Sources of PM2.5-Associated PAHs and n-alkanes in Changzhou China, Atmosphere, 12, 1127, https://doi.org/10.3390/atmos12091127, 2021.
Tang, G., Zhang, J., Zhu, X., Song, T., Münkel, C., Hu, B., Schäfer, K., Liu, Z., Zhang, J., Wang, L., Xin, J., Suppan, P., and Wang, Y.: Mixing layer height and its implications for air pollution over Beijing, China, Atmos. Chem. Phys., 16, 2459–2475, https://doi.org/10.5194/acp-16-2459-2016, 2016.
United States Environmental Protection Agency: EPA Positive Matrix Factorization (PMF) 5.0 Fundamentals and User Guide, EPA/600/R-14/108, https://www.epa.gov/, last access: 25/7/2022, 2014.
Wagner, P. and Schäfer, K.: Influence of mixing layer height on air pollutant concentrations in an urban street canyon, Urban Climate, 22, 64–79, https://doi.org/10.1016/j.uclim.2015.11.001, 2017.
Wang, F. W., Guo, Z. G., Lin, T., and Rose, N. L.: Seasonal variation of carbonaceous pollutants in PM2.5 at an urban 'supersite' in Shanghai, China, Chemosphere, 146, 238–244, https://doi.org/10.1016/j.chemosphere.2015.12.036, 2016.
Wang, G. H. and Kawamura, K.: Molecular characteristics of urban organic aerosols from Nanjing: a case study of a mega-city in China, Environ. Sci. Technol., 39, 7430–7438, https://doi.org/10.1021/es051055+, 2005.
Wang, G. H., Huang, L. M., Zhao, X., Niu, H. Y., and Dai, Z. X.: Aliphatic and polycyclic aromatic hydrocarbons of atmospheric aerosols in five locations of Nanjing urban area, China, Atmos. Res., 81, 54–66, https://doi.org/10.1016/j.atmosres.2005.11.004, 2006a.
Wang, G. H., Kawamura, K., Lee, S. C., Ho, K. F., and Cao, J. J.: Molecular, Seasonal, and Spatial Distributions of Organic Aerosols from Fourteen Chinese Cities, Environ. Sci. Technol., 40, 4619–4625, https://doi.org/10.1021/es060291x, 2006b.
Wang, G. H., Zhang, R. Y., Gomez, M. E., Yang, L. X., Zamora, M. L., Hu, M., Lin, Y., Peng, J. F., Guo, S., Meng, J. J., Li, J. J., Chen, C. L., Hu, T. F., Ren, Y. Q., Wang, Y. S., Gao, J., Cao, J. J., An, Z. S., Zhou, W. J., Li, G. H., Wang, J. Y., Tian, P. F., Marrero-Ortiz, W., Secrest, J., Du, Z. F., Zheng, J., Shang, D. J., Zheng, L. M., Shao, M., Wang, W. G., Huang, Y., Wang, Y., Zhu, Y. J., Li, Y. X., Hu, J. X., Pan, B. W., Cai, L., Cheng, Y. T., Ji, Y. M., Zhang, F., Rosenfeld, D., Liss, P. S., Duce, R. A., Kolb, C. E., and Molina, M. J.: Persistent sulfate formation from London Fog to China haze, P. Natl. Acad. Sci. USA, 113, 13630–13635, https://doi.org/10.1073/pnas.1616540113, 2016.
Wang, H., Li, Z., Lv, Y., Zhang, Y., Xu, H., Guo, J., and Goloub, P.: Determination and climatology of the diurnal cycle of the atmospheric mixing layer height over Beijing 2013–2018: lidar measurements and implications for air pollution, Atmos. Chem. Phys., 20, 8839–8854, https://doi.org/10.5194/acp-20-8839-2020, 2020.
Wang, J. Z., Ho, S. S. H., Ma, S. X., Cao, J. J., Dai, W. T., Liu, S. X., Shen, Z. X., Huang, R. J., Wang, G. H., and Han, Y. M.: Characterization of PM2.5 in Guangzhou, China: uses of organic markers for supporting source apportionment, Sci. Total Environ., 550, 961–971, https://doi.org/10.1016/j.scitotenv.2016.01.138, 2016.
Wang, Q., Jiang, N., Yin, S. S., Li, X., Yu, F., Guo, Y., and Zhang, R. Q.: Carbonaceous species in PM2.5 and PM10 in urban area of Zhengzhou in China: Seasonal variations and source apportionment, Atmos. Res., 191, 1–11, https://doi.org/10.1016/j.atmosres.2017.02.003, 2017.
Wei, M., Li, M. Y., Xu, C. H., Xu, P. J., and Liu, H. F.: Pollution characteristics of bioaerosols in PM2.5 during the winter heating season in a coastal city of northern China, Environ. Sci. Pollut. R., 27, 27750–27761, https://doi.org/10.1007/s11356-020-09070-y, 2020.
Wick, C. D., Siepmann, J., Klotz, W. L., and Schure, M. R.: Temperature effects on the retention of n-alkanes and arenes in helium–squalane gas–liquid chromatography: experiment and molecular simulation, J. Chromatogr. A, 957, 181–190, https://doi.org/10.1016/S0021-9673(02)00171-1, 2002.
Xu, H. M., Tao, J., Ho, S. S. H., Ho, K. F., Cao, J. J., Li, N., Chow, J. C., Wang, G. H., Han, Y. M., and Zhang, R. J.: Characteristics of fine particulate non-polar organic compounds in Guangzhou during the 16th Asian Games: Effectiveness of air pollution controls, Atmos. Environ., 76, 94–101, https://doi.org/10.1016/j.atmosenv.2012.12.037, 2013.
Xu, T. T., Lv, Y., Cheng, T. T., and Li, X.: Using comprehensive GC×GC to study PAHs and n-alkanes associated with PM2.5 in urban atmosphere, Environ. Sci. Pollut. R., 22, 5253–5262, https://doi.org/10.1007/s11356-014-3695-9, 2015.
Yadav, S., Tandon, A., and Attri, A.: Monthly and seasonal variation in aerosol associated n-alkane profiles in relation to meteorological parameters in New Delhi, India, Aerosol Air Qual. Res., 13, 287–300, https://doi.org/10.4209/aaqr.2012.01.0004, 2013.
Yang, X. H., Luo, F. X., Li, J. Q., Chen. D. Y., Ye, E., Lin, W. L., and Jin, J.: Alkyl and aromatic nitrates in atmospheric particles determined by gas chromatography tandem mass spectrometry, J. Am. Soc. Mass Spectr., 30, 2762–2770, https://doi.org/10.1007/s13361-019-02347-8, 2019.
Yao, L., Li, X. R., Guo, X. Q., Liu, X. R., and Wang, Y. S.: Pollution Characteristics of n-alkanes in Atmospheric Fine Particles During Spring Festival of 2007 in Beijing, Environ. Sci., 30, 589–593, https://doi.org/10.13227/j.hjkx.2009.02.042, 2009 (in Chinese).
Yuan, J. W., Liu, G., Li, J. H., and Xu, H.: Chemical Composition of Alkanes and Organic Acids in Vehicle Exhaust, Environ. Sci., 37, 2052–2058, https://doi.org/10.13227/j.hjkx.2016.06.007, 2016 (in Chinese).
Zhao, Y., Zhang, Y., Fu, P., Ho, S. S., Ho, K. F., Liu, F., Zou, S., Wang, S., and Lai, S.: Non-polar organic compounds in marine aerosols over the northern South China Sea: Influence of continental outflow, Chemosphere, 153, 332–339, https://doi.org/10.1016/j.chemosphere.2016.03.069, 2016.
Zhang, R. Y., Wang, G. H., Guo, S., Zamora, M. L., Ying, Q., Lin, Y., Wang, W. G., Hu, M., and Wang, Y.: Formation of urban fine particulate matter, Chem. Rev., 115, 3803–3855, https://doi.org/10.1021/acs.chemrev.5b00067, 2015.
Zhu, X. L., Zhang, Y. H., Zeng, L. M., and Wang, W.: Source Identification of Ambient PM2.5 in Beijing, Res. Environ. Sci., 18, 1–5, https://doi.org/10.3321/j.issn:1001-6929.2005.05.001, 2005 (in Chinese).