the Creative Commons Attribution 4.0 License.
the Creative Commons Attribution 4.0 License.
 | 23 Feb 2023
Microphysics of liquid water in sub-10 nm ultrafine aerosol particles
Xiaohan Li
Ian C. Bourg
Ultrafine aerosol particles with sizes smaller than 50 nm have been shown in recent studies to serve as a large source of cloud condensation nuclei that can promote additional cloud droplet formation under supersaturation conditions. Knowledge of the microphysics of liquid water in these droplets remains limited, particularly in the sub-10 nm particle size range, due to experimental and theoretical challenges associated with the complexity of aerosol components and the small length scales of interest (e.g., difficulty of precisely sampling the liquid–air interface, questionable validity of mean-field theoretical representations). Here, we carried out molecular dynamics (MD) simulations of aerosol particles with diameters between 1 and 10 nm and characterized atomistic-level structure and water dynamics in well-mixed and phase-separated systems with different particle sizes, NaCl salinities, and pimelic acid (PML) organic surface loadings as a function of distance from the time-averaged Gibbs dividing interface or instantaneous water–air interface. We define a sphericity factor (ϕ) that can shed light on the phase-mixing state of nanodroplets, and we reveal an unexpected dependence of mixing state on droplet size. Our results also evidence an ion concentration enhancement in ultrafine aerosols, which should modulate salt nucleation kinetics in sub-10 nm droplets, and provide detailed characterization of the influence of droplet size on surface tension and on water self-diffusivity near the interface. Analysis of water evaporation free energy and water activity demonstrates the validity of the Kelvin equation and Köhler theory at droplet sizes larger than 4 nm under moderate salinities and organic loadings and the need for further extension to account for ion concentration enhancement in sub-10 nm aerosols, droplet-size-dependent phase separation effects, and a sharp decrease in the cohesiveness of liquid water in sub-4 nm droplets. Finally, we show that an idealized fractional surface coating factor (fs) can be used to categorize and reconcile water accommodation coefficients (α*) observed in MD simulations and experimental results in the presence of organic coatings, and we resolve the droplet size dependence of α*.
- Article
(9697 KB) - Full-text XML
- BibTeX
- EndNote


Water is a predominant component of atmospheric aerosol, with mass fraction typically higher than 70 % at moderate to high relative humidities (RH > 40 %), and plays crucial roles in the formation and growth of aerosol particles (Pierce et al., 2012; Karlsson et al., 2022). For example, aerosol liquid water facilitates the partitioning of gas phase water-soluble organic matter into the particle phase and provides a medium for aqueous reactions to form secondary aerosol particles (Faust et al., 2017; Sareen et al., 2017; Frank et al., 2020). In addition, water vapor condensation on nanoparticles can alter the phase state of aerosols and drive aerosol growth to climatically active sizes of about 80 nm and higher (Wu et al., 2018).
Because of water's abundance in atmospheric aerosols, knowledge of the microphysics of aerosol water is essential to resolving key unknowns in aerosol growth and evolution that underlie uncertainties in aerosol–cloud interactions in current weather and climate forecasts (Sato and Suzuki, 2019; Benjamin et al., 2019; Kreidenweis et al., 2019; Lawler et al., 2021). In particular, recent studies have shown that ultrafine aerosol particles with sizes smaller than 50 nm, which are abundant in the troposphere but are conventionally considered too small to affect cloud formation, can serve as an important source of cloud condensation nuclei (CCN) and promote additional cloud droplets under supersaturation conditions (Fan et al., 2018; Williamson et al., 2019). A key challenge in understanding this phenomenon is that the properties of liquid water in such ultrafine aerosol particles remain incompletely understood due to the difficulty of experimentally characterizing bulk and interfacial water in suspended nanodroplets (Ault and Axson, 2017; Bzdek and Reid, 2017; Ohno et al., 2021).
In the absence of detailed observations of aqueous chemistry in nanodroplets (Bzdek et al., 2020a), extant models rely on a simplified conceptual representation of these particles as a bulk aqueous phase, eventually with an accumulation or depletion of solutes in a negligibly thin interfacial region. In short, water in the core of aqueous aerosol particles is treated as bulk water, and the air–particle interface is represented as the surface of bulk water, even in particles that contain only a few hundred water molecules. This simplification underlies widely used models of aerosol growth thermodynamics and kinetics, organic chemistry, water freezing, salt efflorescence, and organic phase separation (McDonald, 1953; Laaksonen and Malila, 2016; Kulmala et al., 1997; Petters and Petters, 2016; Petters and Kreidenweis, 2007, 2008, 2013; Shiraiwa and Pöschl, 2021; Shiraiwa et al., 2012; Liu et al., 2019; Kostenidou et al., 2018; Semeniuk and Dastoor, 2020). For example, the hygroscopic growth of nanoaerosol particles is generally described within the framework of Köhler theory (McDonald, 1953; Laaksonen and Malila, 2016; Kulmala et al., 1997; Petters and Petters, 2016; Petters and Kreidenweis, 2007, 2008, 2013; Estillore et al., 2017), which accounts for osmotic and capillary pressure effects based solely on the average droplet salinity and surface curvature, neglecting any potential impacts of droplet size on water–water and water–solute molecular-level interactions. Similarly, descriptions of the mass transfer kinetics of water at the particle–gas interface largely rely on the Fuchs–Sutugin approximation with a fixed empirical accommodation coefficient (Shiraiwa and Pöschl, 2021; Shiraiwa et al., 2012), which is assumed invariant with droplet phase state, droplet size, and the diffusivity of the investigated compounds despite evidence that its value can vary by several orders of magnitude depending on experimental conditions (Liu et al., 2019; Kostenidou et al., 2018). Despite its widespread application, the conceptual simplification described above has not been rigorously evaluated in the case of aerosol particles. Analogous simplifications are known to be invalid in small pores and in reverse micelles, where liquid water adopts distinct properties when confined to spaces narrower than 10 nm (Bocquet and Charlaix, 2010; Bourg and Steefel, 2012).
Molecular dynamics (MD) simulations have been extensively used to gain insight into the properties of liquid water near interfaces at the atomistic level. In the case of water–air interfaces, most of these studies have focused on flat surfaces relevant to large aerosol particles (Brown et al., 2005; Thomas et al., 2007; D'Auria and Tobias, 2009; Tang et al., 2020; Luo et al., 2020). Comparatively few have examined the properties of liquid water in sub-10 nm aerosol particles (Chowdhary and Ladanyi, 2009; Li et al., 2011; Ma et al., 2011; Lovrić et al., 2016; Sun et al., 2013; Vardanega and Picaud, 2014; Radola et al., 2017; Karadima et al., 2019; Li et al., 2013; Radola et al., 2015, 2021). These simulations have shown that interfacial water adopts distinct properties from those of bulk liquid water and that the surface tension of water droplets decreases with increasing interfacial curvature at the nanometer scale (Li et al., 2010). In addition, interfacial water molecules have been shown to have highly distinct dynamics compared to bulk liquid water, including slower hydrogen bond dynamics and faster diffusion dynamics (Ni et al., 2013; Liu et al., 2004; Wick and Dang, 2005). Finally, a complicating factor revealed by these simulations and by experimental observations is that the shape of nanodroplets often exhibits significant fluctuations and is rarely a perfect sphere, which complicates the determination of interface thickness and water uptake properties (Li et al., 2016; Garrett et al., 2006).
Here, we use MD simulations to characterize nanodroplet structure, water diffusion, and water evaporation energetics in well-mixed and phase-separated systems with different droplet sizes, NaCl salinities, and pimelic acid (PML) organic surface loadings. Our approach builds on previous MD simulation studies of nanoaerosol droplets but includes two distinct features that have the potential to help resolve the challenges identified in previous studies. First, we use two methods of interface characterization – the time-averaged Gibbs dividing interface (Lau et al., 2015) and the instantaneous interface (Willard and Chandler, 2010) – to compare different perspectives on the properties of the interface. Second, we characterize a broad range of structural, dynamic, and energetic properties to help reveal links between these features. We re-examine the validity of the Kelvin equation and Köhler theory and, more broadly, of treating nanodroplet water as a bulk fluid phase. We find that the instantaneous interface enables a novel characterization of the droplet phase state and helps resolve apparent contradictions between experimental observation and MD simulation results on interfacial water dynamics. We also find that the Kelvin equation and Köhler theory accurately describe water microphysics in nanometer-scale droplets under moderate NaCl salinities or PML organic loadings. However, these theories underestimate water activity at droplet diameters below 4 nm and cannot account for the impact of droplet size on ion concentration enhancement in NaCl-bearing droplets and on phase separation in PML-bearing droplets. Overall, our results indicate that the properties of nanoaerosol water deviate strongly from those of bulk water in particles smaller than 4 nm. One implication of this finding is that molecular-scale insight is required to accurately represent the initial stages of droplet nucleation and growth.
2.1 Simulated systems
Molecular dynamics (MD) simulations of droplets containing 100, 500, 1000, 3000, or 5000 water molecules (Nw) with NaCl molality of 0, 1, 2, or 4 m were used to examine the effect of droplet size and salinity on water microphysics in nanoaerosol particles. In addition, droplets of Nw=100, 500, 1000, 3000, or 5000 with low or high organic surface loadings (0.7 or 3.3 pimelic acid molecules nm−2, corresponding to surface loadings of 0.3 or 1.5 monolayers) were used to examine the impact of organic compounds. Sodium chloride is used as a generic representative inorganic salt in aerosol particles for two reasons: first, it accounts for a significant fraction of sea spray and mineral dust aerosols, which constitute the largest mass of particulate matter emitted to the atmosphere (Lewis and Schwartz, 2004; Wise et al., 2007), and, second, relative to other inorganic ions present in aerosol particles, such as and , alkali-halide salts such as NaCl have comparatively well-tested and accurate interatomic interaction potential models, the main input controlling the accuracy of MD simulation predictions (Smith and Dang, 1994; Joung and Cheatham, 2008, 2009). Pimelic acid (PML, C7H12O4) was used as a generic representative organic component because dicarboxylic acids contribute a large fraction of the total identifiable resolved organic mass in fine aerosols (based on mass spectrometry results that are not strictly quantitative due to differences in ionization efficiencies) and have been identified and quantified in both rural and urban air (Hyder et al., 2012; Kawamura and Yasui, 2005; Tran et al., 2000). Furthermore, the ratio of PML (0.57) lies near the midpoint of the range commonly observed for aerosol organic materials (0.2 to 1.0) (Zhang et al., 2007; Hallquist et al., 2009; Song et al., 2018) and near the value below which liquid–liquid phase separation is commonly observed in aerosol particles (∼0.7 to 0.8 for organic–salt–water aerosols, ∼0.6 for organic–water aerosols) (Ciobanu et al., 2009; Song et al., 2012; You et al., 2014; Renbaum-Wolff et al., 2016; Rastak et al., 2017; Song et al., 2018). These observations suggest that NaCl and PML should have the potential to mimic key impacts of salts and organic substances in nanoaerosol droplets. We emphasize, however, that our focus is on identifying and characterizing deviations from ideality in the presence of a generic salt (NaCl) or organic compound (PML) as a function of droplet size and solute loading. Additional studies would be needed to establish the sensitivity of our results to the type of salt or organic compound. The sizes of droplets studied in this work range from 2 to 8 nm (Table A1).
2.2 System preparation and MD simulations
Molecular dynamics simulations were performed with the GROMACS program (Abraham et al., 2015) using cubic simulation cells subject to periodic boundary conditions in all three directions. The edge length of the simulation cell is set to be at least 6 nm larger than the droplet diameter to avoid interactions between the droplet and its periodic images (Fig. A1). Interatomic interactions were represented using the SPC/E model for water molecules (Berendsen et al., 1987), the Joung–Cheatham model for Na+ and Cl− ions (Joung and Cheatham, 2008), and the OPLS-AA model for pimelic acid molecules (Jorgensen et al., 1996). In all simulations, bonds involving H atoms were restrained using the LINCS algorithm (Hess, 2008). Simulations were carried out in the canonical (a.k.a. NVT) ensemble with temperature maintained at 298.15 K using the Nosé–Hoover thermostat (Evans and Holian, 1985) and with the overall translational and rotational momentum of the simulated system set to zero. Coulomb and van der Waals interactions were resolved using a real space cutoff of 1.2 nm with a particle mesh Ewald sum treatment of long-range Coulomb interactions. Each system was simulated with a time step of 1 fs for a total simulation time of 105 ns, comprised of 5 ns for equilibration and 100 ns for data analysis. We note that the Ewald sum treatment of long-range Coulomb interactions used in our study is commonly used in MD simulations, including in simulations of aerosol particles, but care should be taken as it introduces artifacts that remain incompletely examined, particularly in the dynamics of charged and dipolar species (Frenkel and Smit, 2001; Hub et al., 2014).
2.3 Droplet structure
To calculate the radius of the water droplets in most systems (except at high organic loading), the time-averaged water number density profile ρ(r) was obtained for each droplet as a function of distance from the droplet center of mass. Results were fitted to the relation (Thompson et al., 1984)
where ρl is the liquid number density, ρv is the vapor number density, and di is the interfacial width. The density profile was used to locate the equimolar (Gibbs) dividing surface, which corresponds to a vanishing adsorption in a one-component system. The radius Re of the equimolar dividing surface was calculated, using numerical quadrature, based on the relation
For droplets with high organic loading, the radius was calculated instead based on the molecular volumes of water and pimelic acid:
where Nw is the number of water molecules, Norg is the number of PML molecules, ρw is the bulk water density (34.02±0.19 molec. nm−3), and ρorg is the bulk PML density (4.373±0.003 molec. nm−3) calculated in the conditions of our simulations.
2.4 Diffusion coefficient
The self-diffusion coefficient of water molecules was calculated by analyzing water trajectories at 1 ps intervals during 25 ns simulations for all droplets. To analyze the dependence of diffusion on position relative to the interface, we binned water molecules into different 3 Å thick layers based on their distance relative to the interface. Any molecule initially present in a specified layer that passed through the layer boundaries no longer contributed to the calculation. The self-diffusion of water molecules was investigated in directions parallel and normal to the interface.
The parallel diffusion coefficient (D∥) was calculated using the Einstein relation (Liu et al., 2004):
where is the mean square displacement (MSD) of water molecules in directions parallel to the interface, averaged over all molecules of interest remaining in the ith layer during the entire time interval τ. The infinite-time limit in Eq. (4) was approximated by evaluating the slope of MSD versus τ for τ=2 to 6 ps based on the linear relationship between MSD and τ on this timescale; use of longer timescales yielded less precise results as fewer molecules remained consistently located in the ith layer (Fig. A6).
The diffusion coefficient normal to the interface (D⟂) was evaluated using the anisotropic Smoluchowski equation in the r direction:
where is the conditional probability distribution function, , kB is Boltzmann's constant, T is absolute temperature, is the mean force acting on the molecule, and is the potential of mean force (PMF) calculated from the water density profile. Values of D⟂ in different water layers were determined by matching the water survival probabilities calculated from MD simulation and from the numerical solution to the Smoluchowski equation as described by Wick and Dang (2005).
2.5 Surface tension
Surface tension was calculated by analyzing the normal component of the Irving–Kirkwood pressure tensor (Irving and Kirkwood, 1950) at 1 ps intervals during 25 ns simulations for all droplets. According to the formula given by Thompson et al. (1984), the normal pressure tensor PN(r) can be written as
where PK(r)=kBTρ(r) is the kinetic term, is the configuration term, S is the surface area of the spherical surface of radius r, and fk is the normal component of the force between a pair of molecules acting across the surface S. The surface tension is evaluated as
where W is the work of formation as described by Zakharov et al. (1997):
In Eq. (8), Pβ is the vapor pressure of the droplet, and Rβ is the radius of a sphere in the vapor region, which can be approximated as the equimolar radius Re. We note that the surface tension should be rigorously calculated at the radius Rs, where the surface tension applies (McGraw and Laaksonen, 1997). Our use of Re in Eq. (7) introduces a systematic error of less than 8 % in the σ calculation for droplets with Nw≥500 (see Appendix A for more details). This potential source of systematic error is commensurate with the statistical error of our predicted σ values as shown by our reported error bars of %.
2.6 Free energy of evaporation
The potential of mean force (PMF) associated with the evaporation of water molecules as a function of distance r from the droplet center F(r) was calculated using two methods. The first method consisted in calculating the PMF based on the water density profile during 100 ns equilibrium simulations by
The second method is the well-known umbrella sampling technique (Torrie and Valleau, 1977), whereby F(r) is calculated by successively tethering a single water molecule at different distances from the droplet center of mass using a harmonic potential, here with a force constant of 1000 kJ mol−1 nm−1 and 100 ns of simulation time at each tethering distance. The evaporation free energy of water molecules was calculated as the free energy difference between a water molecule in the vapor phase and in the liquid phase as
2.7 Accommodation coefficient
To calculate the accommodation coefficient for a single droplet, the phase state of every water molecule in the system was recorded during a 100 ns trajectory with a time step of 1 fs. The phase state of individual water molecules was divided into three categories (Varilly and Chandler, 2013): (1) liquid phase (state −1) – any water molecule that is hydrogen-bonded to at least one water molecule and is at most 4 Å away from the nearest water molecules (where the “position” of a water molecule refers to the position of its center of mass), (2) vapor phase (state 1) – any water molecule that has no hydrogen-bonded water neighbors and is more than 8 Å away from its nearest water neighbor, and (3) intermediate phase (state 0) – any water molecule that is neither in state 1 nor in state −1. An accommodation event is identified if the state of a water molecule changes from 1 at time step t1 to −1 at time step t2, without adopting a non-zero state value during the time interval (t1, t2). A reflection event is identified if the state of a single water molecule changes from 1 at t1 to 1 at t2 and stays in state 0 during the time interval (t1, t2). The accommodation coefficient α was calculated as
where Nacc is the number of accommodation events and Nref is the number of reflection events. The reported normalized accommodation coefficient α* was calculated as , where α0,w (the value for the flat surface of pure water) was approximated as the α value of the largest simulated pure-water droplet of Nw=5000.
3.1 Morphology and phase state characterization
Figure 1a–e show representative snapshots of simulated droplets that illustrate the variety of predicted morphologies and phase-mixing states. Additional droplet snapshots are presented in Fig. A3. For NaCl droplets, Na+ and Cl− ions are repelled from the water–air interface and distributed inside the droplets in all simulations. These ions are crystallized in the center of the droplet at a 4 m concentration, forming a phase state illustrated in Fig. 1e, whereas they are well mixed with water molecules at 1 and 2 m concentrations with the phase state illustrated in Fig. 1a. The NaCl solubility implied by our results (between 2 and 4 m) is consistent with that observed in previous MD studies that examined bulk NaCl solutions using the same interatomic potential (Mester and Panagiotopoulos, 2015a, b). For droplets with PML, the arrangement of organic molecules varies with droplet size and organic surface loading. At low organic loading, PML molecules are predominantly adsorbed at the water–air interface with minimal clustering, as illustrated in Fig. 1b. At high organic loading, when droplet size is sufficiently large (diameter D≥4.1 nm), PML molecules retain their affinity for the water–air interface and cluster at the droplet surface, forming the “engulfed” morphology shown in Fig. 1c. In smaller droplets with high organic loading, however, the organic molecules cluster in the center of the droplet and displace water molecules towards the surface as shown in Fig. 1d. This transition suggests the existence of a threshold, at a droplet diameter of 3 to 4 nm, in the competition between water hydrogen bonding, which promotes water clustering, and hydrophobic attraction between PML molecules, which promotes organic clustering. Our results are consistent with previous findings that the hydrogen bond network formed by bulk liquid water involves cooperativity over length scales of 1 to 2 nm and becomes significantly weaker upon attenuation of long-range water–water orientational correlations (Alper and Levy, 1989; Ohmine and Tanaka, 1993).
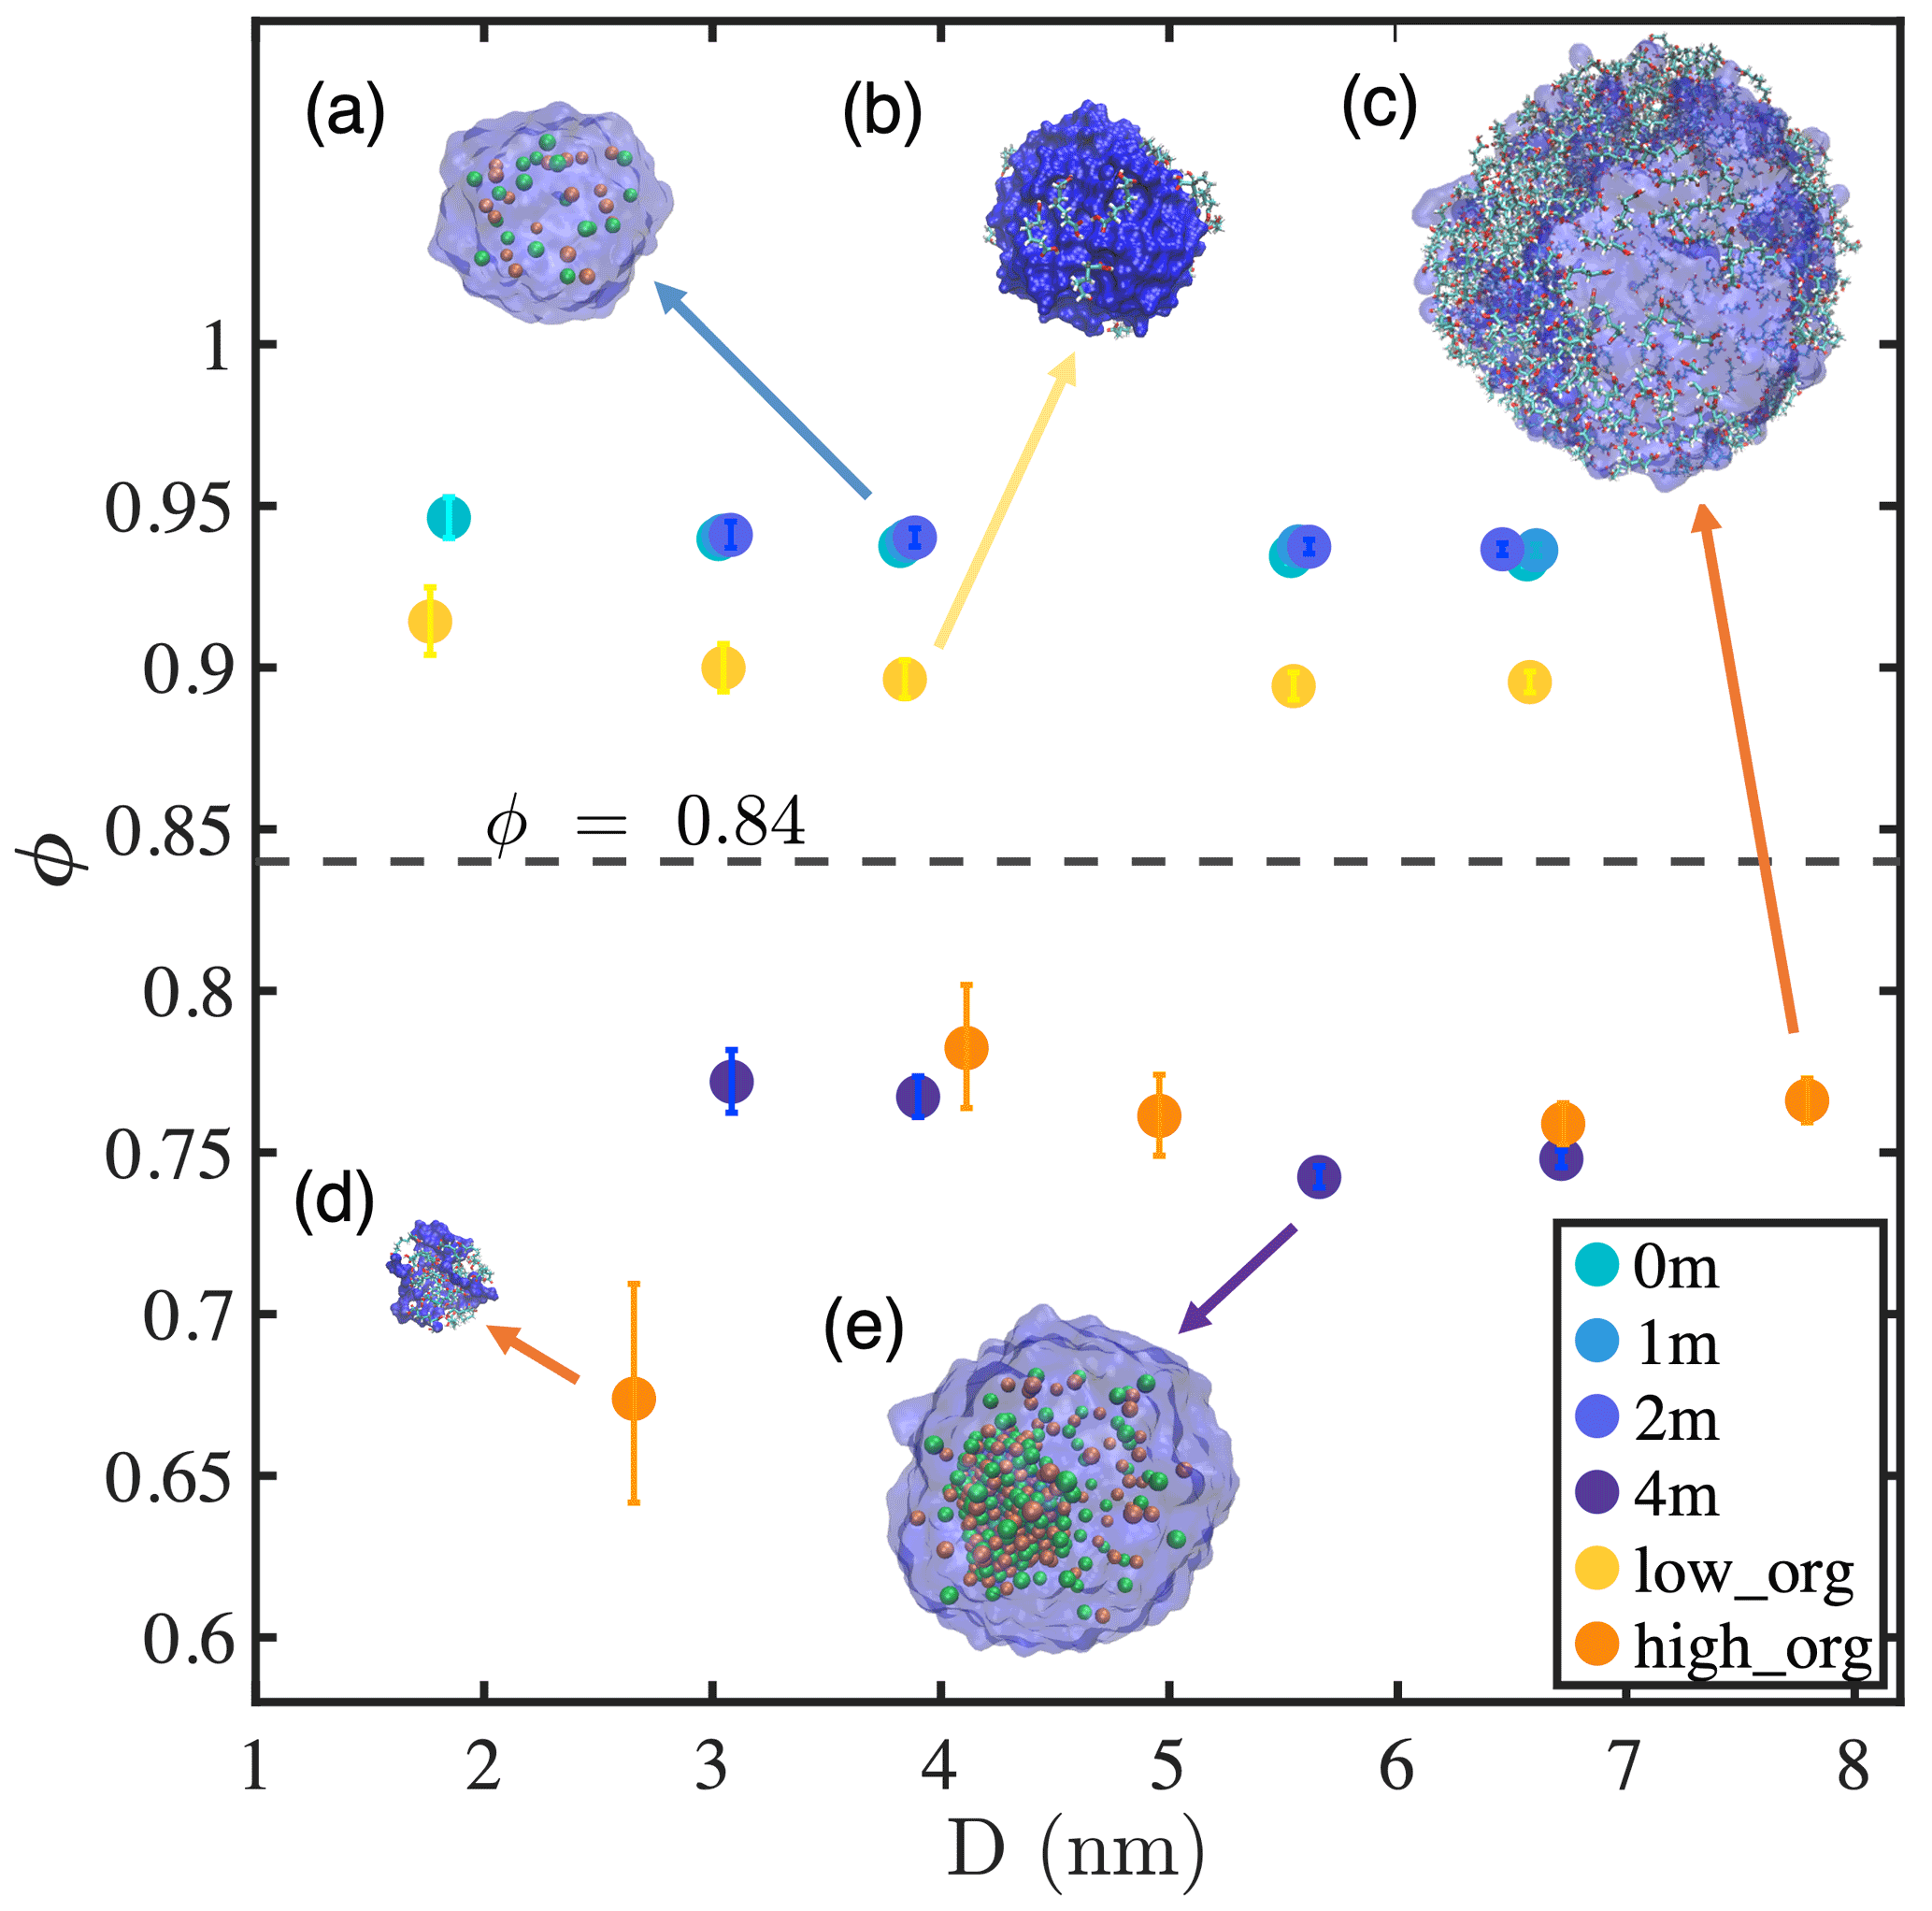
Figure 1Sphericity factor (ϕ) of nanodroplets with different compositions as a function of droplet diameter. Simulation snapshots are shown for the droplets with water (blue color), Na+ (light-orange spheres), Cl− (green spheres), and pimelic acid (colored chains): (a) 1 m NaCl with Nw=1000, (b) low PML surface loading with Nw=1000, (c) high PML surface loading with Nw=5000, (d) high PML surface loading with Nw=100, and (e) 4 m NaCl with Nw=3000.
To characterize the various phase states identified above, we propose a quantitative variable, referred to hereafter as the sphericity factor (ϕ), defined as the ratio of the surface area of a perfect spherical water droplet Sw,sp to the instantaneous interface surface area formed by water molecules with the same amount of water Sw,inst:
The ϕ value is in the range of (0, 1] and reflects the tendency towards water clustering. In particular, ϕ=1 indicates that water forms a perfect spherical droplet with no capillary waves or disruption due to phase separation.
Figure 1 presents the ϕ values of all simulated systems as a function of droplet diameter D. By visual inspection of our simulation trajectories, we identify droplets as being in a well-mixed state if no single phase is formed except for the water cluster and in a phase-separated state if an additional phase exits. For the conditions examined in this study, a threshold at ϕ≈0.84 (illustrated by the horizontal gray dashed line in Fig. 1) distinguishes between well-mixed (above the threshold) and phase-separated droplets (below the threshold). For well-mixed systems, at a fixed ion concentration or organic surface excess, ϕ decreases slightly with increasing droplet size, indicating that larger droplets have a more fluctuating water–air interface. This observation is consistent with our results showing that the water–air interface width observed in time-averaged density profiles increases with droplet size (Table A1) and agrees with the expectation that the capillary wave contribution to interfacial fluctuation increases with interfacial area (Ismail et al., 2006; Lau et al., 2015). We also find that ϕ increases with ion concentration but decreases with organics at the interface, which indicates that NaCl reduces but PML enhances interfacial fluctuations. This observation is consistent with the variations in interfacial width with salinity and organic surface loading (Table A1) and with the expectation that NaCl and PML should, respectively, increase or decrease surface tension because of their negative (NaCl) or positive (PML) adsorption at the water–air interface, as confirmed below.
Phase-separated systems (i.e., droplets with either 4 m NaCl or high PML loading) also show a small decrease in ϕ with increasing droplet size in most cases. A significant exception is presented by the smallest droplet with high organic loading, which shows a sharp decrease in ϕ with decreasing droplet size between D=4.1 and 2.7 nm. This decrease in ϕ coincides with a change in droplet phase-mixing state from a water-core structure at D≥4.1 nm to an organic-core structure at D=2.7 nm and shows that the phase-mixing state of nanodroplets can abruptly vary with particle size. Organic particles with sizes below 5 nm and different PML–water ratios, which lie in the abovementioned phase-mixing transition region and may shed light on the early stages of hygroscopic growth of secondary organic aerosols (Qin et al., 2021), will be examined in more detail in an upcoming study.
3.2 Interfacial structure of nanodroplets
To gain additional insight into the phase state behaviors outlined above, the radial density profiles of water, ions, and PML molecules in our nanodroplets were calculated relative to either the time-averaged interface (Gibbs dividing surface) (Lau et al., 2015) or the instantaneous interface (Willard and Chandler, 2010). As shown in previous studies of flat water–air interfaces (Willard and Chandler, 2010) and in Fig. A4, atomic density profiles obtained under the instantaneous interface scheme provide more detailed information about molecular structure at the interface (e.g., water and solute density layering). Figure 2a shows ion density relative to the instantaneous interface in 1 m NaCl droplets with different numbers of water molecules. Our results show that both Na+ and Cl− ions are negatively adsorbed at the water–air interface, but Na+ is more strongly excluded from the interface than Cl− such that the interface is negatively charged, in agreement with previous studies of flat water–air interfaces (Jungwirth and Tobias, 2000; Underwood and Greenwell, 2018) (see Fig. A4 for more density profiles). Although all droplets highlighted in Fig. 2a were initialized as 1 m uniformly mixed NaCl solutions, ion concentrations are strongly enhanced (up to >2 times the initial concentration) in the core of the droplets at equilibrium due to the negative adsorption of ions at the water–air interface. This ion concentration enhancement increases with decreasing droplet size, particularly in droplets smaller than 4 nm (Nw<1000). We note that the interface propensity of halide anions varies with anion size and polarizability and that the simple interatomic potential models used here may underestimate the affinity of halide anions for the interface (Levin et al., 2009; Jungwirth and Tobias, 2006; Caleman et al., 2011). However, the negative adsorption of alkali cations predicted here is well established (Underwood and Greenwell, 2018; Levin et al., 2009; Jungwirth and Tobias, 2006; Caleman et al., 2011), and the overall negative adsorption of NaCl salt at the water–air interface is correctly predicted as shown by previous MD simulation results on the salinity dependence of water–air interfacial tension (Jungwirth and Tobias, 2001, 2006; D'Auria and Tobias, 2009; Horinek et al., 2009; Sun et al., 2012).
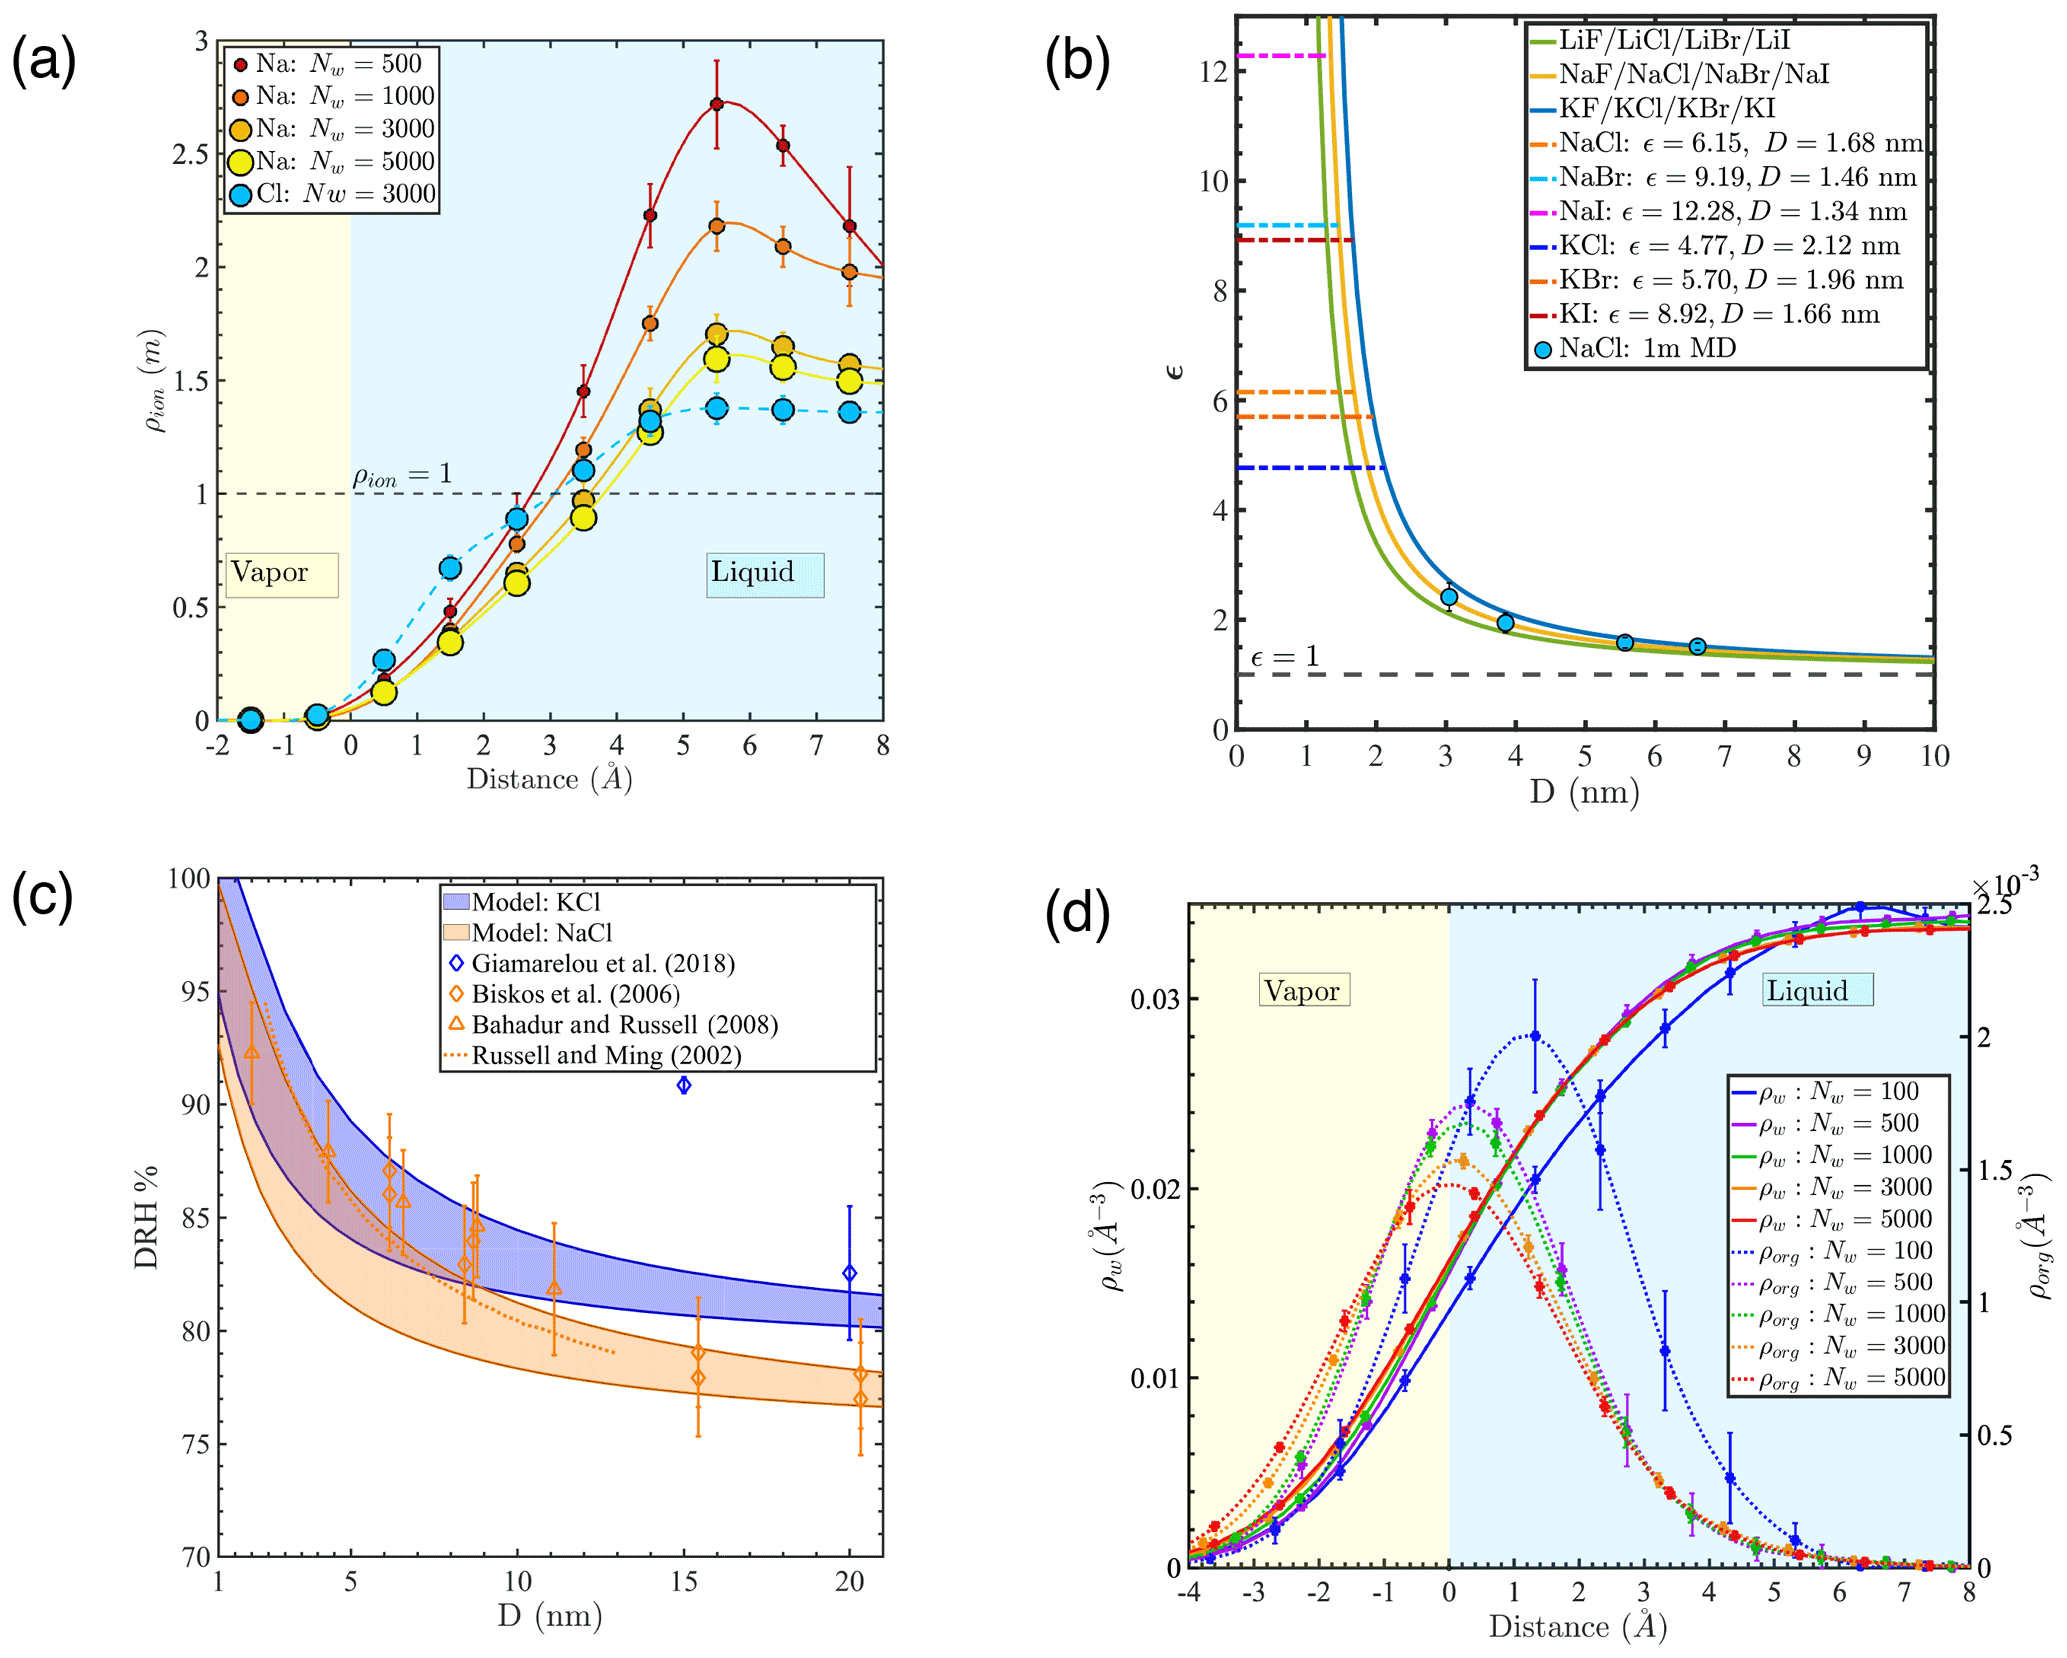
Figure 2(a) Density profiles of Na+ and Cl− ions (ρion) relative to the instantaneous interface in 1 m NaCl droplets with different numbers of water molecules. (b) Salt concentration enhancement factor ϵ as a function of droplet diameter D for droplets with an average salinity of 1 m (blue circles: MD simulation results; lines: predictions for different salts based on a simplified model, whereby the salt exclusion distance at the water–air interface equals 1.2 times the first hydration radius of the cation; horizontal dashed lines: ϵ values where different salts would be expected to precipitate, based on their solubility in bulk liquid water, in a droplet with an average salinity of 1 m). (c) Deliquescence relative humidity (DRH) of KCl and NaCl nanoparticles as a function of diameter (D): shaded area marks model predictions obtained in this study; blue and orange diamonds are previous experimental results for KCl and NaCl (Biskos et al., 2006a; Giamarelou et al., 2018); orange triangles are previous MD simulation results for NaCl (Bahadur and Russell, 2008); and the orange dashed line is the NaCl DRH prediction based on a thermodynamic model (Russell and Ming, 2002). (d) Atomic density profiles of water molecules (ρw) and PML molecules (ρorg) relative to the Gibbs dividing surface under the time-averaged interface scheme at low organic loading.
To illustrate the expected effect of droplet size on ion concentration, we define a salt concentration enhancement factor (ϵ) as the ratio between salt concentration in the core of the droplet and average salt concentration in the entire droplet. Predicted ϵ values for different alkali-halide salts are shown in Fig. 2b based on the simplifying assumption that the salt is excluded from the vicinity of the water surface, in a region with a thickness equal to 1.2 times the first hydration radius of alkali cations (see Appendix B for sensitivity analysis), quantified as the first minimum of the ion–water radial distribution function predicted using the SPC/E water model and compatible ion models (the first hydration shell radii of alkali cations Li+, Na+, and K+ are 0.28, 0.32, and 0.36 nm, respectively) (Joung and Cheatham, 2009). Our simplistic model, shown as solid curves in Fig. 2b for different salts, is consistent with our MD simulation predictions (blue circles, shown for our systems with 1 m NaCl), indicating that the length scale associated with salt exclusion at the water–air interface is invariant with surface curvature. Horizontal lines in Fig. 2b show the ϵ values necessary to achieve crystallization of different salts based on their experimental solubility (Joung and Cheatham, 2009) in droplets where the average concentration is 1 m. Overall, both our simplistic model and our detailed atomistic simulation predictions indicate that the concentration enhancement of simple alkali-halide salts is well above 1.25 for sub-10 nm droplets and may be more than 10 for droplets with a diameter below 1.5 nm. In other words, in droplets with common sea-salt ionic species, crystallization should occur more readily than expected based on the average salt concentration, particularly at small droplet sizes. Our results suggest that the tendency for salt deliquescence should be diminished and salt efflorescence should be enhanced in ultrafine nanoparticles. The ion concentration enhancement discussed here is consistent with experimental findings that both the deliquescence and efflorescence relative humidity (DRH, ERH) of NaCl and KCl particles increase as droplet size decreases from 60 nm to less 10 nm, with a sharper decrease at smaller droplet sizes (Biskos et al., 2006a, b; Giamarelou et al., 2018; Hämeri et al., 2001). Shaded areas in Fig. 2c show the KCl and NaCl DRH as a function of nanoparticle diameter predicted from the ion concentration enhancement model discussed above (see Appendix C for calculation details). Our predictions are consistent with both the size dependence of NaCl DRH reported in previous studies (Biskos et al., 2006a; Bahadur and Russell, 2008; Russell and Ming, 2002) and previous observations that KCl has a larger DRH than NaCl (Giamarelou et al., 2018). Overall, the concentration enhancement discussed above may help explain experimental observations of a size dependence of aerosol shape, in which nanoaerosol particles generated from well-controlled sea spray chambers are more cubic at smaller sizes but more spherical at larger sizes (Zieger et al., 2017). Our observations indicate that the ϵ factor becomes particularly significant for sub-10 nm particles and should be taken into consideration in predictions of salt microphyics in ultrafine particles.
Figure 2d shows the density profiles of water and PML molecules based on the location of their center of mass under the time-averaged interface scheme at low organic surface loading. The PML density profiles show a sharp peak near the water–air interface, confirming the high affinity of the organic compound for the interface. The location of the PML density peak shifts into the liquid water region with decreasing droplet size, particularly at sizes below 3 nm (Nw<500). This observation suggests that the hydrophilic character of the water phase decreases with decreasing number of water molecules in the droplet, as already noted above in the case of the smallest droplet at high organic loading. The PML density curves at high organic loading (Fig. A5d) reveal a more complex and variable pattern of organic–water phase-mixing states, in agreement with the transition between water- and organic-core morphologies identified above.
3.3 Water diffusion kinetics in nanodroplets
Water diffusion in nanodroplets is a fundamental phenomenon that influences interfacial mass fluxes and chemical transformation rates (Chan et al., 2014; Slade and Knopf, 2014; Julin et al., 2013; Evoy et al., 2020). Details of this phenomenon are complicated by the inherently anisotropic and non-uniform nature of water diffusion near the interface. In this study, the water self-diffusion coefficient is calculated in discrete 3 Å thick water layers in directions parallel (D∥) or normal (D⟂) to the interface. As explained in the Methods section, we calculated D∥ using the Einstein relation and D⟂ using the anisotropic Smoluchowski equation (Liu et al., 2004). Diffusion coefficients were calculated relative either to the center of mass of the droplet (“com” scheme) or to the instantaneous interface (“inst” scheme). As expected, both schemes yield identical results for D∥, while for D⟂ the com scheme yields larger values due to the presence of capillary waves at the interface (Appendix D2.1). The following discussion focuses primarily on our predicted D∥ values. Our D⟂ values are somewhat less precise and are discussed in Appendix D2.2.
Figure 3a shows D∥ in different simulated systems relative to the distance from the Gibbs dividing surface. Our results show that D∥ values are bulk-liquid-like at distances > 9 Å (i.e., >3 water layers) from the interface for all well-mixed systems. The D∥ values at the interface are 2 to 3 times larger than in the core of the droplet, with potential implications for mass transfer and reaction kinetics at the interface. In addition, D∥ in the droplet core decreases from 0.25 to 0.15 Å2 ps−1 as ion concentration increases from 0 to 2 m, while D∥ at the interface decreases with increasing PML surface loading. The D∥ difference between interfacial and bulk liquid regions and the D∥ change with salinity and organic addition observed in our results are consistent with trends reported in previous studies (Kim et al., 2012; Paul and Chandra, 2005; Tsimpanogiannis et al., 2019) as shown in Fig. 3a. In all well-mixed NaCl droplets (1 or 2 m), we consistently observe a droplet size dependence of water diffusion near the interface as illustrated in Fig. 3b. More precisely, D∥ at the interface decreases with droplet size, while D∥ in the few monolayers below the interface increases with droplet size. This observation is consistent with our results showing that for droplets containing water and NaCl, smaller droplets have lower ion density at the interface and greater ion density in the droplet core. The minor offset in Fig. 3a, between our D∥ values in the bulk-liquid-like region and those reported by Kim et al. (2012) at the same salinity (calculated in bulk liquid NaCl solutions), is also consistent with the ion density enhancement in the droplet core noted above. Finally, the faster water diffusivity at the interface observed in the case of D∥ is not observed in the case of D⟂, as discussed in Appendix D2. In fact, results obtained under the inst scheme yield to 0.17 Å2 ps−1 near the interface; i.e., water diffusivity normal to the interface is smaller than in the droplet core, in agreement with studies showing slower reorientational dynamics of water near hydrophobic surfaces (Laage et al., 2009; Fayer and Levinger, 2010; Fayer, 2012).
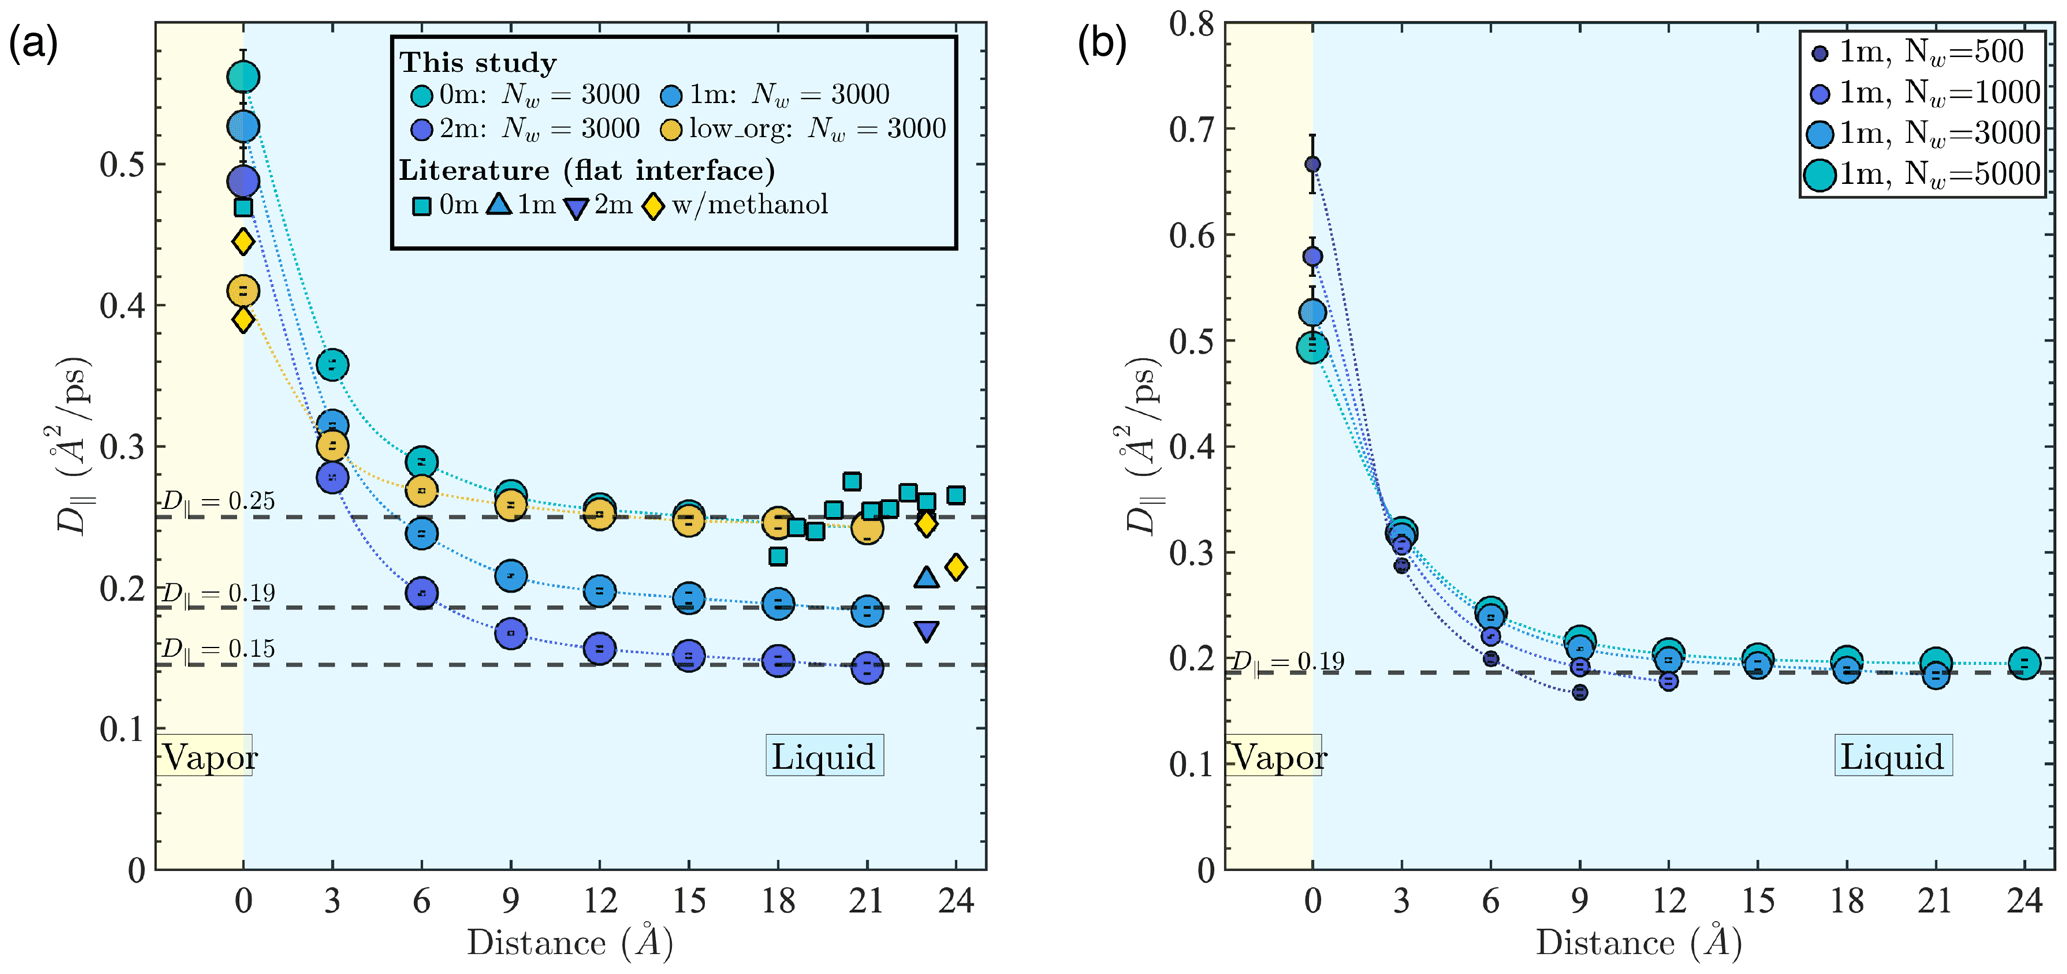
Figure 3Water diffusion coefficient in the direction parallel to the interface (D∥) as a function of distance from the time-averaged interface (com scheme) (a) in 5.5 nm droplets (Nw=3000) with different aqueous chemistries and (b) in 1 m NaCl droplets with different water contents (symbol sizes are scaled with droplet diameter). Literature data shown in panel (a) were collected from previous MD simulation studies using the SPC/E water model at 0 m (Kim et al., 2012; Paul and Chandra, 2005; Tsimpanogiannis et al., 2019) and 1 and 2 m (Kim et al., 2012) and for a methanol–water solution at low organic concentrations (Paul and Chandra, 2005). All literature D∥ values were obtained for systems with a flat water–air interface.
3.4 Surface tension of nanodroplets
Surface tension is an important factor that governs the hygroscopic growth and the activation of aerosol particles and is incorporated in climate models through Köhler theory. However, the surface tension of nanoaerosol particles, especially at the sub-10 nm scale, is not well known and remains arduous to characterize experimentally (Noziere et al., 2014; Bzdek et al., 2016, 2020b; Lee and Tivanski, 2021). Figure A12 shows surface tensions (σ) calculated for our different droplets based on the Irving–Kirkwood pressure tensor (Irving and Kirkwood, 1950; Thompson et al., 1984). A representative example of the instantaneous normal pressure tensor is shown in Fig. A11. All calculated σ values are also tabulated in Table A1. We note that σ values reported in different MD simulation studies differ significantly, even for a pure-liquid-water system (by up to ≈20 mN m−1), depending on the interatomic potential models and surface tension determination methods employed (Bahadur et al., 2007; Bahadur and Russell, 2008; Li et al., 2010; Lau et al., 2015). For well-mixed NaCl droplets with 0, 1, and 2 m NaCl concentrations, our results show that surface tension increases with droplet size and ion concentration and approaches 55, 56, and 58 mN m−1, respectively, when Nw≥3000 (i.e., D>5 nm). The predicted increase in surface tension with NaCl salinity is consistent with experimental values reported for flat water–air interfaces (1.3 to 1.8 mN m−1 per 1 m of salinity) (Hård and Johansson, 1977; Washburn et al., 1926; Abramzon and Gaukhberg, 1993; Tuckermann, 2007). To highlight the impacts of curvature, salinity, and organic coatings on σ and compare our results with those of other studies, we report normalized surface tension values in Fig. 4, where σ0 is the surface tension reported for the flat pure-liquid-water–air interface in the same study. Our σ0 value is 58 mN m−1, in agreement with previous estimates of the surface tension of SPC/E water (Ismail et al., 2006). The solid light-blue line in Fig. 4 shows the fit of our results for 0 m droplets to the second-order Helfrich expansion, , where δ0 is the Tolman length, r is the droplet radius, and c is the rigidity coefficient (Wilhelmsen et al., 2015). The best fit is achieved using δ0=0.06 nm (95 % confidence interval [0.032, 0.094] nm) and nm2 (95 % confidence interval [−0.096, 0.045] nm2). The positive value of δ0 in this study, which indicates that σ increases with droplet size, agrees with the trends observed in other studies as shown in Fig. 4. In addition, although the absolute σ values reported in different studies differ depending on the choice of simulation methods, values from previous studies (Bahadur and Russell, 2008; Li et al., 2010; Lau et al., 2015) agree well with our simulation results and collapse near the light-blue fitting curve. This observation shows that, for pure-water droplets, σ decreases sharply as droplet size decreases below 4 nm and can even be less than half of σ0 at sizes below 1 nm. For droplets with PML organic surface loading, surface tension not only shows the same trend with particle size as for pure-water droplets but also decreases with organic surface loading for all systems where the droplet has a water core (Nw≥500), in agreement with experimental observations that water surface tension decreases with organic adsorption at the water–air interface (Tuckermann, 2007; Kiss et al., 2005). An exception is observed in Fig. 4 in the case of the smallest droplets with low and high PML loadings (leftmost yellow and orange circles in Fig. 4), which both contain the same amount of water (Nw=100), yet the droplet with high organic loading has a higher surface tension. The surface tension of the organic-core configuration (i.e., the smallest droplet with high organic loading) is close to that observed for droplets of pure PML (on the order of 30 mN m−1 at D≈3 nm), suggesting that the unexpected increase in surface tension with organic loading is associated with the observed morphology reversal from a water core to an organic core. In short, the common assumption in aerosol microphysics studies that surface tension invariably decreases with increasing organic loading in aqueous aerosols appears invalid, at least in some cases, for droplets smaller than 4 nm. This finding may have important implications, in particular, in understanding the initial nucleation and growth of secondary organic aerosols (Enghoff and Svensmark, 2008; Kürten et al., 2018; Guo et al., 2020).
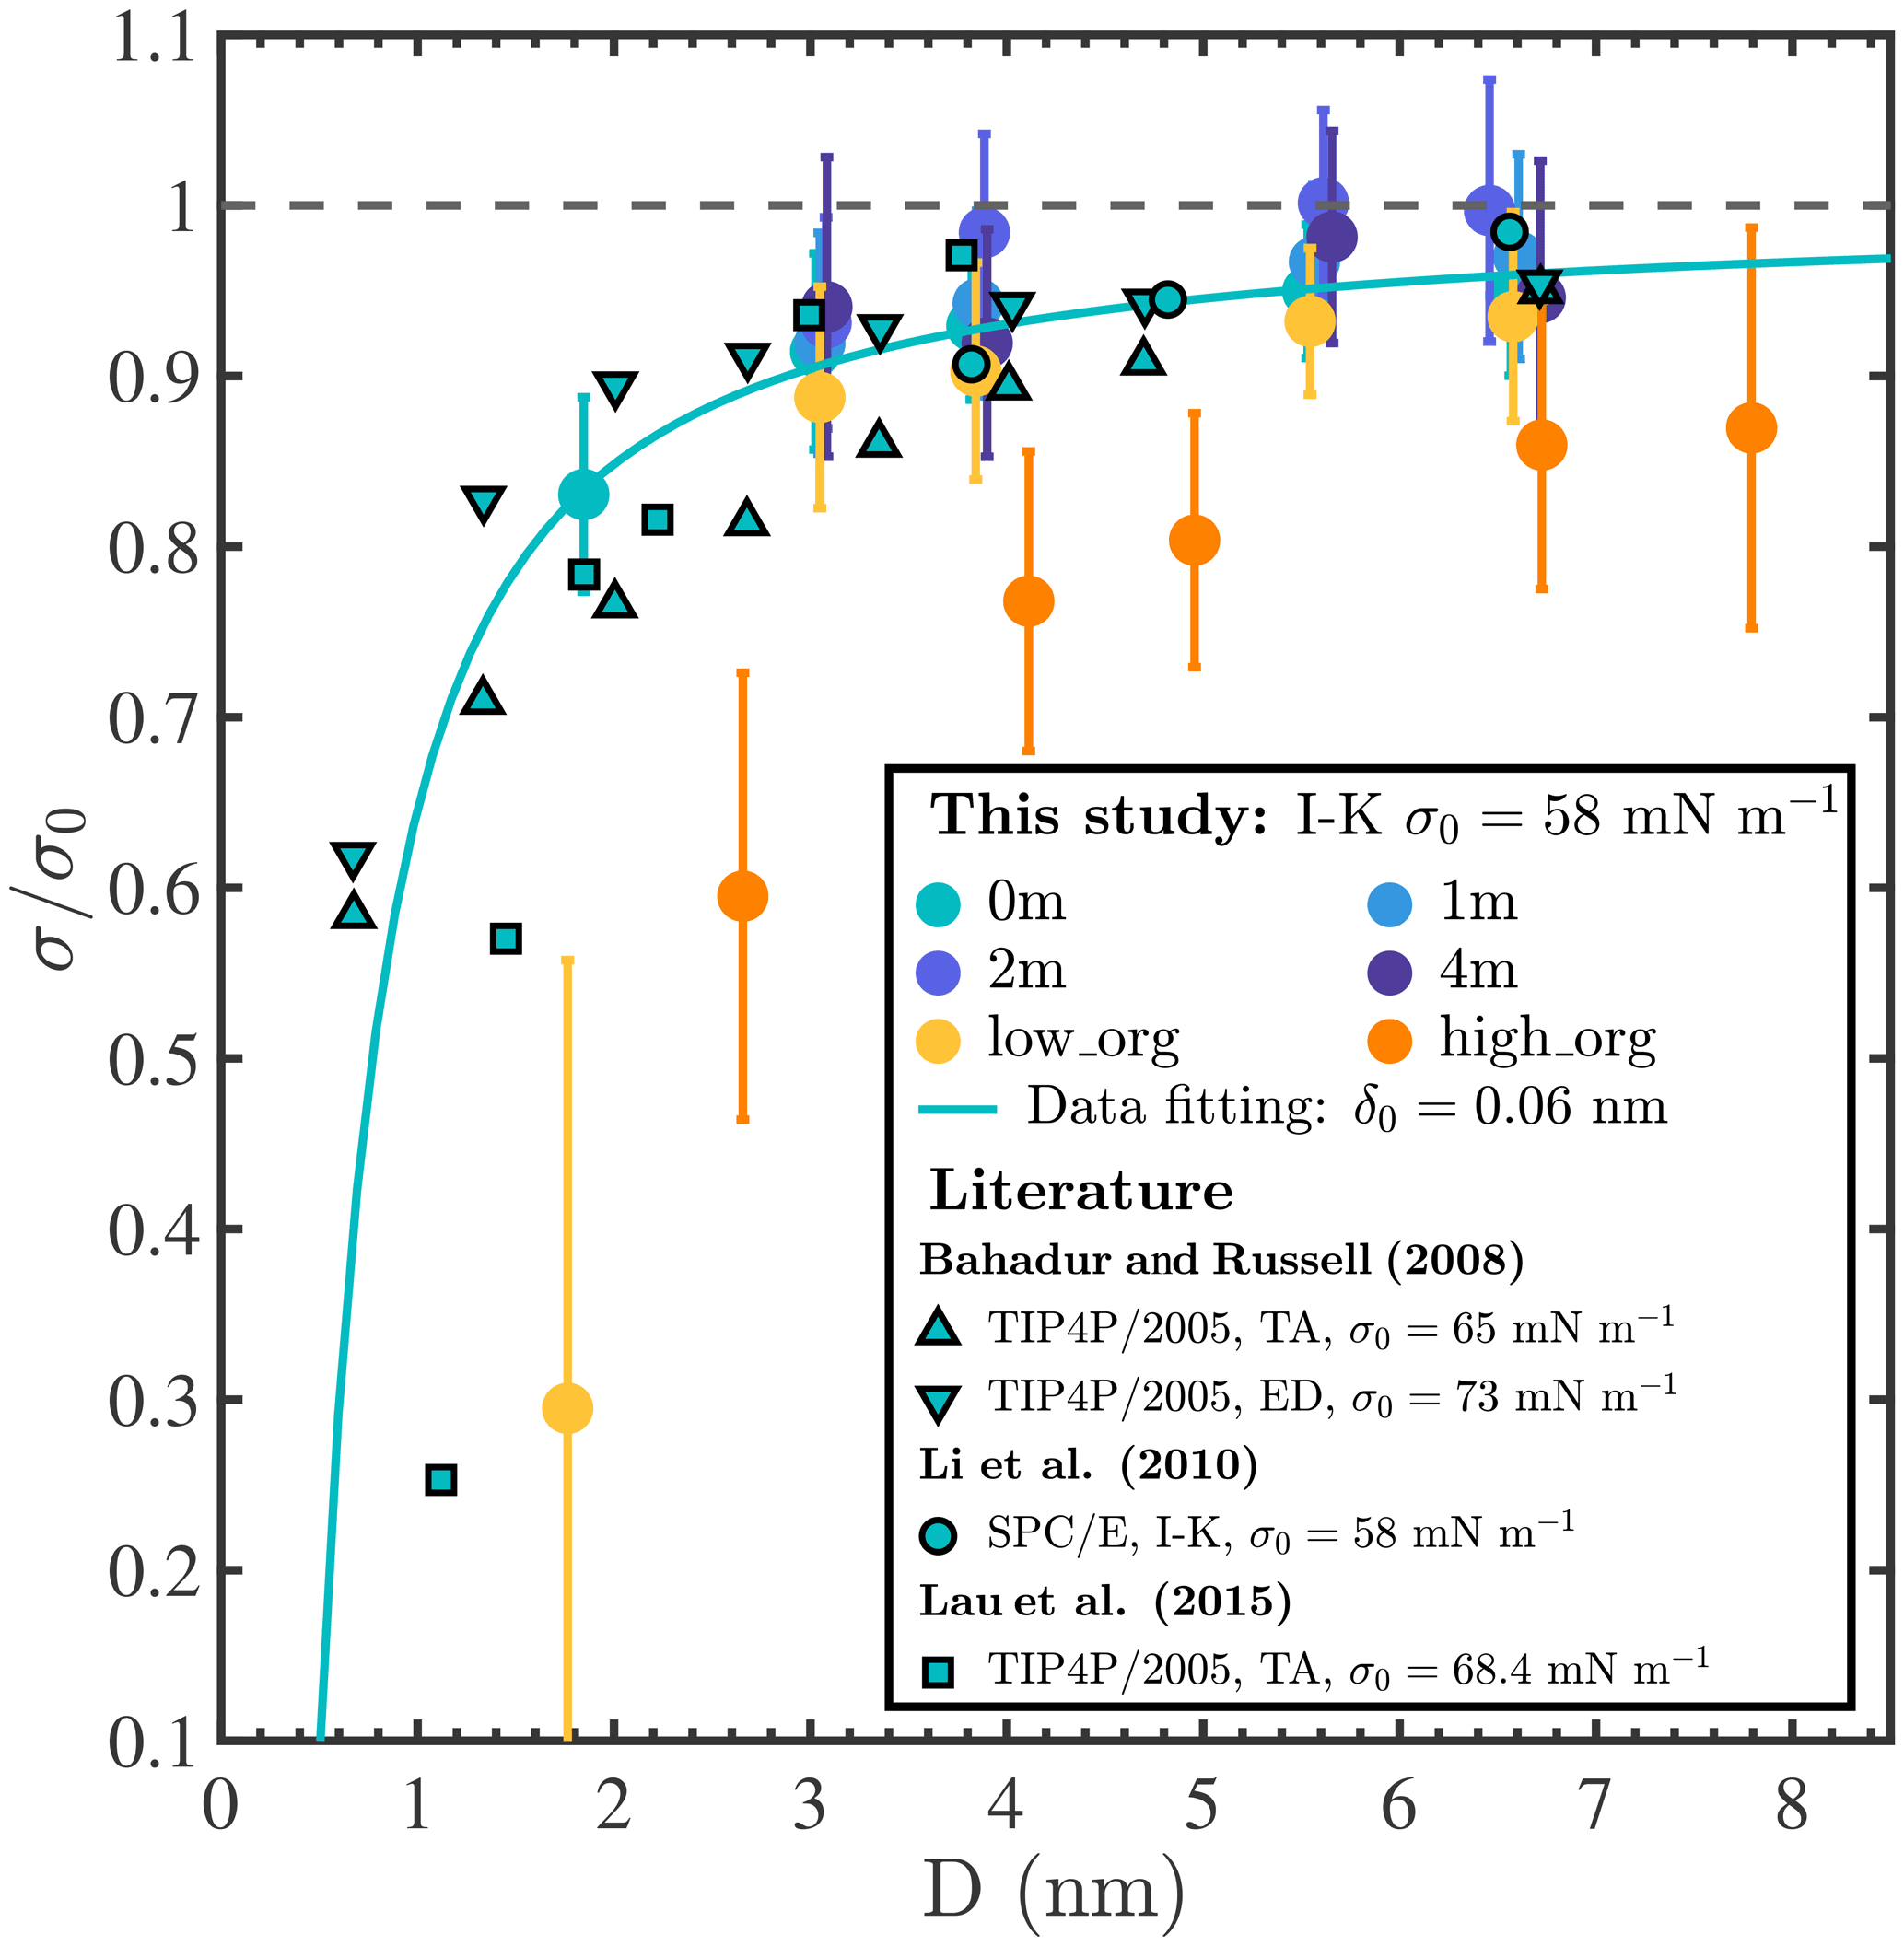
Figure 4Normalized surface tension () of droplets as a function of droplet diameter (D). Colored circles show results obtained in this study using the SPC/E water model and the Irving–Kirkwood (I–K) pressure tensor method; symbols with black edges show previous MD simulation results obtained for pure-water droplets at ambient temperature using the TIP4P/2005 or SPC/E water models and the test-area (TA), energy difference (ED), or Irving–Kirkwood (I–K) methods (Bahadur and Russell, 2008; Li et al., 2010; Lau et al., 2015); the light-blue solid line shows a fit of our 0 m surface tension data to the second-order Helfrich expansion, yielding the Tolman length δ0=0.06 nm.
3.5 Validity of the Kelvin equation
The evaporation free energy δF, i.e., the free energy difference associated with transferring a single water molecule from the droplet phase to the vapor phase, is an important factor that governs water evaporation kinetics through the relation (Seinfeld and Pandis, 2016)
where j is the evaporation rate and c is a constant factor. From the classical thermodynamic Kelvin theory, the water evaporation free energy for a droplet of radius r (δF(r)) relates to the value for a bulk liquid system with a flat interface and with the same aqueous chemistry δFb through the relation
where Pv(r) is the saturated vapor pressure of the droplet, Pv,b is the saturated vapor pressure of the bulk liquid system with a flat interface and the same aqueous chemistry, σ is the surface tension of the droplet, and Vm is the molar volume of the liquid. Therefore, if the Kelvin equation is valid and if solute concentration is invariant with r, a plot of δF as a function of (where D=2r) should yield a straight line with a slope of −2Vm. Such a plot is presented in Fig. 5a.
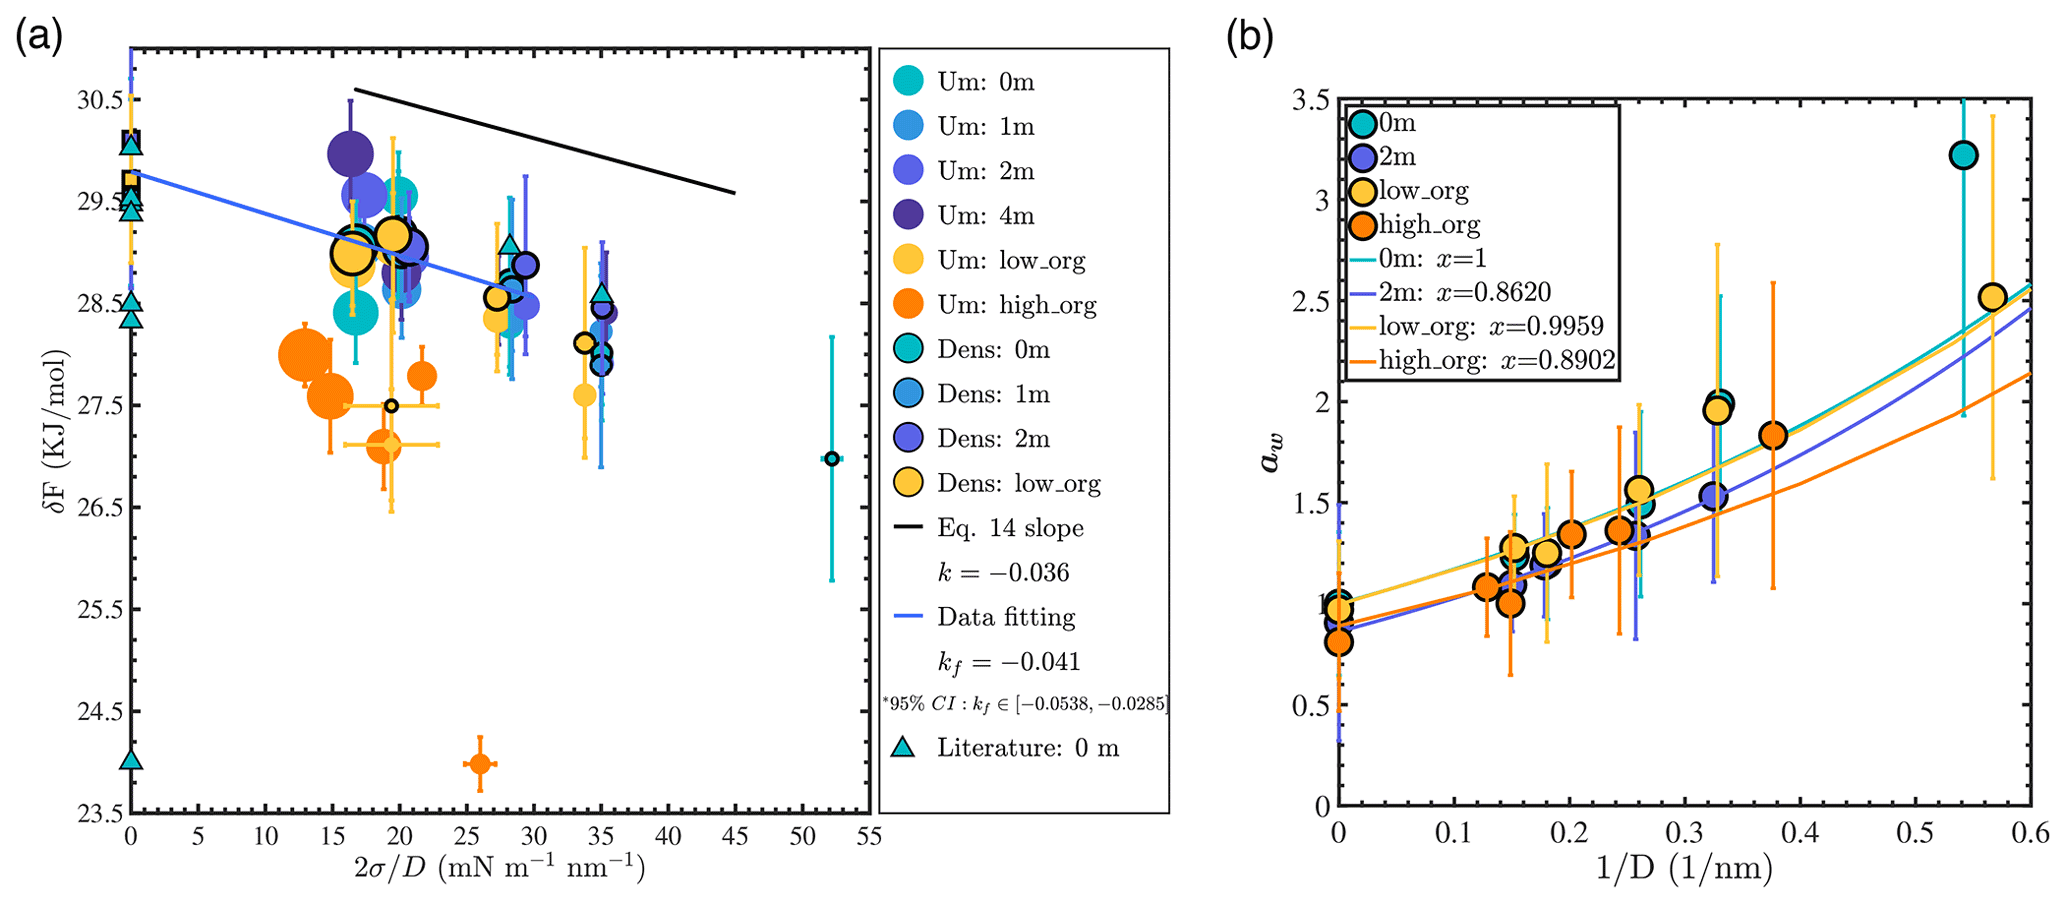
Figure 5(a) Water evaporation free energy calculated from the density profile in equilibrium MD simulations (“Dens”) or from the umbrella sampling method (“Um”): the black line shows the reference slope of δF versus from the classical Kelvin equation prediction; the blue line shows the best linear fit obtained for well-mixed NaCl systems with droplet sizes larger than 3.5 nm (Nw≥1000). Marker size is scaled with droplet size. Literature data were collected from previous MD simulations carried out using the SPC/E water model (Garrett et al., 2006; Li et al., 2018; Varilly and Chandler, 2013). (b) Water activity aw (circles) versus for different droplets: colored lines show best fits obtained using Köhler theory (Eq. 15).
For each simulated system, we calculated δF using two different approaches. The first method consisted in determining the free energy of water evaporation using the umbrella sampling method (Torrie and Valleau, 1977), a biased MD simulation method in which a single water molecule is progressively steered from the particle to the vapor phase. The second method consisted in determining the equilibrium water densities in the liquid and vapor phases, ρl and ρv, from which the evaporation free energy was obtained as . The second method was applied only for systems where a well-defined aqueous phase (and corresponding ρl value) could be identified. From Fig. 5a, we observe that the umbrella sampling and density profile methods yield consistent δF values for all well-mixed systems (0, 1, and 2 m NaCl or low PML loading). We note that there are limited δF literature data, even for a pure-water system. Even for MD simulations of the flat water–air interface carried out with the same water model as in the present study (SPC/E), δF values reported in previous studies vary significantly, as shown in Fig. 5a (Garrett et al., 2006; Li et al., 2018; Varilly and Chandler, 2013). The comprehensive δF dataset reported in our study, with longer simulation times, multiple analysis approaches, and a range of droplet sizes and water chemistry conditions, should provide a useful guide for future examinations of the evaporation free energy of water molecules from aerosol particles.
Calculated δF values in our study increase with droplet size (i.e., water evaporates more readily from smaller droplets) as expected from Eq. (14). Although the impact of ion concentration on evaporation energy cannot be precisely resolved, a linear relationship between δF and is clearly observed in the case of well-mixed droplets, in agreement with the Kelvin equation. The theoretical slope for pure-water droplets according to the Kelvin equation prediction ( m3 mol−1, calculated using the molar volume of liquid water predicted by the SPC/E water model) is indicated by the black line in Fig. 5a. This theoretical slope lies within the 95 % confidence interval of the slope obtained by linear regression of the data for well-mixed NaCl droplets with sizes larger than 3.5 nm (Nw≥1000) (blue solid line in Fig. 5a with slope m3 mol−1). However, if the evaporation data obtained for droplets smaller than 3 nm (Nw≤500) are included in the regression, the best fitting line is deflected downward and k falls outside of the 95 % confidence interval of kf. Our observation that the Kelvin equation is valid at droplet sizes larger than 4 nm under moderate salinities has also been revealed by experimental studies (Winkler et al., 2012).
For droplets with low PML loading, the trend shown in Fig. 5a is generally consistent with that observed for well-mixed water and NaCl droplets. However, the smallest low-organic-loading droplet represents a clear outlier in Fig. 5a, as also observed in Fig. 4, suggesting a possible link between its low surface tension and its low δF value. For the 4 m NaCl droplet system, the trend in δF (dark-purple circles) is similar to that observed for the well-mixed NaCl systems, suggesting that although the ions in the center of the droplet form a solid, the water surface is similar to that of the well-mixed ion–water systems. In contrast, for the phase-separated high-PML-loading system (orange circles), predicted δF values are consistently much smaller than those of the well-mixed systems. This indicates that at high PML loading, the organic coating strongly enhances water evaporation and invalidates Eq. (14). For the smallest droplet with high PML loading, δF is only 24 kJ mol−1, deviating significantly even from the values obtained for larger droplets with high PML surface loading, an observation that may be related to the reversal from water-core to organic-core morphology identified above.
To conclude, the Kelvin equation accurately predicts water evaporation energetics for salty NaCl droplets with sizes larger than 3.5 nm, even at salinities up to 4 m where salt precipitation is observed. However, it overestimates the stability of droplets smaller than 3 nm and of droplets with high PML organic surface loading, in agreement with the expectation that water becomes a somewhat distinct (less hydrophilic) fluid when the collective nature of the water hydrogen bond network is disrupted.
3.6 Validity of Köhler theory
Water activity aw, the ratio of the partial pressure of water in solution and the saturated water vapor pressure of bulk pure water, is an important factor that governs the hygroscopic growth and mass concentration of aerosol particles at a given relative humidity (Seinfeld and Pandis, 2016). According to Köhler theory (Seinfeld and Pandis, 2016), the water activity of an aerosol droplet can be expressed as
where xw is the effective mole fraction of water molecules in the solution, which accounts for the effect of solutes as represented using Raoult's law, and Pv,0 is the saturated vapor pressure of a pure-water system with a flat interface.
To evaluate Köhler theory at the nanometer scale, we calculated aw in all simulated droplet systems and compared our results with Eq. (15) as shown in Fig. 5b. For each system, we calculated the water activity as , where ρv,0 is the density of water in the vapor phase in a system with pure water and a flat water–air interface. The theoretical prediction was determined by fitting aw values obtained for droplets with sizes larger than 3.5 nm using Eq. (15), with σ and Vm obtained from simulations of systems with bulk-liquid-like water and a flat water–air interface (with the same salinity or PML surface loading) and xw fitted to minimize the root mean square deviation from simulation results. From Fig. 5b, we see that aw increases with decreasing droplet size. For pure-water droplets, within the precision of our results, the simulation data match the theoretical prediction well for droplets larger than 3.5 nm in diameter. For droplets smaller than 3 nm, water activity is underestimated by Köhler theory, indicating that small nanodroplets are less stable than expected (i.e., they exhibit higher saturated vapor pressure than expected, as noted above). For 2 m NaCl droplets, within the precision of our results, the simulation results are consistent with Eq. (15). However, we note that under the ideal-solution assumption that underlies Köhler theory, a 2 m NaCl droplet should have xw=0.93, whereas our results are consistent with Eq. (15) with an effective water mole fraction of , which indicates that the impact of NaCl on the activity of water is roughly twice as large as predicted by Raoult's law. Since the interatomic potential models used in this study accurately represent experimental water activity in bulk liquid water up to 3 m NaCl salinity (Mester and Panagiotopoulos, 2015a), this observation likely relates to the presence of the water–air interface. The magnitude of the observed deviation is consistent with the ion concentration enhancement effect identified above. For organic aerosols, as the mixing state of water and organic matter is often poorly defined, the effective water mole fraction is often fitted to match measured values of aw (Seinfeld and Pandis, 2016). From our fitting results, the effective xw value in our low-PML-loading system equals 0.996±0.006, indicating that at low surface coverage PML has essentially no impact on water activity. In contrast, in our high-PML-loading systems, the effective xw value equals 0.890±0.011, indicating that PML can lower water activity by 10 % in engulfed structure droplets. Overall, our results are consistent with Köhler theory for droplets with sizes larger than 3.5 nm. However, Köhler theory overestimates the stability of water in droplets smaller than 3 nm (a phenomenon that may be related to the lower surface tension and water cohesion in small droplets identified above) and underestimates the impact of ions on water activity (a phenomenon that may be related to the ion concentration enhancement noted above).
3.7 Accommodation coefficient of water and condensation kinetics
The mass accommodation coefficient of water molecules on nanoaerosol particles, defined as the probability that a water vapor molecule that impinges on the particle surface becomes incorporated in the particle, is a fundamental factor that governs the hygroscopic growth kinetics of atmospheric aerosols (Diveky et al., 2021; Seinfeld and Pandis, 2016). Its precise value in atmospheric conditions remains highly uncertain (within a range of 0.01 to 1) despite decades of study because of its complex dependence on particle composition, phase-mixing state, and surface curvature (Diveky et al., 2021; Shiraiwa and Pöschl, 2021; Barclay and Lukes, 2019; Davis, 2006; Winkler et al., 2004). In our study, the water accommodation coefficient (α) was calculated by tracking the trajectory and phase state of water molecules for 100 ns for each simulated system. We note that even based on atomistic trajectories determined using MD simulations, there are several possible ways of defining whether an impinging water molecule is absorbed or reflected, and, as a result, different α values (ranging from 0.9 to 1.0) are reported even for the flat surface of pure liquid water (Julin et al., 2013; Barclay and Lukes, 2019; Skarbalius et al., 2021; Tsuruta and Nagayama, 2004; Ohashi et al., 2020). To highlight the impacts of curvature, salinity, and organic coatings on α and compare our results with those of other studies, we report normalized values as , where α0,w is the value reported for the flat surface of pure liquid water in the same study. For studies that did not report α0,w, we used for simplicity. We convert organic concentrations into a surface coating factor fs, defined as the ratio of the surface area occupied by an idealized monolayer of organic molecules (with the thickness of a single carbon monolayer, 0.35 nm) to the surface area of an idealized spherical water droplet. For consistency, we restrict our comparison to studies that considered semi-volatile or non-volatile organic molecules with chain-like structures and more than five carbon atoms.
Figure 6 shows α* as a function of based on our results (circles) and previous studies of aerosols containing liquid water and organic matter (stars) (Ma et al., 2011; Chakraborty and Zachariah, 2008; Li et al., 2019; Takahama and Russell, 2011; Diveky et al., 2019; Duffey et al., 2013; Diveky et al., 2021). The α* values of the droplets containing pure or salty water (fs=0) show no apparent dependence on salinity but increase with droplet size. This size dependence of α* is consistent with previous observations that the mass accommodation coefficient of small water droplets depends on their surface curvature, particularly at droplet diameters below 3 nm (Barclay and Lukes, 2019). Although the origin of this size dependence is unclear, we note that previous studies have demonstrated that the angle of incidence of impinging molecules can significantly impact α*, with more tangential collisions resulting in smaller α* values (Nagayama and Tsuruta, 2003; Garrett et al., 2006). For an idealized geometry (with point-sized water molecules impacting a perfectly spherical droplet), the distribution of incidence angles of impinging water vapor molecules should be invariant with droplet size. The size dependence of α* suggests that deviations from ideality, such as particle surface roughness or the finite size of incident water molecule, may impact the outcome of particle–water collision events.
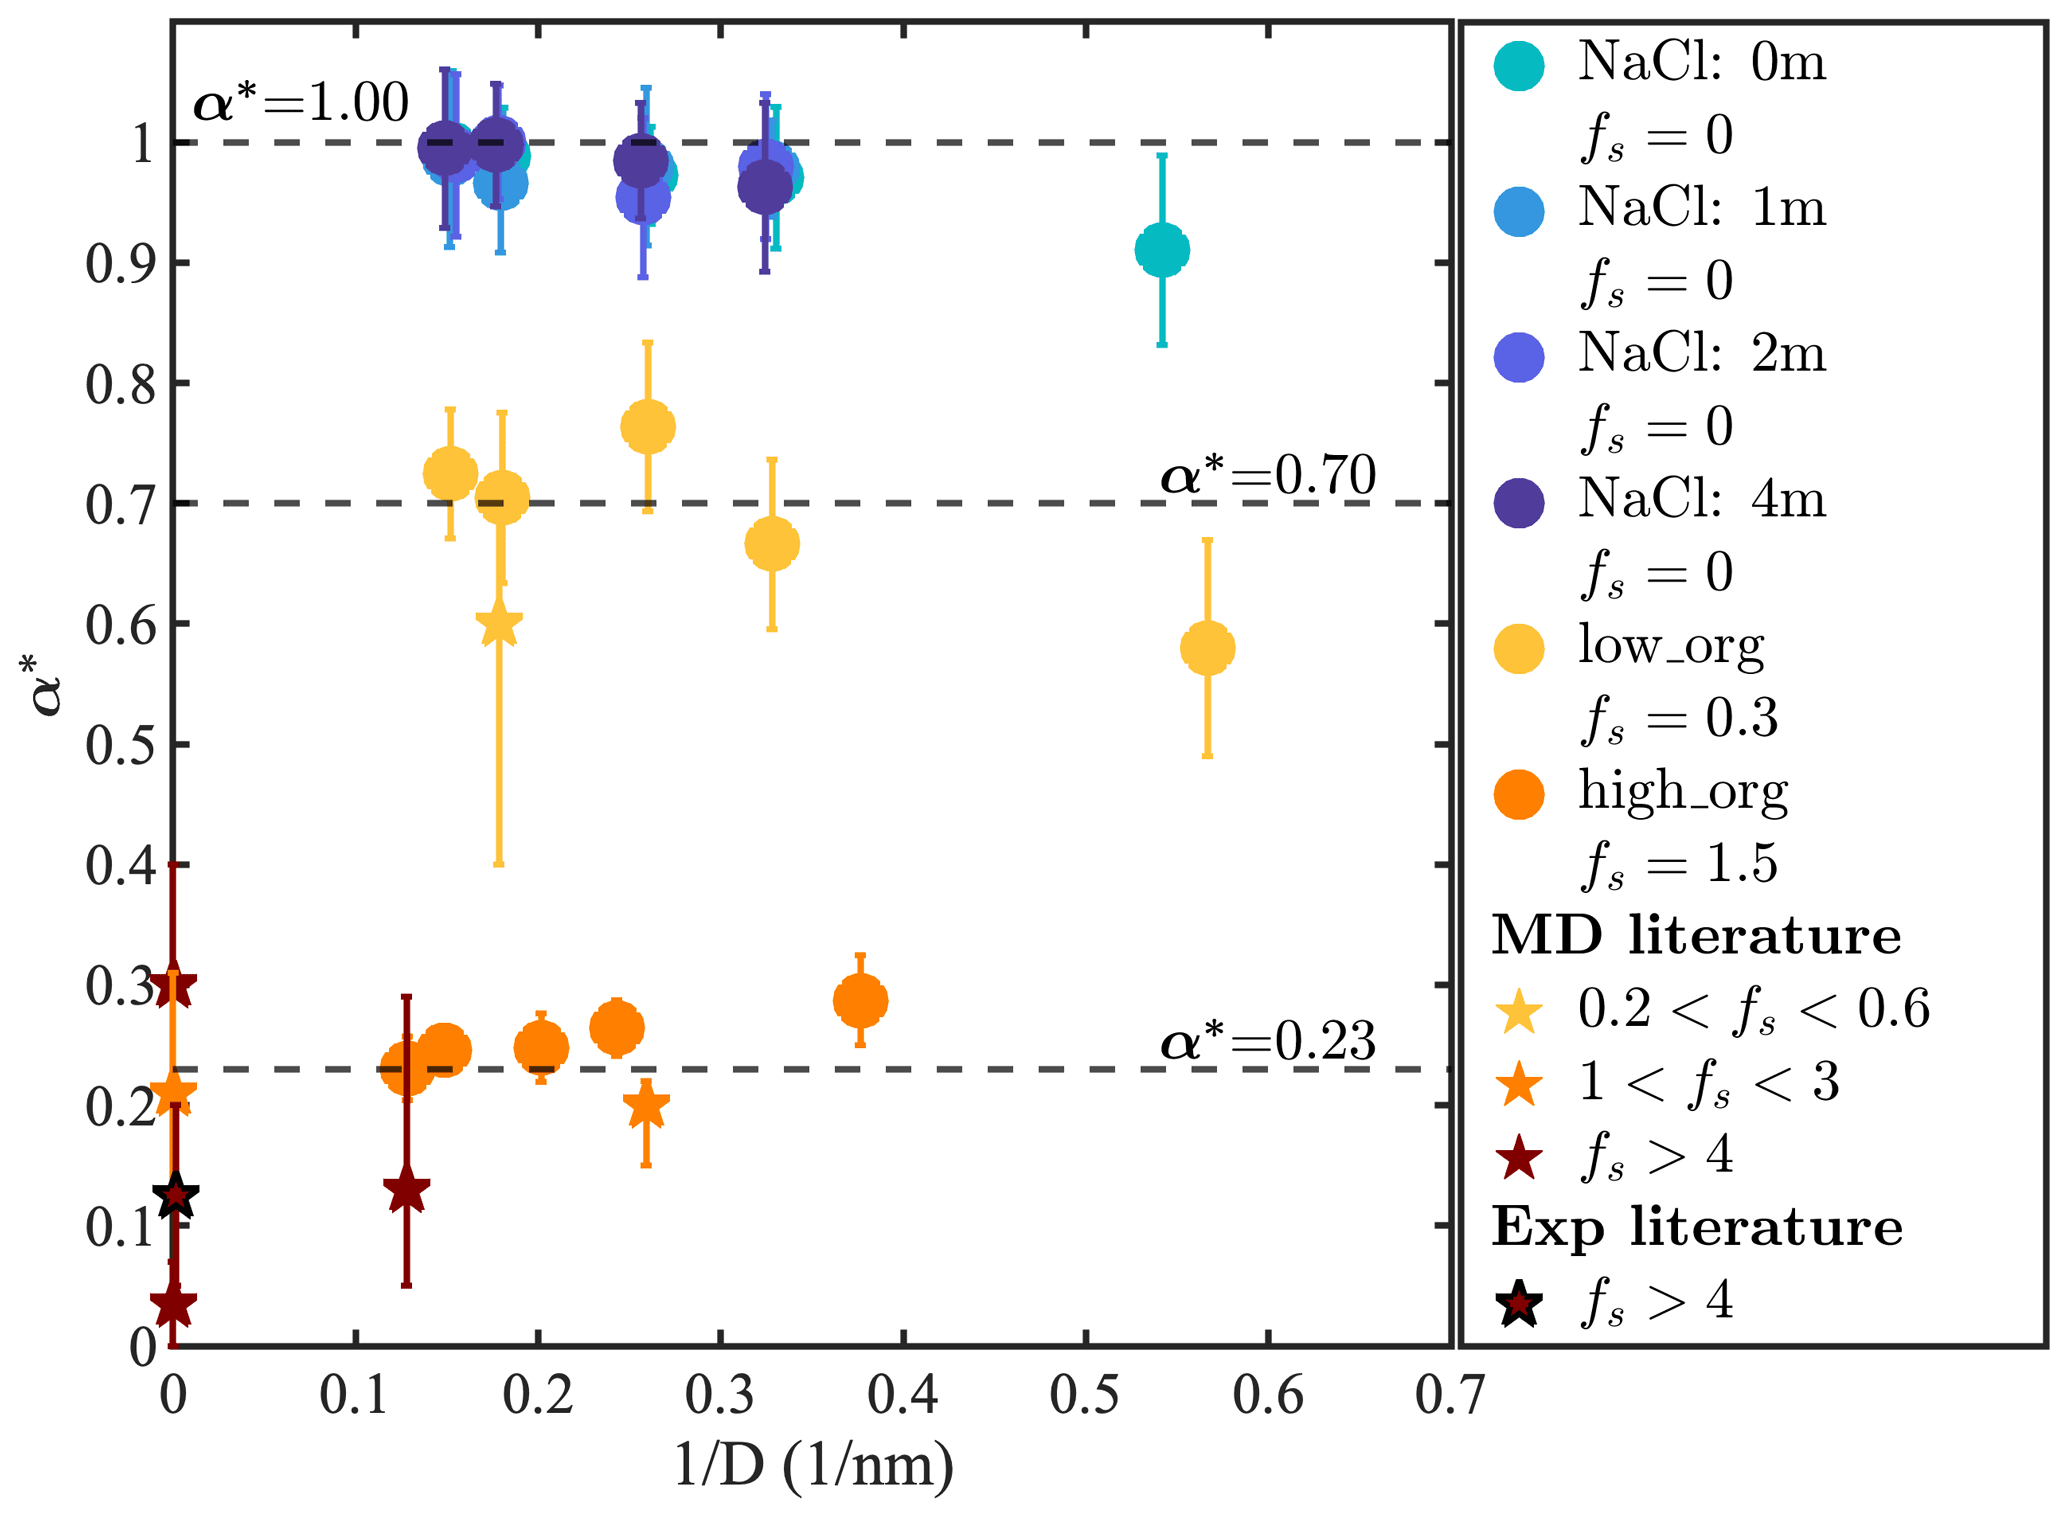
Figure 6Normalized water accommodation coefficient α* versus for different droplets. Circles show results calculated in this study. Stars show previous MD simulation (Ma et al., 2011; Chakraborty and Zachariah, 2008; Li et al., 2019; Takahama and Russell, 2011) and experimental results (Diveky et al., 2019; Duffey et al., 2013; Diveky et al., 2021) obtained at ambient temperature categorized by their fs values.
For our low-PML-loading systems (fs=0.30), shown as yellow circles, calculated α* values show similar size dependence as for NaCl droplets and converge to 0.70 in droplets larger than 3 nm. This observation is consistent with the expectation that for droplets with a sub-monolayer organic coating, the accommodation coefficient can be roughly approximated as the fraction of the droplet surface that is not coated by organic matter, i.e., , as expected based on the simplistic assumption that on the surface of liquid water and on the organic-coated surface. This relationship between fs and α* is also consistent with previous MD simulation results obtained with water droplets containing azelaic acid, a C9 dicarboxylic acid (fs=0.35, ) (Ma et al., 2011). For our high-PML-loading systems (fs=1.50), shown as orange circles, predicted α* values are significantly smaller than for our low-PML-loading systems, as expected, with at the largest droplet sizes. Again, our α* results for high-organic-loading systems are consistent with values obtained in previous MD simulation and experimental studies for systems with fs>1, which range from 0 to 0.3 as shown in Fig. 6. Interestingly, α* now decreases with increasing droplet size, displaying a size dependence opposite to that observed for the other systems discussed above. This unexpected behavior appears to be caused by the distinct size dependence of the phase-mixing state observed for organic-rich droplets, with smaller droplets displaying an organic-core, water-coated morphology, whereas larger droplets have an engulfed structure that exposes less water at its surface.
To the best of our knowledge, this work presents an unprecedentedly broad MD simulation examination of the properties of liquid water in sub-10 nm aerosol particles. Specifically, we characterize droplet shape, water and solute distribution, water diffusivity parallel and perpendicular to the interface, surface tension, water evaporation free energy, water activity, and the water accommodation coefficient in aerosol particles with six different aqueous chemistries for a range of particle sizes. We build upon previous MD simulation studies that have carried out more piecemeal characterizations of water structure, dynamics, and energetics in aerosol particles (Karadima et al., 2019; Chowdhary and Ladanyi, 2009; Li et al., 2011, 2010). We propose a sphericity factor (ϕ) that enables a quantitative characterization of the mixing structure of water and organic- or salt-rich phases and helps reveal the links between aerosol particle morphology and the distinct energetic and kinetic properties of water molecules at the nanometer scale.
A key finding of this study is that in aerosol particles larger than 4 nm, the size dependence of water microphysics in ultrafine aerosol particles is relatively mild and can be represented using continuum-scale models. In contrast, in sub-4 nm diameter particles, multiple behaviors are observed that require fundamental understanding of molecular-level interactions. For particles consisting of a water-rich phase, smaller droplets display less water cohesion, stronger ion concentration enhancement in the droplet core, faster interfacial water diffusion, smaller surface tension, a smaller water accommodation coefficient, and higher water activity. For organic-rich aerosols with the dicarboxylic acid PML as the organic compound, a micelle structure (with an organic core and water coating) can form at small particle sizes, which results in distinct water microphysics compared to water-core aerosols at similar sizes.
Finally, we reiterate that our simulations use highly simplified chemistries, with a single type of salt (NaCl) or organic solute (PML), in order to focus on the impacts of droplet size and solute loading. The organic compound, PML, was selected for its similarity to the compounds most abundantly observed in organic aerosols in terms of molecular weight (Thornton et al., 2020), number of C atoms (Zheng et al., 2021), O:C ratio (Zheng et al., 2021; Song et al., 2018), and functional groups (Zhao et al., 2018; Qi et al., 2022). Although the use of such an idealized proxy facilitates our effort to evaluate the sensitivity of aerosol properties to salt and organic loading, additional studies are required to evaluate the sensitivity of our predictions to the type of salt or organic solutes (or solute mixtures). In particular, future studies should extend this work to other organic compounds abundantly found in organic aerosols, such as alcohols or other dicarboxylic acids.
As noted in the main text, the surface tension should be rigorously calculated at the radius Rs, where the surface tension applies, instead of Re. Our use of Re (instead of Rs) in Eq. (7) is an approximation and can be justified for the following reasonings. (1) For theoretical analysis, the impact of the difference between Re and Rs on the σ calculation is small in most of our simulated systems. The Tolman length δ can be approximated as a measurement of the difference of (Re−Rs). Previous studies, including MD simulations, theoretical analysis, and experimental measurement, have reported δ values ranging from −0.1 to 0.2 nm for liquid water systems (e.g., water droplets, bubbles, water cavitation in minerals, and water with a hydrophobic solute) (Min and Berkowitz, 2019; Wilhelmsen et al., 2015; Kim and Jhe, 2020; Burian et al., 2017; Menzl et al., 2016; Azouzi et al., 2013; Joswiak et al., 2013; Sedlmeier and Netz, 2012). Among these studies, Kim and Jhe (2020) directly calculated (Re−Rs) from MD simulations of pure-water droplets with radii ranging from 0.5 to 1.5 nm. Their results show that for nanodroplets with radii larger than 0.9 nm, (Re−Rs) is in the range of [−0.05, 0.05] nm. Our results in Sect. 3.4 similarly show that δ is very small (∼0.06 nm). The sensitivity of Eq. (7) to the choice of R value can be evaluated using the expression
For nm, which is the case in our study, the maximum error introduced by the use of Re in σ calculation is less than 8 % for droplets with Nw≥500. This systematic error is commensurate with the statistical error of our predicted σ values (as shown by our reported error bars of %). (2) In MD simulation practice, as noted in our article, the droplets simulated here do not have a perfectly spherical shape. As a result, it is impossible to accurately determine the surface tension surface Rs in a traditional manner. The surface tension calculation scheme used in our study (Eqs. 6–8), which uses Re for approximation, has been widely used in previous MD simulation studies for nanodroplet surface tension calculation (Li et al., 2010; Zhao et al., 2019; Li et al., 2013; Zakharov et al., 1997).
Table A1Values of equimolar radius (Re), interfacial width (di), inverse of the sphericity factor (), and surface tension (σ) for water–NaCl mixtures with different ion concentrations (C) and for water–pimelic acid droplets with different values of surface organic loading (Cs) for all simulated systems. Re values were determined from the location of water's Gibbs dividing surface except where denoted with a *, where they were calculated as using the bulk water density 34.02±0.19 molec. nm−2 and bulk organic density 4.373±0.003 molec. nm−2 calculated from separate MD simulations of each fluid.

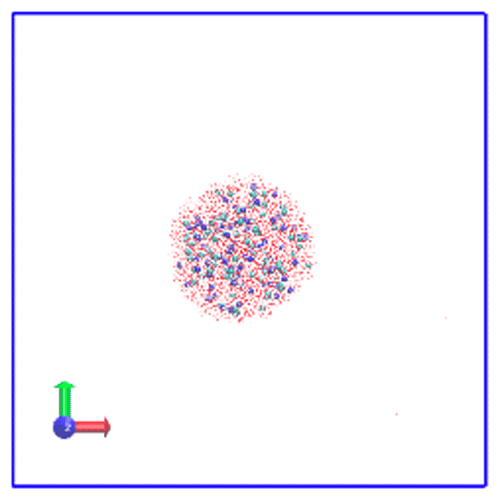
Figure A1A 1 m NaCl droplet with 5000 water molecules in a simulation cell of edge length of 21 nm. Simulation cell boundaries are represented as blue lines.

Figure A2Predicted ϵ value of NaCl droplets as a function droplet diameter D with different dexc values.
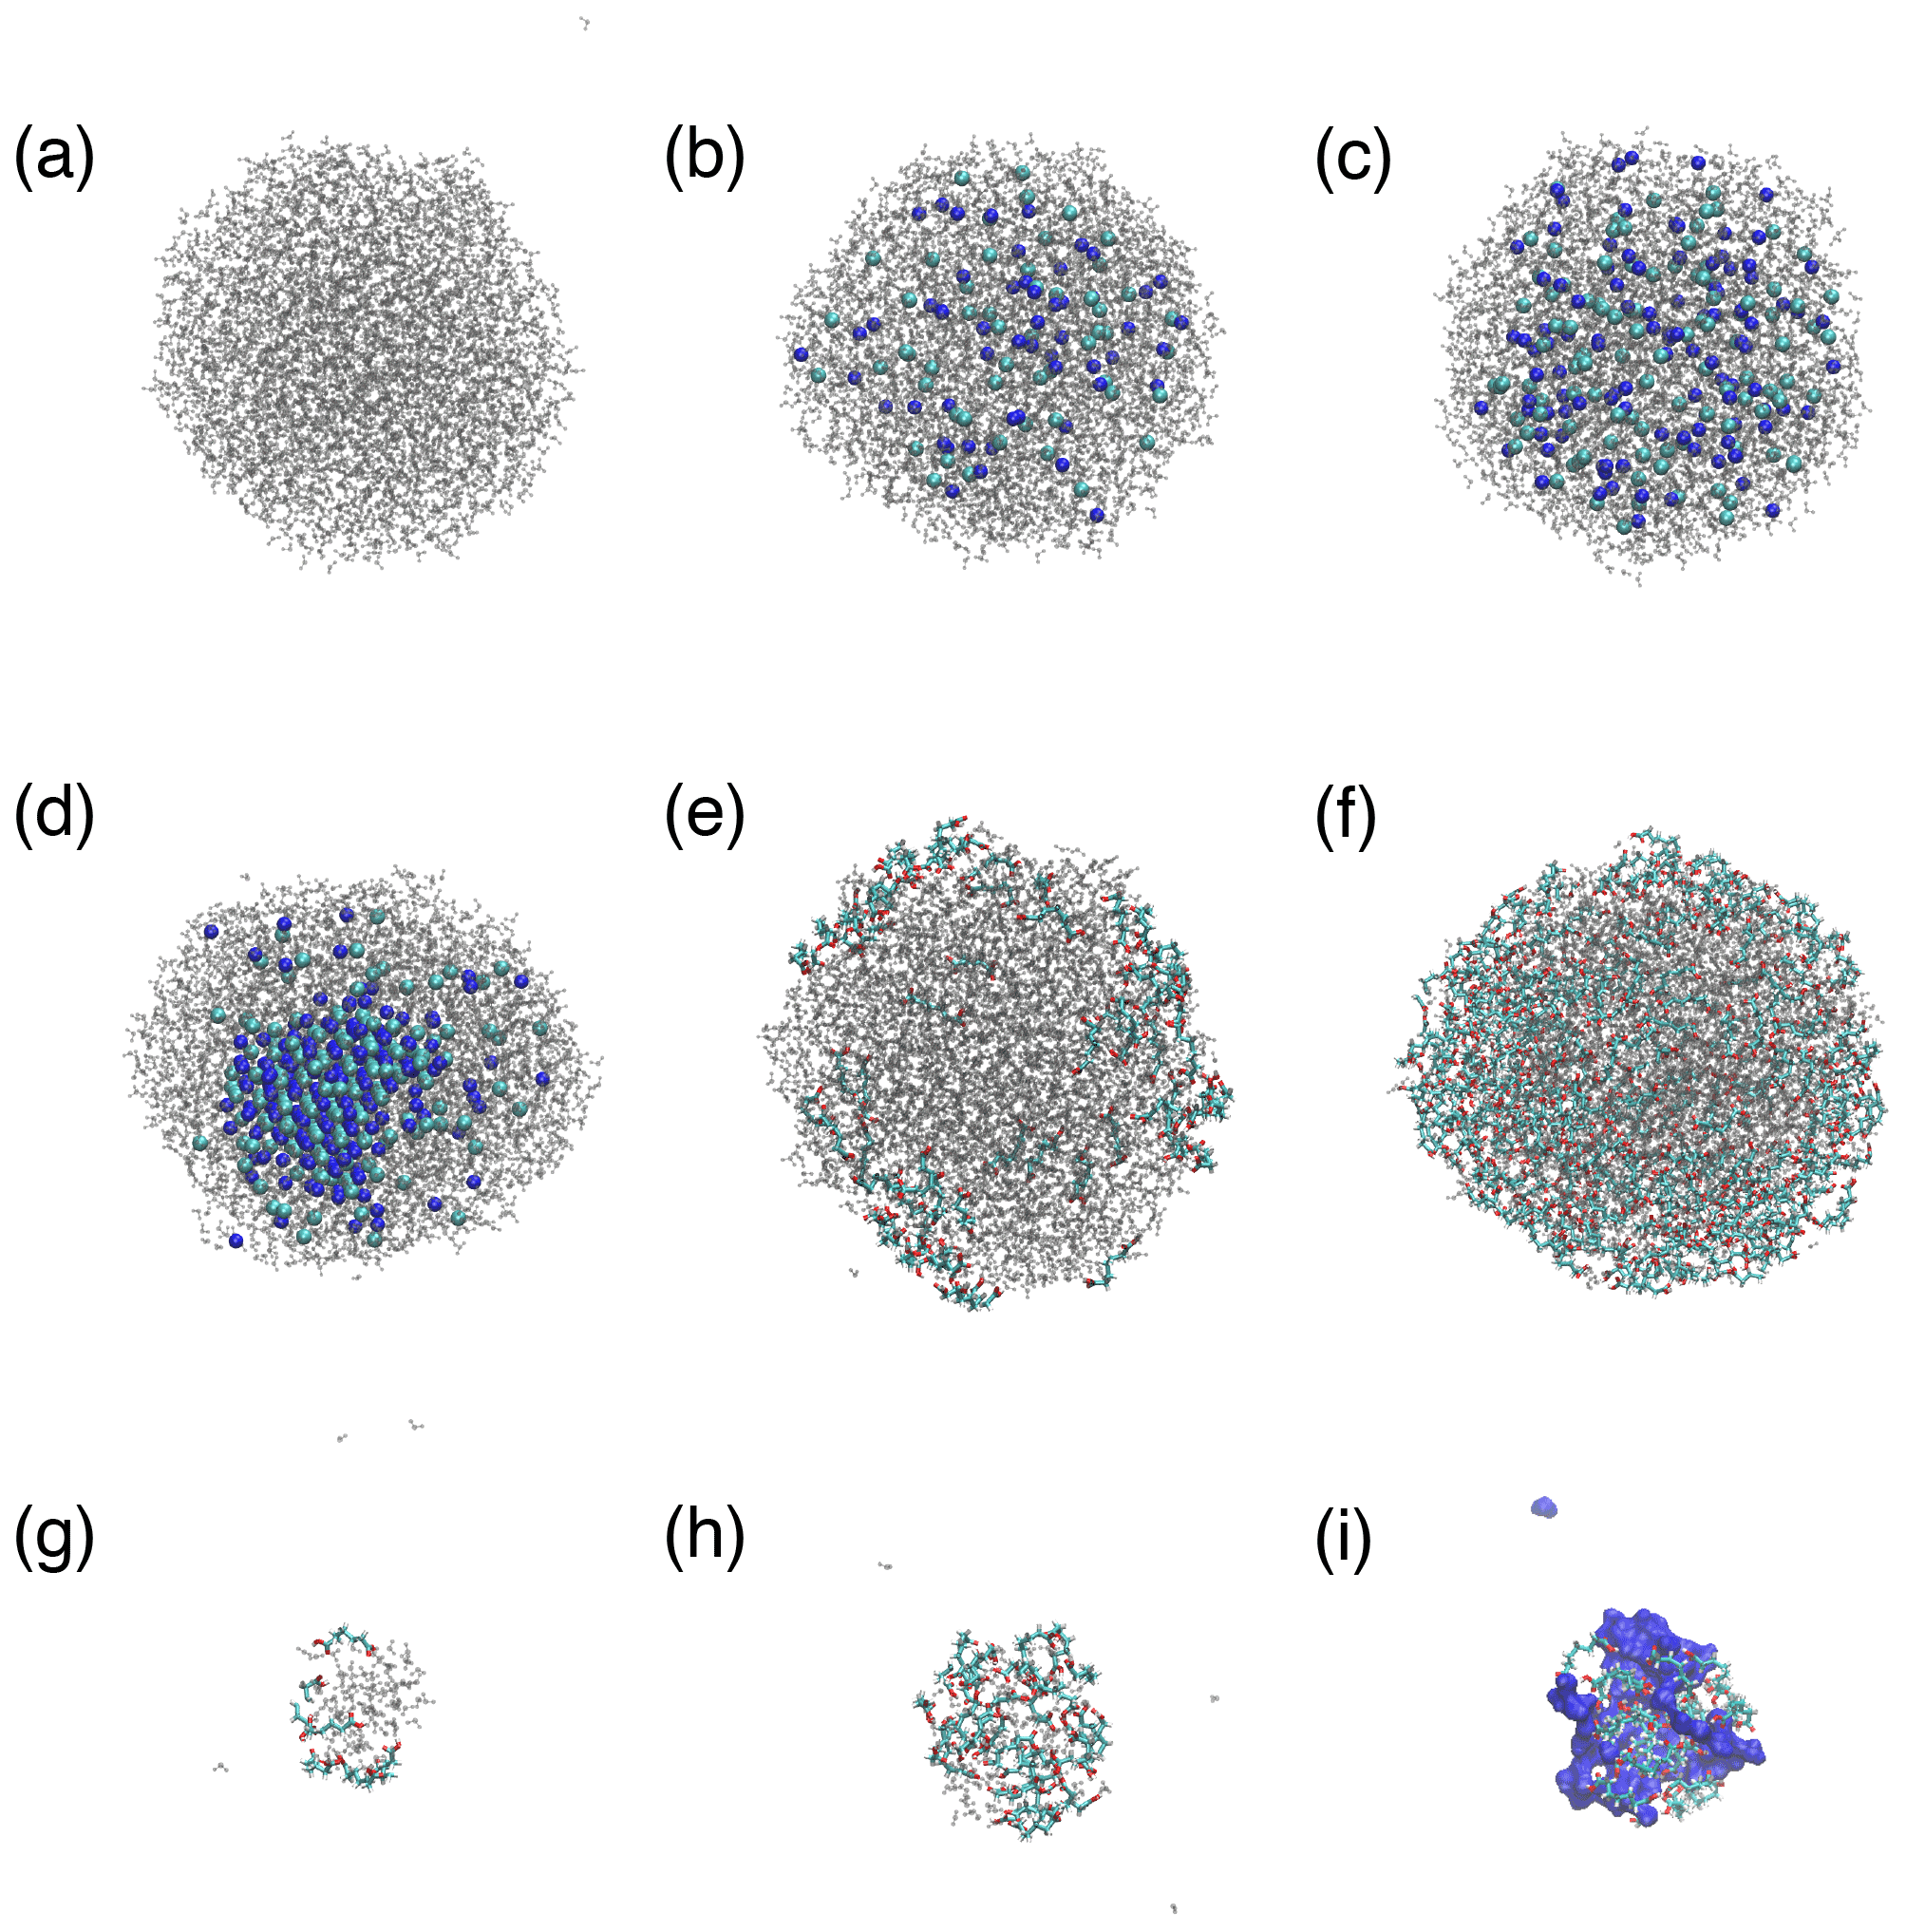
Figure A3MD simulation snapshots of droplets with water (gray color), Na+ (dark-blue spheres), Cl− (light-blue spheres), and pimelic acid (colored chains with O atoms in red, C atoms in light blue, and H atoms in white): (a) Nw=3000; (b–d) 1, 2, and 4 m NaCl solutions with Nw=3000; (e, f) low and high organic loadings with Nw=3000; and (g, h) low and high organic loadings with Nw=100. Panel (i) shows the same system as panel (h) (high-organic-loading cluster with Nw=100) but with water represented as a dark-blue surface.
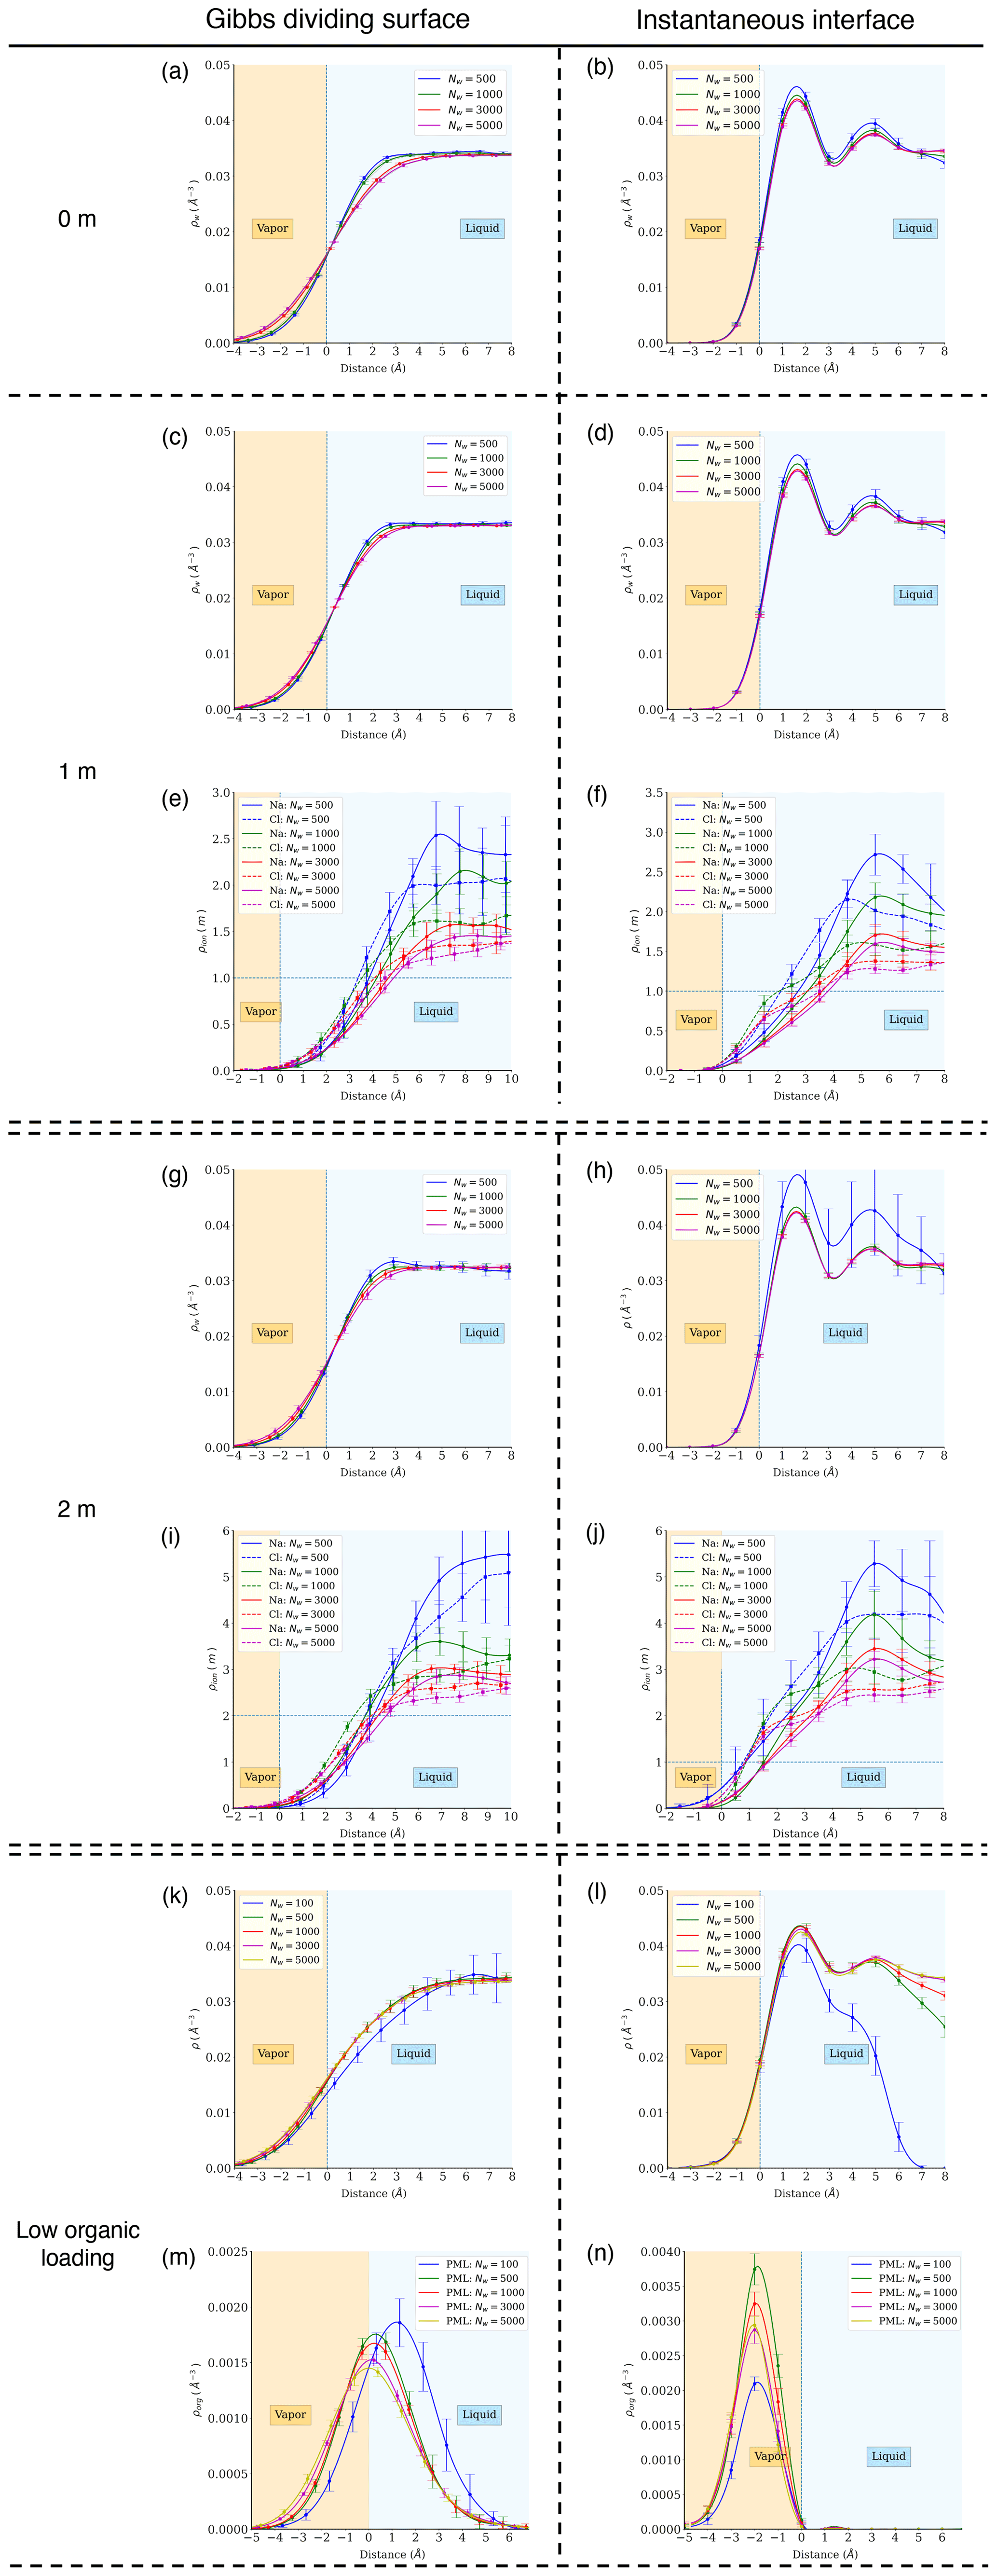
Figure A4Atomic density profiles of different components relative to distance from the Gibbs dividing surface (a, c, g, i, k, m) and the instantaneous interface (b, d, f, h, j, l, n). The top row (a, b) shows water density profiles in pure-water droplets. Rows 2–3 (c–f) show water and ion density profiles in droplets with 1 m NaCl. Rows 4–7 (g–n) show results at other aqueous chemistries.
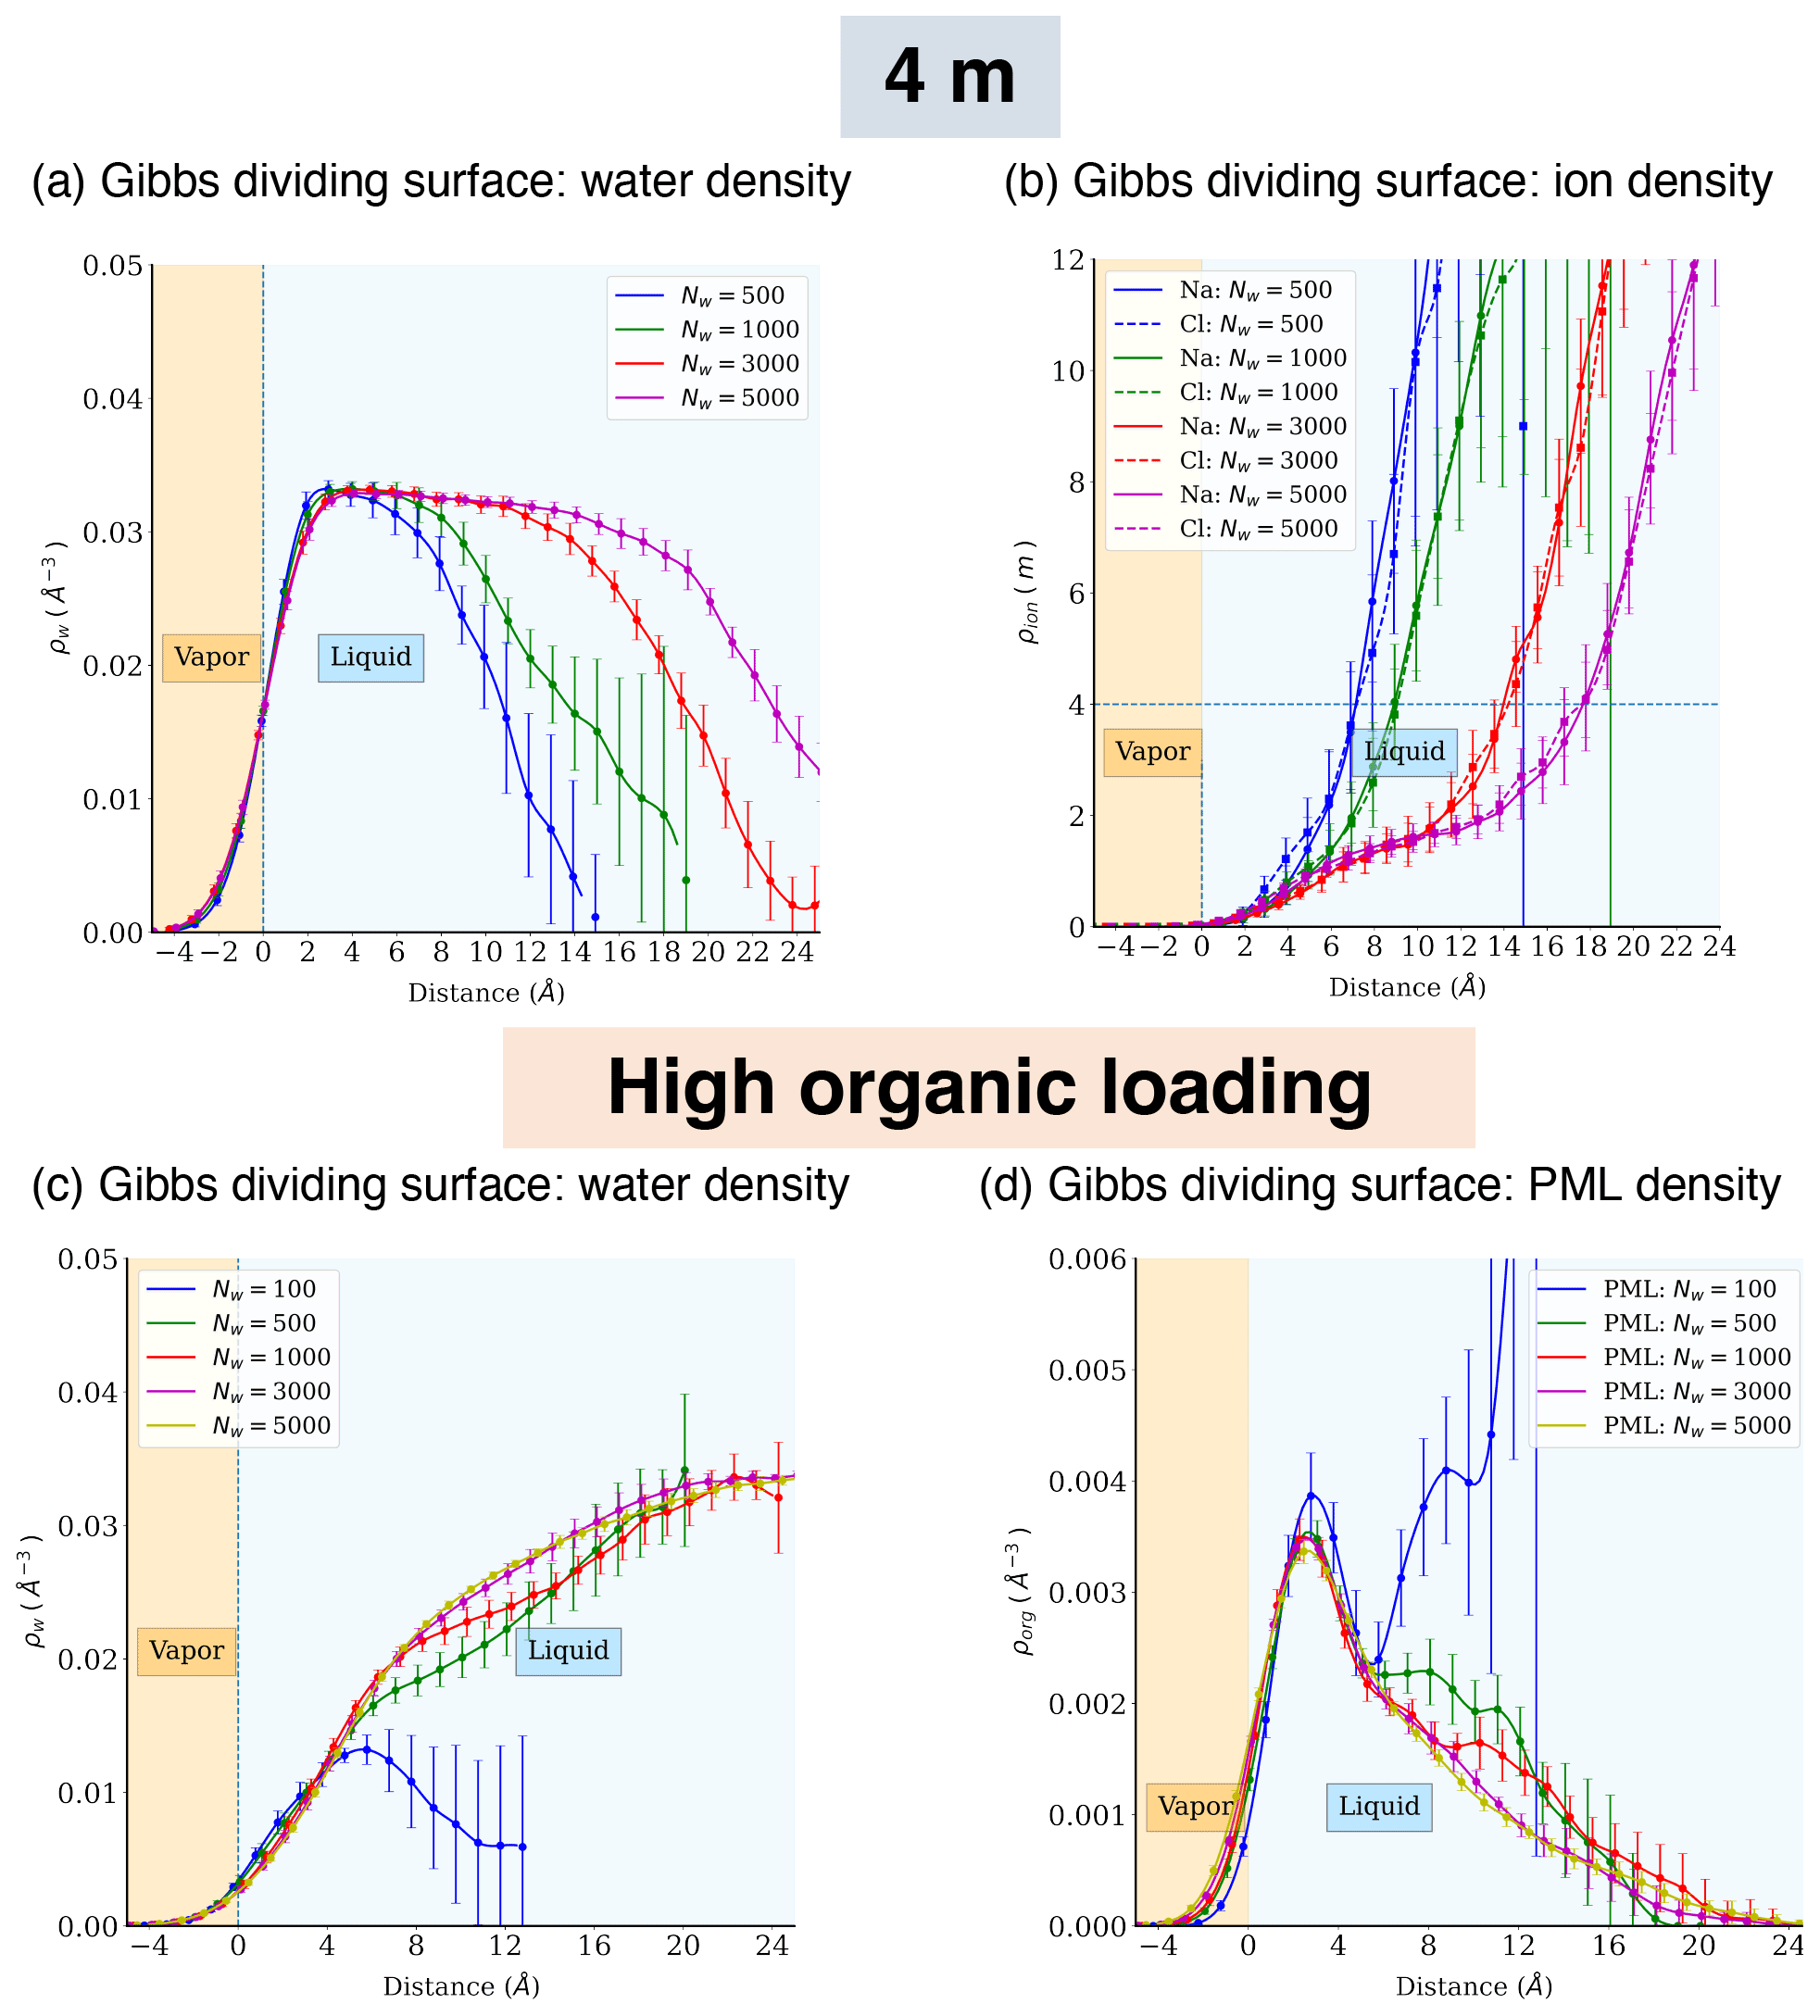
Figure A5Atomic density profiles of different components relative to distance from the Gibbs dividing surface for the phase-separated systems (4 m NaCl or high organic loading).
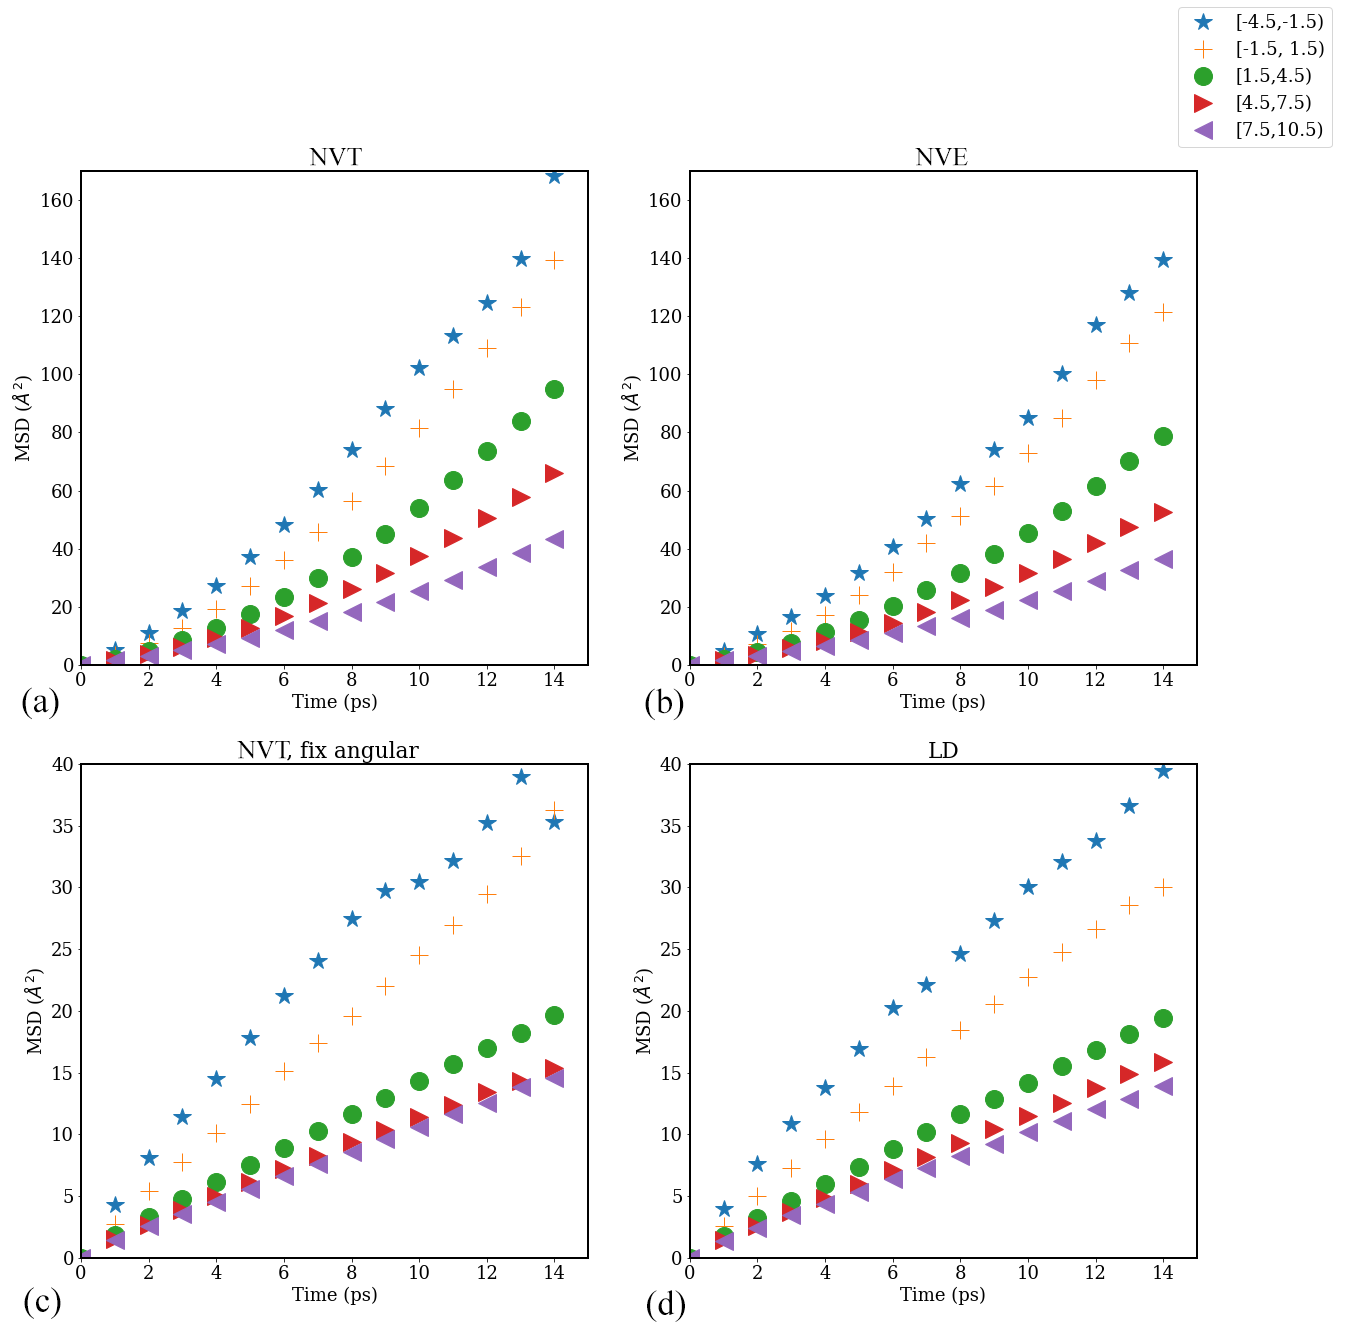
Figure A6Mean square displacement (MSD) of water molecules as a function of time evaluated in different interfacial layers in the direction parallel to the time-averaged Gibbs dividing surface in simulations carried out with different thermostats: (a) NVT, (b) NVE (number of particles–volume–energy), (c) NVT with fixed angular momentum, and (d) Langevin dynamics (LD) with a friction constant of γ=0.5 ps−1 for a pure-water droplet with Nw=1000.

Figure A7Diffusion coefficient D∥ of water molecules (i.e., in the direction parallel to the interface) as a function of distance from the interface in simulations of a pure-water droplet with Nw=1000 carried out using different thermostats (calculated from the slope, from 2 to 6 ps, of the MSD data shown in Fig. A4).
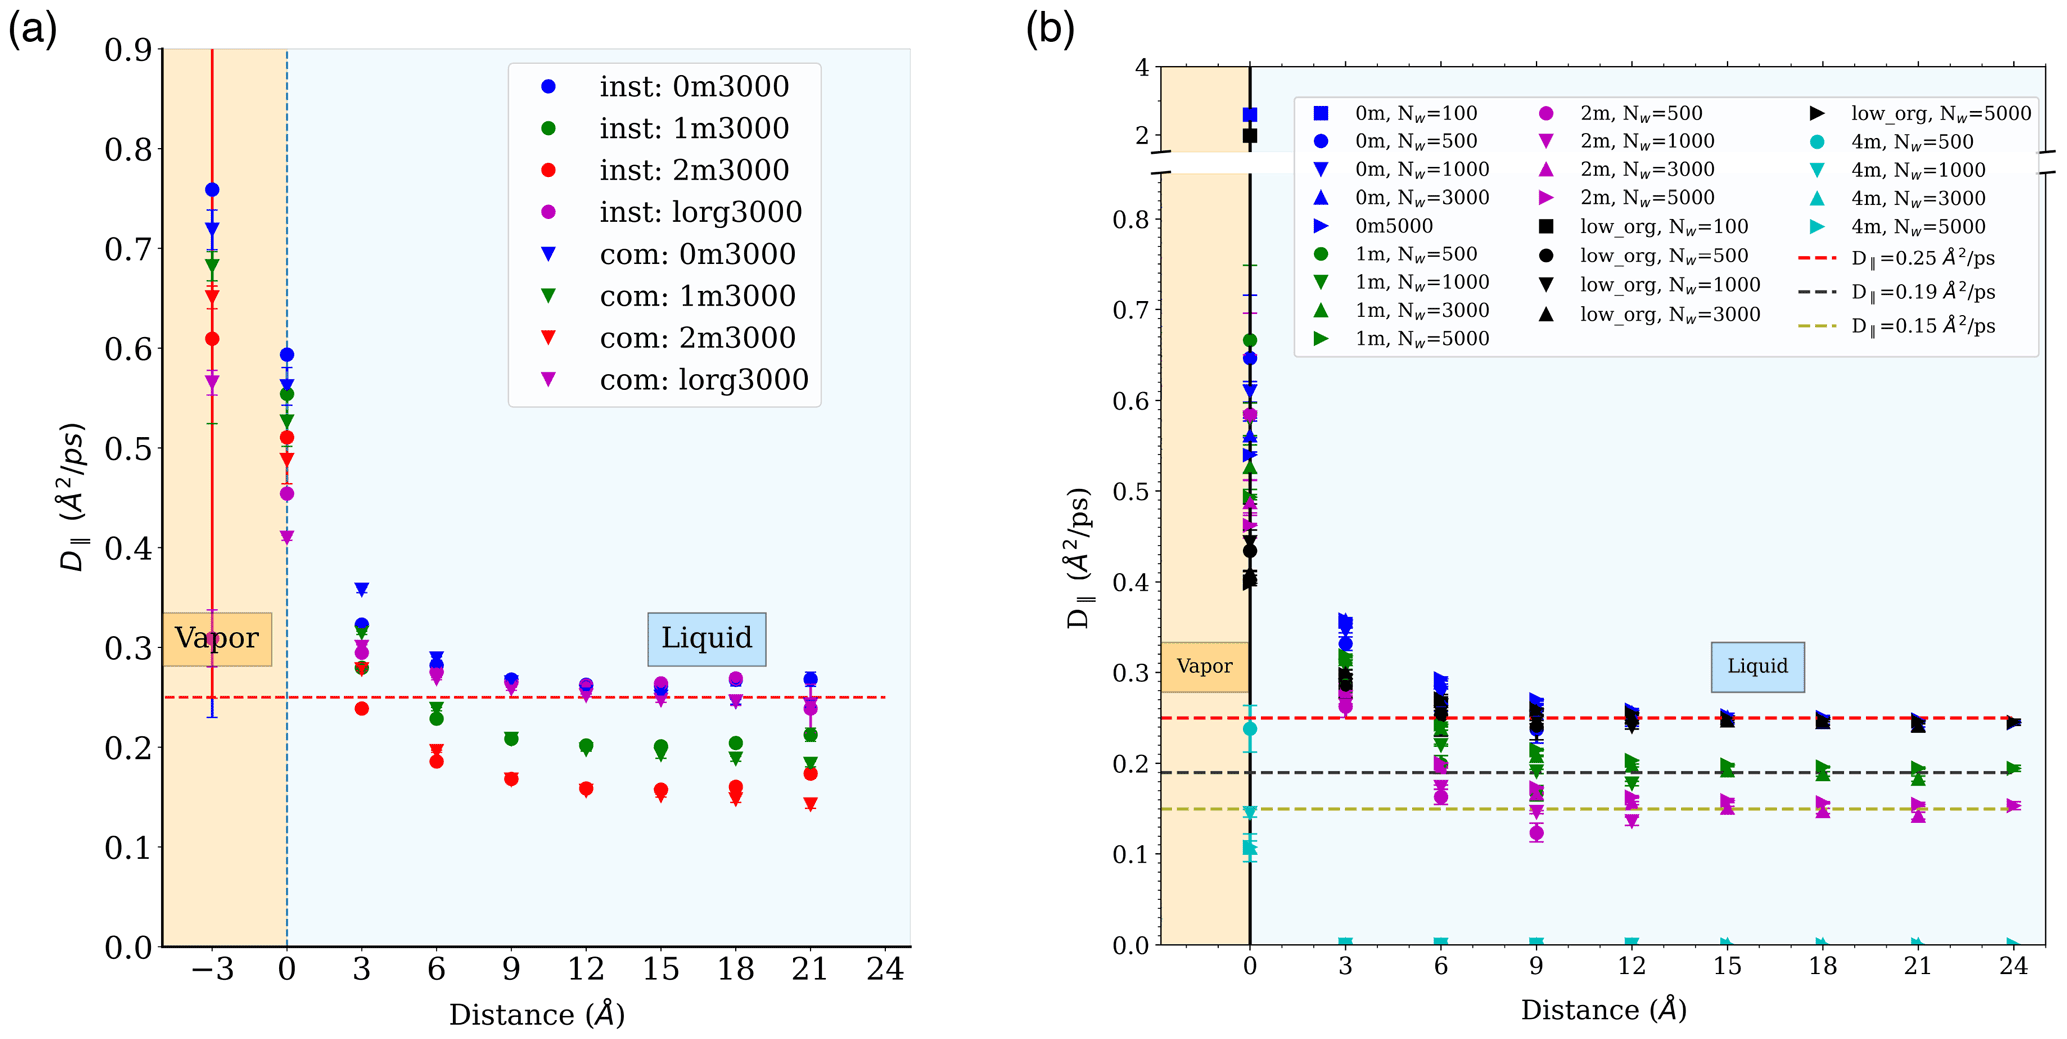
Figure A8Water diffusion coefficient in the direction parallel to the interface, as a function of distance from the interface: (a) under the center of mass (com) and the instantaneous interface (inst) schemes for droplets containing 3000 water molecules with salinity of 0, 1, and 2 m NaCl and low organic surface loading (“lorg”) and (b) in different simulated systems under the com scheme.
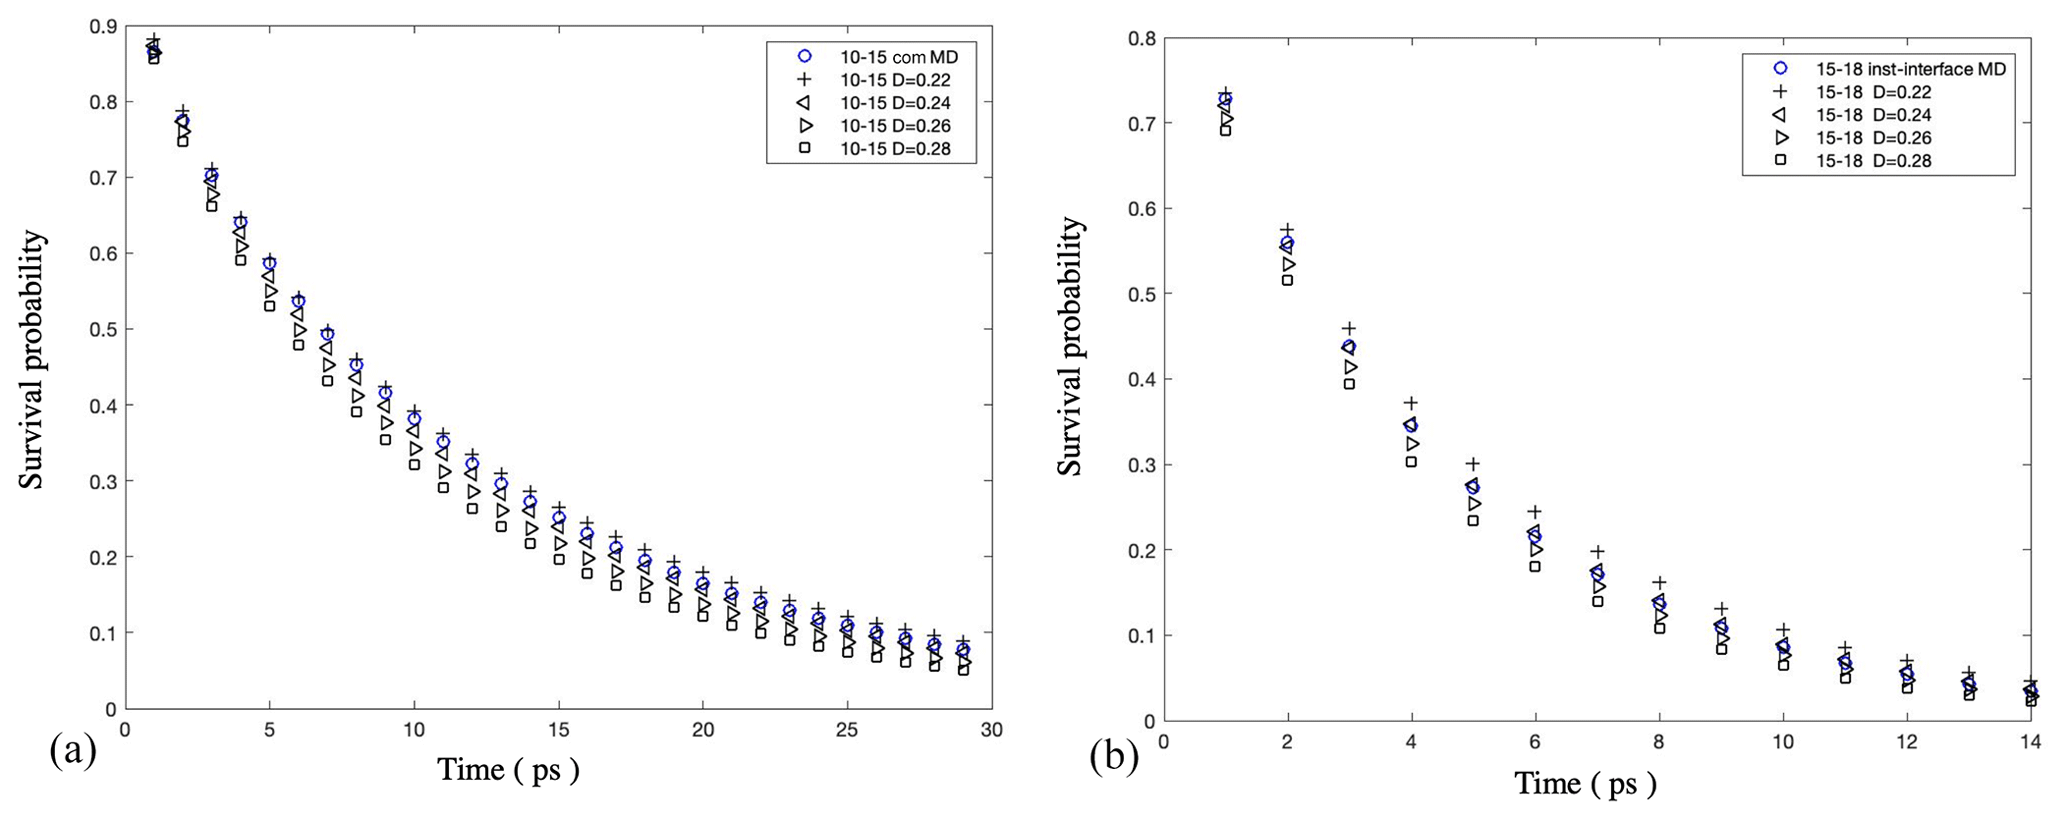
Figure A9Validation of our numerical solution of the anisotropic Smoluchowski equation: (a) survival probability of water molecules as a function of time in a bulk-liquid-like water layer (with a distance from the Gibbs dividing surface of [1, 1.5] nm) in 5000 water droplets under the com scheme and (b) the same calculation for a bulk-liquid-like water layer (with a distance from the instantaneous interface of [1.5, 1.8] nm) under the inst scheme. The water diffusion coefficient perpendicular to the interface (D⟂) is calculated by optimizing the agreement between the water survival probability in MD simulations (blue circle) and the Smoluchowski prediction obtained with different D⟂ values (black symbols). The results show that both schemes show consistent results for D⟂ in bulk liquid droplet regions, with Å2 ps−1.
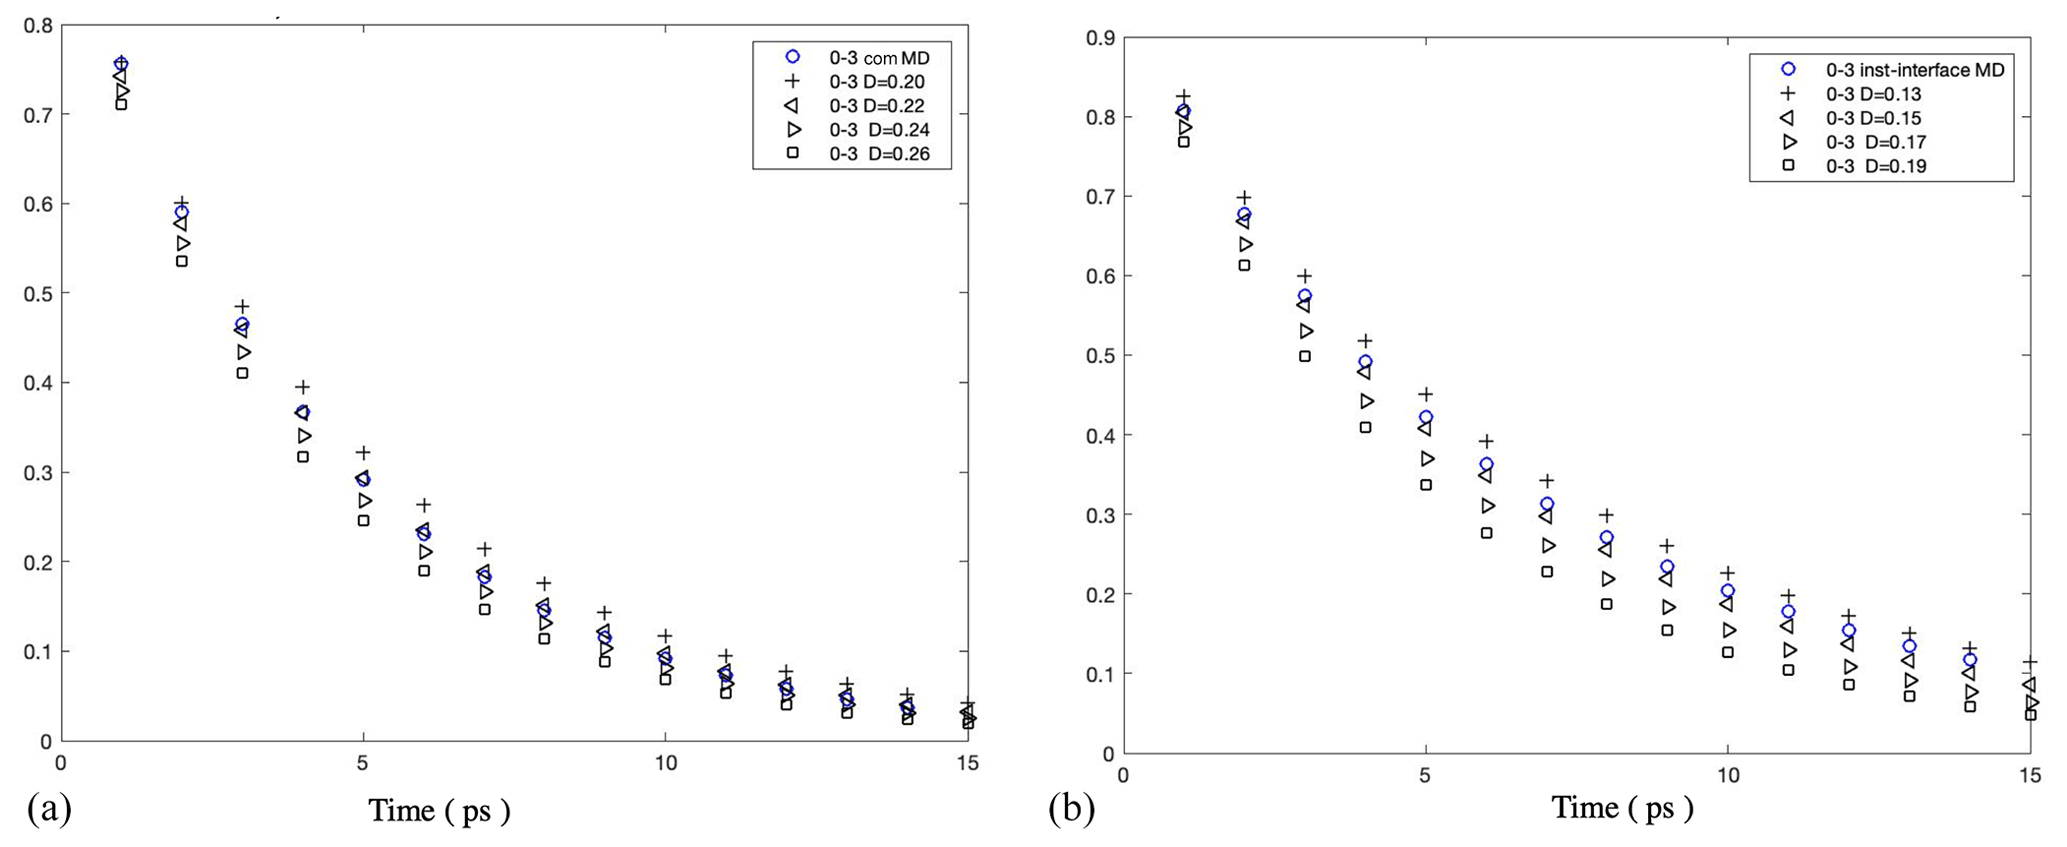
Figure A10Survival probability of water molecules in a 0.3 nm thick interfacial layer in 5000 water droplets: (a) under the com scheme and (b) under the inst scheme. The results show that Å2 ps−1 under the com scheme and Å2 ps−1 under the inst scheme.
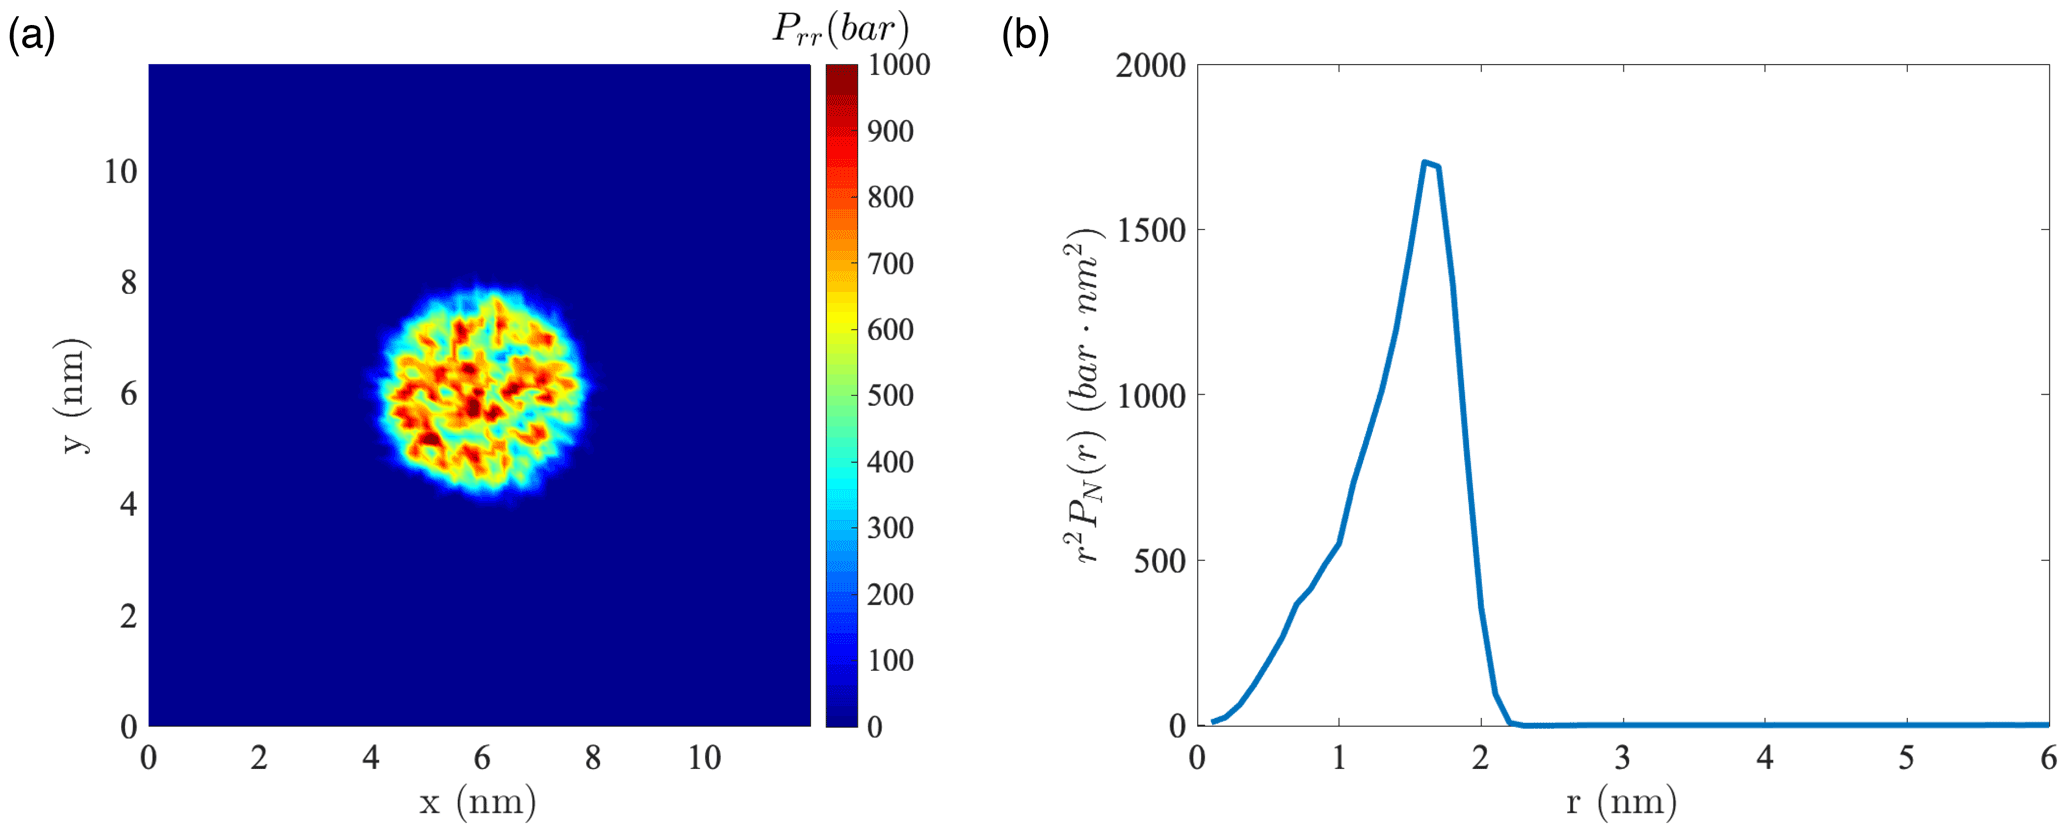
Figure A11(a) Instantaneous normal pressure tensor in 1000 water droplets at the equatorial plane perpendicular to the z axis. (b) Instantaneous value of r2PN(r) versus the radial coordinate in the droplet containing 1000 water molecules.

Figure A12Surface tension (σ) of droplets with different compositions as a function of droplet diameter.
The first hydration shell radii (rhyd) of alkali cations Li+, Na+, and K+ are 0.279, 0.318, and 0.359 nm, respectively, as reported by Joung and Cheatham (2009). The interfacial width parameter (exclusion width dexc) was determined following two steps: (1) from the ion density profile relative to the Gibbs dividing interface (Fig. A4e), we can see that the distance where Na+ density reaches the well-mixed density of 1 m ranges from 0.3 to 0.5 nm for all simulated droplets, which provides estimates of the upper and lower bounds of dexc; (2) we tested different values of the ion exclusion width and calculated the corresponding ion concentration enhancement factor and, then, compared the calculated results with our MD simulation results. Our results show that setting dexc to 1.2rhyd yielded the best match to our MD simulation results. The sensitivity of ϵ values of NaCl droplets to dexc is illustrated in Fig. A2.
To evaluate the DRH based on our simulation results, we assume that for a nanoparticle at the DRH, ion concentration in the droplet core equals the solubility of the salt Csol. We denote the wet particle diameter (including water molecules) as Dwet and the cation hydration radius as rhyd. If we follow the same assumptions as in Sect. 3.2 (i.e., that the salt is excluded from the vicinity of the water surface in a region with a thickness equal to 1.2rhyd), the ion concentration corresponding to a well-mixed system C can be calculated from
The dry diameter of this deliquescent particle D can be approximately evaluated as falling within the range [Dsalt, Dwet], where Dsalt is the diameter of a pure salt crystal approximated as a sphere with density equal to the bulk solid density. The DRH as a function of D (DRH(D)) can be calculated from
where the expression for aw(C) was taken from experimental studies of bulk aqueous solutions (El Guendouzi and Dinane, 2000).
D1 Sensitivity to the simulation thermostat
We tested the impact of different thermostat settings – NVT, NVE, NVT with fixed system angular momentum, and Langevin dynamics (LD) with friction constant γ=0.5 ps−1 (this value results in a friction that is lower than the internal friction of water, while still providing efficient thermostatting) – on the value of the water diffusion coefficient D∥ using the Einstein relation for a water droplet with Nw=1000. Resulting plots of water mean square displacement (MSD) versus time are shown in Fig. A6. Different symbols in Fig. A6 represent the MSD values of water molecules in different 3 Å layers categorized based on distance from the time-averaged Gibbs dividing interface. As shown in Fig. A6, the slope of MSD versus time decreases from the interfacial region to the core of the droplet, indicating that D∥ decreases from the interfacial region to the core. As discussed in the main text, the time interval ps was chosen for the calculation of D∥, that is .
The corresponding D∥ values determined for different water layers in simulations carried out with different thermostats are shown in Fig. A7. From Fig. A7, we can see that the NVT thermostat provides the largest D∥ values for all the water layers analyzed, followed by the NVE thermostat. Results obtained using the NVT with a fixed-angular-momentum thermostat are consistent with the results obtained using the LD thermostat and approach the correct bulk liquid water diffusion coefficient value D=0.25 Å2 ps−1 in the droplet core. The difference in D∥ values obtained using different thermostats is consistent with our visual observation of droplet configuration during the MD simulations. In simulations with the NVT thermostat, the simulated isolated droplet shows consistent rotational motion around the droplet's center of mass (com) such that the standard Einstein relation overestimates D∥, particularly near the interface. This effect is inhibited in simulations carried out using the NVT with a fixed-angular-momentum thermostat or the LD thermostat. Given that the bulk-liquid-like region of individual droplets should show D∥ values equal to the bulk liquid water diffusion coefficient, D=0.2 Å2 ps−1, diffusion coefficients reported in the main text are based on simulations carried out using the NVT thermostat with fixed system angular momentum.
D2 Sensitivity to the frame of reference (com and inst scheme)
D2.1 Diffusion coefficient parallel to the interface (D∥)
The Einstein relation was used to calculate D∥ under both the com and inst schemes, i.e., relative to the average or instantaneous interface. Both schemes are expected to provide mutually consistent results for D∥, irrespective of distance from the interface because capillary waves exist only at the interface and are mostly transverse waves that should have negligible impact on water displacement parallel to the interface. A comparison of D∥ values calculated under both schemes is presented in Fig. A8a for droplets of Nw=3000. As expected, the two schemes provide mutually consistent values. D∥ values calculated for different simulated systems under the com scheme are shown in Fig. A8b.
D2.2 Diffusion coefficient normal to the interface (D⟂)
As discussed in the main text, D⟂ values were determined as a function of distance from the interface by comparing simulation trajectories to the solution of the anisotropic Smoluchowski equation. The com and inst schemes are expected to yield different D⟂ values near the interface (larger in the case of the com scheme) but similar results in the bulk-liquid-like region because the com scheme intrinsically includes motions due to capillary waves as part of the interfacial water dynamics, whereas the inst scheme excludes the interface fluctuation and only quantifies water displacement relative to the instantaneous interface. Since the magnitude of capillary waves increases with droplet size (as observed based on both ϕ values and interfacial width as noted above), the difference between the D⟂ values at the interface calculated with the two schemes should increase with droplet size.
As shown in Fig. A9, we obtained mutually consistent D⟂ values near 0.25 Å2 ps−1 under both com and inst schemes for the bulk liquid region in the pure-liquid-water droplets of Nw=5000 (D=6.6 nm), which validates our calculation method. For the same systems, for the interfacial water layer with a thickness of 3 Å, we obtained a D⟂ value in the range of [0.20, 0.22] Å2 ps−1 under the com scheme and a smaller value in the range of [0.15, 0.17] under the inst scheme as shown in Fig. A10. We note that although the observation of smaller interfacial D⟂ values under the inst scheme compared with the com scheme is consistent with our expectation, our interfacial water D⟂ values under both schemes are smaller than the values reported in previous simulation studies for the flat water–air interface (Liu et al., 2004; Wick and Dang, 2005). This discrepancy might be due to different water models, different interfacial layer definitions, or differences in the curve-fitting procedure required to determine D⟂. As noted in the main text, our observations of relatively low D⟂ values near the interface are consistent with reports of slower water reorientational kinetics near hydrophobic surfaces. The discrepancies between different reported values of D⟂ for interfacial water should be carefully examined in future studies.
The data in the study are available from the authors upon request (xiaohanl@princeton.edu).
XL and ICB designed the research. XL performed the research. XL analyzed the data. XL wrote the paper. ICB edited the paper.
The contact author has declared that neither of the authors has any competing interests.
Publisher's note: Copernicus Publications remains neutral with regard to jurisdictional claims in published maps and institutional affiliations.
This material is based upon work supported by the US Department of Energy, Office of Science, Office of Basic Energy Sciences, Chemical Sciences, Geosciences, and Biosciences (CSGB) Division, Geosciences program under Award Number DE-SC0018419. Molecular dynamics simulations were performed using computational resources managed and supported by the National Energy Research Scientific Computing Center (NERSC), which is supported by the US Department of Energy Office of Science under award number DE-AC02-05CH11231 and by Princeton Research Computing, a consortium of groups including the Princeton Institute for Computational Science and Engineering (PICSciE) and the Office of Information Technology's High Performance Computing Center and Visualization Laboratory at Princeton University.
This research has been supported by the US Department of Energy, Office of Science, Office of Basic Energy Sciences, CSGB Division (award no. DE-SC0018419).
This paper was edited by Lynn M. Russell and reviewed by Robert McGraw and two anonymous referees.
Abraham, M. J., Murtola, T., Schulz, R., Páll, S., Smith, J. C., Hess, B., and Lindahl, E.: GROMACS: High performance molecular simulations through multi-level parallelism from laptops to supercomputers, SoftwareX, 1, 19–25, 2015. a
Abramzon, A. A. and Gaukhberg, R. D.: Surface tension of salt solutions, Zhurnal Prikladnoj Khimii, 66, 2145–2156, 1993. a
Alper, H. E. and Levy, R. M.: Computer simulations of the dielectric properties of water: studies of the simple point charge and transferrable intermolecular potential models, J. Chem. Phys., 91, 1242–1251, 1989. a
Ault, A. P. and Axson, J. L.: Atmospheric aerosol chemistry: Spectroscopic and microscopic advances, Anal. Chem., 89, 430–452, 2017. a
Azouzi, M. E. M., Ramboz, C., Lenain, J.-F., and Caupin, F.: A coherent picture of water at extreme negative pressure, Nat. Phys., 9, 38–41, 2013. a
Bahadur, R. and Russell, L. M.: Effect of surface tension from MD simulations on size-dependent deliquescence of NaCl nanoparticles, Aerosol Sci. Tech., 42, 369–376, 2008. a, b, c, d, e
Bahadur, R., Russell, L. M., and Alavi, S.: Surface tensions in NaCl-water-air systems from MD simulations, J. Phys. Chem. B, 111, 11989–11996, 2007. a
Barclay, P. L. and Lukes, J. R.: Curvature dependence of the mass accommodation coefficient, Langmuir, 35, 6196–6202, 2019. a, b, c
Benjamin, S. G., Brown, J. M., Brunet, G., Lynch, P., Saito, K., and Schlatter, T. W.: 100 years of progress in forecasting and NWP applications, Meteorol. Monogr., 59, 13.1–13.67, 2019. a
Berendsen, H. J. C., Grigera, J. R., and Straatsma, T. P.: The missing term in effective pair potentials, J. Phys. Chem., 91, 6269–6271, 1987. a
Biskos, G., Malinowski, A., Russell, L. M., Buseck, P. R., and Martin, S. T.: Nanosize effect on the deliquescence and the efflorescence of sodium chloride particles, Aerosol Sci. Tech., 40, 97–106, 2006a. a, b, c
Biskos, G., Paulsen, D., Russell, L. M., Buseck, P. R., and Martin, S. T.: Prompt deliquescence and efflorescence of aerosol nanoparticles, Atmos. Chem. Phys., 6, 4633–4642, https://doi.org/10.5194/acp-6-4633-2006, 2006b. a
Bocquet, L. and Charlaix, E.: Nanofluidics, from bulk to interfaces, Chem. Soc. Rev., 39, 1073–1095, 2010. a
Bourg, I. C. and Steefel, C. I.: Molecular dynamics simulations of water structure and diffusion in silica nanopores, J. Phys. Chem. C, 116, 11556–11564, 2012. a
Brown, E. C., Mucha, M., Jungwirth, P., and Tobias, D. J.: Structure and vibrational spectroscopy of salt water/air interfaces: predictions from classical molecular dynamics simulations, J. Phys. Chem. B, 109, 7934–7940, 2005. a
Burian, S., Isaiev, M., Termentzidis, K., Sysoev, V., and Bulavin, L.: Size dependence of the surface tension of a free surface of an isotropic fluid, Phys. Rev. E, 95, 062801, https://doi.org/10.1103/PhysRevE.95.062801, 2017. a
Bzdek, B. R. and Reid, J. P.: Perspective: Aerosol microphysics: From molecules to the chemical physics of aerosols, J. Chem. Phys., 147, 220901, https://doi.org/10.1063/1.5002641, 2017. a
Bzdek, B. R., Power, R. M., Simpson, S. H., Reid, J. P., and Royall, C. P.: Precise, contactless measurements of the surface tension of picolitre aerosol droplets, Chem. Sci., 7, 274–285, 2016. a
Bzdek, B. R., Reid, J. P., and Cotterell, M. I.: Open questions on the physical properties of aerosols, Commun. Chem., 3, 105, https://doi.org/10.1038/s42004-020-00342-9, 2020a. a
Bzdek, B. R., Reid, J. P., Malila, J., and Prisle, N. L.: The surface tension of surfactant-containing, finite volume droplets, P. Natl. Acad. Sci. USA, 117, 8335–8343, 2020b. a
Caleman, C., Hub, J. S., van Maaren, P. J., and van der Spoel, D.: Atomistic simulation of ion solvation in water explains surface preference of halides, P. Natl. Acad. Sci. USA 108, 6838–6842, 2011. a, b
Chakraborty, P. and Zachariah, M. R.: Sticking coefficient and processing of water vapor on organic-coated nanoaerosols, J. Phys. Chem. A, 112, 966–972, 2008. a, b
Chan, M. N., Zhang, H., Goldstein, A. H., and Wilson, K. R.: Role of water and phase in the heterogeneous oxidation of solid and aqueous succinic acid aerosol by hydroxyl radicals, J. Phys. Chem. C, 118, 28978–28992, 2014. a
Chowdhary, J. and Ladanyi, B. M.: Molecular dynamics simulation of aerosol-OT reverse micelles, J. Phys. Chem. B, 113, 15029–15039, 2009. a, b
Ciobanu, V. G., Marcolli, C., Krieger, U. K., Weers, U., and Peter, T.: Liquid-liquid phase separation in mixed organic/inorganic aerosol particles, J. Phys. Chem. A, 113, 10966–10978, 2009. a
D'Auria, R. and Tobias, D. J.: Relation between surface tension and ion adsorption at the air-water interface: a molecular dynamics simulation study, J. Phys. Chem. A, 113, 7286–7293, 2009. a, b
Davis, E. J.: A history and state-of-the-art of accommodation coefficients, Atmos. Res., 82, 561–578, 2006. a
Diveky, M. E., Roy, S., Cremer, J. W., David, G., and Signorell, R.: Assessing relative humidity dependent photoacoustics to retrieve mass accommodation coefficients of single optically trapped aerosol particles, Phys. Chem. Chem. Phys., 21, 4721–4731, 2019. a, b
Diveky, M. E., Gleichweit, M. J., Roy, S., and Signorell, R.: Shining new light on the kinetics of water uptake by organic aerosol particles, J. Phys. Chem. A, 125, 3528–3548, 2021. a, b, c, d
Duffey, K. C., Shih, O., Wong, N. L., Drisdell, W. S., Saykally, R. J., and Cohen, R. C.: Evaporation kinetics of aqueous acetic acid droplets: effects of soluble organic aerosol components on the mechanism of water evaporation, Phys. Chem. Chem. Phys., 15, 11634–11639, 2013. a, b
El Guendouzi, M. and Dinane, A.: Determination of water activities, osmotic and activity coefficients in aqueous solutions using the hygrometric method, J. Chem. Thermodynam., 32, 297–310, 2000. a
Enghoff, M. B. and Svensmark, H.: The role of atmospheric ions in aerosol nucleation – a review, Atmos. Chem. Phys., 8, 4911–4923, https://doi.org/10.5194/acp-8-4911-2008, 2008. a
Estillore, A. D., Morris, H. S., Or, V. W., Lee, H. D., Alves, M. R., Marciano, M. A., Laskina, O., Qin, Z., Tivanski, A. V., and Grassian, V. H.: Linking hygroscopicity and the surface microstructure of model inorganic salts, simple and complex carbohydrates, and authentic sea spray aerosol particles, Phys. Chem. Chem. Phys., 19, 21101–21111, 2017. a
Evans, D. J. and Holian, B. L.: The nose–hoover thermostat, J. Chem. Phys., 83, 4069–4074, 1985. a
Evoy, E., Kamal, S., Patey, G. N., Martin, S. T., and Bertram, A. K.: Unified Description of Diffusion Coefficients from Small to Large Molecules in Organic–Water Mixtures, J. Phys. Chem. A, 124, 2301–2308, 2020. a
Fan, J., Rosenfeld, D., Zhang, Y., Giangrande, S. E., Li, Z., Machado, L. A., Martin, S. T., Yang, Y., Wang, J., Artaxo, P., Barbosa, H. M. J., Braga, R. C., Comstock, J. M., Feng, Z., Gao, W., Gomes, H. B., Mei, F., Pöhlker, C., Pöhlker, M., Pöschl, U., and Souza, R. A. F. D.: Substantial convection and precipitation enhancements by ultrafine aerosol particles, Science, 359, 411–418, 2018. a
Faust, J. A., Wong, J. P., Lee, A. K., and Abbatt, J. P.: Role of aerosol liquid water in secondary organic aerosol formation from volatile organic compounds, Environ. Sci. Technol., 51, 1405–1413, 2017. a
Fayer, M. D.: Dynamics of water interacting with interfaces, molecules, and ions, Accounts Chem. Res., 45, 3–14, 2012. a
Fayer, M. D. and Levinger, N. E.: Analysis of water in confined geometries and at interfaces, Annu. Rev. Anal. Chem., 3, 89, https://doi.org/10.1146/annurev-anchem-070109-103410, 2010. a
Frank, E. S., Fan, H., Shrestha, M., Riahi, S., Tobias, D. J., and Grassian, V. H.: Impact of adsorbed water on the interaction of limonene with hydroxylated SiO2: implications of π-hydrogen bonding for surfaces in humid environments, J. Phys. Chem. A, 124, 10592–10599, 2020. a
Frenkel, D. and Smit, B.: Understanding molecular simulation: from algorithms to applications, in: vol. 1, Elsevier, ISBN 0-12-267351-4, 2001. a
Garrett, B. C., Schenter, G. K., and Morita, A.: Molecular simulations of the transport of molecules across the liquid/vapor interface of water, Chem. Rev., 106, 1355–1374, 2006. a, b, c, d
Giamarelou, M., Smith, M., Papapanagiotou, E., Martin, S. T., and Biskos, G.: Hygroscopic properties of potassium-halide nanoparticles, Aerosol Sci. Tech., 52, 536–545, 2018. a, b, c
Guo, S., Hu, M., Peng, J., Wu, Z., Zamora, M. L., Shang, D., Du, Z., Zheng, J., Fang, X., Tang, R., Wu, Y., Zeng, L., Shuai, S., Zhang, W., Wang, Y., Ji, Y., Li, Y., Zhang, A. L., Wang, W., Zhang, F., Zhao, J., Gong, X., Wang, C., Molina, M. J., and Zhang, R.: Remarkable nucleation and growth of ultrafine particles from vehicular exhaust, P. Natl. Acad. Sci. USA, 117, 3427–3432, 2020. a
Hallquist, M., Wenger, J. C., Baltensperger, U., Rudich, Y., Simpson, D., Claeys, M., Dommen, J., Donahue, N. M., George, C., Goldstein, A. H., Hamilton, J. F., Herrmann, H., Hoffmann, T., Iinuma, Y., Jang, M., Jenkin, M. E., Jimenez, J. L., Kiendler-Scharr, A., Maenhaut, W., McFiggans, G., Mentel, Th. F., Monod, A., Prévôt, A. S. H., Seinfeld, J. H., Surratt, J. D., Szmigielski, R., and Wildt, J.: The formation, properties and impact of secondary organic aerosol: current and emerging issues, Atmos. Chem. Phys., 9, 5155–5236, https://doi.org/10.5194/acp-9-5155-2009, 2009. a
Hämeri, K., Laaksonen, A., Väkevä, M., and Suni, T.: Hygroscopic growth of ultrafine sodium chloride particles, J. Geophys. Res.-Atmos., 106, 20749–20757, 2001. a
Hård, S. and Johansson, K.: The surface tension of concentrated aqueous solutions of 1.1-electrolytes measured by means of Wilhelmy and laser light scattering methods, J. Colloid Interf. Sci., 60, 467–472, 1977. a
Hess, B.: P-LINCS: A parallel linear constraint solver for molecular simulation, J. Chem. Theor. Comput., 4, 116–122, 2008. a
Horinek, D., Herz, A., Vrbka, L., Sedlmeier, F., Mamatkulov, S. I., and Netz, R. R.: Specific ion adsorption at the air/water interface: The role of hydrophobic solvation, Chem. Phys. Lett., 479, 173–183, 2009. a
Hub, J. S., de Groot, B. L., Grubmüller, H., and Groenhof, G.: Quantifying artifacts in Ewald simulations of inhomogeneous systems with a net charge, J. Chem. Theor. Comput., 10, 381–390, 2014. a
Hyder, M., Genberg, J., Sandahl, M., Swietlicki, E., and Jönsson, J. Å.: Yearly trend of dicarboxylic acids in organic aerosols from south of Sweden and source attribution, Atmos. Environ., 57, 197–204, 2012. a
Irving, J. and Kirkwood, J. G.: The statistical mechanical theory of transport processes. IV. The equations of hydrodynamics, J. Chem. Phys., 18, 817–829, 1950. a, b
Ismail, A. E., Grest, G. S., and Stevens, M. J.: Capillary waves at the liquid-vapor interface and the surface tension of water, J. Chem. Phys., 125, 014702, https://doi.org/10.1063/1.2209240, 2006. a, b
Jorgensen, W. L., Maxwell, D. S., and Tirado-Rives, J.: Development and testing of the OPLS all-atom force field on conformational energetics and properties of organic liquids, J. Am. Chem. Soc., 118, 11225–11236, 1996. a
Joswiak, M. N., Duff, N., Doherty, M. F., and Peters, B.: Size-dependent surface free energy and Tolman-corrected droplet nucleation of TIP4P/2005 water, J. Phys. Chem. Lett., 4, 4267–4272, 2013. a
Joung, I. S. and Cheatham III, T. E.: Determination of alkali and halide monovalent ion parameters for use in explicitly solvated biomolecular simulations, J. Phys. Chem. B, 112, 9020–9041, 2008. a, b
Joung, I. S. and Cheatham III, T. E.: Molecular dynamics simulations of the dynamic and energetic properties of alkali and halide ions using water-model-specific ion parameters, J. Phys. Chem. B, 113, 13279–13290, 2009. a, b, c, d
Julin, J., Shiraiwa, M., Miles, R. E., Reid, J. P., Pöschl, U., and Riipinen, I.: Mass accommodation of water: Bridging the gap between molecular dynamics simulations and kinetic condensation models, J. Phys. Chem. A, 117, 410–420, 2013. a, b
Jungwirth, P. and Tobias, D. J.: Surface effects on aqueous ionic solvation: A molecular dynamics simulation study of NaCl at the air/water interface from infinite dilution to saturation, J. Phys. Chem. B, 104, 7702–7706, 2000. a
Jungwirth, P. and Tobias, D. J.: Molecular structure of salt solutions: A new view of the interface with implications for heterogeneous atmospheric chemistry, J. Phys. Chem. B, 105, 10468–10472, 2001. a
Jungwirth, P. and Tobias, D. J.: Specific ion effects at the air/water interface, Chem. Rev., 106, 1259–1281, 2006. a, b, c
Karadima, K. S., Mavrantzas, V. G., and Pandis, S. N.: Insights into the morphology of multicomponent organic and inorganic aerosols from molecular dynamics simulations, Atmos. Chem. Phys., 19, 5571–5587, https://doi.org/10.5194/acp-19-5571-2019, 2019. a, b
Karlsson, L., Baccarini, A., Duplessis, P., Baumgardner, D., Brooks, I. M., Chang, R. Y.-W., Dada, L., Dällenbach, K. R., Heikkinen, L., Krejci, R., Leaitch, W. R., Leck, C., Partridge, D. G., Salter, M. E., Wernli, H., Wheeler, M. J., Schmale, J., and Zieger, P.: Physical and chemical properties of cloud droplet residuals and aerosol particles during the Arctic Ocean 2018 expedition, J. Geophys. Res.-Atmos., 127, e2021JD036383, https://doi.org/10.1029/2021JD036383, 2022. a
Kawamura, K. and Yasui, O.: Diurnal changes in the distribution of dicarboxylic acids, ketocarboxylic acids and dicarbonyls in the urban Tokyo atmosphere, Atmos. Environ., 39, 1945–1960, 2005. a
Kim, J. S., Wu, Z., Morrow, A. R., Yethiraj, A., and Yethiraj, A.: Self-diffusion and viscosity in electrolyte solutions, J. Phys. Chem. B, 116, 12007–12013, 2012. a, b, c, d
Kim, Q. and Jhe, W.: Interfacial thermodynamics of spherical nanodroplets: molecular understanding of surface tension via a hydrogen bond network, Nanoscale, 12, 18701–18709, 2020. a, b
Kiss, G., Tombácz, E., and Hansson, H.-C.: Surface tension effects of humic-like substances in the aqueous extract of tropospheric fine aerosol, J. Atmos. Chem., 50, 279–294, 2005. a
Kostenidou, E., Karnezi, E., Hite Jr., J. R., Bougiatioti, A., Cerully, K., Xu, L., Ng, N. L., Nenes, A., and Pandis, S. N.: Organic aerosol in the summertime southeastern United States: components and their link to volatility distribution, oxidation state and hygroscopicity, Atmos. Chem. Phys., 18, 5799–5819, https://doi.org/10.5194/acp-18-5799-2018, 2018. a, b
Kreidenweis, S. M., Petters, M., and Lohmann, U.: 100 years of progress in cloud physics, aerosols, and aerosol chemistry research, Meteorol. Monogr., 59, 11.1–11.7, https://doi.org/10.1175/AMSMONOGRAPHS-D-18-0024.1, 2019. a
Kulmala, M., Laaksonen, A., Charlson, R. J., and Korhonen, P.: Clouds without supersaturation, Nature, 388, 336–337, 1997. a, b
Kürten, A., Li, C., Bianchi, F., Curtius, J., Dias, A., Donahue, N. M., Duplissy, J., Flagan, R. C., Hakala, J., Jokinen, T., Kirkby, J., Kulmala, M., Laaksonen, A., Lehtipalo, K., Makhmutov, V., Onnela, A., Rissanen, M. P., Simon, M., Sipilä, M., Stozhkov, Y., Tröstl, J., Ye, P., and McMurry, P. H.: New particle formation in the sulfuric acid–dimethylamine–water system: reevaluation of CLOUD chamber measurements and comparison to an aerosol nucleation and growth model, Atmos. Chem. Phys., 18, 845–863, https://doi.org/10.5194/acp-18-845-2018, 2018. a
Laage, D., Stirnemann, G., and Hynes, J. T.: Why water reorientation slows without iceberg formation around hydrophobic solutes, J. Phys. Chem. B, 113, 2428–2435, 2009. a
Laaksonen, A. and Malila, J.: An adsorption theory of heterogeneous nucleation of water vapour on nanoparticles, Atmos. Chem. Phys., 16, 135–143, https://doi.org/10.5194/acp-16-135-2016, 2016. a, b
Lau, G. V., Ford, I. J., Hunt, P. A., Müller, E. A., and Jackson, G.: Surface thermodynamics of planar, cylindrical, and spherical vapour-liquid interfaces of water, J. Chem. Phys., 142, 114701, https://doi.org/10.1063/1.4913371, 2015. a, b, c, d, e, f
Lawler, M. J., Saltzman, E. S., Karlsson, L., Zieger, P., Salter, M., Baccarini, A., Schmale, J., and Leck, C.: New insights into the composition and origins of ultrafine aerosol in the summertime high Arctic, Geophys. Res. Lett., 48, e2021GL094395, https://doi.org/10.1029/2021GL094395, 2021. a
Lee, H. D. and Tivanski, A. V.: Atomic force microscopy: an emerging tool in measuring the phase state and surface tension of individual aerosol particles, Annu. Rev. Phys. Chem., 72, 235–252, 2021. a
Levin, Y., Dos Santos, A. P., and Diehl, A.: Ions at the air-water interface: an end to a hundred-year-old mystery?, Phys. Rev. Lett., 103, 257802, https://doi.org/10.1103/PhysRevLett.103.257802, 2009. a, b
Lewis, E. R. and Schwartz, S. E.: Sea salt aerosol production: mechanisms, methods, measurements, and models, in: vol. 152, American Geophysical Union, ISBN 087590-417-3, 2004. a
Li, W., Shao, L., Zhang, D., Ro, C.-U., Hu, M., Bi, X., Geng, H., Matsuki, A., Niu, H., and Chen, J.: A review of single aerosol particle studies in the atmosphere of East Asia: morphology, mixing state, source, and heterogeneous reactions, J. Clean. Product., 112, 1330–1349, 2016. a
Li, W., Pak, C. Y., and Tse, Y.-L. S.: Free energy study of H2O, N2O5, SO2, and O3 gas sorption by water droplets/slabs, J. Chem. Phys., 148, 164706, https://doi.org/10.1063/1.5022389, 2018. a, b
Li, W., Pak, C. Y., Wang, X., and Tse, Y.-L. S.: Uptake of common atmospheric gases by organic-coated water droplets, J. Phys. Chem. C, 123, 18924–18931, 2019. a, b
Li, X., Hede, T., Tu, Y., Leck, C., and Ågren, H.: Surface-active cis-pinonic acid in atmospheric droplets: a molecular dynamics study, J. Phys. Chem. Lett., 1, 769–773, 2010. a, b, c, d, e, f
Li, X., Hede, T., Tu, Y., Leck, C., and Ågren, H.: Glycine in aerosol water droplets: a critical assessment of Köhler theory by predicting surface tension from molecular dynamics simulations, Atmos. Chem. Phys., 11, 519–527, https://doi.org/10.5194/acp-11-519-2011, 2011. a, b
Li, X., Hede, T., Tu, Y., Leck, C., and Ågren, H.: Cloud droplet activation mechanisms of amino acid aerosol particles: insight from molecular dynamics simulations, Tellus B, 65, 20476, https://doi.org/10.3402/tellusb.v65i0.20476, 2013. a, b
Liu, P., Harder, E., and Berne, B. J.: On the calculation of diffusion coefficients in confined fluids and interfaces with an application to the liquid-vapor interface of water, J. Phys. Chem. B, 108, 6595–6602, 2004. a, b, c, d
Liu, X., Day, D. A., Krechmer, J. E., Brown, W., Peng, Z., Ziemann, P. J., and Jimenez, J. L.: Direct measurements of semi-volatile organic compound dynamics show near-unity mass accommodation coefficients for diverse aerosols, Commun. Chem., 2, 1–9, 2019. a, b
Lovrić, J., Duflot, D., Monnerville, M., Toubin, C., and Briquez, S.: Water-induced organization of palmitic acid at the surface of a model sea salt particle: A molecular dynamics study, J. Phys. Chem. A, 120, 10141–10149, 2016. a
Luo, M., Wauer, N. A., Angle, K. J., Dommer, A. C., Song, M., Nowak, C. M., Amaro, R. E., and Grassian, V. H.: Insights into the behavior of nonanoic acid and its conjugate base at the air/water interface through a combined experimental and theoretical approach, Chem. Sci., 11, 10647–10656, 2020. a
Ma, X., Chakraborty, P., Henz, B. J., and Zachariah, M. R.: Molecular dynamic simulation of dicarboxylic acid coated aqueous aerosol: structure and processing of water vapor, Phys. Chem. Chem. Phys., 13, 9374–9384, 2011. a, b, c, d
McDonald, J. E.: Erroneous cloud-physics applications of raoult's law, J. Meteorol., 10, 68–70, 1953. a, b
McGraw, R. and Laaksonen, A.: Interfacial curvature free energy, the Kelvin relation, and vapor–liquid nucleation rate, J. Chem. Phys., 106, 5284–5287, 1997. a
Menzl, G., Gonzalez, M. A., Geiger, P., Caupin, F., Abascal, J. L., Valeriani, C., and Dellago, C.: Molecular mechanism for cavitation in water under tension, P. Natl. Acad. Sci. USA, 113, 13582–13587, 2016. a
Mester, Z. and Panagiotopoulos, A. Z.: Mean ionic activity coefficients in aqueous NaCl solutions from molecular dynamics simulations, J. Chem. Phys., 142, 044507, https://doi.org/10.1063/1.4906320, 2015a. a, b
Mester, Z. and Panagiotopoulos, A. Z.: Temperature-dependent solubilities and mean ionic activity coefficients of alkali halides in water from molecular dynamics simulations, J. Chem. Phys., 143, 044505, https://doi.org/10.1063/1.4926840, 2015b. a
Min, S. H. and Berkowitz, M. L.: Bubbles in water under stretch-induced cavitation, J. Chem. Phys., 150, 054501, https://doi.org/10.1063/1.5079735, 2019. a
Nagayama, G. and Tsuruta, T.: A general expression for the condensation coefficient based on transition state theory and molecular dynamics simulation, J. Chem. Phys., 118, 1392–1399, 2003. a
Ni, Y., Gruenbaum, S. M., and Skinner, J. L.: Slow hydrogen-bond switching dynamics at the water surface revealed by theoretical two-dimensional sum-frequency spectroscopy, P. Natl. Acad. Sci. USA, 110, 1992–1998, 2013. a
Noziere, B., Baduel, C., and Jaffrezo, J.-L.: The dynamic surface tension of atmospheric aerosol surfactants reveals new aspects of cloud activation, Nat. Commun., 5, 1–7, 2014. a
Ohashi, K., Kobayashi, K., Fujii, H., and Watanabe, M.: Evaporation coefficient and condensation coefficient of vapor under high gas pressure conditions, Sci. Rep., 10, 1–10, 2020. a
Ohmine, I. and Tanaka, H.: Fluctuation, relaxations, and hydration in liquid water. Hydrogen-bond rearrangement dynamics, Chem. Rev., 39, 2545–2566, 1993. a
Ohno, P. E., Qin, Y., Ye, J., Wang, J., Bertram, A. K., and Martin, S. T.: Fluorescence aerosol flow tube spectroscopy to detect liquid–liquid phase separation, ACS Earth Space Chem., 5, 1223–1232, 2021. a
Paul, S. and Chandra, A.: Hydrogen bond properties and dynamics of liquid- vapor interfaces of aqueous methanol solutions, J. Chem. Theor. Comput., 1, 1221–1231, 2005. a, b, c
Petters, M. D. and Kreidenweis, S. M.: A single parameter representation of hygroscopic growth and cloud condensation nucleus activity, Atmos. Chem. Phys., 7, 1961–1971, https://doi.org/10.5194/acp-7-1961-2007, 2007. a, b
Petters, M. D. and Kreidenweis, S. M.: A single parameter representation of hygroscopic growth and cloud condensation nucleus activity – Part 2: Including solubility, Atmos. Chem. Phys., 8, 6273–6279, https://doi.org/10.5194/acp-8-6273-2008, 2008. a, b
Petters, M. D. and Kreidenweis, S. M.: A single parameter representation of hygroscopic growth and cloud condensation nucleus activity – Part 3: Including surfactant partitioning, Atmos. Chem. Phys., 13, 1081–1091, https://doi.org/10.5194/acp-13-1081-2013, 2013. a, b
Petters, S. S. and Petters, M. D.: Surfactant effect on cloud condensation nuclei for two-component internally mixed aerosols, J. Geophys. Res.-Atmos., 121, 1878–1895, 2016. a, b
Pierce, J. R., Leaitch, W. R., Liggio, J., Westervelt, D. M., Wainwright, C. D., Abbatt, J. P. D., Ahlm, L., Al-Basheer, W., Cziczo, D. J., Hayden, K. L., Lee, A. K. Y., Li, S.-M., Russell, L. M., Sjostedt, S. J., Strawbridge, K. B., Travis, M., Vlasenko, A., Wentzell, J. J. B., Wiebe, H. A., Wong, J. P. S., and Macdonald, A. M.: Nucleation and condensational growth to CCN sizes during a sustained pristine biogenic SOA event in a forested mountain valley, Atmos. Chem. Phys., 12, 3147–3163, https://doi.org/10.5194/acp-12-3147-2012, 2012. a
Qi, W., Wang, G., Dai, W., Liu, S., Zhang, T., Wu, C., Li, J., Shen, M., Guo, X., Meng, J., and Li, J.: Molecular characteristics and stable carbon isotope compositions of dicarboxylic acids and related compounds in wintertime aerosols of Northwest China, Sci. Rep., 12, 1–10, 2022. a
Qin, Y., Ye, J., Ohno, P., Zhai, J., Han, Y., Liu, P., Wang, J., Zaveri, R. A., and Martin, S. T.: Humidity Dependence of the Condensational Growth of α-Pinene Secondary Organic Aerosol Particles, Environ. Sci. Technol., 55, 14360–14369, 2021. a
Radola, B., Picaud, S., Vardanega, D., and Jedlovszky, P.: Molecular dynamics simulations of the interaction between water molecules and aggregates of acetic or propionic acid molecules, J. Phys. Chem. B, 119, 15662–15674, 2015. a
Radola, B., Picaud, S., Vardanega, D., and Jedlovszky, P.: Analysis of mixed formic and acetic acid aggregates interacting with water: a molecular dynamics simulation study, J. Phys. Chem. C, 121, 13863–13875, 2017. a
Radola, B., Picaud, S., Ortega, I. K., and Ciuraru, R.: Formation of atmospheric molecular clusters from organic waste products and sulfuric acid molecules: a DFT study, Environ. Sci.-Atmos., 1, 267–275, 2021. a
Rastak, N., Pajunoja, A., Acosta Navarro, J. C., Ma, J., Song, M., Partridge, D. G., Kirkevåg, A., Leong, Y., Hu, W. W., Taylor, N. F., Lambe, A., Cerully, K., Bougiatioti, A., Liu, P., Krejci, R., Petäjä, T., Percival, C., Davidovits, P., Worsnop, D. R., Ekman, A. M. L., Nenes, A., Martin, S., Jimenez, J. L., Collins, D. R., Topping, D. O., Bertram, A. K., Zuend, A., Virtanen, A., and Riipinen, I.: Microphysical explanation of the RH-dependent water affinity of biogenic organic aerosol and its importance for climate, Geophys. Res. Lett., 44, 5167–5177, 2017. a
Renbaum-Wolff, L., Song, M., Marcolli, C., Zhang, Y., Liu, P. F., Grayson, J. W., Geiger, F. M., Martin, S. T., and Bertram, A. K.: Observations and implications of liquid–liquid phase separation at high relative humidities in secondary organic material produced by α-pinene ozonolysis without inorganic salts, Atmos. Chem. Phys., 16, 7969–7979, https://doi.org/10.5194/acp-16-7969-2016, 2016. a
Russell, L. M. and Ming, Y.: Deliquescence of small particles, J. Chem. Phys., 116, 311–321, 2002. a, b
Sareen, N., Waxman, E. M., Turpin, B. J., Volkamer, R., and Carlton, A. G.: Potential of aerosol liquid water to facilitate organic aerosol formation: assessing knowledge gaps about precursors and partitioning, Environ. Sci. Technol., 51, 3327–3335, 2017. a
Sato, Y. and Suzuki, K.: How do aerosols affect cloudiness?, Science, 363, 580–581, 2019. a
Sedlmeier, F. and Netz, R. R.: The spontaneous curvature of the water-hydrophobe interface, J. Chem. Phys., 137, 135102, https://doi.org/10.1063/1.4755753, 2012. a
Seinfeld, J. H. and Pandis, S. N.: Atmospheric chemistry and physics: from air pollution to climate change, John Wiley and Sons, ISBN 9781119221166, 2016. a, b, c, d, e
Semeniuk, K. and Dastoor, A.: Current state of atmospheric aerosol thermodynamics and mass transfer modeling: A review, Atmosphere, 11, 156, https://doi.org/10.3390/atmos11020156, 2020. a
Shiraiwa, M. and Pöschl, U.: Mass accommodation and gas–particle partitioning in secondary organic aerosols: dependence on diffusivity, volatility, particle-phase reactions, and penetration depth, Atmos. Chem. Phys., 21, 1565–1580, https://doi.org/10.5194/acp-21-1565-2021, 2021. a, b, c
Shiraiwa, M., Pfrang, C., Koop, T., and Pöschl, U.: Kinetic multi-layer model of gas-particle interactions in aerosols and clouds (KM-GAP): linking condensation, evaporation and chemical reactions of organics, oxidants and water, Atmos. Chem. Phys., 12, 2777–2794, https://doi.org/10.5194/acp-12-2777-2012, 2012. a, b
Skarbalius, G., Džiugys, A., Misiulis, E., and Navakas, R.: Molecular dynamics study on water evaporation/condensation parameters, Microfluid. Nanofluid., 25, 1–13, 2021. a
Slade, J. H. and Knopf, D. A.: Multiphase OH oxidation kinetics of organic aerosol: The role of particle phase state and relative humidity, Geophys. Res. Lett., 41, 5297–5306, 2014. a
Smith, D. E. and Dang, L. X.: Computer simulations of NaCl association in polarizable water, J. Chem. Phys., 100, 3757–3766, 1994. a
Song, M., Marcolli, C., Krieger, U., Zuend, A., and Peter, T.: Liquid-liquid phase separation in aerosol particles: Dependence on O:C, organic functionalities, and compositional complexity, Geophys. Res. Lett., 39, L19801, https://doi.org/10.1029/2012GL052807, 2012. a
Song, M., Ham, S., Andrews, R. J., You, Y., and Bertram, A. K.: Liquid–liquid phase separation in organic particles containing one and two organic species: importance of the average O:C, Atmos. Chem. Phys., 18, 12075–12084, https://doi.org/10.5194/acp-18-12075-2018, 2018. a, b, c
Sun, L., Li, X., Hede, T., Tu, Y., Leck, C., and Ågren, H.: Molecular dynamics simulations of the surface tension and structure of salt solutions and clusters, J. Phys. Chem. B, 116, 3198–3204, 2012. a
Sun, L., Hede, T., Tu, Y., Leck, C., and Ågren, H.: Combined effect of glycine and sea salt on aerosol cloud droplet activation predicted by molecular dynamics simulations, J. Physi. Chem. A, 117, 10746–10752, 2013. a
Takahama, S. and Russell, L.: A molecular dynamics study of water mass accommodation on condensed phase water coated by fatty acid monolayers, J. Geophys. Res.-Atmos., 116, D02203, https://doi.org/10.1029/2010JD014842, 2011. a, b
Tang, F., Ohto, T., Sun, S., Rouxel, J. R., Imoto, S., Backus, E. H., Mukamel, S., Bonn, M., and Nagata, Y.: Molecular structure and modeling of water–air and ice–air interfaces monitored by sum-frequency generation, Chem. Rev., 120, 3633–3667, 2020. a
Thomas, J. L., Roeselova, M., Dang, L. X., and Tobias, D. J.: Molecular dynamics simulations of the solution- air interface of aqueous sodium nitrate, J. Phys. Chem. A, 111, 3091–3098, 2007. a
Thompson, S., Gubbins, K., Walton, J., Chantry, R., and Rowlinson, J.: A molecular dynamics study of liquid drops, J. Chem. Phys., 81, 530–542, 1984. a, b, c
Thornton, J. A., Mohr, C., Schobesberger, S., D'Ambro, E. L., Lee, B. H., and Lopez-Hilfiker, F. D.: Evaluating Organic Aerosol Sources and Evolution with a Combined Molecular Composition and Volatility Framework Using the Filter Inlet for Gases and Aerosols (FIGAERO), Account. Chem. Res., 53, 1415–1426, 2020. a
Torrie, G. M. and Valleau, J. P.: Nonphysical sampling distributions in Monte Carlo free-energy estimation: Umbrella sampling, J. Comput. Phys., 23, 187–199, 1977. a, b
Tran, N. K., Steinberg, S. M., and Johnson, B. J.: Volatile aromatic hydrocarbons and dicarboxylic acid concentrations in air at an urban site in the Southwestern US, Atmos. Environ., 34, 1845–1852, 2000. a
Tsimpanogiannis, I. N., Moultos, O. A., Franco, L. F., Spera, M. B. D. M., Erdős, M., and Economou, I. G.: Self-diffusion coefficient of bulk and confined water: a critical review of classical molecular simulation studies, Molec. Simul., 45, 425–453, 2019. a, b
Tsuruta, T. and Nagayama, G.: Molecular dynamics studies on the condensation coefficient of water, J. Phys. Chem. B, 108, 1736–1743, 2004. a
Tuckermann, R.: Surface tension of aqueous solutions of water-soluble organic and inorganic compounds, Atmos. Environ., 41, 6265–6275, 2007. a, b
Underwood, T. R. and Greenwell, H. C.: The water-alkane interface at various Nacl salt concentrations: a molecular dynamics study of the readily available force fields, Sci. Rep., 8, 1–11, 2018. a, b
Vardanega, D. and Picaud, S.: Water and formic acid aggregates: A molecular dynamics study, J. Chem. Phys., 141, 104701, https://doi.org/10.1063/1.4894658, 2014. a
Varilly, P. and Chandler, D.: Water evaporation: A transition path sampling study, J. Phys. Chem. B, 117, 1419–1428, 2013. a, b, c
Washburn, E. W., Hull, C., and West, C. J.: International critical tables of numerical data, physics, chemistry and technology, in: vol. 1, National research council, 1926. a
Wick, C. D. and Dang, L. X.: Diffusion at the Liquid- Vapor Interface of an Aqueous Ionic Solution Utilizing a Dual Simulation Technique, J. Phys. Chem. B, 109, 15574–15579, 2005. a, b, c
Wilhelmsen, Ø., Bedeaux, D., and Reguera, D.: Communication: Tolman length and rigidity constants of water and their role in nucleation, J. Chem. Phys., 142, 171103, https://doi.org/10.1063/1.4919689, 2015. a, b
Willard, A. P. and Chandler, D.: Instantaneous liquid interfaces, J. Phys. Chem. B, 114, 1954–1958, 2010. a, b, c
Williamson, C. J., Kupc, A., Axisa, D., Bilsback, K. R., Bui, T., Campuzano-Jost, P., Dollner, M., Froyd, K. D., Hodshire, A. L., Jimenez, J. L., Kodros, J. K., Luo, G, Murphy, D. M., Nault, B. A., Ray, E. A., Weinzierl, B., Wilson, J. C., Yu, F., Yu, P., Pierce, J., R., and Brock, C. A.: A large source of cloud condensation nuclei from new particle formation in the tropics, Nature, 574, 399–403, 2019. a
Winkler, P. M., Vrtala, A., Wagner, P. E., Kulmala, M., Lehtinen, K. E., and Vesala, T.: Mass and thermal accommodation during gas-liquid condensation of water, Phys. Rev. Lett., 93, 075701, https://doi.org/10.1103/PhysRevLett.93.075701, 2004. a
Winkler, P. M., Vrtala, A., Steiner, G., Wimmer, D., Vehkamäki, H., Lehtinen, K. E., Reischl, G. P., Kulmala, M., and Wagner, P. E.: Quantitative characterization of critical nanoclusters nucleated on large single molecules, Phys. Rev. Lett., 108, 085701, https://doi.org/10.1103/PhysRevLett.108.085701, 2012. a
Wise, M. E., Semeniuk, T. A., Bruintjes, R., Martin, S. T., Russell, L. M., and Buseck, P. R.: Hygroscopic behavior of NaCl-bearing natural aerosol particles using environmental transmission electron microscopy, J. Geophys. Res.-Atmos., 112, D10224, https://doi.org/10.1029/2006JD007678, 2007. a
Wu, Z., Chen, J., Wang, Y., Zhu, Y., Liu, Y., Yao, B., Zhang, Y., and Hu, M.: Interactions between water vapor and atmospheric aerosols have key roles in air quality and climate change, Nat. Sci. Rev., 5, 452–454, 2018. a
You, Y., Smith, M. L., Song, M., Martin, S. T., and Bertram, A. K.: Liquid–liquid phase separation in atmospherically relevant particles consisting of organic species and inorganic salts, Int. Rev. Phys. Chem., 33, 43–77, 2014. a
Zakharov, V. V., Brodskaya, E. N., and Laaksonen, A.: Surface tension of water droplets: A molecular dynamics study of model and size dependencies, J. Chem. Phys., 107, 10675–10683, 1997. a, b
Zhang, Q., Jimenez, J. L., Canagaratna, M. R., Allan, J. D., Coe, H., Ulbrich, I., Alfarra, M. R., Takami, A., Middlebrook, A. R., Sun, Y. L., Dzepina, K., Dunlea, E., Docherty, K., DeCarlo, P. F., Salcedo, D., Onasch, T., Jayne, J. T., Miyoshi, T., Shimono, A., Hatakeyama, S., Takegawa, N., Kondo, Y., Schneider, J., Drewnick, F., Borrmann, S., Weimer, S., Demerjian, K., Williams, P., Bower, K., Bahreini, R., Cottrell, L., Griffin, R. J., Rautiainen, J., Sun, J. Y., Zhang, Y. M., and Worsnop, D. R.: Ubiquity and dominance of oxygenated species in organic aerosols in anthropogenically-influenced Northern Hemisphere midlatitudes, Geophys. Res. Lett., 34, L13801, https://doi.org/10.1029/2007GL029979, 2007. a
Zhao, W., Kawamura, K., Yue, S., Wei, L., Ren, H., Yan, Y., Kang, M., Li, L., Ren, L., Lai, S., Li, J., Sun, Y., Wang, Z., and Fu, P.: Molecular distribution and compound-specific stable carbon isotopic composition of dicarboxylic acids, oxocarboxylic acids and α-dicarbonyls in PM2.5 from Beijing, China, Atmos. Chem. Phys., 18, 2749–2767, https://doi.org/10.5194/acp-18-2749-2018, 2018. a
Zhao, Z., Kong, K., Wang, S., Zhou, Y., Cheng, D., Wang, W., Zeng, X. C., and Li, H.: Understanding Hygroscopic Nucleation of Sulfate Aerosols: Combination of Molecular Dynamics Simulation with Classical Nucleation Theory, J. Phys. Chem. Lett., 10, 1126–1132, 2019. a
Zheng, Y., Chen, Q., Cheng, X., Mohr, C., Cai, J., Huang, W., Shrivastava, M., Ye, P., Fu, P., Shi, X., Ge, Y., Liao, K., Miao, R., Qiu, X., Koenig, T. K., and Chen, S.: Precursors and pathways leading to enhanced secondary organic aerosol formation during severe haze episodes, Environ. Sci. Technol., 55, 15680–15693, 2021. a, b
Zieger, P., Väisänen, O., Corbin, J. C., Partridge, D. G., Bastelberger, S., Mousavi-Fard, M., Rosati, B., Gysel, M., Krieger, U. K., Leck, C., Nenes, A., Riipinen, I., Virtanen, A., and Salter, M. E.: Revising the hygroscopicity of inorganic sea salt particles, Nat. Commun., 8, 15883, https://doi.org/10.1038/ncomms15883, 2017. a
- Abstract
- Introduction
- Methods
- Results and discussions
- Conclusions
- Appendix A: Discussion of the use of the equimolar radius Re in surface tension calculations
- Appendix B: Sensitivity of ion concentration enhancement to ion interfacial exclusion width
- Appendix C: Deliquescence relative humidity as a function of nanoparticle size
- Appendix D: Diffusion coefficient calculation
- Data availability
- Author contributions
- Competing interests
- Disclaimer
- Acknowledgements
- Financial support
- Review statement
- References