the Creative Commons Attribution 4.0 License.
the Creative Commons Attribution 4.0 License.
 | 23 Feb 2023
Impacts of reductions in non-methane short-lived climate forcers on future climate extremes and the resulting population exposure risks in eastern and southern Asia
Yingfang Li
Yadong Lei
Huizheng Che
Xiaoye Zhang
Non-methane short-lived climate forcers (SLCFs), including aerosols, ozone, and their precursors, are important climate forcings and primary air pollutants. Future stringent SLCF emissions controls to mitigate air pollution will substantially impact regional climate change. Here, we investigate the changes in future climate extremes and resulting population exposure risks in Asia during 2031–2050 in response to non-methane SLCF emissions reductions using multi-model ensemble (MME) simulations under two shared socioeconomic pathway (SSP) scenarios with the same greenhouse gas (GHG) emissions but weak (SSP3-7.0) and strong (SSP3-7.0-lowNTCF) air quality control measures from the Aerosol and Chemistry Model Intercomparison Project (AerChemMIP), which is endorsed by the Coupled Model Intercomparison Project phase 6 (CMIP6). The MME results show that future reductions in non-methane SLCF emissions lead to an increase of 0.23 ± 0.16 W m−2 in global annual mean effective radiative forcing, thereby magnifying the GHG-induced global surface warming by 0.19 ± 0.1 K during 2031–2050. In terms of the entire study area of Asia, the additional warming caused by the non-methane SLCF reductions increases the temperature of the hottest days (TXx) by 0.3 ± 0.1 K, the percentage of warm days (TX90p) by 4.8 ± 2.2 %, the number of tropical nights (TR) by 1.7 ± 0.8 d, the warm-spell duration (WSDI) by 1.0 ± 0.4 d, the number of heavy precipitation days (R10) by 1.0 ± 0.5 d, the maximum consecutive 5 d precipitation (RX5day) by 1.0 ± 0.3 mm, and the total wet-day precipitation (R95p) by 16.4 ± 7.3 mm during 2031–2050. In terms of sub-regional changes in temperature extremes, the largest regional increases in TXx, TX90p, and WSDI occur in northern India (NIN) and northern China (NC). Relatively large increases in TR are projected in NC and the Sichuan Basin (SCB), reaching 5.1 ± 2.5 d and 4.9 ± 3.3 d, respectively. For precipitation extremes, the regional changes are greatest in southern China (SC), particularly southwestern China (SWC), where reductions in non-methane SLCF emissions increase R10 by 2.5 ± 1.9 d, RX5day by 2.5 ± 1.5 mm, and R95p by 37.5 ± 22.6 mm. Moreover, the populations exposed to temperature and precipitation extremes increase most sharply in NIN, reaching (32.2 ± 11.4) × 107 person-days and (4.6 ± 6.1) × 106 person-days during 2031–2050, respectively, followed by NC and SCB. Our results highlight the significant impacts of non-methane SLCF reductions on future climate extremes and related exposure risks in eastern and southern Asia, which are comparable to the impact associated with increased GHG forcing in some regions.
- Article
(22843 KB) - Full-text XML
-
Supplement
(1479 KB) - BibTeX
- EndNote


Short-lived climate forcers (SLCFs), also known as near-term climate forcers (NTCFs), include aerosols (e.g. sulfates, black carbon (BC), organic carbon (OC), ammonium salts, and nitrate), ozone, methane (CH4), and their precursors (e.g. sulfur dioxide (SO2), nitrogen oxides (NOx), carbon monoxide (CO), and ammonia) (Myhre et al., 2013). Since the beginning of the industrial era, human activities have led to a significant increase in emissions of SLCFs (Hoesly et al., 2018). Non-methane SLCFs, including aerosols, ozone, and their precursors, affect not only climate but also air quality. Previous studies have revealed significant influences of non-methane SLCFs on global and regional climate, as well as human health (Liao et al., 2015; Forster et al., 2021; Apte et al., 2015; Malley et al., 2017; B. Xie et al., 2016).
Increasing and accumulating greenhouse gas (GHG) emissions from human activities since the industrial revolution are the main drivers of global warming, but care must be taken in attributing an acceleration in human-induced global warming to these changes in SLCF emissions (Jenkins et al., 2022). According to the Sixth Assessment Report of the Intergovernmental Panel on Climate Change (IPCC, AR6), global average effective radiative forcing (ERF) since the beginning of the industrial revolution (1750–2019) is −1.1 (−1.7 to −0.4) W m−2 for aerosols and +0.47 (+0.24 to +0.71) W m−2 for ozone (Forster et al., 2021). Over the past few decades, climate change caused by non-methane SLCFs has had an important impact on natural ecosystems and human societies in Asia (Ramanathan et al., 2007; Li et al., 2016). The northeast of India witnessed cooler maximum temperatures due to increased aerosols (Freychet et al., 2019). Surface cooling and tropospheric atmospheric thermal responses associated with aerosol forcing can weaken the East Asian summer monsoon, thereby suppressing precipitation in the East Asian monsoon region (Li et al., 2016; X. Xie et al., 2016; Wang et al., 2019, 2020; Mu and Wang, 2021). The increase in aerosols since the 1950s may have led to the weakening of summer precipitation in South Asia (Bollasina et al., 2011) and the anomalous precipitation pattern described as “southern flood/northern drought” in eastern China (Li et al., 2016). Regional aerosol–cloud interactions may be the main factor causing extreme precipitation variability in India and China during 1979–2005 (Lin et al., 2018). In terms of ozone, Chang et al. (2009) noted that tropospheric ozone increased average surface air temperature (SAT) by 0.43 ∘C and decreased average precipitation by 0.08 mm d−1 in eastern China during 1971–2000. The simulation results of Li et al. (2018) showed that East Asian summer monsoon circulation was enhanced over southern China but weakened over northern China during 2001–2010 due to tropospheric ozone forcing.
Emissions controls implemented by governments, which aim to mitigate global warming and improve air quality, have led to significant changes in non-methane SLCF emissions that will affect future climate change (Naik et al., 2021). Meanwhile, the important role of non-methane SLCFs in historical climate change in Asia (Bollasina et al., 2011; Dong et al., 2019; Wang et al., 2019) suggests that SLCF emissions reductions may have major implications for future regional climate and its extremes (Wang et al., 2016; Zhang et al., 2018; Wilcox et al., 2020). In previous research, Turnock et al. (2020) made a first assessment of historical and future changes in air pollutants, and Zanis et al. (2022) presented an analysis of the effect of climate change on surface ozone, discussing the related penalties and benefits around the globe using five Earth system models (ESMs) from the Coupled Model Intercomparison Project phase 6 (CMIP6). But the assessed impact of reducing non-methane SLCF emissions on future climate change has been limited to the effect of aerosol forcing associated with incomplete interactive tropospheric chemistry schemes in global climate models. Future aerosol emissions reductions could greatly aggravate the warming effect caused by GHG forcing (Lin et al., 2016; Hienola et al., 2018), particularly in eastern and southern Asia, and may increase surface temperatures by 0.5 ∘C in some regions (Westervelt et al., 2015; Chuwah et al., 2016) and cause a significant increase in the number of extreme high-temperature events (Wang et al., 2016; Samset et al., 2018; Luo et al., 2020). In eastern Asia, under global warming of 1.5 and 2 ∘C, the average temperature in China is expected to grow at a faster rate than the global mean, and there is a strong warming on the Tibetan Plateau (You et al., 2020). When studying changes in local climate between 1.5 and 2 ∘C of global warming, non-GHG influences need to be considered (King et al., 2018; You et al., 2020). The effect of projected reductions in anthropogenic aerosol emissions over eastern Asia caused an increase in summer temperatures and raised the likelihood of extreme hot summers (King et al., 2018). Future aerosol reductions may also shift the tropical rain belt northwards, enhancing precipitation in the Asian monsoon region (Westervelt et al., 2018; Zanis et al., 2020) and shifting both the mean and extreme values of precipitation toward larger values (Zhao et al., 2018). Asia is a region where extreme precipitation is particularly sensitive to aerosol reductions (Lin et al., 2016; Samset et al., 2018).
The precursors of aerosols and ozone are homologous and overlapping (e.g. NOx, volatile organic compounds – VOCs) (Myhre et al., 2013). The implementation of air pollution control measures inevitably causes simultaneous changes in their radiative forcings. Therefore, considering the impacts of changes in non-methane SLCFs on future climate, particularly on regional extreme climate events, is essential. However, few studies in this field have been conducted to date. A recent study considering emissions reductions in aerosols, ozone, and their precursors showed that future non-methane SLCF reductions will not only improve air quality but also increase global mean temperature, precipitation, and climate extremes in the mid-21st century, with more marked warming and wetting trends in some regions, particularly Asia and the Arctic (Allen et al., 2020). However, there were some limitations in that study. First, Allen et al. (2020) only considered three extreme indicators including hottest day, wettest day, and consecutive dry days to examine the effects of future non-methane SLCF reductions on climate extremes. These three indicators were not enough to represent climate extremes, especially the lack of some indicators related to human health. For example, tropical nights usually occur in combination with extended periods of heat (particularly in extra-tropical regions) and have been suggested to be problematic for human health (Weisskopf et al., 2002; Patz et al., 2005), and the maximum consecutive 5 d precipitation can be used as an indicator of flooding and related hazards (Frich et al., 2002; Sillmann et al., 2013a). Second, climate extremes pose a serious threat to human health and well-being (Bras et al., 2021; Tellman et al., 2021). Quantifying avoided population exposure to climate extremes associated with future non-methane SLCF reductions is valuable for future policymaking on climate change mitigation and adaptation, especially in these densely populated and industrially developed regions of Asia, which is lacking in Allen et al. (2020).
With the continued global warming caused by GHG emissions, the frequency of climate extremes increases (Zhou and Qian, 2021) and will increasingly become a threat to human health, economic stability, and environmental sustainability. As a densely populated and climate-vulnerable region, Asia is at high risk for future population exposure to climate extremes. In the coming decades, the population exposed to extreme heat in East Asia will continue to increase under most future scenarios (An et al., 2020). The population exposure to extreme precipitation over the Indus River Basin is projected to increase by 72.4 %, 122.7 %, and 87.6 %, respectively, with global warming of 1.5, 2.0, and 3.0 ∘C (Zhao et al., 2021). The population affected by extreme precipitation in China is projected to increase by nearly 22 % by the end of the 21st century under the representative concentration pathway–shared socioeconomic pathway (RCP-SSP) scenario RCP4.5-SSP2, with the largest absolute increase in eastern China (Chen and Sun, 2020). With increasing warming in the future, dry conditions across China will be further aggravated, and an additional 12.9 million people will be exposed to droughts under the 1.5 ∘C global warming scenario (Chen et al., 2018; Chen and Sun, 2019). This raises the issue of whether reductions in non-methane SLCF emissions will further exacerbate the intensity and frequency of extreme climate events and the resulting risk of population exposure.
With continuous development, some models have evolved from the original climate system model to more complete ESMs that consider the coupling of Earth system processes (including atmosphere, ocean, land, sea, and ice, as well as biogeochemical cycles) and can provide a more realistic and complete analysis of the whole Earth system. Furthermore, the Aerosols and Chemistry Intercomparison Project (AerChemMIP) was established by CMIP6 to comprehensively assess the impacts of SLCFs on climate and air quality (Collins et al., 2017), which can further elucidate changes in atmospheric chemical composition and their interactions with changes in global and regional climate. Here, we quantify the impacts of non-methane SLCF emissions reductions on extreme climate changes and the resulting population exposure risks during 2031–2050 in eastern and southern Asia (here defined as 0–60∘ N, 70–150∘ E) using historical simulations and two scenario simulations (SSP3-7.0 and SSP3-7.0-lowNTCF) with state-of-the-art ESMs from the AerChemMIP (Collins et al., 2017).
The remainder of this paper is organised as follows. Section 2 describes the models, simulations, and calculations of climate extremes and related population exposure. Section 3 contains the results. Finally, our discussion and conclusions are presented in Sect. 4.
2.1 Future emissions scenarios
Simulations under two AerChemMIP scenarios, SSP3-7.0 and SSP3-7.0-lowNTCF, were performed to assess the impacts of non-methane SLCF changes on climate and air quality (Collins et al., 2017; Allen et al., 2020). The SSP3-7.0 scenario includes no climate policies related to GHG reductions and weak air pollution controls (∼ 7.0 W m−2 in the year 2100). In this scenario, the future climate change is approximatively influenced by GHG forcing only. The SSP3-7.0-lowNTCF scenario uses the same GHG forcing path but with strong air pollution controls, and thus future climate change in this scenario is influenced by a combination of GHG forcing and reduction in non-methane SLCF emissions. As shown in Fig. 1, the two simulations include the same variation in carbon dioxide (CO2) and CH4, both of which continue to increase in the future. However, non-methane SLCFs exhibit different changes in these two scenarios. Global emissions of non-methane SLCFs are maintained at a stable level or vary slightly after 2020 under the SSP3-7.0 scenario, with a decrease of 1 % in SO2 and increases of 7 %–13 % in other SLCFs by 2050. Global emissions of all non-methane SLCFs show downward trends under the SSP3-7.0-lowNTCF scenario, ranging from 10 % for BC to 55 % for SO2 by 2050. Assuming that the joint impact of GHGs and non-methane SLCFs are approximated as a linear superposition of their respective impacts, the impact of non-methane SLCF mitigation can be quantified as the difference between the results of simulations under the two scenarios (SSP3-7.0-lowNTCF minus SSP3-7.0) (Allen et al., 2020).
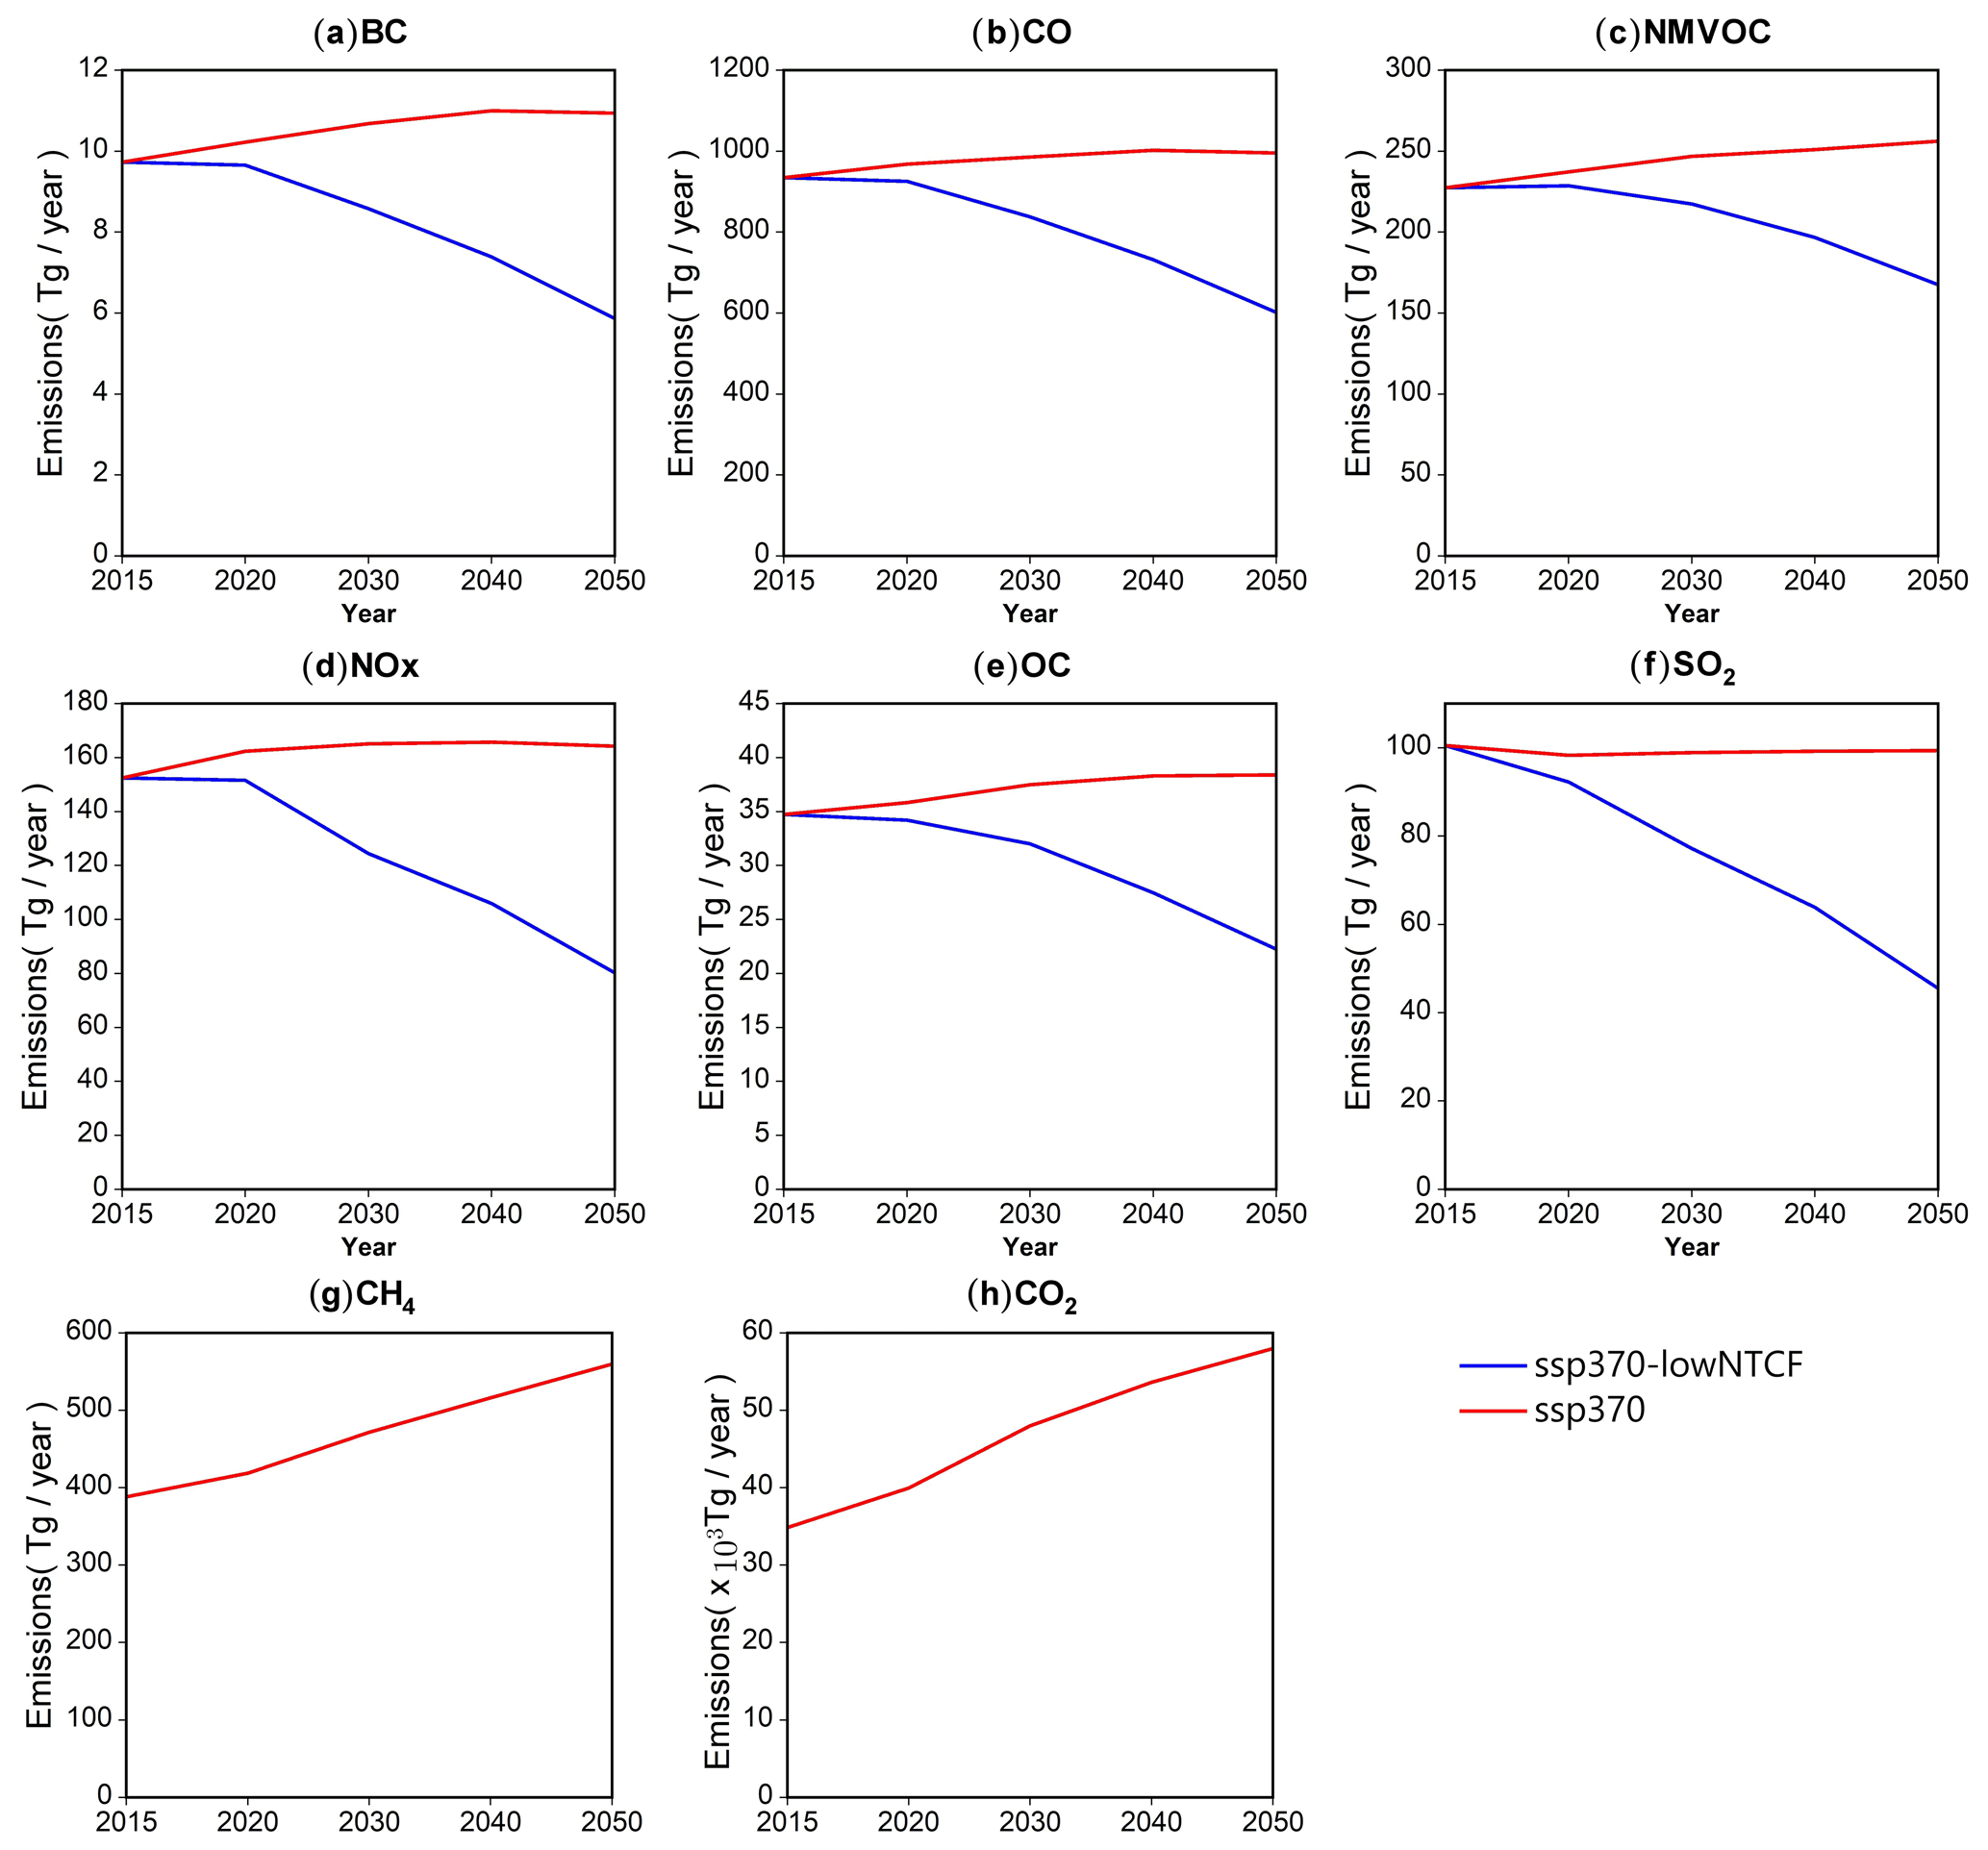
Figure 1Time series of global annual emissions of (a) BC, (b) CO, (c) NMVOCs (non-methane volatile organic compounds), (d) NOx, (e) OC, (f) SO2, (g) CH4, and (h) CO2 from 2015–2050 under the SSP3-7.0 (solid red line – ssp370) and SSP3-7.0-lowNTCF (solid blue line – ssp370-lowNTCF) scenarios. Only the red line is visible in (g) and (h) as ssp370 and ssp370-lowNTCF overlap.
2.2 Models and simulations
Seven CMIP6 ESMs with interactive representation of tropospheric aerosols and atmospheric chemistry were used to conduct the SSP3-7.0 and SSP3-7.0-lowNTCF simulations (Table 1), with integration periods of 2015–2055 and individual models integrated through 2100. We used the daily and monthly outputs for both scenarios from 2015 to 2050. Historical climate simulations (Historical) for 1995–2014 from the same models were used as the reference period. In addition to coupled ocean–atmosphere simulations, these models were also used for Atmospheric Model Intercomparison Project (AMIP)-style simulations with the time-varying sea surface temperature (SST) outputs from SSP3-7.0 simulations under the two emissions scenarios to quantify the ERF associated with future changes in atmospheric composition (Collins et al., 2017). All models used here provided SST simulations for calculating ERF, and they provided the same number of realisations as stated in Table 1. ERF is a measure of the extent to which forcing agents affect climate, defined as the change in net radiative flux at the top of the atmosphere caused by a disturbance that allows for changes in atmospheric temperature, water vapour, and clouds but keeps global SST unchanged (Myhre et al., 2013; Forster et al., 2016; Pincus et al., 2016). At present, there are few models carrying out both SSP3-7.0 and SSP3-7.0-lowNTCF experiments as mentioned above; thus, we directly used the seven-model ensemble mean to investigate the changes in climate extremes in response to future SLCF emissions reductions.
To evaluate the performance of the models, a gridded daily maximum and minimum temperature and daily precipitation dataset obtained from the National Oceanic and Atmospheric Administration (NOAA) Climate Prediction Center (CPC) is used here. This dataset was constructed using optimal interpolation methods based on approximately 16 000 station and satellite observations (Chen et al., 2020b). It spans the period from 1979 to the present with a resolution of 0.5∘ × 0.5∘. All model outputs, as well as observations, were interpolated onto a common grid (1∘ × 1∘) through bilinear interpolation except precipitation data, which used first-order conservative interpolation. We also quantify the confidence of the multi-model ensemble (MME) relative to each individual model using sign agreement and signal-to-noise ratio (SNR). The details of the calculation of SNR can be found in the Supplement. We compared the simulated results with the observational climate extremes during 1995–2014. In general, the MME can reasonably reproduce the observed spatial distribution of extreme temperature and precipitation indices. For the extreme temperature indices, the maximums obtained from both the MME and observations are found in eastern China and southern Asia, especially for the simulated absolute extreme indices (the hottest day, tropical night) (Fig. 2a, b, g, and h), which are generally consistent with the observations in spatial distribution with limited difference in magnitude. Relative to the absolute extreme indices, the percentile and duration indices show large differences between the MME and observation (Fig. 2d, e, j, and k). Previous studies have also shown that both CMIP5 (CMIP version 5) and CMIP6 models perform relatively unsatisfactorily in simulating spatial patterns of the duration and percentile indices (Fan et al., 2020; Guo et al., 2021). For heavy precipitation, the maximum consecutive 5 d precipitation, and total wet-day precipitation, the climatological mean is well captured by MME, although it tends to produce overestimates especially over the southeastern Qinghai–Tibet Plateau and the Indo-China Peninsula (Fig. 3a–i). In addition, the MME underestimates the consecutive dry days in northwest China and along Mongolia (Fig. 3l), which is consistent with previous studies (Zhu et al., 2021; Kim et al., 2020). Although the MME produces some regional biases with respect to observations, such biases will be reduced when considering the difference between the two segments of time (Sillmann et al., 2013b; Chen et al., 2020a). In this study, we focused on the changes in the future (2031–2050) relative to the reference period (1995–2014), so the results of the MME for future extreme climate projections can be considered representative.
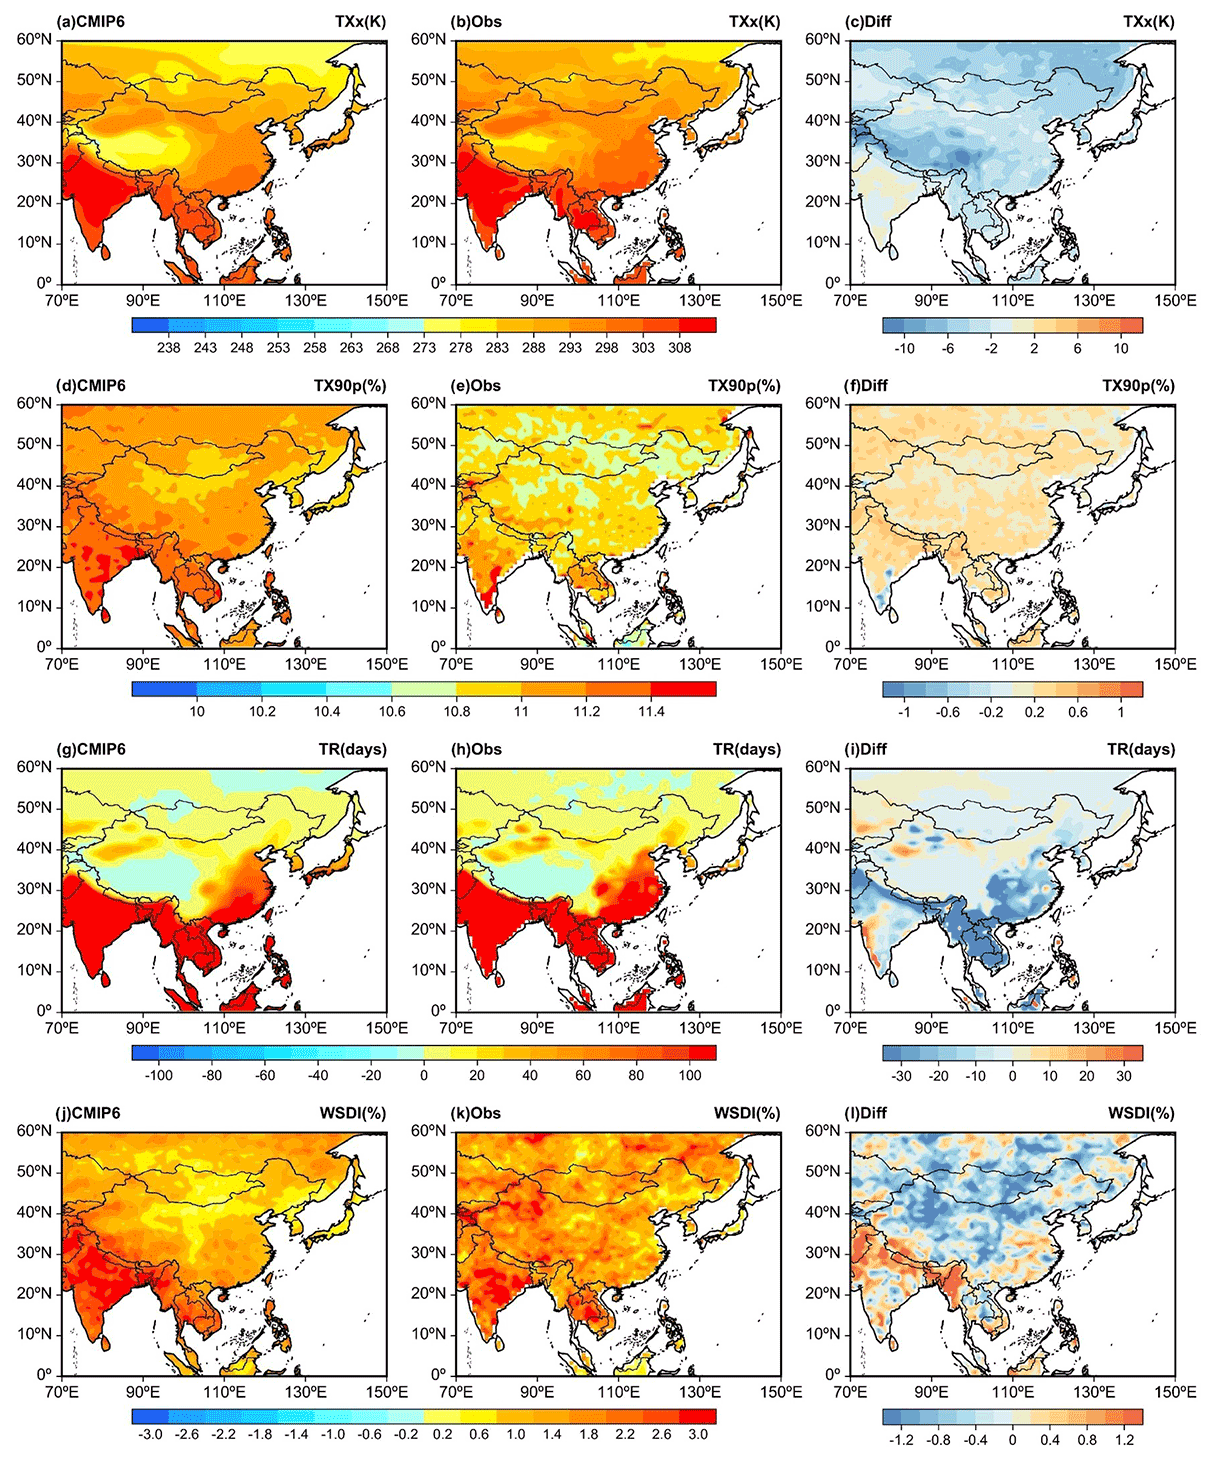
Figure 2The annual mean of the hottest day (TXx), warm days (TX90p), tropical nights (TR), and warm-spell duration (WSDI) over the study area during 1995–2014 for the CMIP6 multi-model mean (a, d, g, j) and gridded observations (b, e, h, k). The right column (c, f, i, l) represents difference between CMIP6 and observations, so the red area in this column indicates that the model is over-projecting.
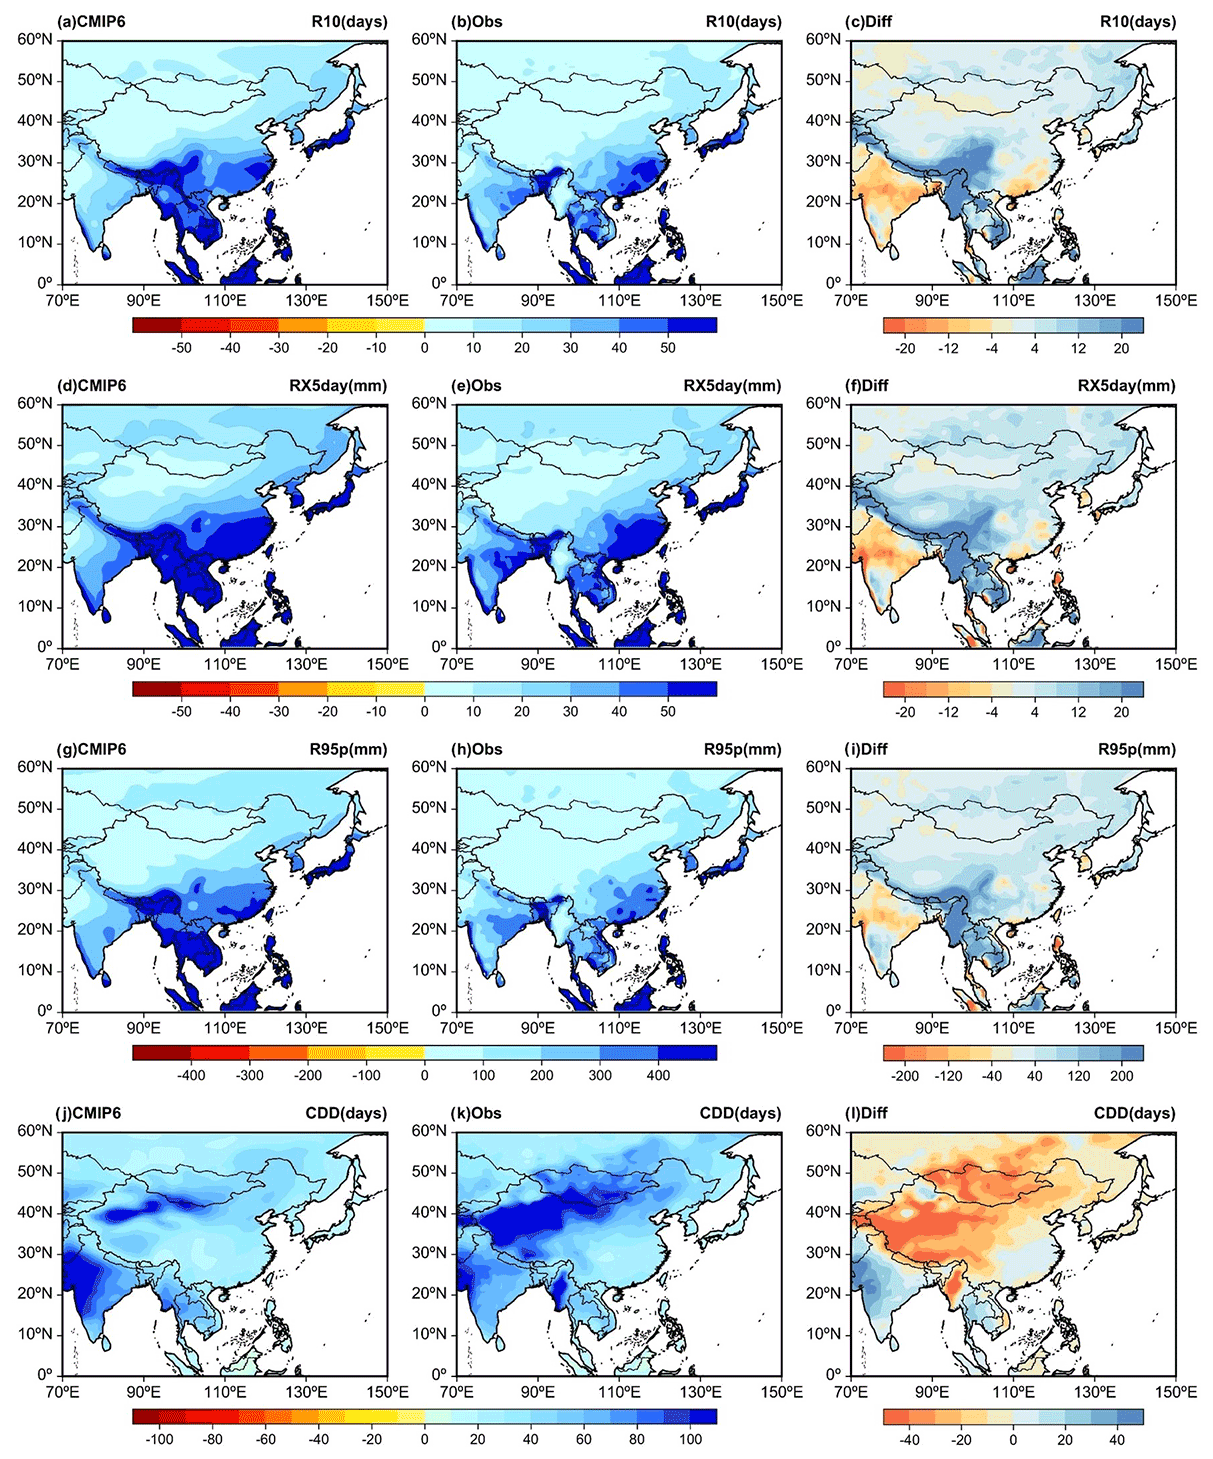
Figure 3The annual mean of heavy precipitation (R10), maximum consecutive 5 d precipitation (RX5day), total wet-day precipitation (R95p), and consecutive dry days (CDDs) over the study area during 1995–2014 for the CMIP6 multi-model mean (a, d, g, j) and gridded observations (b, e, h, k). The right column (c, f, i, l) represents the difference between CMIP6 and observations.
2.3 Extreme climate indices
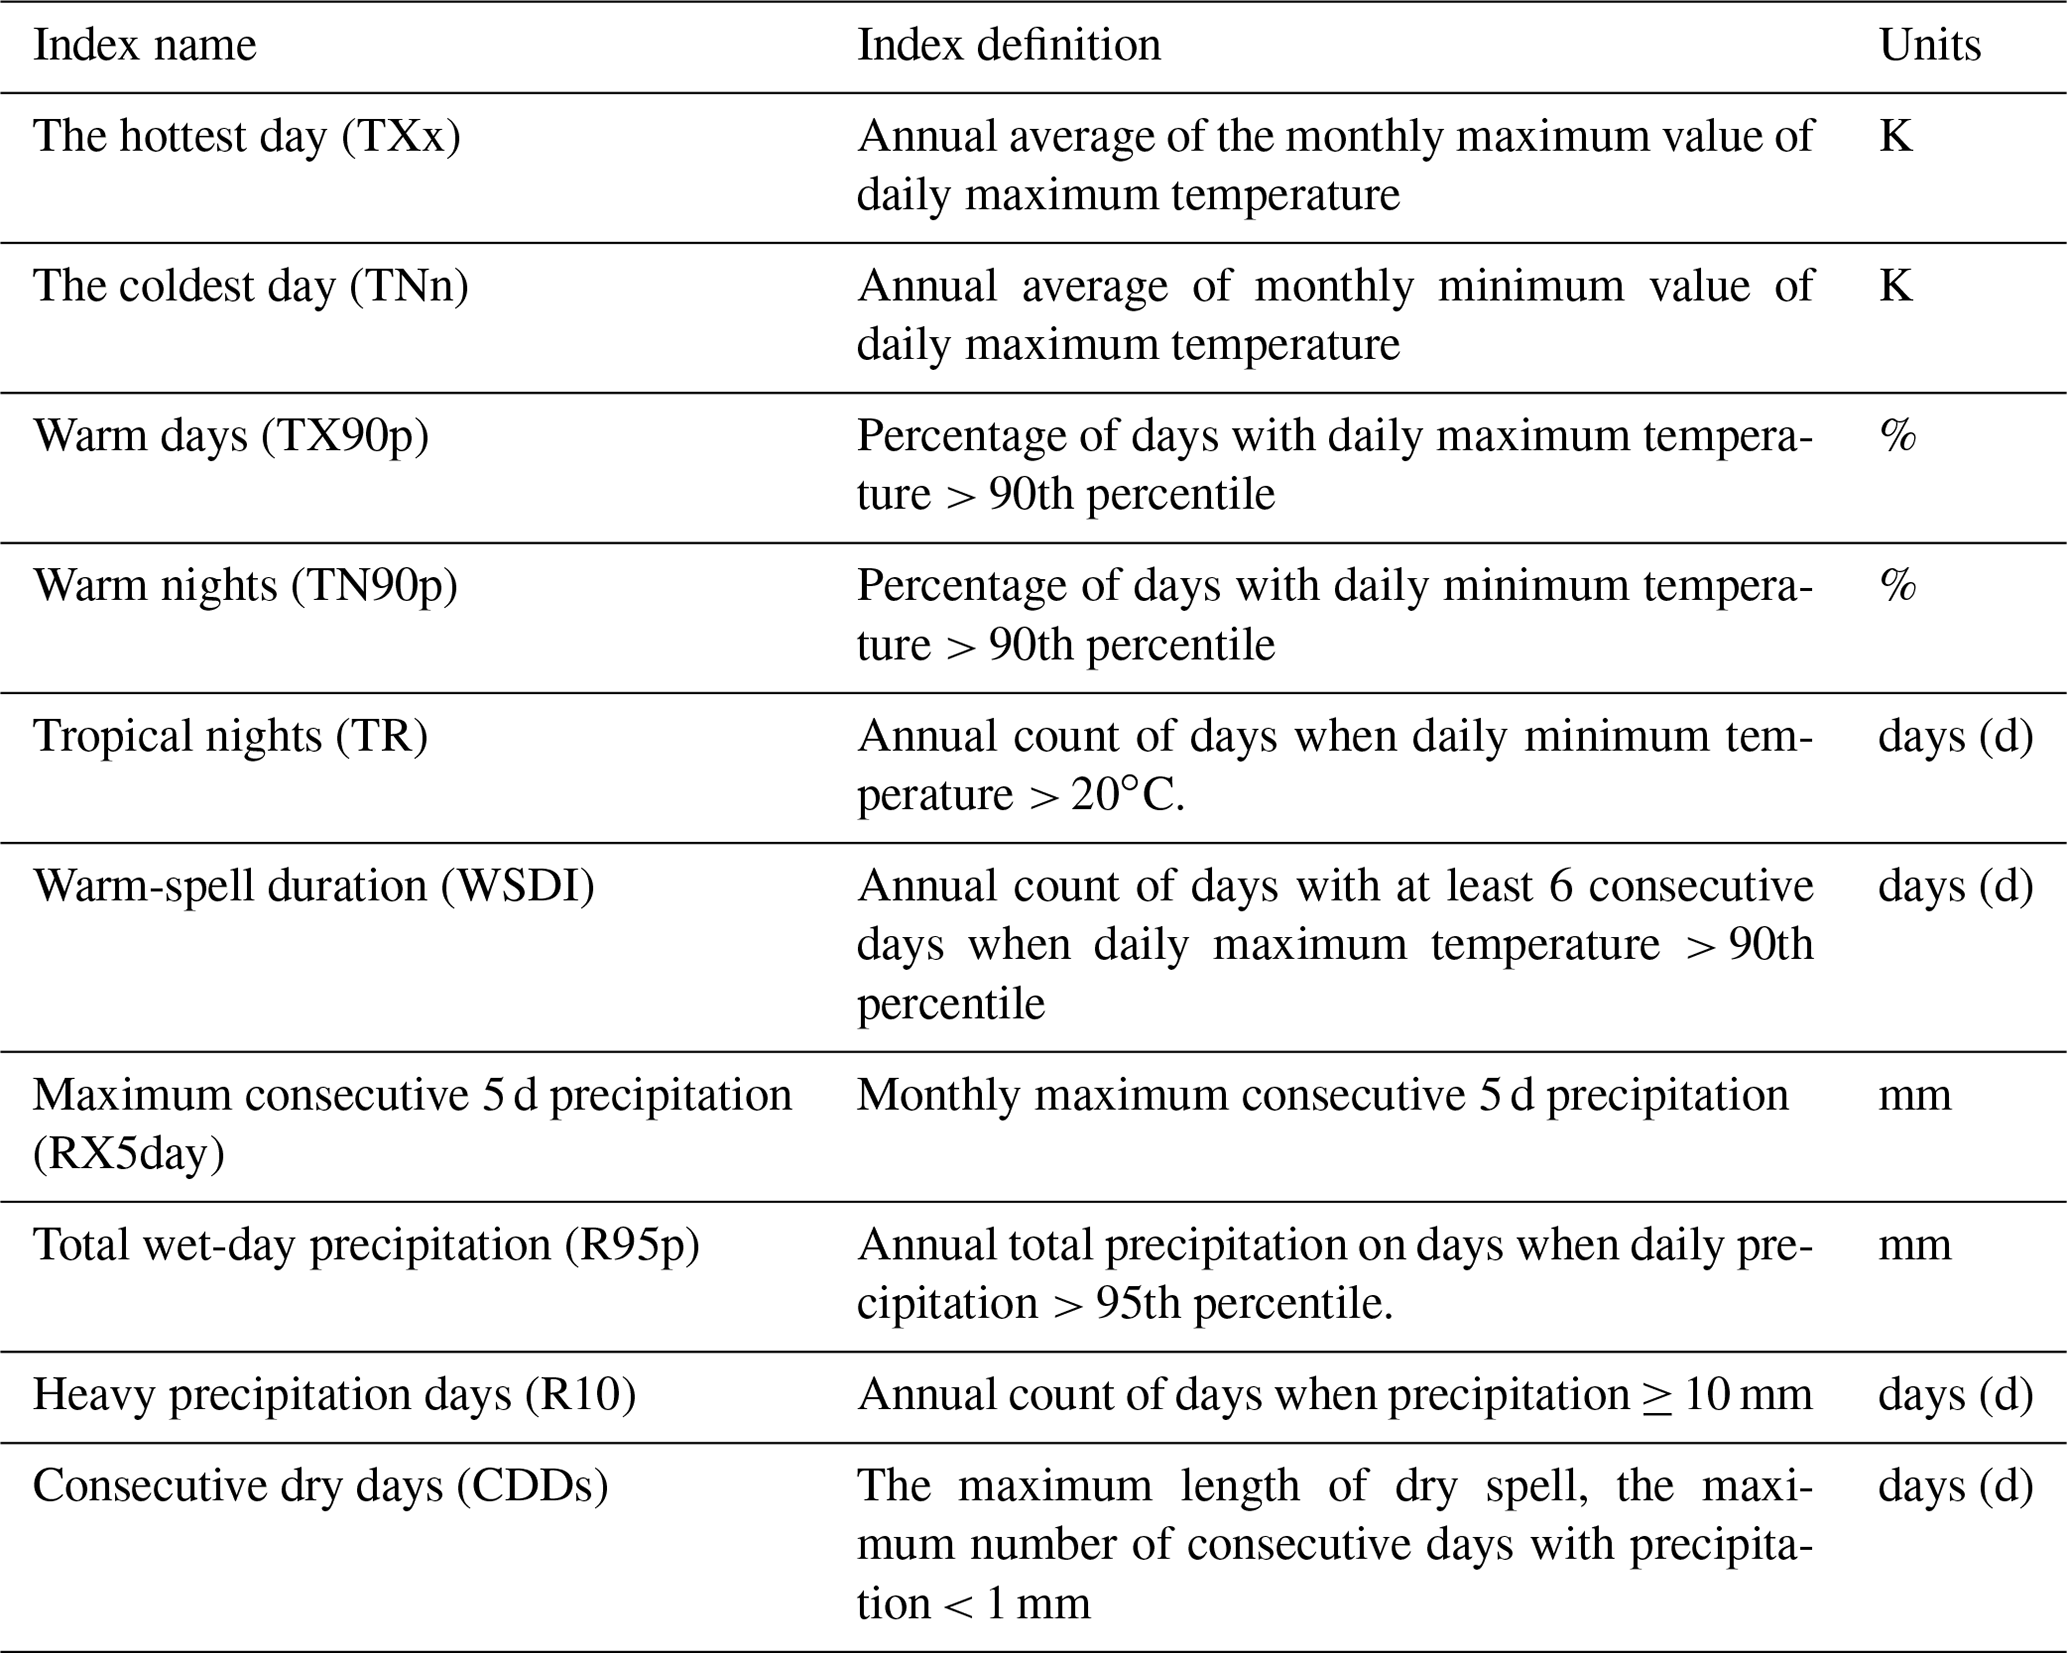
Following the definitions of the Expert Team for Climate Change Detection and Indices, six extreme temperature indices and four extreme precipitation indices representing intensity and frequency were employed in this study (Table 2). Due to incomplete data provided by CESM2-WACCM and GISS-E2-1-G in the AerChemMIP, the extreme temperature indices were calculated with the remaining five models, and the extreme precipitation indices were calculated with the six models but not GISS-E2-1-G. We focused on the changes in extreme climate indices in the future (2031–2050) relative to the reference period (1995–2014), as this is when reductions in aerosol and ozone precursor emissions and the resulting changes in climate are expected to be significant.
Table 2Definitions of the extreme climate indices used in this study.
2.4 Population exposure
Population exposure to climate extremes can be estimated by multiplying the frequency of extreme events by the number of people, and this method has been widely employed to assess future climate risks (Jones et al., 2015). Gridded population datasets for 2000 and 2040 under SSP3 were used to represent the population during the reference and future periods, respectively (Jones and O'Neill, 2016). These population datasets were summed for each grid box of 1∘ × 1∘ to match the resolution of the climate data.
Population exposures to extreme heat and heavy precipitation are calculated as the population exposed multiplied by the number of days with a daily maximum temperature greater than the 90th percentile of the reference period and by the number of days with daily precipitation greater than the 95th percentile of the reference period, respectively (Chen et al., 2020b; Sun et al., 2022). The exposure change (Δexpo) could be decomposed into three parts, namely, changes driven by the climate effect, the population effect, and their interaction:
where c and p are the number of extreme days and population in the baseline period, respectively. Δc and Δp are the changes in extreme climate days and population in the future with respect to the baseline period. Thus, the terms of c⋅Δp, p⋅Δc, and Δc⋅Δp represent the population, climate, and population–climate interaction effects, respectively, on exposure changes, allowing for attribution analysis of changes in population exposure.
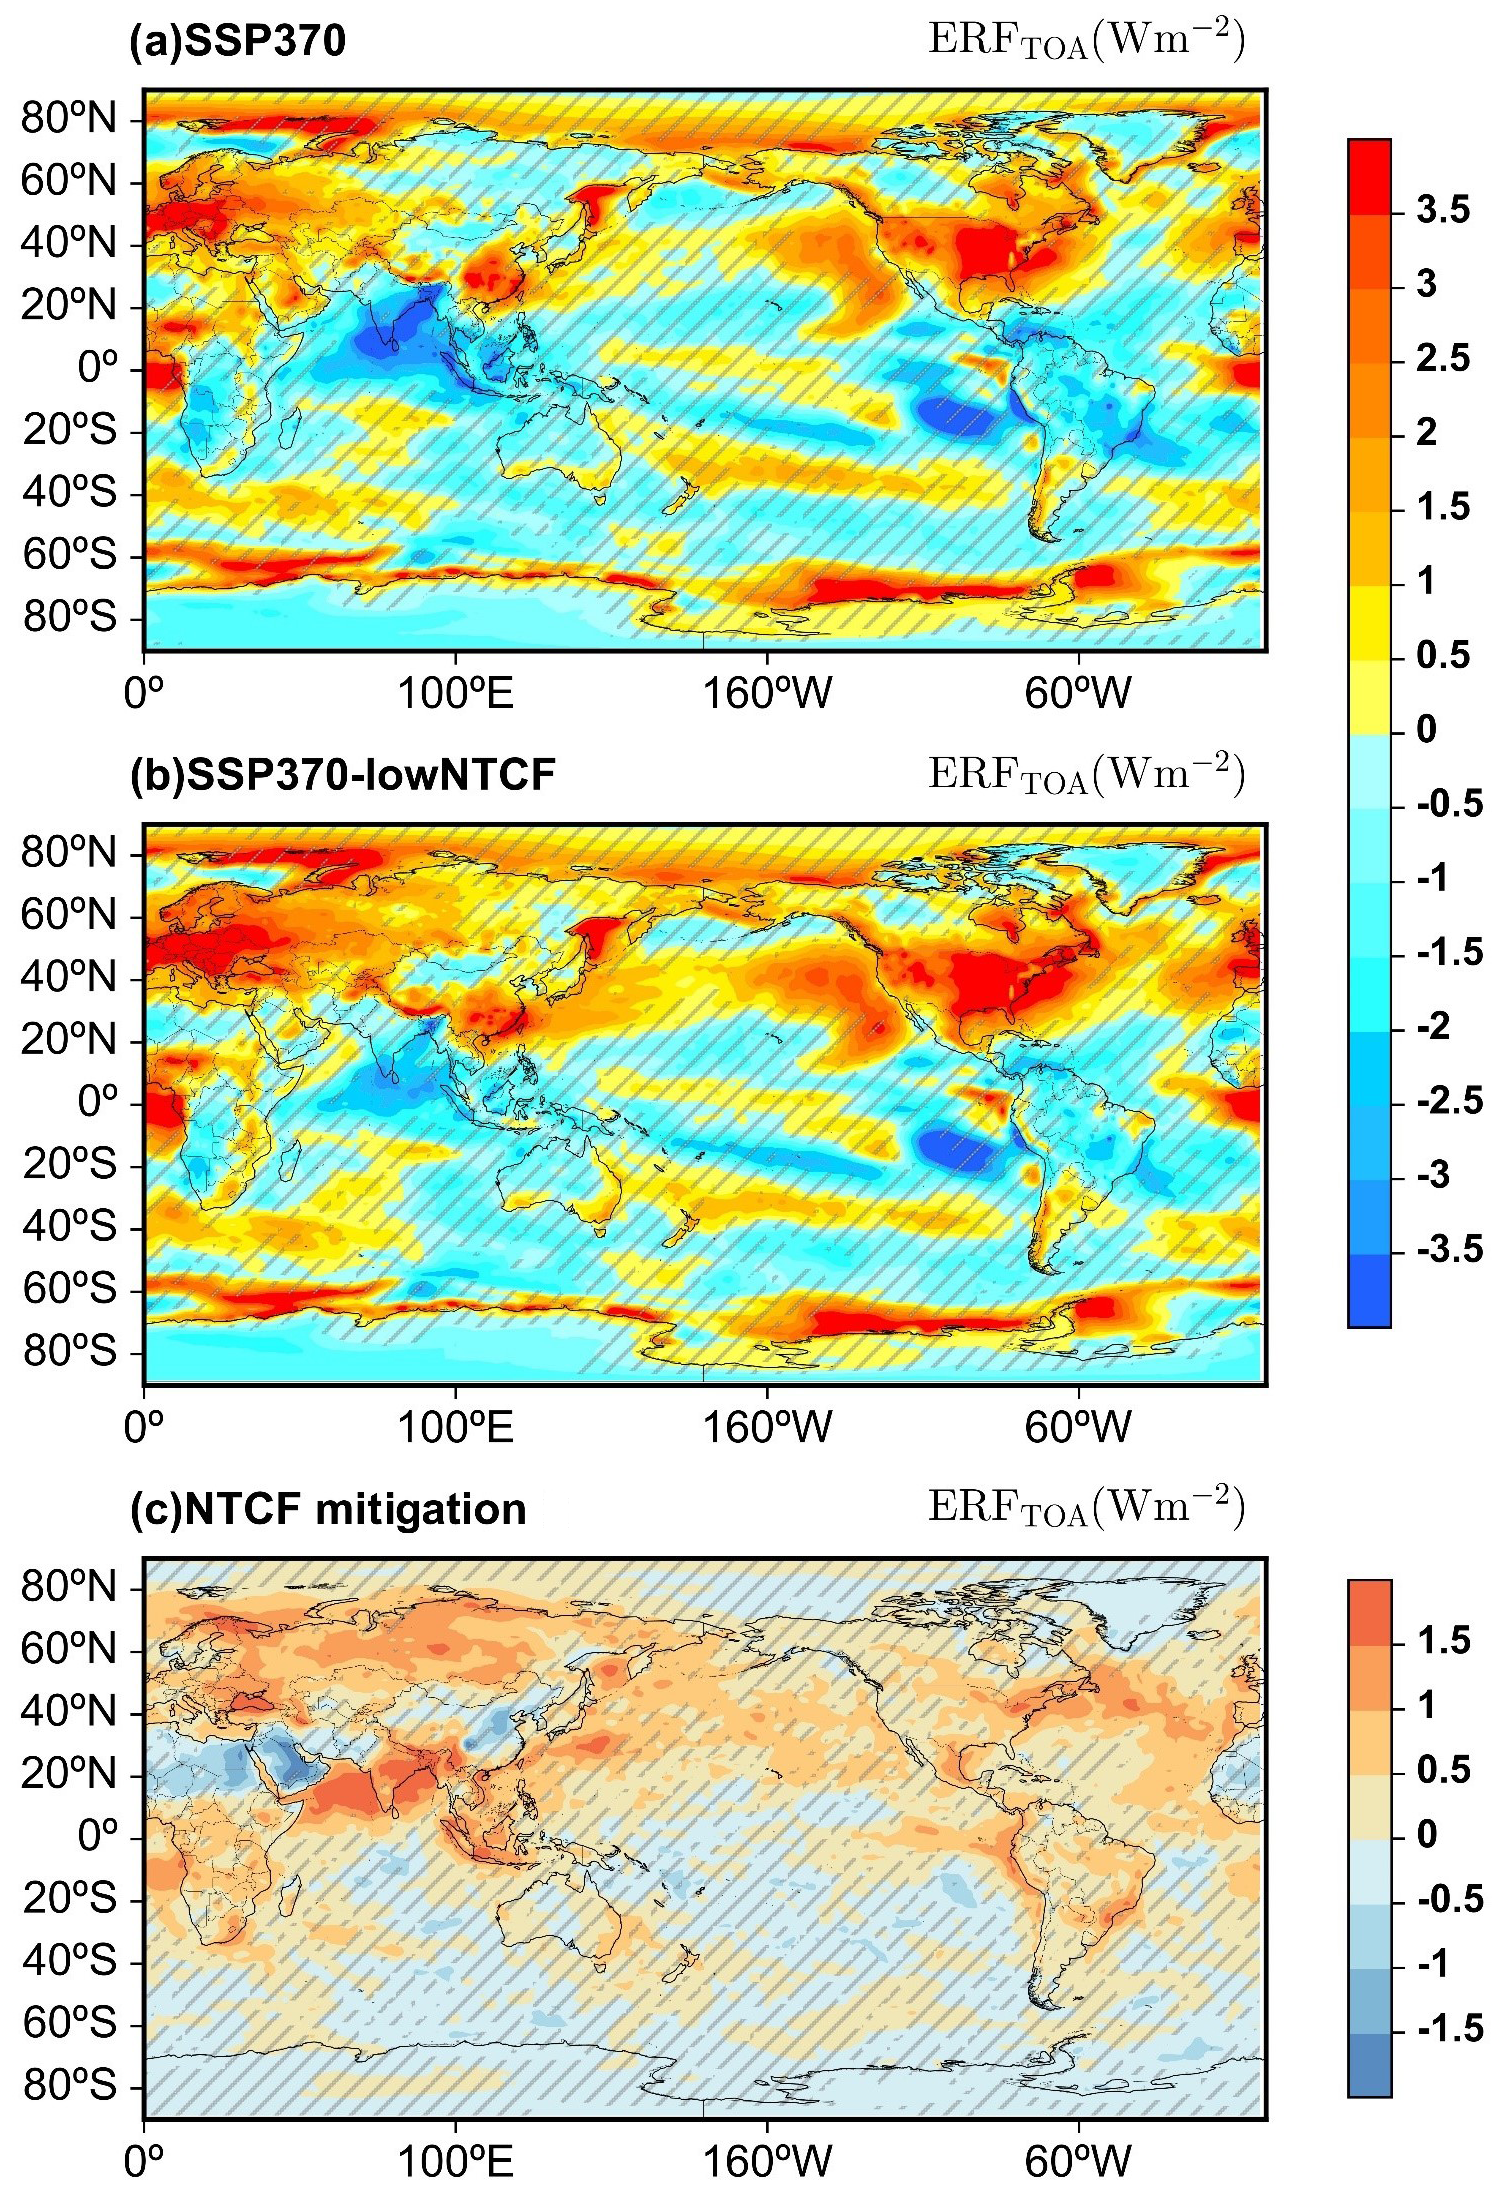
Figure 4Spatial patterns of effective radiative forcing (ERF) at top of atmosphere (ERFTOA) during 2031–2050 under the (a) SSP3-7.0 and (b) SSP3-7.0-lowNTCF scenarios and (c) ERF only caused by the non-methane SLCF reductions relative to 1995–2014 (units: W m−2). The areas with hatching indicate that at least one out of seven models disagrees on the sign.
3.1 Changes in global ERF and SAT
Figure 4 shows the spatial patterns of ERF under the SSP3-7.0 and SSP3-7.0-lowNTCF scenarios and their changes associated with reductions in non-methane SLCF emissions during 2031–2050 relative to 1995–2014. As GHG concentrations increase and SLCF concentrations decrease, more long-wave radiation is absorbed, and less short-wave radiation is reflected, resulting in positive global average ERF values under both scenarios (Fig. 4a and b). It is worth noting that the global spatial distribution of ERFs shows poor inter-model agreement, with large areas where there is disagreement about the sign with at least one of the models and SNR less than 1 (Fig. S2), especially over the ocean. Non-methane SLCF emissions reductions lead to positive ERF over most of the globe, particularly in the Northern Hemisphere (Fig. 2c). Increases in ERF of approximately 1 W m−2 occur mainly in Eurasia north of 40∘ N, the northern Pacific Ocean, northern America, and the northern Atlantic Ocean. The largest increases of more than 1.5 W m−2 are found over India, southeastern Asia, and the surrounding oceans with relatively good inter-model agreement (Figs. 4c and S2c). Although the reduction in SLCFs leads to a decrease in the aerosol optical depth (AOD) on a global scale (Fig. S1), not all SLCFs behave the same way, and it is reductions in non-BC aerosols that are driving the increase in ERF in the SSP3-7.0-lowNTCF scenario. Besides, some negative ERFs remain over northern China, the Sichuan Basin, the Arabian Peninsula, and northern Africa, as the increase in low cloud cover induced by changes in regional precursor concentrations leads to greater reflection of short-wave radiation (Yang et al., 2017; Zhang et al., 2018). The MME global annual mean ERF induced by non-methane SLCF emissions reductions is +0.23 W m−2, with positive values obtained from all models except GFDL-ESM4 (Table 3).
Table 3Global effective radiative forcing (ERF) and surface air temperature (SAT) responses to non-methane SLCF mitigation. MMM is the multi-model mean.
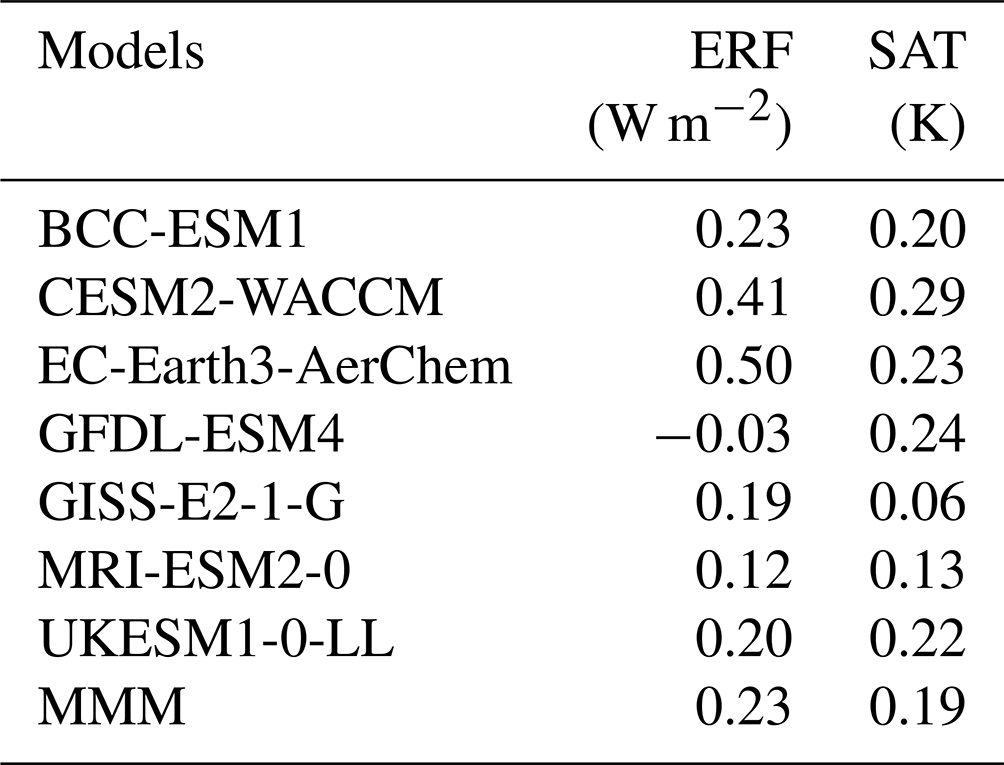
Figure 5 shows the MME global changes in SAT under each scenario. Increases in SATs occur worldwide during 2031–2050 under both the SSP3-7.0 and SSP3-7.0-lowNTCF scenarios (Fig. 5a and b). The SAT increases are greater in the Northern Hemisphere and on land than in the Southern Hemisphere and ocean areas due to greater precursor emissions in the Northern Hemisphere and the high heat capacity of the ocean. Regionally, the greatest warming of more than 1.5 K is found in central and northern Asia and in northern North America, particularly in the Arctic, where warming is greater than 2.5 K. The models agree on the sign of the change across regions and have a high level of confidence (Figs. 5a, b and S3a, b). Previous studies have also shown that the Arctic has warmed at a much higher rate than the rest of the globe in recent decades (Screen and Simmonds, 2010; Pithan and Mauritsen, 2014). Moreover, such warming is exacerbated by future non-methane SLCF emissions reductions in most regions of the world, particularly in the Northern Hemisphere with great inter-model consistency (Figs. 5c and 3c). Previous studies have shown that a reduction in sulfate aerosols is the dominant driver of future SAT increases in response to aerosol forcing, particularly in the Northern Hemisphere (Baker et al., 2015; Samset et al., 2018). Future reductions in non-methane SLCF emissions causes additional warming of more than 0.2 K throughout Eurasia, the northern Pacific, and northern North America. In particular, warming in the Arctic will exceed 0.6 K (Fig. 5c). The reduction in non-methane SLCF emissions results in an average increase of 0.19 K in global mean SAT in the MME results, ranging from 0.06 to 0.29 K across different models (Table 3). Furthermore, the increase in global mean SAT is consistent with the increase in global mean ERF except for GFDL-ESM4. However, warming and positive ERF do not correspond exactly in some regions, such as the Arctic and northern China (Figs. 4c and 5c), likely due to climate feedbacks, remote teleconnection, and other processes. In general, under the SSP3-7.0-lowNTCF scenario, the combined reductions in aerosols, ozone, and their precursors cause further warming, suggesting that the cooling effect of ozone reduction is somewhat weaker than the warming effect of aerosol reduction.
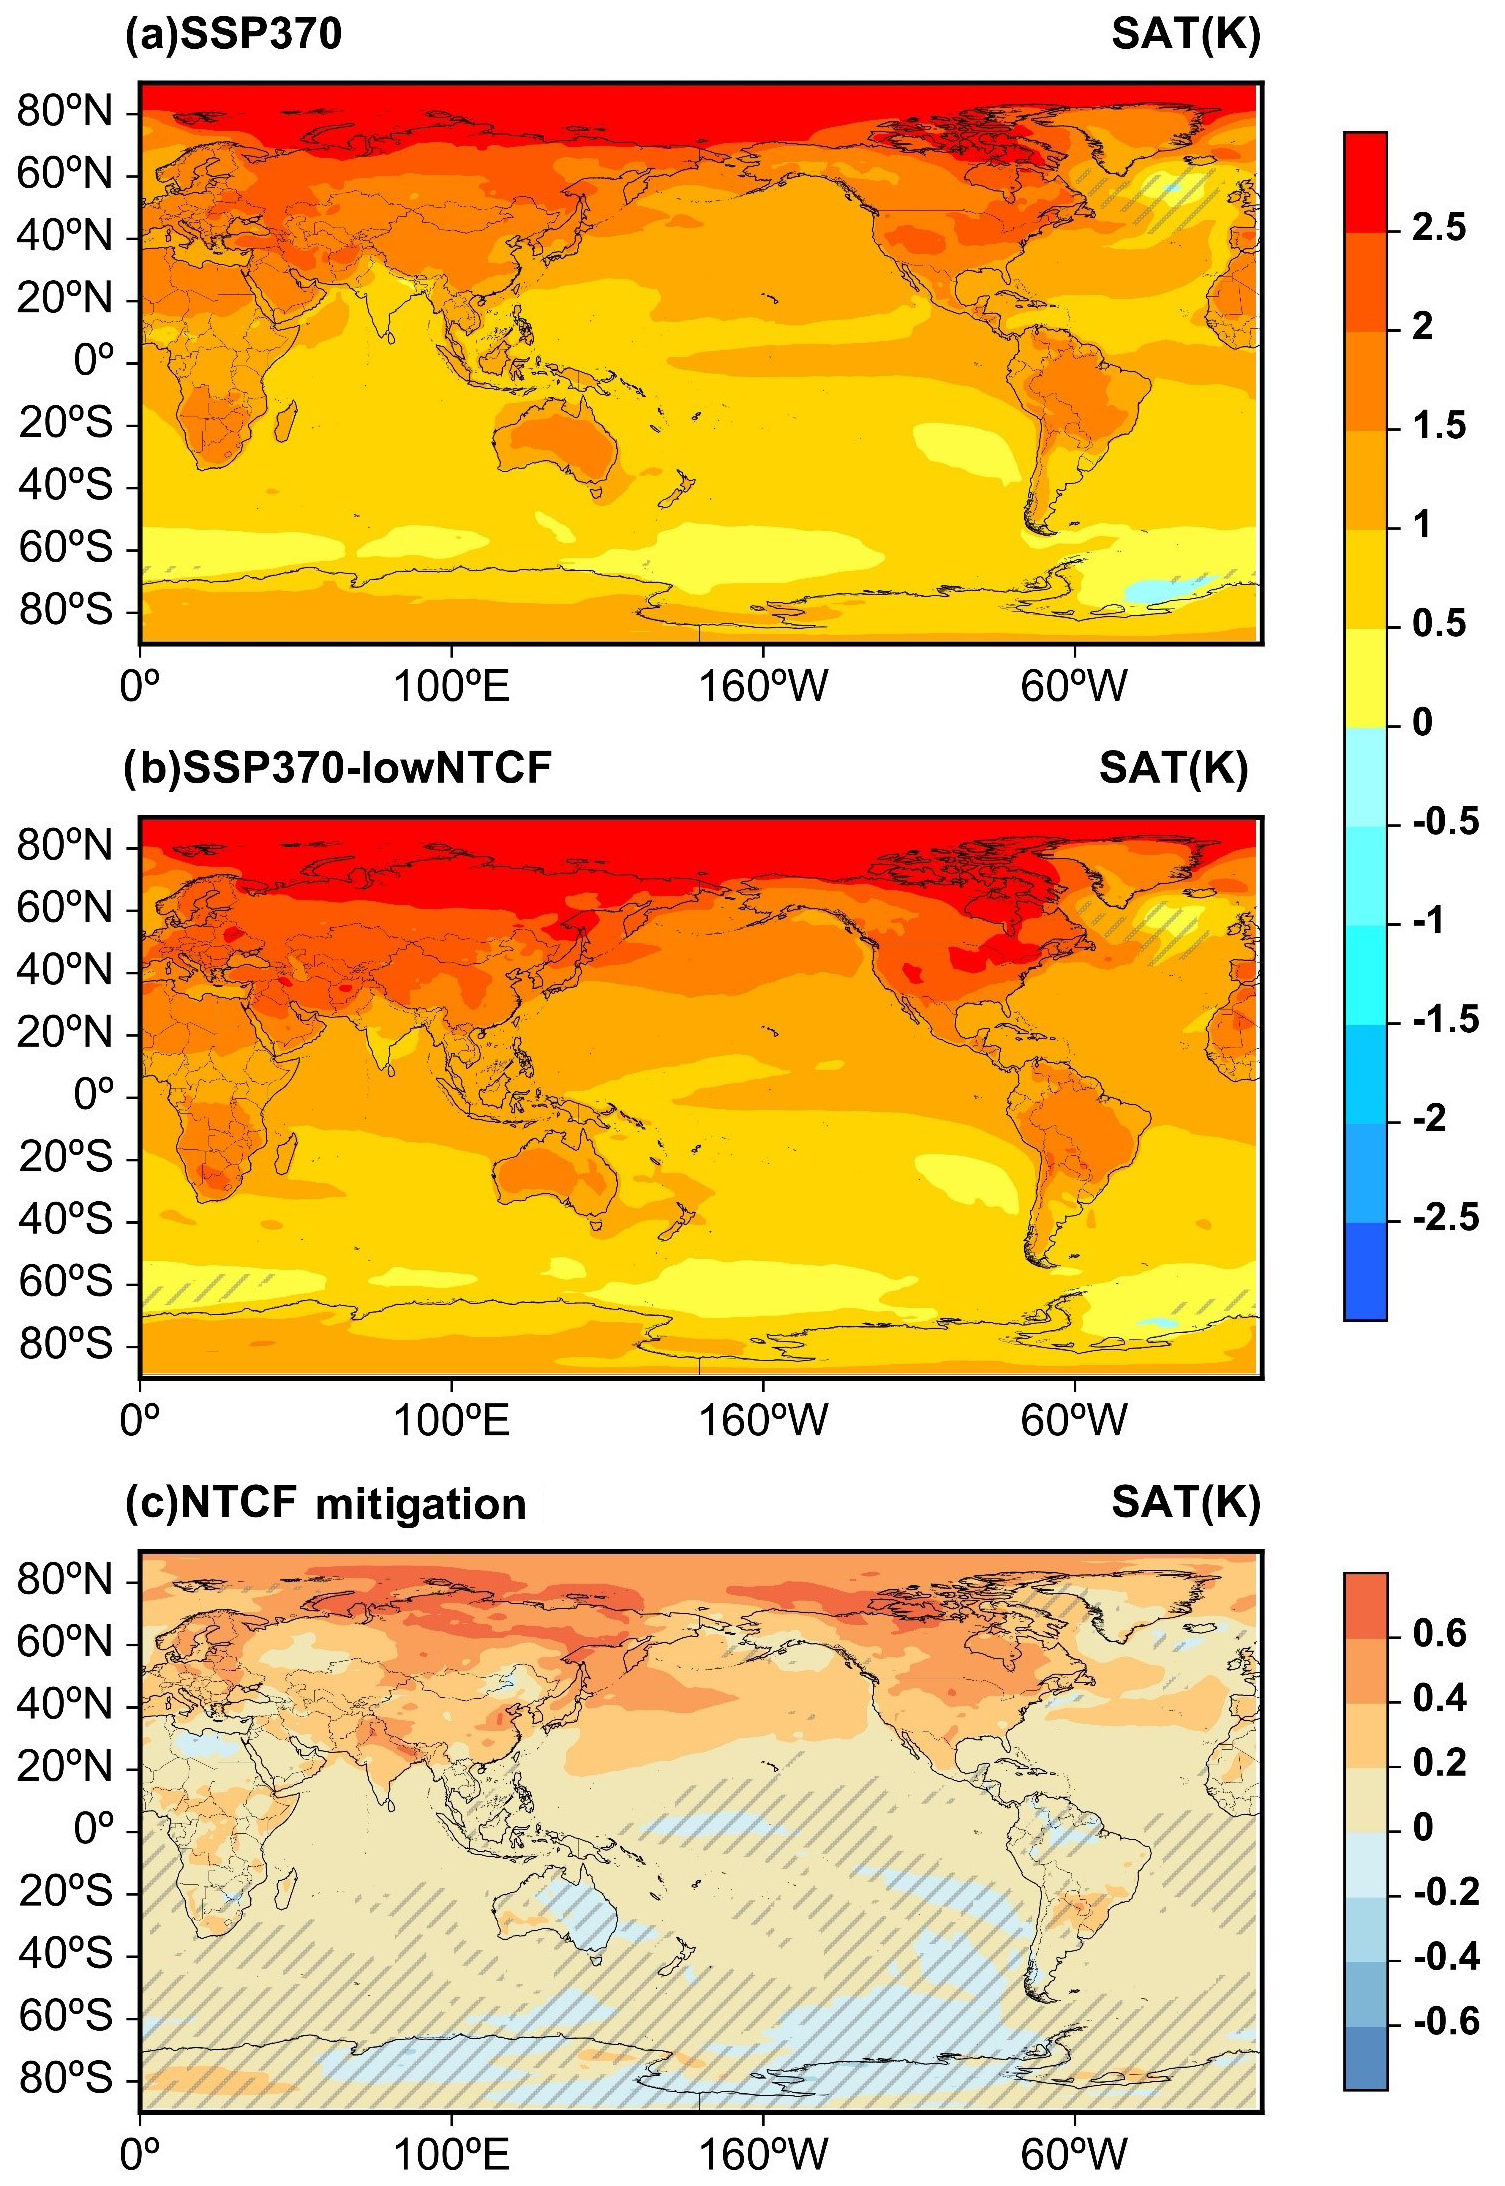
Figure 5Spatial patterns of changes in surface air temperature (SAT) during 2031–2050 under the (a) SSP3-7.0 and (b) SSP3-7.0-lowNTCF scenarios and (c) SAT only caused by the non-methane SLCF reductions relative to 1995–2014 surface air (units: K). The areas with hatching indicate that at least one out of seven models disagrees on the sign.
3.2 Changes in temperature extremes in eastern and southern Asia
Figure 6 shows the time series of changes in annual mean extreme temperature indices averaged across the entire study area under the SSP3-7.0 and SSP3-7.0-lowNTCF scenarios from 2015 to 2050 relative to the reference period. All extreme temperature indices in the entire study area consistently increase under both scenarios, with a larger increase under the SSP3-7.0-lowNTCF scenario. By 2050, the hottest day and warm days increase by 2.2 ± 0.7 K (mean ± standard deviation) and 27.7 ± 13.1 % under the SSP3-7.0 scenario and by 2.6 ± 0.6 K and 34.9 ± 13.3 % under the SSP3-7.0-lowNTCF scenario, respectively. Compared to the hottest day and warm days, larger increases occur for the coldest day and warm nights, which increase by 2.8 ± 0.8 K and 35.9 ± 14.9 % under the SSP3-7.0 scenario and 3.2 ± 1.0 K and 43.1 ± 15.6 % under the SSP3-7.0-lowNTCF scenario, respectively. These changes indicate that future nighttime warming will be more apparent than daytime warming under both scenarios. Compared to the SSP3-7.0 scenario, non-methane SLCF emissions reductions result in varying degrees of increase in the extreme temperature indices, and such increases will become more pronounced as future time passes.
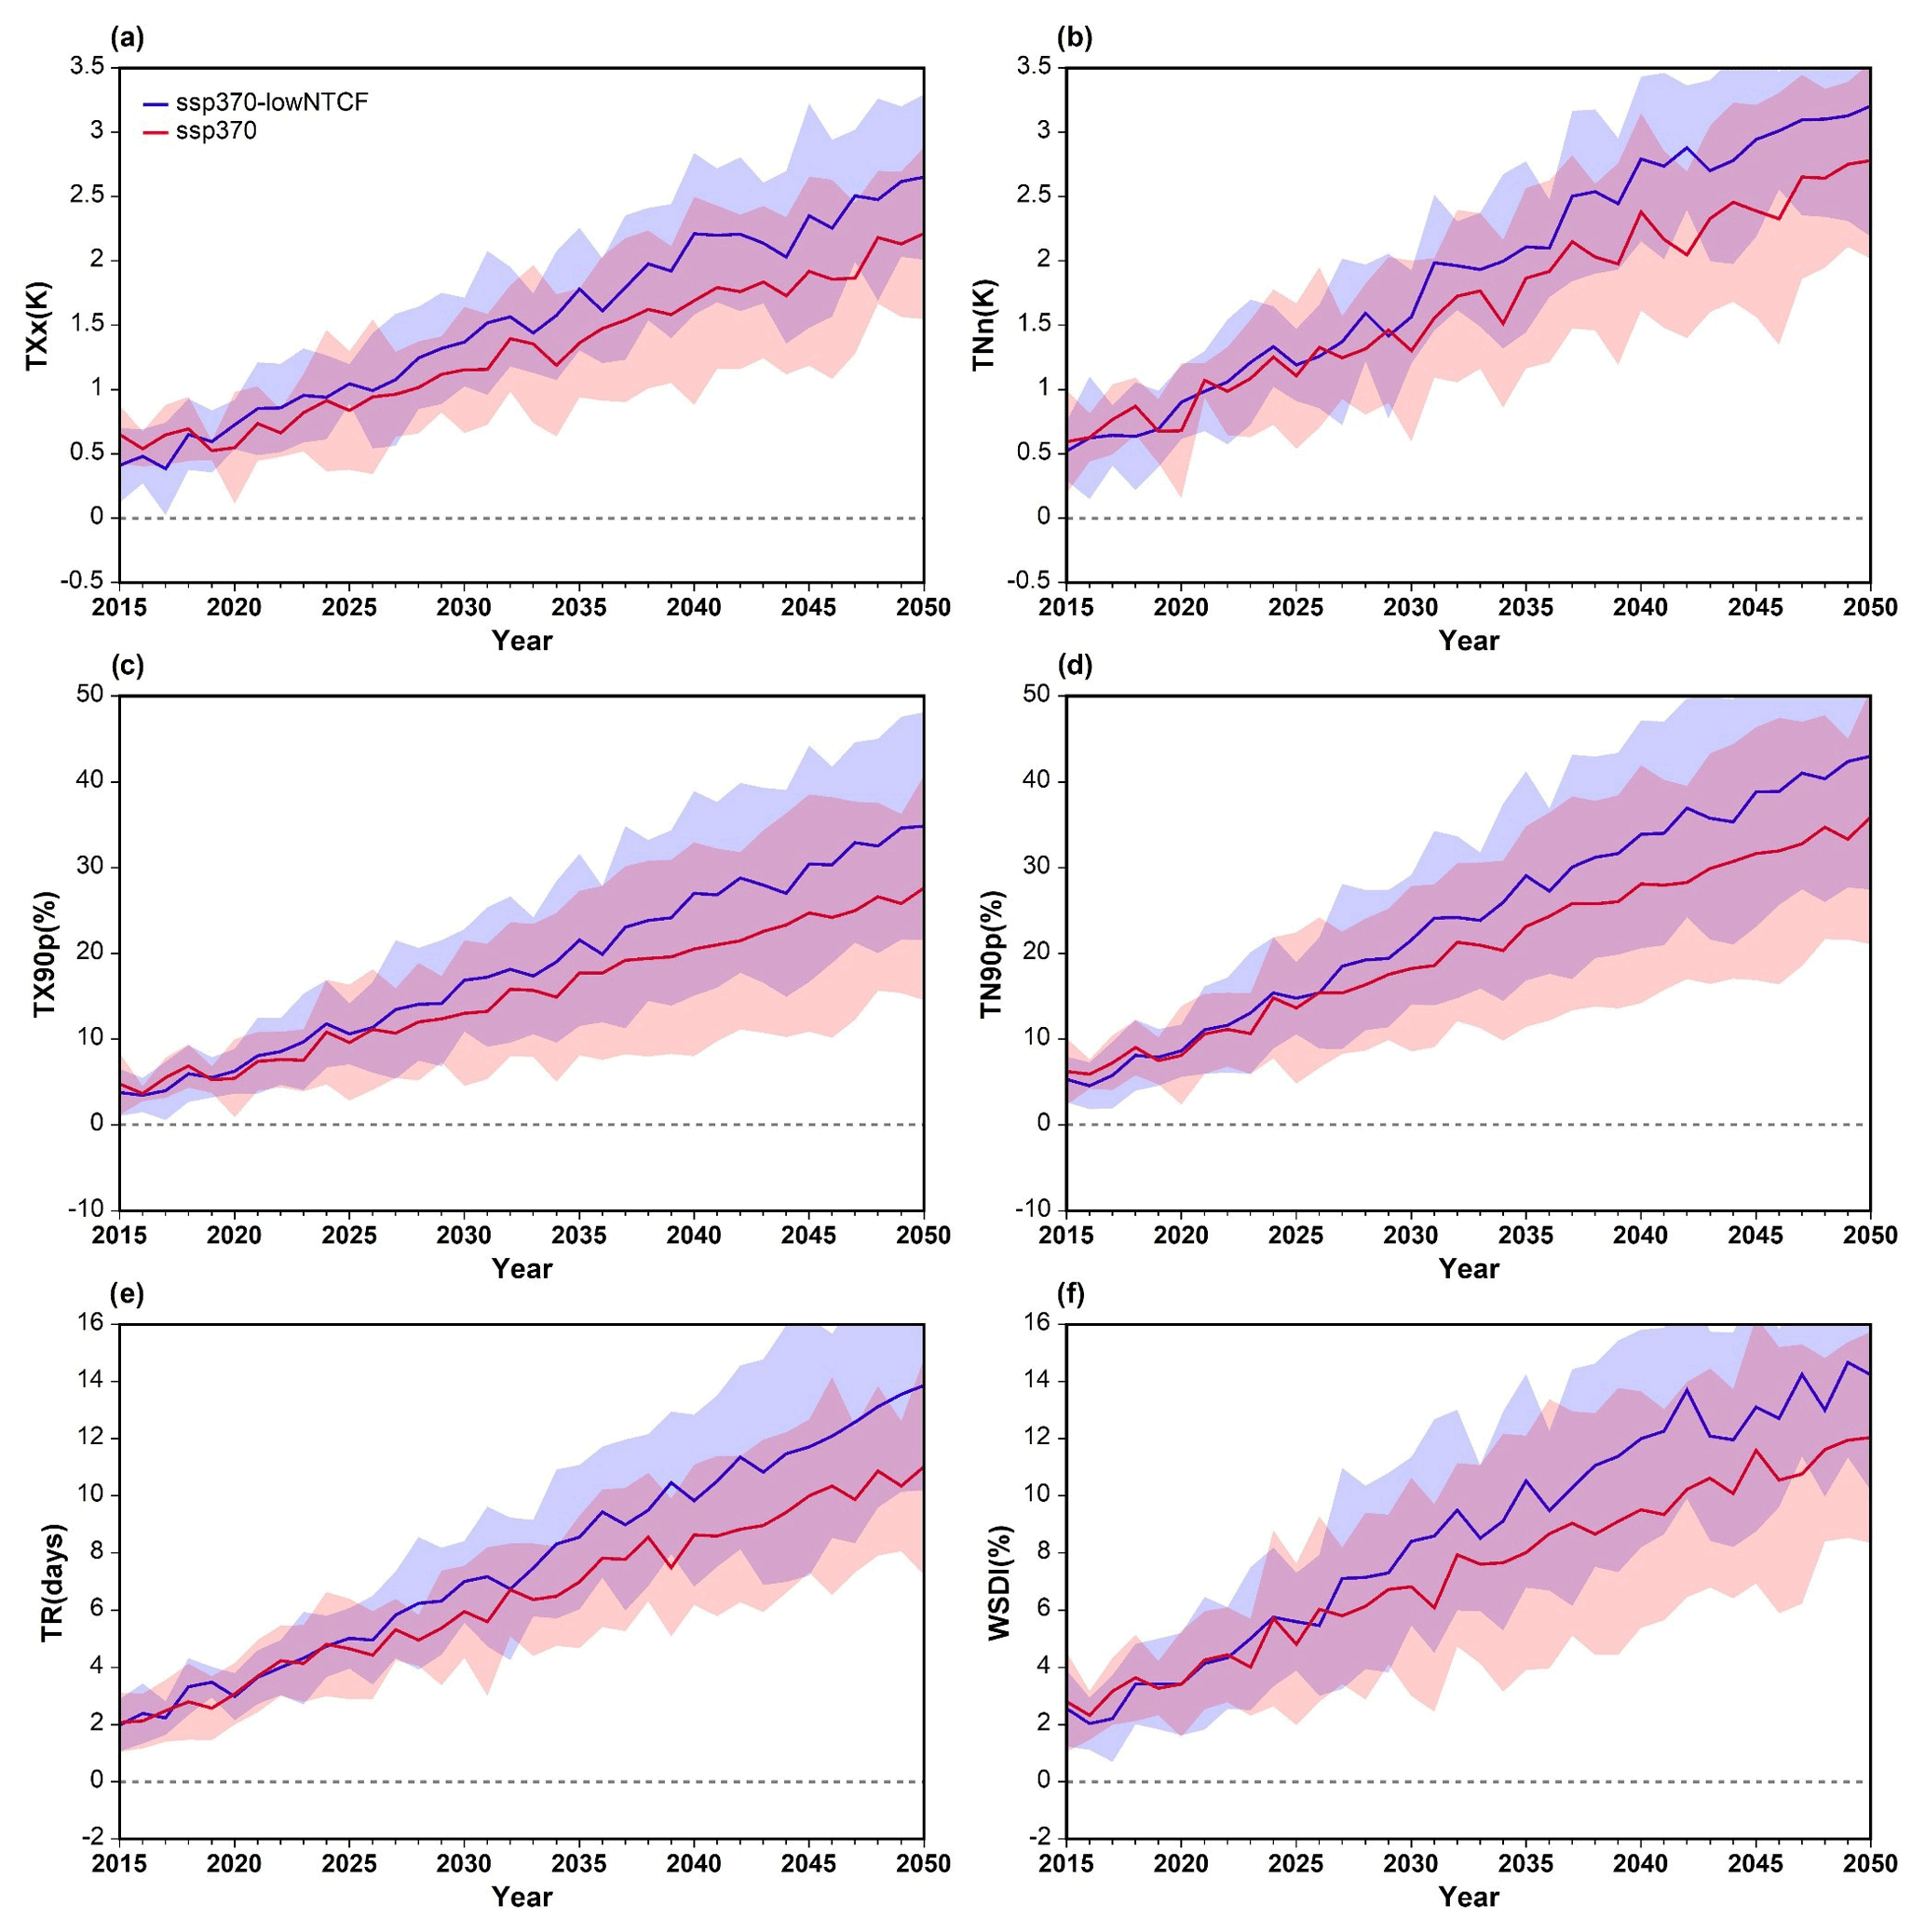
Figure 6Time series of changes in annual mean for the hottest day (TXx; a), coldest day (TNn; b), warm days (TX90p; c), warm nights (TN90p; d), tropical nights (TR; e), and warm-spell duration (WSDI; f) averaged over Asia under the SSP3-7.0 (red) and SSP3-7.0-lowNTCF (blue) scenarios from 2015–2050 relative to 1995–2014. The red and blue shading represents the ±1 standard deviations across models.
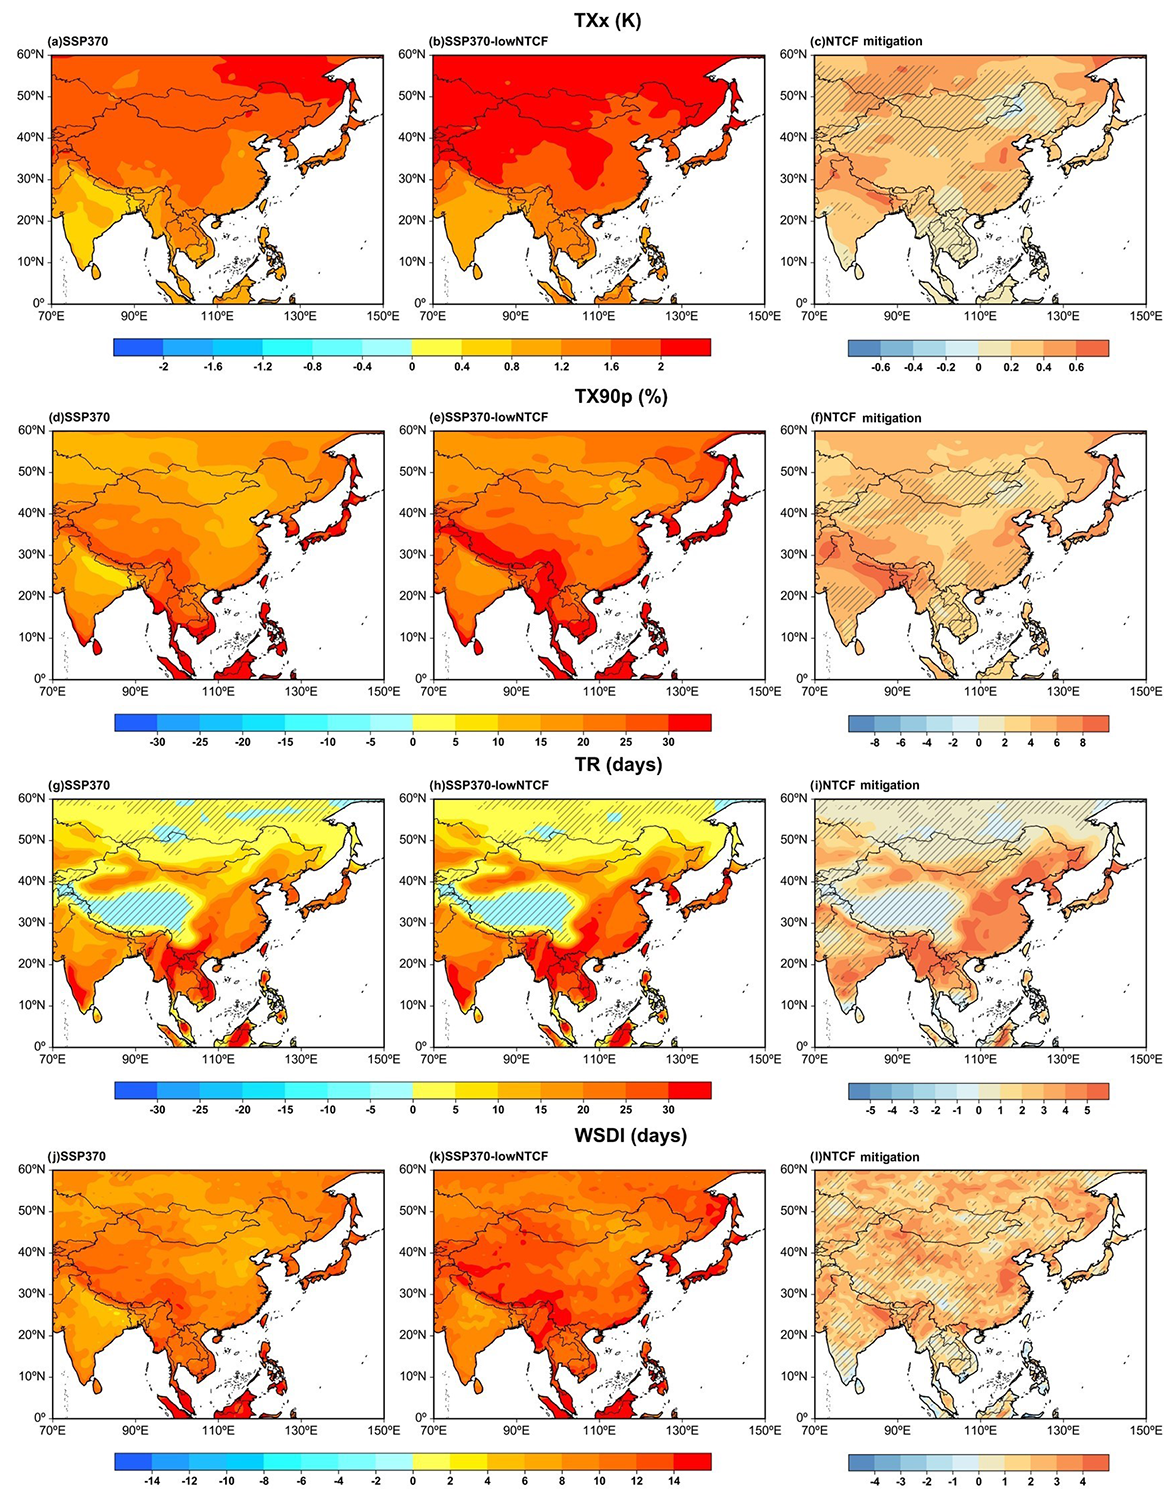
Figure 7Spatial patterns of changes for the hottest day (TXx; a–c), warm days (TX90p; d–f), tropical nights (TR; g–i), and warm-spell duration (WSDI; j–l) during 2031–2050 in Asia under the SSP3-7.0 (left column) and SSP3-7.0-lowNTCF (middle column) scenarios relative to 1995–2014. The right column represents changes caused by the non-methane SLCF mitigation. The areas with hatching indicate that at least one out of five models disagrees on the sign.
Figure 7 shows the spatial patterns of changes for the hottest day, warm days, tropical nights, and warm-spell duration over the entire study area during 2031–2050 relative to the reference period. Consistent increases occur in these extreme temperature indices under both the SSP3-7.0 and SSP3-7.0-lowNTCF scenarios. For the hottest day, in the SSP3-7.0 and SSP3-7.0-lowNTCF scenarios, the warming in most regions exceeds 1.5 K, and the warming is greater at higher latitudes under both scenarios with all models agree on the sign and SNR larger than 1 (Figs. 7a, b and S4a, b). Compared to the SSP3-7.0 scenario, non-methane SLCF reduction leads to an additional increase of about 0.2 K across most of the entire study area's continent. Local effects of non-methane SLCF reductions are particularly large due to the short lifetimes of these contaminants. For example, future reductions in non-methane SLCFs cause the hottest day increases of more than 0.4 K in northern India and northern China with great inter-model consistency, where anthropogenic emissions are high (Fig. 7c).
Similarly, warm days increase under both scenarios (Fig. 7d and e). In contrast to the changes in SAT (Fig. 5) and the hottest day, the increase in the number of warm days is more pronounced (> 40 %) at lower latitudes. This difference arises because lower daily temperature variation at low latitudes could result in more days above the 90th percentile of the reference period. The largest increases in the number of warm days with non-methane SLCF reductions are found over northern India and eastern China with relatively high agreement among models and confidence level (Figs. 7f and S4f), where increases are more than 8 % and around 6 %, respectively (Fig. 7f). In these regions, the effects of non-methane SLCFs are comparable to those of GHG forcing (Fig. 7d and f). The hottest day and warm days indicate an increase in the number of extreme daytime heat events, which not only increases the risk for heatstroke but also exacerbates ozone pollution, posing a further threat to human health (Gosling et al., 2009; Pu et al., 2017).
Concomitant with the increases for the coldest day and warm nights (Fig. 6), tropical nights are also projected to increase over most study area (red areas in Fig. 7g and h) in the future with some difference among models, but the agreement among models is relatively good in regions where tropical nights increase, such as eastern China, western northern China, southern Asia, and southern eastern Asia. An increase of more than 40 d occurs in parts of southern India, the Indo-China Peninsula, and Indonesia, followed by eastern and northern China and Mongolia, with increases greater than 30 d, under the SSP3-7.0 scenario (Fig. 7g). The spatial pattern of tropical-night changes under SSP3-7.0-lowNTCF is similar to that under SSP3-7.0, but the magnitude of the changes is larger, especially in eastern China, western northern China, and on the Indo-China Peninsula where models show good agreement (Figs. 7g, h and S4g, h). Non-methane SLCF reductions cause robust increases in the number of tropical nights of more than 5 d on the Indo-China Peninsula, in northern and northeastern China, and on the Korean Peninsula (Fig. 7i). Notably, tropical nights indicate that the temperature at night remains above 20 ∘C. High nighttime temperatures can cause insomnia and abnormalities in thermoregulation, which may increase health risks, particularly for elderly or sick individuals (Fischer and Schär, 2010; Gosling et al., 2009).
With the increase in average temperature and values of extreme temperature indices described above, warm-spell duration is also projected to increase across the entire study area under both scenarios (Fig. 7j and k). Similarly to warm days, the increase in warm-spell duration is more apparent at lower latitudes. The largest increments occur over the Qinghai–Tibet Plateau, southern China, and the Indo-China Peninsula. Compared to the SSP3-7.0 scenario, the increase in warm-spell duration is greater under the SSP3-7.0-lowNTCF scenario, with increases of more than 12 d on the Qinghai–Tibetan Plateau, the Indo-China Peninsula, and along the coast of southern China. Non-methane SLCF reductions are associated with increases in warm-spell duration of more than 2 d over most study area and more than 4 d in parts of northern China, coastal areas of southern China, northern India, and central and northern Asia (Fig. 7l). Notably, the confidence level of the MME in these regions is relatively high, except for some small areas (Fig. S4l), but the variation in sign among models is large (Fig. 7l).
Overall, although ozone reductions cause cooling, the combined reductions in aerosols, ozone, and their precursors have an additional warming effect on Earth's climate system, exacerbating the surface warming and extreme temperature events caused by GHGs. These results are consistent with studies considering only aerosol reductions (Wang et al., 2016; Samset et al., 2018). Spatially, non-methane SLCF reductions cause the largest increases in extreme temperature indices in northern India and eastern China with good agreement among models and a high level of confidence (Fig. S4). In these regions, the human and environmental effects of temperature extremes are more significant due to high population densities and industrial development. Therefore, we selected northern India (NIN), northern China (NC), southern China (SC), and the Sichuan Basin (SCB) (Fig. 8a) for the quantitative assessment of changes in regional mean extreme temperature indices in response to non-methane SLCF reductions.
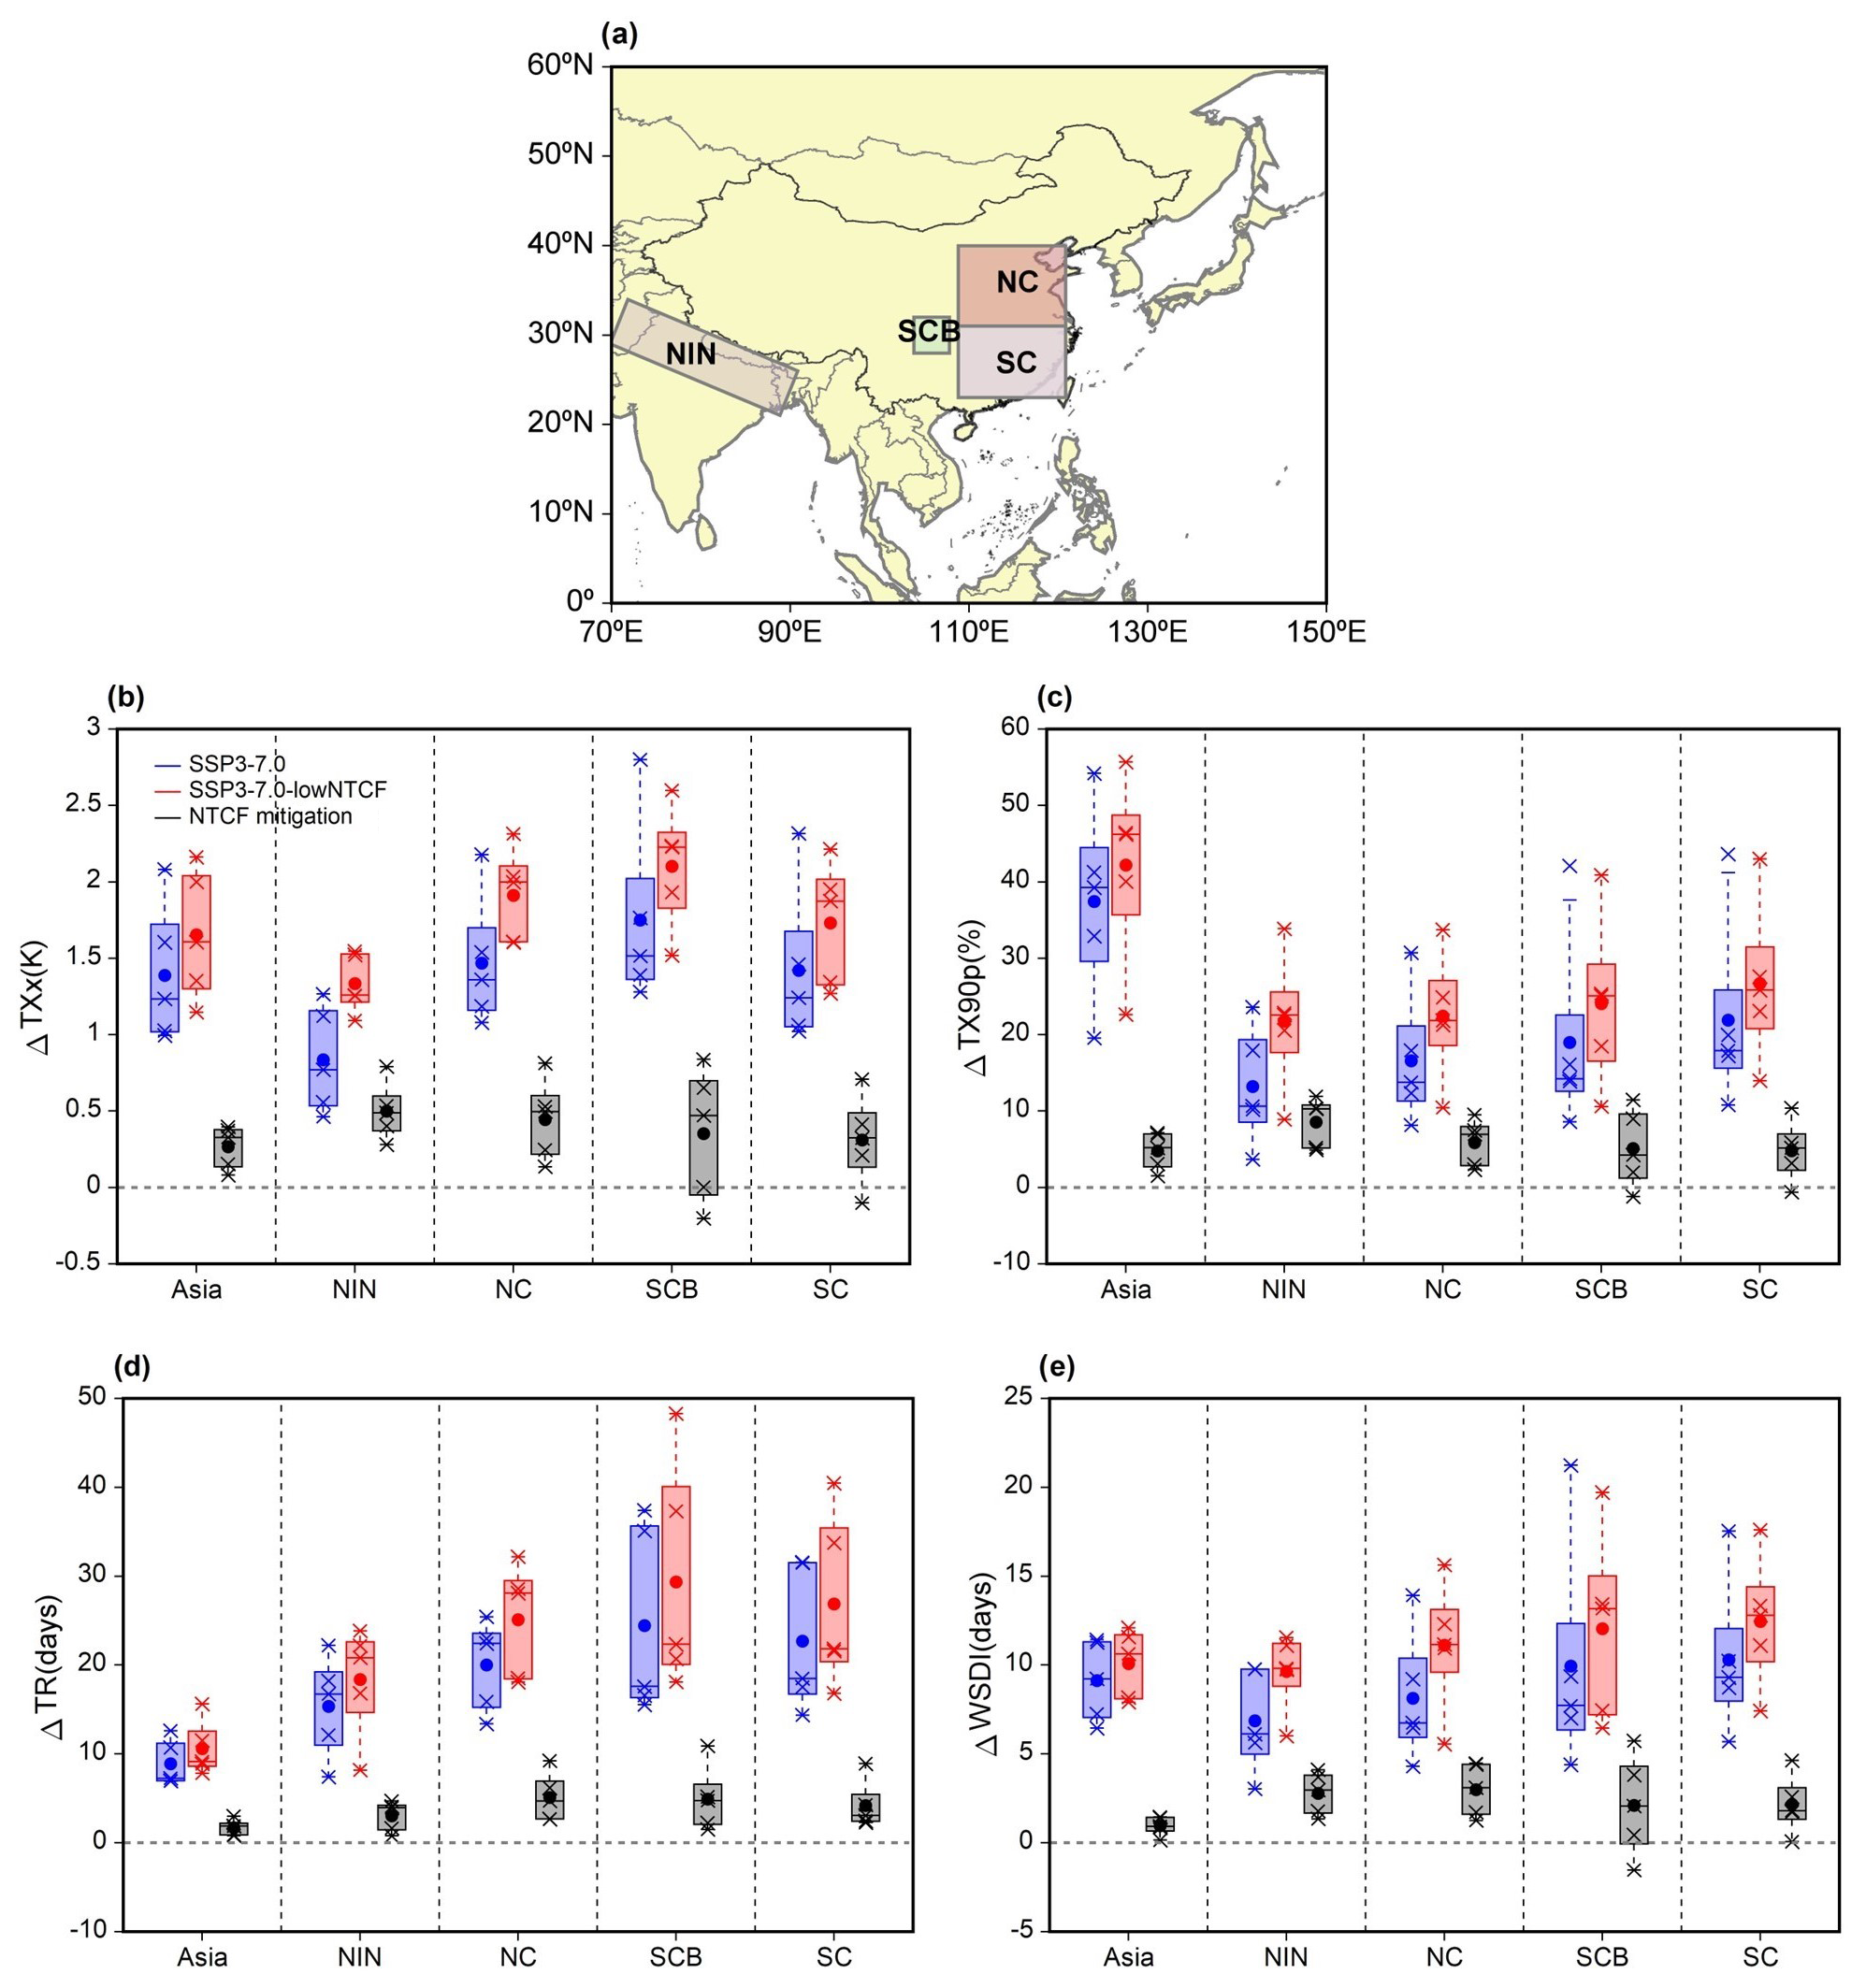
Figure 8Changes for the hottest day (TXx; b), warm days (TX90p; c), tropical nights (TR; d), and warm-spell duration (WSDI; e) averaged over NIN, NC, SC, and SCB (a) during 2031–2050 relative to 1995–2014 under the SSP3-7.0 (red) and SSP3-7.0-lowNTCF (blue) scenarios. The grey bars represent the changes caused by the non-methane SLCF reductions. The star symbols indicate the individual models, and the boxes indicate the spread from the 25th to the 75th percentile of the models, with the centre lines representing the median and the dot representing the mean values.
The domain-averaged values of the hottest day, warm days, tropical nights, and warm-spell duration across the entire study area have increases of 1.4 ± 0.4 K, 37.4 ± 11.3 %, 8.9 ± 2.3 d, and 9.1 ± 2.0 d under the SSP3-7.0 scenario, respectively (Fig. 8). Considering the effects of non-methane SLCF reductions, these extreme temperature indices show increases of 1.7 ± 0.4 K, 42.2 ± 11.0 %, 10.6 ± 2.8 d, and 10.1 ± 1.7 d under the SSP3-7.0-lowNTCF scenario, respectively. Future reductions in non-methane SLCFs result in additional increases of 0.3 ± 0.1 K for the hottest day, 4.8 ± 2.2 % for warm days, 1.7 ± 0.8 d for tropical nights, and 1.0 ± 0.4 d for warm-spell duration for the entire study area. The hottest day, warm days, and warm-spell duration all show their largest regional increases in NIN and NC due to non-methane SLCF reduction, reaching 0.5 ± 0.2 K, 8.5 ± 2.9 %, and 2.8 ± 1.1 d and 0.4 ± 0.2 K, 5.9 ± 2.7 %, and 3.0 ± 1.3 d, respectively. The models agree on the sign of the change for tropical nights across regions, and the largest increases occur in NC and the SCB, at 5.1 ± 2.5 and 4.9 ± 3.3 d, respectively. Although the MME changes in regional mean extreme temperature indices are consistently positive, some differences are found among the models which may be attributed to differences in model resolution, the types of SLCFs included in each model, and parameterisation schemes (Allen et al., 2020; Wei et al., 2019).
3.3 Changes in precipitation extremes in eastern and southern Asia
Figure 9 shows the time series of changes in annual mean precipitation indices averaged across the entire study area under the SSP3-7.0 and SSP3-7.0-lowNTCF scenarios from 2015 to 2050 relative to the reference period. Similarly to the extreme temperature changes described above, the extreme precipitation changes are larger under the SSP3-7.0-lowNTCF scenario than the SSP3-7.0 scenario, and this difference increases gradually after 2030. However, precipitation projections have larger uncertainties and disagree more across models. By 2050, the values of heavy precipitation days, the maximum consecutive 5 d precipitation, and total wet-day precipitation have increased by 1.6 ± 0.6 d, 2.7 ± 1.0 d, and 46.7 ± 16.4 mm under the SSP3-7.0 scenario, respectively. The increases in precipitation decrease the number of drought events, resulting in a reduction in the number of maximum consecutive dry days of 2.4 ± 1.5 d. Non-methane SLCF mitigation causes an increase in the extreme precipitation indices after 2035 except CDDs, which show a complex signal in the future.
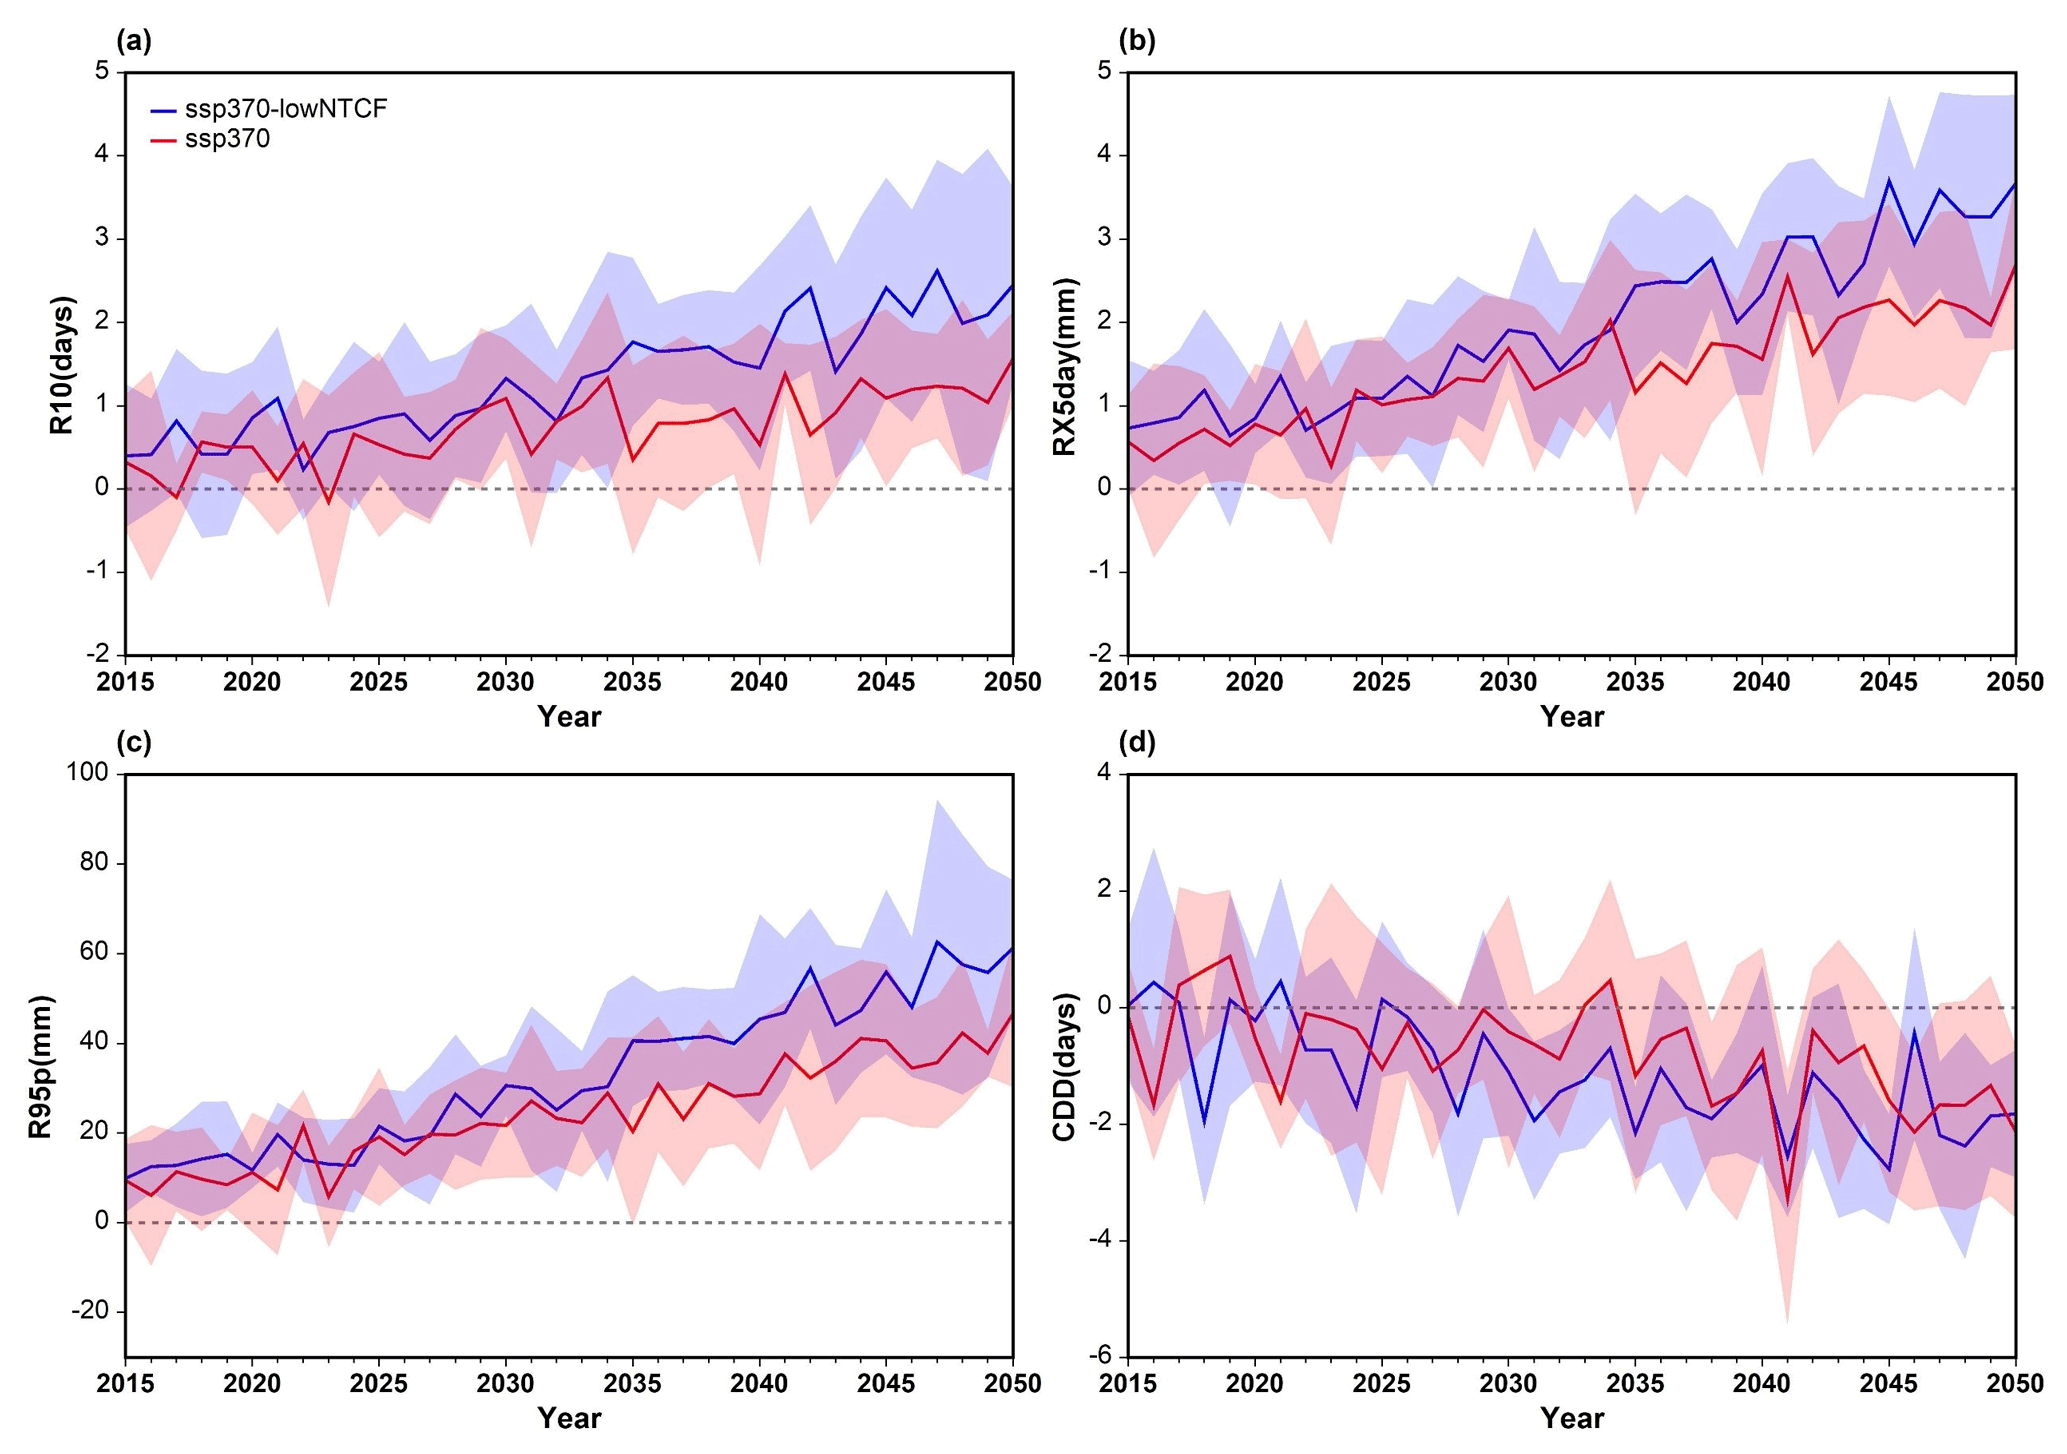
Figure 9Time series of changes in annual mean heavy precipitation (R10; a), maximum consecutive 5 d precipitation (RX5day; b), total wet-day precipitation (R95p; c), and consecutive dry days (CDDs; d) averaged over Asia under the SSP3-7.0 (red) and SSP3-7.0-lowNTCF (blue) scenarios from 2015–2050 relative to 1995–2014. The red and blue shading represents the ±1 standard deviations across models.
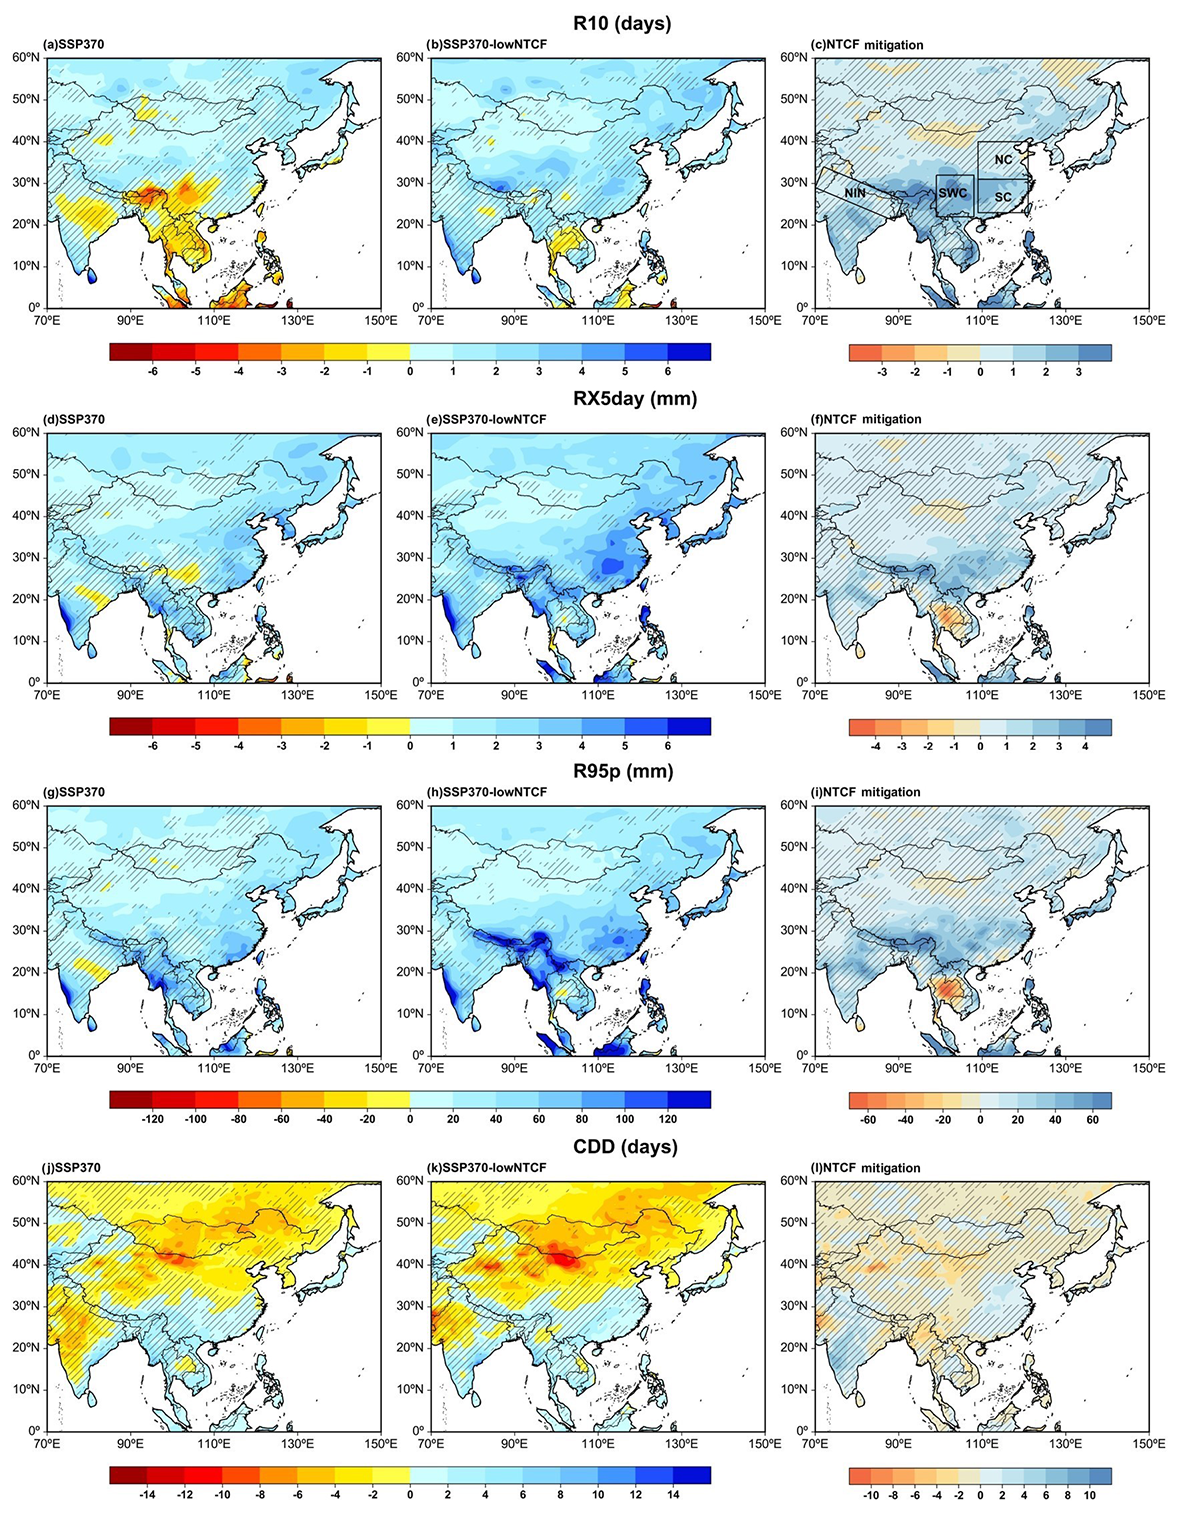
Figure 10Spatial patterns of changes in heavy precipitation (R10; a–c), maximum consecutive 5 d precipitation (RX5day; d–f), total wet-day precipitation (R95p; g–i), and consecutive dry days (CDDs; j–l) during 2031–2050 in Asia under the SSP3-7.0 (left column) and SSP3-7.0-lowNTCF (middle column) scenarios relative to 1995–2014. The right column represents changes caused by the non-methane SLCF mitigation. The areas with hatching indicate that at least one out of six models disagrees on the sign.
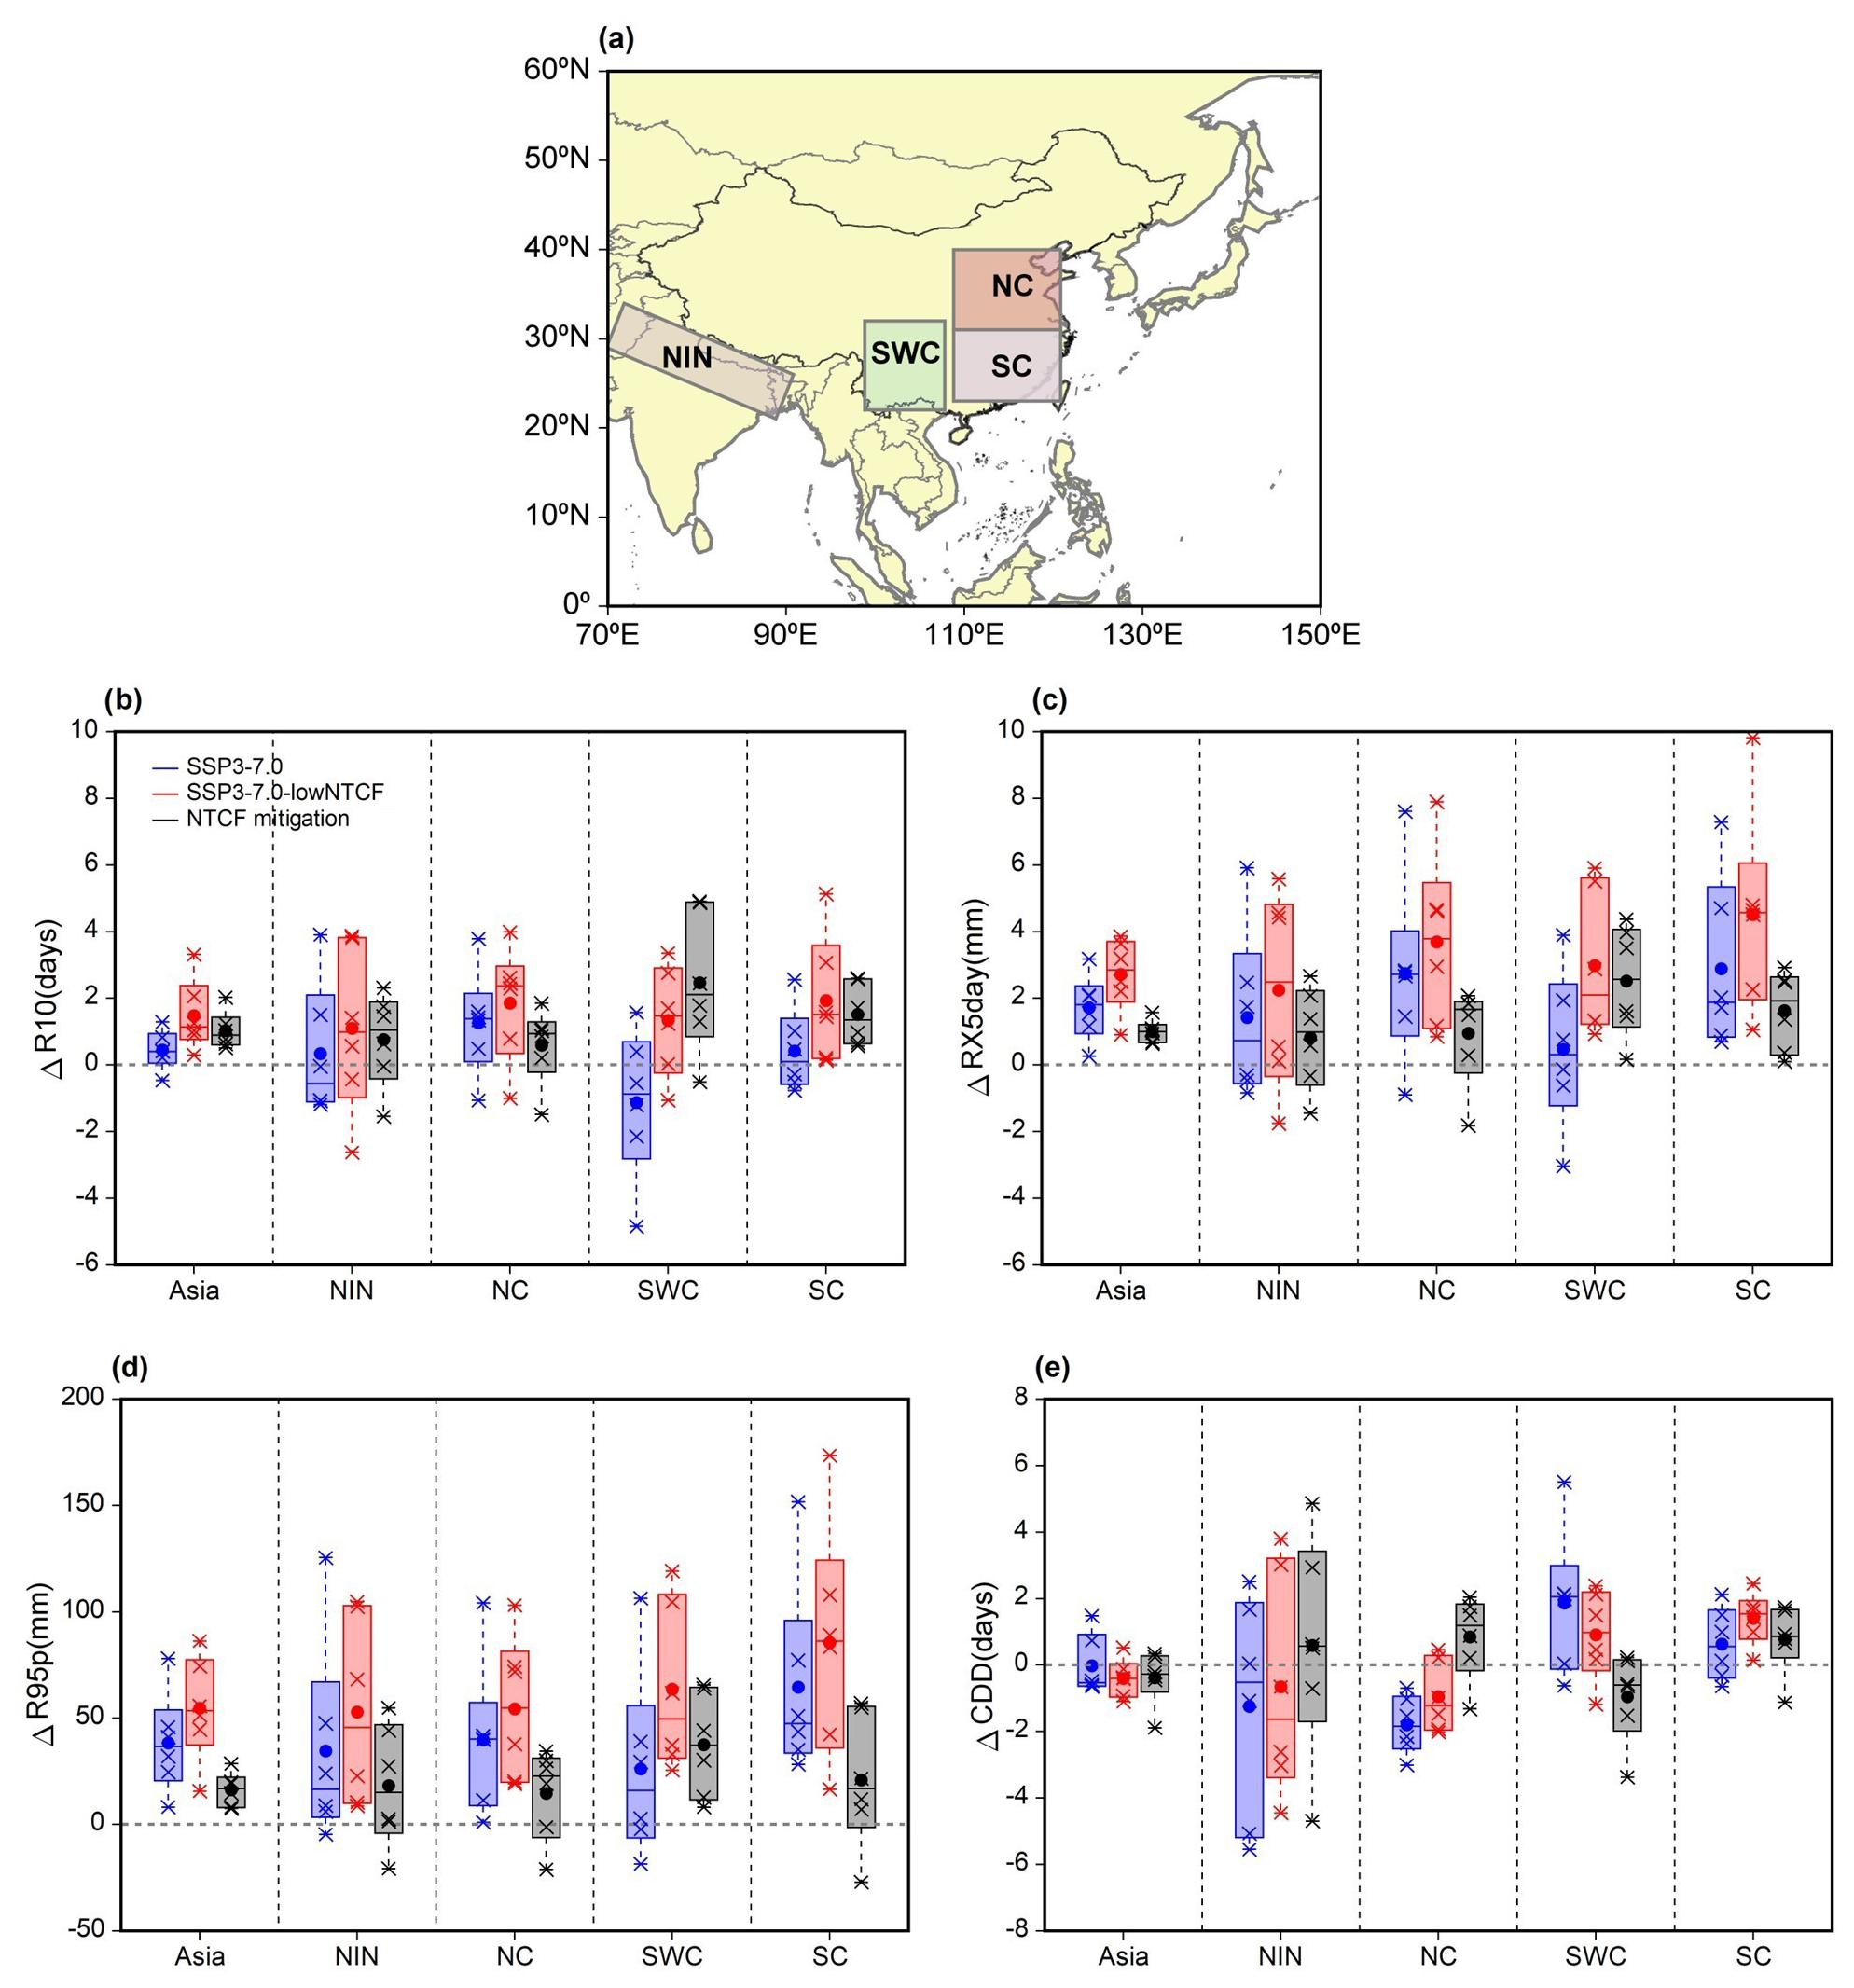
Figure 11Changes in heavy precipitation (R10; b), maximum consecutive 5 d precipitation (RX5day; c), total wet-day precipitation (R95p; d), and consecutive dry days (CDDs; e) averaged over NIN, NC, SC, and SCB (a) during 2031–2050 relative to 1995–2014 under the SSP3-7.0 (red) and SSP3-7.0-lowNTCF (blue) scenarios. The grey bars represent the changes caused by the non-methane SLCF reductions. The star symbols indicate the individual models, and the boxes indicate the spread from the 25th to the 75th percentile of the models, with the centre lines representing the median and the dot representing the mean values.
Figure 10 shows the spatial patterns of the extreme precipitation indices over the entire study area. Considering the spatial distribution of the changes in extreme precipitation indices, we selected NIN, NC, SC, and southwestern China (SWC) (Fig. 11a) for the quantitative analysis of extreme precipitation changes. Heavy precipitation days, the maximum consecutive 5 d precipitation, and total wet-day precipitation represent future changes in the intensity and frequency of extreme heavy precipitation. Under the SSP3-7.0 scenario, the number of heavy precipitation days decreases by approximately 2 d in central India and on the Indo-China Peninsula and by more than 4 d on the southeastern Qinghai–Tibet Plateau, in SWC, and in parts of Indonesia, while it increases in all other regions of the entire study area (Fig. 10a). Under the SSP3-7.0-lowNTCF scenario, heavy precipitation days increase by 1.5 ± 1.0 d across the entire study area (Fig. 11b), with the largest increases in western China and near the Himalayas. However, it is worth noting that the consistency among models is poor (Figs. 10b and S5b). The reductions in non-methane SLCFs cause an increase of 1.0 ± 0.5 d for average heavy precipitation days across the entire study area (Fig. 11b). For the selected regions, robust increases in the number of heavy precipitation days occur in SWC and SC, reaching 2.5 ± 1.9 d and 1.5 ± 0.8 d, respectively (Figs. 10c and 11b). In addition, increases of more than 3.0 d for heavy precipitation days are also found in India, on the Indo-China Peninsula, and in Indonesia, but again, consistency in these regions among models is poor, and this pattern is exactly opposite to that of GHG forcing (Fig. 10a and c). By contrast, previous research suggested that a reduction in aerosols alone will reduce R10 in these regions during 2031–2050 (Wang et al., 2016; Zhao et al., 2018).
The maximum consecutive 5 d precipitation increases across most of eastern and southern Asia under both future scenarios (Fig. 10d and e), with average increases of 1.7 ± 0.9 and 2.7 ± 1.0 mm under the SSP3-7.0 and SSP3-7.0-lowNTCF scenarios, respectively (Fig. 11c); the largest increases among the selected regions occur in SC, at 2.9 ± 2.4 and 4.5 ± 2.8 mm, respectively (Fig. 11c). Future reductions in non-methane SLCFs lead to an increase of 1.0 ± 0.3 mm in the maximum consecutive 5 d precipitation in the entire study area (Fig. 11c). Regionally, these effects of non-methane SLCF reductions are much greater than the effects of GHG forcings alone. For example, non-methane SLCF mitigation yields an increase of 2.5 ± 1.5 mm in the maximum consecutive 5 d precipitation in SWC, compared to 0.5 ± 2.1 mm under the SSP3-7.0 scenario (Fig. 11c). In addition, non-methane SLCF reductions cause an increase of more than 2 mm in the maximum consecutive 5 d precipitation on the southeastern Qinghai–Tibet Plateau, in the western Hengduan Mountains, in SWC, and in the middle and lower reaches of the Yangtze River, whereas decreases of more than 3 mm occur in the southwestern part of the Indo-China Peninsula. However, there are large differences among models (Figs. 10f and S5f). The variation in the maximum consecutive 5 d precipitation can be used as an indicator of flooding and related hazards (Frich et al., 2002; Sillmann et al., 2013a). Our results suggest that heavy precipitation associated with natural disasters will be aggravated in some parts of eastern and southern Asia in the future due to non-methane SLCF reductions.
The spatial pattern of changes in total wet-day precipitation is consistent with that of the maximum consecutive 5 d precipitation. With or without strong air quality controls, total wet-day precipitation increases across most of eastern and southern Asia, reaching 38.3 ± 21.5 and 54.7 ± 22.4 mm, respectively (Figs. 10g, h and 11d). The increases in total wet-day precipitation exceed 120 mm in the Himalayas, on the southeastern Qinghai–Tibet Plateau, in the western Hengduan Mountains, and in Indonesia under the SSP3-7.0-lowNTCF scenario (Fig. 10h). Additional increases in total wet-day precipitation caused by reduced emissions of non-methane SLCFs are apparent on the southeastern Qinghai–Tibet Plateau, in SWC, and in the middle and lower reaches of the Yangtze River (> 40 mm), while decreases occur in the southwestern part of the Indo-China Peninsula (< 50 mm) with less consistency among models. Total wet-day precipitation also decreases (< 10 mm) along the coast of SC (Fig. 10i), with effects greater than or comparable to GHGs– even opposite in some regions. This finding is in opposition to previous results based on only aerosol reduction (Wang et al., 2016; Zhao et al., 2018).
In contrast to the three extreme precipitation indices described above, consecutive dry days represent the variability in extreme drought. In the entire study area north of 30∘ N, the increase in total precipitation reduces the number of consecutive dry days, particularly at high latitudes. However, consecutive dry days increase in NIN, on the southeastern Tibetan Plateau, and in the southern Yangtze River (Fig. 10j and k) with low inter-model agreement. Overall, consecutive dry days decrease by 0.02 ± 0.8 and 0.4 ± 0.5 d under the SSP3-7.0 and SSP3-7.0-lowNTCF scenarios, respectively (Fig. 11e), with SNR less than 1, which means model projections have a low level of confidence (Fig. S5j and k). Future reductions in non-methane SLCFs contribute to decreases in the number of consecutive dry days in northwestern and northeastern China, near the Hengduan Mountains, and on the Indo-China Peninsula. Consecutive dry days decrease by 1.4 ± 1.2 d in SWC due to increases in the frequency and intensity of heavy precipitation (Fig. 11e). The sign of the results shows relatively good agreement, and the SNR is larger than 1 among models in SWC and NC (Figs. 10i and S5i). Similarly, the changes in consecutive dry days due to non-methane SLCF reductions in some regions are comparable to the impacts of GHG forcing. Also, for most regions, the models do not all agree on the sign of the responses and have a low level of confidence. The increases in the number of consecutive dry days in India and eastern China are accompanied by increases in the frequency and intensity of extreme precipitation, which may be related to the probability distribution of future precipitation. A decrease in light rainfall and increase in heavy rainfall will lead to simultaneous increases in the number of consecutive dry days and extreme precipitation (Wang et al., 2016). Zhu et al. (2021) showed that extreme precipitation in SC increases, while droughts become more severe under the SSP3-7.0 and SSP5-8.5 scenarios, suggesting that the future precipitation probability distribution function (PDF) in SC could be more heterogeneous under high-SSP scenarios.
3.4 Population exposure to climate extremes in eastern and southern Asia
Extreme weather and climate events pose serious threats to human health, economic stability, and environmental sustainability, particularly in densely populated areas. Sustained warming of the climate will exacerbate climate extremes and the associated risks (Diffenbaugh et al., 2017; Sun et al., 2021). Based on the analysis presented above, a reduction in non-methane SLCFs will further increase the frequency, intensity, and duration of extreme temperature and precipitation occurrences in eastern and southern Asia. Next, we analyse the changes in population exposure to warm days and total wet-day precipitation under both future scenarios (Fig. 12). It is important to emphasise that there are still uncertainties among models, especially in future projections of extreme precipitation, and the difference in model simulations could also lead to uncertainties in population exposure.
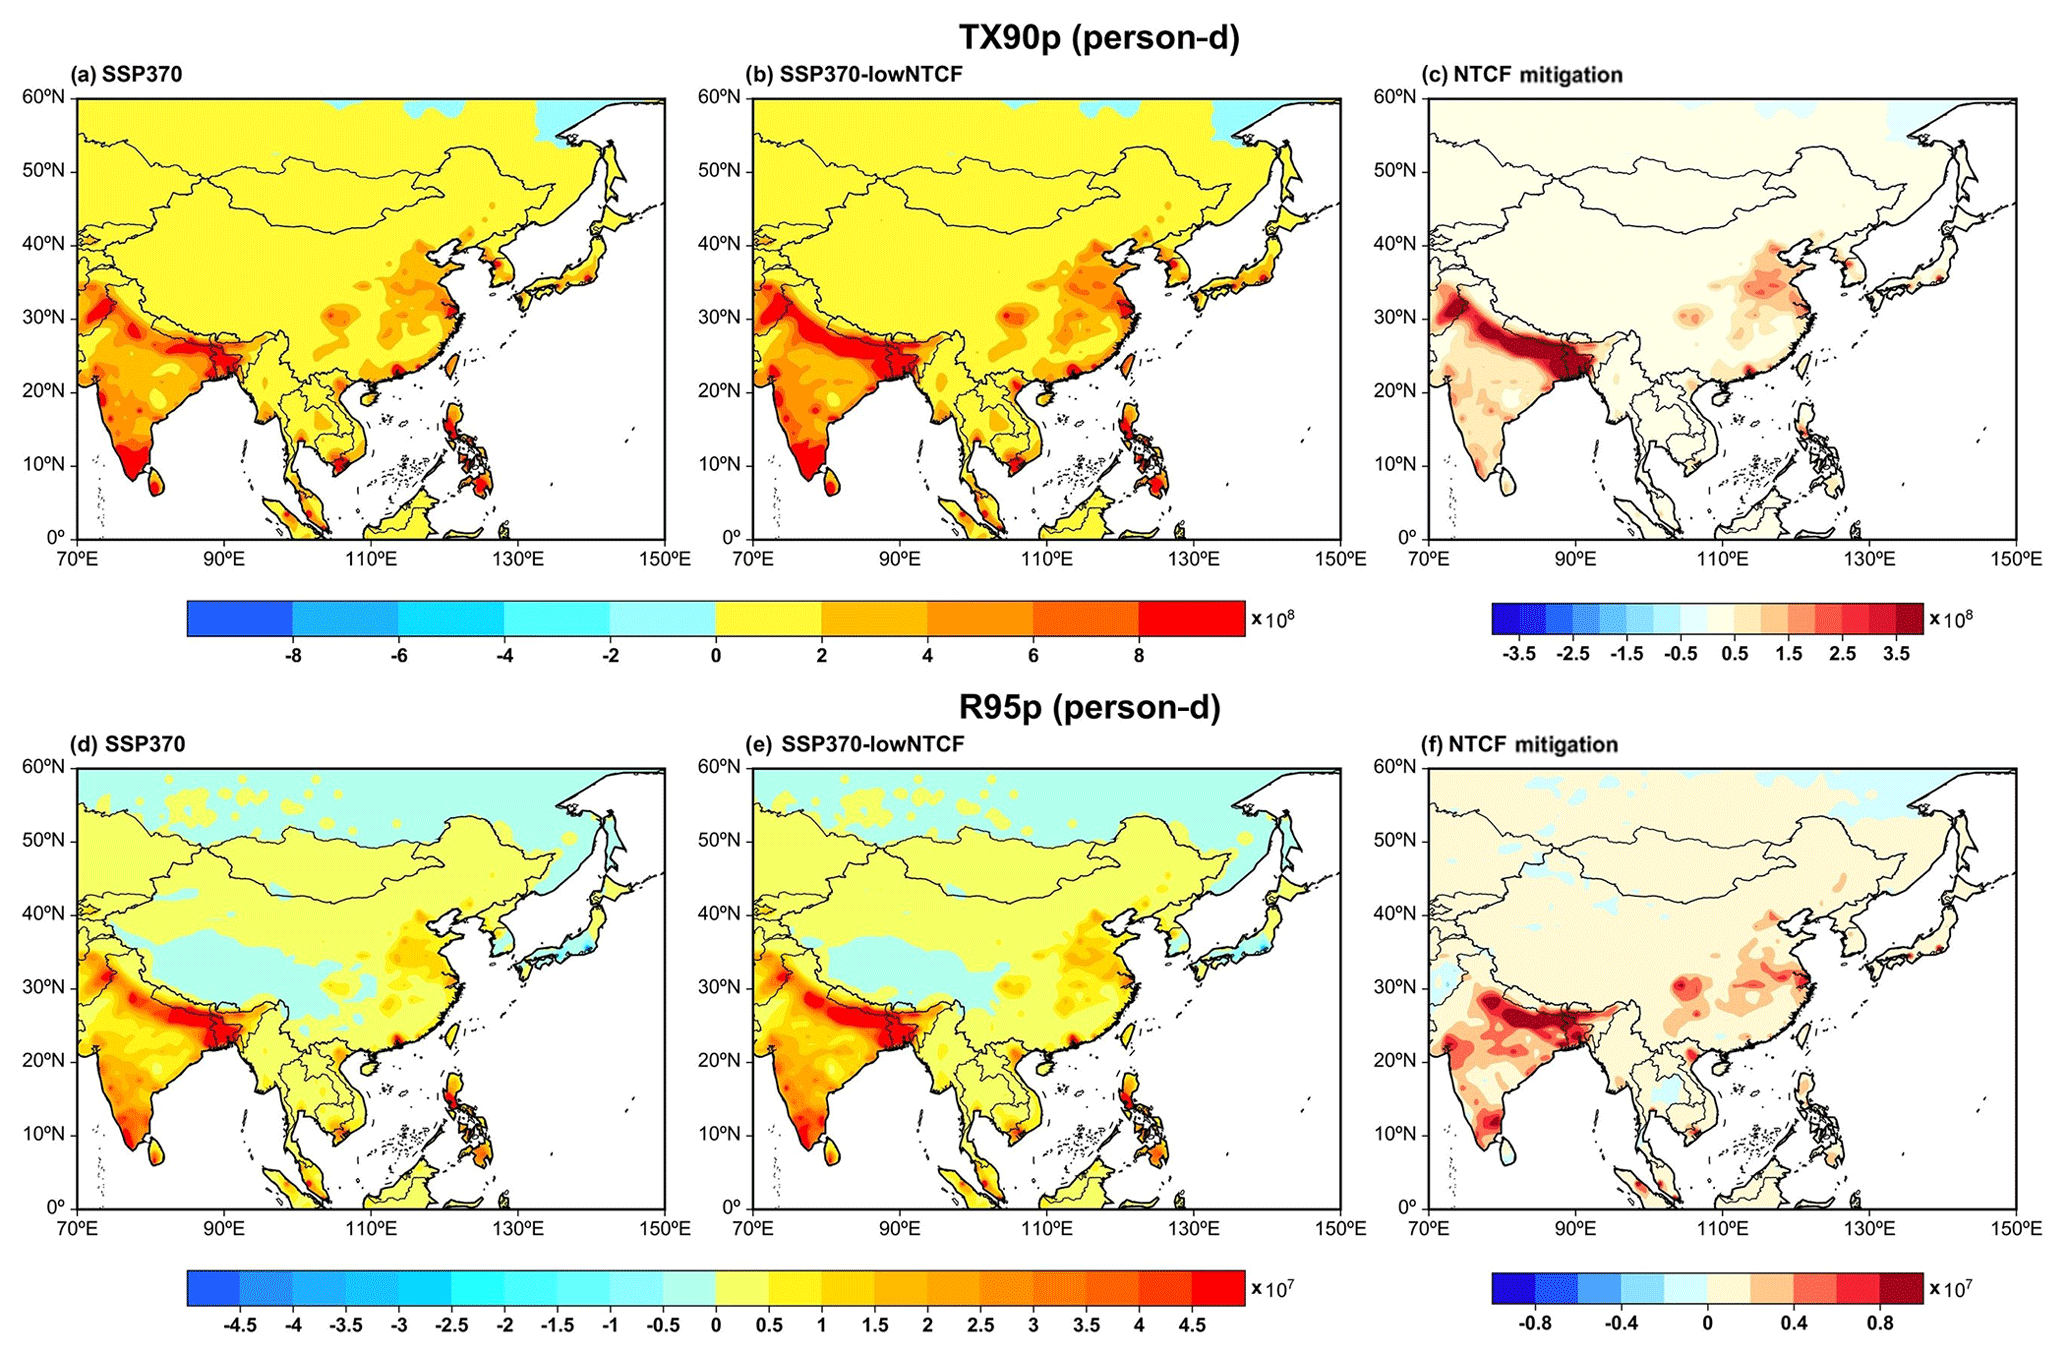
Figure 12Spatial patterns of changes in population exposed to warm days (TX90p) and total wet days (R95pdays) in Asia during 2031–2050 under the SSP3-7.0 (a, d) and SSP3-7.0-lowNTCF (b, e) scenarios relative to 1995–2014 (units: person-days). Panels (c) and (f) represent the changes caused by the non-methane SLCF reductions.
Considering population growth and the increased frequency of climate extremes, the total population exposed to warm days and total wet-day precipitation show similar spatial patterns under the SSP3-7.0 and SSP3-7.0-lowNTCF scenarios, with the largest increases in India and eastern China (Fig. 12a, b, d, and e). Quantitatively, with the same population growth, a significantly greater population will be exposed to extreme temperature than to extreme heavy precipitation due to the higher frequency of extreme temperature events than extreme heavy precipitation events in the future. Under the SSP3-7.0 scenario, the largest increases in the population exposed to extreme temperature occur in India and eastern China, with a maximum increase greater than 6 × 10⁸ person-days, while the increases in the population exposed to extreme precipitation exceed 4.5 × 10⁷ person-days in India and are relatively small in eastern China (> 1.5 × 10⁷ person-days) (Fig. 12e). Compared to the SSP3-7.0 scenario, future non-methane SLCF reduction will increase the population exposed to extreme temperature by more than 3.5 × 10⁸ person-days in NIN, followed by more than 1.5 × 10⁸ person-days in NC and the SCB (Fig. 12c). In addition, future non-methane SLCF reductions will significantly increase the population exposed to extreme precipitation in India, the SCB, and the middle and lower reaches of the Yangtze River, reaching values greater than 6 × 10⁶ person-days (Fig. 12f).
Future changes in population exposure to climate extremes are affected by climate, population, and climate–population interactions according to Eq. (1) presented above. Under the SSP3 scenario, the population in India increases significantly by 2040 relative to 2000. This change is particularly sharp in NIN, which experiences an increase of more than 5 million people, followed by more than 1 million people in the SCB, NC, and SC (data not shown). We attribute the changes in population exposure to three major factors (Figs. 13 and 14).

Figure 13The total changes in population exposure to warm days (TX90p) averaged over northern India (NIN; a), northern China (NC; b), the Sichuan Basin (SCB; c), and southern China (SC; d) under the SSP3-7.0 and SSP3-7.0-lowNTCF scenarios and its changes driven by the non-methane SLCF reductions. The pink, green, and orange bars represent the changes driven by climate change, population change, and population–climate interaction, respectively. The error bars denote the ±1 standard deviations across models.
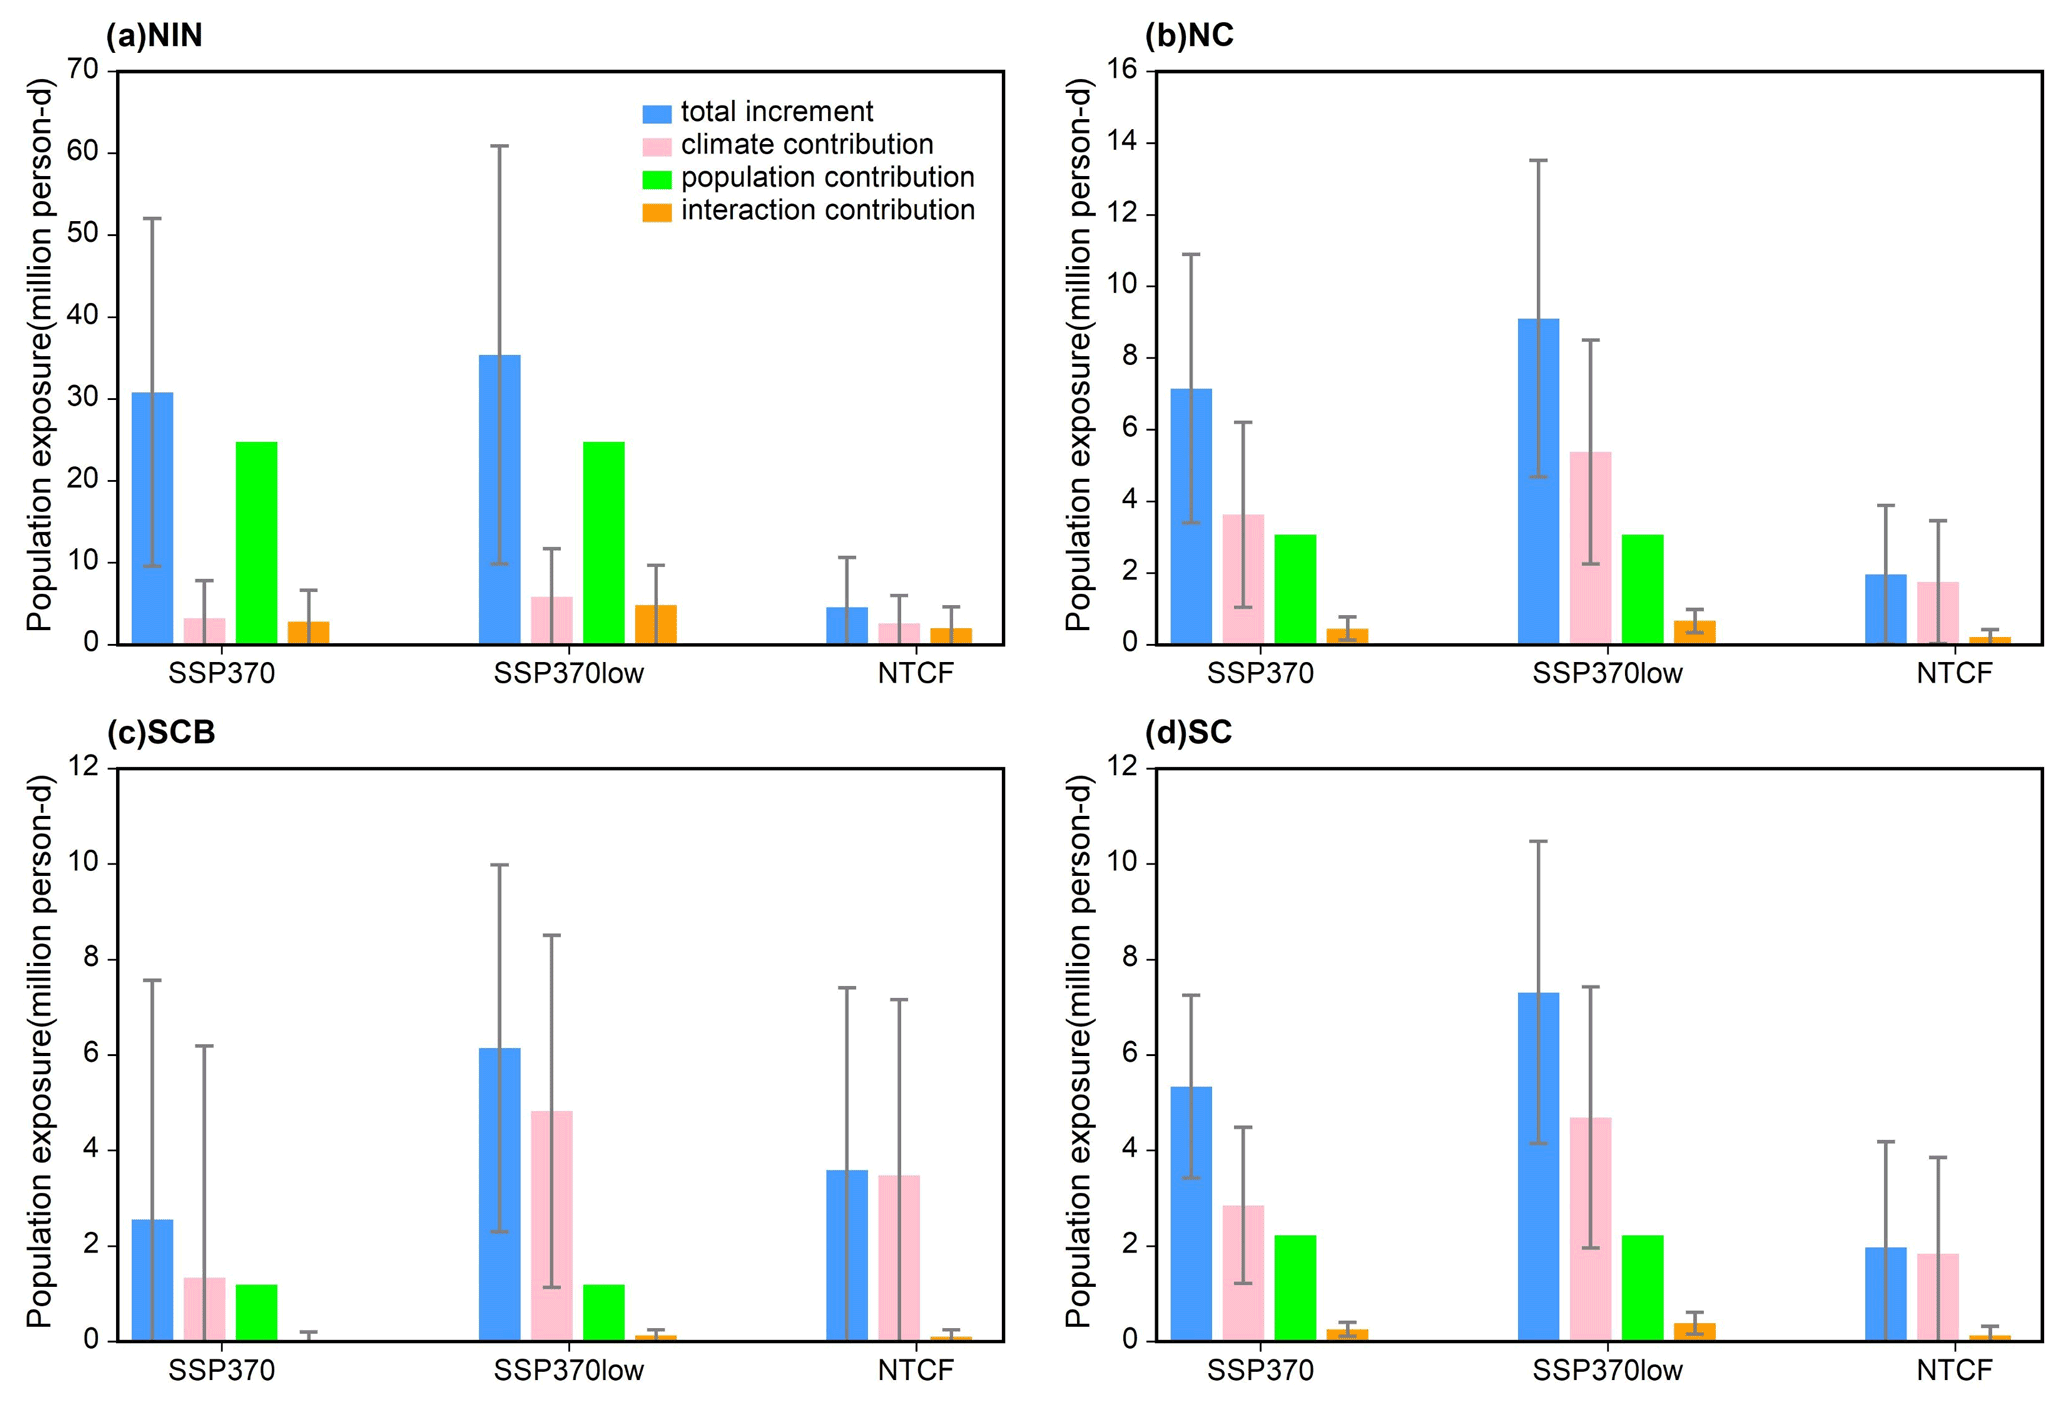
Figure 14The total changes in population exposure to wet days (R95pdays) averaged over northern India (NIN; a), northern China (NC;b), the Sichuan Basin (SCB; c), and southern China (SC; d) under the SSP3-7.0 and SSP3-7.0-lowNTCF scenarios and its changes driven by the non-methane SLCF reductions. The pink, green, and orange bars represent the changes driven by climate change, population change, and population–climate interaction, respectively. The error bars denote the ±1 standard deviations across models.
The increases in population exposed to extreme high temperatures are dominated by changes in climate factors under both the SSP3-7.0 and SSP3-7.0-lowNTCF scenarios in the four selected regions (Fig. 13). This result suggests that climate change caused by non-methane SLCFs is the primary driver of population exposure to extreme temperature events, followed by changes in the climate–population interaction factor, with population change contributing the least. Future non-methane SLCF reductions increase total population exposure to warm days by (32.2 ± 11.4) × 107 person-days in NIN, (10.3 ± 5.2) × 107 person-days in NC, (7.5 ± 6.9) × 107 person-days in the SCB, and (6.3 ± 4.7) × 107 person-days in SC.
For population exposure under extreme precipitation, the climate factor is also the largest contributor to the increase in population exposure, followed by the climate–population interaction factor and the population factor in NC, the SCB, and SC (Fig. 14b–d). By contrast, the population factor becomes dominant in NIN, indicating that population growth is the main cause of increased population exposure in that region, followed by changes in the climate factor and climate–population interaction factor (Fig. 14a). Notably, in the SCB, changes in population exposure caused by non-methane SLCF reductions are greater than those caused by the continued increase in GHGs (Fig. 14c). Future non-methane SLCF reductions increase total population exposure to total wet-day precipitation by (4.6. ± 6.1) × 106 person-days in NIN, (2.0 ± 1.9) × 106 person-days in NC, (3.6 ± 3.8) × 106 person-days in the SCB, and (2.0 ± 2.2) × 106 person-days in SC. Also, the inter-model variation is large, which arises from differences in model simulations of extreme precipitation.
This study quantitatively assesses the impacts of reductions in emissions of non-methane SLCFs (including aerosols, ozone, and their precursors) on eastern and southern Asian climate extremes and the associated population exposure risks during 2031–2050 using MME simulations under the SSP3-7.0 and SSP3-7.0-lowNTCF scenarios from AerChemMIP. Our results show that non-methane SLCF reductions alone will exacerbate the warming effect caused by GHGs, resulting in increases in extreme temperature and precipitation events compared to the standard SSP3-7.0 scenario. These results are consistent with previous studies that have considered only aerosol reductions (Wang et al., 2016; Samset et al., 2018; Luo et al., 2020). Future reductions in non-methane SLCFs during 2031–2050 are projected to cause a global mean ERF of 0.23 ± 0.16 W m−2 and an increase of 0.19 ± 0.1 K in global average SAT relative to 1995–2014 based on the MME results.
The additional warming caused by the reduction in non-methane SLCF emissions increases the temperature of the domain-averaged hottest day by 0.3 ± 0.1 K, the percentage of warm days by 4.8 ± 2.2 %, the number of tropical nights by 1.7 ± 0.8 d, and warm-spell duration by 1.0 ± 0.4 d across the entire study area. The models agree on the sign of the change across regions; the hottest day, warm days, and warm-spell duration show their largest increases in NIN and NC, reaching 0.5 ± 0.2 K, 8.5 ± 2.9 %, and 2.8 ± 1.1 d and 0.4 ± 0.2 K, 5.9 ± 2.7 %, and 3.0 ± 1.3 d, respectively. The increase in the number of warm days due to non-methane SLCF mitigation is comparable to that caused by GHG emissions in some regions. The largest increases in the number of tropical nights are found in NC and the SCB, reaching 5.1 ± 2.5 and 4.9 ± 3.3 d, respectively. Overall, the warming trends driven by the combined reductions in aerosols, ozone, and their precursors are similar to the trends driven only by aerosol reductions. Such strong local effects of SLCFs on temperature extremes were also revealed in other high-emission and high-population-density regions such as Europe and the United States (Sillmann et al., 2013a; Samset et al., 2018; Luo et al., 2020). In addition, population exposure to warm days associated with future non-methane SLCF reductions is greatest in NIN at (32.2 ± 11.4) × 107 person-days.
For extreme precipitation, future non-methane SLCF reductions increase the number of domain-averaged heavy precipitation days by 1.0 ± 0.5 d, the maximum consecutive 5 d precipitation by 1.0 ± 0.32 mm, and total wet-day precipitation by 16.4 ± 7.3 mm in the entire study area. For heavy precipitation days, the maximum consecutive 5 d precipitation, and total wet-day precipitation, there is a robust increase on the southeastern Qinghai–Tibetan Plateau, in SWC, and in the middle and lower reaches of the Yangtze River, with relatively good inter-model agreement and high confidence. In SWC, these extreme precipitation indices increase by 2.5 ± 1.9 d, 2.5 ± 1.5 mm, and 37.5 ± 22.6 mm, and these increases are greater than or comparable to the effects of GHGs. By contrast, consecutive dry days decrease by 1.4 ± 1.2 d in SWC due to increases in the frequency and intensity of heavy precipitation events. Notably, our results show a large uncertainty and model disagreement in simulating future extreme precipitation. Previous studies also indicate that there are still large uncertainties in the model's simulations of extreme precipitation, which may be attributed to model resolution and natural variation (Li et al., 2015; Deser et al., 2012). Besides, large differences are found at the regional scale in response to reductions in non-methane SLCFs and only aerosols, with changes in opposite directions observed in some regions. This discrepancy may be attributed to ozone and aerosol interactions, which may be further assessed via model simulations with both coupled and uncoupled experiments in the future. The spatial pattern of changes in the total population exposed to total wet-day precipitation due to non-methane SLCF reductions is largely consistent with the distribution of warm days, with the largest increases in NIN reaching (4.6 ± 6.1) × 106 person-days. Similarly, the inter-model variation in population exposure is large, which arises from differences in model simulations of extreme precipitation.
Compared with the previous assessment by Allen et al. (2020), our study provides some new insights on the effects of future non-methane SLCF emissions on regional climate change. Firstly, although extreme temperature indices are all increasing in the future due to the reduction in non-methane SLCFs, warm days and warm-spell duration vary spatially opposite to the hottest day, indicating that the warming of future temperature extremes is greater at higher latitudes, while the increase in the frequency and duration of extreme temperature occurrences is more pronounced at lower latitudes. As for extreme precipitation, changes in both heavy precipitation days and total wet-day precipitation in some areas are opposite in sign to previous results considering only aerosol reduction, revealing the importance of considering aerosol and ozone interactions. More importantly, we analyse the changes in tropical nights and the maximum consecutive 5 d precipitation. The former represents the variation in nighttime temperature extremes that are important for human health. The latter is usually used as an indicator of flooding, suggesting that heavy precipitation associated with natural disasters will be aggravated in the future due to non-methane SLCF reduction in certain areas, especially in SC and SWC. Secondly, population exposure is an effective indicator for climate change risk assessment. Compared to the SSP3-7.0 scenario, the reduction in non-methane SLCFs will result in the additional exposure of millions of people to extreme events, as well as up to tens of millions in densely populated areas, such as northern India, which is an indicator of human health risk and also valuable for future policy making on climate change mitigation and adaptation. Thirdly, Allen et al. (2020) used nine models, including five Aer+O3 models and four Aer-only models, but we used seven Aer+O3 models. More Aer+O3 models may better reflect the effect of considering the combined aerosol and ozone changes simultaneously. Finally, Pendergrass et al. (2019) have shown that the response of extreme precipitation to warming varies widely in climate models, especially in the tropics. The rate of response increases with warming and is not linear (Pendergrass et al., 2019), as shown in Allen et al. (2020), in which some of the extreme indices were not well fitted such as the wettest day and CDDs, with a lower value of R2 or even a lack of significance. Freychet et al. (2019) suggested that radiation-driven aerosol emissions impacts on local surface temperature and precipitation were not linear and could be mitigated or cancelled by the local dynamics. Our method of subtracting the mean between two periods may, to some extent, provide a more intuitive representation of the changes in the extreme indices in absolute terms.
Notably, GHGs share many common sources with SLCFs, such as the combustion of fossil fuels. Emissions reductions for shorter-lived GHGs, such as methane, can partially mask or offset the warming caused by emissions reductions in non-methane SLCFs over decades, providing benefits for both climate change mitigation and air quality on nearly all decadal to centennial timescales (Allen et al., 2021; Shindell and Smith, 2019). Increasing and accumulating anthropogenic GHG emissions are the main driving factors in shaping the increase and intensification of extreme high temperatures globally and regionally. By the end of the century, the differences in temperature and precipitation between the different aerosol reduction scenarios are negligible in the context of ambitious CO2 reductions (Hienola et al., 2018; Wilcox et al., 2020), and global warming is significantly less under strong mitigation scenarios with both climate policies and air quality controls (i.e. SSP1-1.9 and SSP1-2.6) than under the SSP3-7.0-lowNTCF scenario with only strong air quality control measures (Naik et a., 2021). Even if the impact of non-methane SLCFs is negligible on centennial timescales, they may be important for regional and global climate in the coming decade, especially for Asia where aerosol has played an important role in historical changes, in particular for precipitation (Wilcox et al., 2020). The important impact of SLCFs on climate change in the short term does not mean that reducing air pollutants is harmful to the climate but rather that it generates additional warming to the climate, amplifying the temperature and extreme precipitation caused by GHG changes (Wang et al., 2016; Luo et al., 2020). In the short term, the differences in regional climate change under different future emissions scenarios depend strongly on changes in emissions of SLCFs, especially before net CO2 emissions (and co-emitted aerosol emissions) become very low in the first half of this century (Hienola et al., 2018; Wilcox et al., 2020). Warming is most obvious in the strong mitigation scenarios (i.e. SSP1-1.9 and SSP1-2.6) because of the rapid reduction in aerosols. In the SSP3-7.0 scenario, aerosols do not decrease until mid-century, but increases in methane and ozone contribute to the net warming in 2040. The warming is similar in magnitude to the SSP1 scenario, where aerosol reductions are the primary driver (Wilcox et al., 2020; Naik et al., 2021). Also, the conclusion of Shindell and Smith (2019) that there is no conflict between climate and air quality objectives may not hold when using a full coupled global climate model and when investigating changes beyond global mean temperature (Wilcox et al., 2020). Although it is difficult to improve air quality alone without reducing GHGs in reality, this is the case for some air quality policies, such as flue gas desulfurisation in coal-fired power plants, denitrification, restaurant grease pollution control, and improved vehicle emissions standards. These advanced end-of-pipe control measures may involve only the reduction in air pollutants (Rafaj et al., 2014; Hordijk and Amann, 2007). For example, European countries have taken specific measures to reduce air pollutant emissions, especially through the application of advanced end-of-pipe emissions control technologies, resulting in a significant decline in SO2 and NOx emissions in western Europe after the 1970s, compared to a constant growth rate of CO2 emissions (Rafaj et al., 2014; Hordijk and Amann, 2007). For China, the State-Council-implemented Air Pollution Prevention and Control Action Plan in 2013 and the Three-Year Action Plan to Win the Blue Sky Defense War implemented in 2018 both introduced a series of aggressive industrial clean air policies (Zheng et al., 2018; Cheng et al., 2019). The reality in China's air pollution prevention and control policies in recent years is that China's treatment is still dominated by end-of-pipe measures, as source treatment often requires large investments to ensure energy efficiency and is not conducive to maintaining the competitiveness of Chinese industry (Wu et al., 2019), in which case it may only result in rapid reductions in air pollutants. Besides, emissions reductions aimed at achieving global carbon neutrality will inevitably result in further reductions in SLCF emissions, as demonstrated in the SSP1-1.9 and SSP1-2.6 scenarios (Gidden et al., 2019), which may lead to greater impacts of SLCFs on climate. The maximum technical potential in the SSP3-7.0-lowNTCF scenario refers to the currently existing end-of-pipe technologies; with faster technological progress and stronger air quality action, greater emissions reductions may also be possible, which may cause greater impacts on climate. Additionally, cleaner air may already have increased the warming effect of CO2 emissions over the past 2 decades, and this will get worse as air pollution continues to be controlled (Quaas et al., 2022; McKenna et al., 2021). Finally, large biases may exist in SLCF emissions at the regional scale in global emissions scenarios due to insufficient consideration of local environmental policies (Tong et al., 2020). For example, the RCP-SSP global emissions scenarios used in CMIP6 do not fully consider the rapid pollution controls enacted in China since 2013 under the Air Pollution Prevention and Control Action Plan. Consequently, the CMIP6 database underestimates emissions reductions obtained from China's Action Plan (Wang et al., 2021; Tong et al., 2020), which means that the impact of emissions reductions that have already happened may be underestimated and thus may lead to the underestimation of the impact of SLCF emissions reductions in China. This study highlights the importance of reductions in emissions of non-methane SLCFs for future climate change and population exposure risk in eastern and southern Asia in the short term and suggests that current and future policy decisions about air pollution emissions have the potential for a large near-term impact on temperature and precipitation extremes. Air pollution is dangerous to human health, and there is no doubt that we need clean air, but more importantly efforts to reduce GHGs need to be doubled in order to simultaneously mitigate climate change and improve air quality (Quaas et al., 2022; McKenna et al., 2021).
The CMIP6 Historical and AerChemMIP model data can be freely downloaded from https://esgf-node.llnl.gov/projects/cmip6 (World Climate Research Programme, 2023). The observed gridded data can be downloaded at the website of https://psl.noaa.gov/data/gridded/index.html (National Oceanic and Atmospheric Administration Physical Sciences Laboratory (PSL), 2023). Gridded population datasets for the base year and future under the SSP3 scenario are publicly available at https://www2.cgd.ucar.edu/iam/modeling/spatial-population-scenarios.html (University Corporation for Atmospheric Research, 2023).
The supplement related to this article is available online at: https://doi.org/10.5194/acp-23-2499-2023-supplement.
ZW conceived the study. YL performed the analysis. YL, ZW, and YL led the paper writing. All authors provided comments and contributed to the text.
The contact author has declared that none of the authors has any competing interests.
Publisher’s note: Copernicus Publications remains neutral with regard to jurisdictional claims in published maps and institutional affiliations.
The authors greatly appreciate the assistance of the editor and three anonymous reviewers for the helpful comments that improved the quality of this paper.
This research has been supported by the National Natural Science Foundation of China (grant no. 42275042) and the Science and Technology Development Fund of CAMS (grant nos. 2022KJ004 and 2021KJ010).
This paper was edited by Rebecca Garland and reviewed by three anonymous referees.
Allen, R. J., Turnock, S., Nabat, P., Neubauer, D., Lohmann, U., Olivié, D., Oshima, N., Michou, M., Wu, T., Zhang, J., Takemura, T., Schulz, M., Tsigaridis, K., Bauer, S. E., Emmons, L., Horowitz, L., Naik, V., van Noije, T., Bergman, T., Lamarque, J.-F., Zanis, P., Tegen, I., Westervelt, D. M., Le Sager, P., Good, P., Shim, S., O'Connor, F., Akritidis, D., Georgoulias, A. K., Deushi, M., Sentman, L. T., John, J. G., Fujimori, S., and Collins, W. J.: Climate and air quality impacts due to mitigation of non-methane near-term climate forcers, Atmos. Chem. Phys., 20, 9641–9663, https://doi.org/10.5194/acp-20-9641-2020, 2020.
Allen, J. R., Horowitz, W. L., Naik, V., Oshima, N., O'Connor, M. F., Turnock, S., Shim, S., Sager, L. P., Noije, V. T., Tsigaridis, K., Bauer, E. S., Sentman, L. T., John, J. G., Broderick, C., Deushi, M., Folberth, A. G., Fujimori, S., and Collins, J. W.: Significant climate benefits from near-term climate forcer mitigation in spite of aerosol reductions, Environ. Res. Lett., 16, 034010, https://doi.org/10.1088/1748-9326/abe06b, 2021.
An, J., Fu, B., Li, W., Peng, S., and Li, B.: Future Prediction of Typical Extreme Climatic Indices and Population Exposure to High Temperature in East Asia, Acta Scientiarum Naturalium Universitatis Pekinensis, 56, 884–892, https://doi.org/10.13209/j.0479-8023.2020.071, 2020.
Apte, J. S., Marshall, J. D., Cohen, A. J., and Brauer, M.: Addressing Global Mortality from Ambient PM2.5, Environ. Sci. Technol., 49, 8057–8066, https://doi.org/10.1021/acs.est.5b01236, 2015.
Baker, L. H., Collins, W. J., Olivié, D. J. L., Cherian, R., Hodnebrog, Ø., Myhre, G., and Quaas, J.: Climate responses to anthropogenic emissions of short-lived climate pollutants, Atmos. Chem. Phys., 15, 8201–8216, https://doi.org/10.5194/acp-15-8201-2015, 2015.
Bollasina, M. A., Yi, M., and V., R.: Anthropogenic Aerosols and the Weakening of the South Asian Summer Monsoon, Science, 334, 502–505, https://doi.org/10.1126/science.1204994, 2011.
Bras, T. A., Seixas, J., Carvalhais, N., and Jagermeyr, J.: Severity of drought and heatwave crop losses tripled over the last five decades in Europe, Environ. Res. Lett., 16, 065012, https://doi.org/10.1088/1748-9326/abf004, 2021.
Chang, W., Liao, H., and Wang, H.: Climate responses to direct radiative forcing of anthropogenic aerosols, tropospheric ozone, and long-lived greenhouse gases in eastern China over 1951–2000, Adv. Atmos. Sci., 26, 748–762, https://doi.org/10.1007/s00376-009-9032-4, 2009.
Chen, H. and Sun, J.: Increased population exposure to extreme droughts in China due to 0.5 ∘C of additional warming, Environ. Res. Lett., 14, 064011, https://doi.org/10.1088/1748-9326/ab072e, 2019.
Chen, H. and Sun, J.: Increased population exposure to precipitation extremes in China under global warming scenarios, Atmos. Ocean. Sci. Lett., 13, 63–70, https://doi.org/10.1080/16742834.2020.1697168, 2020.
Chen, H., Sun, J., Lin, W., and Xu, H.: Comparison of CMIP6 and CMIP5 models in simulating climate extremes, Sci. Bull., 65, 1415–1418, https://doi.org/10.1016/j.scib.2020.05.015, 2020a.
Chen, H., Sun, J., and Li, H.: Increased population exposure to precipitation extremes under future warmer climates, Environ. Res. Lett., 15, 034048, https://doi.org/10.1088/1748-9326/ab751f, 2020b.
Chen, J., Liu, Y., Pan, T., Liu, Y., Sun, F., and Ge, Q.: Population exposure to droughts in China under the 1.5 ∘C global warming target, Earth Syst. Dynam., 9, 1097–1106, https://doi.org/10.5194/esd-9-1097-2018, 2018.
Cheng, J., Su, J., Cui, T., Li, X., Dong, X., Sun, F., Yang, Y., Tong, D., Zheng, Y., Li, Y., Li, J., Zhang, Q., and He, K.: Dominant role of emission reduction in PM2.5 air quality improvement in Beijing during 2013–2017: a model-based decomposition analysis, Atmos. Chem. Phys., 19, 6125–6146, https://doi.org/10.5194/acp-19-6125-2019, 2019.
Chuwah, C., van Noije, T., van Vuuren, D. P., Le Sager, P., and Hazeleger, W.: Global and regional climate impacts of future aerosol mitigation in an RCP6.0-like scenario in EC-Earth, Clim. Change, 134, 1–14, https://doi.org/10.1007/s10584-015-1525-9, 2016.
Collins, W. J., Lamarque, J.-F., Schulz, M., Boucher, O., Eyring, V., Hegglin, M. I., Maycock, A., Myhre, G., Prather, M., Shindell, D., and Smith, S. J.: AerChemMIP: quantifying the effects of chemistry and aerosols in CMIP6, Geosci. Model Dev., 10, 585–607, https://doi.org/10.5194/gmd-10-585-2017, 2017.
Deser, C., Knutti, R., Solomon, S., and Phillips, A. S.: Communication of the role of natural variability in future North American climate, Nat. Clim. Change, 2, 775–779, https://doi.org/10.1038/nclimate1562, 2012.
Diffenbaugh N. S., Singh, D., Mankin. J. S., Horton, D. E., Swain, D. L., Touma, D,. Charland, A., Liu, Y., Haugen, M., Tsang, M., and Rajaratnam, B.: Quantifying the influence of global warming on unprecedented extreme climate events, P. Natl. Acad. Sci. USA, 114, 4881–4886, https://doi.org/10.1073/pnas.1618082114, 2017.
Dong, B., Wilcox, L. J., Highwood, E. J., and Sutton, R. T.: Impacts of recent decadal changes in Asian aerosols on the East Asian summer monsoon: roles of aerosol–radiation and aerosol–cloud interactions, Clim. Dynam., 53, 3235–3256, https://doi.org/10.1007/s00382-019-04698-0, 2019.
Fan, X., Miao, C., Duan, Q., Shen, C., and Wu, Y.: The Performance of CMIP6 Versus CMIP5 in Simulating Temperature Extremes Over the Global Land Surface, J. Geophys. Res.-Atmos., 125, 1–16, https://doi.org/10.1029/2020JD033031, 2020.
Fischer, E. M. and Schär, C.: Consistent geographical patterns of changes in high-impact European heatwaves, Nat. Geosci., 3, 398–403, https://doi.org/10.1038/ngeo866, 2010.
Forster, P. M., Richardson, T., Maycock, A. C., Smith, C. J., Samset, B. H., Myhre, G., Andrews, T., Pincus, R., and Schulz, M.: Recommendations for diagnosing effective radiative forcing from climate models for CMIP6, J. Geophys. Res.-Atmos., 121, 12412–460475, https://doi.org/10.1002/2016JD025320, 2016.
Forster, P., Storelvmo, T., Armour, K., Collins, W., Dufresne, J.-L., Frame, D., Lunt, D., Mauritsen, T., Palmer, M., Watanabe, M., Wild, M., and Zhang, H.: The Earth’s Energy Budget, Climate Feedbacks, and Climate Sensitivity, in: Climate Change 2021: The Physical Science Basis. Contribution of Working Group I to the Sixth Assessment Report of the Intergovernmental Panel on Climate Change, edited by: Masson-Delmotte, V., Zhai, P., Pirani, A., Connors, S., Péan, C., Berger, S., Caud, N., Chen, Y., Goldfarb, L., Gomis, M., Huang, M., Leitzell, K., Lonnoy, E., Matthews, J., Maycock, T., Waterfield, T., Yelekçi, O., Yu, R., and Zhou, B., chap. 7, Cambridge University Press, Cambridge, United Kingdom and New York, NY, USA, https://www.ipcc.ch/report/ar6/wg1/chapter/chapter-7/ (last access: 17 February 2023), 2021.
Freychet, N., Tett, S. F. B., Bollasina, M., Wang, K. C., and Hegerl, G. C.: The Local Aerosol Emission Effect on Surface Shortwave Radiation and Temperatures, J. Adv. Model. Earth Sy., 11, 806–817, https://doi.org/10.1029/2018MS001530, 2019.
Frich, P. L., Alexander, L., Della-Marta, P., Gleason, B., Haylock, M., Klein, T., and Peterson, T. C.: Observed coherent changes in climatic extremes during 2nd half of the 20th century, Clim. Res., 19, 193–212, https://doi.org/10.3354/cr019193, 2002.
Gidden, M. J., Riahi, K., Smith, S. J., Fujimori, S., Luderer, G., Kriegler, E., van Vuuren, D. P., van den Berg, M., Feng, L., Klein, D., Calvin, K., Doelman, J. C., Frank, S., Fricko, O., Harmsen, M., Hasegawa, T., Havlik, P., Hilaire, J., Hoesly, R., Horing, J., Popp, A., Stehfest, E., and Takahashi, K.: Global emissions pathways under different socioeconomic scenarios for use in CMIP6: a dataset of harmonized emissions trajectories through the end of the century, Geosci. Model Dev., 12, 1443–1475, https://doi.org/10.5194/gmd-12-1443-2019, 2019.
Gosling, S. N., Lowe, J. A., McGregor, G. R., Pelling, M., and Malamud, B. D.: Associations between elevated atmospheric temperature and human mortality: a critical review of the literature, Clim. Change, 92, 299–341, https://doi.org/10.1007/s10584-008-9441-x, 2009.
Guo, D., Zhang, Y., Gao, X., Pepin, N., and Sun, J.: Evaluation and ensemble projection of extreme high and low temperature events in China from four dynamical downscaling simulations, Int. J. Climatol., 41, E1252–E1269, https://doi.org/10.1002/joc.6765, 2021.
Hienola, A., Partanen, A. I., Pietikäinen, J. P., O'Donnell, D., Korhonen, H., Matthews, H. D., and Laaksonen, A.: The impact of aerosol emissions on the 1.5 ∘C pathways, Environ. Res. Lett., 13, 44011, https://doi.org/10.1088/1748-9326/aab1b2, 2018.
Hoesly, R. M., Smith, S. J., Feng, L., Klimont, Z., Janssens-Maenhout, G., Pitkanen, T., Seibert, J. J., Vu, L., Andres, R. J., Bolt, R. M., Bond, T. C., Dawidowski, L., Kholod, N., Kurokawa, J.-I., Li, M., Liu, L., Lu, Z., Moura, M. C. P., O'Rourke, P. R., and Zhang, Q.: Historical (1750–2014) anthropogenic emissions of reactive gases and aerosols from the Community Emissions Data System (CEDS), Geosci. Model Dev., 11, 369–408, https://doi.org/10.5194/gmd-11-369-2018, 2018.
Hordijk, L. and Amann, M.: How science and policy combined to combat air pollution problems, Environ. Policy Law, 37, 336–340, 2007.
Jenkins, S., Povey, A., Gettelman, A., Grainger, R., Stier, P., and Allen, M.: Is Anthropogenic Global Warming Accelerating?, J. Climate, 35, 4273–4290, https://doi.org/10.1175/jcli-d-22-0081.1, 2022.
Jones, B. and O'Neill, B. C.: Spatially explicit global population scenarios consistent with the Shared Socioeconomic Pathways, Environ. Res. Lett., 11, 084003, https://doi.org/10.1088/1748-9326/11/8/084003, 2016.
Jones, B., O'Neill, B. C., McDaniel, L., McGinnis, S., Mearns, L. O., and Tebaldi, C.: Future population exposure to US heat extremes, Nat. Clim. Change, 5, 652–655, https://doi.org/10.1038/nclimate2631, 2015.
Kim, Y. H., Min, S. K., Zhang, X., Sillmann, J., and Sandstad, M.: Evaluation of the CMIP6 multi-model ensemble for climate extreme indices, Weather Clim. Extrem., 29, 100269, https://doi.org/10.1016/j.wace.2020.100269, 2020.
King, A. D., Knutti, R., Uhe, P., Mitchell, D. M., Lewis, S. C., Arblaster, J. M., and Freychet, N.: On the Linearity of Local and Regional Temperature Changes from 1.5 ∘C to 2 ∘C of Global Warming, J. Climate, 31, 7495–7514, https://doi.org/10.1175/JCLI-D-17-0649.1, 2018.
Li, J., Yu, R., Yuan, W., Chen, H., Sun, W., and Zhang, Y.: Precipitation over East Asia simulated by NCAR CAM5 at different horizontal resolutions, J. Adv. Model. Earth Sy., 7, 774–790, https://doi.org/10.1002/2014MS000414, 2015.
Li, S., Wang, T., Zanis, P., Melas, D., and Zhuang, B.: Impact of Tropospheric Ozone on Summer Climate in China, J. Meteorol. Res., 32, 279–287, https://doi.org/10.1007/s13351-018-7094-x, 2018.
Li, Z., Lau, W., Ramanathan, V., Wu, G., Ding, Y., Manoj, M. G., Liu, J., Qian, Y., Li, J., Zhou, T., Fan, J., Rosenfeld, D., Ming, Y., Wang, Y., Huang, J., Wang, B., Xu, X., Lee, S.-S., Cribb, M., and Zhao, C.: Aerosol and Monsoon Climate Interactions over Asia: Aerosol and Monsoon Climate Interactions, Rev. Geophys., 54, 866–929, https://doi.org/10.1002/2015RG000500, 2016.
Liao, H., Chang, W., and Yang, Y.: Climatic effects of air pollutants over china: A review, Adv. Atmos. Sci., 32, 115–139, https://doi.org/10.1007/s00376-014-0013-x, 2015.
Lin, L., Wang, Z., Xu, Y., and Fu, Q.: Sensitivity of precipitation extremes to radiative forcing of greenhouse gases and aerosols, Geophys. Res. Lett., 43, 9860–9868, https://doi.org/10.1002/2016GL070869, 2016.
Lin, L., Xu, Y., Wang, Z., Diao, C., Dong, W., and Xie, S.-P.: Changes in Extreme Rainfall Over India and China Attributed to Regional Aerosol-Cloud Interaction During the Late 20th Century Rapid Industrialization, Geophys. Res. Lett., 45, 7857–7865, https://doi.org/10.1029/2018GL078308, 2018.
Luo, F., Wilcox, L., Dong, B., Su, Q., Chen, W., Dunstone, N., Li, S., and Gao, Y.: Projected near-term changes of temperature extremes in Europe and China under different aerosol emissions, Environ. Res. Lett., 15, 34013, https://doi.org/10.1088/1748-9326/ab6b34, 2020.
Malley, C. S., Henze, D. K., Kuylenstierna, J. C. I., Vallack, H. W., Davila, Y., Anenberg, S. C., Turner, M. C., and Ashmore, M. R.: Updated Global Estimates of Respiratory Mortality in Adults ≥ 30 Years of Age Attributable to Long-Term Ozone Exposure, Environ. Health Persp., 125, 87021, https://doi.org/10.1289/EHP1390, 2017.
McKenna, C. M., Maycock, A. C., Forster, P. M., Smith, C. J., and Tokarska, K. B.: Stringent mitigation substantially reduces risk of unprecedented near-term warming rates, Nat. Clim. Change, 11, 126-131, https://doi.org/10.1038/s41558-020-00957-9, 2021.
Mu, J. and Wang, Z.: Responses of the East Asian summer monsoon to aerosol forcing in CMIP5 models: The role of upper-tropospheric temperature change, Int. J. Climatol., 41, 1555–1570, https://doi.org/10.1002/joc.6887, 2021.
Myhre, G., Shindell, D., Bréon, F.-M., Collins, W., Fuglestvedt, J., Huang, J., Koch, D., Lamarque, J.-F., Lee, D., Mendoza, B., Nakajima, T., Robock, A., Stephens, G., Takemura, T., and Zhang, H.: Anthropogenic and Natural Radiative Forcing, in Climate Change 2013: The Physical Science Basis. Contribution of Working Group I to the Fifth Assessment Report of the Intergovernmental Panel on Climate Change, edited by: Stocker, T. F., Qin, D., Plattner, G.-K., Tignor, M., Allen, S. K., Boschung, J., Nauels, A., Xia, Y., Bex, V., and Midgley, P. M., Tech. rep., Cambridge University Press, Cambridge, United Kingdom and New York, NY, USA, https://www.ipcc.ch/report/ar5/wg1/anthropogenic-and-natural-radiative-forcing (last access: 17 February 2023), 2013.
Naik, V., Szopa, S., Adhikary, B., Artaxo, P., Berntsen, T., Collins, W. D., Fuzzi, S., Gallardo, L., Kiendler Scharr, A., Klimont, Z., Liao, H., Unger, N., and Zanis, P.: Short-Lived Climate Forcers, in: Climate Change 2021: The Physical Science Basis. Contribution of Working Group I to the Sixth Assessment Report of the Intergovernmental Panel on Climate Change, edited by: Masson-Delmotte, V., Zhai, P., Pirani, A., Connors, S. L., Péan, C., Berger, S., Caud, N., Chen, Y., Goldfarb, L., Gomis, M. I., Huang, M., Leitzell, K., Lonnoy, E., Matthews, J. B. R., Maycock, T. K., Waterfield, T., Yelekçi, O., Yu, R., and Zhou, B., Cambridge University Press, https://www.ipcc.ch/report/ar6/wg1/chapter/chapter-6/ (last access: 17 February 2023), 2021.
National Oceanic and Atmospheric Administration Physical Sciences Laboratory (PSL): Gridded Climate data, National Oceanic and Atmospheric Administration Physical Sciences Laboratory (PSL) [data set], https://psl.noaa.gov/data/gridded/index.html, last access: 2 February 2023.
Patz, J. A., Campbell-Lendrum, D., Holloway, T., and Foley, J. A.: Impact of regional climate change on human health, Nature, 438, 310–317, https://doi.org/10.1038/nature04188, 2005.
Pendergrass, A. G., Coleman, D. B., Deser, C., Lehner, F., Rosenbloom, N., and Simpson, I. R.: Nonlinear Response of Extreme Precipitation to Warming in CESM1, Geophys. Res. Lett., 46, 10551–10560, https://doi.org/10.1029/2019GL084826, 2019.
Pincus, R., Forster, P. M., and Stevens, B.: The Radiative Forcing Model Intercomparison Project (RFMIP): experimental protocol for CMIP6, Geosci. Model Dev., 9, 3447–3460, https://doi.org/10.5194/gmd-9-3447-2016, 2016.
Pithan, F. and Mauritsen, T.: Arctic amplification dominated by temperature feedbacks in contemporary climate models, Nat. Geosci., 7, 181–184, https://doi.org/10.1038/ngeo2071, 2014.
Pu, X., Wang, T. J., Huang, X., Melas, D., Zanis, P., Papanastasiou, D. K., and Poupkou, A.: Enhanced surface ozone during the heat wave of 2013 in Yangtze River Delta region, China, Sci. Total Environ., 603–604, 807–816, https://doi.org/10.1016/j.scitotenv.2017.03.056, 2017.
Quaas, J., Jia, H., Smith, C., Albright, A. L., Aas, W., Bellouin, N., Boucher, O., Doutriaux-Boucher, M., Forster, P. M., Grosvenor, D., Jenkins, S., Klimont, Z., Loeb, N. G., Ma, X., Naik, V., Paulot, F., Stier, P., Wild, M., Myhre, G., and Schulz, M.: Robust evidence for reversal of the trend in aerosol effective climate forcing, Atmos. Chem. Phys., 22, 12221–12239, https://doi.org/10.5194/acp-22-12221-2022, 2022.
Rafaj, P., Amann, M., Siri, J., and Wuester, H.: Changes in European greenhouse gas and air pollutant emissions 1960–2010: Decomposition of determining factors, Clim. Change, 124, 477–504, https://doi.org/10.1007/s10584-013-0826-0, 2014.
Ramanathan, V., Li, F., Ramana, M. V, Praveen, P. S., Kim, D., Corrigan, C. E., Nguyen, H., Stone, E. A., Schauer, J. J., Carmichael, G. R., Adhikary, B., and Yoon, S. C.: Atmospheric brown clouds: Hemispherical and regional variations in long-range transport, absorption, and radiative forcing, J. Geophys. Res.-Atmos., 112, D22S21, https://doi.org/10.1029/2006JD008124, 2007.
Samset, B. H., Sand, M., Smith, C. J., Bauer, S. E., Forster, P. M., Fuglestvedt, J. S., Osprey, S., and Schleussner, C. F.: Climate Impacts From a Removal of Anthropogenic Aerosol Emissions, Geophys. Res. Lett., 45, 1020–1029, https://doi.org/10.1002/2017GL076079, 2018.
Screen, J. A. and Simmonds, I.: The central role of diminishing sea ice in recent Arctic temperature amplification, Nature, 464, 1334–1337, https://doi.org/10.1038/nature09051, 2010.
Shindell, D. and Smith, C. J.: Climate and air-quality benefits of a realistic phase-out of fossil fuels, Nature, 573, 408–411, https://doi.org/10.1038/s41586-019-1554-z, 2019.
Sillmann, J., Kharin, V. V, Zwiers, F. W., Zhang, X., and Bronaugh, D.: Climate extremes indices in the CMIP5 multi-model ensemble: Part 2. Future climate projections, J. Geophys. Res.-Atmos., 118, 2473–2493, https://doi.org/10.1002/jgrd.50188, 2013a.
Sillmann, J., Kharin, V. V., Zhang, X., Zwiers, F. W., and Bronaugh, D.: Climate extremes indices in the CMIP5 multimodel ensemble: Part 1. Model evaluation in the present climate, J. Geophys. Res.-Atmos., 118, 1716–1733, https://doi.org/10.1002/jgrd.50203, 2013b.
Smith, C. J., Forster, P. M., Allen, M., Leach, N., Millar, R. J., Passerello, G. A., and Regayre, L. A.: FAIR v1.3: a simple emissions-based impulse response and carbon cycle model, Geosci. Model Dev., 11, 2273–2297, https://doi.org/10.5194/gmd-11-2273-2018, 2018.
Sun, S., Dai, T. L., Wang, Z. Y., Chou, J. M., Chao, Q. C., and Shi, P. J.: Projected increases in population exposure of daily climate extremes in eastern China by 2050, Adv. Clim. Chang. Res., 12, 804–813, https://doi.org/10.1016/j.accre.2021.09.014, 2021.
Sun, X., Ge, F., Fan, Y., Zhu, S., and Chen, Q.: Will population exposure to heat extremes intensify over Southeast Asia in a warmer world?, Environ. Res. Lett., 17, 44006, https://doi.org/10.1088/1748-9326/ac48b6, 2022.
Tellman, B., Sullivan, J. A., Kuhn, C., Kettner, A. J., Doyle, C. S., Brakenridge, G. R., Erickson, T. A., and Slayback, D. A.: Satellite imaging reveals increased proportion of population exposed to floods, Nature, 596, 80–86, https://doi.org/10.1038/s41586-021-03695-w, 2021.
Tong, D., Cheng, J., Liu, Y., Yu, S., Yan, L., Hong, C., Qin, Y., Zhao, H., Zheng, Y., Geng, G., Li, M., Liu, F., Zhang, Y., Zheng, B., Clarke, L., and Zhang, Q.: Dynamic projection of anthropogenic emissions in China: methodology and 2015–2050 emission pathways under a range of socio-economic, climate policy, and pollution control scenarios, Atmos. Chem. Phys., 20, 5729–5757, https://doi.org/10.5194/acp-20-5729-2020, 2020.
Turnock, S. T., Allen, R. J., Andrews, M., Bauer, S. E., Deushi, M., Emmons, L., Good, P., Horowitz, L., John, J. G., Michou, M., Nabat, P., Naik, V., Neubauer, D., O'Connor, F. M., Olivié, D., Oshima, N., Schulz, M., Sellar, A., Shim, S., Takemura, T., Tilmes, S., Tsigaridis, K., Wu, T., and Zhang, J.: Historical and future changes in air pollutants from CMIP6 models, Atmos. Chem. Phys., 20, 14547–14579, https://doi.org/10.5194/acp-20-14547-2020, 2020.
University Corporation for Atmospheric Research: Climate and Global Dynamics (CGD), University Corporation for Atmospheric Research [data set], https://www2.cgd.ucar.edu/iam/modeling/spatial-population-scenarios.html, last access: 2 February 2023.
Wang, Z., Lin, L., Yang, M., and Xu, Y.: The effect of future reduction in aerosol emissions on climate extremes in China, Clim. Dynam., 47, 2885–2899, https://doi.org/10.1007/s00382-016-3003-0, 2016.
Wang, Z., Lin, L., Yang, M., and Guo, Z.: The Role of Anthropogenic Aerosol Forcing in Interdecadal Variations of Summertime Upper-Tropospheric Temperature Over East Asia, Earth's Future, 7, 136–150, https://doi.org/10.1029/2018EF001052, 2019.
Wang, Z., Mu, J., Yang, M., and Yu, X.: Reexamining the mechanisms of East Asian summer monsoon changes in response to non-East Asian anthropogenic aerosol forcing, J. Climate, 33, 2929–2944, https://doi.org/10.1175/JCLI-D-19-0550.1, 2020.
Wang, Z., Lin, L., Xu, Y., Che, H., Zhang, X., Zhang, H., Dong, W., Wang, C., Gui, K., and Xie, B.: Incorrect Asian aerosols affecting the attribution and projection of regional climate change in CMIP6 models, npj Clim. Atmos. Sci., 4, 2, https://doi.org/10.1038/s41612-020-00159-2, 2021.
Wei, Y., Chen, X., Chen, H., Li, J., Wang, Z., Yang, W., Ge, B., Du, H., Hao, J., Wang, W., Li, J., Sun, Y., and Huang, H.: IAP-AACM v1.0: a global to regional evaluation of the atmospheric chemistry model in CAS-ESM, Atmos. Chem. Phys., 19, 8269–8296, https://doi.org/10.5194/acp-19-8269-2019, 2019.
Weisskopf, M. G., Anderson, H. A., Foldy, S.L., Hanrahan, P., Blair, K. T., Trk, J., and Rumm, P. D.: Heat wave morbidity and mortality,Milwaukee, Wis, 1999 vs 1995: An improved response?, Am. J. Public Health, 92, 830–833, 2002.
Westervelt, D. M., Horowitz, L. W., Naik, V., Golaz, J.-C., and Mauzerall, D. L.: Radiative forcing and climate response to projected 21st century aerosol decreases, Atmos. Chem. Phys., 15, 12681–12703, https://doi.org/10.5194/acp-15-12681-2015, 2015.
Westervelt, D. M., Conley, A. J., Fiore, A. M., Lamarque, J.-F., Shindell, D. T., Previdi, M., Mascioli, N. R., Faluvegi, G., Correa, G., and Horowitz, L. W.: Connecting regional aerosol emissions reductions to local and remote precipitation responses, Atmos. Chem. Phys., 18, 12461–12475, https://doi.org/10.5194/acp-18-12461-2018, 2018.
Wilcox, L. J., Liu, Z., Samset, B. H., Hawkins, E., Lund, M. T., Nordling, K., Undorf, S., Bollasina, M., Ekman, A. M. L., Krishnan, S., Merikanto, J., and Turner, A. G.: Accelerated increases in global and Asian summer monsoon precipitation from future aerosol reductions, Atmos. Chem. Phys., 20, 11955–11977, https://doi.org/10.5194/acp-20-11955-2020, 2020.
World Climate Research Programme: WCRP Coupled Model Intercomparison Project (Phase 6), World Climate Research Programme [data set], https://esgf-node.llnl.gov/projects/cmip6/, last access: 2 February 2023.
Wu, G., Baležentis, T., Sun, C., and Xu, S.: Source control or end-of-pipe control: Mitigating air pollution at the regional level from the perspective of the Total Factor Productivity change decomposition, Energ. Policy, 129, 1227–1239, https://doi.org/10.1016/j.enpol.2019.03.032, 2019.
Xie, B., Zhang, H., Wang, Z., Zhao, S., and Fu, Q.: A modeling study of effective radiative forcing and climate response due to tropospheric ozone, Adv. Atmos. Sci., 33, 819–828, https://doi.org/10.1007/s00376-016-5193-0, 2016.
Xie, X., Wang, H., Liu, X., Li, J., Wang, Z., and Liu, Y.: Distinct effects of anthropogenic aerosols on the East Asian summer monsoon between multidecadal strong and weak monsoon stages, J. Geophys. Res.-Atmos., 121, 7026–7040, https://doi.org/10.1002/2015JD024228, 2016.
Yang, D., Zhao, S., Zhang, H., and Shen, X. Y.: Simulation of global distribution of temporal and spatial variation of PM2.5 concentration in the future, Zhongguo Huanjing Kexue/China Environ. Sci., 37, 1201–1212, 2017.
You, Q., Wu, F., Shen, L., Pepin, N., Jiang, Z., and Kang, S.: Tibetan Plateau amplification of climate extremes under global warming of 1.5 ∘C, 2 ∘C and 3 ∘C, Global Planet. Change, 192, 103261, https://doi.org/10.1016/j.gloplacha.2020.103261, 2020.
Zanis, P., Akritidis, D., Georgoulias, A. K., Allen, R. J., Bauer, S. E., Boucher, O., Cole, J., Johnson, B., Deushi, M., Michou, M., Mulcahy, J., Nabat, P., Olivié, D., Oshima, N., Sima, A., Schulz, M., Takemura, T., and Tsigaridis, K.: Fast responses on pre-industrial climate from present-day aerosols in a CMIP6 multi-model study, Atmos. Chem. Phys., 20, 8381–8404, https://doi.org/10.5194/acp-20-8381-2020, 2020.
Zanis, P., Akritidis, D., Turnock, S., Naik, V., Szopa, S., Georgoulias, A., Bauer,S., Deushi, M., Horowitz, L., Keeble, J., Sager, P., O'Connor, F., Oshima, N., Tsigaridis, K., and Noije, T.: Climate change penalty and benefit on surface ozone: a global perspective based on CMIP6 earth system models, Environ. Res. Lett. 17, 024014, https://doi.org/10.1088/1748-9326/ac4a34, 2022.
Zhao, A. D., Stevenson, D. S., and Bollasina, M. A.: The role of anthropogenic aerosols in future precipitation extremes over the Asian Monsoon Region, Clim. Dynam., 52, 6257–6278, https://doi.org/10.1007/s00382-018-4514-7, 2018.
Zhang, H., Xie, B., and Wang, Z.: Effective Radiative Forcing and Climate Response to Short-Lived Climate Pollutants Under Different Scenarios, Earth's Future, 6, 857–866, https://doi.org/10.1029/2018EF000832, 2018.
Zhao, J., Su, B., Mondal, S. K., Wang, Y., Tao, H., and Jiang, T.: Population exposure to precipitation extremes in the Indus River Basin at 1.5 ∘C, 2.0 ∘C and 3.0 ∘C warming levels, Adv. Clim. Chang. Res., 12, 199–209, https://doi.org/10.1016/j.accre.2021.03.005, 2021.
Zhou, B. and Qian, J.: Changes of weather and climate extremes in the IPCC AR6, Adv. Clim. Chang. Res., 17, 713–718, 2021.
Zheng, B., Tong, D., Li, M., Liu, F., Hong, C., Geng, G., Li, H., Li, X., Peng, L., Qi, J., Yan, L., Zhang, Y., Zhao, H., Zheng, Y., He, K., and Zhang, Q.: Trends in China's anthropogenic emissions since 2010 as the consequence of clean air actions, Atmos. Chem. Phys., 18, 14095–14111, https://doi.org/10.5194/acp-18-14095-2018, 2018.
Zhu, X., Lee, S. Y., Wen, X., Ji, Z., Lin, L., Wei, Z., Zheng, Z., Xu, D., and Dong, W.: Extreme climate changes over three major river basins in China as seen in CMIP5 and CMIP6, Clim. Dynam., 57, 1187–1205, https://doi.org/10.1007/s00382-021-05767-z, 2021.