the Creative Commons Attribution 4.0 License.
the Creative Commons Attribution 4.0 License.
 | 22 Feb 2023
Influence of air mass origin on microphysical properties of low-level clouds in a subarctic environment
Konstantinos Matthaios Doulgeris
Ville Vakkari
Ewan J. O'Connor
Veli-Matti Kerminen
Heikki Lihavainen
David Brus
In this work, an analysis was performed to investigate how different long-range transport air masses can affect the microphysical properties of low-level clouds in a clean subarctic environment. The cloud measurements included in situ and remote sensing ground-based techniques and were conducted during eight Pallas Cloud Experiments (PaCEs) held in the autumn between 2004 and 2019. Each PaCE was carried out at the Pallas Atmosphere-Ecosystem Supersite, located in the Finnish subarctic region. Two cloud spectrometer ground setups were installed on the roof of the station to measure cloud microphysical properties: the cloud, aerosol and precipitation spectrometer (CAPS) and the forward-scattering spectrometer probe (FSSP). Air mass histories were analyzed using the Lagrangian FLEXible PARTicle dispersion model (FLEXPART) in order to investigate the differences between five distinct source regions (“Arctic”, “Eastern”, “Southern”, “Western” and “Local”). We observed clear differences in the cloud microphysical properties for the air mass source regions. Arctic air masses were characterized by low liquid water content (LWC), low cloud droplet number concentration (Nc) and comparatively large median volume and effective droplet diameter. The Western region (marine North Atlantic) differed from the Arctic by both higher Nc and LWC. The Eastern region (continental Eurasia) only had a little higher LWC than the Arctic but substantially higher Nc and a smaller droplet diameter. The Southern region (continental Europe) had high Nc and LWC and a very similar droplet diameter to the Eastern region. Finally, the relationship between Nc and droplet size (i.e., the Twomey effect) was characterized for the different source regions, indicating that all region clouds were sensitive to increases in Nc.
- Article
(5252 KB) - Full-text XML
-
Supplement
(404 KB) - BibTeX
- EndNote


Uncertainties in cloud processes and feedbacks are key challenges when developing climate projections (e.g., Boucher et al., 2013; Sherwood et al., 2020). Cloud microphysics and their dynamics are considered a fundamental challenge (Morrison et al., 2020) due to their connection to the cloud radiative effect (e.g., Devenish et al., 2012; McFarquhar et al., 2020). Thus, it is necessary to distinguish between the effects of aerosol and varying meteorological conditions on clouds (Barthlott and Hoose, 2018) since the aerosol is influenced through meteorology by air mass history as well as cloud and precipitation processes (Rosenfeld et al., 2014). Long-range transport is significant when investigating the characteristics and the spatial distribution of aerosols (e.g., Raatz and Shaw, 1984; Barrie, 1986; Freud et al., 2017; Wang et al., 2020; Lee et al., 2022). It is important to understand how different air masses can influence the aerosols and the cloud microphysics (e.g., Painemal et al., 2014; Orbe et al., 2015a; Fuchs et al., 2017; Cho et al., 2021). Investigating subarctic clouds is of particularly high interest due to the Arctic amplification effect, since the Arctic surface energy budget and Arctic warming feedback are affected by cloud-related radiative processes (e.g., Wendisch et al., 2019; Shupe at al., 2022).
Several observation efforts and experiments have been made to explore how air masses affect climate and the cloud macrophysical and microphysical properties (e.g., Hobbs and Rangno, 1998; Gultepe et al., 2000; Orbe et al., 2015b; Solomon and Shupe, 2019; Torres-Delgado et al., 2021). Hobbs and Rangno (1998) highlighted that air masses from the south resulted in the highest overall aerosol number concentration measured in altocumulus clouds over the Beaufort Sea. Gultepe et al. (2000) stated that Arctic clouds were affected by the air mass origin, which was strongly related to aerosol properties and dynamical and thermodynamical parameters. Gultepe and Isaac (2002) studied the cloud microphysics over the Arctic Ocean and found that there were differences in the number concentration, liquid water content and effective radius of Arctic clouds in air masses originating from the Arctic and Pacific oceans. After investigating the air mass origin seasonality, Orbe et al. (2015a) revealed that the Northern Hemisphere summer air mass origin response to increases in greenhouse gases (Orbe et al., 2015b). Fuchs et al. (2017) highlighted the impact of air mass origin and dynamics on cloud property changes in the southeast Atlantic during the biomass burning season based on a cluster analysis of 8 years of September data. Solomon and Shupe (2019) presented a case study of a sharp transition between high ice clouds and the formation of lower stratocumulus from Summit, Greenland, when a warm and moist air mass was advected to Greenland from lower latitudes. Iwamoto et al. (2021), using measurements from a high mountain site located in Japan, showed that the cloud droplet number concentrations were significantly higher in continental air masses than in air masses from the Pacific Ocean. Patel and Jiang (2021) combined measurements of aerosol properties from a site located in Lamont, Oklahoma, with cluster analysis of back trajectories to study aerosol characteristics and their influences on cloud condensation nuclei (CCN) under various air mass environments and suggested that information on the aerosol chemical composition and mixing state is more crucial at lower supersaturations. Torres-Delgado et al. (2021), using aerosol and cloud measurements from a site in a tropical montane cloud forest on the Caribbean island of Puerto Rico, suggested that air masses that arrived after passing over areas with anthropogenic emissions led to clouds with much higher cloud droplet concentrations. Cho et al. (2021) investigated wintertime cloud properties and radiative effects in connection with cold and warm air mass origins at Ny-Ålesund, Svalbard, using remote sensing measurements with cloud radar, ceilometer and microwave radiometer instruments and revealed that the effective radius of cloud particles in warm advection cases was approximately 5–10 µm larger than that of cold advection cases at all altitudes.
One of the few sites that enables long-term in situ observations of cloud and aerosol properties in Arctic and subarctic air masses is the Pallas Global Atmospheric Watch (GAW) station in northern Finland (e.g., Lihavainen et al., 2008; Hyvärinen et al., 2011; Anttila et al., 2012; Raatikainen et al., 2015; Gérard et al., 2019; Girdwood et al., 2020, 2022). However, after the initial case study (Lihavainen et al., 2008), which indicated a clear Twomey effect depending on air mass origin, no subsequent concerted study has investigated the effect of air mass origin on cloud microphysical properties at Pallas. In the Arctic, during autumn, the ultrafine aerosol number concentration and the occurrence of clean, natural Arctic background conditions are significantly increasing (Pernov et al., 2022). Subsequently, this allows us to focus in this work on quantifying the impact of air mass origin (e.g., clean Arctic vs. long-range-transported air from continental Europe) on the microphysical properties of low-level clouds and their patterns based on measurements at the Pallas GAW station. To our knowledge, this is the first study that was performed in a subarctic environment and connects extensive in situ cloud measurements to air mass origin. Size distribution is considered one of the most important parameters of the cloud system due to its impact on the dynamics and microstructures within the cloud (Igel and van den Heever, 2017a, b). Measuring cloud microphysical properties, such as the median volume diameter and liquid water content, is of high importance for the identification and description of clouds (Pruppacher and Klett, 2010; Rosenfeld and Ulbrich, 2003; Donovan et al., 2015), cloud radiative properties and lifetime (Albrecht, 1989; Small et al., 2009), and the probability for which clouds precipitate (Rosenfeld and Ulbrich, 2003; Chang et al., 2019). We used in situ low-level cloud measurements from two ground-based cloud spectrometers from 8 different years of campaigns to obtain the cloud droplet size distribution. A lidar ceilometer was used to monitor the cloud base. The FLEXible PARTicle (FLEXPART) dispersion model was used to analyze the air mass history. A description of the measurement site and the instrumentation, and how it was installed, is given in Sect. 2.1 and 2.2. Subsequently, in Sect. 2.3, a general overview of the campaigns is presented. In Sect. 2.4, we present how the backward trajectories were calculated. In Sect. 3, the optimal threshold of traveling air masses within a region to represent an air mass type is identified, and a detailed analysis is done to find out to what extent the air mass type influences the microphysical properties of the low-level clouds. Finally, in Sect. 4, we summarize our main conclusions.
2.1 Sampling station
The measurements were conducted in subarctic Finland at the Pallas Atmosphere-Ecosystem Supersite (67∘580′ N, 24∘070′ E), hosted by the Finnish Meteorological Institute. The site where the ground-based cloud spectrometers were installed was the Sammaltunturi station, located on a hilltop, 565 m above sea level (a.s.l.) (Hatakka et al., 2003). The site where the ceilometer was installed was the Kenttärova station, 347 m a.s.l., located at the foot of the same hill (Fig. 1). A full description of the Pallas Atmosphere-Ecosystem Supersite can be found in Lohila et al. (2015).
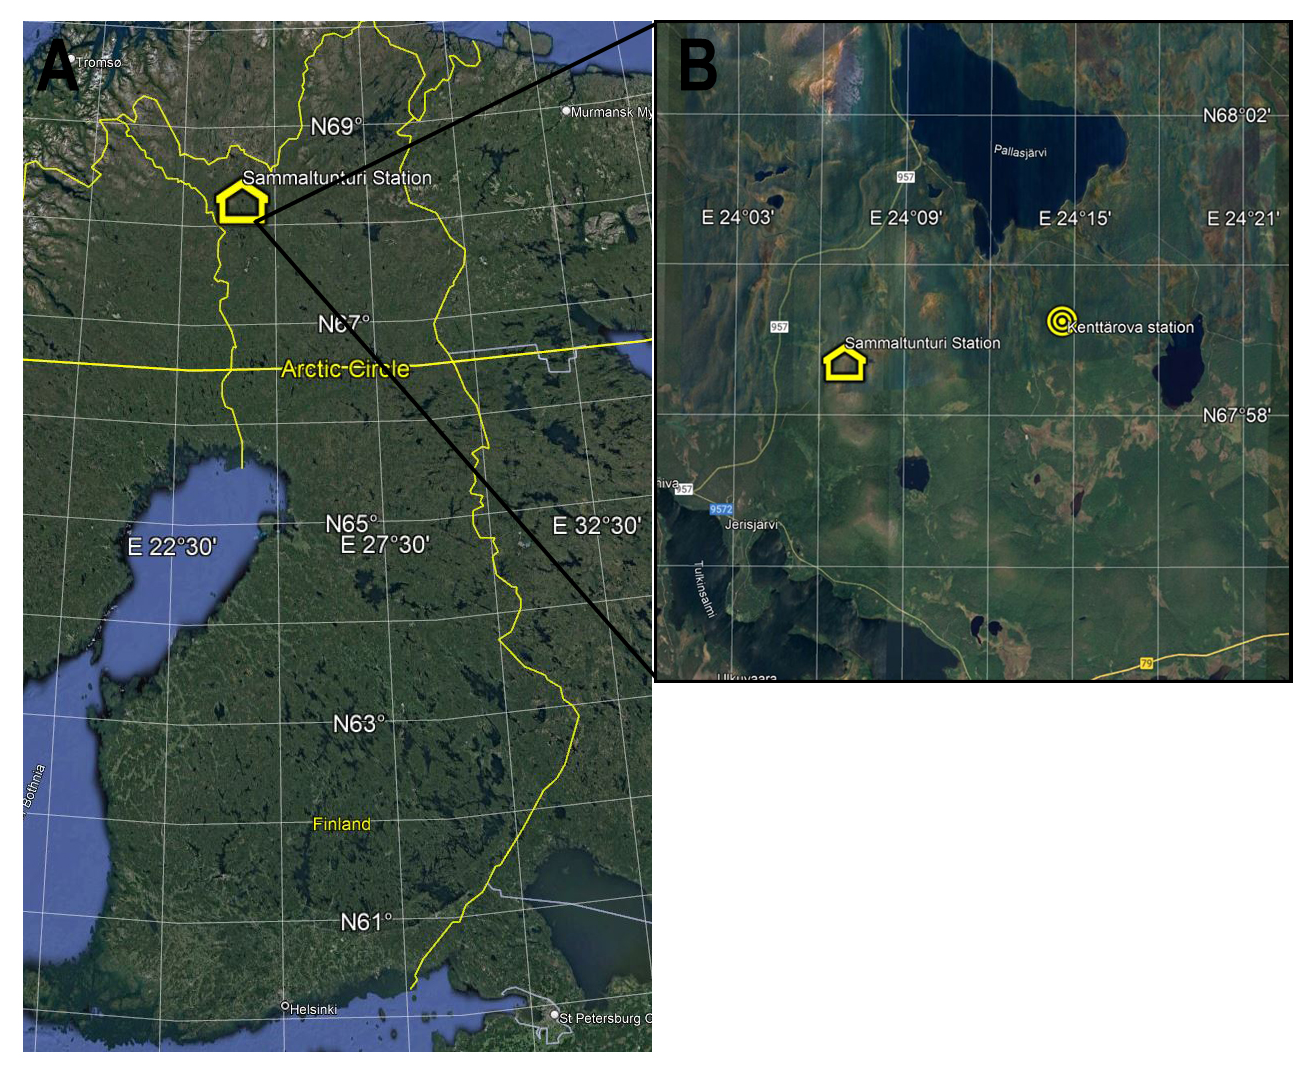
Figure 1(a) Map of Finland showing the location of the Pallas Atmosphere-Ecosystem Supersite (yellow hut) and (b) map of the wider Pallas area showing the location of Sammaltunturi (yellow hut) and Kenttärova (yellow circles) stations (© Google Maps).
2.2 Instrumentation
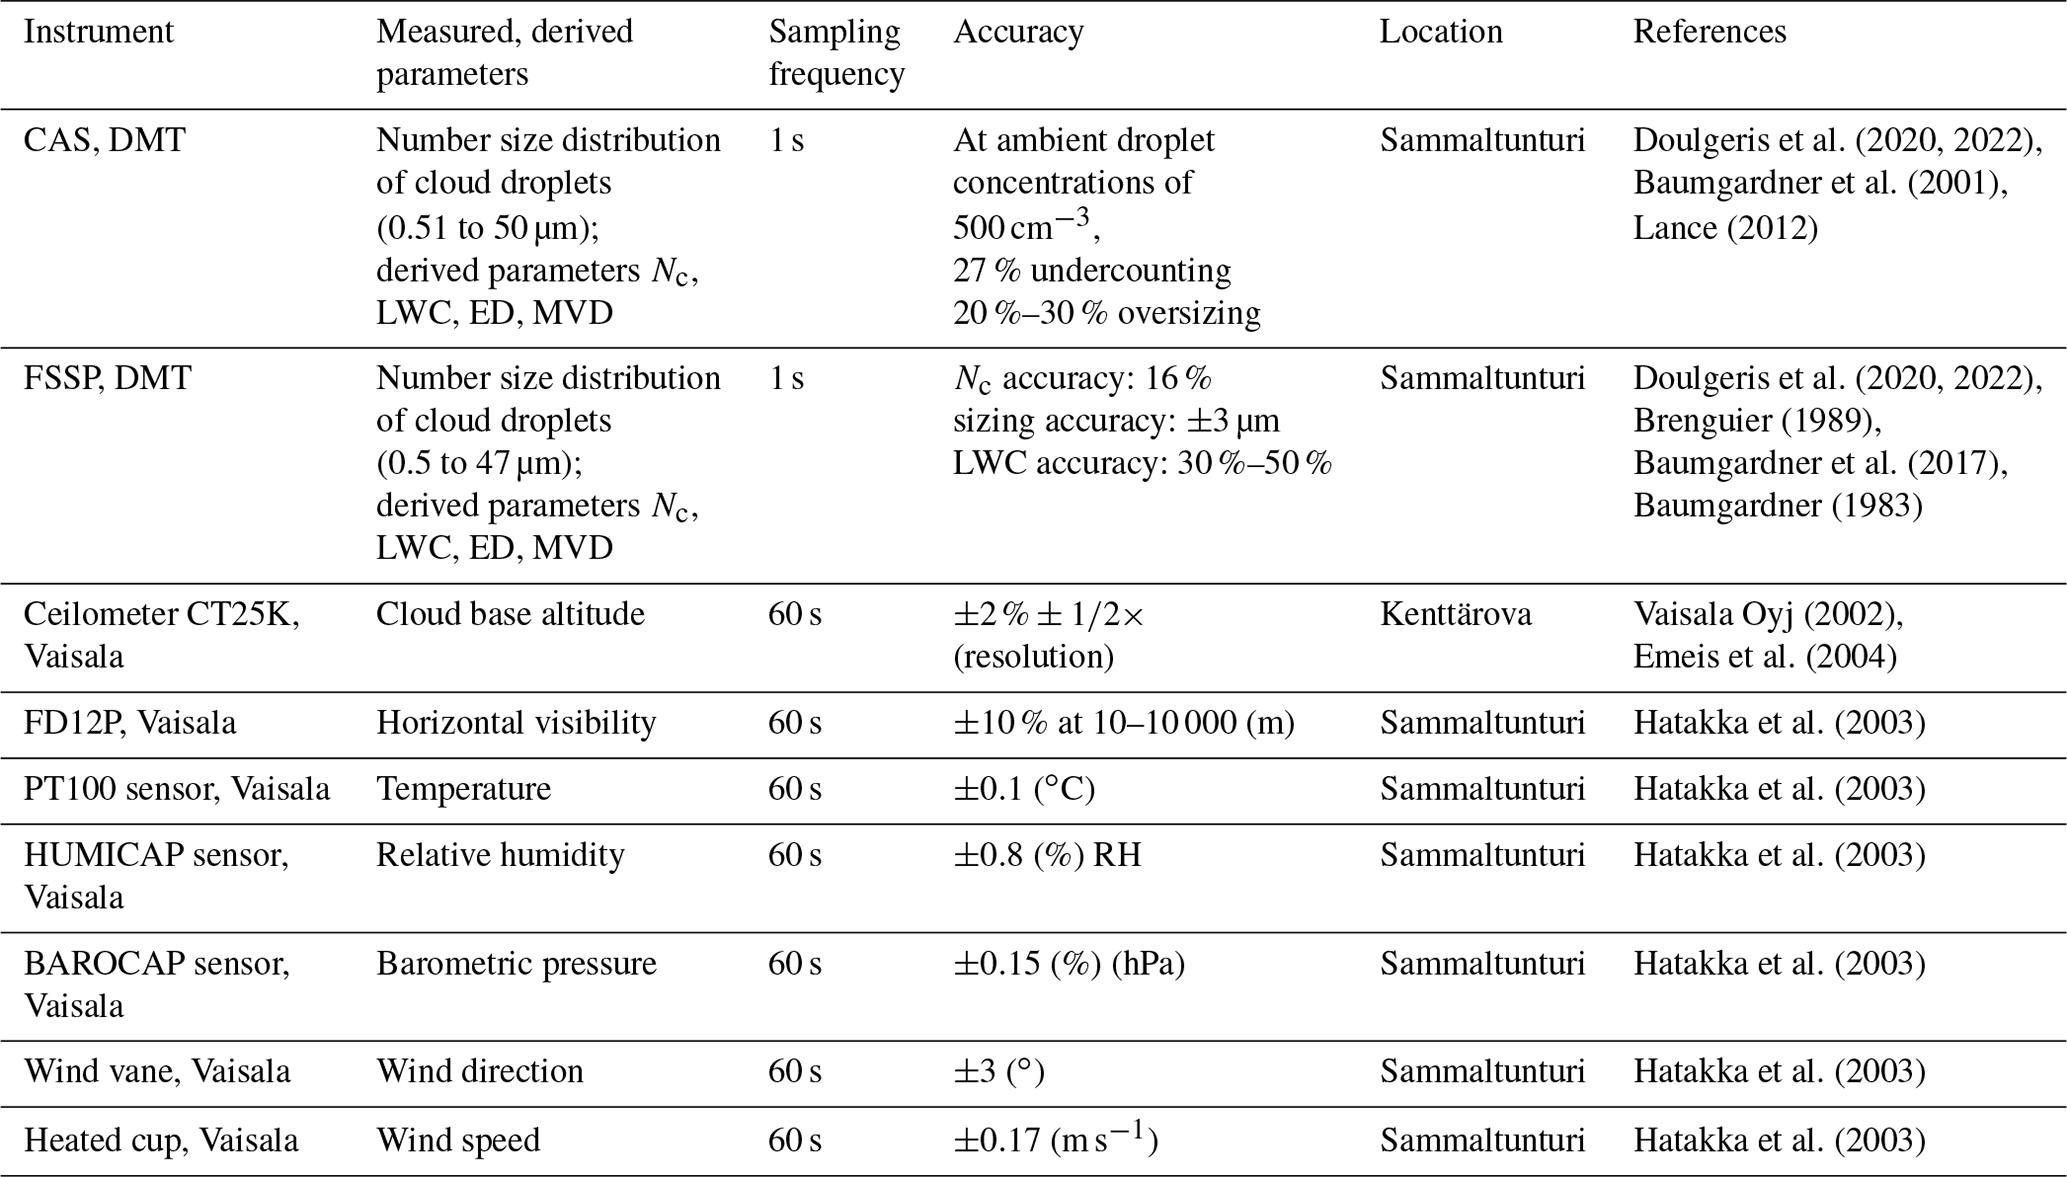
The instruments that were used in this study are listed in Table 1, together with the measured and derived parameters, their uncertainties and their location. During Pallas Cloud Experiments (PaCEs), we used ground-based in situ cloud spectrometers to monitor the cloud droplet size distribution, which has been recognized as a valid method for continuous cloud in situ measurements in the Aerosol, Clouds and Trace Gases Research Infrastructure (ACTRIS) network (Wandinger et al., 2018). Four microphysical parameters were derived from the measured size distribution (Droplet Measurement Technologies, 2009; Doulgeris et al., 2020): the cloud droplet number concentration (Nc; cm−3), the median volume diameter (MVD; µm) and effective diameter (ED; µm) of cloud droplets, and the cloud liquid water content (LWC; g m−3).
Two ground-based spectrometers were installed on the roof of Sammaltunturi station: the cloud, aerosol and precipitation spectrometer (CAPS) and the forward-scattering spectrometer probe (FSSP-100; hereafter called FSSP for simplicity) (Fig. 2). CAPS was made by Droplet Measurement Technologies (DMT), Boulder, CO, USA. FSSP-100 (model SPP-100, DMT) was initially manufactured by Particle Measuring Systems (PMS Inc., Boulder CO, USA) and later acquired by DMT. The CAPS probe includes three instruments: the cloud and aerosol spectrometer (CAS), the cloud imaging probe (CIP), and the hot-wire liquid water content (LWChw) sensor. Only CAS data were used during this work. The size range of the CAS extends from 0.51 to 50 µm and that of the FSSP from 0.5 to 47 µm in diameter. In both CAS and FSSP, the main measurement principle for the size detection is based on a conversion of the forward scattering of light into a size bin using Lorentz–Mie theory (Mie, 1908). Their main difference was that the CAS was fixed and always heading to the main wind direction of the station (southwest, ∼225), whereas the FSSP-100 was deployed on a rotating platform to continuously face the wind. A description of both ground setups, installation, limitations and the methodology that was used is documented in Doulgeris et al. (2020, 2022). The instrument that monitored the cloud base was a lidar ceilometer that was deployed at the Kenttärova site (model CT25K, Vaisala Oyj, 2002; Emeis et al., 2004), except in 2019 when it was replaced by a CL31 model, Vaisala Oyj. The meteorological variables were monitored by an automatic weather station (model Milos 500, Vaisala Oyj) that was deployed at the Sammaltunturi site. All the weather sensors that were used in this work were described in Hatakka et al. (2003). The temperature was measured at 570 m a.s.l. by a PT100 sensor, the horizontal visibility by a weather sensor (model FDP12P, Vaisala Oyj), the relative humidity by a HUMICAP (Vaisala Oyj), the barometric pressure by a BAROCAP (Vaisala Oyj) sensor, the wind direction by a heated wind vane and the wind speed by a heated cup (Vaisala Oyj).
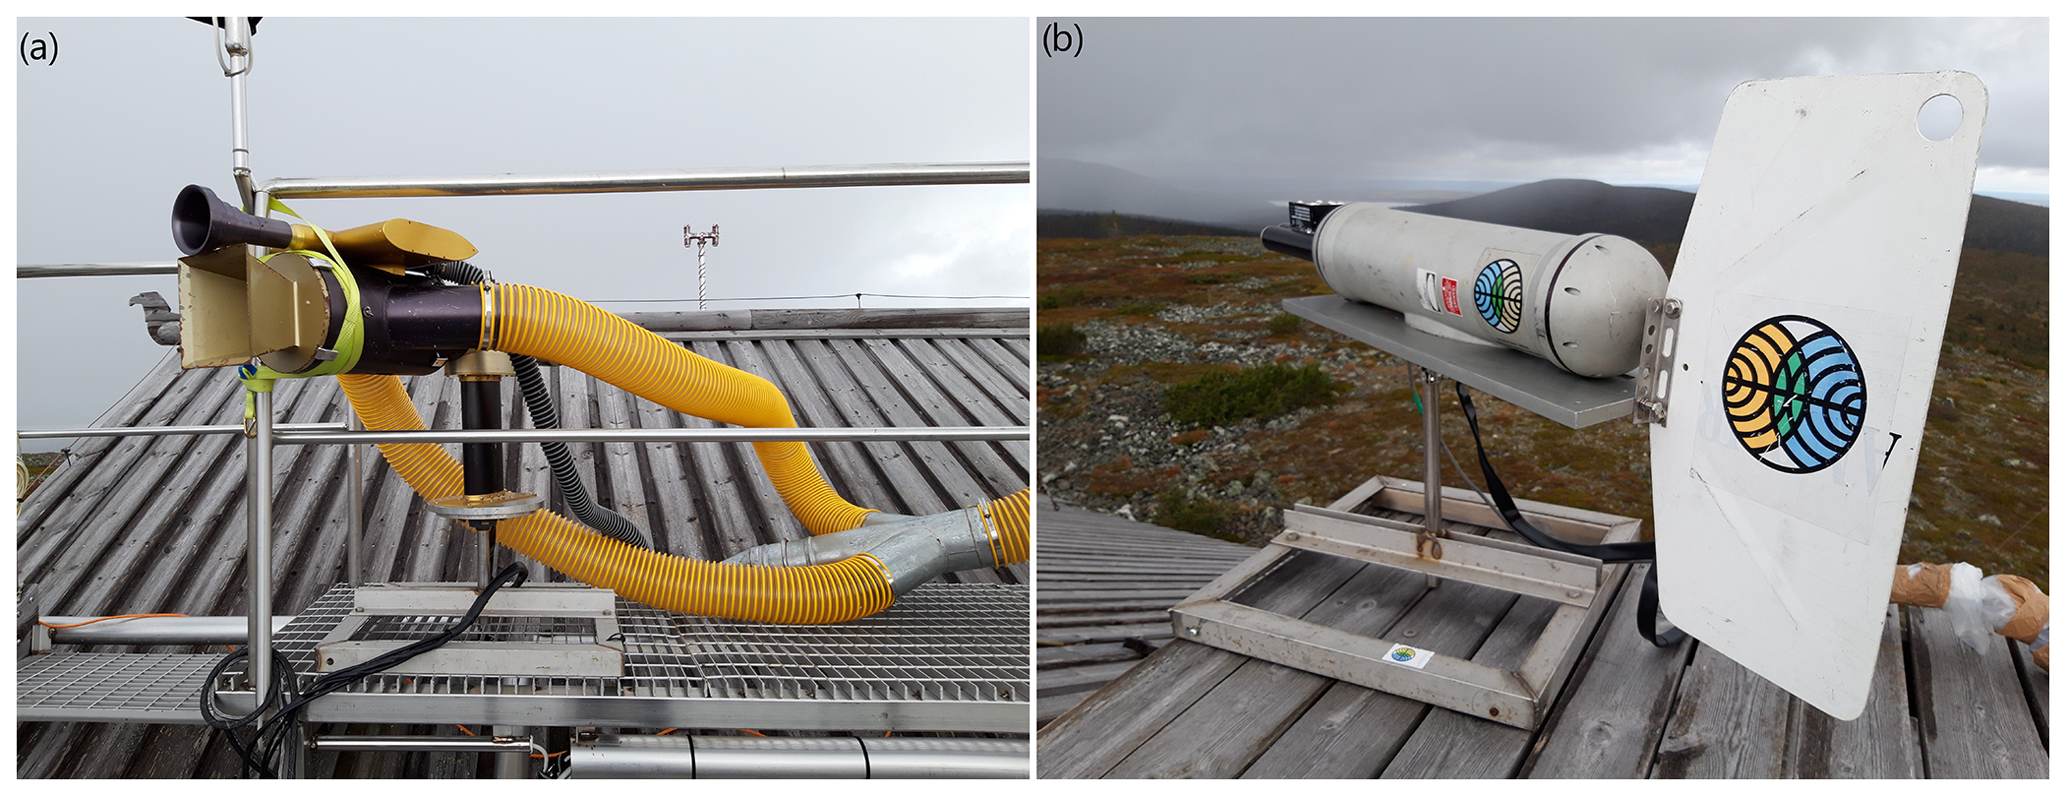
Figure 2(a) CAPS and (b) FSSP-100 ground setups installed on the roof of Sammaltunturi station during PaCE 2017.
Table 1Instrumentation that was used during PaCE, along with measured and derived parameters, their sampling frequencies, accuracy of the instruments and the location where the instruments were installed.
2.3 Sampling campaigns
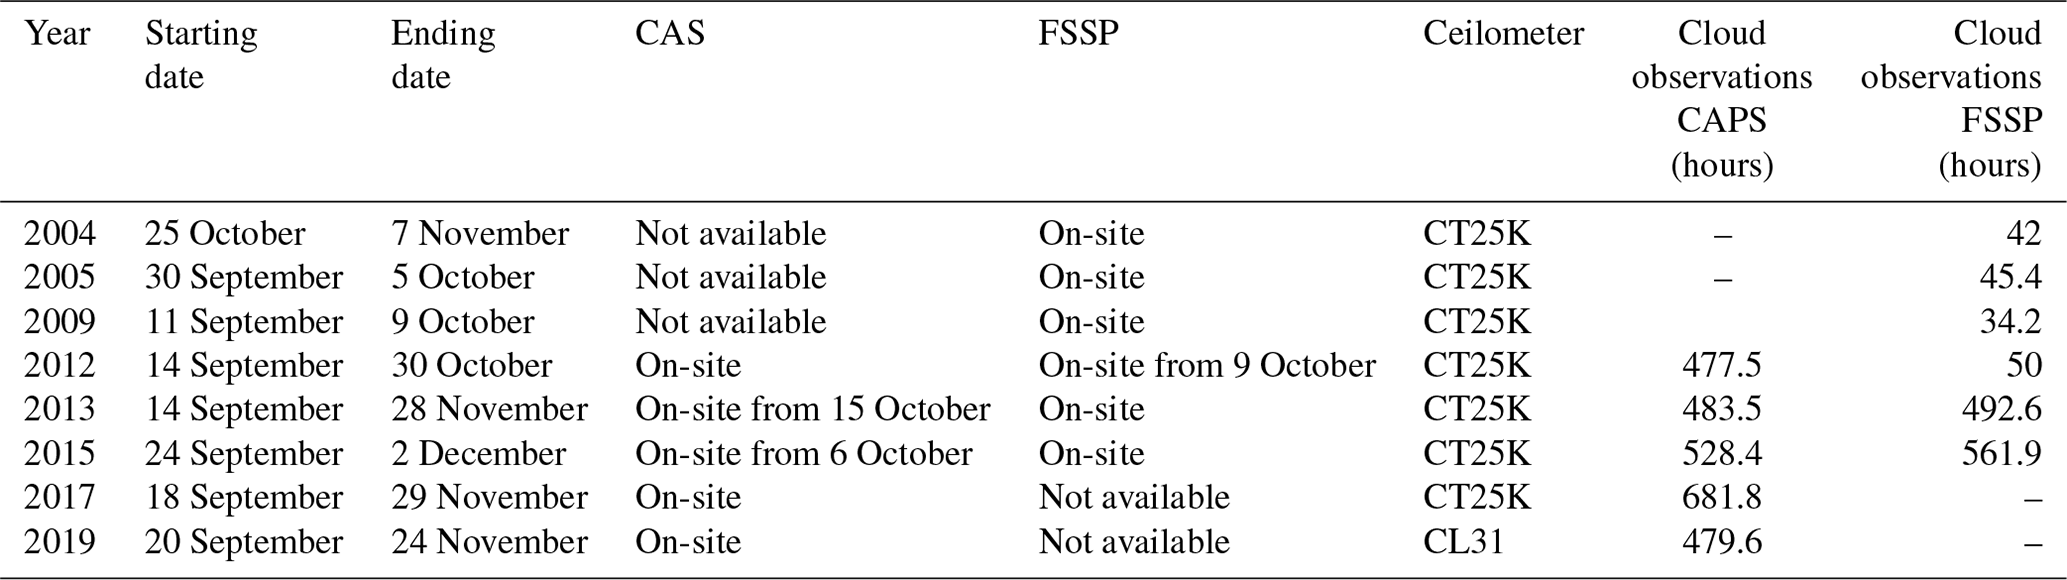
Measurements used in this study were conducted during the Pallas Cloud Experiments (PaCEs). A description of the dataset (microphysical properties of clouds along with meteorological variables) that was obtained during PaCEs is available in Doulgeris et al. (2022). The PaCEs were approximately 2-month-long field campaigns conducted in the Finnish subarctic region at the Sammaltunturi station during autumn and lasted approximately from the beginning of September until the end of November. The reason for this choice was that during autumn the Sammaltunturi station is frequently inside a cloud, which allowed us to perform ground-based, continuous in situ cloud measurements (Hatakka et al., 2003). An overview of each campaign, along with the availability of instruments and the hours of observations in cloud, is presented in Table 2. During PaCEs, all measurements were performed with a 1 Hz acquisition frequency. For the data analysis, averages per minute from each instrument were calculated when the measuring site was inside a cloud. Each cloud event was inspected separately. Afterwards, in situ cloud data were related to the air mass origin and classified accordingly. We only used measurements when the cloud spectrometers were facing the wind direction, as suggested by Doulgeris et al. (2020). Thus, since the CAS was fixed, data when the CAS was not facing the wind direction were disqualified from further analysis.
Table 2Overview of each campaign, including the starting and ending date, the availability of the ground cloud spectrometer probes and the ceilometer.
Fine particles at the Sammaltunturi site are expected to be dominated by sulfate and particulate organic matter in continental air masses, while particulate organic matter, sodium and chlorine are the main components in marine air masses (Lihavainen et al., 2008; Brus et al., 2013a). Also, episodes of elevated concentrations of SO2 and H2SO4 are possible in air masses arriving from the Kola Peninsula, which is a large source of SO2 emissions (Kyrö et al., 2014; Sipilä et al., 2021; Brus et al., 2013a, b). Elevated SO2 concentrations and particle number concentrations in the accumulation mode (0.1–1 µm in diameter) of the mass size distribution are also expected from air masses that have traveled over continental Europe. Total aerosol particle number concentrations at Sammaltunturi are typically low (average of 700 cm−3; in winter the daily averages may drop below 100 cm−3) (Hatakka et al., 2003; Komppula et al., 2003). Generally, in Finnish Lapland, aerosol particle number concentrations are expected to be the highest in air masses arriving from the Kola Peninsula (more than 1000 cm−3) and the lowest in marine air masses, especially in air originating from the Arctic Sea (often less than 100 cm−3) (Lihavainen et al., 2008). Higher particle number concentrations in the accumulation mode are also expected in air masses which have traveled over continental Europe (Virkkula et al., 1997). In Sammaltunturi, cloud condensation nuclei (CCN) concentrations are smaller than 100 cm−3 for supersaturations from 0.1 % to 0.5 %. The aerosol particle population is dominated by the Aitken mode (30–100 nm in diameter), and a low hygroscopicity is expected (Paramonov et al., 2015).
2.4 Classification of air mass origin
Air mass origins were analyzed using the Lagrangian particle dispersion model FLEXPART version 10.4 (Seibert and Frank, 2004; Stohl et al., 2005; Pisso et al., 2019). FLEXPART was run backward in time to calculate potential emission sensitivity (PES) fields. PES in a particular grid cell is proportional to the air mass residence time in that cell and was calculated in units of seconds (Seibert and Frank, 2004; Pisso et al., 2019). ERA5 reanalysis by the European Centre for Medium-Range Weather Forecasts (ECMWF) was used as meteorological input fields for FLEXPART at 1 h temporal resolution and 0.25∘ resolution in latitude and longitude. In the vertical, ERA5 levels 50 to 137 were used, which corresponds approximately to the lowest 20 km above the surface. The model domain was from 125∘ W to 75∘ E and 10 to 85∘ N, which was large enough to contain 96 h simulations backward in time. FLEXPART runs were initiated at an hourly time resolution for the in-cloud measurement periods at Sammaltunturi. The retro plume release height was set to 560–660 m a.s.l., as the terrain height in ERA5 at the site was approximately 300 m a.s.l. The PES output resolution was set to 0.2∘ latitude and longitude with a 250 m height resolution up to 5 km and two additional output levels at 10 and 50 km.
The air mass source regions for the Sammaltunturi site were divided into five categories: “Arctic”, “Eastern”, “Southern”, “Western” and “Local” (Fig. 3). The division was based on previous studies that were conducted at Sammaltunturi (e.g., Aalto et al., 2003; Eneroth et al., 2005; Tunved et al., 2006; Asmi et al., 2011). Initially, the regions were classified using trajectory cluster analysis, following the method proposed by Eneroth et al. (2003). The choice of sectors roughly represents the characteristics of the region. The Arctic and Western regions represent marine areas, whereas the Eastern, Southern and Local regions represent continental areas. Figure 4 illustrates an example case for air masses arriving on 20 September 2012 at 11:00 UTC at Sammaltunturi. In Fig. 4a PES is summed up for the full duration of the 96 h backward simulation and for all output heights at each latitude–longitude grid cell. Figure 4b displays the vertical distribution of PES during the simulation. However, the information in Fig. 4b is not used in further analysis, but the fraction of PES in each source region is calculated based on the integrated data presented in Fig. 4a. For the case in Fig. 4a, this results in PES fractions of 42 % Local (area V), 35 % Southern (area III) and 23 % Western (area IV). Finally, Fig. 4c shows how the PES fractions evolve during 20 September 2012 at Sammaltunturi, with the case in Fig. 4a represented by the bar at 11:00 UTC. In Fig. 4c a clear change in air mass origin is observed at 18:00 UTC when the fraction of Arctic source region starts to increase, reaching up to 48 % at 22:00 UTC.

Figure 3Map of the air mass regions: I (Arctic), II (Eastern), III (Southern), IV (Western) and V (Local). Figure was adopted from Asmi et al. (2011).

Figure 4(a) Horizontal distribution of vertically integrated PES for air masses arriving at Sammaltunturi on 20 September 2012 11:00 UTC. Source regions are indicated with Roman numerals. (b) Vertical distribution of PES in panel (a) as a function of time before arrival at Sammaltunturi. (c) Timeline of the PES fraction for each source region for 20 September 2012.
3.1 Local meteorological conditions
Figure 5 shows the daily average temperatures at 570 m observed at the Sammaltunturi measuring site for days with “cloud events”. The seasonal temperatures range from an average of 4.5 ∘C (SD 2.1 ∘C) in September to −5.3 ∘C (SD 1.8 ∘C) in November, and interannual variability is revealed. Days with “cloud events” were defined as the days when the station was at least 30 min immersed in a cloud. To identify the presence of a cloud at the station, four steps were followed. The droplet size distribution was checked from both cloud spectrometers; the relative humidity should be ∼100 %, and the horizontal visibility should be less than 1000 m, and a final inspection was performed visually using pictures recorded by an automatic weather camera installed on the roof of the station. During days with no cloud events, clouds could still exist at higher altitudes. Supercooled water droplets were expected at temperatures <0 ∘C (usually during November and October of each campaign, in total 175 cloud events with temperature <0 ∘C were sampled). Mixed-phase clouds, consisting of water vapor, ice particles and supercooled liquid droplets, are frequent at temperatures from −10 to −25 ∘C (Korolev et al., 2017; Filioglou et al., 2019); however, they can be present up to temperatures of 0 ∘C (Andronache, 2017). During September, the average temperature was >0 ∘C; thus, the clouds were expected to consist of liquid hydrometeors only (liquid droplets, drizzle drops and raindrops). Wind speed ranges during the PaCEs were approximately 0 to 10 m s−1, and the average wind speed during each campaign was around 7 m s−1. These values were lower in comparison to the probe air speed of both cloud ground-based spectrometers (Doulgeris et al., 2022).
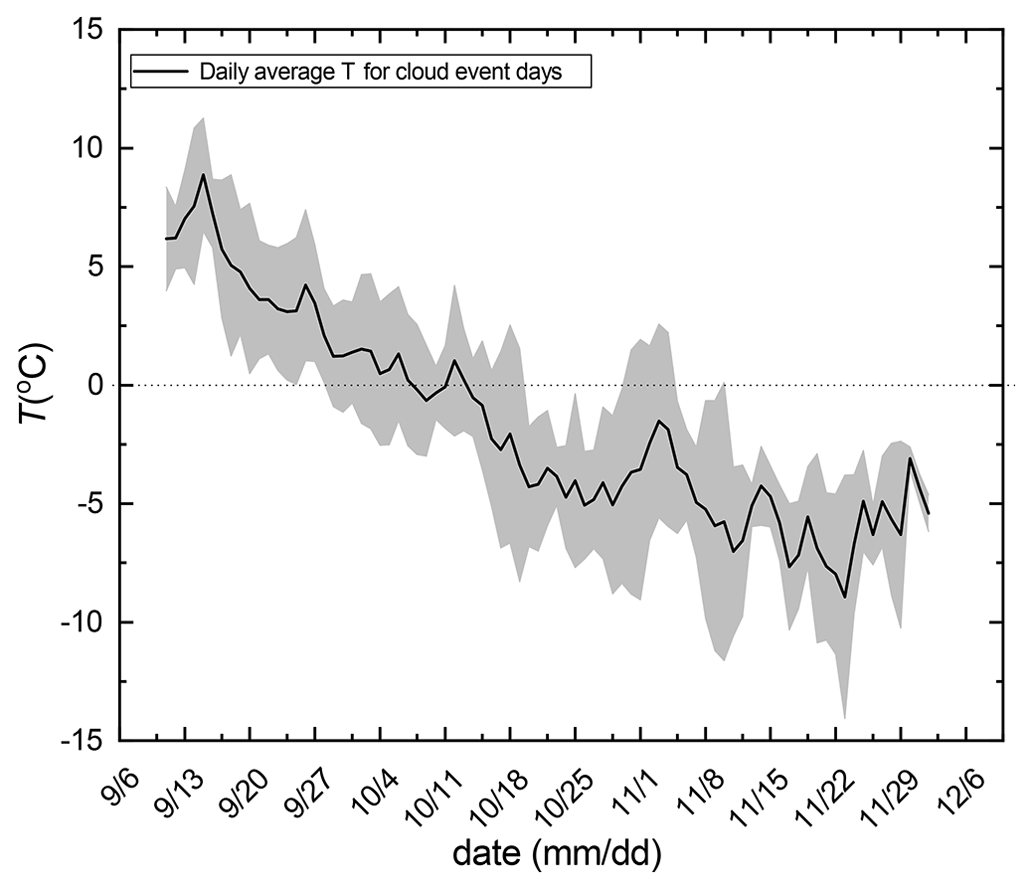
Figure 5The daily average temperatures at the Sammaltunturi site for days with cloud events during all PaCE campaigns. The dotted line is used as a reference line for 0 ∘C temperature. The definition of a cloud event is provided in the text. The shaded area represents the corresponding standard deviations.
3.2 Identification of the air mass origin and its effect on the number concentration of cloud droplets
First, we examined which was the optimal threshold of the PES fraction within one region that should be used for a particular region to be representative of the air mass type. Nc was chosen to be used as a benchmark parameter. Figure 6 shows hourly Nc values depending on the PES fraction of the Arctic region (in the Arctic, during autumn, the ultrafine aerosol number concentration and the occurrence of clean, natural Arctic background conditions are significantly increasing; Pernov et al., 2022). The lowest values of Nc (<30 cm−3) were related to PES fractions >80 %. When the PES fraction was between 70 % and 80 %, the values of Nc were varying between 5 and 80 cm−3, and the highest values of Nc (>30 cm−3) were related to a PES fraction lower than 70 %.

Figure 6Hourly cloud droplet number concentration (Nc) versus the different potential emission sensitivity (PES) fraction for the Arctic region. The shaded area represents the corresponding standard deviations.
To achieve a generalization of the large-scale air mass influence on microphysical cloud properties, the characteristics of all regions were intercompared. In Fig. 7 we summarize cloud Nc measurements from both CAS and FSSP. Each point represents a single PaCE campaign for different regions according to the classification criteria that were introduced previously in this section. We present each campaign and instrument to demonstrate that there were no obvious changes through years or possible malfunction of the instruments that were used and could produce biased results. Two different levels of the PES fraction were chosen to be further investigated: (i) when the PES fraction was more than 80 % within one region and (ii) when the PES fraction was between 70 % and 80 % within one region. For the first level, the highest values of Nc (approximately 100–200 cm−3) were clearly associated with Southern air masses, whereas the lowest ones (approximately 20 cm−3) were observed in Arctic air masses. In general, marine air masses (Arctic, Western) arriving at Sammaltunturi resulted in lower values of Nc compared with continental air masses. However, there was also a difference (by a factor of approximately 2) between marine air masses: Nc values in air masses traveling over the Atlantic Ocean or the Norwegian Sea were higher than those in air masses arriving from the Arctic Sea. For aerosol populations, higher values of NCCN are expected in more polluted air masses (Southern and Eastern air masses, due to emissions from Europe and the Kola Peninsula) (Virkkula et al., 1997; Jaatinen et al., 2014; Sipilä et al., 2021). Averaged temperatures at Sammaltunturi for each air mass were −3.1 ∘C (SD 2.5 ∘C), −2.2 ∘C (SD 5.9 ∘C), 1.3 ∘C (SD 3.9 ∘C) and −2.8 ∘C (SD 2.01 ∘C) for the Arctic, Eastern, Southern and Western region respectively. Furthermore, there was no clear indication that there was any trend in Nc through different years of PaCEs. In this work, NCCN measurements at different supersaturations were not conducted.

Figure 7Cloud droplet number concentration (Nc) for each region and single PaCE campaign measured by the cloud and aerosol spectrometer (CAS) and the forward-scattering spectrometer probe (FSSP) where the PES fraction was within one region >80 % (full symbols) and the PES fraction was within one region from 70 % to 80 % (open symbols). Error bars indicate the corresponding standard deviation.
For a PES fraction between 70 % and 80 %, the impact of the air mass type on the Nc changed as the differences in Nc were less than for PES >80 %. Clouds that were associated with Southern air masses had slightly higher values of Nc (approximately 60–80 cm−3) in comparison with clouds from the other regions (approximately 20–60 cm−3). As a result, for further analysis in this work, we decided to exclude measurements that were performed when the PES fraction was between 70 % and 80 %. Thus, we considered that >80 % of the PES fraction within a particular region would be the optimal threshold to represent an air mass type during PaCEs. Using the >80 % PES fraction from one source region as a criterion for further analysis left 492 h of in-cloud measurements with the CAS and 214 h of in-cloud measurements with the FSSP probe (from a total of 2004 h of in situ cloud data, 706 h belongs to non-mixed air mass origin), respectively, which ensured statistically robust results. Cloud observation related to Arctic, Eastern, Southern, Western and Local air masses were 118, 275, 152, 118 and 43 h, respectively. The observation hours related to each region for each PaCE are presented in Table S2 of the Supplement. Clouds that were related with local air masses were excluded due to a relatively small number of observations.
Based on the air mass origin classification, a statistical analysis was made to investigate the frequency of the air masses during cloud events at the measuring site. When the air masses were not mixed, the occurrence of clouds at the station related to continental and marine air masses in 31.9 % and 14.3 % of the cases, respectively. Focusing on each region separately, 29.6 % of the cloud's occurrence seemed to be related to Southern and Eastern air masses and 7.4 % were related to Arctic air masses, although the predominant air mass at Sammaltunturi was from the Arctic (Asmi et al., 2011).
3.3 Effect of the air mass origin on the cloud droplet size
In this section, we focused on investigating the size distribution of the cloud droplets and the derived parameters ED, MVD and LWC. ED and MVD are strongly dependent on the shape of the cloud droplet size distribution, while LWC is a function of both Nc and sizes of the cloud droplets. To achieve a generalization, size distributions of cloud droplets related to each air mass origin for all PaCE campaigns are presented in Fig. 8. Cloud droplet size distributions originating from marine regions (Arctic, Western) had a relatively broad shape with the presence of large (10–20 µm) droplets, whereas in continental air masses there was a clear absence of large cloud droplets. In general, the average size distribution showed a spectrum with more droplets at small size ranges when the masses were continental and more droplets in larger size ranges when the air masses were marine. Cloud droplets larger than 16.0 µm started to appear in clouds that were characterizes by Arctic and western air masses. On the other hand, clouds that were characterized by Eastern and Southern air masses had cloud droplets mainly in the range from 5 to 10 µm. Values of Nc for different sizes of the cloud droplets suggest that higher aerosol loadings lead to higher number concentrations of cloud droplets and smaller cloud droplet effective diameters. This result is consistent with the Twomey effect (Twomey, 1977), reported in several in situ observations (e.g., Twohy et al., 2005; Freud et al., 2008; Goren and Rosenfeld, 2014). In general, in a cloud system, it is expected that for a relatively constant LWC, the effective diameter of cloud droplets decreases as their number concentration increases.
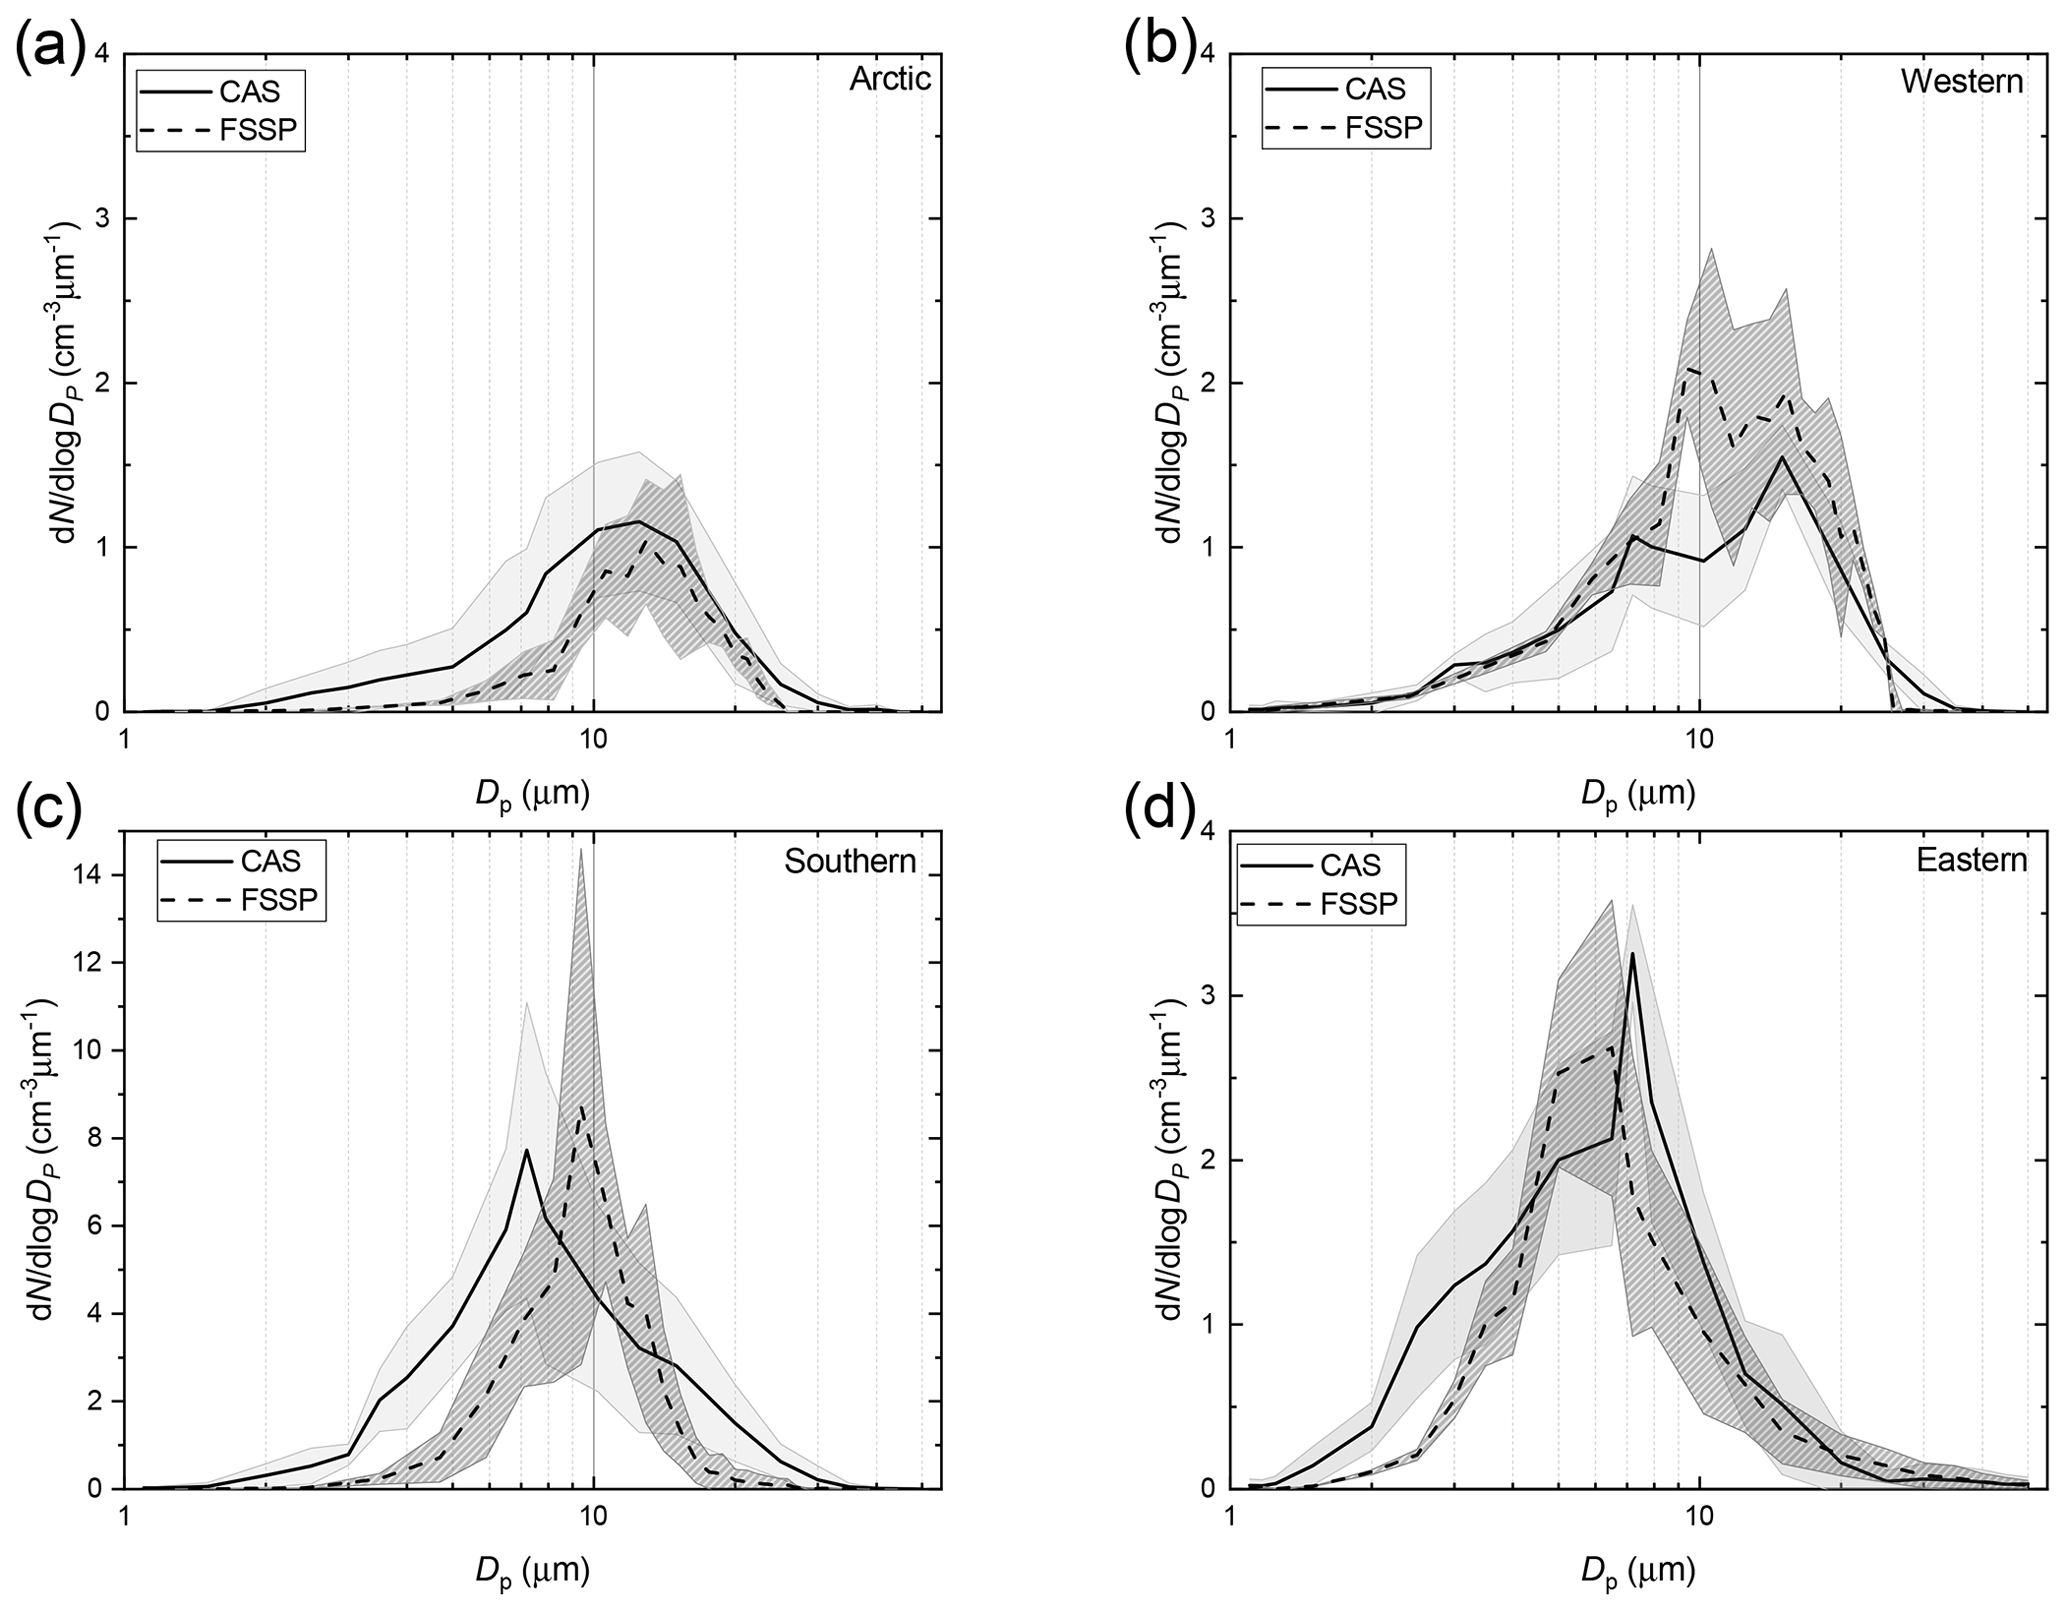
Figure 8Cloud droplet size distribution associated with the (a) Arctic, (b) Western, (c) Southern and (d) Eastern region measured by the cloud and aerosol spectrometer (CAS) and the forward-scattering spectrometer probe (FSSP) during all PaCEs.
We also investigated whether sizes of cloud droplets depend on the air temperature. For that reason, temperature bins of 4 ∘C range were created. Thus, the measurements were grouped into temperature bins of −10 to −6, −6 to −2, −2 to 2 and 2 to 6 ∘C. The mid-temperature value of each bin was used to create Fig. 9 which shows that cloud droplets appeared to be more prone to growing at temperatures larger than −2 ∘C. A hypothesis to explain such growth could be the collision–coalescence procedures that can take place in warm clouds (e.g., Xue et al., 2008; Pruppacher and Klett, 2010; Lohmann et al., 2016). In this study, all the sampled clouds are considered to be warm clouds; however those at warmer air temperatures seem to consist of larger droplets. Both MVD and ED showed a similar behavior. When the clouds were characterized by Arctic air masses, MVD and ED were approximately 15 µm within our temperature spectrum. The decrease of particle size for the “Arctic” subsample in the FSSP data above 0 ∘C was due to the relatively low number of observations in this temperature range (2 h of observation). The observation hours related to each temperature bin for each PaCE are presented in Table S3. For clouds related to Eastern air masses, MVD and ED were approximately 9 µm when the temperature was below 0 ∘C and showed approximately 6 µm larger hydrometeors in warmer clouds (above 0 ∘C). However, more observations from existing and wider temperature ranges are needed to statistically ensure those results.
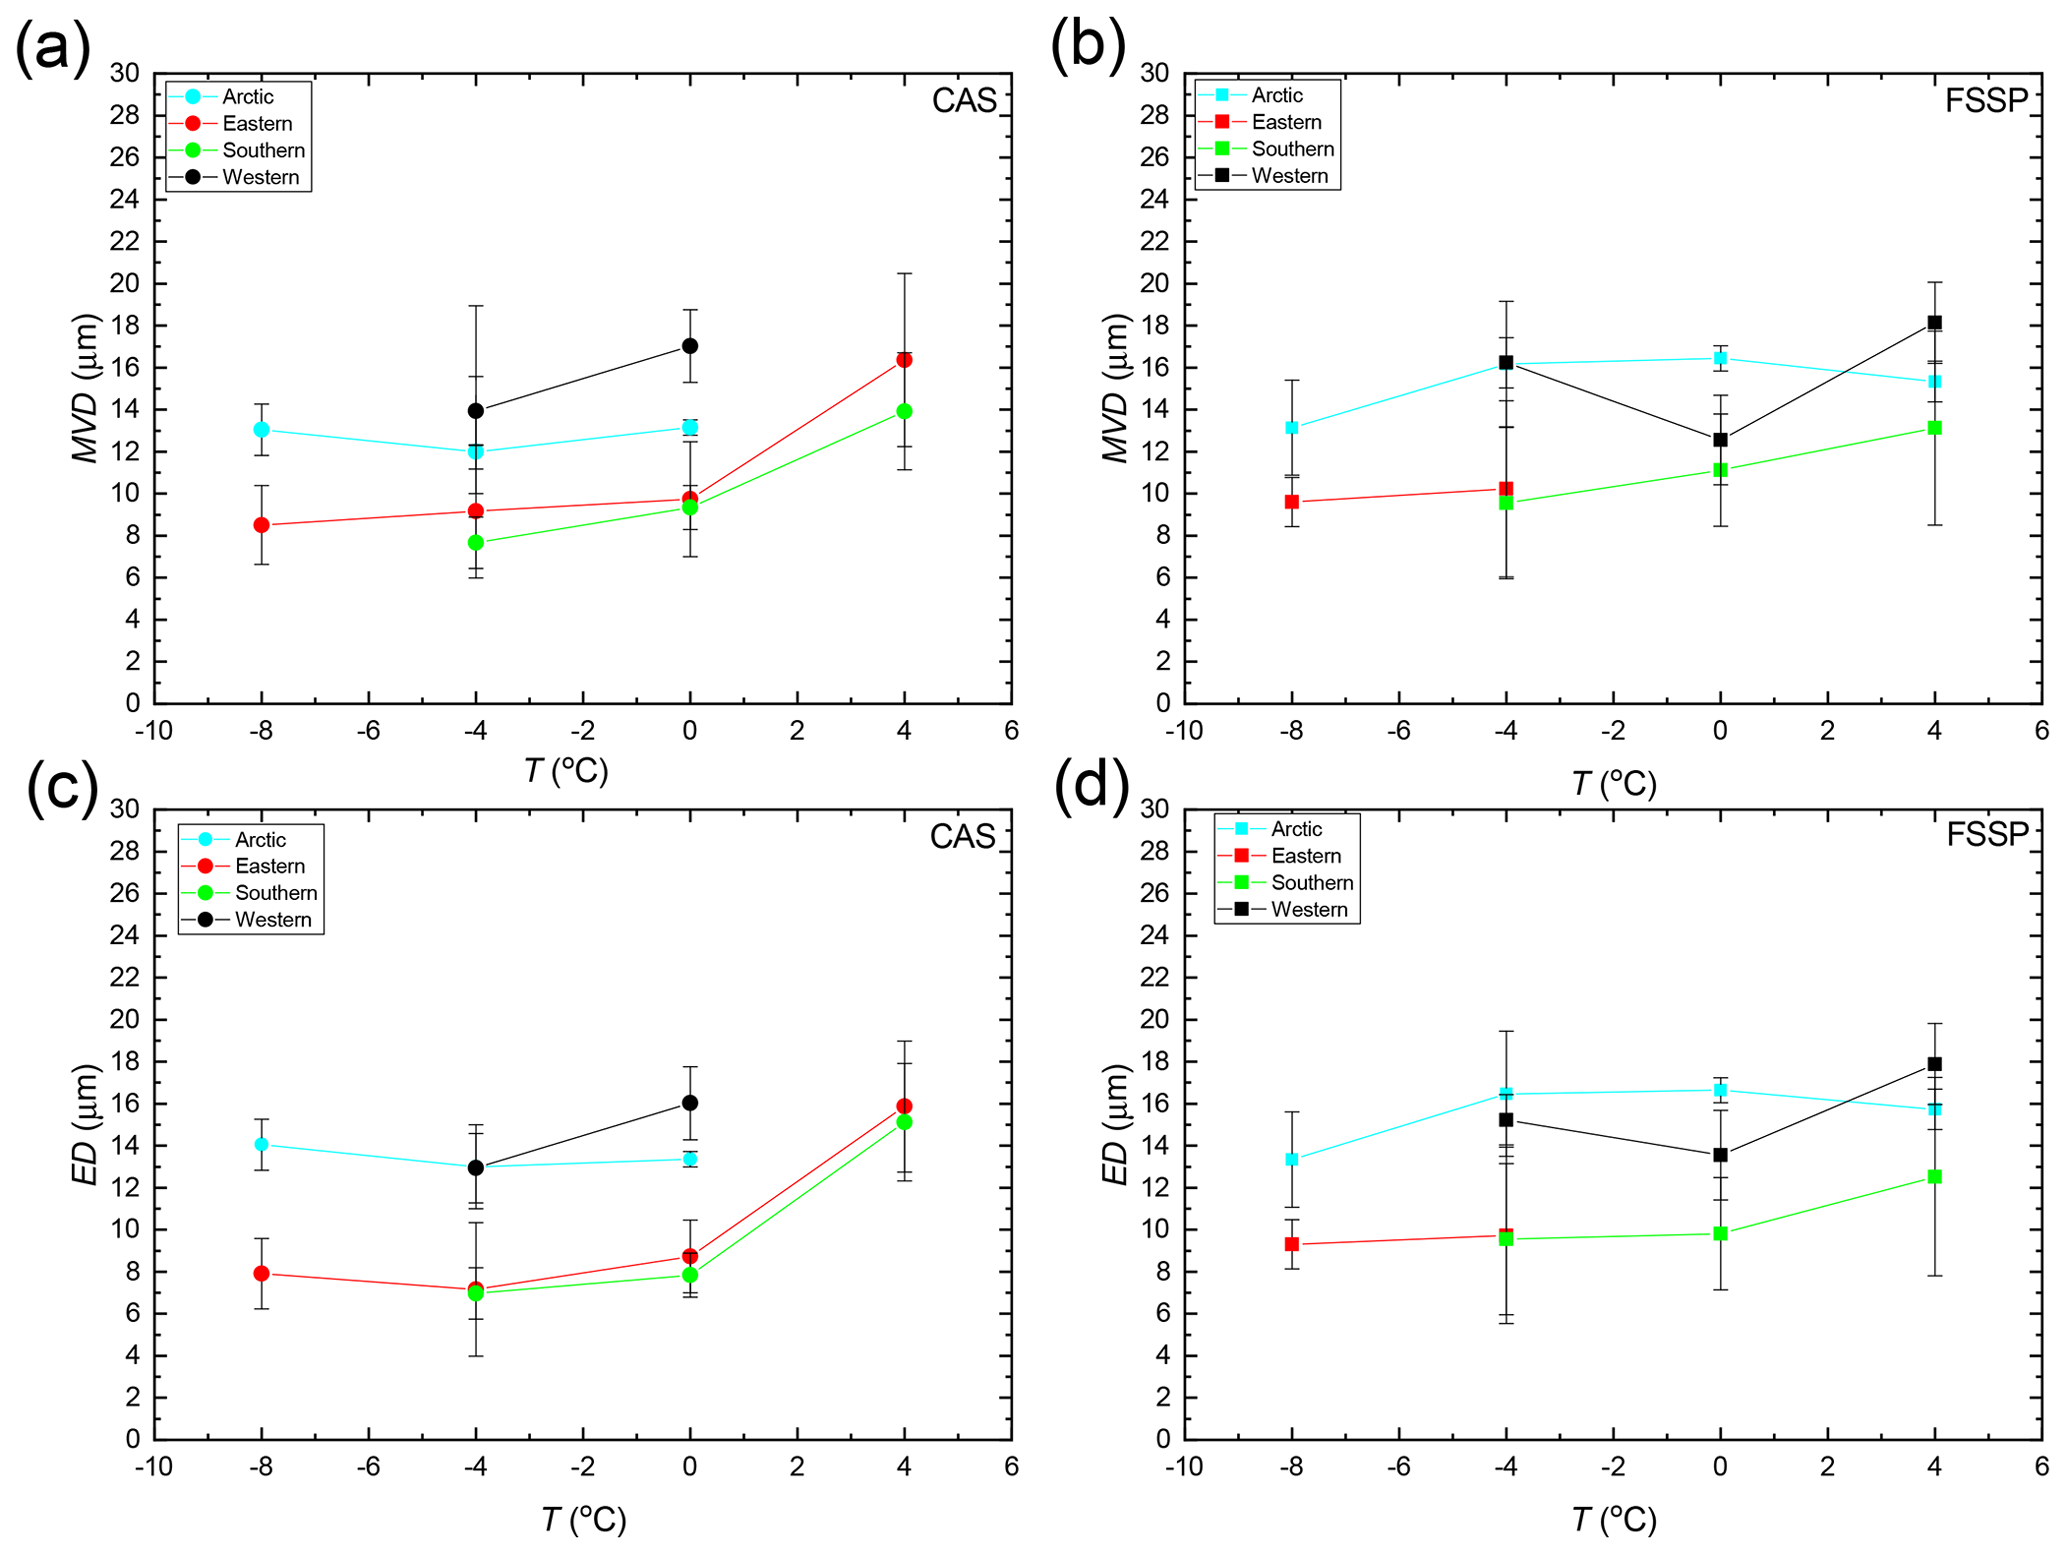
Figure 9Hourly averages of median volume diameter (MVD) and effective diameter (ED) values versus temperature for all PaCE campaigns measured by the cloud and aerosol spectrometer (CAS) and the forward-scattering spectrometer probe (FSSP) where the PES fraction was within one region >80 %. Solid lines were made to lead readers' eyes.
The LWC of low-level clouds for the different air mass types is summarized for each PaCE campaign (Fig. 10a). The Arctic air masses were related to the lowest values of LWC (approximately 0.025 g m−3), whereas the Southern air masses were related to the highest values of LWC (>0.05 g m−3). Western and Eastern air masses were related to LWC values of approximately 0.025 to 0.05 g m−3. In this study, the LWC of continental air masses was, on average, larger than that of marine air masses. This is also reflected in the higher Nc of continental air masses (Fig. 7), as LWC is a function of both Nc and the size of cloud droplets. In Fig. 10b, the relation between the Nc and MVD is plotted. The points were divided into three different levels according to the measured LWC. The values of MVD ranged from ∼9 to 19 µm. MVD was larger for higher values of LWC and decreased with an increasing cloud droplet number concentration for each LWC category. The LWC values of the clouds we sampled (∼0.03 g m−3 for marine and ∼0.06 g m−3 for continental conditions) are comparable to those observed in several other in situ cloud studies (e.g., Gultepe and Isaac, 1997; Zhao et al., 2012; Lu et al., 2014; Guyot et al., 2015; Dionne et al., 2020).
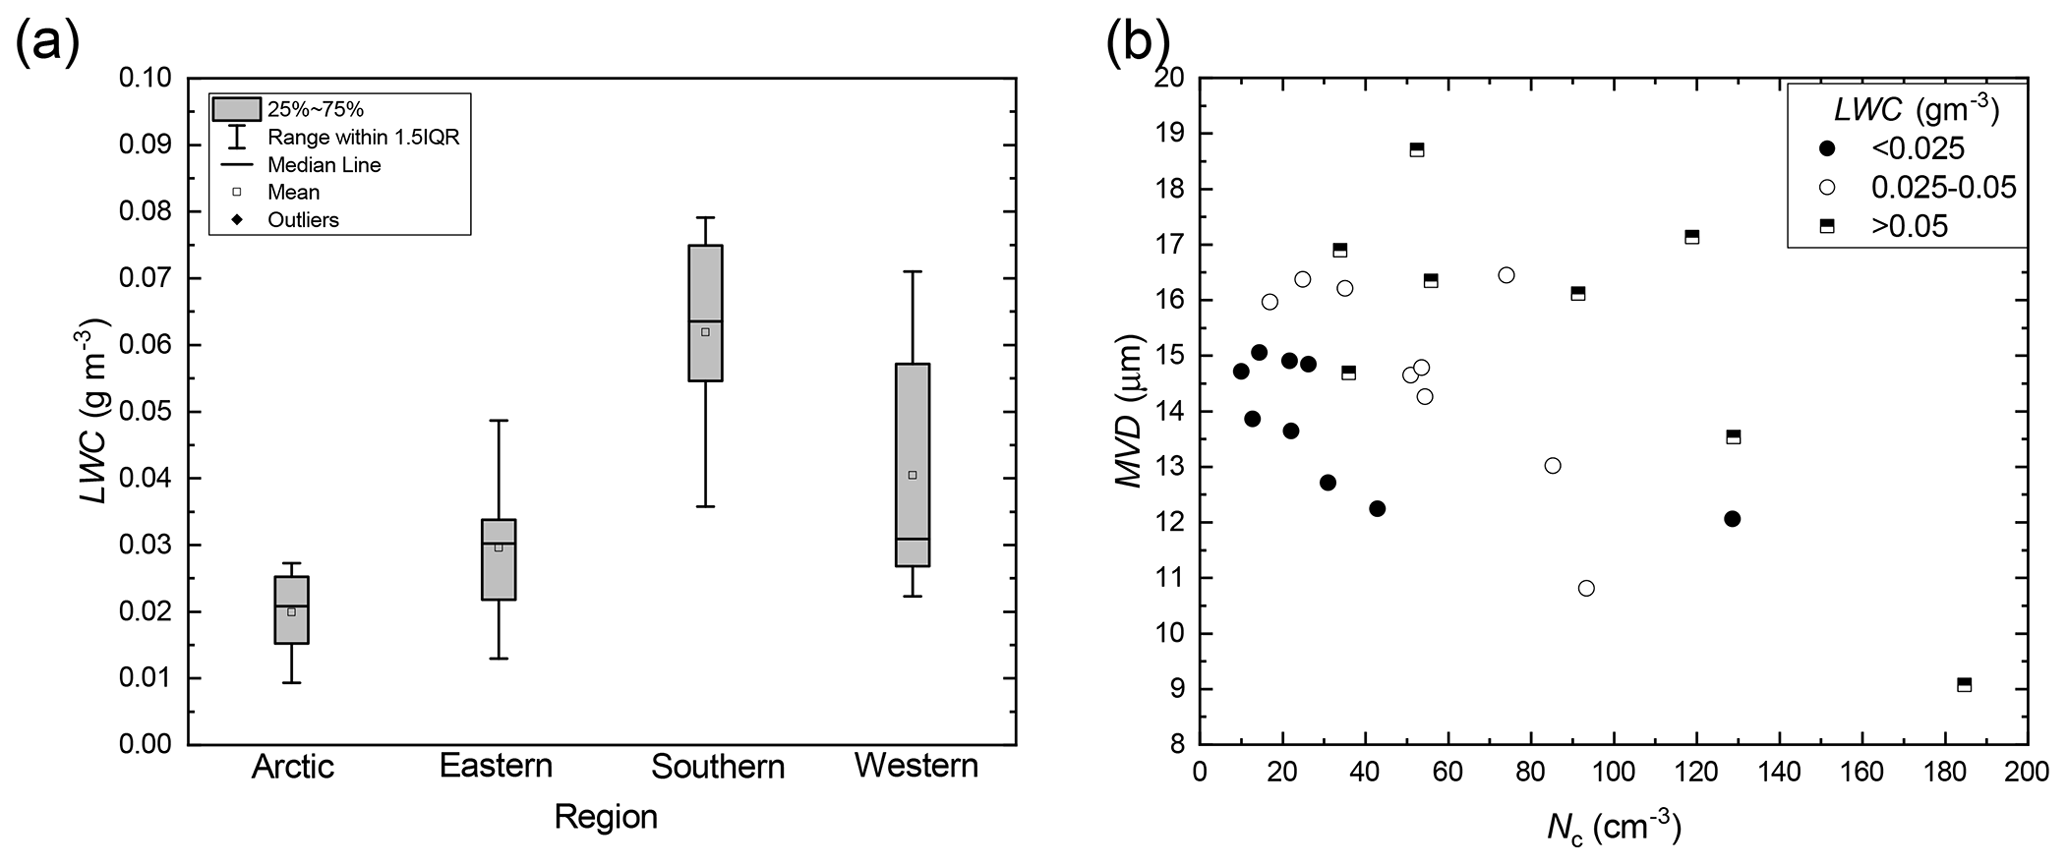
Figure 10(a) Statistical description of liquid water content (LWC) for each region measured by the cloud and aerosol spectrometer (CAS) and the forward-scattering spectrometer probe (FSSP) where PES was within one region >80 %. (b) Median volume diameter (MVD) as a function of total cloud droplet number concentration (Nc) for three different categories of LWC. Each point represents a single PaCE campaign for different regions.
3.4 Influence of the vertical position of the probe on the derived parameters
In this section, we focus on investigating how the derived parameters change with changes in the vertical position (altitude) of the sampling probe, H (m) (e.g., Martins et al., 2011; MacDonald et al., 2018; Alexandrov et al., 2020). Under theoretical adiabatic conditions, the vertical profile of LWC is expected to increase linearly with height above cloud base, with a constant gradient that is dependent on the temperature and pressure at cloud base (Brenguier, 1991). Nc is constant through the vertical profile of the cloud layer, while the size of the droplets increases with altitude (Pawlowska et al., 2006). Assuming homogenous mixing, this expectation of the cloud microphysical profile also holds for “scaled-adiabatic” conditions which include the entrainment of drier air (Boers et al., 2000). In reality, there are more processes to consider, which lead to departures from this ideal condition, particularly towards the cloud top (Pawlowska et al., 2006). As already discussed in Sect. 2.2, both ground-based spectrometers were fixed in one vertical position. Thus, there were cases that we sampled with different layers of a cloud in a range of 120 m from the cloud base. The ground-based spectrometers were placed at the Sammaltunturi, 210 m above the ceilometer (installed at the Kenttärova site). Kenttärova is located 4.3 km to the east of the hilltop station, Sammaltunturi. Since the Sammaltunturi station is on the top of an Arctic fell, cloud formation and properties could also be influenced by the local topography via changes in turbulence or orographic flows. The ceilometer's resolution in estimation of the cloud base was 30 m.
In Fig. 11, a statistical description of MVD is presented, derived from both cloud spectrometers at five different altitudes above cloud base. The distance of the cloud spectrometer was relative to the cloud base. From this analysis, it is apparent that there was no strong dependency between the vertical position of CAS and FSSP in the cloud and the derived sizing parameters. It is expected that number concentration provides a robust signal and can clearly be linked to air mass origin, whereas MVD and ED have some extra uncertainties depending on the altitude with respect to cloud base.
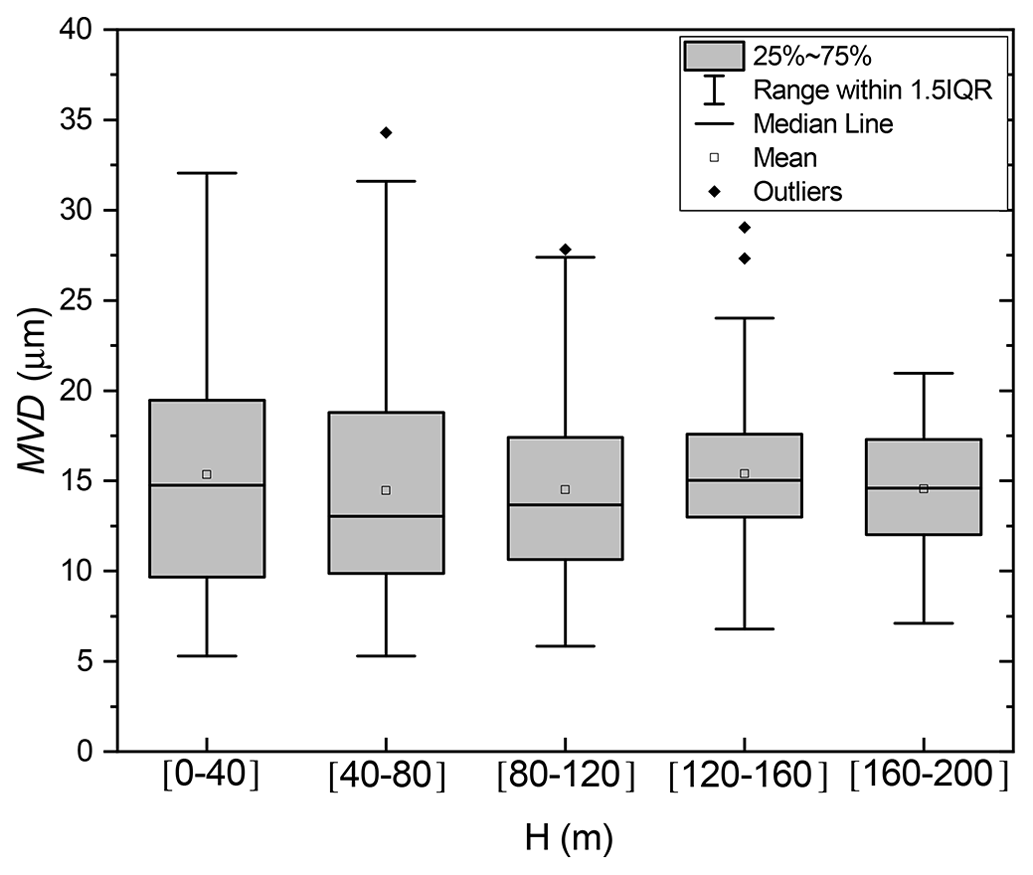
Figure 11Statistical description of hourly averages of median volume diameter (MVD) measured by the cloud and aerosol spectrometer (CAS) and the forward-scattering spectrometer probe (FSSP) where PES was within one region >80 % for five different levels of the position of the probes inside the cloud (H) (relative distance of the cloud ground-based spectrometer). Cloud base was measured at the Kenttärova station.
Our main goal during this work was to quantify the effect of air mass origin on cloud microphysical properties in a clean subarctic environment. Thus, the impact of different air masses on cloud properties in the subarctic Finland was investigated based on data from eight Pallas Cloud Experiments (PaCEs) made during 2004–2019. For measuring the cloud microphysical properties, we deployed two cloud ground-based spectrometer probes: the cloud and aerosol spectrometer and the forward-scattering spectrometer probe. For performing the air mass source classification, the FLEXPART model was used with ERA5 meteorology. The air mass source regions were categorized into Arctic, Eastern, Southern, Western and Local sectors, with the Arctic and Western sectors representing marine air masses and the Eastern, Southern and Local sectors representing continental air masses.
Our analysis demonstrated that different air mass types had significant impacts on cloud microphysics. When 80 % of the potential emission sensitivity fraction was within a region, the observations were considered representative of that air mass type. Continental air masses led to the highest cloud droplet number concentrations (∼ 100–200 cm−3) and marine air masses to the lowest ones (∼ 20 cm−3). The lowest values of cloud droplet concentration were related to clean Arctic air masses. We observed a clear relationship between air mass origin and cloud droplet number concentration. This connection is expected to be a robust signal as according to theoretical considerations (Brenguier 1991; Pawlowska et al., 2006), the measurements of cloud droplet number concentration do not depend on the vertical position of the cloud spectrometer within the cloud layer. In general, the median volume diameter and effective diameter of cloud droplets were found to be influenced by the cloud droplet number concentration: clouds associated with marine air masses had larger cloud droplets (ranging from 15 to 20 µm) in comparison with continental clouds (ranging from 8 to 12 µm). These results are in agreement with the Twomey effect (Twomey, 1977). The above differences that were observed in cloud microphysical properties when the air masses were related to different regions show the need to investigate how the aerosol loading and meteorology of different air masses along with local meteorological parameters change the cloud microphysics and to what scale. Furthermore, there was an indication that cloud droplets in clouds in warmer air (from −2 to 6 ∘C) were more prone to growing. However, all-year-round in situ cloud measurements in the area are of high importance to confirm such temperature dependency of droplet sizes. Specifically, a large dataset containing a wider temperature range needs to be obtained.
The cloud probes and meteorological data used here are available in the Finnish Meteorological Institute (FMI) open data repository for each campaign and each cloud spectrometer ground setup individually (Doulgeris et al., 2021: https://doi.org/10.23728/fmi-b2share.988739d21b824c709084e88ed6c6d54b, Doulgeris et al., 2022: https://doi.org/10.5194/essd-14-637-2022). The FLEXPART simulations and the ceilometer dataset are available upon request to the corresponding author (konstantinos.doulgeris@fmi.fi).
The supplement related to this article is available online at: https://doi.org/10.5194/acp-23-2483-2023-supplement.
KMD wrote the paper with contributions from all co-authors. HL planned and coordinated PaCE 2004, 2005 and 2009. HL and DB planned and coordinated PaCE 2012 and 2013. KMD and DB planned and coordinated PaCE 2015, 2017 and 2019. KMD and DB processed, analyzed and quality-controlled the dataset. VV carried out the FLEXPART simulations. EJO'C provided the ceilometer data. VMK reviewed and edited the manuscript.
The contact author has declared that none of the authors has any competing interests.
Publisher’s note: Copernicus Publications remains neutral with regard to jurisdictional claims in published maps and institutional affiliations.
This work was supported by the Koneen Säätiö (grant no. 46-6817) and the Academy of Finland Flagship funding (grant no. 337552). This project has also received funding from the European Union, H2020 Research and Innovation program (ACTRIS-IMP, the European Research Infrastructure for the observation of Aerosol, Clouds, and Trace gases (grant no. 871115)). The authors wish to acknowledge CSC – IT Center for Science, Finland, for computational resources. The authors would also like to thank all the people who have helped in PaCE campaign measurements throughout the years.
This research has been supported by the Academy of Finland (grant no. 337552), the KONE Foundation (grant no. 46-6817) and Horizon 2020 (ACTRIS IMP (grant no. 871115)).
This paper was edited by Matthias Tesche and reviewed by two anonymous referees.
Aalto, T., Hatakka, J., and Viisanen, Y.: Influence of air mass source sector on variations in CO2 mixing ratio at a boreal site in northern Finland, Boreal Environ. Res., 8, 285–393, 2003.
Albrecht, B. A.: Aerosols, cloud microphysics, and fractional cloudiness, Science, 245, 1227–1230, 1989.
Alexandrov, M. D., Miller, D. J., Rajapakshe, C., Fridlind, A., van Diedenhoven, B., Cairns, B., Ackerman, A., and Zhang, S: Vertical profiles of droplet size distributions derived from cloud-side observations by the research scanning polarimeter: Tests on simulated data, Atmos. Res., 239, 104924, https://doi.org/10.1016/j.atmosres.2020.104924, 2020.
Andronache, C.: Mixed-phase Clouds: Observations and Modeling, Elsevier, Saint Louis, proQuest Ebook Central, https://ebookcentral.proquest.com/lib/fmi/detail.action?docID=5064425 (last access: 16 January 2023), 2017.
Anttila, T., Brus, D., Jaatinen, A., Hyvärinen, A.-P., Kivekäs, N., Romakkaniemi, S., Komppula, M., and Lihavainen, H.: Relationships between particles, cloud condensation nuclei and cloud droplet activation during the third Pallas Cloud Experiment, Atmos. Chem. Phys., 12, 11435–11450, https://doi.org/10.5194/acp-12-11435-2012, 2012.
Asmi, E., Kivekäs, N., Kerminen, V.-M., Komppula, M., Hyvärinen, A.-P., Hatakka, J., Viisanen, Y., and Lihavainen, H.: Secondary new particle formation in Northern Finland Pallas site between the years 2000 and 2010, Atmos. Chem. Phys., 11, 12959–12972, https://doi.org/10.5194/acp-11-12959-2011, 2011.
Barrie, L. A.: Arctic air pollution: an overview of current knowledge, Atmos. Environ., 20, 643–663, 1986.
Barthlott, C. and Hoose, C.: Aerosol effects on clouds and precipitation over central Europe in different weather regimes, J. Atmos. Sci., 75, 4247–4264, https://doi.org/10.1175/JAS-D-18-0110.1, 2018.
Baumgardner, D.: An analysis and comparison of five water droplet measuring instruments, J. Appl. Meteorol., 22, 891–910, https://doi.org/10.1175/1520-0450(1983)022<0891:AAACOF>2.0.CO;2, 1983.
Baumgardner, D., Jonsson, H., Dawson, W., O'Connor, D., and Newton, R.: The cloud, aerosol and precipitation spectrometer (CAPS): A new instrument for cloud investigations, Atmos. Res., 59–60, 251–264, https://doi.org/10.1016/S0169-8095(01)00119-3, 2001.
Baumgardner, D., Abel, S. J., Axisa, D., Cotton, R., Crosier, J., Field, P., Gurganus, C., Heymsfield, A., Korolev, A., Krämer, M., Lawson, P., McFarquhar, G., Ulanowski, Z., and Um, J.: Cloud Ice Properties: In Situ Measurement Challenges, Meteor. Mon., 58, 9.1–9.23, https://doi.org/10.1175/AMSMONOGRAPHS-D-16-0011.1, 2017.
Boers, R., Russchenberg, H., Erkelens, J., Venema, V., van Lammeren, A., Apituley, A., and Jongen, S.: Ground-based remote sensing of stratocumulus properties during CLARA, 1996, J. Appl. Meteorol., 39, 169–181, 2000.
Boucher, O., Randall, D., Artaxo, P., Bretherton, C., Feingold, G., Forster, P., Kerminen, V.-M., Kondo, Y., Liao, H., Lohmann, U., Rasch, P., Satheesh, S. K., Sherwood, S., Stevens, B., and Zhang, X. Y.: Chapter 7 – Clouds and aerosols, in: Climate Change 2013: The Physical Science Basis. Contribution of Working Group I to the Fifth Assessment Report of the Intergovernmental Panel on Climate Change, edited by: Stocker, T. F., Qin, D., Plattner, G.-K., Tignor, M., Allen, S. K., Doschung, J., Nauels, A., Xia, Y., Bex, V., and Midgley, P. M., Cambridge University Press, Cambridge, 571–657, https://doi.org/10.1017/CBO9781107415324.016, 2013.
Brenguier, J. L.: Coincidence and Dead-Time Corrections for Particles Counters. Part II: High Concentration Measurements with an FSSP, J. Atmos. Ocean. Tech., 6, 585–598, https://doi.org/10.1175/1520-0426(1989)006<0585:CADTCF>2.0.CO;2, 1989.
Brenguier, J. L.: Parameterization of the condensation process – A theoretical approach, J. Atmos. Sci., 48, 264–282, 1991.
Brus, D., Neitola, K., Asmi, E., Aurela, M., Makkonen, U., Svensson, J., Hyvärinen, A.-P., Hirsikkoa, A., Hakola, H., Hillamo, R., and Lihavainen, H.: Pallas cloud experiment, PACE 2012, AIP Conf. Proc., 1527, 964, https://doi.org/10.1063/1.4803433, 2013a.
Brus, D., Asmi, E., Raatikainen, T., Neitola, K., Aurela, M., Makkonen, U., Svensson, J., Hyvärinen, A.-P., Hirsikkoa, A., Hakola, H., Hillamo, R., and Lihavainen, H: Ground-based observations of aerosol and cloud properties at sub-arctic Pallas GAW-station, PAllas Cloud Experiment (PACE 2012) report series in aerosol science no. 142, in: Proceedings of FCoE in 'Physics, Chemistry, Biology and Meteorology of Atmospheric Composition and Climate Change' Annual Meeting, Helsinki, 2013, Proceedings_FCoE_2013, 187–191, http://www.faar.fi/wp-content/uploads/2020/04/RS142_Proceedings_FCoE_2013.pdf (last access: 16 January 2023), 2013b.
Chang, Y., Guo, X., Tang, J., and Lu, G.: Aircraft measurement campaign on summer cloud microphysical properties over the Tibetan Plateau, Sci. Rep., 9, 4912, https://doi.org/10.1038/s41598-019-41514-5, 2019.
Cho, Y., Park, S.-J., Kim, J.-H., Yeo, H., Nam, J., Jun, S.-Y., Kim, B.-M., and Kim, S.-W.: Investigating Wintertime Cloud Microphysical Properties and Their Relationship to Air Mass Advection at Ny-Ålesund, Svalbard Using the Synergy of a Cloud Radar–Ceilometer–Microwave Radiometer, Remote Sens., 13, 2529, https://doi.org/10.3390/rs13132529, 2021.
Devenish, B. J., Bartello, P., Brenguier, J.-L., Collins, L. R., Grabowski, W. W., Jzermans, R. H. A., Malinowski, S. P., Reeks, M. W., Vassilicos, J. C., Wang, L.-P., and Warhaft, Z.: Droplet growth in warm turbulent clouds, Q. J. Roy. Meteor. Soc., 138, 1401–1429, https://doi.org/10.1002/qj.1897, 2012.
Dionne, J., von Salzen, K., Cole, J., Mahmood, R., Leaitch, W. R., Lesins, G., Folkins, I., and Chang, R. Y.-W.: Modelling the relationship between liquid water content and cloud droplet number concentration observed in low clouds in the summer Arctic and its radiative effects, Atmos. Chem. Phys., 20, 29–43, https://doi.org/10.5194/acp-20-29-2020, 2020.
Donovan, D. P., Klein Baltink, H., Henzing, J. S., de Roode, S. R., and Siebesma, A. P.: A depolarisation lidar-based method for the determination of liquid-cloud microphysical properties, Atmos. Meas. Tech., 8, 237–266, https://doi.org/10.5194/amt-8-237-2015, 2015.
Doulgeris, K.-M., Komppula, M., Romakkaniemi, S., Hyvärinen, A.-P., Kerminen, V.-M., and Brus, D.: In situ cloud ground-based measurements in the Finnish sub-Arctic: intercomparison of three cloud spectrometer setups, Atmos. Meas. Tech., 13, 5129–5147, https://doi.org/10.5194/amt-13-5129-2020, 2020.
Doulgeris, K.-M., Lihavainen, H., Hyvärinen, A.-P., Kerminen, V.-M., and Brus, D.: Data set for Doulgeris et al. 2021: In-situ microphysical characterization of low-level clouds in the Finnish sub-Arctic, extensive dataset, Finnish Meteorological Institute [data set], https://doi.org/10.23728/fmi-b2share.988739d21b824c709084e88ed6c6d54b, 2021.
Doulgeris, K. M., Lihavainen, H., Hyvärinen, A.-P., Kerminen, V.-M., and Brus, D.: An extensive data set for in situ microphysical characterization of low-level clouds in a Finnish sub-Arctic site, Earth Syst. Sci. Data, 14, 637–649, https://doi.org/10.5194/essd-14-637-2022, 2022.
Droplet Measurement Technologies (DMT): Manual: Particle Analysis and Display System (PADS) Image Probe Data Reference Manual DOC-0201 Rev A-2 PADS 2.5.6, DMT, Boulder, Colorado, USA, 2009.
Emeis, S., Münkel, C., Vogt, S., Müller, W. J., and Schäfer, K.: Atmospheric boundary-layer structure from simultaneous SODAR, RASS and ceilometer measurements, Atmos. Environ., 38, 273–286, 2004
Eneroth, K., Kjellström, E. and Holmén, K.: A trajectory climatology for Svalbard; investigating how atmospheric flow patterns influence observed tracer concentrations, Phys. Chem. Earth, 28, 1191–1203, https://doi.org/10.1016/j.pce.2003.08.051, 2003.
Eneroth, K., Aalto, T., Hatakka, J., Holmen, K., Laurila, T., and Viisanen, Y.: Atmospheric transport of carbon dioxide to a baseline monitoring station in northern Finland, Tellus B, 57, 366–374, https://doi.org/10.1111/j.1600-0889.2005.00160.x, 2005.
Filioglou, M., Mielonen, T., Balis, D., Giannakaki, E., Arola, A., Kokkola, H., Komppula, M., and Romakkaniemi, S.: Aerosol Effect on the Cloud Phase of Low-Level Clouds Over the Arctic, J. Geophys. Res.-Atmos., 124, 7886–7899, https://doi.org/10.1029/2018JD030088, 2019.
Freud, E., Rosenfeld, D., Andreae, M. O., Costa, A. A., and Artaxo, P.: Robust relations between CCN and the vertical evolution of cloud drop size distribution in deep convective clouds, Atmos. Chem. Phys., 8, 1661–1675, https://doi.org/10.5194/acp-8-1661-2008, 2008.
Freud, E., Krejci, R., Tunved, P., Leaitch, R., Nguyen, Q. T., Massling, A., Skov, H., and Barrie, L.: Pan-Arctic aerosol number size distributions: seasonality and transport patterns, Atmos. Chem. Phys., 17, 8101–8128, https://doi.org/10.5194/acp-17-8101-2017, 2017.
Fuchs, J., Cermak, J., Andersen, H., Hollmann, R., and Schwarz, K.: On the influence of air mass origin on low-cloud properties in the Southeast Atlantic, J. Geophys. Res.,-Atmos., 122, 11076–11091, https://doi.org/10.1002/2017JD027184, 2017.
Gérard, V., Noziere, B., Fine, L., Ferronato, C., Singh, D., K., Frossard, A., Cohen, R. C. Asmi, E., Lihavainen, H., Kivekäs, N., Aurela, M., Brus, D., Frka, S., and Cvitešić Kušan, A.: Concentrations and Adsorption Isotherms for Amphiphilic Surfactants in PM1 Aerosols from Different Regions of Europe, Environ. Sci. Technol., 53, 12379–12388, https://doi.org/10.1021/acs.est.9b03386, 2019.
Girdwood, J., Smith, H., Stanley, W., Ulanowski, Z., Stopford, C., Chemel, C., Doulgeris, K.-M., Brus, D., Campbell, D., and Mackenzie, R.: Design and field campaign validation of a multi-rotor unmanned aerial vehicle and optical particle counter, Atmos. Meas. Tech., 13, 6613–6630, https://doi.org/10.5194/amt-13-6613-2020, 2020.
Girdwood, J., Stanley, W., Stopford, C., and Brus, D.: Simulation and field campaign evaluation of an optical particle counter on a fixed-wing UAV, Atmos. Meas. Tech., 15, 2061–2076, https://doi.org/10.5194/amt-15-2061-2022, 2022.
Goren, T. and Rosenfeld, D.:Decomposing aerosol cloud radiative effects into cloud cover, liquid water path and Twomey components in marine stratocumulus, Atmos. Res., 138, 378–393, https://doi.org/10.1016/j.atmosres.2013.12.008, 2014.
Gultepe, I. and Isaac, G. A.: Liquid water content and temperature relationship from aircraft observations and its applicability to GCMs, J. Climate, 10, 447–452, https://doi.org/10.1175/1520-0442(1997)010<0446:LWCATR>2.0.CO;2, 1997.
Gultepe, I. and Isaac, G. A.: Effects of air mass origin on Arctic cloud microphysical parameters for April 1998 during FIRE.ACE, J. Geophys. Res., 107, SHE 4-1–SHE 4-12, https://doi.org/10.1029/2000JC000440, 2002.
Gultepe, I., Isaac, G., Hudak, D., Nissen, R., and Strapp, W.: Dynamical and microphysical characteristics of Arctic clouds during BASE, J. Climate, 13, 1225–1254, 2000.
Guyot, G., Gourbeyre, C., Febvre, G., Shcherbakov, V., Burnet, F., Dupont, J.-C., Sellegri, K., and Jourdan, O.: Quantitative evaluation of seven optical sensors for cloud microphysical measurements at the Puy-de-Dôme Observatory, France, Atmos. Meas. Tech., 8, 4347–4367, https://doi.org/10.5194/amt-8-4347-2015, 2015.
Hatakka, J., Aalto, T., Aaltonen, V., Aurela, M., Hakola, H., Komppula, M., Laurila, T., Lihavainen, H., Paatero, J., Salminen, K., and Viisanen Y.: Overview of the atmospheric research activities and results at Pallas GAW station, Boreal Environ. Res., 8, 365–384, 2003.
Hobbs, P. V. and Rangno, A. L.: Reply to “Comments by Alan M. Blyth and John Latham on 'Cumulus glaciation papers by P. V. Hobbs and A. L. Rangno”', Q. J. Roy. Meteor. Soc., 124, 1009–1011, 1998.
Hyvärinen, A.-P., Kolmonen, P., Kerminen, V.-M., Virkkula, A., Leskinen, A., Komppula, M., Hatakka, J., Burkhart, J., Stohl, A., Aalto, P., Kulmala, M., Lehtinen, K., Viisanen, Y., and Lihavainen, H.: Aerosol black carbon at five background measurement sites over Finland, a gateway to the Arctic, Atmos. Environ., 45, 4042–4050, 2011.
Igel, A. L. and van den Heever, S. C.: The Importance of the Shape of Cloud Droplet Size Distributions in Shallow Cumulus Clouds. Part I: Bin Microphysics Simulations, J. Atmos. Sci., 74, 249–258, https://doi.org/10.1175/JAS-D-15-0382.1, 2017a.
Igel, A. L. and van den Heever, S. C.: The Importance of the Shape of Cloud Droplet Size Distributions in Shallow Cumulus Clouds. Part II: Bulk Microphysics Simulations, J. Atmos. Sci., 74, 259–273, https://doi.org/10.1175/JAS-D-15-0383.1, 2017b.
Iwamoto, Y., Watanabe, A., Kataoka, R., Uematsu, M., and Miura, K.: Aerosol–Cloud Interaction at the Summit of Mt. Fuji, Japan: Factors Influencing Cloud Droplet Number Concentrations, Appl. Sci., 11, 8439, https://doi.org/10.3390/app11188439, 2021.
Jaatinen, A., Romakkaniemi, S., Anttila, T., Hyvärinen, A.-P., Hao, L. Q., Kortelainen, A., Miettinen, P., Mikkonen, S., Smith, J. N., Virtanen, A., and Laaksonen, A.: The third Pallas Cloud Experiment: Consistency between the aerosol hygroscopic growth and CCN activity, Boreal Environ. Res., 19, 368–382, 2014.
Komppula, M., Lihavainen, H., Hatakka, J., Paatero, J., Aalto, P., Kulmala, M., and Viisanen, Y.: Observations of new particle formation and size distributions at two different heights and surroundings in subarctic area in northern Finland, J. Geophys. Res., 108, 4295, https://doi.org/10.1029/2002JD002939, 2003.
Korolev, A., McFarquhar, G., Field, P. R., Franklin, C., Lawson, P., Wang, Z., Williams, E., Abel, S. J., Axisa, D., Borrmann, S., Crosier, J., Fugal, J., Krämer, M., Lohmann, U., Schlenczek, O., Schnaiter, M., and Wendisch, M.: Mixed-Phase Clouds: Progress and Challenges, Meteorol. Mon., 58, 5.1–5.50, 2017.
Kyrö, E.-M., Väänänen, R., Kerminen, V.-M., Virkkula, A., Petäjä, T., Asmi, A., Dal Maso, M., Nieminen, T., Juhola, S., Shcherbinin, A., Riipinen, I., Lehtipalo, K., Keronen, P., Aalto, P. P., Hari, P., and Kulmala, M.: Trends in new particle formation in eastern Lapland, Finland: effect of decreasing sulfur emissions from Kola Peninsula, Atmos. Chem. Phys., 14, 4383–4396, https://doi.org/10.5194/acp-14-4383-2014, 2014.
Lance, S.: Coincidence Errors in a Cloud Droplet Probe (CDP) and a Cloud and Aerosol Spectrometer (CAS), and the Improved Performance of a Modified CDP, J. Atmos. Ocean. Tech., 29, 1532–1541, https://doi.org/10.1175/JTECH-D-11-00208.1, 2012.
Lee, H. J., Jo, Y. J., Kim, S., Kim, D., Kim, J., Choi, D., Jo, H., Bak, J., Park, S., Jeon, W., and Kim, C.-H.: Transboundary aerosol transport process and its impact on aerosol-radiation-cloud feedbacks in springtime over Northeast Asia, Sci. Rep., 12, 4870, https://doi.org/10.1038/s41598-022-08854-1, 2022.
Lihavainen, H., Kerminen, V.-M., Komppula, M., Hyvärinen, A.-P., Laakia, J., Saarikoski, S., Makkonen, U., Kivekäs, N., Hillamo, R., Kulmala, M., and Viisanen, Y.: Measurements of the relation between aerosol properties and microphysics and chemistry of low level liquid water clouds in Northern Finland, Atmos. Chem. Phys., 8, 6925–6938, https://doi.org/10.5194/acp-8-6925-2008, 2008.
Lohila, A., Penttilä, T., Jortikka, S., Aalto, T., Anttila, P., Asmi, E., Aurela, M., Hatakka, J., Hellén, H., Henttonen, H., Hänninen, P., Kilkki, J., Kyllönen, K., Laurila, T., Lepistö, A., Lihavainen, H., Makkonen, U., Paatero, J., Rask, M., Sutinen, R., Tuovinen, J.-P., Vuorenmaa, J., and Viisanen, Y.: Preface to the special issue on integrated research of atmosphere, ecosystems and environment at Pallas, Boreal Environ. Res., 20, 431–454, 2015.
Lohmann, U., Lüönd, F., and Mahrt, F.: Microphysical processes in warm clouds, in: An Introduction to Clouds: From the Microscale to Climate, Cambridge University Press, Cambridge, 186–217, https://doi.org/10.1017/CBO9781139087513.008, 2016.
Lu, C., Liu, Y., Niu, S., and Endo, S.: Scale dependence of entrainment-mixing mechanisms in cumulus clouds, J. Geophys. Res.-Atmos., 119, 13877–13890, 2014.
MacDonald, A. B., Dadashazar, H., Chuang, P. Y., Crosbie, E., Wang, H., Wang, Z., Jonsson, H. H., Flagan, R. C., Seinfeld, J. H., and Sorooshian, A.: Characteristic Vertical Profiles of Cloud Water Composition in Marine Stratocumulus Clouds and Relationships With Precipitation, J. Geophys. Res.-Atmos., 123, 3704–3723, https://doi.org/10.1002/2017JD027900, 2018
Martins, J. V., Marshak, A., Remer, L. A., Rosenfeld, D., Kaufman, Y. J., Fernandez-Borda, R., Koren, I., Correia, A. L., Zubko, V., and Artaxo, P.: Remote sensing the vertical profile of cloud droplet effective radius, thermodynamic phase, and temperature, Atmos. Chem. Phys., 11, 9485–9501, https://doi.org/10.5194/acp-11-9485-2011, 2011.
McFarquhar, G. M., Bretherton, C., Marchand, R., Protat, A., DeMott, P. J., Alexander, S. P., Roberts, G. C., Twohy, C. H., Toohey, D., Siems, S., Huang, Y., Wood, R., Rauber, R. M., Lasher-Trapp, S., Jensen, J., Stith, J., Mace, J., Um, J., Järvinen, E., Schnaiter, M., Gettelman, A., Sanchez, K. J., McCluskey, C. S., Russell, L. M., McCoy, I. L., Atlas, R., Bardeen, C. G., Moore, K. A., Hill, T. C. J., Humphries, R. S., Keywood, M. D., Ristovski, Z., Cravigan, L., Schofield, R., Fairall, C., Mallet, M. D., Kreidenweis, S. M., Rainwater, B., D'Alessandro, J., Wang, Y., Wu, W., Saliba, G., Levin, E. J. T., Ding, S., Lang, F., Truong, S. C., Wolff, C., Haggerty, J., Harvey, M. J., Klekociuk, A., and McDonald, A.: Observations of clouds, aerosols, precipitation, and surface radiation over the Southern Ocean: An overview of CAPRICORN, MARCUS, MICRE and SOCRATES, B. Am. Meteorol. Soc., 102, E894–E928, https://doi.org/10.1175/BAMS-D-20-0132.1, 2020.
Mie, G.: Beiträge zur Optik trüber Medien, speziell kolloidaler Metallösungen, Ann. Phys.-Berlin, 330, 377–445, 1908.
Morrison, H., van Lier-Walqui, M., Fridlind, A. M., Grabowski, W. W., Harrington, J. Y., Hoose, C., Koroloev, A., Kumjian, M. R., Milbrandt, J. A., Pawlowska, H., Posselt, D. J., Prat, O. P., Reimel, K. J., Shima, S.-I., Van Diedenhoven, B., and Xue, L.: Confronting the challenge of modeling cloud and precipitation microphysics, J. Adv. Model. Earth Sy., 12, e2019MS001689, https://doi.org/10.1029/2019MS001689, 2020.
Orbe, C., Newman, P. A., Waugh, D. W., Holzer, M., Oman, L. D., Li, F., and Polvani, L. M.: Airmass Origin in the Arctic. Part I: Seasonality, J. Climate, 28, 4997–5014, https://doi.org/10.1175/JCLI-D-14-00720.1, 2015a.
Orbe, C., Newman, P. A., Waugh, D. W., Holzer, M., Oman, L. D., Li, F., and Polvani, L. M.: Air-mass Origin in the Arctic. Part II: Response to Increases in Greenhouse Gases, J. Climate, 28, 9105–9120, https://doi.org/10.1175/JCLI-D-15-0296.1, 2015b.
Paramonov, M., Kerminen, V.-M., Gysel, M., Aalto, P. P., Andreae, M. O., Asmi, E., Baltensperger, U., Bougiatioti, A., Brus, D., Frank, G. P., Good, N., Gunthe, S. S., Hao, L., Irwin, M., Jaatinen, A., Jurányi, Z., King, S. M., Kortelainen, A., Kristensson, A., Lihavainen, H., Kulmala, M., Lohmann, U., Martin, S. T., McFiggans, G., Mihalopoulos, N., Nenes, A., O'Dowd, C. D., Ovadnevaite, J., Petäjä, T., Pöschl, U., Roberts, G. C., Rose, D., Svenningsson, B., Swietlicki, E., Weingartner, E., Whitehead, J., Wiedensohler, A., Wittbom, C., and Sierau, B.: A synthesis of cloud condensation nuclei counter (CCNC) measurements within the EUCAARI network, Atmos. Chem. Phys., 15, 12211–12229, https://doi.org/10.5194/acp-15-12211-2015, 2015.
Painemal, D., Kato, S., and Minnis, P.: Boundary layer regulation in the southeast Atlantic cloud microphysics during the biomass burning season as seen by the A-train satellite constellation, J. Geophys. Res.-Atmos., 119, 11288–11302, https://doi.org/10.1002/2014JD022182, 2014.
Patel, P. N. and Jiang, H. J.: Cloud condensation nuclei characteristics at the Southern Great Plains site: role of particles size distribution and aerosol hygroscopicity, Environ. Res. Commun., 3, 075002, https://doi.org/10.1088/2515-7620/ac0e0b, 2021.
Pawlowska, H., Grabowski, W. W., and Brenguier, J.-L.: Observations of the width of cloud droplet spectra in stratocumulus, Geophys. Res. Lett., 33, L19810, https://doi.org/10.1029/2006GL026841, 2006.
Pernov, J. B., Beddows, D., Thomas, D. C., Dall'Osto, M., Harrison, R. M., Schmale, J., Skov, H., and Massling, A.: Increased aerosol concentrations in the High Arctic attributable to changing atmospheric transport patterns, npj Climate and Atmospheric Science, 5, 62, https://doi.org/10.1038/s41612-022-00286-y, 2022.
Pisso, I., Sollum, E., Grythe, H., Kristiansen, N. I., Cassiani, M., Eckhardt, S., Arnold, D., Morton, D., Thompson, R. L., Groot Zwaaftink, C. D., Evangeliou, N., Sodemann, H., Haimberger, L., Henne, S., Brunner, D., Burkhart, J. F., Fouilloux, A., Brioude, J., Philipp, A., Seibert, P., and Stohl, A.: The Lagrangian particle dispersion model FLEXPART version 10.4, Geosci. Model Dev., 12, 4955–4997, https://doi.org/10.5194/gmd-12-4955-2019, 2019.
Pruppacher, H. R. and Klett, J. D.: Microphysics of Clouds and Precipitation, 2nd edn., Springer, Dordrecht, Netherlands, ISBN 978-0-7923-4211-3, ISBN 978-0-306-48100-0, https://doi.org/10.1007/978-0-306-48100-0, 2010.
Raatikainen, T., Brus, D., Hyvärinen, A.-P., Svensson, J., Asmi, E., and Lihavainen, H.: Black carbon concentrations and mixing state in the Finnish Arctic, Atmos. Chem. Phys., 15, 10057–10070, https://doi.org/10.5194/acp-15-10057-2015, 2015.
Raatz, W. E. and Shaw, G. E.: Long-range tropospheric transport of pollution aerosols into the Alaskan Arctic, J. Appl. Meteorol. Clim., 23, 1052–1064, 1984.
Rosenfeld, D. and Ulbrich, C. W.: Cloud Microphysical Properties, Processes, and Rainfall Estimation Opportunities, Meteor. Mon., 30, 237–237, https://doi.org/10.1175/0065-9401(2003)030<0237:CMPPAR>2.0.CO;2, 2003.
Rosenfeld, D., Sherwood, S., Wood, R., and Donner, L.: Climate effects of aerosol-cloud interactions, Science, 343, 379–380, https://doi.org/10.1126/science.1247490, 2014.
Seibert, P. and Frank, A.: Source-receptor matrix calculation with a Lagrangian particle dispersion model in backward mode, Atmos. Chem. Phys., 4, 51–63, https://doi.org/10.5194/acp-4-51-2004, 2004.
Sherwood, S., Webb, M. J., Annan, J. D., Armour, K. C., Forster, P. M., Hargreaves, J. C., Hegerl, G., Klein, S. A., Marvel, K. D., Rohling, E. J., Watanabe, M., Andrews, T., Braconnot, P., Bretherton, C. S., Foster, G. L., Hausfather, Z., von der Heydt, A. S., Knutti, R., Mauritsen, T., Norris, J. R., Proitosescu, C., Rugenstein, M., Schmidt, G. A., Tokarska, K. B., and Zelinka, M. D.: An assessment of Earth's climate sensitivity using multiple lines of evidence, Rev. Geophys., 58, e2019RG000678, https://doi.org/10.1029/2019RG000678, 2020.
Shupe, M. D., Rex, M., Blomquist, B., Persson, P. O. G., Schmale, J., Uttal, T., Althausen, D., Angot, H., Archer, S., Bariteau, L., Beck, I., Bilberry, J., Bucci, S., Buck, C., Boyer, M., Brasseur, Z., Brooks, I. M., Calmer, R., Cassano, J., Castro, V., Chu, D., Costa, D., Cox, C. J., Creamean, J., Crewell, S., Dahlke, S., Damm, E., de Boer, G., Deckelmann, H., Dethloff, K., Dütsch, M., Ebell, K., Ehrlich, A., Ellis, J., Engelmann, R., Fong, A. A., Frey, M. M., Gallagher, M. R., Ganzeveld, L., Gradinger, R., Graeser, J., Greenamyer, V., Griesche, H., Griffiths, S., Hamilton, J., Heinemann, G., Helmig, D., Herber, A., Heuzé, C., Hofer, J., Houchens, T., Howard, D., Inoue, J., Jacobi, H.-W., Jaiser, R., Jokinen, T., Jourdan, O., Jozef, G., King, W., Kirchgaessner, A., Klingebiel, M., Krassovski, M., Krumpen, T., Lampert, A., Landing, W., Laurila, T., Lawrence, D., Lonardi, M., Loose, B., Lüpkes, C., Maahn, M., Macke, A., Maslowski, W., Marsay, C., Maturilli, M., Mech, M., Morris, S., Moser, M., Nicolaus, M., Ortega, P., Osborn, J., Pätzold, F., Perovich, D. K., Petäjä, T., Pilz, C., Pirazzini, R., Posman, K., Powers, H., Pratt, K. A., Preußer, A., Quéléver, L., Radenz, M., Rabe, B., Rinke, A., Sachs, T., Schulz, A., Siebert, H., Silva, T., Solomon, A., Sommerfeld, A., Spreen, G., Stephens, M., Stohl, A., Svensson, G., Uin, J., Viegas, J., Voigt, C., von der Gathen, P., Wehner, B., Welker, J. M., Wendisch, M., Werner, M., Xie, Z. Q., Yue, F.: Overview of the MOSAiC expedition: Atmosphere, Elementa: Science of the Anthropocene, 10, 00060, https://doi.org/10.1525/elementa.2021.00060, 2022.
Sipilä, M., Sarnela, N., Neitola, K., Laitinen, T., Kemppainen, D., Beck, L., Duplissy, E.-M., Kuittinen, S., Lehmusjärvi, T., Lampilahti, J., Kerminen, V.-M., Lehtipalo, K., Aalto, P. P., Keronen, P., Siivola, E., Rantala, P. A., Worsnop, D. R., Kulmala, M., Jokinen, T., and Petäjä, T.: Wintertime subarctic new particle formation from Kola Peninsula sulfur emissions, Atmos. Chem. Phys., 21, 17559–17576, https://doi.org/10.5194/acp-21-17559-2021, 2021.
Small, J. D., Chuang, P. Y., Feingold, G., and Jiang, H.: Can aerosol decrease cloud lifetime?, Geophys. Res. Lett., 36, L16806, https://doi.org/10.1029/2009GL038888, 2009.
Solomon, A. and Shupe, M. D.: A Case Study of Airmass Transformation and Cloud Formation at Summit, Greenland, J. Atmos. Sci., 76, 3095–3113, https://doi.org/10.1175/JAS-D-19-0056.1, 2019.
Stohl, A., Forster, C., Frank, A., Seibert, P., and Wotawa, G.: Technical note: The Lagrangian particle dispersion model FLEXPART version 6.2, Atmos. Chem. Phys., 5, 2461–2474, https://doi.org/10.5194/acp-5-2461-2005, 2005.
Torres-Delgado, E., Baumgardner, D., and Mayol-Bracero, O. L.: Measurement report: Impact of African aerosol particles on cloud evolution in a tropical montane cloud forest in the Caribbean, Atmos. Chem. Phys., 21, 18011–18027, https://doi.org/10.5194/acp-21-18011-2021, 2021.
Tunved, P., Hansson, H. C., Kerminen, V. M., Strom, J., Dal Maso, M., Lihavainen, H., Viisanen, Y., Aalto, P. P., Komppula, M., and Kulmala, M.: High natural aerosol loading over boreal forests, Science, 312, 261–263, https://doi.org/10.1126/science.1123052, 2006.
Twohy, C. H., Petters, M. D., Snider, J. R., Stevens, B., Tahnk, W., Wetzel, M., Russell, L., and Burnet, F.: Evaluation of the aerosol indirect effect in marine stratocumulus clouds: Droplet number, size, liquid water path, and radiative impact, J. Geophys. Res., 110, D08203, https://doi.org/10.1029/2004JD005116, 2005.
Twomey, S.: The Influence of Pollution on the Shortwave Albedo of Clouds, J. Atmos. Sci., 34, 1149–1152, https://doi.org/10.1175/1520-0469(1977)034<1149:TIOPOT>2.0.CO;2, 1977.
Vaisala Oyj: Ceilometer CT25K: User's Guide, Vaisala Oyj, Vantaa, Finland, 2002.
Virkkula, A., Hillamo, R. E., Kerminen, V.-M., and Stohl, A.: The influence of Kola Peninsula, continental European and marine sources on the number concentrations and scattering coefficients of the atmospheric aerosol in Finnish Lapland, Boreal Environ. Res., 2, 317–336, ISSN 1239-6095, 1997.
Wandinger, U., Apituley, A., Blumenstock, T., Bukowiecki, N., Cammas, J.-P., Connolly, P., De Mazière, M., Dils, B., Fiebig, M., Freney, E., Gallagher, M., Godin-Beekmann, S., Goloub, P., Gysel, M., Haeffelin, M., Hase, F., Hermann, M., Herrmann, H., Jokinen, T., Komppula, M., Kubistin, D., Langerock, B., Lihavainen, H., Mihalopoulos, N., Laj, P., Lund Myhre, C., Mahieu, E., Mertes, S., Möhler, O., Mona, L., Nicolae, D., O'Connor, E., Palm, M., Pappalardo, G., Pazmino, A., Petäjä, T., Philippin, S., Plass-Duelmer, C., Pospichal, B., Putaud, J.-P., Reimann, S., Rohrer, F., Russchenberg, H., Sauvage, S., Sellegri, K., Steinbrecher, R., Stratmann, F., Sussmann, R., Van Pinxteren, D., Van Roozendael, M., Vigouroux, C., Walden, C., Wegene, R., and Wiedensohler, A.: ACTRIS-PPP Deliverable D5.1: Documentation on technical concepts and requirements for ACTRIS Observational Platforms, https://www.actris.eu/sites/default/files/Documents/ACTRIS PPP/Deliverables/ACTRIS PPP_WP5_D5 1_Documentation on technical concepts and requirements for ACTRIS observational platforms.pdf (last access: 21 January 2023), 2018.
Wang, Y., Zheng, X., Dong, X., Xi, B., Wu, P., Logan, T., and Yung, Y. L.: Impacts of long-range transport of aerosols on marine-boundary-layer clouds in the eastern North Atlantic, Atmos. Chem. Phys., 20, 14741–14755, https://doi.org/10.5194/acp-20-14741-2020, 2020.
Wendisch, M., Macke, A., Ehrlich, A., Lüpkes, C., Mech, M., Chechin, D., Dethloff, K., Velasco, C. B., Bozem, H., Brückner, M., Clemen, H., Crewell, S., Donth, T., Dupuy, R., Ebell, K., Egerer, U., Engelmann, R., Engler, C., Eppers, O., Gehrmann, M., Gong, X., Gottschalk, M., Gourbeyre, C., Griesche, H., Hartmann, J., Hartmann, M., Heinold, B., Herber, A., Herrmann, H., Heygster, G., Hoor, P., Jafariserajehlou, S., Jäkel, E., Järvinen, E., Jourdan, O., Kästner, U., Kecorius, S., Knudsen, E. M., Köllner, F., Kretzschmar, J., Lelli, L., Leroy, D., Maturilli, M., Mei, L., Mertes, S., Mioche, G., Neuber, R., Nicolaus, M., Nomokonova, T., Notholt, J., Palm, M., van Pinxteren, M., Quaas, J., Richter, P., Ruiz-Donoso, E., Schäfer, M., Schmieder, K., Schnaiter, M., Schneider, J., Schwarzenböck, A., Seifert, P., Shupe, M. D., Siebert, H., Spreen, G., Stapf, J., Stratmann, F., Vogl, T., Welti, A., Wex, H., Wiedensohler, A., Zanatta, M., and Zeppenfeld, S.: The Arctic Cloud Puzzle: Using ACLOUD/PASCAL Multiplatform Observations to Unravel the Role of Clouds and Aerosol Particles in Arctic Amplification, B. Am. Meteorol. Soc., 100, 841–871, https://doi.org/10.1175/BAMS-D-18-0072.1, 2019.
Xue, Y., Wang, L., and Grabowski, W. W.: Growth of Cloud Droplets by Turbulent Collision–Coalescence, J. Atmos. Sci., 65, 331–356, https://doi.org/10.1175/2007JAS2406.1, 2008.
Zhao, C. F., Xie, S. C., Klein, S. A., Protat, A., Shupe, M. D., McFarlane, S. A., Comstock, J. M., Delanoe, J., Deng, M., Dunn, M., Hogan, R. J., Huang, D., Jensen, M. P., Mace, G. G., McCoy, R., O'Connor, E. J., Turner, D. D., and Wang, Z. E.: Toward understanding of differences in current cloud retrievals of ARM ground-based measurements, J. Geophys. Res.-Atmos., 117, D10206, https://doi.org/10.1029/2011jd016792, 2012.