the Creative Commons Attribution 4.0 License.
the Creative Commons Attribution 4.0 License.
 | 22 Feb 2023
Microphysical processes of super typhoon Lekima (2019) and their impacts on polarimetric radar remote sensing of precipitation
Yabin Gou
Hong Zhu
Lulin Xue
The complex precipitation microphysics associated with super typhoon Lekima (2019) and its potential impacts on the consistency of multi-source datasets and radar quantitative precipitation estimation were disentangled using a suite of in situ and remote sensing observations around the waterlogged area in the groove windward slope (GWS) of Yandang Mountain (YDM) and Kuocang Mountain, China. The main findings include the following: (i) the quality control processing for radar and disdrometers, which collect raindrop size distribution (DSD) data, effectively enhances the self-consistency between radar measurements, such as radar reflectivity (ZH), differential reflectivity (ZDR), and the specific differential phase (KDP), as well as the consistency between radar, disdrometers, and gauges. (ii) The microphysical processes, in which breakup overwhelms coalescence in the coalescence–breakup balance of precipitation particles, noticeably make radar measurements prone to be breakup-dominated in radar volume gates, which accounts for the phenomenon where the high number concentration rather than the large size of drops contributes more to a given attenuation-corrected ZH () and the significant deviation of attenuation-corrected ZDR () from its expected values () estimated by DSD-simulated ZDR–ZH relationships. (iii) The twin-parameter radar rainfall estimates based on measured ZH () and ZDR (), and their corrected counterparts and , i.e., R(, ) and R(, ), both tend to overestimate rainfall around the GWS of YDM, mainly ascribed to the unique microphysical process in which the breakup-dominated small-sized drops above transition to the coalescence-dominated large-sized drops falling near the surface. (iv) The improved performance of R(, ) is attributed to the utilization of , which equals physically converting breakup-dominated measurements in radar volume gates to their coalescence-dominated counterparts, and this also benefits from the better self-consistency between , , and KDP, as well as their consistency with the surface counterparts.
- Article
(30847 KB) - Full-text XML
- BibTeX
- EndNote


Weather radars form the cornerstone of national weather warnings and forecast infrastructure in many countries. Doppler radar networks play an indispensable role in modern meteorological and hydrological applications, such as quantitative precipitation estimation (QPE), in support of the application of some hydrological models for water resource management, especially during high-impact weather events in urban environments (Chandrasekar et al., 2018; Cifelli et al., 2018; Chen and Chandrasekar, 2018). Although technological advances such as dual-polarization have tremendously improved weather radar applications in hydrometeorology remote sensing, it is still a challenge to incorporate complex precipitation dynamics and microphysics in an adaptive manner to optimize the quantitative applications of polarimetric radar measurements, including horizontal reflectivity ZH, differential reflectivity ZDR, copolar correlation coefficient ρHV, differential propagation phase ΦDP, and its range derivative KDP (specific differential phase). Traditional utilization of these measurements has only been able to extract some information on complex spatiotemporal precipitation variability.
In general, three main factors contribute to radar QPE uncertainties: radar measurement error, parameterization error of various radar–rain rate (R) relationships, and random error. In practical applications, it is crucial to consider these three factors as a whole to ensure radar rainfall estimates approximate the surface rainfall truth as much as possible. Among conventional radar QPE algorithms, those developed based on ZH measurements are typical and are still in use today. For instance, an earlier version of the radar QPE algorithm in the National Oceanic and Atmospheric Administration (NOAA) Multi-Radar/Multi-Sensor System (MRMS) and its refined version both utilize multi-radar hybrid ZH to derive the radar-based rainfall field (Zhang et al., 2011, 2016). The recent update of MRMS further incorporated specific attenuation (AH) and KDP to enhance the ZH-based algorithm (Wang et al., 2019; Ryzhkov et al., 2022), and such an update can benefit from (i) the insensitivity of AH to raindrop size distribution (DSD) variability (Ryzhkov et al., 2014); (ii) KDP is a better indicator of rain rate and liquid water content (LWC, g m−3) than ZH, since KDP connects more tightly to the precipitation particle size distribution; and (iii) R(KDP) and R(AH) inherit the immunity of ΦDP to miscalibration, attenuation, partial beam blockage, and wet radome effects (Park et al., 2005; Ryzhkov et al., 2014, 2022), which are hard to address when using ZH for radar QPE, especially at higher frequencies such as C- and X-bands (Park et al., 2005; Matrosov, 2010; Frasier et al., 2013). However, since AH and α are simultaneously derived, R(AH) partly inherits the sensitivity of α to temperature (Ryzhkov et al., 2014), which occurs with the ascending altitude of the propagation of one radar beam. Multi-parameter radar QPE algorithms further integrate ZDR with ZH, KDP, or AH to infer more information about raindrop shape, such as the double-measurement algorithm R(ZH, ZDR), R(KDP, ZDR), and R(AH, ZDR) and the triple-measurement radar QPE algorithm as R(ZH, ZDR, KDP) (Matrosov, 2010; Gosset et al., 2010; Schneebeli and Berne, 2012; Keenan et al., 2001; Chen et al., 2017; Gou et al., 2019b), but these algorithms all assume that ZDR measurements are well calibrated and attenuation-corrected (Ryzhkov et al., 2005; Bringi et al., 2010).
In addition to radar measurements, disdrometer and rain gauge data are often used to determine the optimal parameters of radar-based QPE algorithms (Lee and Zawadzki, 2005; Tokay et al., 2005). For example, the MRMS system utilizes long-term ZH and gauge rainfall measurements to obtain climatological Z–R relationships for each precipitation type (Zhang et al., 2011, 2016). In Gou et al. (2018, 2020), rain gauge measurements are used to dynamically adjust Z–R relationships to reflect the microphysical evolutions of precipitation systems. Nevertheless, the accuracy of meteorological gauge rainfall recordings is usually configured as 0.1 mm, and rain gauges may record less rainfall than reality due to debris blockage (tree leaves, insects, etc.) and the quick spinning of tipping buckets in a heavy shower situation. In addition, the surface wind may hinder some raindrops from falling into the tipping bucket, and the mechanical failures of the tipping bucket will record abnormally high or low rainfall, which introduces significant errors to the gauge network. Similarly, disdrometer measurements can be affected by strong winds and mixed-phase hydrometeors falling through the laser sampling area of the disdrometer, resulting in degraded quality of the DSD recordings (Tokay and Bashor, 2010). Since the DSD data collected by disdrometers are indispensable and sometimes are the only resources that can be used for precipitation microphysical analysis and the establishment of polarimetric radar rainfall relationships, meticulous quality control (QC) must be conducted on the disdrometer measurements (Friedrich et al., 2013).
Another issue that is important but rarely considered in radar QPE is the changing microphysics that occurs during the falling processes of precipitation particles between radar volume gates and surface ground, which is often indicated by inconsistent radar observations with their surface counterparts. The ZH measurements in the melting layer (ML) of a stratiform rain system, which features falling melting snowflakes or ice crystals, usually need to be corrected for subsequent rainfall retrievals, especially when little rain is reported on the ground (Chen et al., 2020). A severe updraft may introduce a large ZH and ZDR column (Snyder et al., 2015; Carlin et al., 2017), while the surface rain gauge may record little or time-lagged rainfall, which is frequently perceived in the front of a squall line system or wind gust system. In addition, the contamination of mixed-phase hydrometeor particles on KDP and AH may lead to R(KDP) and R(AH) being overestimated (Gou et al., 2019b), and the falling wet hailstones may also contaminate radar-measured ZH, KDP, and AH (Donavon and Jungbluth, 2007; Ryzhkov et al., 2014), leading to an overestimated hotspot on the derived rainfall field if such contaminations are not well addressed.
The complex microphysical variations mentioned above may coexist in a large-scale precipitation system such as a typhoon.
Before the polarimetric update, the impacts of the coexisting precipitation types on the radar QPE can be exploited through the vertical profile of reflectivity (VPR, Xu et al., 2008; Zhang et al., 2011, 2016). During the landfall of typhoon Hakui (2012), the VPR characteristics of coexisting tropical, convective, and stratiform rain account for the spatial precipitation variability (Gou et al., 2014). Super typhoon Lekima (2019) was the first super typhoon that landed on the eastern coast of Zhejiang after the polarimetric radar update, which provided an opportunity to exploit more microphysical signatures of the typhoon. Lekima landed on the coastal area of Chengnan town in Wen Ling (WL) city at 17:45 UTC, 9 August 2019, and the maximum wind near its center was about 52 m s−1, which made it the strongest typhoon landing on the mainland of China in 2019. According to the statistics of the Chinese Meteorological Administration, Lekima was detained on land for 44 h; the affected area with rainfall measurements over 100 mm was about 361 000 km2 during this period, and 19 national meteorological stations broke their historical daily rainfall recordings. During landfall, high waves were stirred up along the coastline, as depicted in Fig. 1a, and the landslide in Fig. 1b blocked the river and temporarily formed a dike with a sudden rise of the water level of the river before the collapse of the landslide dike, resulting in 22 casualties around this area. Waterlogging submerged the road network and many buildings in the urban area of Wen Ling (WL), Lin Hai (LH), Yu Huan (YH), and Xian Ju (XJ) in Taizhou (TZ) city (see Fig. 1c–f). Millions of people were evacuated from TZ city or were trapped in the disaster area. A total of 57 casualties were reported due to the landslides, floods, and waterlogging during the landfall of Lekima.
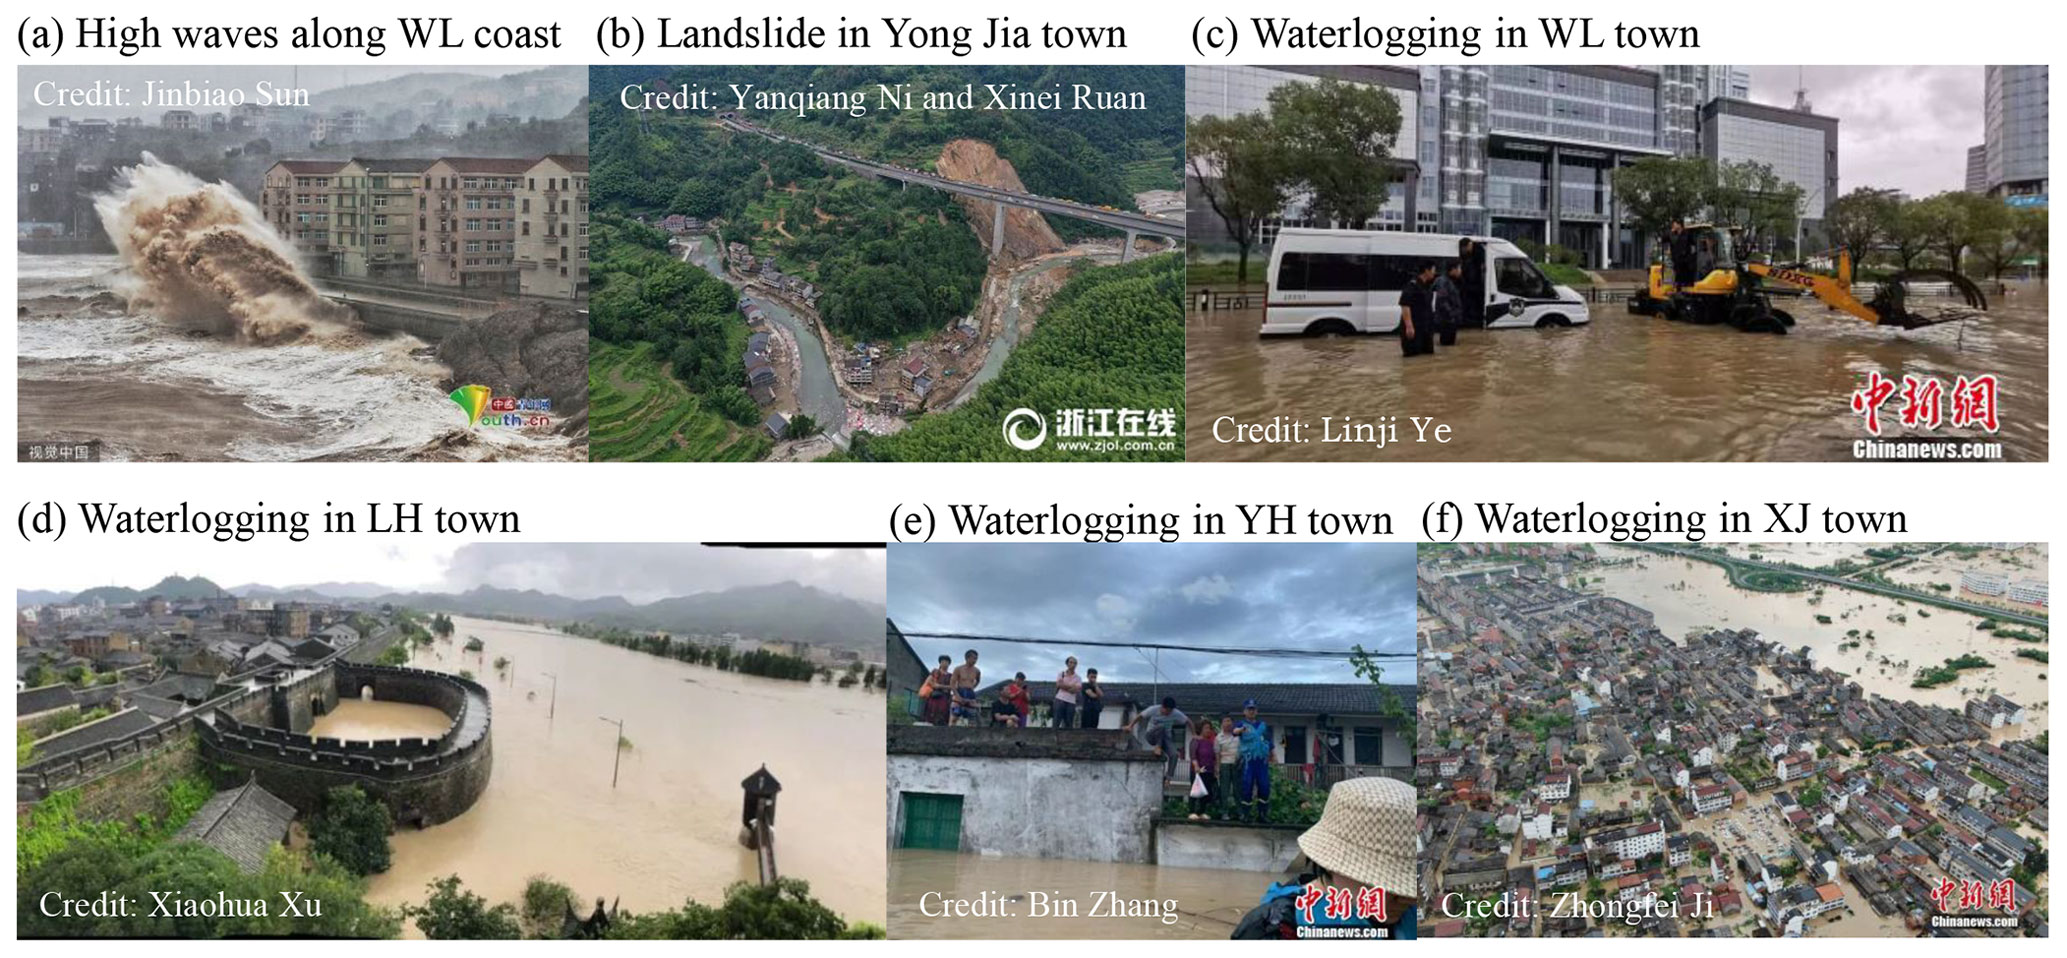
Figure 1The disastrous situation in WZ and TZ due to the landfall of super typhoon Lekima: (a) high waves along the Wen Ling (WL) coast of TZ city; (b) landslide in the northern mountain area of Yong Jia (YJ) in WZ city; (c–f) serious waterlogging in WL, Lin Hai (LH), Yu Huan (YH), and Xian Ju (XJ) town of TZ city. Photo (a) is available at http://picture.youth.cn/qtdb/201908/t20190810_12036586.htm (last access: 15 January 2023). Photo (b) is available at https://baijiahao.baidu.com/s?id=1641647981934061656&wfr=spider&for=pc (last access: 15 January 2023). Photo (c) is available at https://new.qq.com/omn/20190810/20190810A0FZUT00.html?pc (last access: 15 January 2023). Photo (d) is available at https://new.qq.com/omn/20190828/20190828A0KGLT00.html (last access: 15 January 2023). Photo (e) is available at https://www.newssz.com/sz/2019/0818/94241-1/ (last access: 15 January 2023). Photo (f) is available at https://m.chinanews.com/wap/detail/undefined/zw/8925613.shtml (last access: 15 January 2023).
This paper investigates the microphysical characteristics of the typhoon-induced storm after its landfall, using observations from an S-band polarimetric radar deployed at Wenzhou (hereafter referred to as WZ-SPOL), six Thies disdrometers, and a local rain gauge network around the disaster area. So far, the reason for the significant convective asymmetries in the concentric eyewalls before its landfall has been ascribed to the phase locking of vortex Rossby waves (VRW), and the cloud and precipitation microphysics caused by this phase-locking VRW-triggered asymmetric convection have been revealed (Dai et al., 2021; Huang et al., 2022), mainly based on the WZ-SPOL radar and another Doppler weather radar in TZ city. The DSD differences in the eyewall and spiral rainbands based on surface disdrometer measurements have also been demonstrated (Bao et al., 2020). However, the microphysical processes inherent in Lekima after its landfall have not been thoroughly investigated.
The novel contributions of this paper are summarized as follows: (1) an enhanced QC procedure for disdrometer measurement is developed and analyzed through cross-comparison with rain gauge and WZ-SPOL radar measurements. (2) The microphysical process with overwhelming breakup over coalescence during the landfall of Lekima is revealed based on radar and surface disdrometers. (3) The impacts of dominant breakup and coalescence on radar QPE are investigated through an R(ZH, ZDR) estimator, and this algorithm integrates the expected ZDR (i.e., ) estimated from attenuation-corrected ZH (i.e., ) to mitigate the negative effects of the unique microphysical process, in which dominant breakup in the air transitioned to dominant coalescence near the surface around the GWS of YDM.
The remainder of this article is organized as follows: Sect. 2 introduces the study domain, hardware configuration, and data processing methodologies. Section 3 details the precipitation microphysics associated with Lekima (2019). The impacts of dominant collision–breakup or collision–coalescence on radar QPE performance are also quantified in Sect. 3. Section 4 summarizes the main findings of this study and suggests future directions in implementing this work in an operational environment.
2.1 Study domain
As shown in Fig. 2a, this paper focused on the north side of WZ city and the south side of TZ city. These two cities are both regional central cities of eastern China: WZ is an important trade city with more than nine million residents and an urban popularity density of 2900 km−2. TZ is an important seaport city in southeastern China with six million residents and an urban popularity density of 688 km−2. Historical typhoons have landed on the coastlines of these two cities, indicating the necessity and importance of monitoring typhoons coming into this area. With this aim, the S-band weather radar in WZ was upgraded to a polarimetric radar system in 2019 to enhance its precipitation-monitoring capability. The WZ-SPOL radar is deployed on a hill (735 m) near the coastline, as depicted in Fig. 2a. It sufficiently covers the flood and waterlogging disaster area caused by the landfall of Lekima. Two mountains lie between WZ and TZ, Kuocang Mountain (KCM) and Yandang Mountain (YDM). Although the mountainous terrain causes no serious beam blockage issues, the vertical gap between the radar beam center and the surface enlarges with ascending volume gates, as depicted in Fig. 2c. In addition, KCM and YDM both feature a typical groove topography, as indicated by the dashed lines in Fig. 2a, which benefits the assembling and uplifting of water vapor on the lower atmospheric layers.
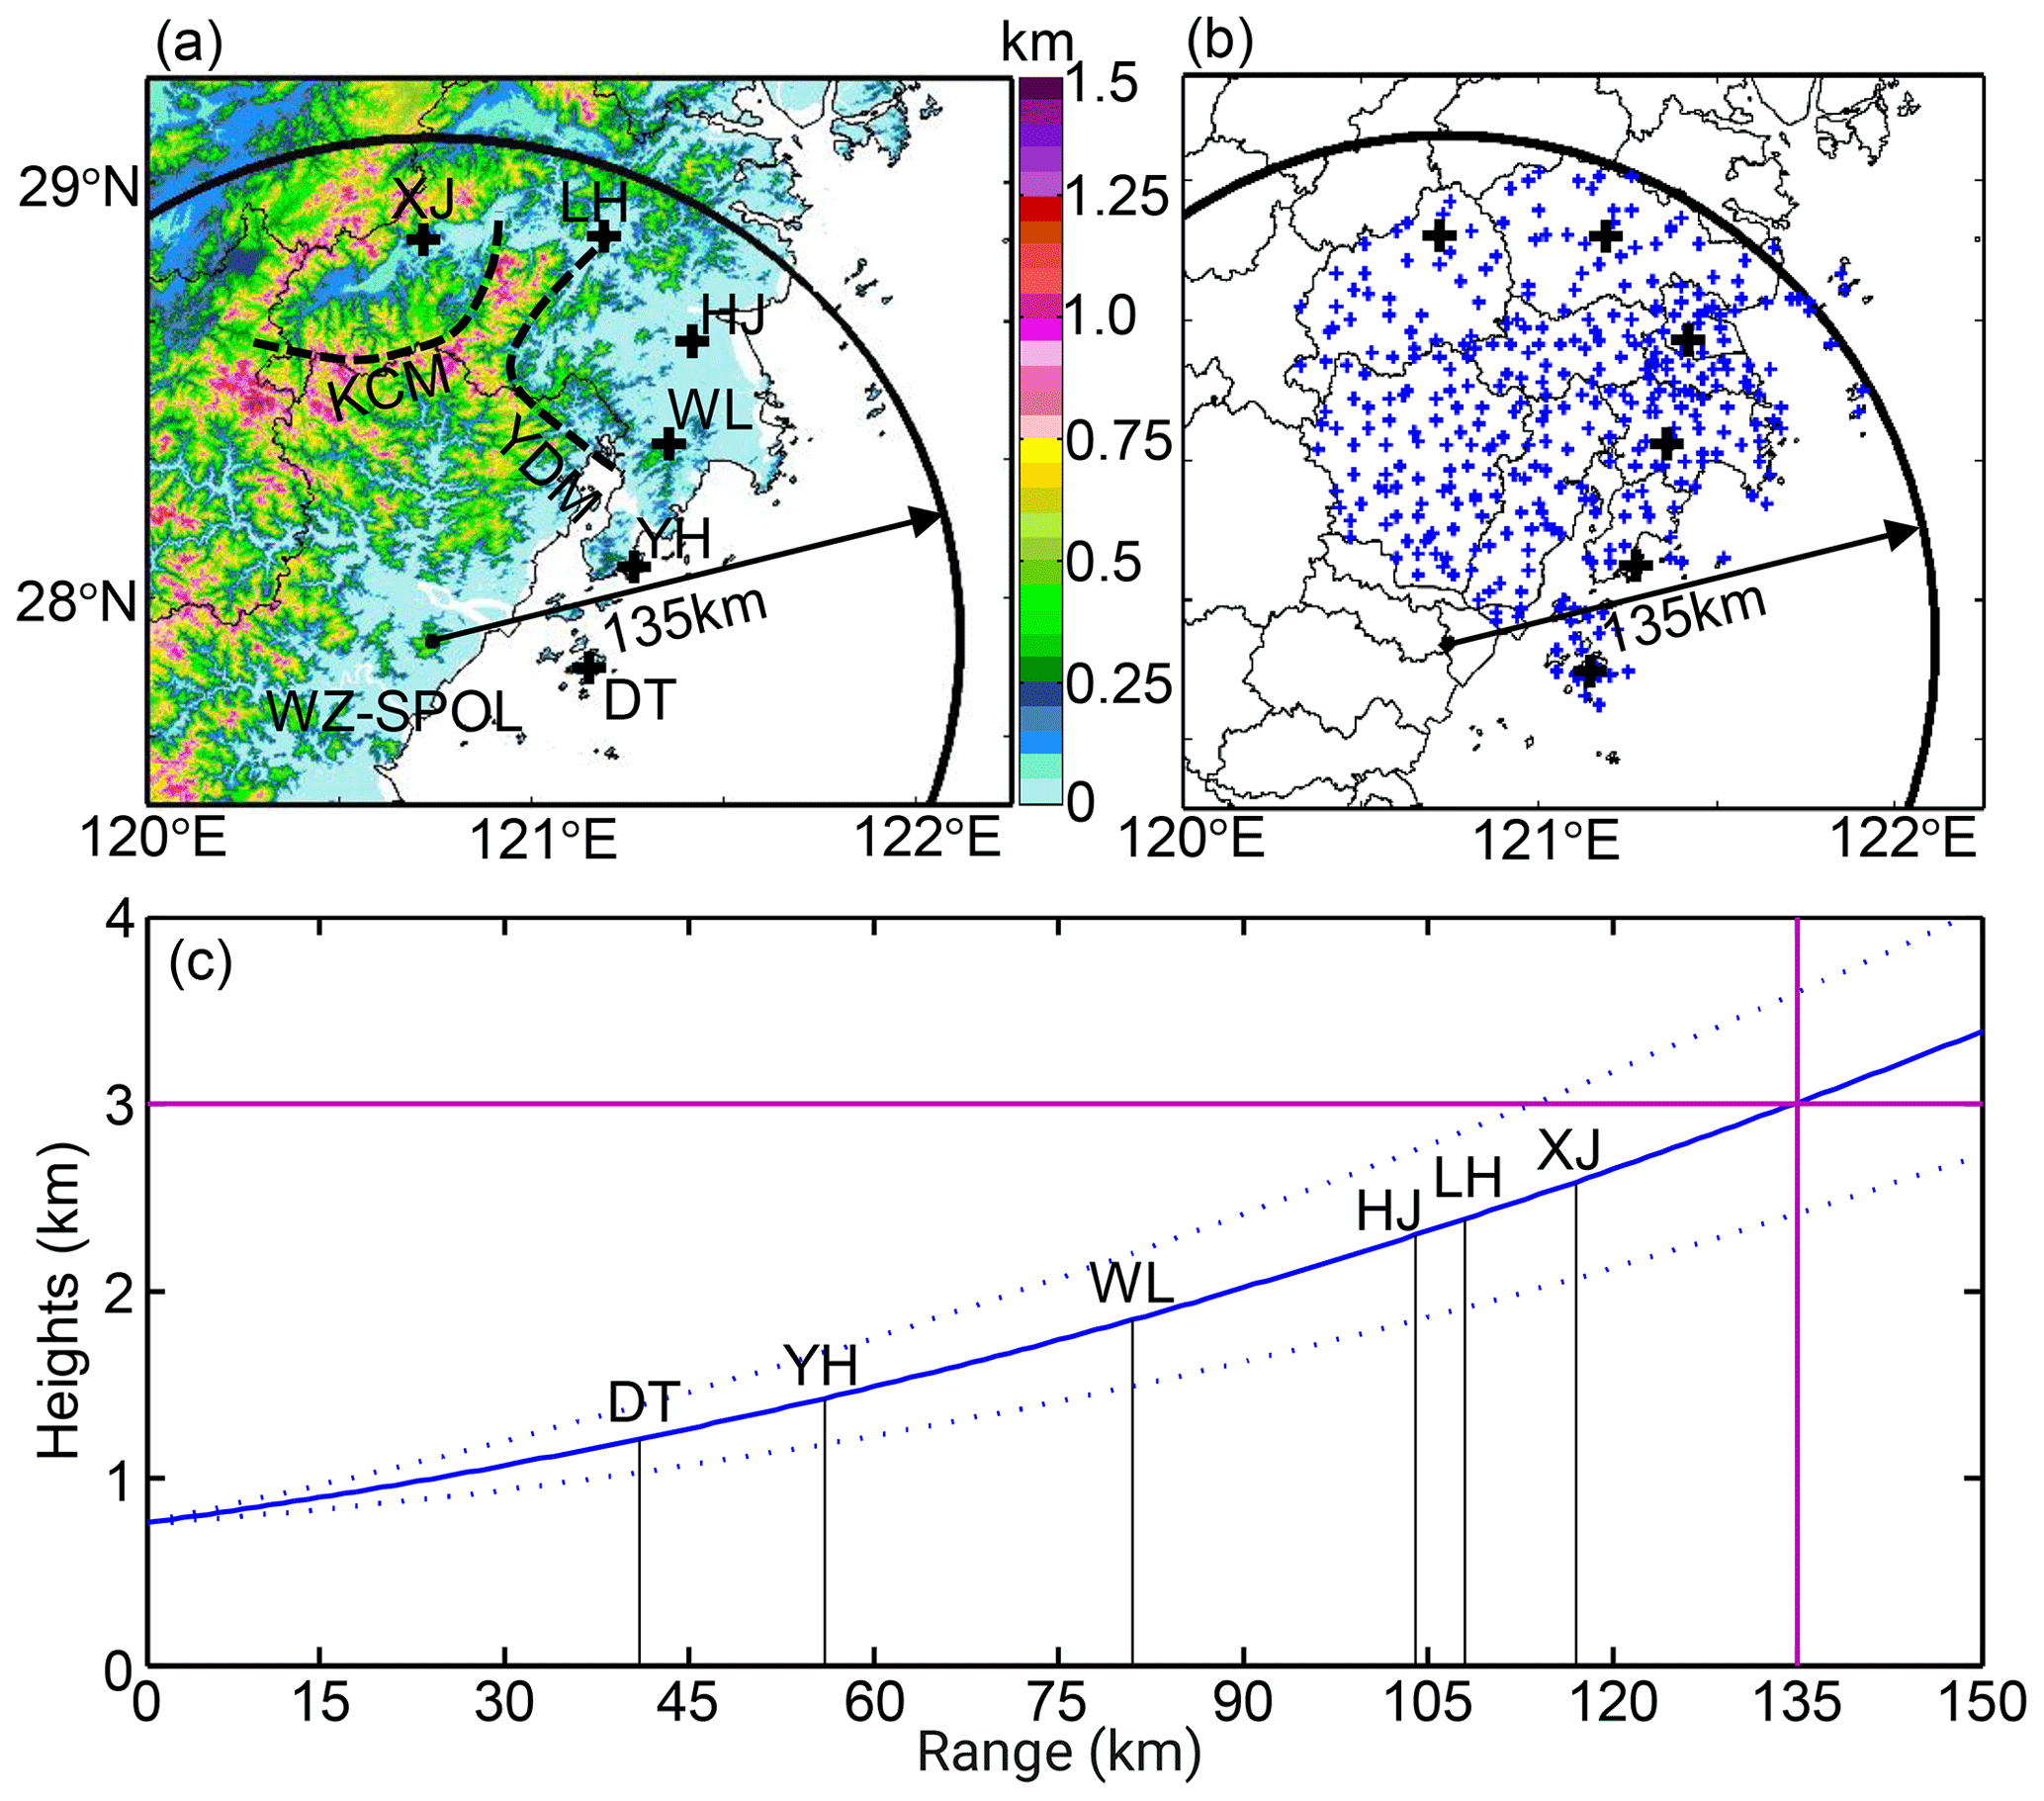
Figure 2(a) Terrain elevation and disdrometer network around the WZ-SPOL radar (735 m), (b) rain gauge network around the disaster center area, and (c) the height of the radar beam shown as a function of measurement range in standard atmospheric conditions. The two dashed lines refer to the GWS of YDM and KCM. The black + in (a) and (b) refer to six national meteorological sites, and the blue + in (b) refers to regional meteorological sites. The solid and dotted blue curves in (c) refer to the height of the radar beam center and its radius boundaries, the vertical black lines mark the range distance of national meteorological stations (heights < 0.1 km) from the radar, and the two orthogonal purple lines refer to the altitude of 3 km and range of 135 km.
Six Thies laser-optical disdrometers have been deployed at the national meteorological stations around the target area since 2017 (see Figs. 2a and 1b). These include Xian Ju (XJ), Lin Hai (LH), Wen Ling (WL), Hong Jia (HJ), Yu Huan (YH), and Dong Tou (DT), and they provide particle size and terminal velocity (size–velocity) pairs with a 1 min time resolution. These size–velocity pairs are utilized to calculate rainfall intensity and to simulate dual-polarization radar measurements near the surface.
In addition, 356 tipping-bucket rain gauge stations (see Fig. 2b) are uniformly deployed around 10 towns that have suffered from landslide and waterlogging disasters within the coverage of a radius of 135 km from the WZ-SPOL radar. The time resolution of the gauge measurements is also configured as 1 min; if hourly gauge measurements are temporarily interrupted due to network issues, such as transmission congestion, these interrupted recordings will not be utilized. If we suppose that a gauge rainfall recording exceeds 1 mm, but the ratio between hourly gauge rainfall and any hourly radar estimates exceeds 10 (or less than 0.1 for the intercomparison), then this gauge measurement is suspected to be falsely reported and will not be used. This ratio (10, suggested in Marzen, 2004) is large enough to eliminate significant outliers but keep most other valuable gauge rainfall recordings.
2.2 Radar configuration and data processing
The WZ-SPOL radar adopts the simultaneous horizontal and vertical polarization mode. For the routine operations, the standard volume coverage pattern (VCP21) is configured, which has elevation angles including 0.5, 1.5, 2.4, 3.3, 4.3, 6.0, 9.9, 14.5, and 19.5∘. The azimuthal radial resolution is set as 0.95∘, and the range gate resolution is configured as 250 m for all elevation angles. Radar-measured ZH, ZDR, ρHV, as well as radial velocity (VR) and ΨDP, are archived in the radar data acquisition (RDA) system and then transferred to the radar products generation system to produce some predefined standard radar products. QC processing for WZ-SPOL radar data is performed using the following steps:
- i.
Ground clutter (GC) identification and mitigation.
Two parts are included in this step. The clutter mitigation decision (CMD) algorithm (Hubbert et al., 2009) has been integrated into the RDA software to filter the ground clutters in real-time, but some residual static ground clutters (RSGC) still exist in the WZ-SPOL radar measurements at the 0.5∘ elevation angle. To further eliminate the RSGC, the WZ-SPOL radar ZH measurements on the 0.5∘ elevation angle from August 2019 are utilized. The max number (Nmax) of the pixel with ZH > 0 dBZ within 55 km from the WZ-SPOL radar is 6981, and the observation number (Nobs) of each pixel within this range is normalized by dividing Nmax. Then, an RSGC statistical map is derived, as shown in Fig. 3a, representing the relative frequency (freq. % of ZH > 0 dBZ) within the coverage of the WZ-SPOL radar. In this map, the pixels with freq. > 50 % are deemed to be contaminated by the RSGC, and they form an RSGC mask in Fig. 3b to eliminate RSGC-contaminated ZH and ZDR at the 0.5∘ elevation angle of the WZ-SPOL radar.
- ii.
ΨDP processing.
A nine-gate smoothing is first carried out to suppress the noise signals along the ΨDP range profile. Then, a procedure is executed to correct the aliased ΨDP based on the standard deviation of ΨDP in nine consecutive range gates (Wang and Chandrasekar, 2009), and 360∘ are added to the aliased ΨDP to guarantee a monotonically increasing ΨDP range profile. In addition, the iterative filtering method in Hubbert and Bringi (1995) is used to filter the backscatter differential phase, and a zero-started filtered ΦDP () range profile is obtained by removing the initial phase of ΦDP. The range profile is utilized to estimate KDP through a linear fitting approach (Wang and Chandrasekar, 2009) with an additional non-negative constraint on KDP.
- iii.
Attenuation correction for ZH.
The ZPHI approach proposed by Bringi et al. (2001) is extended for correcting S-band ZH measurements:
where and denote the measured and attenuation-corrected reflectivity, respectively; ΦDP refers to the filtered differential phase; is a reconstructed differential phase through the ZPHI processing chain with an optimal coefficient α iteratively searched in the range [0.01, 0.12] by step 0.01 until the cost function C(r0,rm) of the difference between ΦDP and in Eq. (1f) is minimized. The coefficient b is assumed to be 0.62 for the S-band (Ryzhkov et al., 2014).
The ZPHI approach utilizes and ΔΦDP in Eq. (1b) to calculate attenuation AH. Here, it should be noted that three constraints are imposed on the ZPHI processing chain to ensure its practical performance, including a non-negative constraint on AH, ρHV constraint on the range gate partitioning, and convergence constraint to avoid incorrect calculation termination (Gou et al., 2019a). Finally, is corrected to according to Eq. (1g).
- iv.
ZDR processing.
The ZDR offset is usually routinely obtained in zenith mode, with which near-zero ZDR is anticipated in light rain scenarios, and then this offset is fed back to the RDA system to ensure slight ZDR bias. Bringi et al. (2001) showed that all ZDR values at the far side of one radial profile are expected to approximate 0 dB if the “intrinsic” ZH is small enough (i.e., < 20 dBZ) and attenuation-corrected ZDR () should approximate to their along the whole radial profile; thus, appropriate ZDR bias adjustment may effectively help in such a ZDR approximation. In this process, near-zero is also anticipated for far-side volume gates containing ice crystals with dBZ. Here, the exponential ZDR–ZH relationship is established as Eq. (2a) based on the quality-controlled DSD datasets from all national meteorological stations (denoted as S0) detailed in Sect. 2.3 and the analysis in Sect. 3.1. Therein, ZH, ZDR, and KDP are simulated using the T-matrix method, assuming the raindrop aspect ratio in Brandes et al. (2002) at a temperature of 20 ∘C. Then, the differential attenuation factor (ADP) in Eq. (2b) is calculated by adjusting β to obtain according to Eq. (2c). The optimal β can be iteratively determined for ADP by minimizing the differences between and in Eq. (2d), along the whole radial range profile. Additional ΔZDR is also iteratively imposed on the whole range profile with a step of 0.1 dB to mitigate the residual ZDR bias caused by miscalibration or wet radome effects. Then, is corrected by Eq. (2c) to through ADP calculated by the optimal β. is utilized for the subsequent analysis and radar rainfall estimation:
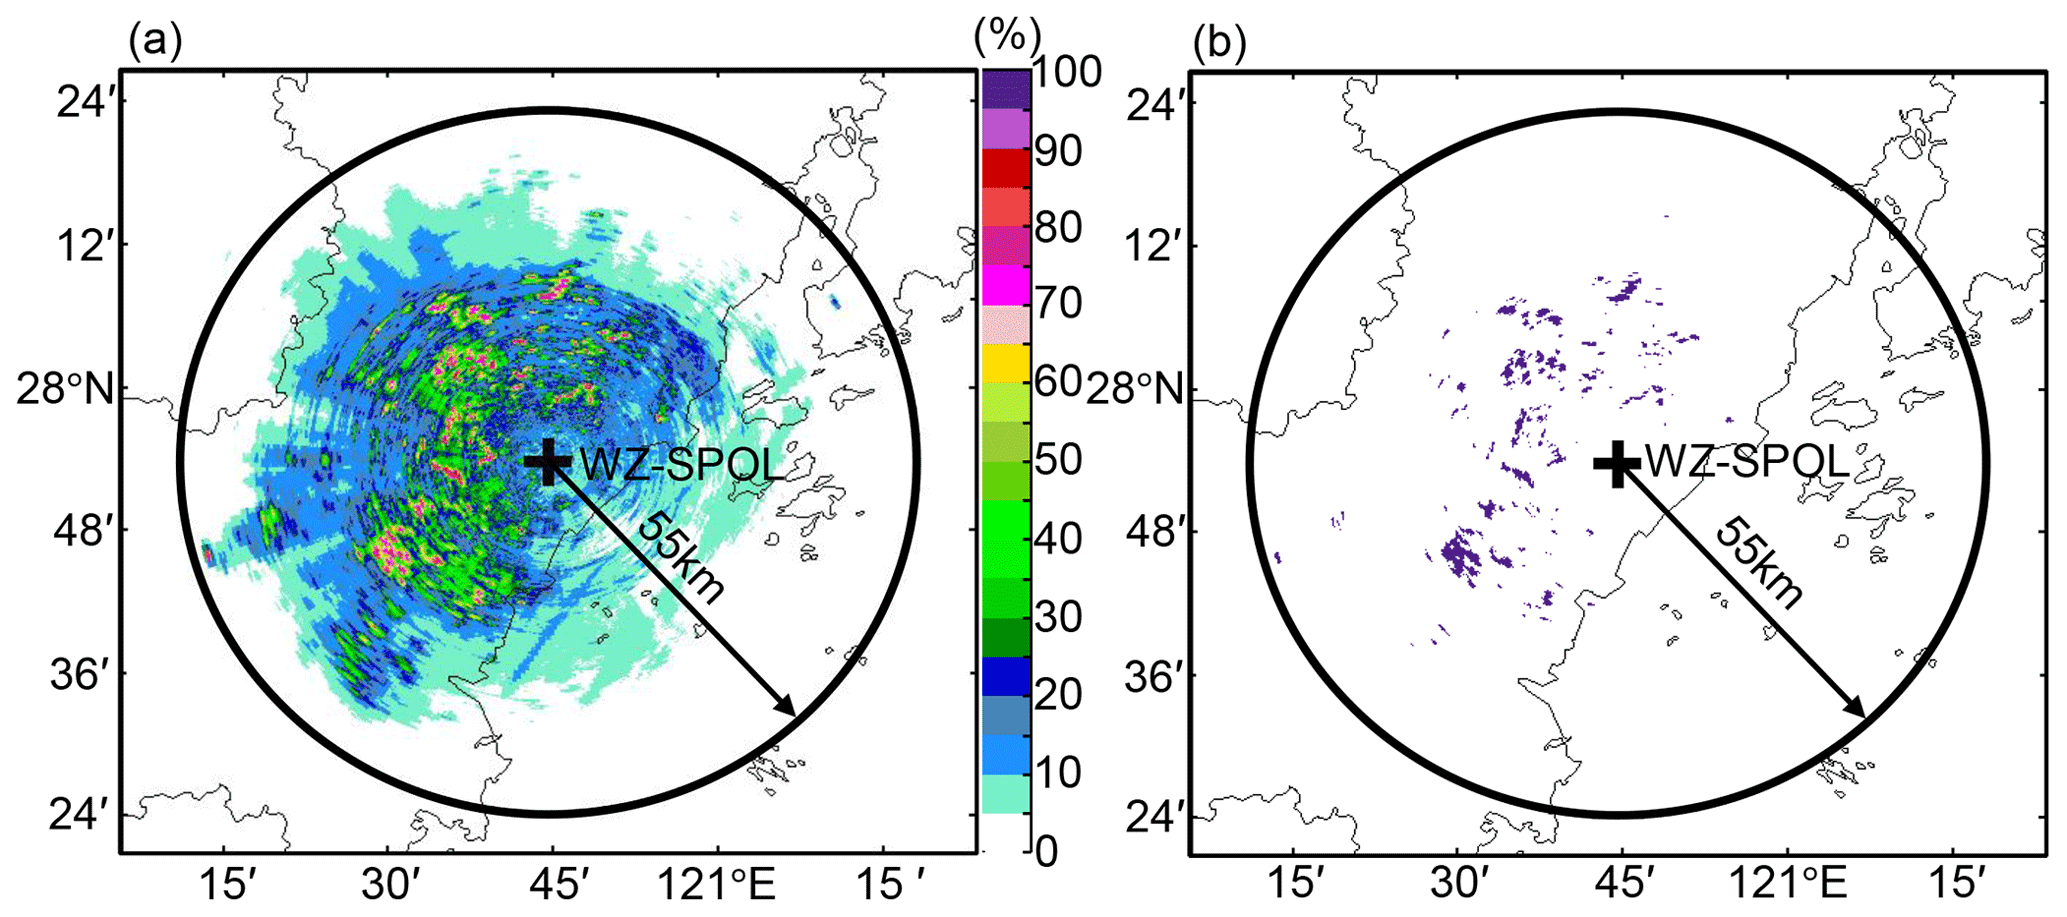
Figure 3(a) Statistics of pixels with ZH > 0 dBZ within 55 km from the WZ-SPOL radar and (b) residual static ground clutter mask of the WZ-SPOL radar.
2.3 DSD data processing
The Thies disdrometer measurements configured with 1 min sampling intervals collected between 00:00 UTC, 9 August 2019, and 00:00 UTC, 11 August 2019, are utilized. These measurements were variously affected by the strong winds, with the hourly maximum wind speed exceeding 20 m s−1, as depicted in Fig. 4. Particularly, YH, WL, and DT suffered more seriously (> 40 m s−1) after 16:00 UTC, 9 August 2019. Theoretically, the size–velocity measurements of raindrops, which are recorded by disdrometers in pairs, should be uniformly distributed as in the drop velocity model in Beard (1977), which can be represented as
where Di is the diameter of the ith size class (diameter interval) and VB is estimated by Di. However, real velocity measurement (VM) of disdrometers may deviate seriously from VB due to the strong wind effects. For instance, many size–velocity pairs at all six stations are biased with VM < 0.5 VB and distributed in all predefined size classes; more deviated size–velocity pairs of WL, YH, and DT are featured with VM < 0.5 VB in Fig. 5d–f than in XJ, LH, and HJ in Fig. 5a–c, which can also be ascribed to high wind speeds. Consequently, these size–velocity pairs need to be preprocessed, and the QC procedure utilized hereafter includes the following three steps:
- i.
For wind-contaminated size–velocity pairs, if the VM of the ith size class is located inside [0.5 VB, 1.5 VB] (enclosed by the blue lines in Fig. 5), the size–velocity pairs are deemed to agree well with Eq. (3) and will be kept; the other outliers will be eliminated.
- ii.
For the potential hail (Di > 5 mm) and graupel (Di in [2 mm, 5 mm]), two size–velocity relationships listed in Friedrich et al. (2013) as
are selected to estimate the velocity of potential hail (VH) and graupel (VG) corresponding to Di. The size–velocity pairs that fulfilled or will be kept, because they are more prone to raindrops; otherwise, these measurements are eliminated from the original dataset depicted in Fig. 5.
- iii.
The residual contaminations, which the above-mentioned processing cannot directly eliminate due to their similar size–velocity characteristics to raindrops, need another analysis based on DSD-derived median volume diameter (D0) and ZDR. Larger ZDR values are anticipated for melting solid particles than raindrops with similar diameters. The final QC processing result of the DSD dataset is presented in Sect. 3.1.

Figure 4Time series of hourly maximum wind speed at the six national meteorological stations between 16:00 UTC, 8 August 2019, and 16:00 UTC, 10 August 2019.
3.1 The consistency between multi-source data
3.1.1 The surface consistency between disdrometer and rain gauge
A DSD dataset is critical for establishing relationships between polarimetric radar variables for radar QPE algorithms. Disdrometers and rain gauges are usually deployed at the same meteorological site; although they sample the precipitation differently, their rainfall measurements in the same area should agree with each other. However, DSD-derived rainfall at six stations, directly calculated from the size–velocity pairs in Fig. 5 without any QC processing (denoted as RM), all presented unrealistically large values: maximum RM at LH, XJ, and HJ exceeded 200 mm that at DT exceeded 400 mm and that at WL and YH unbelievably exceeded 3×10³ and 104 mm during typhoon Lekima. For convenient comparison of disdrometers with gauge rainfall series, RM is rewritten as
where RTM stands for the transformed rainfall value and RT stands for a rainfall threshold that is set a little larger than the maximum hourly gauge rainfall. CT is also manually set for each station, and CT partly indicates that RM is at least CT times higher than gauge rainfall. The RM part exceeding RT can shrink into a limited range interval, and RT and CT serve for comparing RM and DSD-derived rainfall after QC processing (denoted as RQC) in the same figure, as depicted in Fig. 6. Accordingly, CT of YH and WL in Fig. 6 is huge (800 and 500, ≥20 at the other stations). Meanwhile, DSD-derived maximum ZH, ZDR, KDP, and R exceeded 85 dBZ, 5.5 dB, 1500 ∘ km−1, and 15000 mm h−1, respectively (see Fig. 7a–c), and they are also abnormally larger than the final QC-processed counterparts (rectangles in Fig. 7a–c). If these unrealistic DSD-derived radar variables were directly utilized to establish the parameters of any radar QPE algorithm, an unrealistically overestimated radar rainfall field would be obtained. Afterward, the QC procedure in Sect. 2.3 is first imposed on the size–velocity pairs, and its performance and effectiveness are investigated through comparison with gauge rainfall recordings.

Figure 5The original size–velocity dataset collected at (a) XJ, (b) LH, (c) HJ, (d) WL, (e) YH, and (f) DT. The black and blue lines refer to the fall speed VB, 0.5 VB, and 1.5 VB calculated in Eq. (3).
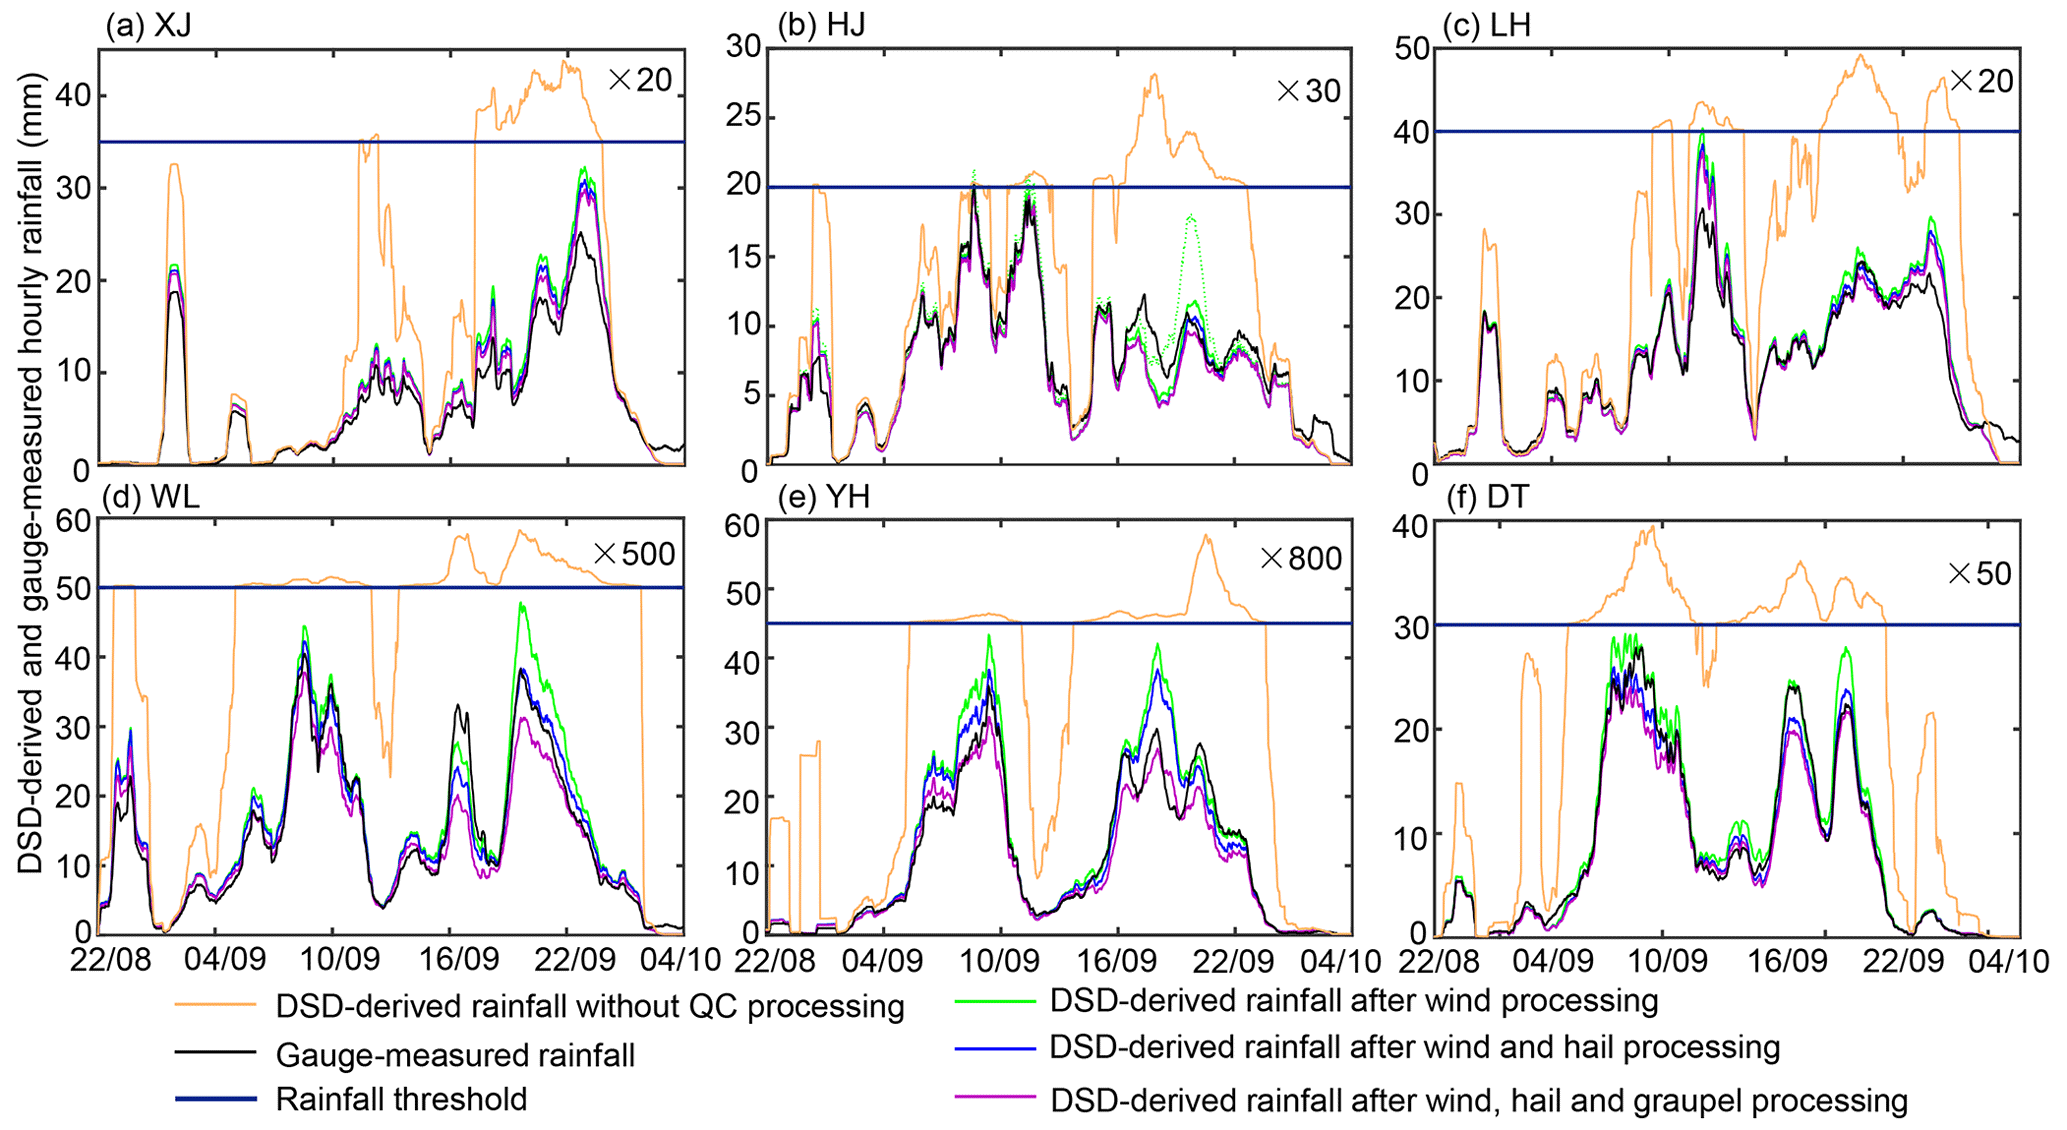
Figure 6Time series of DSD-derived and gauge hourly rainfall. Panels (a)–(f) are obtained from XJ, HJ, LH, WL, YH, and DT, respectively, during 22:00 UTC, 8 August 2019, and 04:00 UTC, 10 August 2019. The number following × refers to CT, and bold, dark blue straight lines indicate the threshold of RT of each station according to Eq. (5). The green dotted line in (b) is conditioned by VM∈ [0.4 VB, 1.5 VB], and other green solid lines are conditioned by VM∈ [0.5 VB, 1.5 VB].
According to a visual comparison in Fig. 6, the severe overestimation of RM at all six stations is reduced after processing wind effects, and a better approximation is noticeable at XJ, HJ, LH, and DT in Fig. 6a–c and e, where the extra hail and graupel processing hardly change the residual differences. In contrast, the RQC time series at WL agrees well with its gauge rainfall recordings after the hail processing but is underestimated after extra graupel processing (see Fig. 6d). This implies that WL suffers from some solid particle contaminations. Still, these solid particles may melt and have similar size–velocity characteristics to raindrops, and their removal is responsible for the final underestimation of RQC at WL after QC processing. YH also suffered from solid particle contaminations. During its peak rainfall recording period between 16:00 and 22:00 UTC, 9 August 2019, RQC in Fig. 6e changes relatively less after the hail processing and still deviates largely from gauge rainfall recordings; conversely, RQC better approximates gauge rainfall after the graupel processing. This indicates that the terminal velocity of these filtered particles is more prone to graupel (not deduced by size). Section 3.2.1 further verifies the falling solid particles.
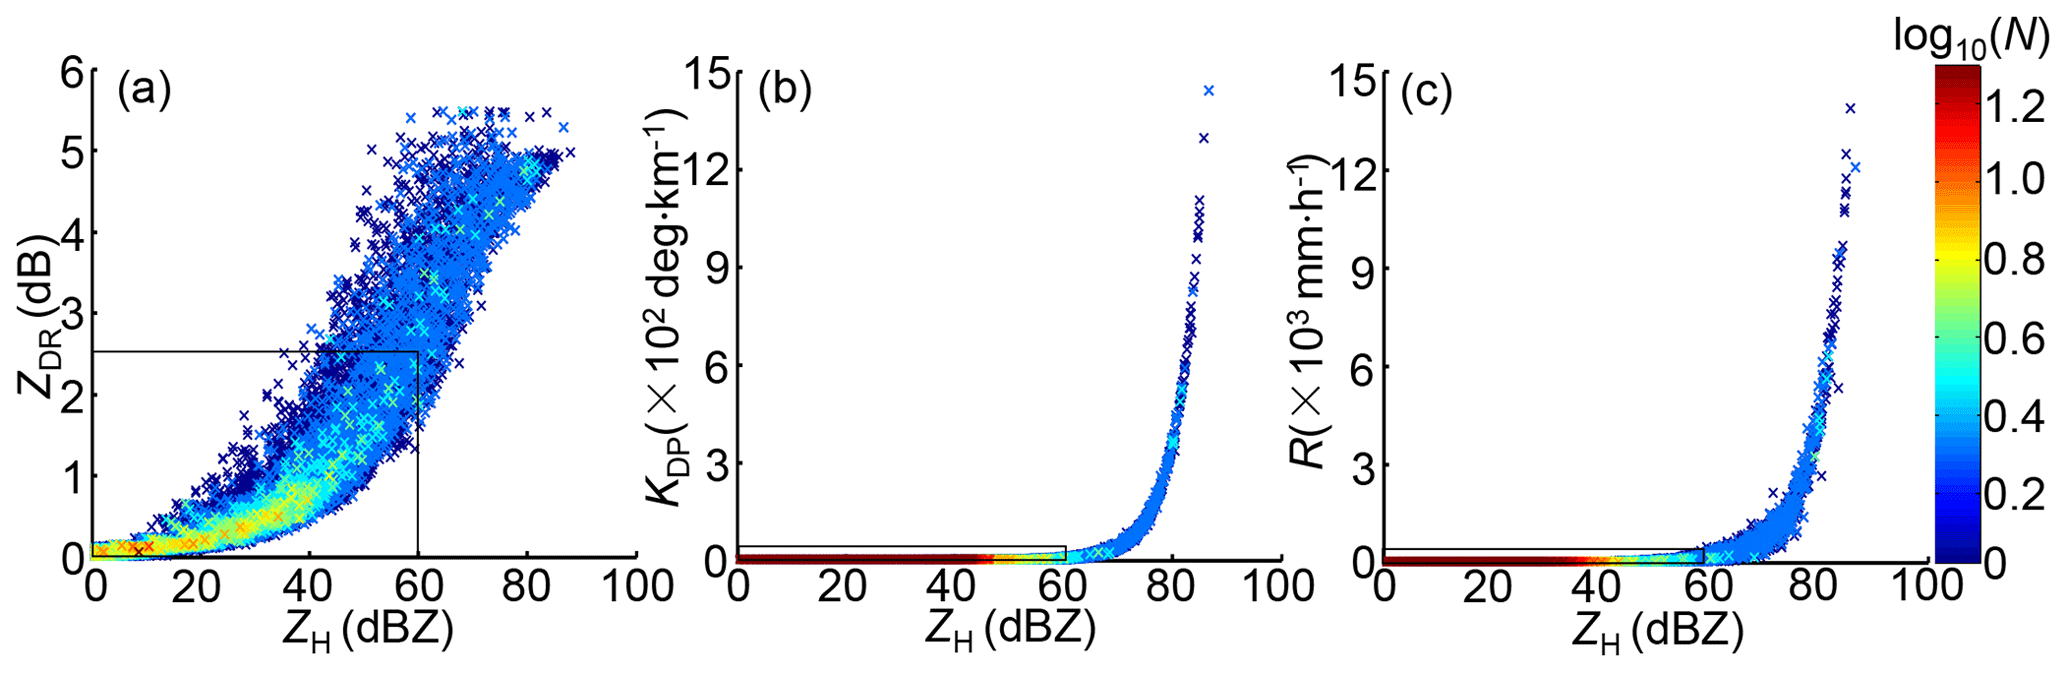
Figure 7The scattergrams of DSD-derived polarimetric radar variables without QC processing: (a) ZDR vs. ZH, (b) KDP vs. ZH, (c) R vs. ZH. The rectangles in (a–c) indicate the ranges of DSD-derived variables after final QC processing.
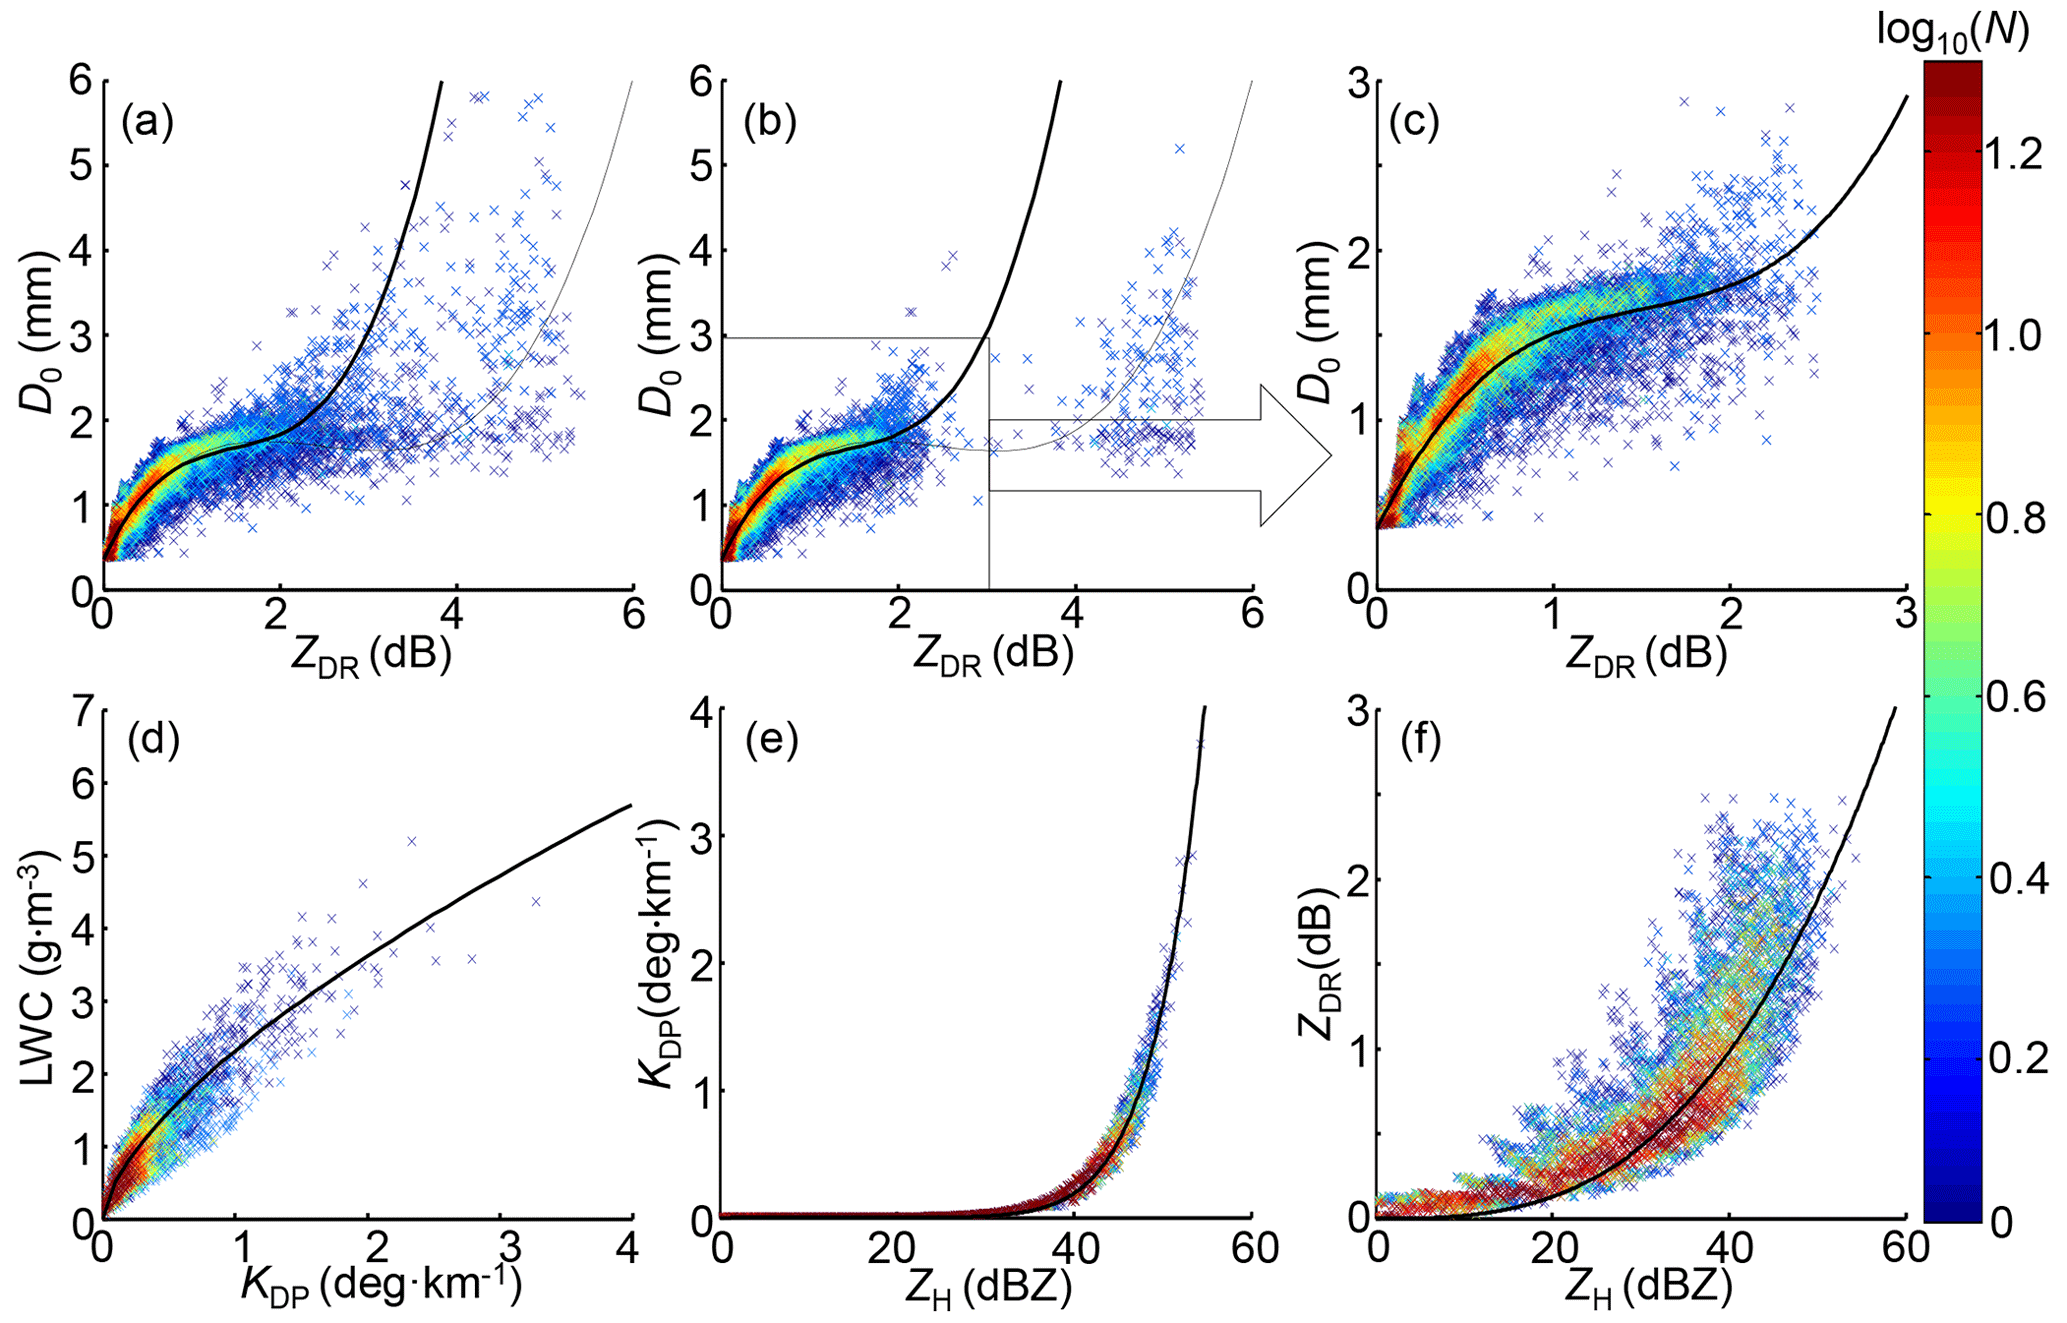
Figure 8Scattergrams between polarimetric radar variables: (a) D0 vs. ZDR after eliminating wind contaminations. Panel (b) is based on (a) but after removing the hail and graupel contaminations further. Panel (c) is based on (b) but after further eliminating the residual graupel contaminations with ZDR > 2.5 dB. Panels (d), (e), and (f) are LWC vs. KDP, KDP vs. ZH, and ZDR vs. ZH based on the same dataset as (c). The thick black lines in (a)–(c) stand for Eq. (5); the thin black lines in (a) and (b) indicate the overfitted results, and the black curves in (d)-(f) stand for Eqs. (6), (7), and (2a), respectively.
These residual solid particles could result in a false relationship between D0 and ZDR. As shown in Fig. 8a, the fitted curve uniformly passed through the scattergram, representing an excellent fitting relationship between D0 and ZDR. However, as mentioned above, these DSD-derived D0 and ZDR still suffer from some solid particle contaminations after processing the wind effects. Even after hail and graupel processing, the scattergram in Fig. 8b still presents a significant overfitted relationship between D0 and ZDR. The scatters with ZDR > 2.5 dB are related to melting solid particles with D0 ranging from 1.5 to 4 mm, and some have raindrop-like sizes (< 2 mm). Finally, DSD-derived radar variables constrained by ZDR < 2.5 dB are assumed to be contributed by pure raindrops, and they are utilized to fit the D0–ZDR, LWC–KDP, and KDP–ZH relationships in Fig. 8c–e and the ZDR–ZH relationship in Eq. (2a) (see Fig. 8f):
Combining these relationships and another relationship between the normalized concentration of raindrops (Nw, in mm−1 m−3), LWC, and the mean volume diameter of the drop size distribution (Dm, in mm) in Eqs. (9) and (10),
where ρw is the water density (1 g cm−3), high-resolution DSD parameter fields can be derived from WZ-SPOL radar measurements.
3.1.2 The self-consistency between radar measurements
The self-consistency can demonstrate the credibility of polarimetric radar measurements through scattergrams (Fig. 9). The scattergrams in Fig. 9b and d are obtained from all , , and KDP measurements described in Fig. 11. The ZHPI approach (Bringi et al., 2001) with more constraints described in Gou et al. (2019a) effectively mitigates the attenuation effects on ZH and ZDR of the WZ-SPOL radar. The spatial fields of and are not presented (they will not be used for the subsequent analysis), but it is noticeable that radar-measured , , and KDP are not self-consistent before attenuation correction processing: it is obvious for dBZ and KDP > 1 ∘ km−1 that KDP– scatters deviates positively from the theoretical KDP–ZH curve (Eq. 8 as depicted in Fig. 8e), indicating that larger reflectivity values are anticipated for these KDP measurements. In addition, an overall deviation of – distribution in Fig. 9c from the theoretical ZDR–ZH curve (the black curve stands for Eq. 2a as depicted in Fig. 8f) addresses a non-negligible negative ZDR bias before the differential attenuation correction. In contrast, the scattergram core areas in Fig. 9b and d (defined as log10(N) > 1.6) exhibit more compact distribution along theoretical KDP–ZH and ZDR–ZH curves, demonstrating the effectiveness of the attenuation correction to enhance the self-consistency between , , and KDP.
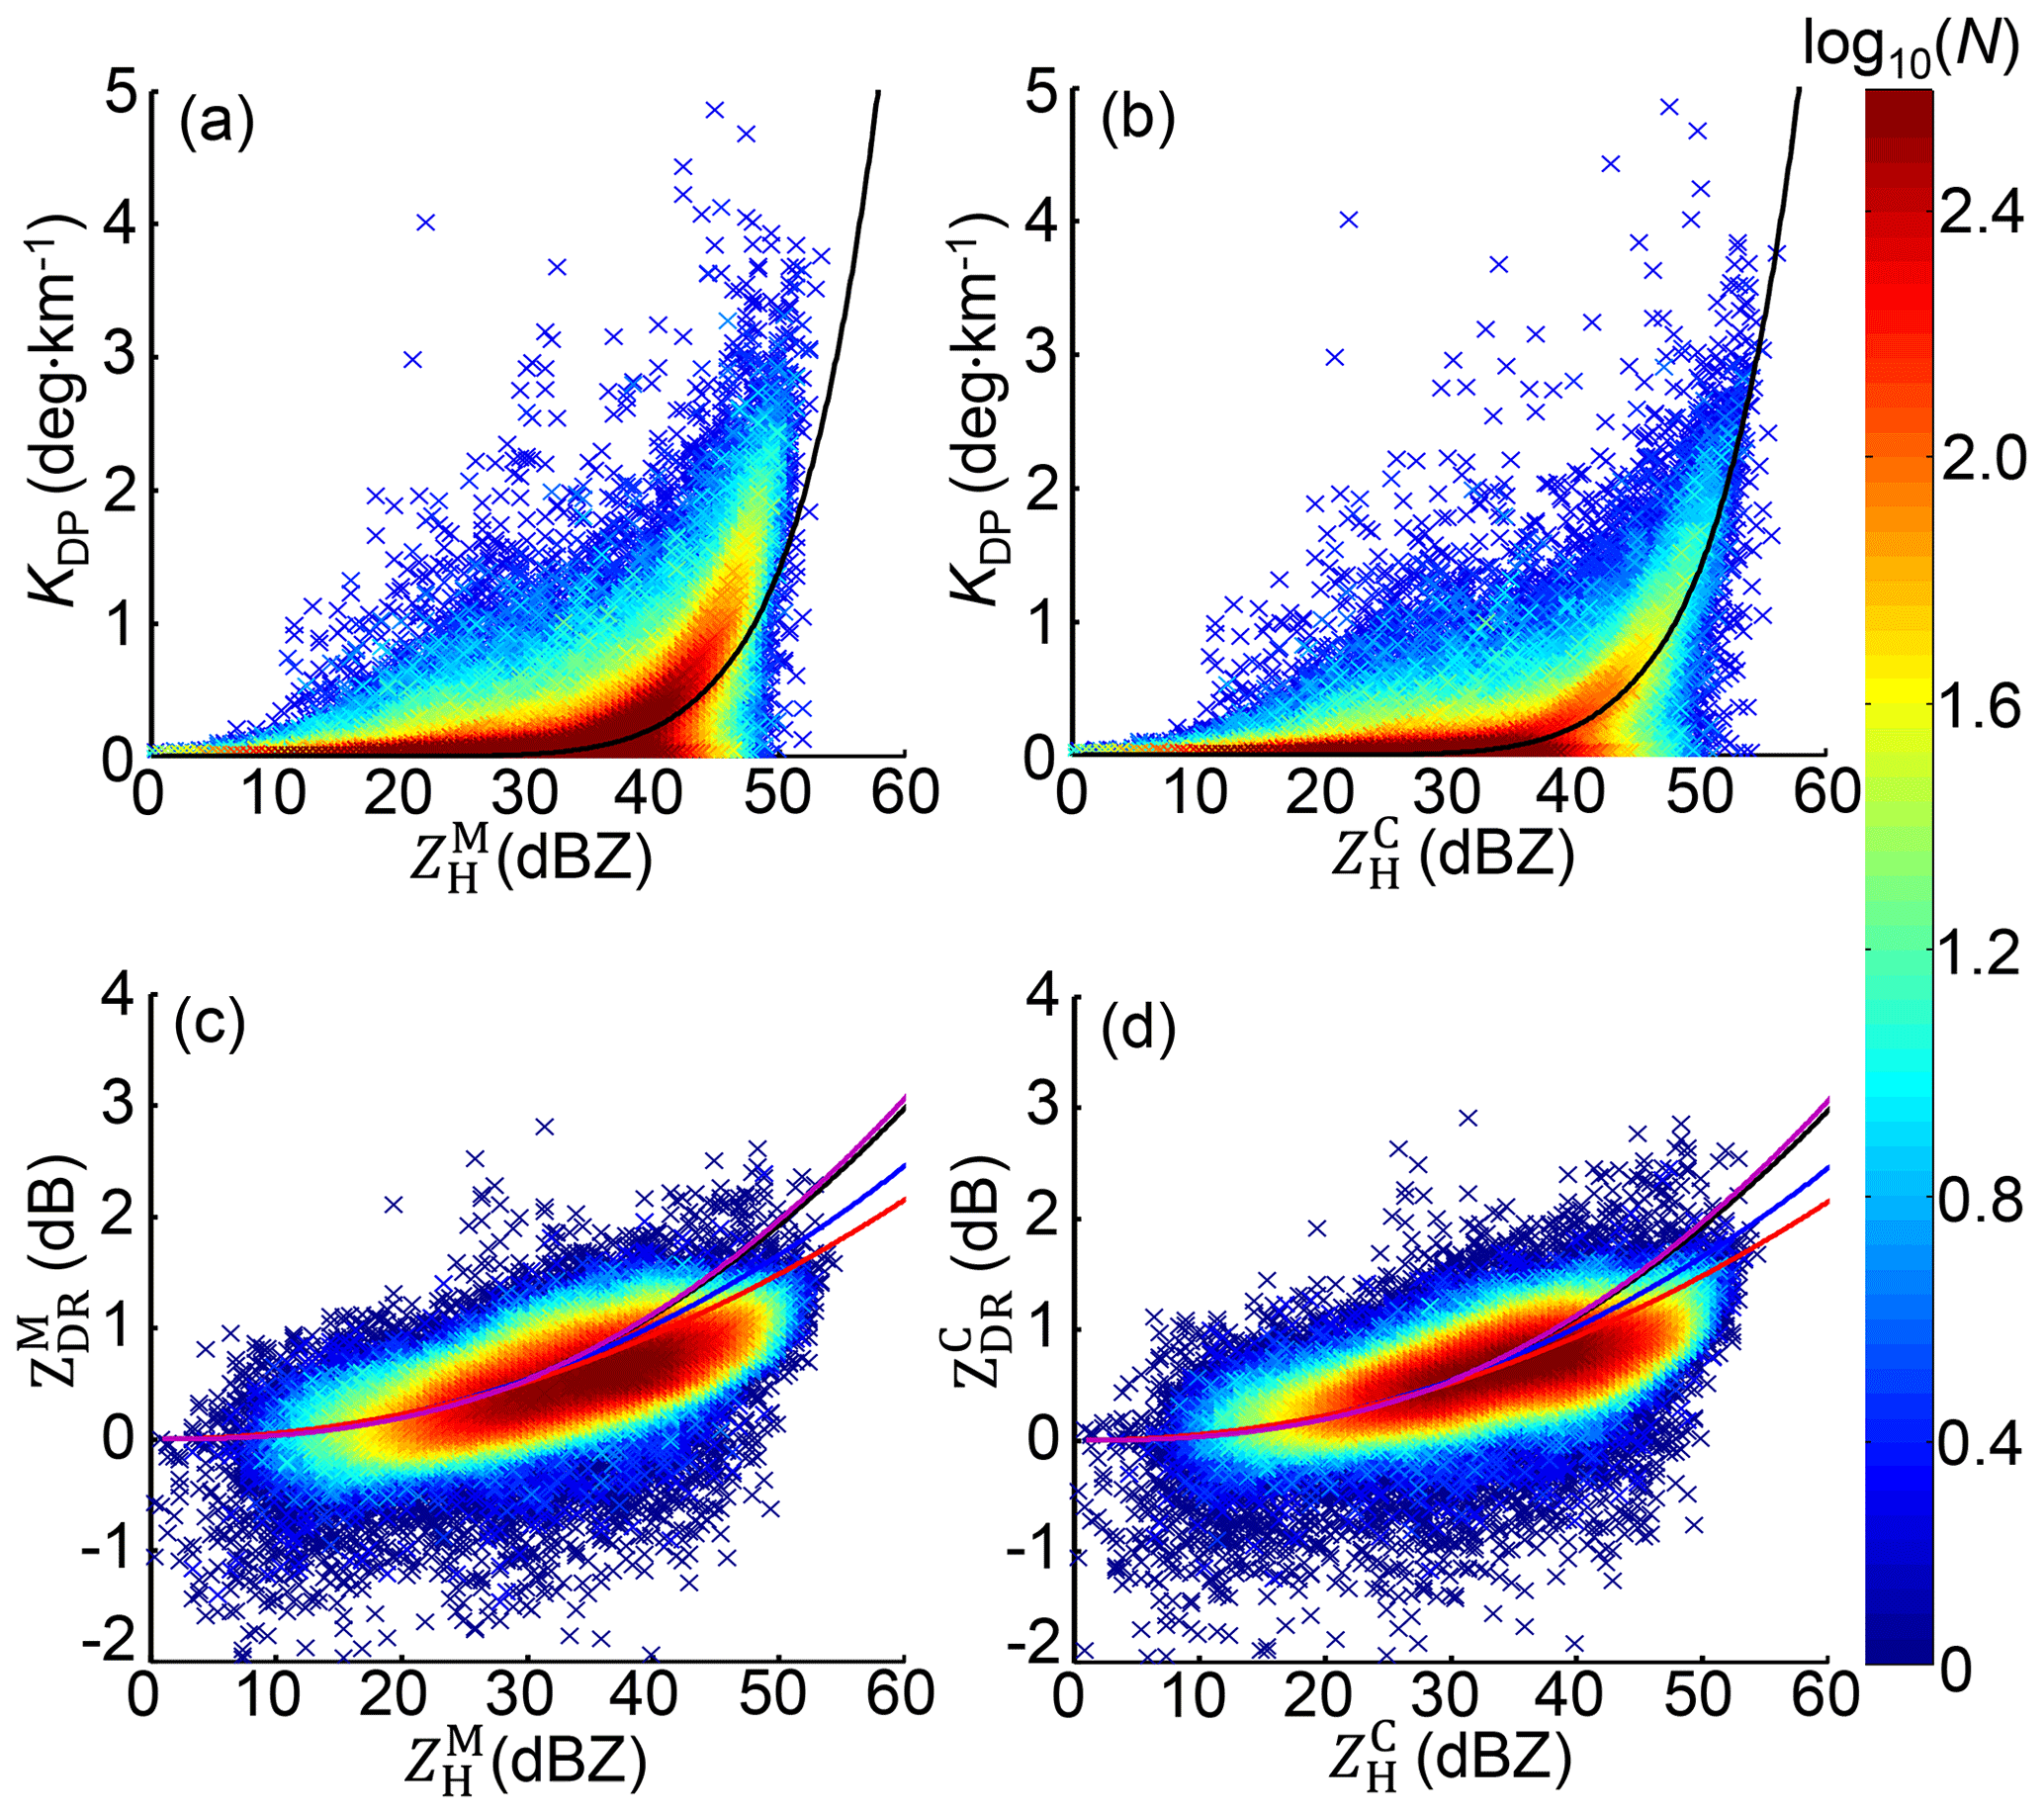
Figure 9The scattergram between polarimetric measurements from the WZ-SPOL radar, (a) KDP vs. , (b) KDP vs. , (c) vs. , and (d) vs. . Measurements of all six stations derive the black curves; the blue, red, and purple curves in (c) and (d) stand for Eqs. (11a)–(11c) derived from SI–SIII.
Radar measurements are feedback from drops in the air, but disdrometers collect DSD near the surface. In this sense, the comparison above also means that radar measurements tend to be more consistent with their surface counterparts after the correction. However, this does not mean that they completely agree; conversely, still deviates largely from when reflectivity exceeds 35 dBZ in Fig. 9d. In addition, the time series in Fig. 10 shows that extremely large DSD-derived ZH, ZDR, and KDP in Fig. 7 (time series not presented) have diminished, and they begin to approximate their radar-measured counterparts. The hail and graupel processing effectively improves the consistency between the gauge and disdrometer, as mentioned above; furthermore, DSD-derived ZH and KDP also simultaneously tend to better approximate radar-measured and KDP. Meanwhile, the residual differences between radar and DSD are still prominent in terms of ZDR, and larger DSD-derived ZDR than radar-measured occurs at WL and YH, indicating that larger-sized drops are collected by WL and YH than the radar volume gates above.

Figure 10(a) Time series of radar-measured and DSD-derived ZH at the six meteorological stations shown in Fig. 6 during 22:00 UTC, 8 August 2019, and 04:00 UTC, 10 August 2019. (b) Similar to (a), but for radar-measured KDP and DSD-derived KDP. (c) Similar to (a), but for radar-measured and DSD-derived ZDR.
Considering that Eq. (2a) is fitted based on S0, and RQC at WL agrees better with gauge rainfall if no graupel processing occurs, S0 can be refined: SI excludes large-sized drops by removing WL, SII further excludes large-sized drops from WL and YH, and SIII re-includes more large-sized drops by adding the size–velocity pairs removed by graupel processing at WL. In this way, three new ZDR–ZH relationships are re-established as
The further removal of the DT dataset from SII will change the ZDR–ZH relationship in Eq. (11b) very little (data not presented). Although there is an uncertainty that large-sized drops may source either from melting solid particles or the collision–coalescence, more large-sized drops in S0 and SIII make Eqs. (2a) and (11c) (higher estimates) prone to the outcome of the dominant collision–coalescence process; conversely, more small-sized drops in SII and SIII make Eqs. (11a) and (11b) prone to dominant collision–breakup. Resultantly, Eqs. (11a) and (11b) exhibit smaller ZDR than that of Eqs. (2a) and (11c) for a given , which agrees well with the simulation result in Kumjian and Prat (2014). In Fig. 9d, radar-measured tends to be more consistent with Eqs. (11a) and (11b) for a given than Eqs. (2a) and (11c) in the scattergram core area, and this – scattergram reflects that the governing collision–breakup processes in radar volume gates restrain the drop size increase due to the coalescence–breakup balance, which means does not grow similarly to coalescence-dominated volume gates.
3.2 Microphysics of the landfall of Lekima (2019)
When super typhoon Lekima landed on the eastern coast of China, several beneficial conditions for its evolution were perceived: (i) the severe interaction between the mountain and the typhoon caused terrain-enhanced precipitation, (ii) the wind speed shear (the bold black curves in Fig. 11a–d) with noticeable VR differences benefited the strengthening development of convective storms, and (iii) the typhoon carried abundant warm moisture which can condensate if confronted with cold air. The characteristics of Lekima can be described based on : the outer and inner eyewalls were both featured with dBZ before landfall in Fig. 11e, indicating the enhanced convective development of the concentric eyewalls before its landfall; afterward, the inner eyewall was destroyed and merged with the outer eyewall into a convective storm with an enlarged area, with dBZ dwelling around the GWS of YDM (in Fig. 11f), and then the storm area with dBZ transitioned to the north GWS of YDM (in Fig. 11g) but strongly weakened when it passed over the mountain ridge between YDM and KCM (as depicted in Fig. 11h). More complex microphysical processes than these described also occurred during the landfall of Lekima.
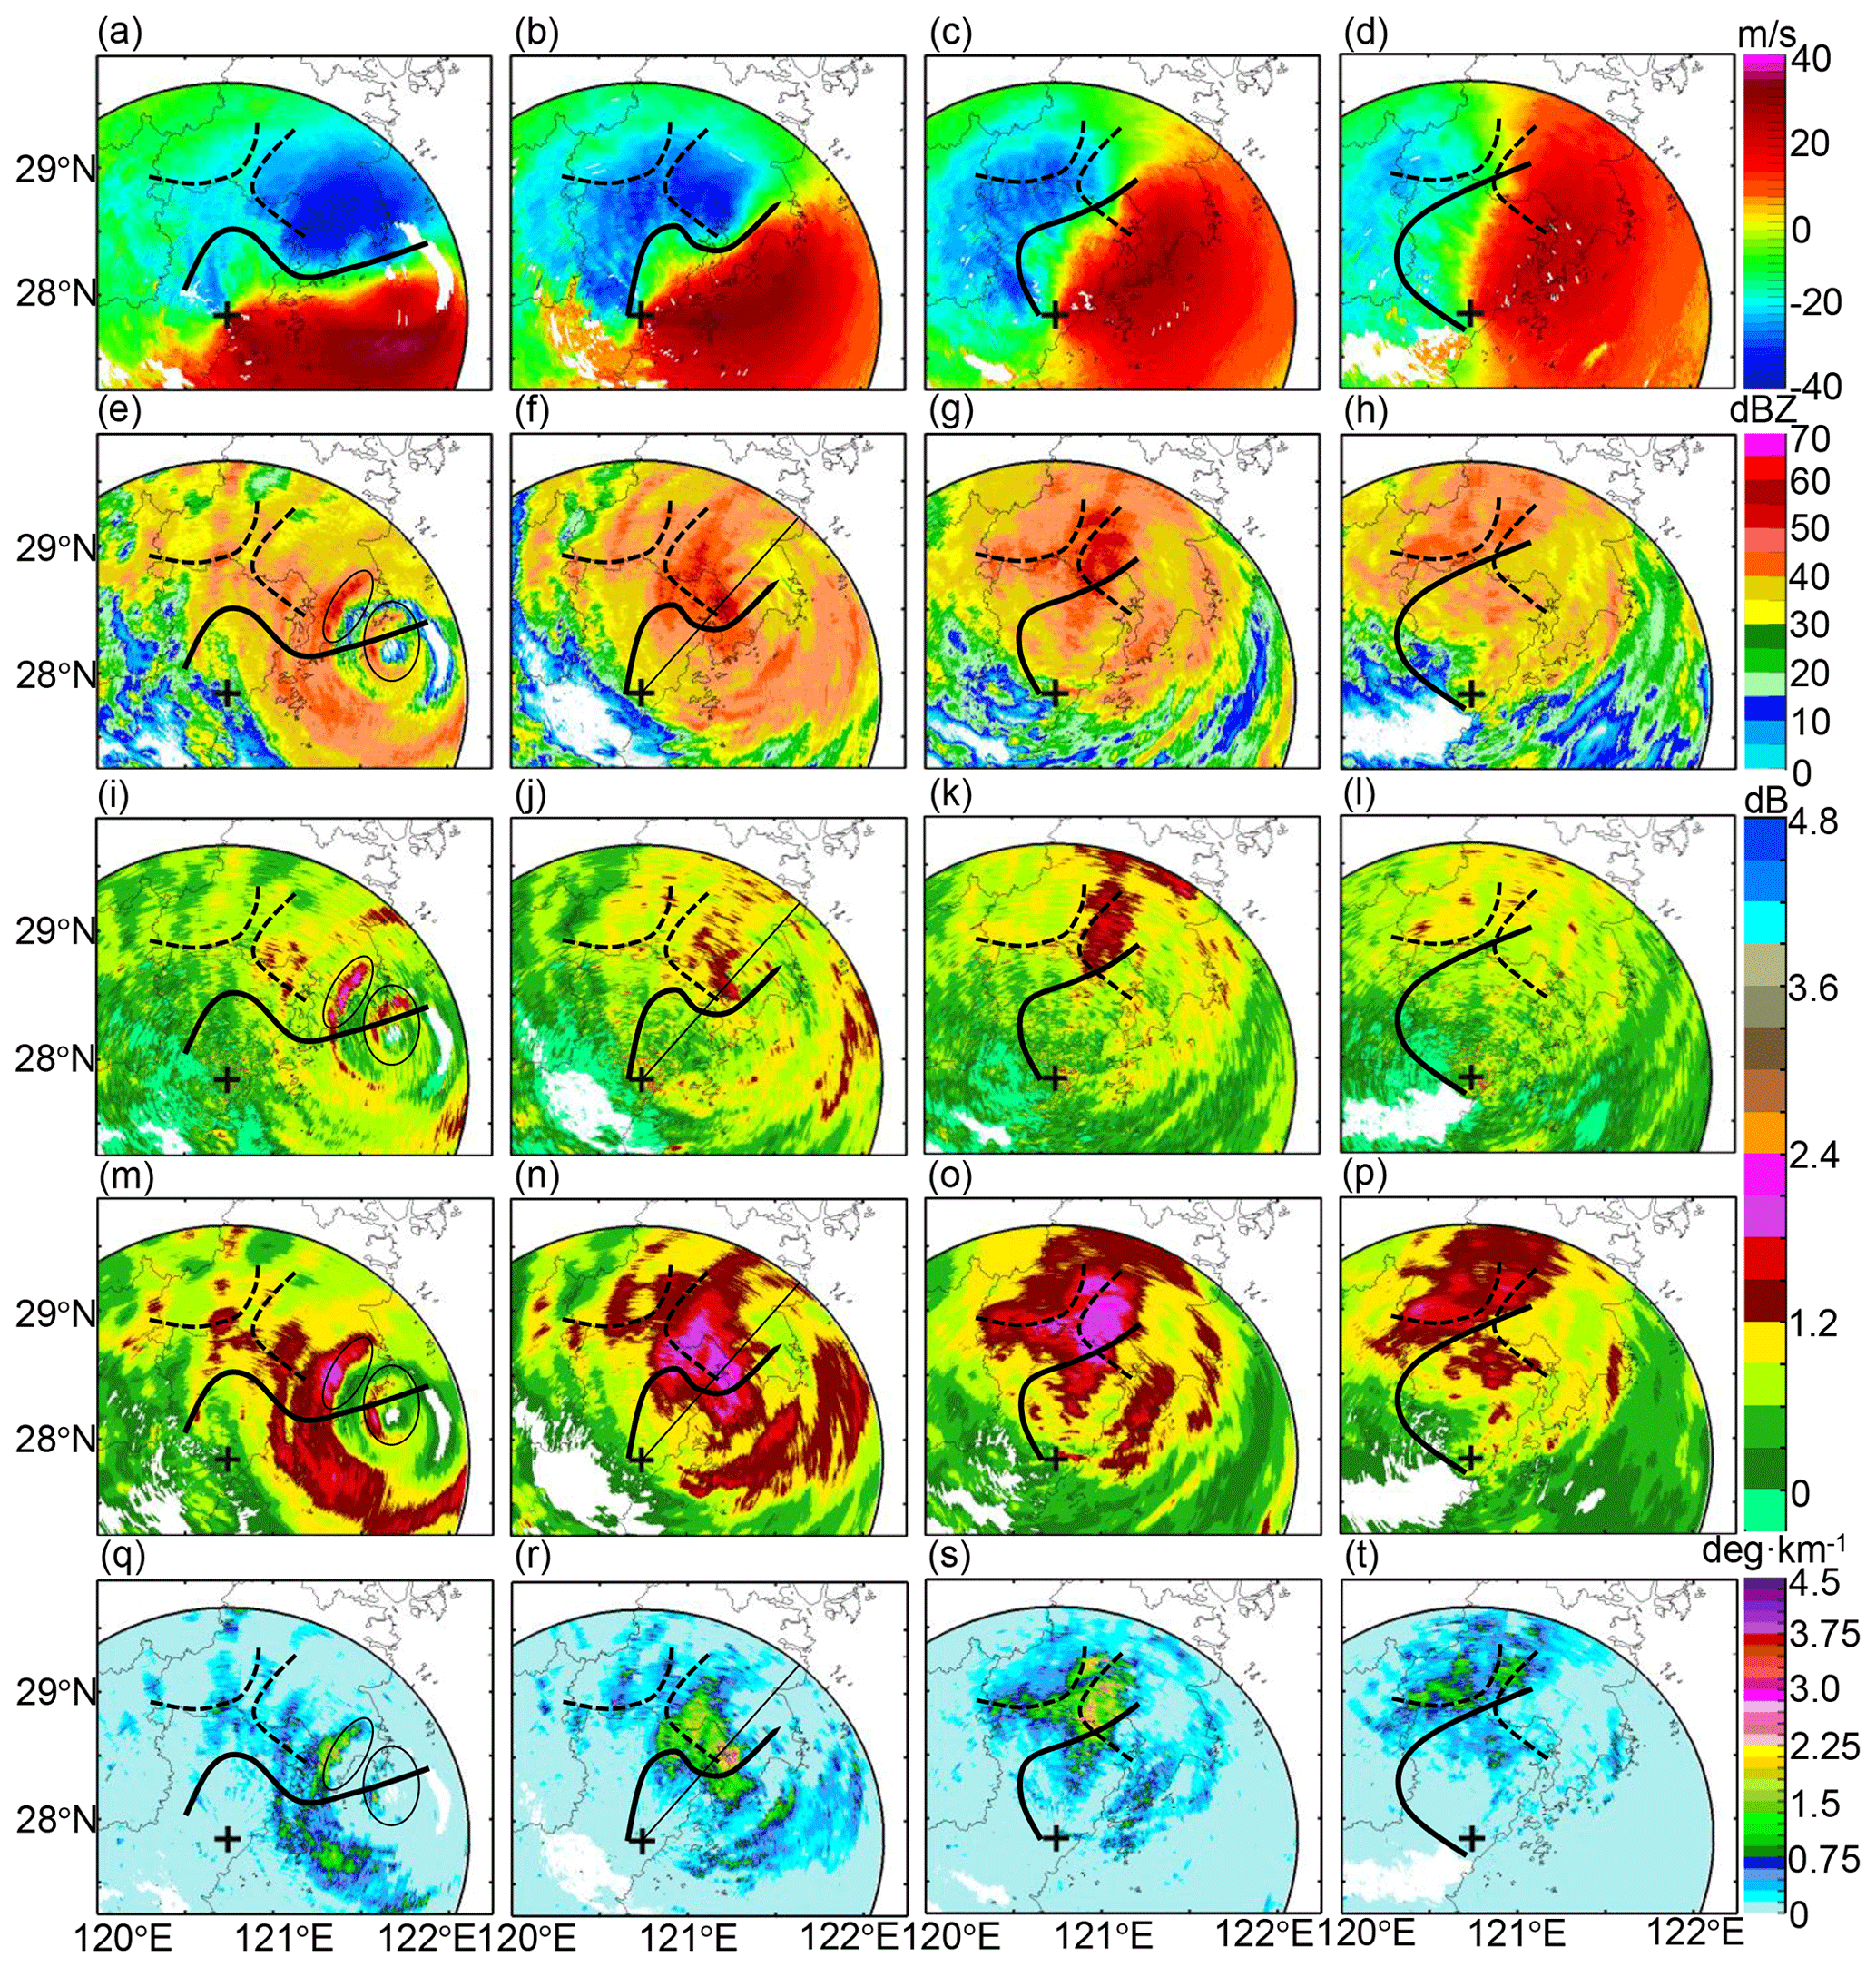
Figure 11WZ-SPOL radar measurements during typhoon Lekima: (a)–(d) are Doppler velocity VR at 16:01, 17:59, 20:02, and 22:00 UTC, 9 August 2019, respectively; (e)–(h), (i)–(l), (m)–(p), (q)–(t) are, respectively, , , , and KDP simultaneously as (a–d). The solid black lines refer to wind shear deduced from VR. The dashed black lines refer to the GWS of KCM and YDM, and + indicates the location of the WZ-SPOL radar. The ellipses in (e), (i), (m), and (q) indicate where hydrometeor size sorting occurred. The black lines along the radial profiles in (f), (j), (n), and (r) indicate the azimuthal angle shown in Fig. 18.
3.2.1 Polarimetric signatures of solid particles
The time series of vertical polarimetric radar measurement (Figs. 12–17), which is constructed with an altitude resolution of 100 m based on the technique in Zhang et al. (2005), is chosen to describe the microphysical evolutions upon each station; DSD-derived radar measurements in Sect. 3.1 assist in interpreting what occurred near the surface. The combination of radar and DSD can effectively explain the potential microphysical processes in the vertical gap between the air and the surface.
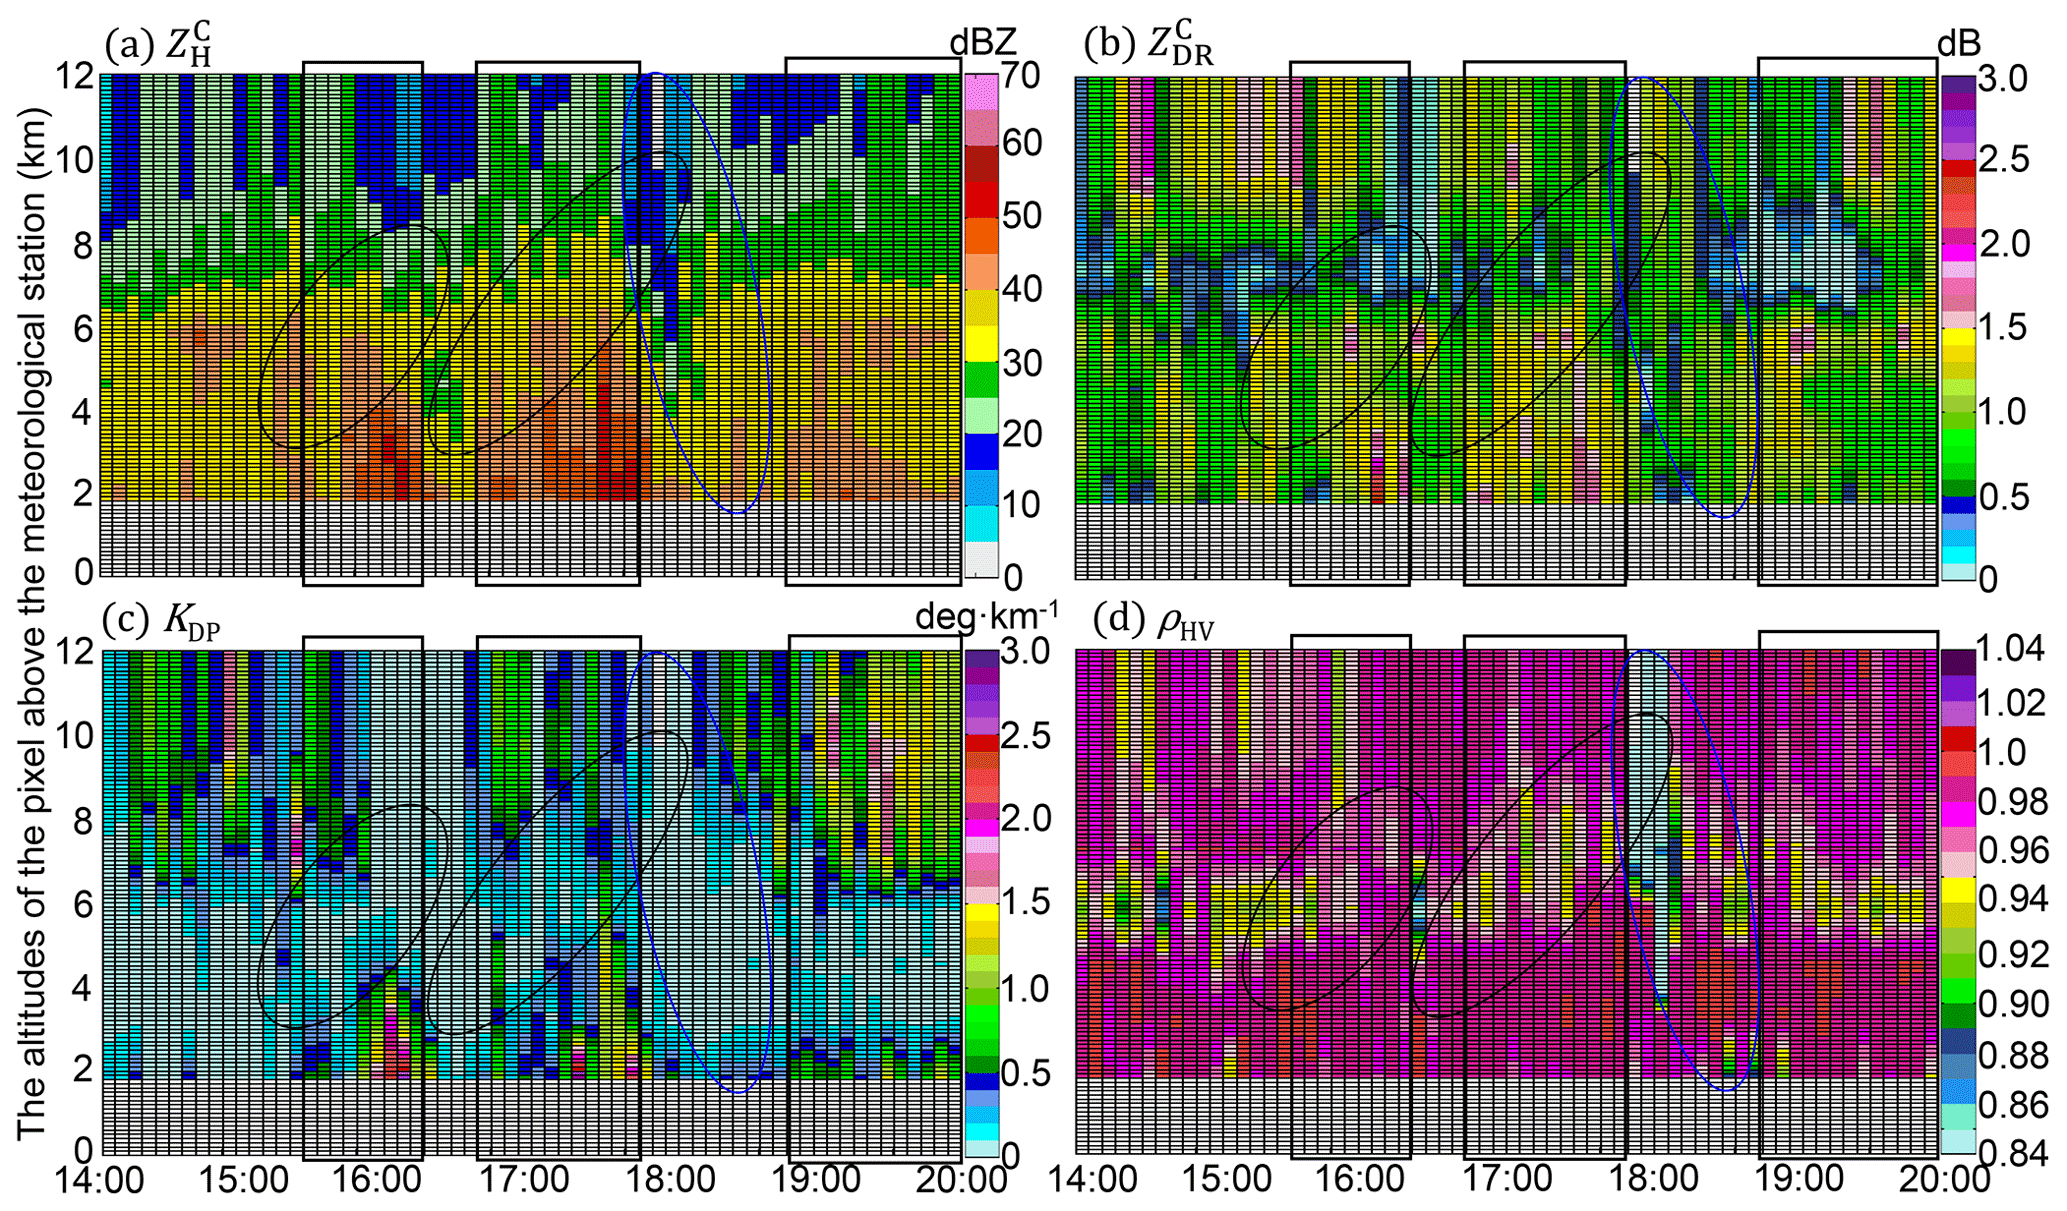
Figure 12(a) Time series of vertical polarimetric radar variables upon the WL station between 14:00 UTC, 8 August 2019, and 20:00 UTC, 9 August 2019, (a) , (b) , (c) KDP, and (d) ρHV. The black rectangles indicate developing convective storms, the black ellipses surround the potential updrafts, and the blue ellipses surround the subsiding signatures of ice or mixed-phase particles.
The freezing level (FL) is significant in the vertical measurements (see Figs. 12, 14, and 17), and its altitude is about 7 km: the layers with near-zero measurements dominate above the FL, indicating the dominant dry snow aggregates ( dBZ); ρHV is relatively weaker (< 0.98) below the FL, indicating the dominant mix-phase particles in the ML (near 6 km). In addition, the sustaining large KDP (>1 ∘ km−1) upon WL and HJ (Figs. 12 and 14) after 18:00 UTC, 9 August 2019, (after landfall) indicates the high concentration of solid particles above the FL. In addition, the significant upward extension of (> 40 dBZ) and (> 1 dB) columns marked with black rectangles indicate the developing convective storms; the black ellipses indicate potential updrafts coupled with the storm; the blue ellipses indicate subsiding signatures of falling solid particles deducing from gradual decreasing heights of ρHV < 0.98 over time. The convective storms are accompanied by abundant water content, as indicated by significant KDP (> 0.5∘ km−1) columns extending upwards, which benefited the size increases of the falling solid particles. The microphysical processes of the solid particles differed at each station.
The WZ-SPOL radar initially measured similar ZDR but larger ZH and KDP compared with DSD at the WL station (rectangle 1 in Fig. 10) before the landfall of Lekima, and more concentrated hydrometeors aloft accompanying the updrafts compared to the surface in this process account for this phenomenon, which is verified in the first rectangle of Fig. 12a and c. Furthermore, two consecutive severe updrafts passed over WL, one from the outer eyewall and the other from the inner eyewall, causing the significant upward extension of , , and KDP columns below the FL, as depicted in two black rectangles in Fig. 12. As illustrated in two black ellipses, some ice particles might ascend with the first updraft, then fall and melt in the time gap between two updrafts, with the signature of ρHV < 0.98 reaching the lowest layer of 1.8 km; they instantly suffered from another size increase process confronting the second updraft (in the second ellipse) and then fell with the subsiding signals of ρHV and (in the blue ellipse): dB was sustained when ρHV gradually transitioned from ρHV < 0.84 around the FL to ρHV < 0.98 on the lowest layer, indicating the existence of some near-spherical but mixed-phase particles during this falling process. These solid particles partly account for the larger DSD-derived ZDR near the surface than the WZ-SPOL radar (rectangle 2 in Fig. 10), but the coalescence of raindrops might also partly account for this DSD-derived larger ZDR.
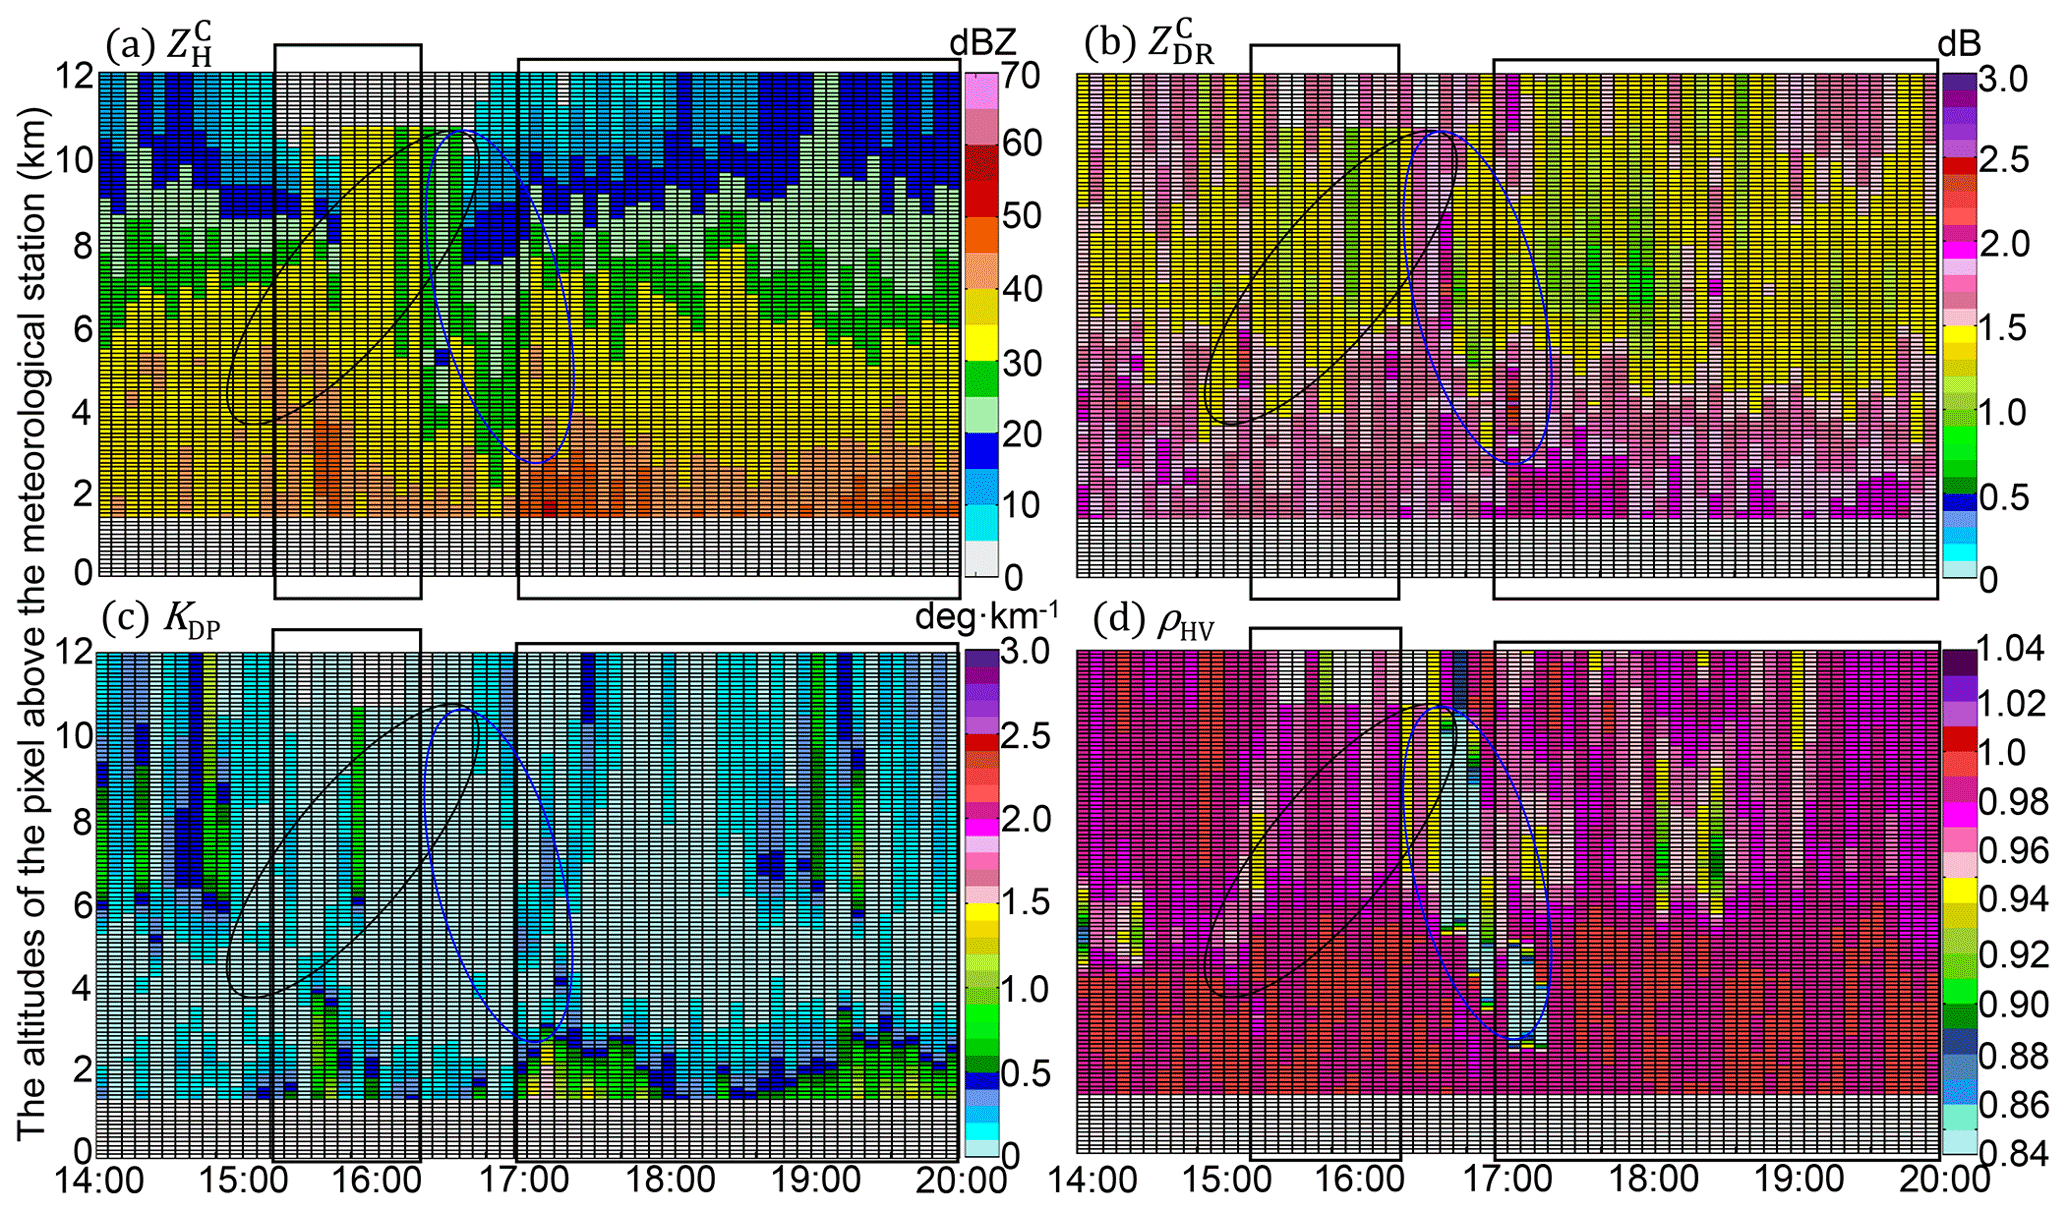
Similar updrafts occurred upon the YH station (rectangle 3 in Fig. 10), and the WZ-SPOL radar measured similar KDP but weaker ZH and ZDR compared with DSD before the hail/graupel processing. Featuring with similar extending upwards upon the YH station, large (> 1.2 dB) and weak KDP (< 0.2 ∘ km−1) accompanied the updrafts with ρHV < 0.98 in the black ellipse of Fig. 13, indicating that dominant large-sized mixed-phase particles were developing around the ML. Then, in the blue ellipse, the subsiding signals of ρHV < 0.84 formed in Fig. 13d after 16:30 UTC and tended to decrease their heights over time; finally, they transitioned to ρHV > 0.98 on the top of the (> 2 dB) columns, attributing to the transformation of melting solid particles into big raindrops. Compared with surface DSD, the decrease in radar-measured and KDP reflects the reduction of LWC in the vertical gap; this LWC reduction did not contribute to the size increase of drops, because radar and DSD presented similar ZDR. Another possible explanation is that some LWC is absorbed by the falling solid particles, contributing to the filtered ZDR part in the hail/graupel processing.
Another solid particle falling occurred upon HJ, which is to the north of the landfall positions of Lekima. Even with the unnoticeable upward enhancement between 17:00 and 18:00 UTC, 9 August 2019, as depicted in Fig. 14a, the large signals of the ML in Fig. 14b diminished due to the updraft, and KDP both increased, and ρHV reduced steadily after 18:00 UTC above the FL in the black ellipses of Fig. 13b–d. Subsiding signals of ρHV < 0.84 also emerged after 18:00 UTC, resulting in the ρHV reduction from 0.98 to 0.96 on the lowest layer. Conditioning VM by [0.5VB, 1.5VB] eliminated some size–velocity pairs of the solid particles at HJ, because solid precipitation particles have smaller terminal velocities than liquid particles. Conversely, the rising overestimation of RQC by reconditioning VM by [0.4 VB, 1.5 VB] in Fig. 6b (the dotted green line) further verified this possibility.
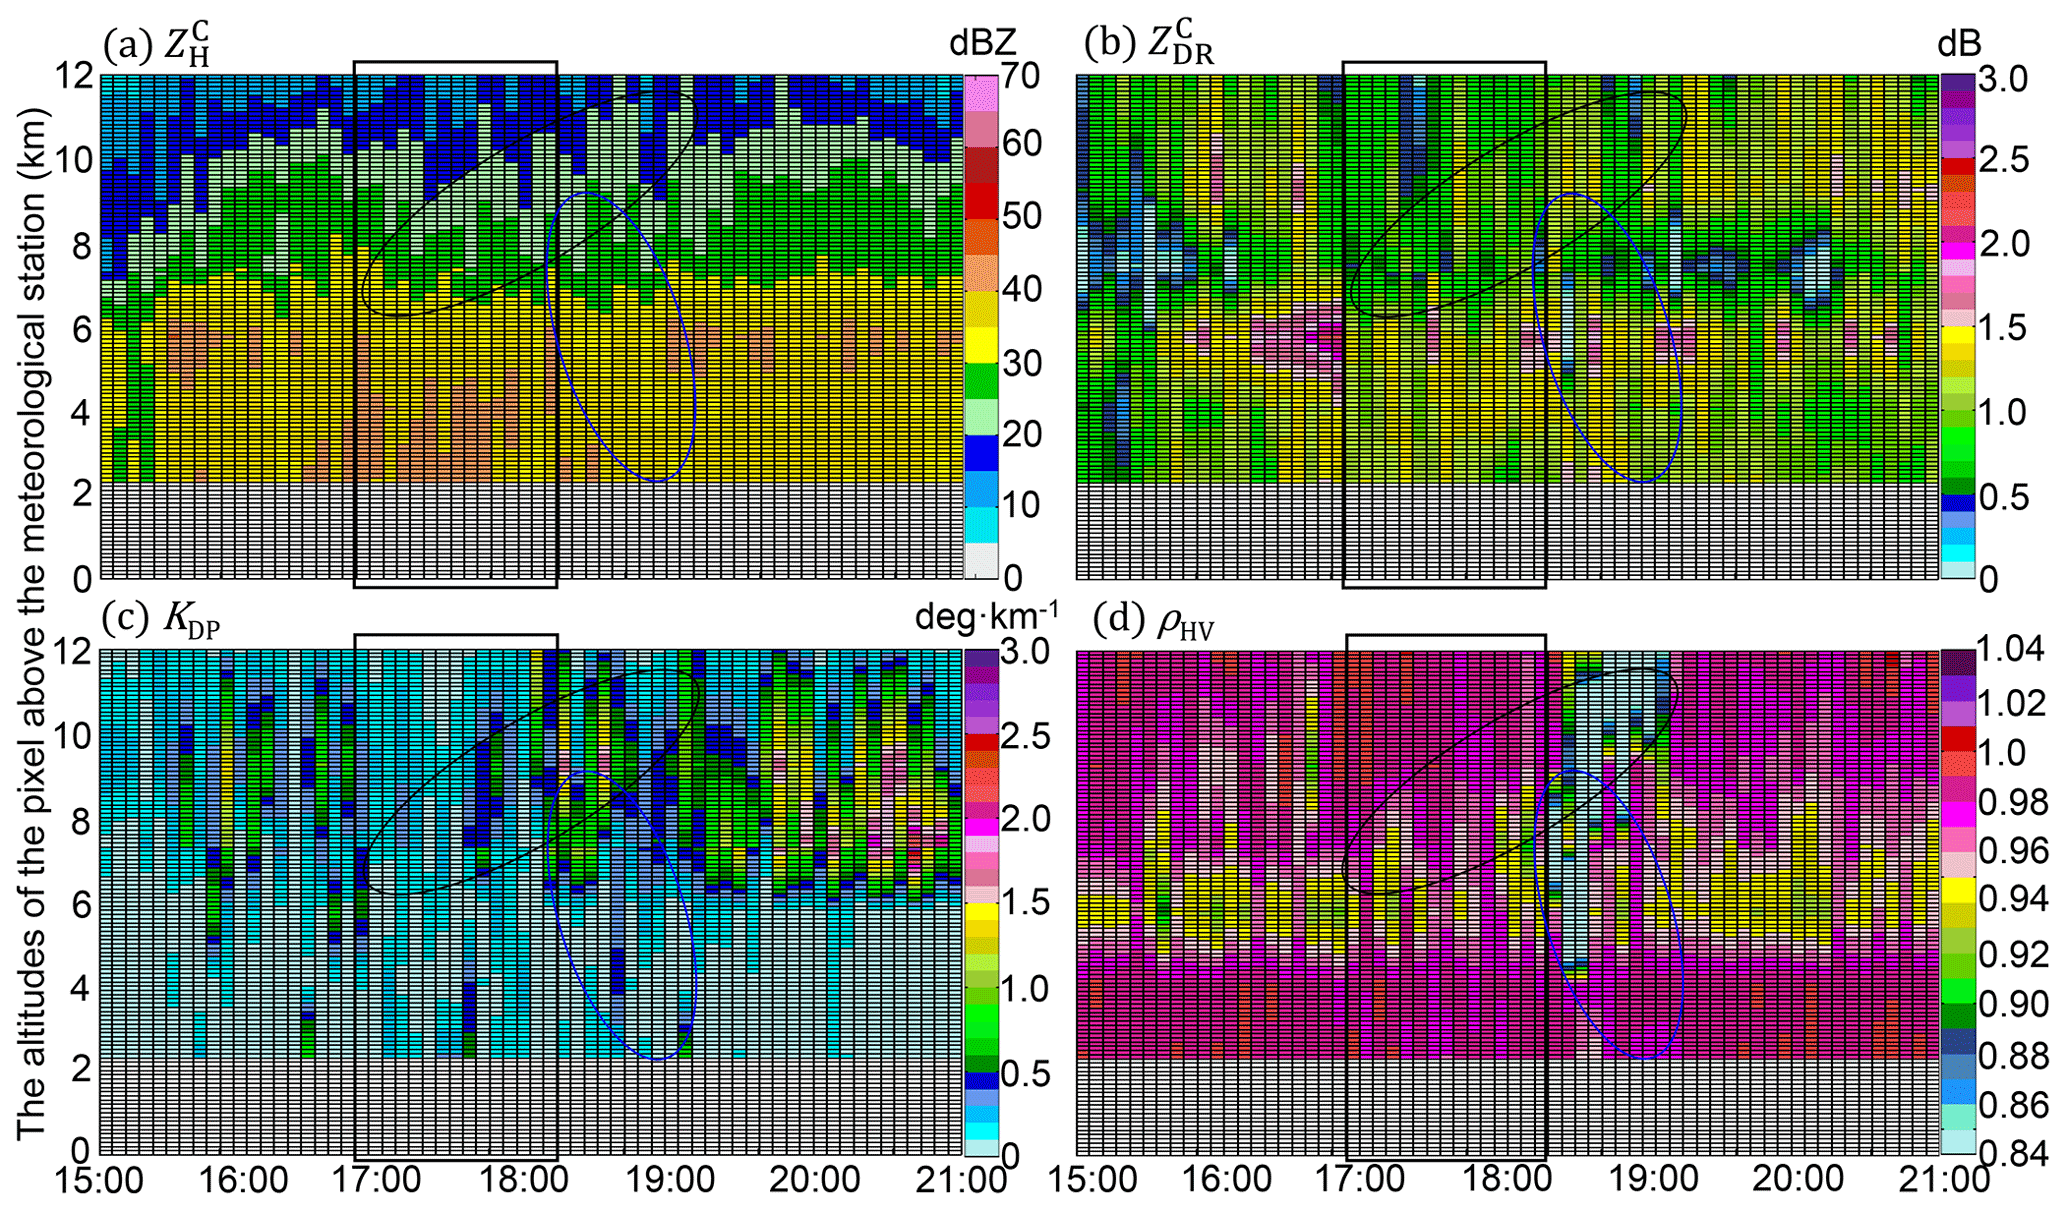
Figure 14The same as Fig. 12 but for the HJ station between 15:00 UTC, 8 August 2019, and 21:00 UTC, 9 August 2019.
These common characteristics feature in HJ, DT, LH, and XJ in Figs. 14–17: KDP (< 0.5 ∘ km−1) above the FL indicated a lower concentration of ice particles upon DT, LH, and XJ than upon the other three sites, which refrains the size increase of falling solid particles through the aggregation process; the insignificant (< 45 dBZ) and KDP (< 0.2 ∘ km−1) extending upwards reflect the relatively low concentration of hydrometeors below the ML upon HJ, LH, and XJ, which refrains the further size increases of melting ice particles in the warm rain environment. The exceptions in columns upon DT between 18:00 and 19:00 UTC in Fig. 15b were attributed to the falling melting ice particles upon an updraft with high LWC (KDP > 1∘ in Fig. 15c); those in LH between 18:00 and 19:00 UTC were attributed to the sustaining weak updrafts ( <45dBZ) but more concentrated ice particles above the FL. The deep ML (ρHV < 0.98) also features these stations, and this signature even extends down to the lowest layer of LH and HJ with dB dwelling below the FL. In addition, most ice particles upon these four stations might have melted in the air before being collected by disdrometers near the surface, which effectively accounts for the small rainfall differences between disdrometers and rain gauges. However, the residual differences between radar and DSD are mainly related to the warm process of raindrops below the ML.
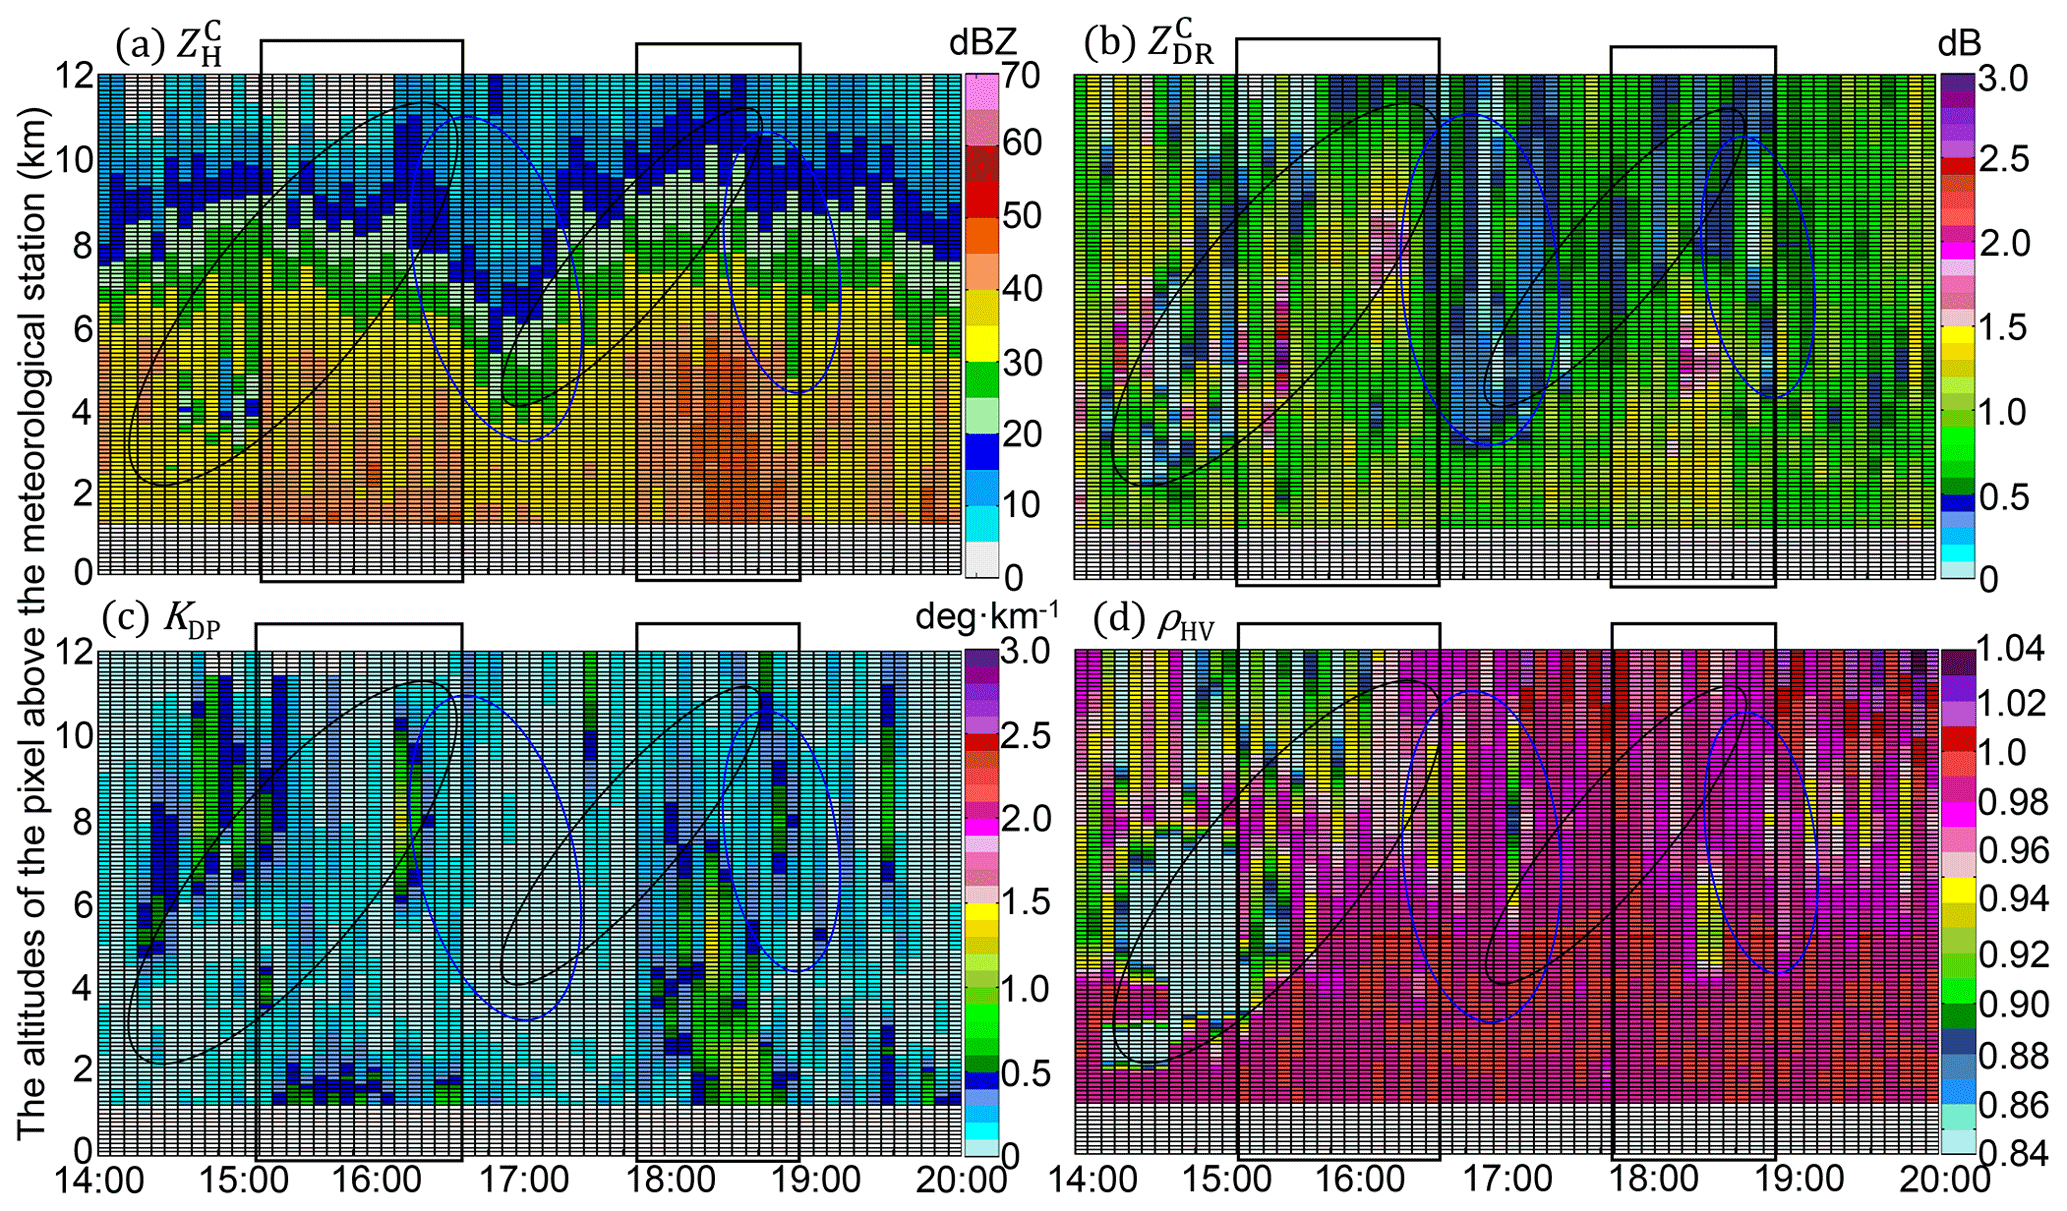
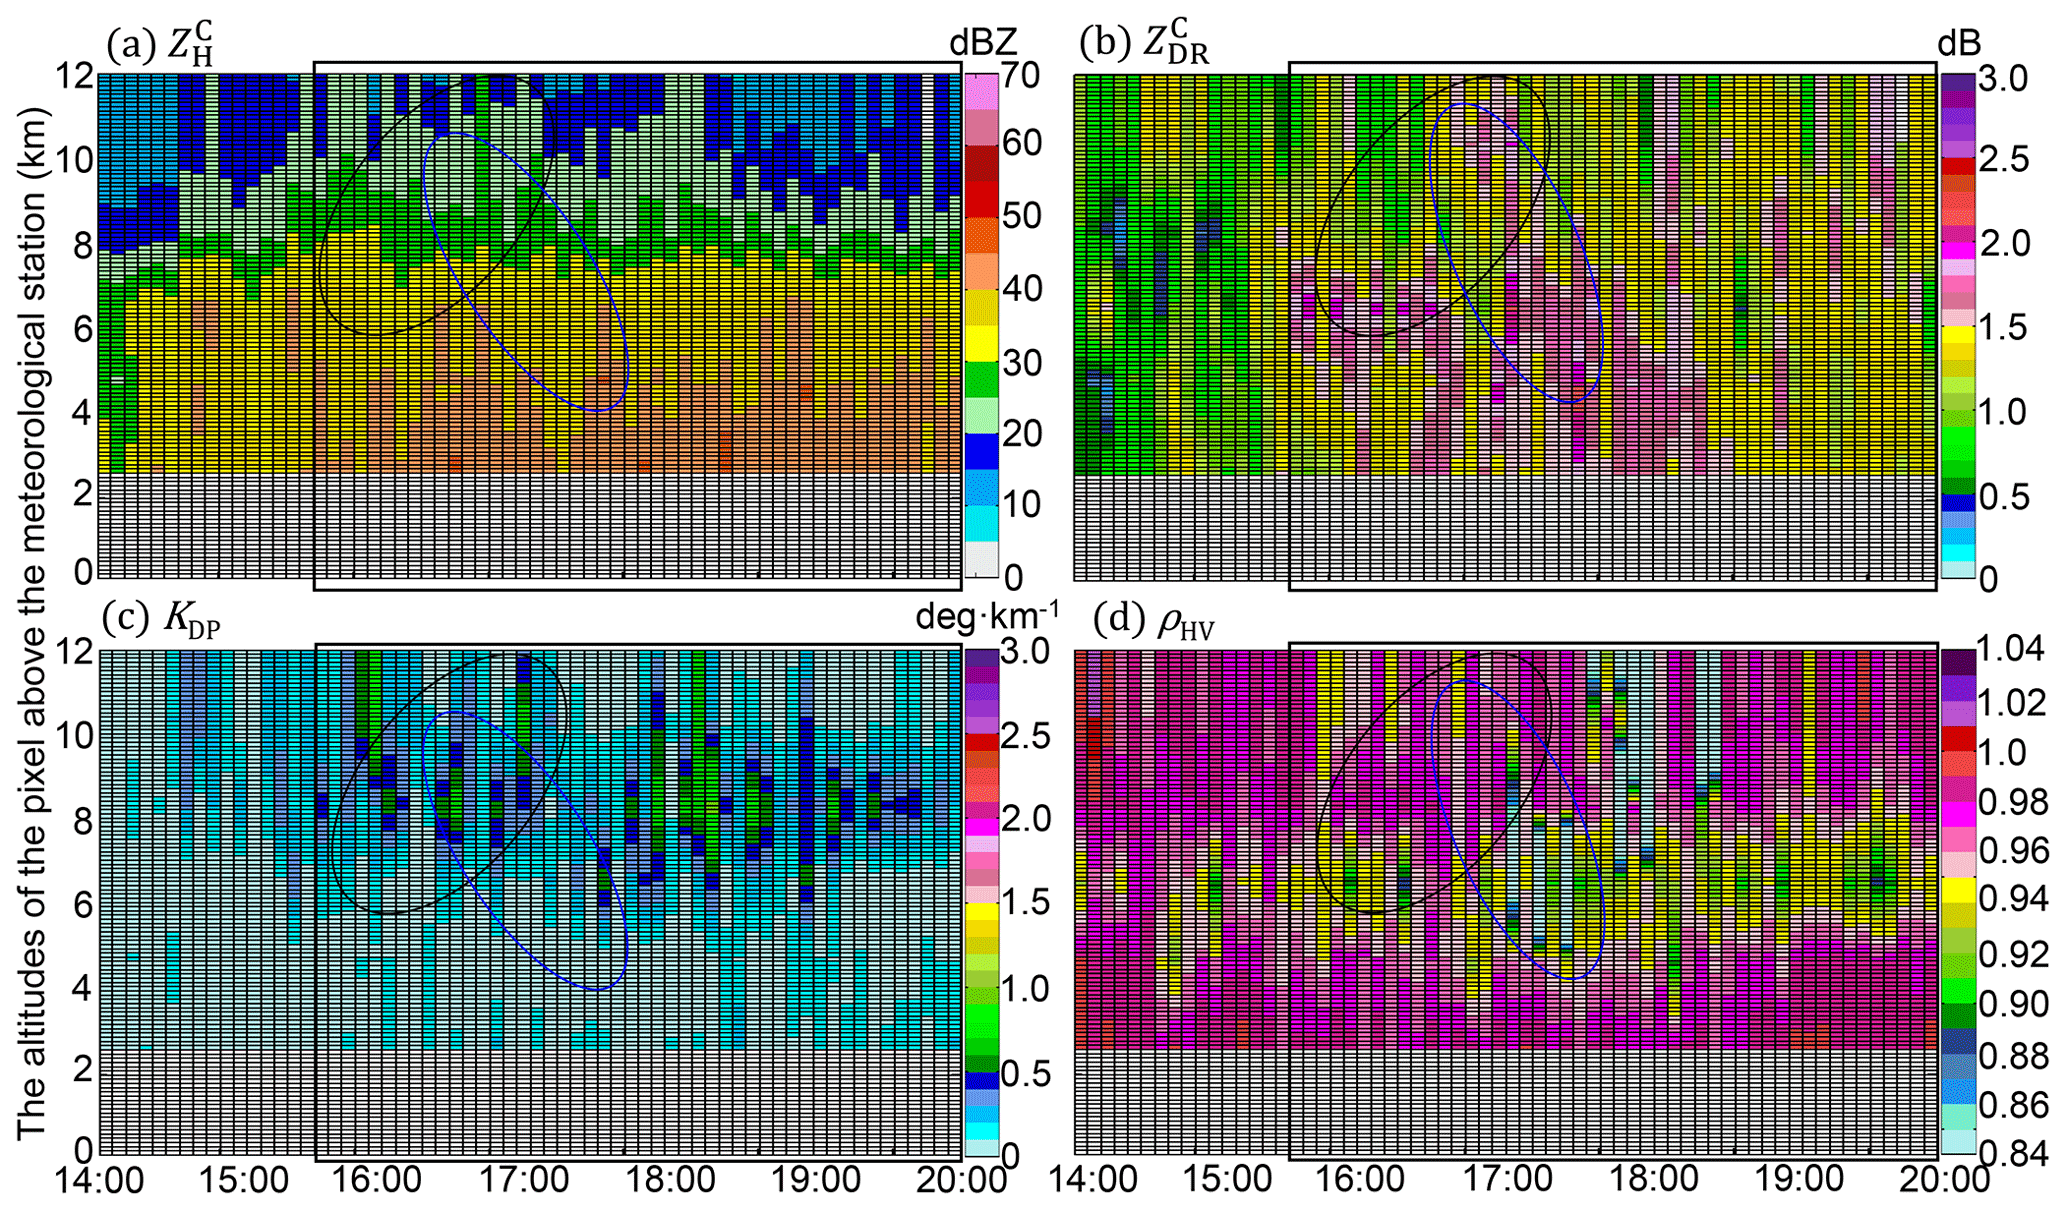
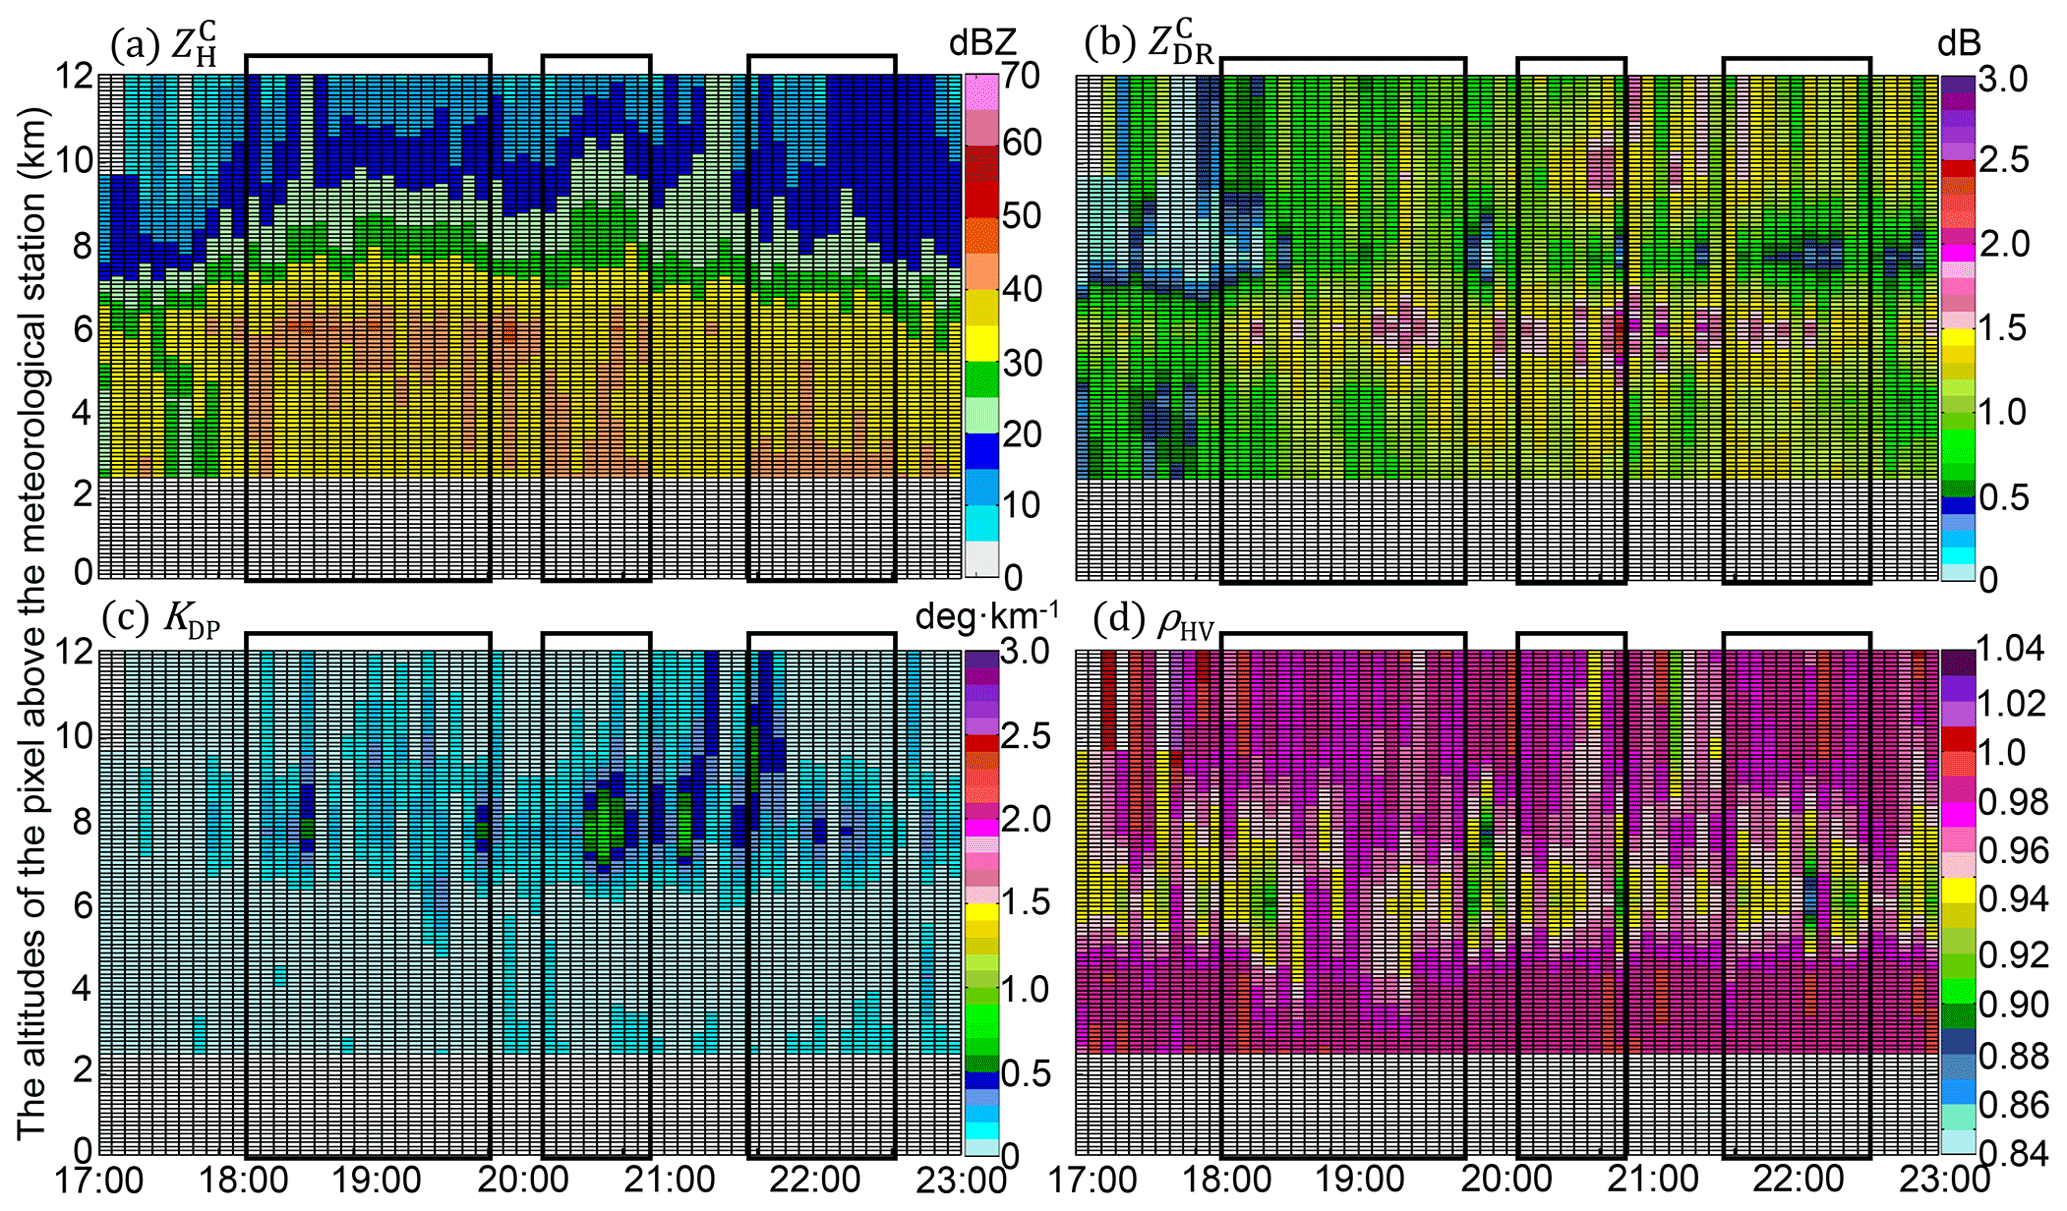
Figure 17The same as Fig. 12 but for the XJ station between 15:00 UTC, 8 August 2019, and 21:00 UTC, 9 August 2019.
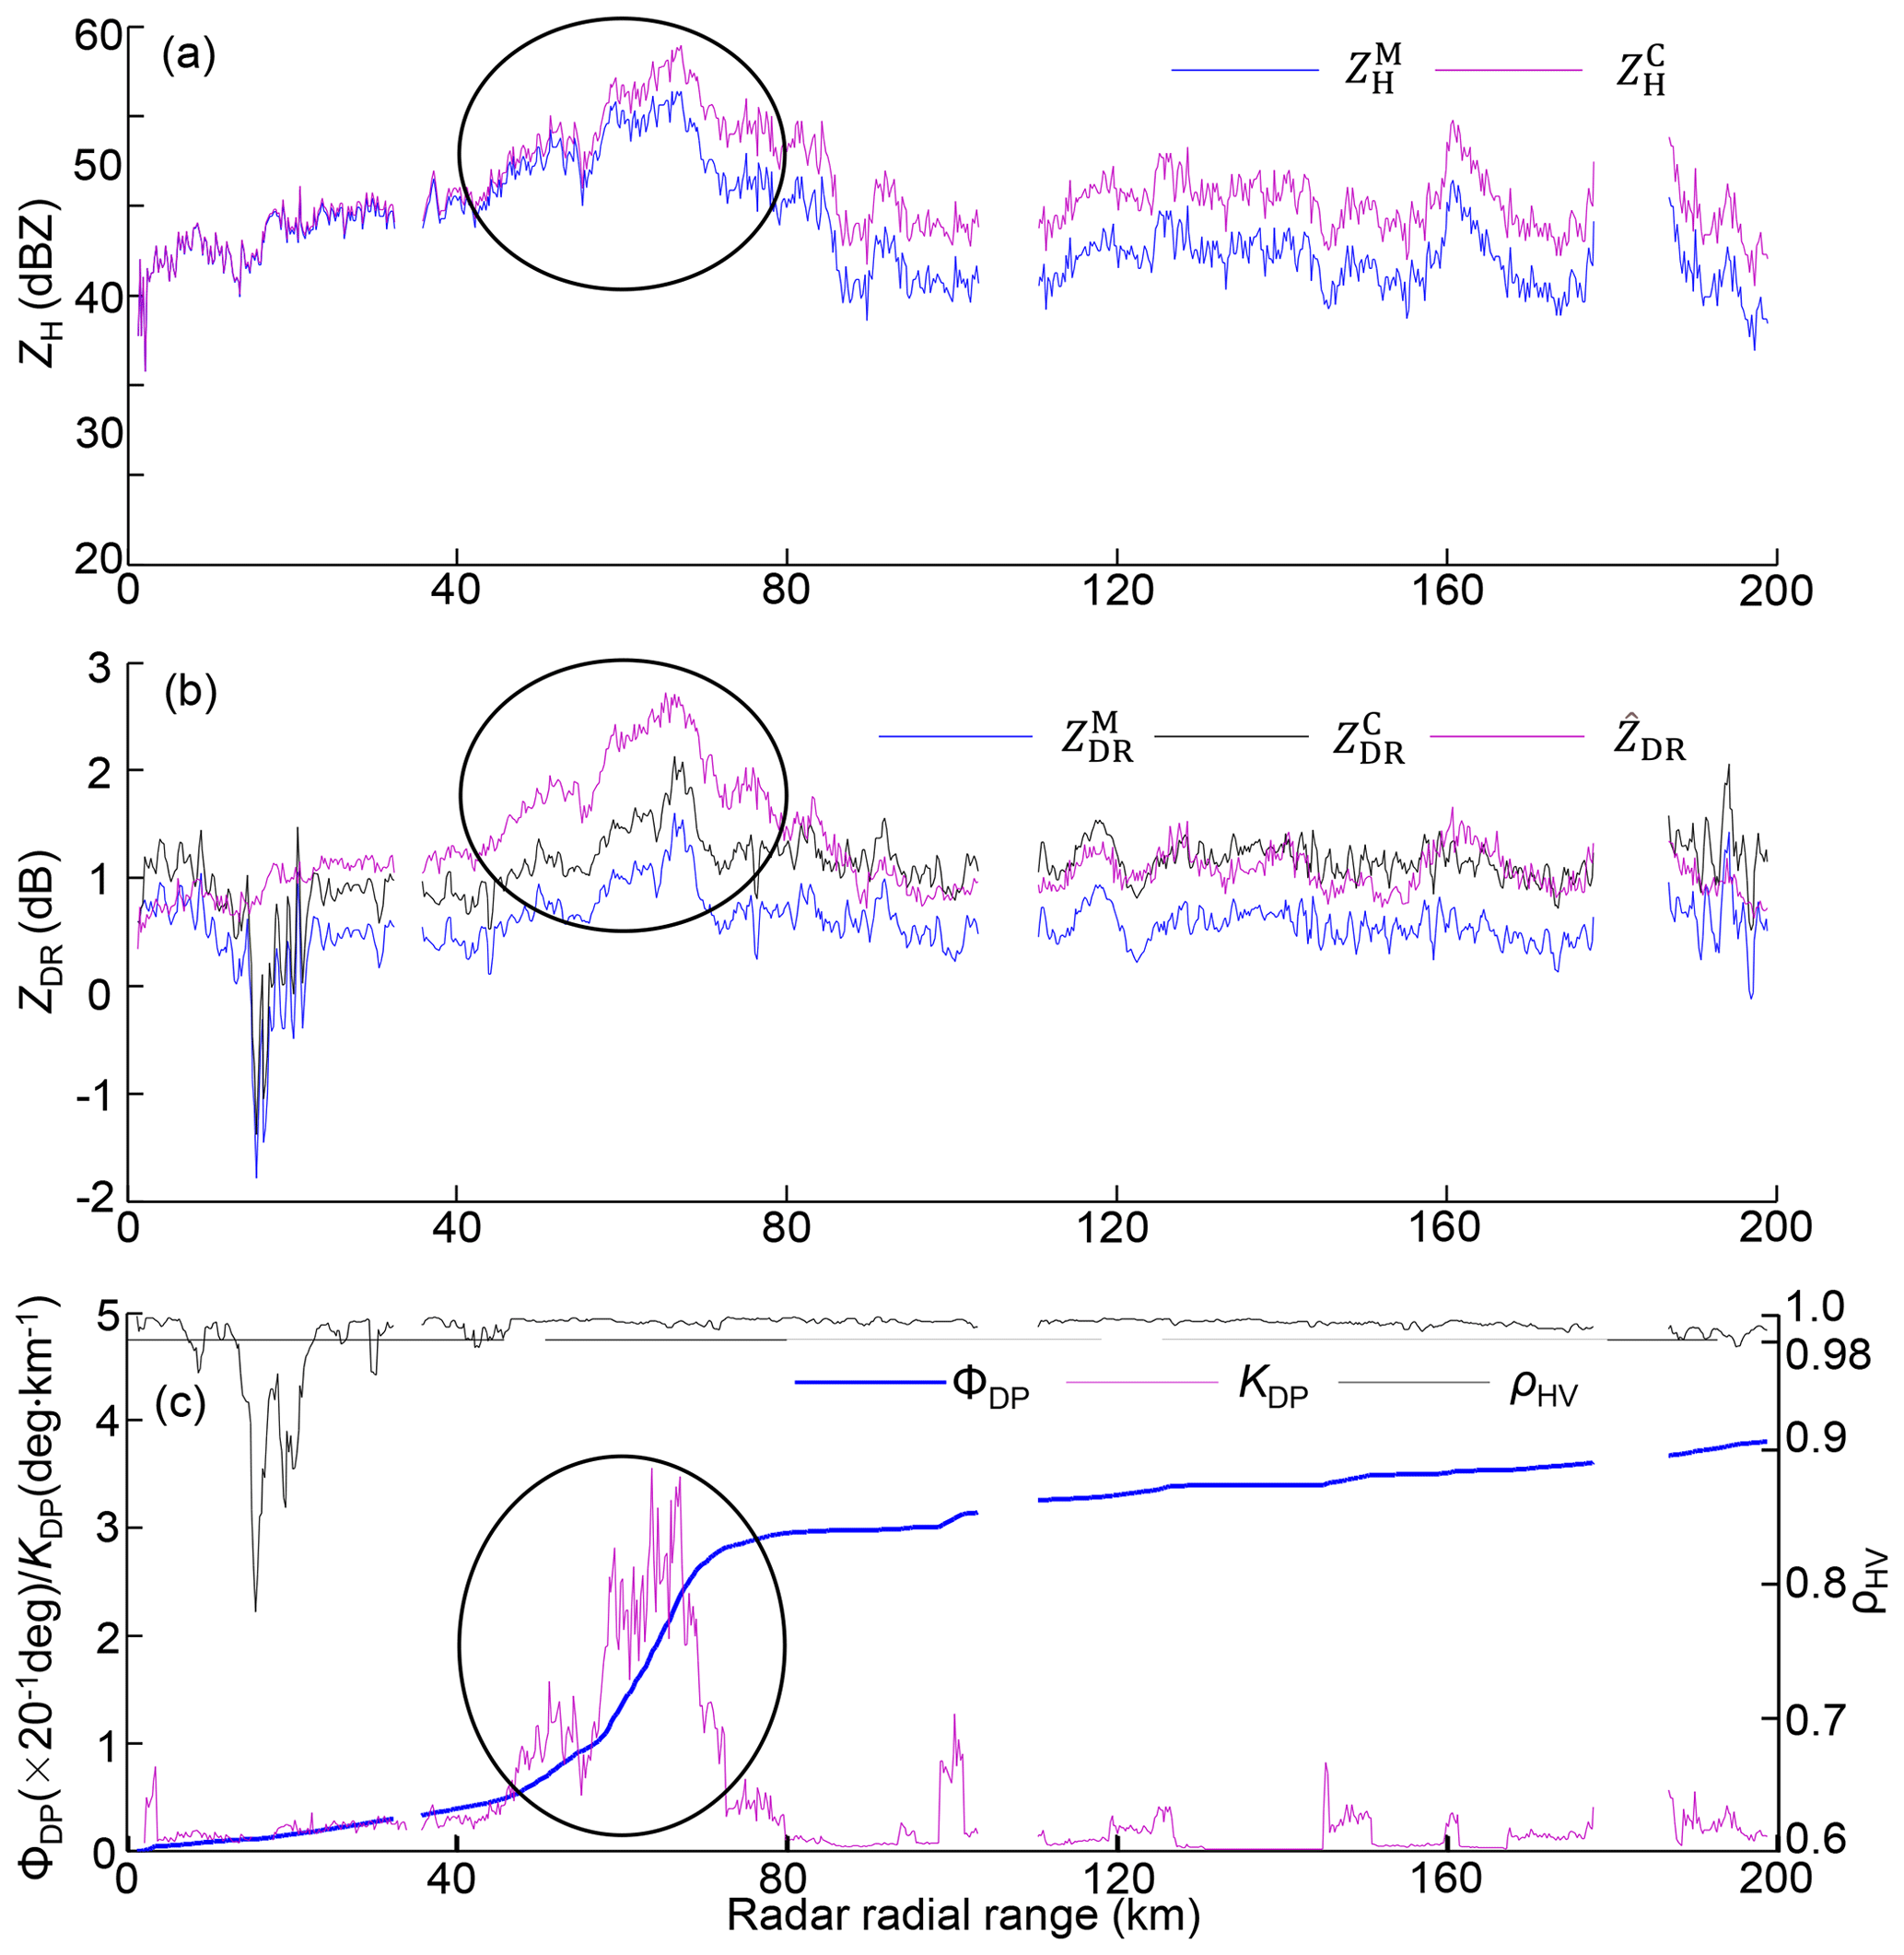
Figure 18The WZ-SPOL radar along a radial profile (azimuth angle = 46∘) at an elevation angle of 0.5∘ at 17:59 UTC, 9 August 2019: (a) and ; (b) , , and ; and (c) ΦDP, KDP, and ρHV. This azimuth angle is marked in Fig. 11.
3.2.2 Polarimetric signatures of raindrops
The deviation of from is a non-negligible phenomenon during landfall of Lekima: underestimated in Fig. 11i–l compared with in Fig. 11m–p emerged in areas with significant KDP in Fig. 11q–t, which simultaneously emerged around the GWS of YDM. Apparently, cannot completely approximate after correction; intrinsically, the microphysical composition issue, either dominant large-sized or small-sized raindrops filling in radar volume gates, resultantly determines final – distribution. One typical radial range profile in Fig. 18 is detailed to clarify this phenomenon. The ellipse-surrounded storm area contributes the most attenuation and differential attenuation with maximum ΔZH = 7.9 dBZ and ΔZDR = 0.645 dB, respectively, in Fig. 18a and b. Although the correction can result in enhanced consistency between ZH and KDP (see Sect. 3.1.2) and some have indeed partly approximated well to (outside the ellipse in Fig. 18b), the other within the storm (in the ellipse) still have a residual ZDR bias of about −1 dB. Additionally, ρHV ranging from 0.99 to 1 (in Fig. 15c) further indicates the dominance of pure liquid precipitation; high LWC and Nw can be deduced from Eqs. (8) and (9) (KDP ≈ 3.5 ∘ km−1; ΔΦDP ≈ 68.5∘ in Fig. 12c). ZH is a composite integral of hydrometeors with different sizes and number concentrations, and ZDR is sensitive to hydrometeor size; therefore, high concentrations of small-sized drops rather than large-sized drops contribute more to radar-measured in radar volume gates. This unique composition resultantly causes an overestimated estimated by , or conversely, underestimated compared with .
The hydrometeor size sorting (HSS) partly accounts for the position inconsistency between and , and it is significant in the rectangle-surrounded area of the inner eyewall, characterized by a maximum of in Fig. 12i on the significant upwind gradients of KDP in Fig. 12q (Homeyer et al., 2021; Hu et al., 2020). Since in Fig. 12e and KDP in Fig. 12q are consistent with each other, the large estimated by also horizontally deviates from the area with large . Differential sedimentation of hydrometeors of various sizes is the intrinsic reason for HSS (Feng and Bell, 2019), which is significant in the outer eyewall. The higher LWC (> 3 g m−3) features the outer eyewall as depicted in Fig. 16e; the area with large (> 2 dB) consists of dominant larger-sized drops with D0 > 1.8 mm in Fig. 16a, but relatively lower concentration with log10(Nw) > 4.4 in Fig. 16a than in its downwind area. Meanwhile, lower LWC (< 2 g m−3) features a cyclonical downwind area, but this area consists of dominant higher concentrated (log10(Nw) > 4.4) small-sized drops (D0 < 1.625 mm). However, HSS cannot account for the overall underestimation of when pixels with large , , and KDP coincide.
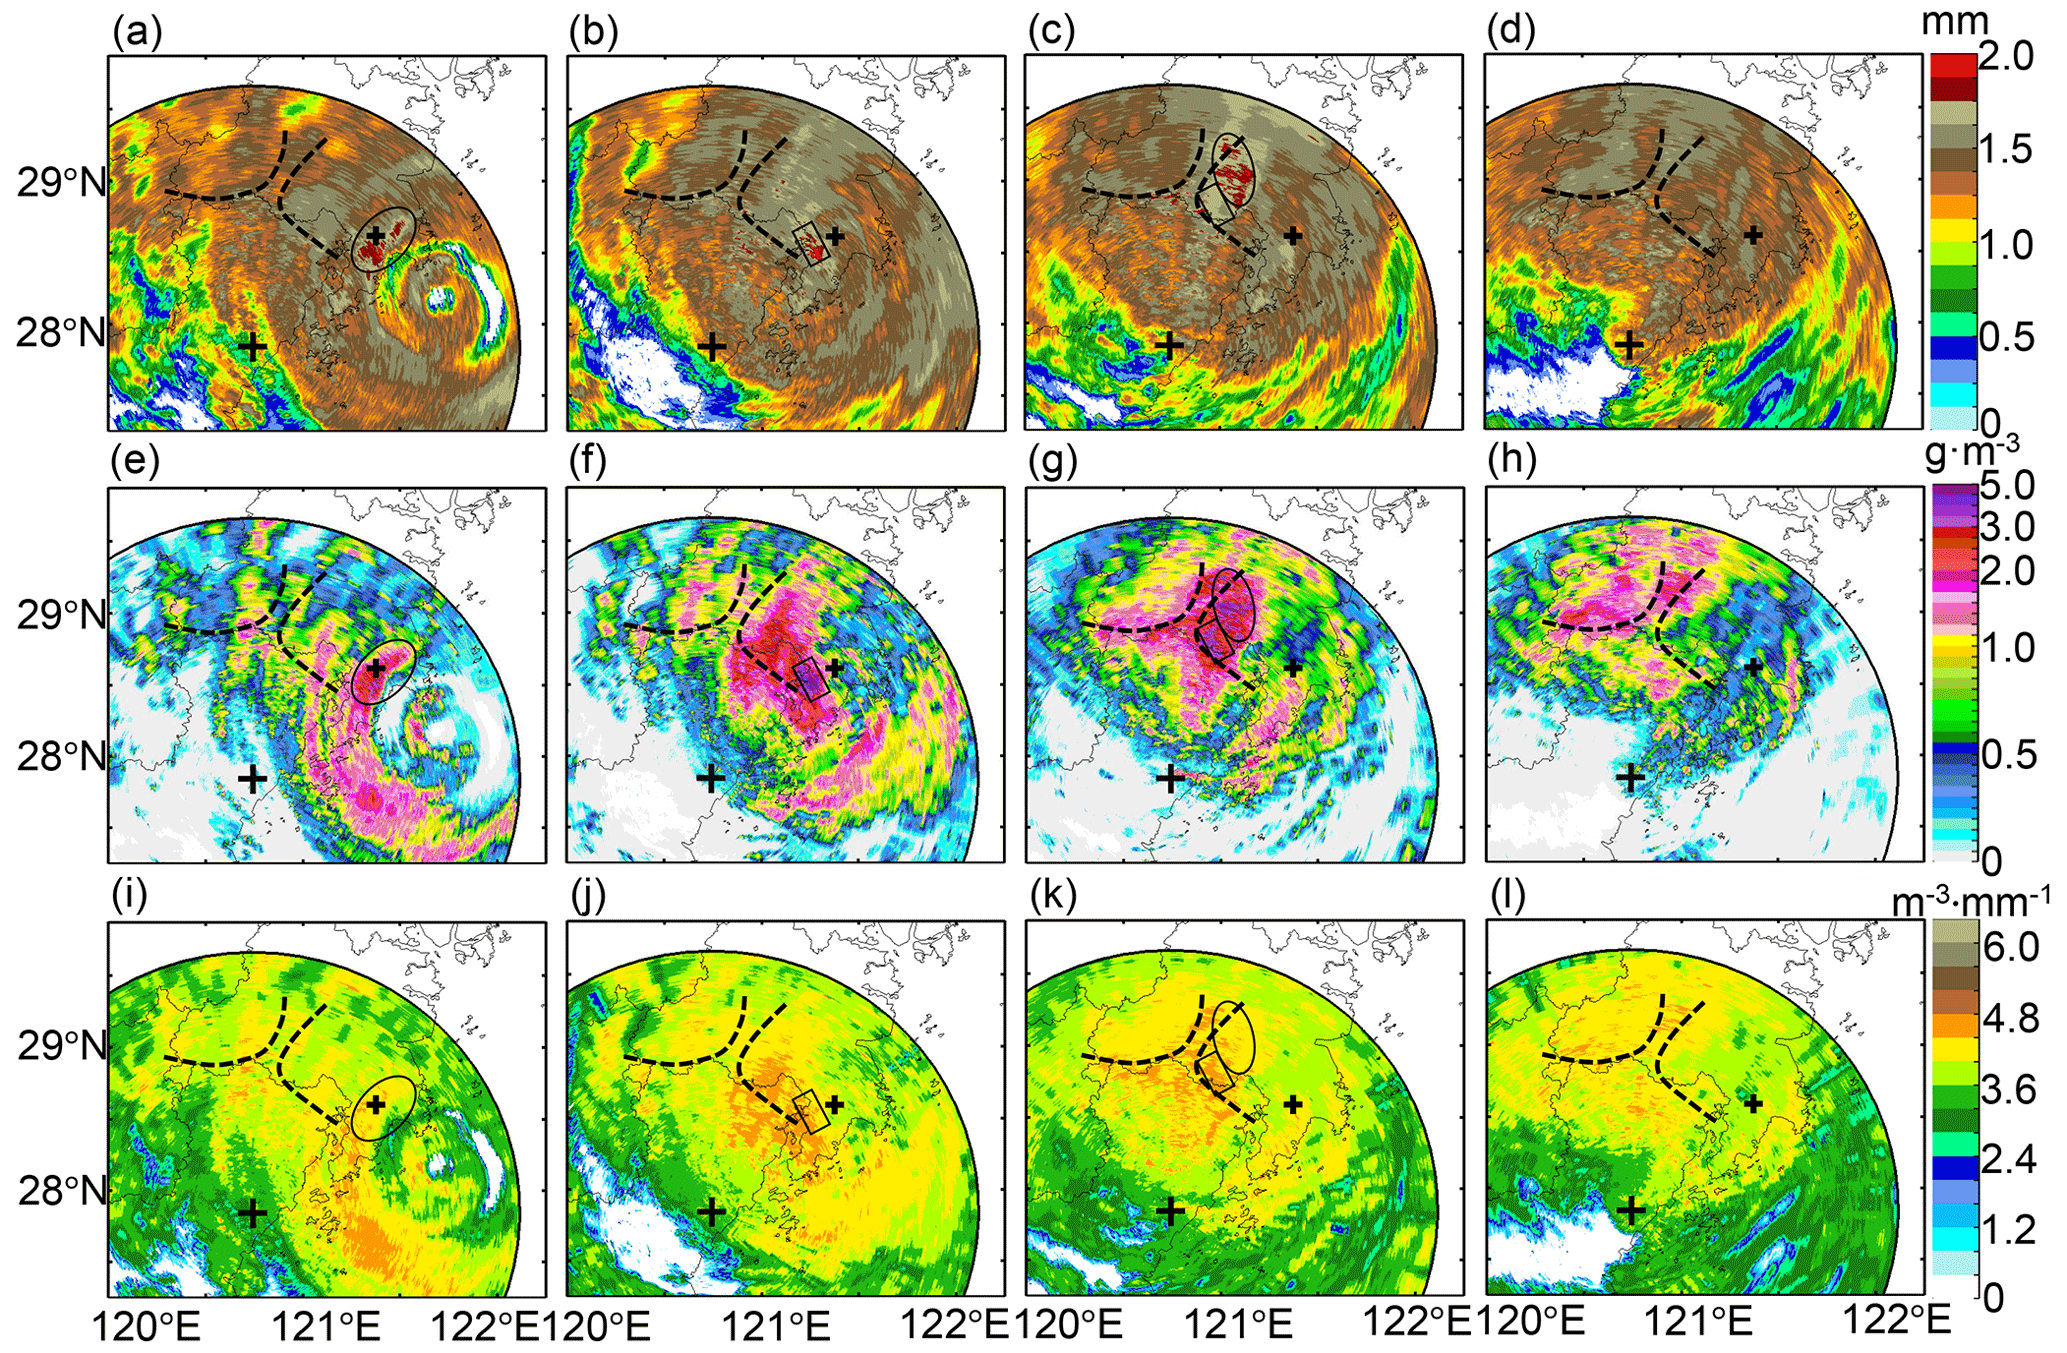
Figure 19Radar-retrieved DSD parameters during typhoon Lekima: (a)–(d) are D0 at 16:01, 17:59, 20:02, and 22:00 UTC, 9 August 2019, respectively; (e)–(h) and (i)–(l) are LWC and log10(Nw), respectively, at the same time as (a)–(d). Two dashed lines refer to the GWS of YDM and KCM. The large + indicates the location of the WZ-SPOL radar site, and the little + indicates the location of the WL station.
The collision process in warm rain has three probable colliding outcomes: bounce, coalescence, and breakup. In one volume gate, bounce cannot change raindrop size and concentration; coalescence boosts the size increase, but breakup increases the concentration. The existence of large raindrops with D0 > 1.8 mm around the GWS of YDM (in Fig. 19b and c) indeed back the occurrences of collision–coalescence processes, which corresponds to (> 1.8 dB in Fig. 11j and k). However, if the size increases contribute enough in one volume gate, might have well-approximated in the storm area and agree better with . In addition, raindrops cannot continue increasing their size; spontaneous breakup (Srivastava, 1971) or collision–breakup due to vertical wind shear (i.e., Deng et al., 2019) co-occurs during the falling process of drops:
- i.
The first evidence comes from the radar-measured – scattergram in Fig. 11d, and it tends to be more consistent with ZDR–ZH relationships dominated by small-sized drops related to the breakup, not large-sized drops related to the coalescence. This also agrees with the simulation results in Kumjian and Prat (2014).
- ii.
The second natural phenomenon is the decreasing ZDR downward in the lower atmospheric layers. Although some columns were indeed enhancing downward in Figs. 12–17, particularly in the time frames with significant updrafts with extending upwards upon WL and YH, more time frames presented a dominant decreasing toward the ground, such as at DT, HJ, LH, and XJ.
- iii.
The residual differences between radar and DSD are evident for the possible process in the vertical gap between radar volume gates and the surface. If dominant collision–coalescence occurred, DSD-derived ZDR should be more significant than their radar counterparts in the air. However, the opposite is true at XJ, HJ, and LH, as depicted in Fig. 10. Meanwhile, DT exhibits similar ZDR, ZH, and KDP to its radar counterparts after the landfall of Lekima, which is also evidence against the contribution from coalescence.
The collision–coalescence indeed occurs, but the breakup balances the size increase. This is evident in the evolutions of D0 and Nw constrained by a given LWC, which is typical around the GWS of YDM. In Fig. 19c, g, and k, the identical LWC fill in the rectangle-surrounded and ellipse-surrounded regions; the latter exhibits larger D0 (> 1.75 mm) but lower Nw with log10(Nw) < 4.4; conversely, the former shows smaller D0 (< 1.75 mm) but higher Nw with log10 (Nw) > 4.4. Similar situations occurred in the two left columns in Fig. 19, and sparse large-sized D0 is only prominent in a small area (in ellipse and rectangle); high Nw but small D0 are features of the other parts of the typhoon. The LWC in one range gate will contribute not only to the size increase but also to the concentration, attributing to the balance between coalescence and breakup.
Combining the abovementioned observations, the overwhelming breakup of large-sized drops over coalescence firmly restrains the magnitudes of radar-measured for a given , accounting for the noticeable deviation of from (in Fig. 11). Despite all this, collision–coalescence accompanied by the terrain-enhanced precipitation occurred when Lekima took high LWC (> 2 g m−3) and passed over YDM, as depicted in Fig. 19f and g, resulting in an overall LWC reduction around the GWS of KCM (i.e., Fig. 19g to h). During this period, D0 and Nw simultaneously increased: D0 increased by about 0.5 mm from Fig. 19a to D0 > 1.5 mm in Fig. 19c; log10 (Nw) increased about 0.4–0.8 from Fig. 19i to k, and these enhancements coincided well with the GWS of YDM. The gradual but insignificant enhancement persisted around the GWS of KCM, including an LWC increase by about 1 g m−3 (i.e., Fig. 19e–h), a diameter transition from D0 < 1.25 mm to D0 > 1.5 mm (i.e., Fig. 19a–d), and growth of log10 (Nw) about 0.4 in sparse pixels (i.e., Fig. 19i–l), but this enhancement was relatively weaker than that around the GWS of YDM. This comparison indicates that extensive large-sized drops had formed and fallen around the GWS of YDM before Lekima moved to the north, which effectively accounts for the flood disasters. However, the utilization of radar-measured may not derive accurate radar rainfall fields.
3.3 Radar QPE analysis
3.3.1 The performances of radar QPE
Utilizing the DSD dataset from S0, three primary radar rainfall rate relationships for R(ZH), R(KDP), and R(ZH, ZDR) are respectively established as
based on the standard weighted least squares nonlinear fitting method and DSD-derived radar variables (depicted in Fig. 20). In addition, , , and are integrated with ZH to exploit the impacts of the above-mentioned microphysical process on radar QPE algorithms. The pixel-to-pixel linear average accumulation scheme is utilized to retrieve radar 6 h rainfall fields for these radar QPE estimators and is then evaluated independently by comparing gauge 6 h rainfall measurements through the absolute normalized mean error (ENMA), root mean square error (ERMS), and correlation coefficient (ECC) as
where ri and gi refer to radar rainfall estimates and gauge rainfall. The 6 h radar rainfall fields retrieved by R(), R(), R(KDP), R(, ), R(, ), and R(, ) are derived in Fig. 21, as well as the scattergram between radar rainfall estimates and gauge rainfall measurements, depicted in Fig. 22, to reveal their practical performances around the disaster area.
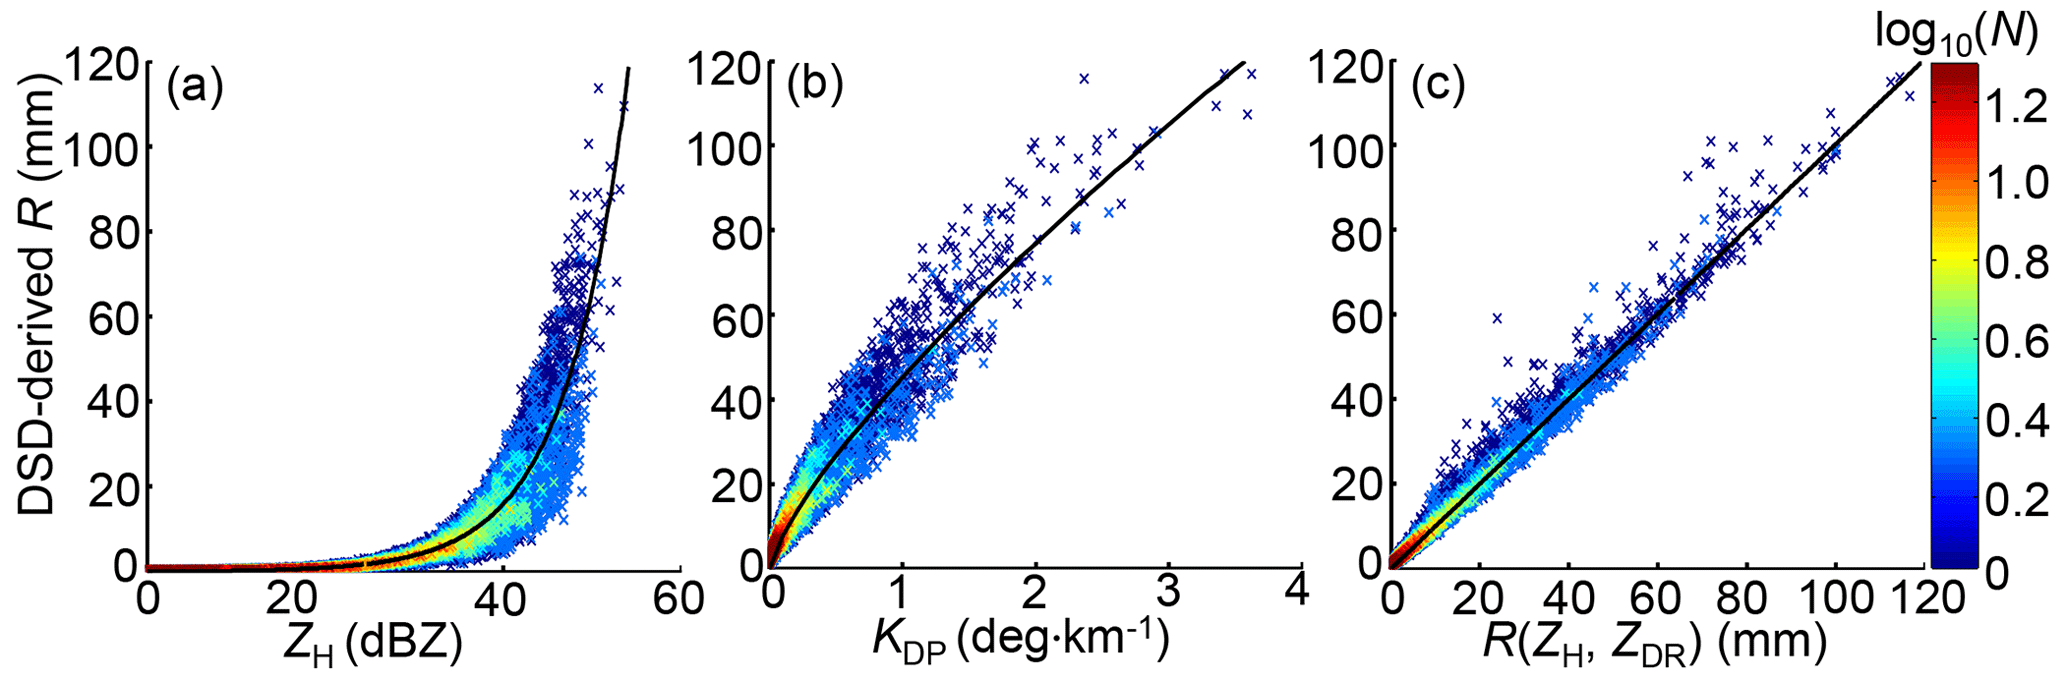
Figure 20The scattergram of (a) DSD-derived R vs. ZH, (b) DSD-derived R vs. KDP, and (c) DSD-derived R vs. R estimated by fitted R(ZH, ZDR).
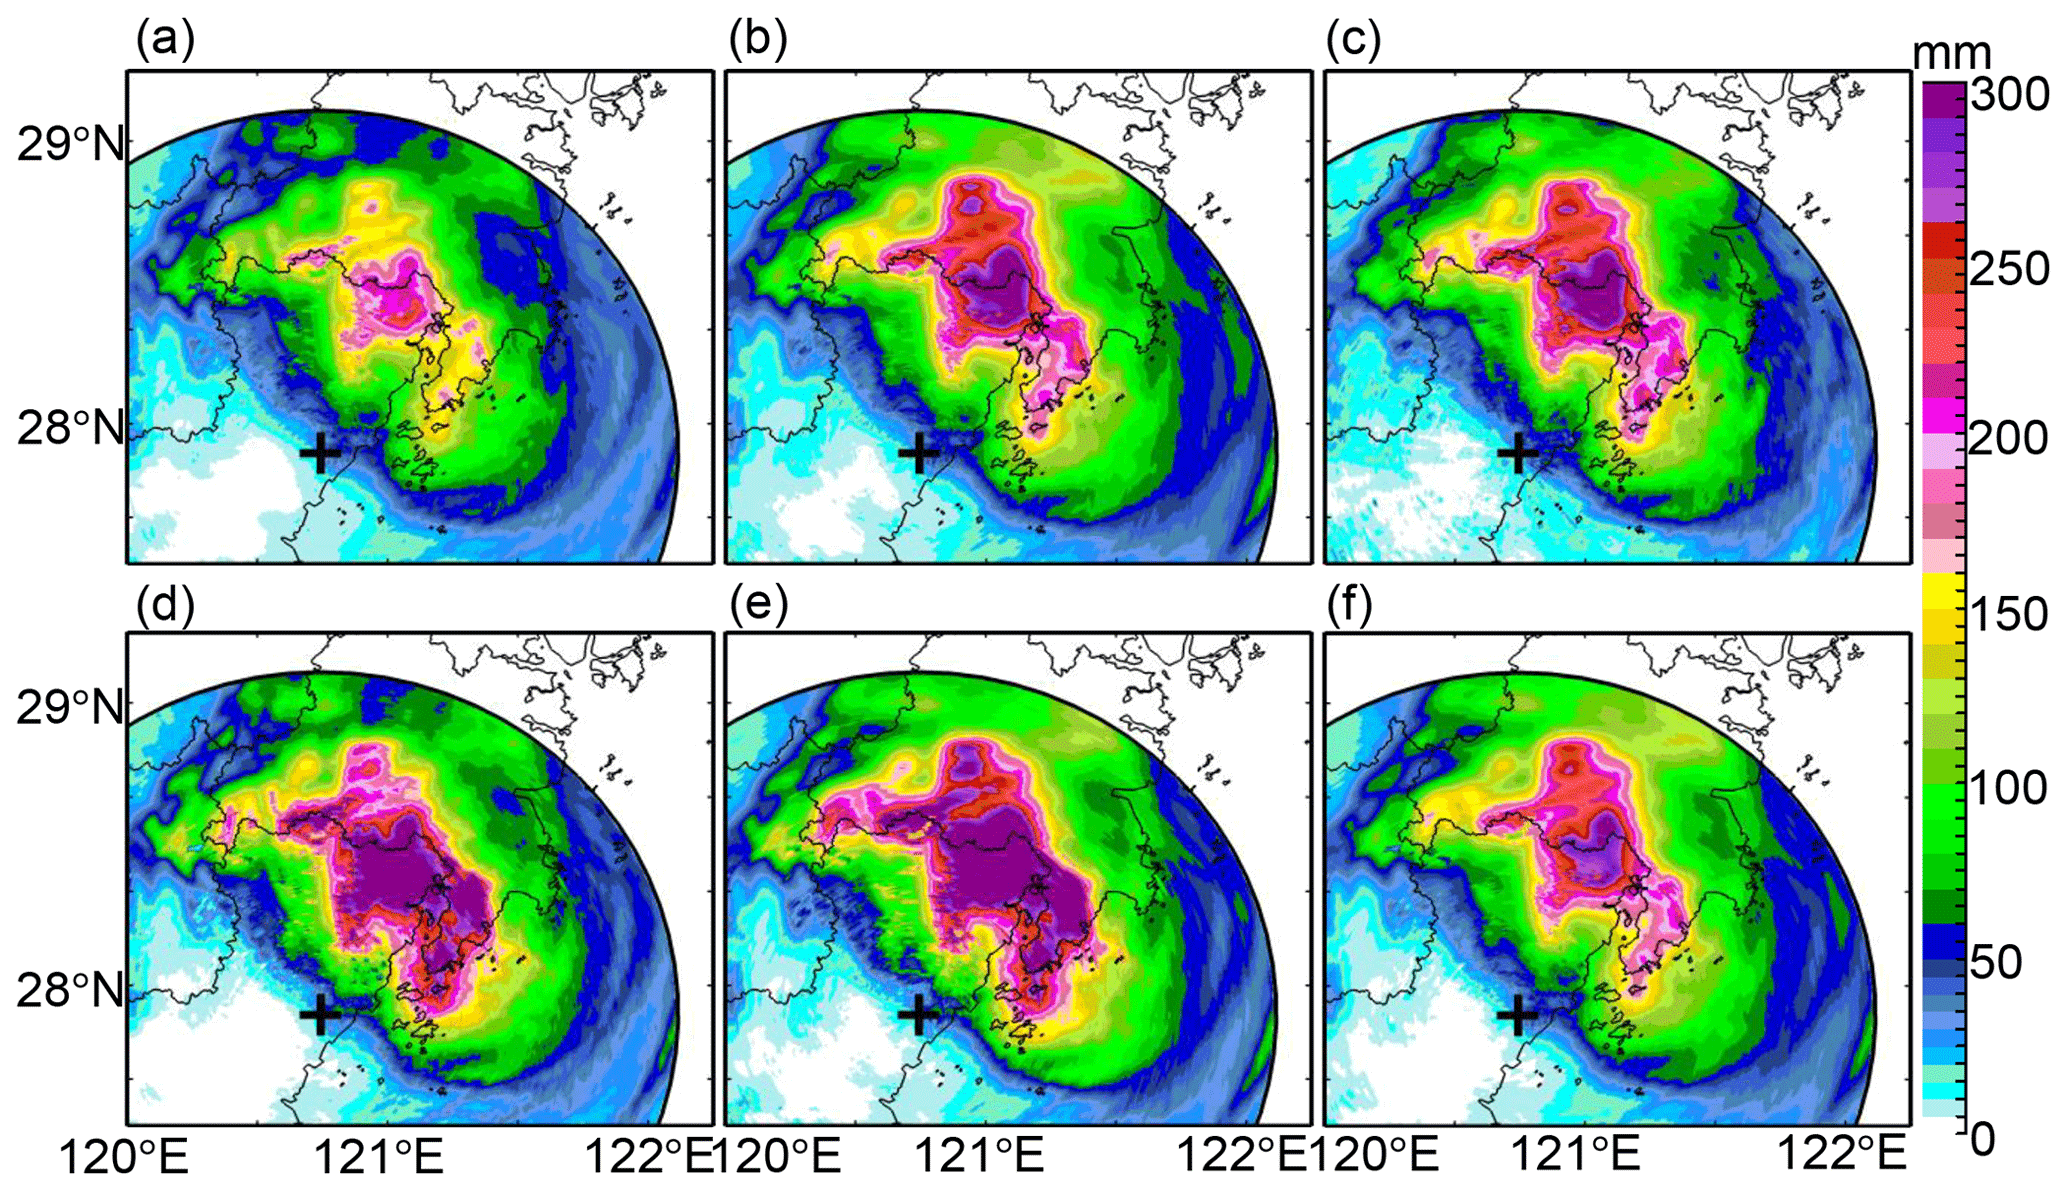
Figure 21The 6 h rainfall estimates derived from (a) R(), (b) R(), (c) R(KDP), (d) R(, ), (e) R(, ), and (f) R(, ) at 22:00 UTC, 9 August 2019. Two dashed lines refer to the GWS of YDM and KCM, and + refers to the WZ-SPOL radar site.
R() presents lower rainfall estimates in Fig. 21a than the other radar rainfall estimators in Fig. 21b–f, although they have similar rainfall center shapes. In terms of statistical scores in Table 1, R() does not perform the worst among all radar rainfall estimators. Its ERMS, ENMA, and ECC even outperform R(, ) by 57 %, 31.6 % and 7.9 %, and outperform R(, ) by 63.8 %, 34.9 % and 6 %, respectively. However, its underestimation can easily be perceived from the scatters in Fig. 22a when rainfall recordings exceed 100 mm in the center rainfall area. This phenomenon can be ascribed to the attenuation on caused by the highly concentrated hydrometeors in the storm during the landfall of Lekima.
Table 1Evaluation scores of 6 h rainfall accumulations based on six radar QPE relationships.


Figure 22The scattergram of 6 h rainfall estimates from radar versus corresponding gauge rainfall measurements. The radar rainfall estimates are derived at 22:00 UTC, 9 August 2019, using (a) R(), (b) R(), (c) R(KDP), (d) R(, ), (e) R(, ), and (f) R(, ).
In contrast, R() in Fig. 21b presents higher rainfall estimates and R() mainly overestimates, since more scatters are distributed above the diagonal line (y=x) as depicted in Fig. 22b, and its ECC outperforms that of R() by 4.2 %, even with larger ENMA and ENMA scores. The overestimation of R() in the rainfall center area conversely demonstrates the effectiveness of the attenuation correction based on the ZPHI approach, because the same R(ZH) relationship is utilized for the rainfall retrieval; the only difference is the replacement of with .
R(KDP) in Fig. 21c presents a similar rainfall field structure to R(). The scores of R(KDP) are just a little superior to that of R() in Table 1, with its ERMS, ENMA, and ECC outperforming that of R() by 3.1 %, 3.2 %, and 0.5 %, respectively. The scattergrams in Fig. 22b and c are also similar to each other, indicating that R(KDP) and R() both overestimate, although R(KDP) is less overestimated when rainfall recordings are less than 100 mm. Their similar performances can be attributed to the consistency between radar-measured KDP and measurements as described in Sect. 3.1.2.
R(, ) and R(, ) in Fig. 21d and e both present significantly higher estimates in the rainfall center area than the others, which results in severe overestimation according to the scattergrams in Fig. 22d and e. Furthermore, R(, ) obtains the worst ERMS and ENMA scores of all radar rainfall estimators, and this can be explained based on the ZH-related and ZDR-related calculation items as demonstrated in Fig. 23: obtains much higher rainfall estimates through ZH-related items than . However, the calculation needs to be further adjusted through the ZDR-related item: the larger ZDR measurements correspond to fewer final rainfall estimates. A −0.5 dB ZDR bias could result in relatively less rainfall adjustment, according to Fig. 23. The attenuation effects on make the corresponding rainfall calculation less adjusted, which can effectively account for the overestimation of R(, ). However, the correction cannot make completely consistent with , but it is underestimated, as demonstrated in Sect. 3.1.2, which is related to the dynamic microphysical process described in Sect. 3.2.
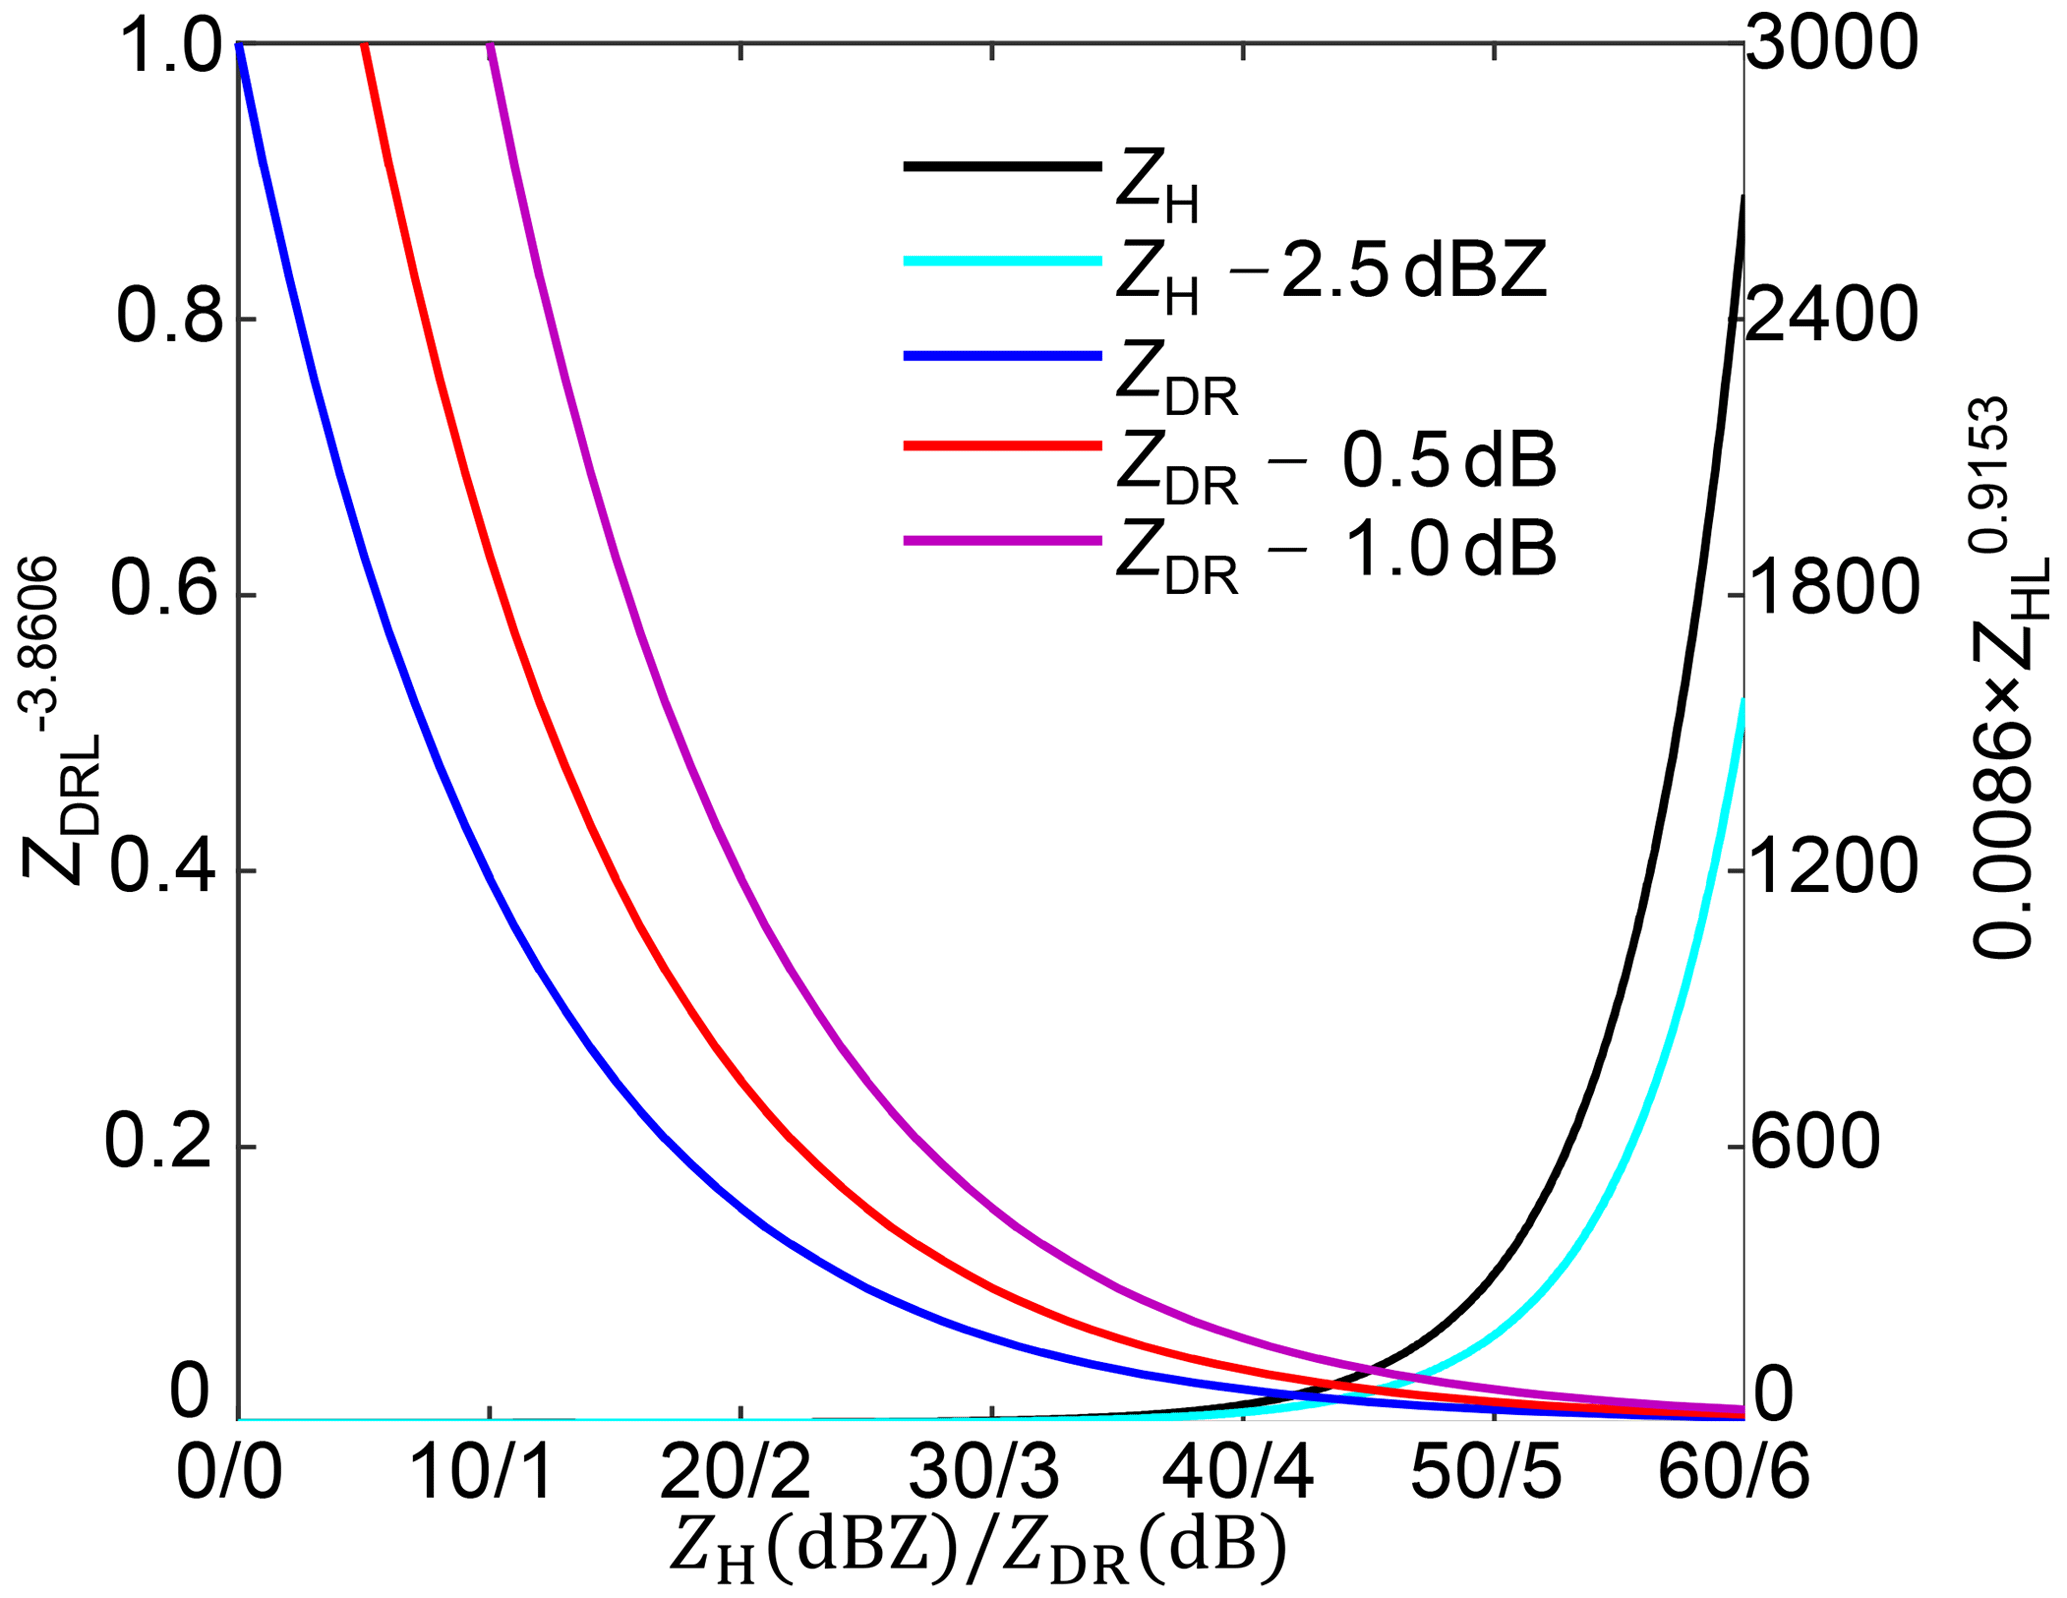
Figure 23The contribution of ZH-related and ZDR-related terms in the R(ZH, ZDR) relationship with different ZH and ZDR biases. The R(ZH, ZDR) relationship is detailed in Eq. (12c). ZHL and ZDRL refer to ZH and ZDR at a linear scale.
The spatial texture of R(, ) in Fig. 21f presents slightly fewer rainfall estimates than R() and R(KDP) in Fig. 21b and c, and the scattergram in Fig. 22f shows that R(, ) agrees better with the gauge rainfall than in Fig. 22b and c. R(, ) effectively reduces the overestimates and is obviously superior to R(, ) and R(, ). The ERMS/ENMA score of R(, ) is better than R() and R(KDP), by and , respectively, although its ECC score is slightly worse by 0.2 % and 0.3 %. The superiority of R(, ) can also be apparently attributed to the incorporation of . is not a real radar measurement; it is directly estimated from from the theoretical DSD-derived ZDR–ZH relationship in Eq. (2a). is naturally self-consistent with and KDP, since and KDP have agreed well with their DSD-derived counterparts regarding the KDP–ZH distributions and pixel-to-pixel comparisons in Sect. 3.1. The utilization of the DSD-derived ZDR–ZH relationship intrinsically assumes that composition in radar volume gates has a similar size and concentration to its surface counterparts; therefore, can be seen as an equivalent radar variable. The replacement of with is also equivalent to imposing the surface raindrop size and concentration on radar measurements. The relatively larger than means a more significant adjustment can be performed for rainfall estimation using R(, ), according to Fig. 23, and this also indicates that the anticipated giant raindrops had fallen around the GWS of YDM. Except for the simultaneous D0 and Nw increases, the following alternative indirectly verifies the dominant collision–coalescence around this area.
3.3.2 The impacts of microphysical processes on radar QPE
The consistency between radar and surface measurements is critical for radar QPE algorithms, but the microphysical process in the vertical gap between air and surface may worsen the practical performances of radar QPE. This is the case around the GWS of YDM: the primary outcome of the collision process transitions from a dominant breakup in the air to dominant coalescence near the surface due to the topographical enhancement. Using radar measurements on the lowest elevation angle to retrieve radar QPE implicitly assumes that they are representative of surface precipitation, but they are not in this situation; only R(ZH), R(KDP), and R(ZH, ZDR) relationships established based on the DSD dataset represent the feedback near the surface. Although R(, ) performs best, can also be estimated by Eqs. (11a)–(11c). However, changes little if a smaller or larger estimated by Eqs. (11a)–(11c) is imposed in the correction procedure, as – scattergrams shown in Fig. 24a–c. Furthermore, the corresponding three R(ZH, ZDR) relationships based on SI–SIII can be established as
The alternative utilization of SI–SIII slightly changes the parameters of R(ZH, ZDR) with minor rainfall rate differences estimated by Eqs. (12c), (14a)–(14c). However, the impacts on are non-negligible, particularly for a given exceeding 35 dBZ, and smaller means weaker adjustment for the ZHL-related item, as depicted in Fig. 23.

Figure 24Scattergrams between and , utilizing estimated by (a) Eq. (11a) (the blue curve), (b) Eq. (11b) (the red curve), and (c) Eq. (11c) (the purple curve). The black curve stands for Eq. (2a).
As in the analysis in Sect. 3.1.2, radar-measured – in volume gates tend to be more consistent with SI and SII, because breakup overwhelms in the coalescence–breakup balance, so if breakup still dominates when these drops further fall on the ground, R(, estimated by Eqs. (14a) and (14b) should perform better than that estimated by Eq. (12c). However, in reality, their spatial fields in Fig. 25a and b and scattergrams in Fig. 26a and b conversely present a similar overestimation as R(, ) and R(, ), which contradict the anticipated results. Such a contradiction means estimated by Eqs. (11a) and (11b) is not representative enough for surface precipitation. In contrast, R(, ) in Fig. 25c shows even lower rainfall estimates than that in Fig. 21f (obtained through Eq. 12c based on S0), which can also be seen by comparing the scattergrams in Figs. 26c and 22f. In addition, when large-sized drops are gradually excluded from the DSD dataset for and R(, , ECC changes little in Table 2, whereas ERMS and ENMA both exhibit a monotonic increasing tendency, implying the non-negligible contribution of large-sized drops around the GWS of YDM.
Table 2Evaluation scores of R(, ) calculated by different datasets*.
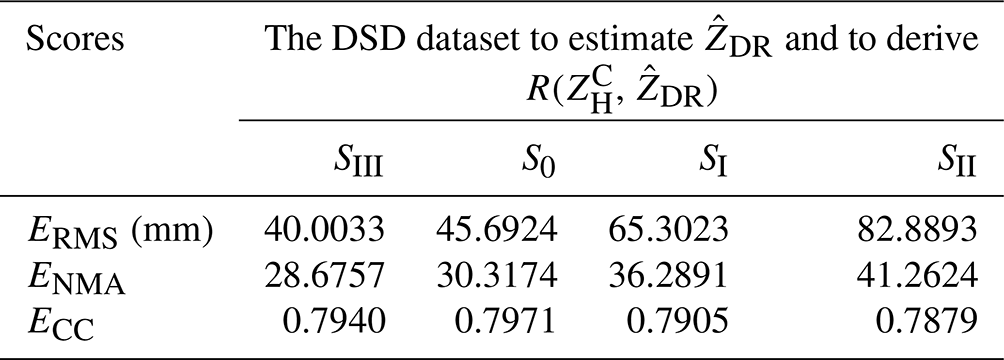
* SIII includes more size–velocity pairs than S0.
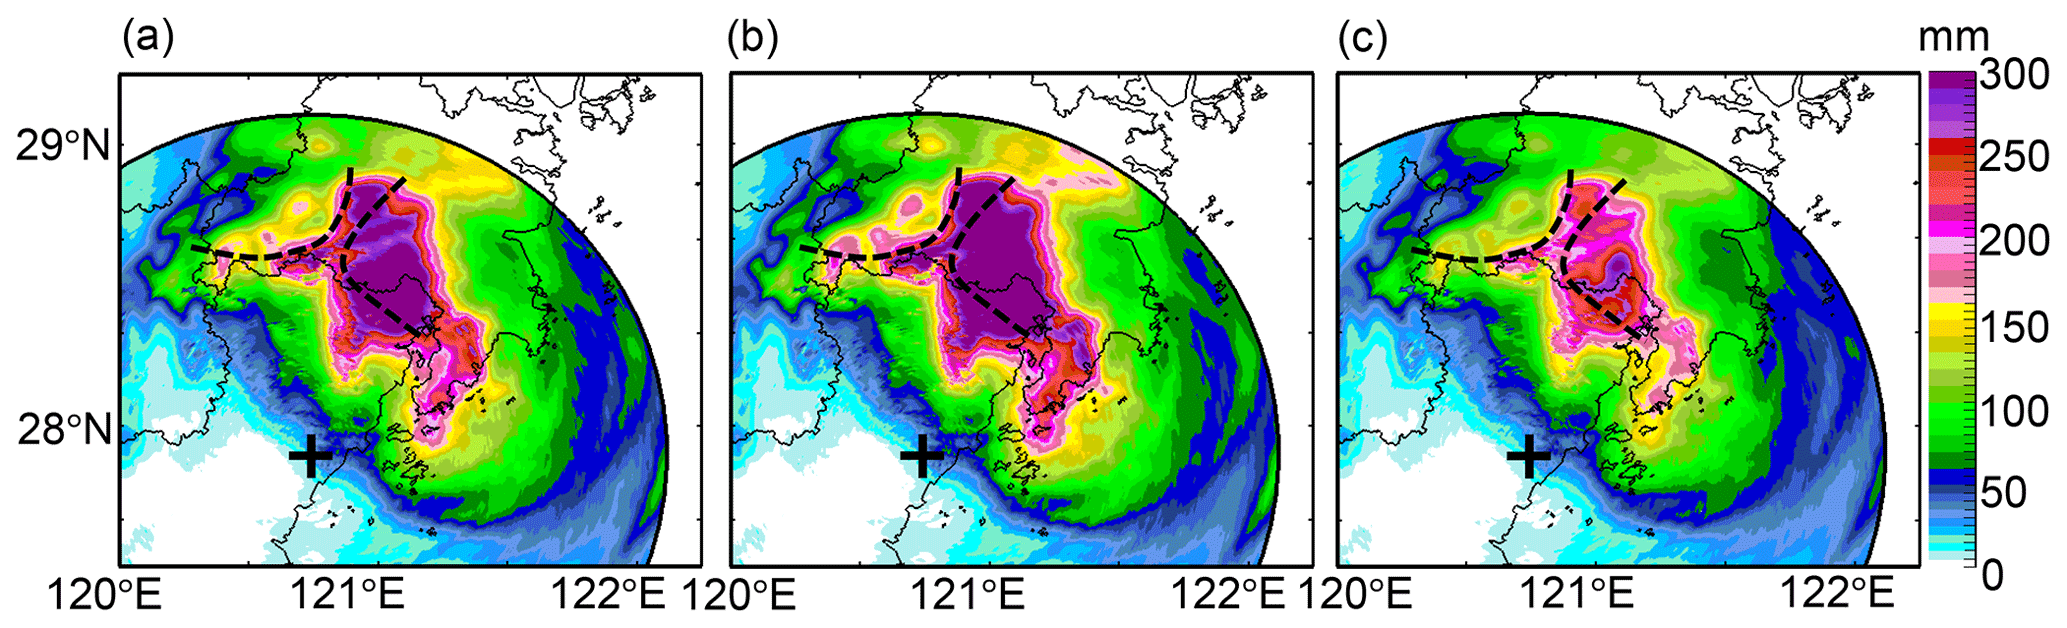
Figure 25The same as Fig. 21, but (a)–(c) were calculated with Eqs. (14a)–(14c), respectively.
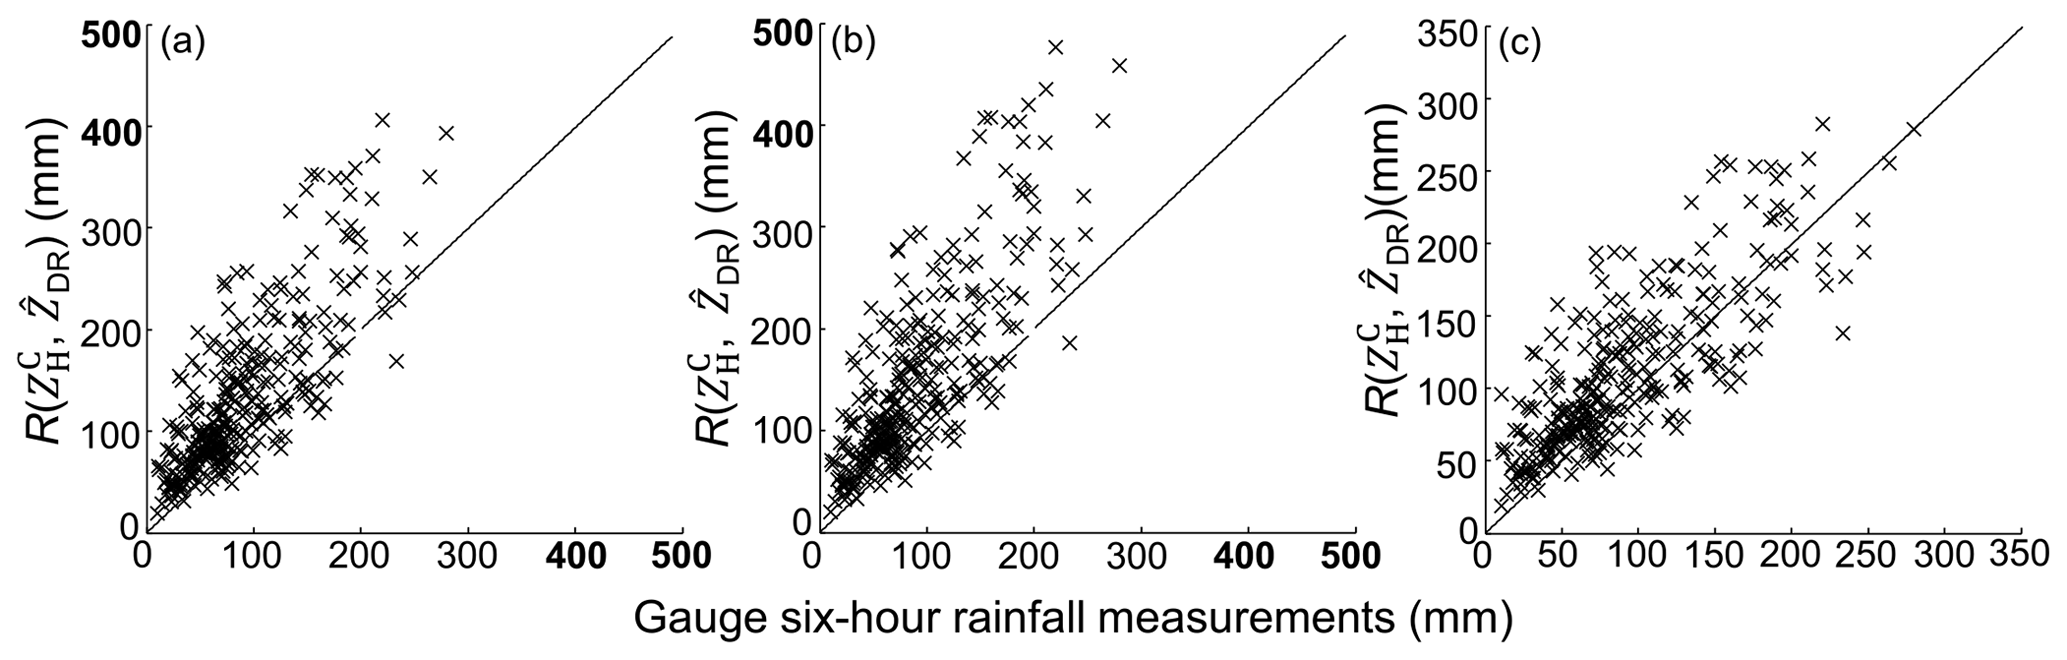
Figure 26The scattergram of 6 h rainfall estimates from R(, ) versus corresponding gauge rainfall measurements at 22:00 UTC, 9 August 2019: (a)–(c) are, respectively, for results calculated using Eqs. (14a)–(14c).
The dominant breakup in the air but dominant coalescence around the GWS of YDM can be ascribed to the overshooting of radar beams and the topographical enhancement. In this sense, the utilization of instead of equals a physical conversion of breakup-dominated outcome in one volume gate for a given into their coalescence-dominated counterparts in an average sense. In this conversion process, consistency between radar-measured and KDP in the air and the surface counterparts (DSD-derived KDP and ZH) has been achieved, as indicated in Sect. 3.1.2, demonstrating the mass conservation characteristics of falling drops. Therefore, radar-measured and KDP around the GWS of YDM may change insignificantly, which makes it conducive for R(, to obtain a better radar rainfall field.
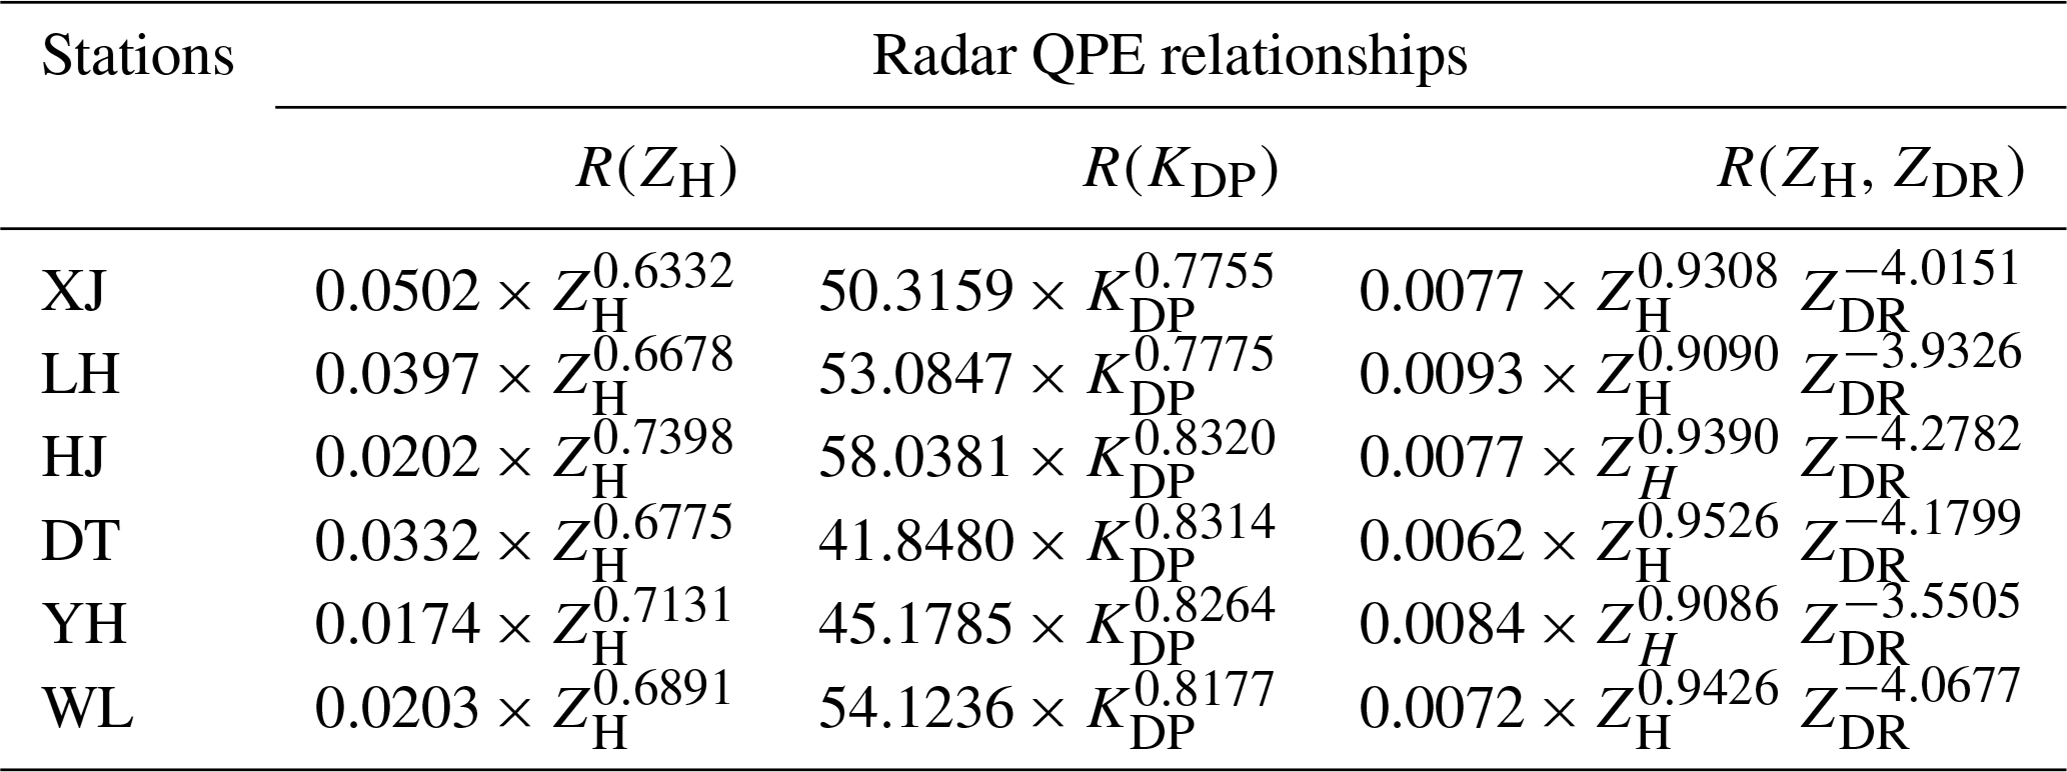
Table 3Radar QPE relationships at six different meteorological stations.
3.4 Discussion
The microphysical processes during the landfall of typhoon Lekima have been revealed based on the analysis of consistency between measurements from radar, disdrometers, and rain gauge networks. The cause of the flood disaster around the GWS of YDM, and its impacts on the practical performance of radar QPE algorithms have been investigated. Several critical issues should be considered for radar quantitative applications in future:
- i.
High-quality DSD datasets could lay a solid foundation for microphysical analysis and polarimetric radar applications, but selecting representative datasets for different microphysical processes is critical to determine parameters for quantitative applications, such as the construction of relationships between ZH, ZDR, KDP, and R. The size–velocity QC procedure could be deeply refined for radar QPE in cold seasons. So far, one-dimensional disdrometers (OTT or Thies) are the main facilities to collect DSD measurements in the national meteorological stations over China. However, both GWS areas in this article have no DSD measurements for directly revealing and validating the critical precipitation process in the typhoon center area. Furthermore, there are more similar GWS areas in south China, thus deploying some two-dimensional disdrometers in these vital target locations could be beneficial for future research.
- ii.
The polarimetric radar measurements are indispensable for microphysical analysis and quantitative applications. In particular, ZDR provides critical signatures for analyzing the collision process in this super typhoon event. Currently, more X-band polarimetric radar systems have been planned and/or deployed to fill the gap of operational S-band radar networks. Although ZDR of S-,C-, and X-band radars is sensitive to drop size in different degrees, ZDR biases in X-band radar measurements can be more serious in a super typhoon case due to radome attenuation. The correction methods of ZH and ZDR in this article could potentially be further refined for X-band applications.
- iii.
The spatial variability of precipitation could be far more complex, and it is oversimplified to assert that convective or stratiform rainfall always exhibits breakup or coalescence (Kumjian and Prat, 2014). It is noticed that the practical performances of R(, ) rely on determining optimal based on the representative DSD dataset of the microphysical process, which is the main limitation of R(, ). R(KDP) or R(AH) are insensitive to such uncertainty, and they can outperform R(, ) if they are further optimized. In addition, a single relationship between R and radar measurements might not be applicable to all range gates within the radar coverage, for example, R(ZH), R(KDP), and R(ZH, ZDR) relationships listed in Table 3 are different; therefore, the residual differences between radar estimates and gauge measurements are still significant for R(), R(KDP), and R(, ). Merging radar with gauge measurements may partly reduce such differences if surface gauge rainfall bias caused by strong wind can be mitigated effectively.
- iv.
The vertical gap between radar measurements and surface hinders deriving more optimal relationships and the complete vertical view of the microphysical processes, which are critical in precipitation events such as this super typhoon case. Sophisticated correction models are necessary to mitigate uncertainty caused by the vertical gap, such as the classical models for vertical extrapolation if only radar measurements on higher altitudes are available, either caused by complete beam blockage of mountainous terrain or the high altitudes of radar sites. Efficient implementation of the correction models requires prior knowledge of vertical microphysical precipitation variations. Still, the precipitation process should be determined to effectively match the model with radar measurements. In this typhoon case, the microphysical process is much more complicated, but if the coalescence–breakup balance of the collision process can be measured quantitatively and incorporated into radar QPE algorithms in the future, a more reasonable model can be established to enhance radar QPE performance.
This paper utilized a range of data, including observations from the WZ-SPOL radar, disdrometers, and gauge rainfall measurements, to analyze the microphysical processes during the landfall of Lekima (2019). The investigation focused on demonstrating the impacts of precipitation microphysics on the consistency of multi-source measurements and radar QPE performance. The main findings are summarized as follows:
- i.
Measurements from radar, disdrometers, and rain gauges are more consistent after the QC processing, including attenuation correction of radar observations and wind and hail/graupel processing of size–velocity measurements from disdrometers.
- ii.
The breakup overwhelms coalescence as the primary outcome of the collision process of raindrops, noticeably making radar-measured – be breakup-dominated, which accounts for that high drop concentration rather than large drop size contributes more to a given and the residual deviation of from .
- iii.
R() performs comparably well with R(KDP) owing to attenuation correction, but R(, ) performs worse with serious overestimation. This is related to the unique microphysical process around the GWS of YDM, in which the breakup-dominated small-sized drops in radar sampling volumes were located above the surface but coalescence-dominated large-sized drops were near the surface.
- iv.
R(, ) outperforms R() and R(KDP) in terms of the ERMS and ENMA scores, and the utilization of instead of is close to physically converting breakup-dominated measurements in radar range gates to coalescence-dominated counterparts, which boosts better self-consistency between , , and KDP and their consistency with the surface counterparts derived from disdrometer measurements.
The complex precipitation microphysics may have other unknown impacts on the self-consistency of radar measurements and the consistency between multi-source datasets, which is still a challenge for future research. An in-depth understanding of such microphysical processes is critical for improving radar quantitative remote sensing of precipitation. Deployment of cost-effective zenith radar (X- or Ka-band) networks may be an effective complement of operational weather radar networks. Collaborative observations of various remote sensing facilities such as these can not only help to resolve more microphysical processes in the vertical gaps currently missed by scanning radars but also support the development of more reasonable models to mitigate the resulting application uncertainty, especially in complex terrain regions.
The code and data that support the findings of this article are available on request from the first author (Yabin Gou) or corresponding author (Haonan Chen).
YG carried out the data collection and detailed analysis. He was also part of the polarimetric radar data processing and product generation team. HC supervised the work and provided critical comments. YG and HC wrote the manuscript. HZ contributed to critical comments and revisions. LX reviewed and edited the manuscript.
The contact author has declared that none of the authors has any competing interests.
Publisher's note: Copernicus Publications remains neutral with regard to jurisdictional claims in published maps and institutional affiliations.
This research is primarily supported by the National Natural Science Foundation of China under grant no. 41375038 and the Zhejiang Provincial Natural Science fund through award LY17D050001. The work of Haonan Chen is supported by the Colorado State University and the National Oceanic and Atmospheric Administration (NOAA) through Cooperative Agreement NA19OAR4320073. The authors acknowledge the anonymous reviewers for their careful review and comments on this article. They also thank Lin Deng at the Shanghai Typhoon Institute of China Meteorological Administration for the discussion on typhoon microphysical processes, Yuanyuan Zheng and Fen Xu at the Jiangsu Institute of Meteorological Sciences for the discussion on radar measurements during this particular event, and Bo Si and Xiaolong Huang for double-checking the locations and measurement quality of meteorological stations. The S-band polarimetric radar, disdrometer, and rain gauge data are provided by the Chinese Meteorological Administration and are available upon request.
This paper was edited by Yuan Wang and reviewed by two anonymous referees.
Bao, X., Wu, L., Zhang, S., Yuan, H., and Wang, H.: A comparison of convective raindrop size distributions in the eyewall and spiral rainbands of Typhoon Lekima (2019), Geophys. Res. Lett., 47, e2020GL090729, https://doi.org/10.1029/2020GL090729, 2020.
Beard, K. V.: Terminal velocity adjustment for cloud and precipitation drops aloft, J. Atmos. Sci., 34, 1293–1298, 1977.
Brandes, E. A., Zhang, G., and Vivekanandan, J.: Experiments in rainfall estimation with a polarimetric radar in a subtropical environment, J. Appl. Meteorol., 41, 674–685, 2002.
Bringi, V. N., Keenan, T. D., and Chandrasekar, V.: Correcting C-band Radar Reflectivity and Differential Reflectivity Data for Rain Attenuation: A Self-consistent Method with Constraints, IEEE T. Geosci. Remote, 39, 1906–1915. 2001.
Bringi, V. N., Rico-Ramirez, M. A., and Thurai, M.: Rainfall Estimation with An Operational Polarimetric C-Band Radar in the United Kingdom: Comparison with A Gauge Network and Error Analysis, J. Hydrometeorol., 12, 935–954, 2010.
Carlin, J. T., Gao, J., Snyder, J. C., and Ryzhkov, A. V.: Assimilation of ZDR Columns for Improving the Spinup and Forecast of Convective Storms in Storm-Scale Models: Proof-of-Concept Experiments, Mon. Weather Rev., 145, 5033–5057, 2017.
Chandrasekar, V., Chen, H., and Philips, B.: Principles of high-resolution radar network for hazard mitigation and disaster management in an urban environment, J. Meteorol. Soc. Jpn., 96, 119–139, 2018.
Chen, H. and Chandrasekar, V.: Real-Time Wind Velocity Retrieval in the Precipitation System Using High-Resolution Operational Multi-Radar Network. Remote Sensing of Aerosols, Clouds, and Precipitation, Elsevier, the Netherlands, 315–339, https://doi.org/10.1016/B978-0-12-810437-8.00015-3, 2018.
Chen, H., Chandrasekar, V., and Bechini, R.: An Improved Dual-Polarization Radar Rainfall Algorithm (DROPS2.0): Application in NASA IFloodS Field Campaign, J. Hydrometeorol., 18, 917–937, 2017.
Chen, H., Cifelli, R., and White, A.: Improving Operational Radar Rainfall Estimates Using Profiler Observations Over Complex Terrain in Northern California, IEEE T. Geosci. Remote, 58, 1821–1832, 2020.
Cifelli, R., Chandrasekar, V., Chen, H., and Johnson, L. E.: High Resolution Radar Quantitative Precipitation Estimation in the San Francisco Bay Area: Rainfall Monitoring for the Urban Environment, J. Meteorol. Soc. Jpn., 96, 141–155, 2018.
Dai, H., Zhao, K., Li, Q., Lee, W.-C., Ming, J., Zhou, A., Fan, X., Yang, Z., Zheng, F., and Duan, Y.: Quasi-periodic intensification of convective asymmetries in the outer eyewall of typhoon Lekima (2019), Geophys. Res. Lett., 48, e2020GL091633, https://doi.org/10.1029/2020gl091633, 2021.
Donavon, R. A. and Jungbluth, K. A.: Evaluation of a technique for radar identification of large hail across the upper midwest and central plains of the United States, Weather Forecast., 22, 244–254, 2007.
Deng, L., Gao, W., and Duan, Y.: A Modeling Study of the Effects of Vertical Wind Shear on the Raindrop Size Distribution in Typhoon Nida (2016), J. Geophys. Res.-Atmos., 124, 6501–6517, 2019.
Frasier, S. J., Kabeche, F., Figueras i Ventura, J., Al-Sakka, H., Tabary, P., Beck, J., and Bousquet, O.: In-Place estimation of wet-radome attenuation at X-band, J. Atmos. Ocean. Tech., 30, 917–928, https://doi.org/10.1175/JTECH-D-12-00148.1, 2013.
Feng, Y.-C. and Bell, M. M.: Microphysical characteristics of an asymmetric eyewall in major Hurricane Harvey, Geophys. Res. Lett., 46, 461–471, 2019.
Friedrich, K., Higgins, S. A., Masters, F. J., and Lopez, C. R.: Articulating and stationary PARSIVEL disdrometer measurements in conditions with strong winds and heavy rainfall, J. Atmos. Ocean. Tech., 30, 2063–2080, https://doi.org/10.1175/JTECH-D-12-00254.1, 2013.
Gosset, M., Zahirib, E. P., and Moumounic, S.: Rain Drop Size Distribution Variability and Impact on X-band Polarimetric Radar Retrieval: Results from the AMMA Campaign in Benin, Q. J. Roy. Meteor. Soc., 136, 243–256, 2010.
Gou, Y., Liu, L., Yang, J., Wu, C.: Operational application and evaluation of the quantitative precipitation estimates algorithm based on the multi-radar mosaic, Acta Metall. Sin., 72, 731–748, https://doi.org/10.11676/qxxb2014.050, 2014 (in Chinese).
Gou, Y., Ma, Y., Chen, H., and Wen, Y.: Radar-derived Quantitative Precipitation Estimation in Complex Terrain over The Eastern Tibetan Plateau, Atmos. Res., 203, 286–297, 2018.
Gou, Y., Chen, H., and Zheng, J.: An Improved Self-Consistent Approach to Attenuation Correction for C-band Polarimetric Radar Measurements and Its Impact on Quantitative Precipitation Estimation, Atmos. Res., 226, 32–48, 2019a.
Gou, Y., Chen, H., and Zheng, J.: Polarimetric Radar Signatures and Performance of Various Radar Rainfall Estimators during an Extreme Precipitation Event over the Thousand-Island Lake Area in Eastern China, Remote Sensing, 11, 2335, https://doi.org/10.3390/rs11202335, 2019b.
Gou, Y., Chen, H., and Chandrasekar, V.: A Dynamic Approach to Quantitative Precipitation Estimation Using Multiradar Multigauge Network, IEEE T. Geosci. Remote, 58, 6376–6390, 2020.
Homeyer, C. R., Fierro, A. O., Schenkel, B. A., Didlake, A. C., Jr., McFarquhar, G. M., Hu, J., Ryzhkov, A. V., Basara, J. B., Murphy, A. M., and Zawislak, J.: Polarimetric Signatures in Landfalling Tropical Cyclones, Mon. Weather Rev., 149, 131–154, 2021.
Hu, J., Rosenfeld, D., Ryzhkov, A., and Zhang, P.: Synergetic Use of the WSR-88D Radars, GOES-R Satellites, and Lightning Networks to Study Microphysical Characteristics of Hurricanes, J. Appl. Meteorol. Clim., 59, 1051–1068, 2020.
Huang, H., Li, Q., Zhao, K., Dai, H., Ming, J., Fan, X., Xu, Y., Duan, Y., Lee, W.-C., and Feng., Z.: Microphysical characteristics of the phase-locking VRW-induced asymmetric convection in the outer eyewall of Super Typhoon Lekima (2019), Geophys. Res. Lett., 49, e2021GL096869, https://doi.org/10.1029/2021GL096869, 2022.
Hubbert, J. and Bringi, V. N.: An Iterative Filtering Technique for The Analysis of Copolar Differential Phase and Dual Frequency Radar Measurements, J. Atmos. Ocean. Tech., 12, 643–648, 1995.
Hubbert, J., Dixon, M., and Ellis, S.: Weather Radar Ground Clutter. Part II: Real-Time Identification and Filtering, J. Atmos. Ocean. Tech., 26, 1181–1197, 2009.
Keenan, T. D., Carey, L. D., Zrnic, D. S., and May, P. T.: Sensitivity of 5-cm Wavelength Polarimetric Radar Variables to Raindrop Axial Ratio and Drop Size Distribution, J. Appl. Meteorol., 40, 526–545, 2001.
Kumjian, M. R. and Prat, O. P.: The Impact of Raindrop Collisional Processes on the Polarimetric Radar Variables, J. Atmos. Sci., 71, 3052–3067, 2014.
Lee, G. and Zawadzki, I.: Variability of drop size distributions: time-scale dependence of the variability and its effects on rain estimation, J. Appl. Meteorol., 44, 241–255, 2005.
Matrosov, S. Y.: Evaluating polarimetric X-band radar rainfall estimators during HMT, J. Atmos. Ocean. Tech., 27, 122–134, 2010.
Marzen, J. L.: Development of a Florida high-resolution multisensor precipitation dataset for 1996–2001 – Quality control and verification. MS thesis, Department of Meteorology, Florida State University, 86 pp., http://purl.flvc.org/fsu/fd/FSU_migr_etd-2681 (last access: 1 January 2022), 2004.
Park, S., Maki, M., Iwanami, K., Bringi, V. N., and Chandrasekar, V.: Correction of Radar Reflectivity and Differential Reflectivity for Rain Attenuation at X Band. Part II: Evaluation and Application, J. Atmos. Ocean. Tech., 22, 1633–1655, 2005.
Ryzhkov, A. V., Giangrande, S. E., and Schuur, T. J.: Rainfall Estimation with A Polarimetric Prototype of WSR-88D, J. Appl. Meteorol., 44, 502–515, 2005.
Ryzhkov, A. V., Diederich, M., Zhang, P., and Simmer, C.: Potential Utilization of Specific Attenuation for Rainfall Estimation, Mitigation of Partial Beam Blockage, and Radar Networking, J. Atmos. Ocean. Tech., 31, 599–619, 2014.
Ryzhkov, A., Zhang, P., Bukovčić, P., Zhang, J., and Cocks, S.: Polarimetric Radar Quantitative Precipitation Estimation, Remote Sensing, 14, 1695, https://doi.org/10.3390/rs14071695, 2022.
Schneebeli, M. and Berne, A.: An extended Kalman Filter Framework for Polarimetric X-band Weather: Radar Data Processing, J. Atmos. Ocean. Tech., 29, 711–730, 2012.
Snyder, J. C., Ryzhkov, A. V., Kumjian, M. R., Khain, A. P., and Picca, J.: A ZDR Column Detection Algorithm to Examine Convective Storm Updrafts, Weather Forecast., 30, 1819–1844, 2015.
Srivastava, R. C.: Size distribution of raindrops generated by their breakup and coalescence, J. Atmos. Sci., 28, 410–415, 1971.
Tokay, A. and Bashor, P. G.: An experimental study of small-scale variability of raindrop size distribution, J. Appl. Meteorol. Clim., 49, 2348–2365, 2010.
Tokay, A., Bashor, P. G., and Wolff, K. R.: Error characteristics of rainfall measurements by collocated Joss-Waldvogel disdrometers, J. Atmos. Ocean. Tech., 22, 513–527, 2005.
Wang, Y. and Chandrasekar, V.: Algorithm for Estimation of The Specific Differential Phase, J. Atmos. Ocean. Tech., 26, 2565–2578, 2009.
Wang, Y., Cocks, S., Tang, L., Ryzhkov, A., Zhang, P., Zhang, J., and Howard, K.: A prototype quantitative precipitation estimation algorithm for operational S-Band polarimetric radar utilizing specific attenuation and specific differential phase. Part I: Algorithm description, J. Hydrometeorol., 20, 985–997, 2019.
Xu, X., Howard, K., and Zhang, J.: An automated radar technique for the identification of tropical precipitation, J. Hydrometeor., 9, 885–902, 2008.
Zhang, J., Howard, K., and Gourley, J. J.: Constructing Three-Dimensional Multiple-Radar Reflectivity Mosaics: Examples of Convective Storms and Stratiform Rain Echoes, J. Atmos. Ocean. Tech., 22, 30–42, https://doi.org/10.1175/JTECH-1689.1, 2005.
Zhang, J., Howard, K., Langston, C., Vasiloff, S., Kaney, B., Arthur, A., Van Cooten, S., Kelleher, K., Kitzmiller, D., Ding, F., Seo, D., Wells, E., and Dempsey, C.: National Mosaic and Multi-Sensor QPE (NMQ) system: Description, results, and future plans, B. Am. Meteorol. Soc., 92, 1321–1338, 2011.
Zhang, J., Howard, K., Langston, C., Kaney, B., Qi, Y., Tang, L., Grams, H., Wang, Y., Cocks, S., Martinaitis, S., Arthur, A., Cooper, K., Brogden, J., and Kitzmiller, D.: Multi-Radar MultiSensor (MRMS) Quantitative Precipitation Estimation: Initial Operating Capabilities, B. Am. Meteorol. Soc., 97, 621–638, 2016.