the Creative Commons Attribution 4.0 License.
the Creative Commons Attribution 4.0 License.
 | 21 Feb 2023
Elucidate the formation mechanism of particulate nitrate based on direct radical observations in the Yangtze River Delta summer 2019
Tianyu Zhai
Haichao Wang
Shengrong Lou
Xiaorui Chen
Renzhi Hu
Yuanhang Zhang
Particulate nitrate (NO is one of the dominant components of fine particles in China, especially during pollution episodes, and has a significant impact on human health, air quality, and climate. Here a comprehensive field campaign that focuses on the atmospheric oxidation capacity and aerosol formation and their effects in the Yangtze River Delta (YRD) was conducted from May to June 2019 at a regional site in Changzhou, Jiangsu Province in China. The concentrations of NO, OH radicals, N2O5, NO2, O3, and relevant parameters were measured simultaneously. We showed a high NO mass concentration with 10.6 ± 8.9 µg m−3 on average, which accounted for 38.3 % of total water-soluble particulate components and 32.0 % of total PM2.5, followed by the proportion of sulfate, ammonium, and chloride by 26.0 %, 18.0 %, and 2.0 %, respectively. This result confirmed that the heavy nitrate pollution in eastern China happened not only in winter, but also in summer. This study's high nitrate oxidation ratio (NOR) emphasized the solid atmospheric oxidation and fast nitrate formation capacity in the YRD. It was found that OH + NO2 during daytime dominated nitrate formation on clean days, while N2O5 hydrolysis vastly enhanced and became comparable with that of OH + NO2 during polluted days (67.2 % and 30.2 %, respectively). The updated observed-constraint Empirical Kinetic Modeling Approach (EKMA) was used to assess the kinetic controlling factors of both local O3 and NO productions, which indicated that the O3-targeted scheme (VOCs : NOx = 2:1) is adequate for mitigating the O3 and nitrate pollution coordinately during summertime in this region. Our results promote the understanding of nitrate pollution mechanisms and mitigation based on field observation and model simulation and call for more attention to nitrate pollution in the summertime.
- Article
(4406 KB) - Full-text XML
- BibTeX
- EndNote


Chemical compositions of fine particles have been measured in China during the past 20 years, and secondary inorganic aerosol is regarded as one of the dominant species in aerosol (Cao et al., 2012; Hagler et al., 2006; Zhao et al., 2013; Andreae et al., 2008). Since the Air Pollution Prevention and Control Action Plan, there has been a significant decrease in SO2, NO2, and PM2.5 concentrations in China, while the inorganic nitrate ratio in PM2.5 increased and became the considerable component in PM2.5 (Shang et al., 2021; Zhang et al., 2022). Therefore, a comprehensive understanding of the particulate nitrate formation mechanism is essential and critical for mitigating haze pollution in China.
Massive research has been done in China to investigate nitrate formation mechanisms, and a basic framework has been established (Sun et al., 2006; Chang et al., 2018; Wu et al., 2019). In the daytime, NO2 + OH radical oxidation (Reaction 1) is the major particulate nitrate formation pathway. The product (HNO3) reacts with alkaline substances in aerosol, generating particulate nitrate. This pathway is mainly controlled by precursor concentrations as well as the gas-particle partition of gaseous nitric acid, and particulate nitrate depends on temperature, relative humidity (RH), NH3 concentration, and aerosol acidity (Wang et al., 2009; Song and Carmichael, 2001; Meng et al., 2020; Zhang et al., 2021). At night, N2O5 uptake is a vital nitrate formation pathway (Reaction 4) (Chen et al., 2020; Wang et al., 2022). N2O5 is formed through NO2 + NO3 (Reaction 3), and there exists a quick thermal equilibrium balance ( cm−3 molec.−1 s−1, 298 K). However, two problems remain ambiguous in quantifying the contribution of N2O5 uptake to nitrate formation. The first is that the N2O5 heterogeneous uptake coefficient (γ) on ambient aerosol is highly varied, with a range from 10−4 to 10−1 based on previous lab and field measurements (Bertram and Thornton, 2009; Brown et al., 2009; Z. Wang et al., 2017; Wang and Lu, 2016). The other one is the ClNO2 production yield which influences nitrate contribution due to the extensive variation range (Phillips et al., 2016; Staudt et al., 2019; Tham et al., 2018). Both parameters are complex to well-predicted by current schemes. No2 heterogeneous uptake has been found to be non-negligible for nitrate formation, which can be a vital pathway during heavy haze events according to recent studies (Qiu et al., 2019; Chan et al., 2021). The uptake coefficient and nitrate yield remain uncertain, as with the N2O5 heterogeneous reaction. In addition, N2O5 homogeneous hydrolysis and NO3 radical oxidation have a minor contribution to particulate nitrate under ambient conditions (Brown et al., 2009; Seinfeld and Pandis, 2016).
As a critical area of China's economy and industry, the Yangtze River Delta (YRD) has suffered severe air pollution during past decades, and fine particle pollution in the YRD has raised widespread concern (Guo et al., 2014; Zhang et al., 2015, 2017; Ming et al., 2017; Xue et al., 2019). However, most research focuses on wintertime PM2.5 pollution and lacks measurements of critical intermediate species and radicals to assess the importance of each nitrate formation pathway. In this study, with the direct measurements of hydroxyl radicals and the reactive nitrogen compounds and chemical box model analyses, we explore the characteristics of nitrate and precursors in the YRD in the summer of 2019, the importance of particulate nitrate formation pathways is quantified, and the controlling factors are explored. A further suggestion for summer pollution prevention and control in the local area is proposed.
2.1 The campaign site
This campaign took place at a suburban sanatorium from 30 May to 18 June 2019 in Changzhou, China. Changzhou (119.95∘ E, 31.79∘ N) is located in Jiangsu Province and about 150 km northwest of Shanghai. The sanatorium, located 420 m east of Lake Ge (one of the largest lakes in Jiangsu Province, 164 km2), is surrounded by farmland and fishponds. With the closest arterial traffic 1 km away, several industry zones are 4 km to the east. The prevailing wind was from the southern and southeastern sectors (about 30 % of the time) compared to 20 % from the western sector, of which only 15 % came from the east. The wind speed was usually lower than 5 m s−1, with faster speed from the west. This site was influenced by anthropogenic and biological sources with occasional biomass burning.
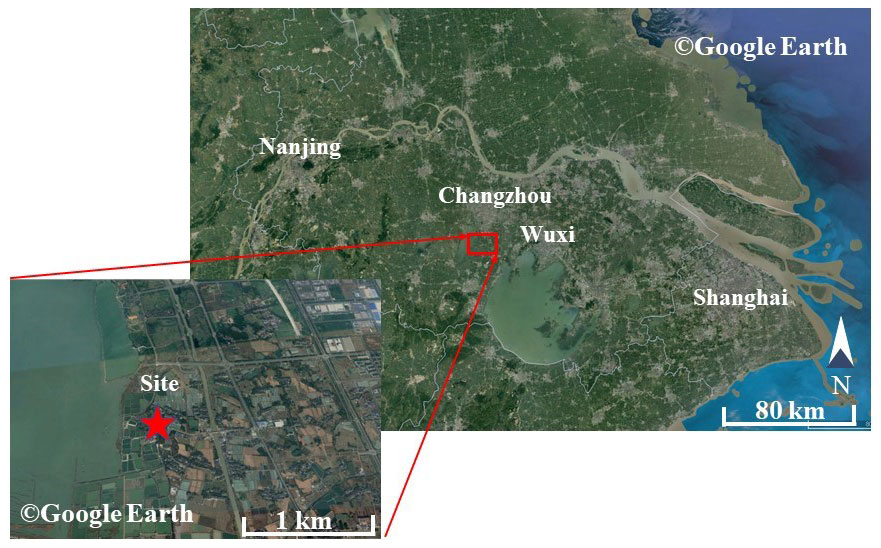
Figure 1The location of the campaign site (red star), Changzhou, is 150 km on the northwestern side of Shanghai.
2.2 The instrumentation
Multiple gaseous and particulate parameters were measured simultaneously during the campaign to comprehensively interpret the nocturnal atmospheric capacity and aerosol formation. The related instruments are listed in Table 1. N2O5 and particle number and size distribution (PNSD) were measured on the fourth floor of the sanatorium, which is the top of the building. Other instruments were placed in containers on the ground 170 m northeast of the building and sampling inlets at circa 5 m above the ground through the containers' roof.
N2O5 was measured by a cavity-enhanced absorption spectrometer (CEAS) based on the Lambert–Beer law which was developed by Wang et al. (2017b). Briefly, air samples were drawn through the window and reached out of the wall 30 cm to prevent influence from surface deposition. The aerosol membrane filter was deployed before the perfluoroalkoxy alkane (PFA) sampling tube and changed every 2 h at night to avoid a decrease in N2O5 transmission efficiency due to the increased loss of N2O5 from the accumulated aerosols on the filter. N2O5 was decomposed into NO3 and NO2 by preheating tube heat at 130∘ and detected within a PFA-coated resonator cavity heated at 110∘ to prevent the formation of N2O5 by reversible reaction subsequently. At the end of each sampling cycle (5 min), a 30 s injection of high-concentration NO (10 ppm, 20 mL min−1) mixed with sample air was set to eliminate NO3–N2O5 from the system. The NO titration spectra were adopted as the dynamic background spectrum by assuming no H2O concentration variation in a single sampling cycle. The loss of N2O5 in the sampling system and filter was also considered during data correction. The limit of detection (LOD) was estimated to be 2.7 pptv (1σ) with an uncertainty of 19 %.
OH radical measurement was conducted by fluorescence assay by gas expansion laser-induced fluorescence techniques (FAGE-LIF). Ambient air was expanded through a 0.4 mm nozzle to low pressure in a detection chamber, where the 308 nm laser pulse irradiated OH radicals at a repetition rate of 8.5 kHz (Chen et al., 2018). NOx and O3 were monitored by commercial monitors (Thermo-Fisher 42i and 49i). Volatile organic compounds (VOCs) were measured by an automated gas chromatograph equipped with a mass spectrometer and flame ionization detector (GC-MS) with a time resolution of 60 min. The photolysis frequencies were determined from the spectral actinic photon flux density measured by a spectroradiometer (Bohn et al., 2008).
PM2.5 concentration was obtained by a Tapered Element Oscillating Microbalance (TEOM 1405, Thermo Scientific Inc). Aerosol surface concentration (Sa) was converted from the particle number and size distribution, which was measured by a Scanning Mobility Particle Sizer (SMPS, TSI 3936) and an Aerosol Particle Sizer (APS, TSI 3321) and modified to the wet particle-state Sa with a hygroscopic growth factor (Liu et al., 2013). The uncertainty of the wet Sa was ∼30 %. Meanwhile, water-soluble particulate components and their gaseous precursors were analyzed through the Monitor for AeRosols and GAses in ambient air (MARGA, Chen et al., 2017). Meteorological data were also available, including the temperature, RH, pressure, wind speed, and wind direction.
Table 1The observed gas and particle parameters during the campaign.
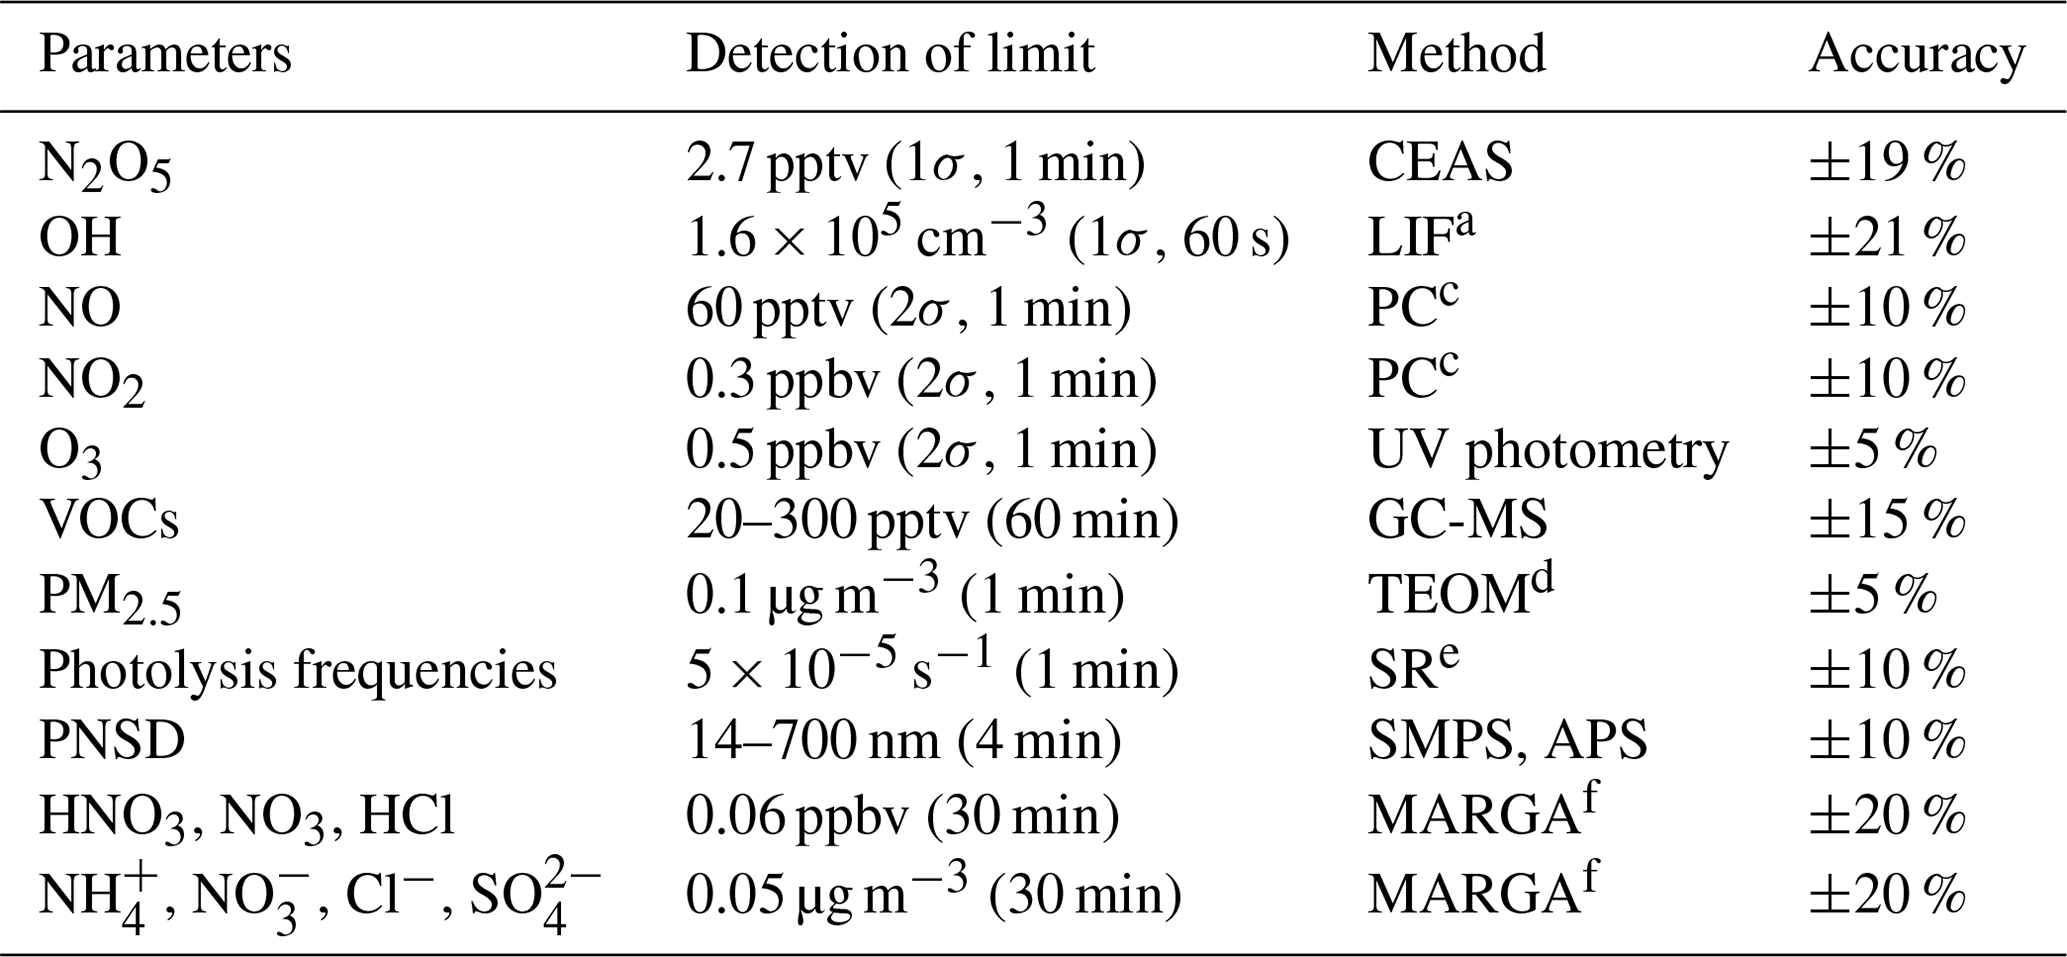
a Laser-induced fluorescence. b Chemiluminescence. c Photolytic converter. d Tapered Element Oscillating Microbalance. e Spectroradiometer. f The Monitor for AeRosols and GAses in ambient air.
2.3 The Empirical Kinetic Modeling Approach
A box model coupled with the Regional Atmospheric Chemical Mechanism version 2 (RACM2, Goliff, Stockwell and Lawson, 2013) is used to conduct the mitigation strategy studies. The model is operated at 1 h time resolution with measurement results of temperature, relative humidity, pressure, CO, NO2, H2O, photolysis frequencies, and aggregated VOC input to constrain the model. It should be noted that HONO concentration is calculated by NO2 × 0.02, as suggested by Elshorbany et al. (2012), and has been used in the box model before (Lou et al., 2022). Long-lived species such as H2 and CH4 are assumed to be constants (550 and 1900 ppbv, respectively). Moreover, a 13 h constant loss rate of unconstrained intermediate and secondary products, the result of synthetic evaluating secondary simulation of secondary species, is set for representing the multiple effects of deposition, transformation, and transportation.
The approaches to the chemical production of O3 (P(O3)) and inorganic nitrate (P(NO are described in previous articles (Tan et al., 2021, 2018) and expressed as Eqs. (1) and (4).
Briefly, P(O3) is net ozone production, which is calculated by peroxyl radial + NO oxidation (Eq. 2) minus the chemical loss of O3 and NO2 (Eq. 3). P(NO is constituted by reaction OH + NO2 (Eq. 5) and N2O5 heterogeneous uptake (Eq. 6). Here, rate constants of reactions are obtained from the NASA JPL publication or RACM2 (Goliff et al., 2013). γ is the N2O5 uptake coefficient calculated from parameterization (γP; more details in Sect. 3.3). φ represents ClNO2 production yield through N2O5 hydrolysis, and the mean value reported by Xia et al. (2020) is used in this work.
The Empirical Kinetic Modeling Approach (EKMA) was invented to study the effects of precursor (VOC and NOx) reactivity on the region's ozone pollution by Kanaya et al. (2008) and helps recognize the region's susceptibility to precursors by weight and became a prevalent tool to study the process of ozone formation (Tan et al., 2018; D. Yu et al., 2020; Kanaya et al., 2008). The prevention and control problem of pollutant generation can be transformed through the EKMA curve to reduce its precursors' emissions. Furthermore, the precursor reduction scheme needed for total pollutant control is given qualitatively. P(NO can also be analyzed through EKMA for the nonlinear secondary formation relationship with precursor reactivity. Here, an isopleth diagram of the net ozone production rate as functions of the reactivities of NOx and VOCs can be derived from EKMA. In detail, 0.01 to 1.2 emission reduction strategy assumptions are exponentially interpolated into 20 kinds of emission situations of NOx and VOCs, respectively, which counts 400 scenarios.
2.4 The calculation of aerosol liquid water content
Aerosol liquid water content (ALWC) is calculated through ISORROPIA II (Fountoukis and Nenes, 2007). Forward mode is applied in this study. Furthermore, water-soluble particulate components in PM2.5 and gaseous species (NH3 + HNO3 + HCl) obtained from MARGA, along with RH and T, are input as initial input. In addition, a metastable aerosol state is chosen due to high RH during this campaign.
3.1 Overview of measurements
The time used in this study is China Standard Time (UTC + 8), and the local sunrise and sunset times during the campaign were around 17:00 and 19:00, respectively. The whole campaign period is divided into four PM2.5 clean periods and four PM2.5 polluted periods (9 out of 14 d; the latter polluted period days refer to PM2.5 pollution except for a specified description) according to the Chinese National Air Quality Standard (CNAAQS) Grade I of daily PM2.5 concentrations (<35.0 µg m−3). Figure 2 shows the meteorological parameters and gas-phase and particulate species time series during the observation. During the campaign, the temperature was high; the maximum reached 34.5∘, with an average of 25.1 ± 3.7∘. RH changed drastically from 21 % to 88 %, with a mean value of 58.9 ± 14.0 %. The mean NO2 concentration was 14.8 ± 9.5 ppbv. Meanwhile, the O3 average was 54.6 ± 28.8 ppbv, exceeding CNAAQS Grade II for a maximum daily average of 8 h ozone (160 µg m−3) on 14 out of 19 d and exceeding 200 µg m−3 on 6 d.

Figure 2Time series of NO2, O3, N2O5, OH radicals, PM2.5, and water-soluble particulate components, temperature, and RH. The vertical dotted line represents the zero clock. The black horizontal solid line in the O3 and PM2.5 panels represents Chinese national air quality standards for O3 and PM2.5, respectively. The top panel color blocks represent the PM2.5 clean day (light green) and PM2.5 polluted day (salmon).
Daytime OH radicals ranged from 2 × 10⁶ to 8 × 10⁶ molec. cm−3 with a daily peak over 3 × 10⁶ molec. cm−3. Maximum OH radicals reached 8.18 × 10⁶ molec. cm−3 in this campaign. Compared with other summertime OH radicals observed in China, the OH radical concentration at this site is relatively low but still on the same order of magnitude (Lu et al., 2012, 2013; Ma et al., 2022; Tan et al., 2017; Woodward-Massey et al., 2020; Yang et al., 2021). N2O5 mean concentration was 21.9 ± 39.8 pptv with a nocturnal average of 61.0 ± 63.1 pptv and a daily maximum of over 200 pptv on eight nights. The maximum concentration of N2O5 (477.2 pptv, 5 min resolution) appeared at 20:47 on 8 June. The average NO3 radical production rate P(NO3) is 2.1 ± 1.4 ppbv h−1, with nocturnal average P(NO3) 2.8 ± 1.6 ppbv h−1 and daytime P(NO3) 2.2 ± 1.4 ppbv h−1. P(NO3) is about twice the documented value in Taizhou and the North China Plain (Wang et al., 2017a, 2018b, 2020a) but close to another result in the YRD before (Chen et al., 2019). The average PM2.5 was 34.6 ± 17.8 µg m−3, with a maximum reach of 163.0 µg m−3. The water-soluble particulate components of PM2.5 are displayed as well. The average NO concentration was 10.6 µg m−3, which accounts for the 38.3 % mass concentration of water-soluble particulate components and 32.0 % total PM2.5, while the proportions of sulfate, ammonium, and chloride are 26.0 %, 18 %, and 2.0 %, respectively. To sum up, during the campaign period, the pollution of PM2.5 would be generally exacerbated on high O3 and NO2 days. Precipitation occurred during four clean processes and receded pollutant concentration; otherwise, the pollution condition remained severe.
The mean diurnal variations (MDCs) of temperature, RH, NO2, O3, P(NO3), N2O5, OH radicals, and PM2.5 in different air quality are shown in Fig. 3. The temperature, RH, and OH radical MDCs show indistinct differences between clean days (CDs) and polluted days (PDs). The MDC of NO2 has two concentration peaks that appear at 06:00 and 21:00 on CDs, while on PDs, its peak appears at 20:00 and maintains a high level during the whole night. The O3 diurnal pattern reflects a typical urban-influenced character with a maximum O3 peak that lasts 3 h from 14:00 to 17:00, while the PD O3 peak concentration is 1.2 higher than the CD O3 peak concentration. P(NO3) grows after the O3 peak, and the maximum P(NO3) shows at 19:00 with an average value of 1.7 ppbv h−1 on CDs. By contrast, the mean PD P(NO3) is 2.6 ppbv h−1, and the maximum value reaches 4.7 ppbv h−1. In contrast, the CD N2O5 has a higher average and maximum concentration than PDs, which suggests a faster removal process during PDs. PM2.5 has a similar trend to P(NO3) and has a higher concentration during nighttime.
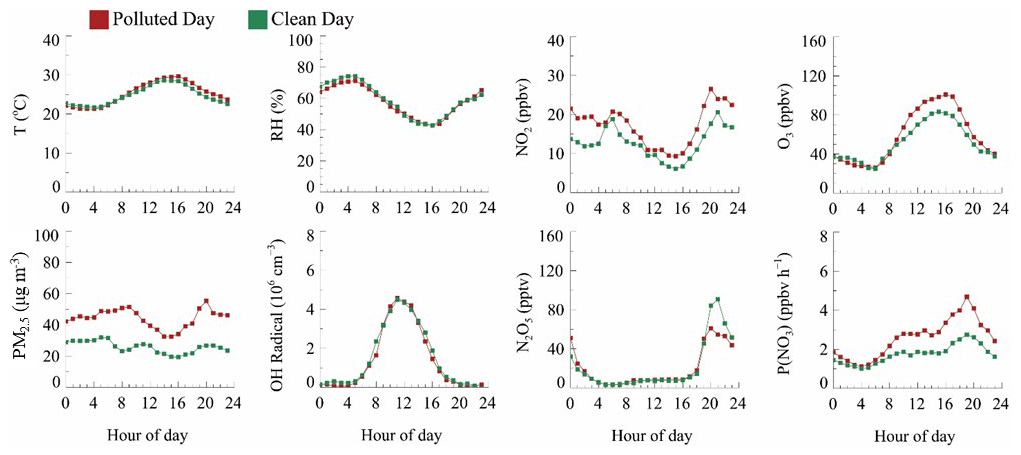
Figure 3The mean diurnal variations of temperature, RH, NO2, O3, PM2.5, OH radicals (orange), N2O5, and P(NO3) of clean days and polluted days.
3.2 The evolution of nitrate pollution
Figure 4a shows the relationship between nitrate and sulfate with water-soluble particulate components. Nitrate positively correlates with total water-soluble particulate components, while the sulfate ratio has an inverse correlation. With PM2.5 concentration increasing, nitrate proportion increases rapidly and keeps high weight at a heavy PM2.5 period, while the sulfate ratio shows the opposite phenomenon. Once the mass concentration of the total water-soluble particulate component is over 30 µg m−3, the mass fraction of nitrate in total water-soluble particulate components is up to 50 % on average. This result illustrates that particulate nitrate is one of the vital sources of explosive growth particulate matter.
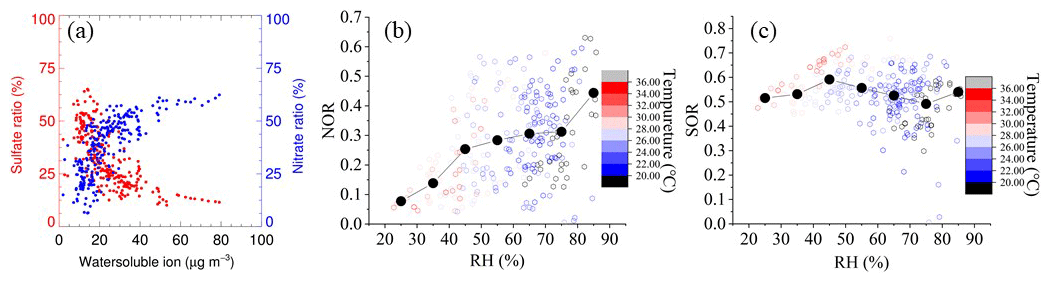
Figure 4(a) Particulate ion mass concentration ratio of nitrate and sulfate to water-soluble ion. (b) NOR against RH, colored with temperature. (c) SOR against RH, colored with temperature.
To further assess the conversion capacity of nitrate and sulfate at this site, the sulfur oxidation ratio (SOR) and the nitrogen oxidation ratio (NOR) are used to indicate the secondary transformation ratio of SO2 and NO2, respectively (Sun et al., 2006). SOR and NOR are estimated using the formulae below:
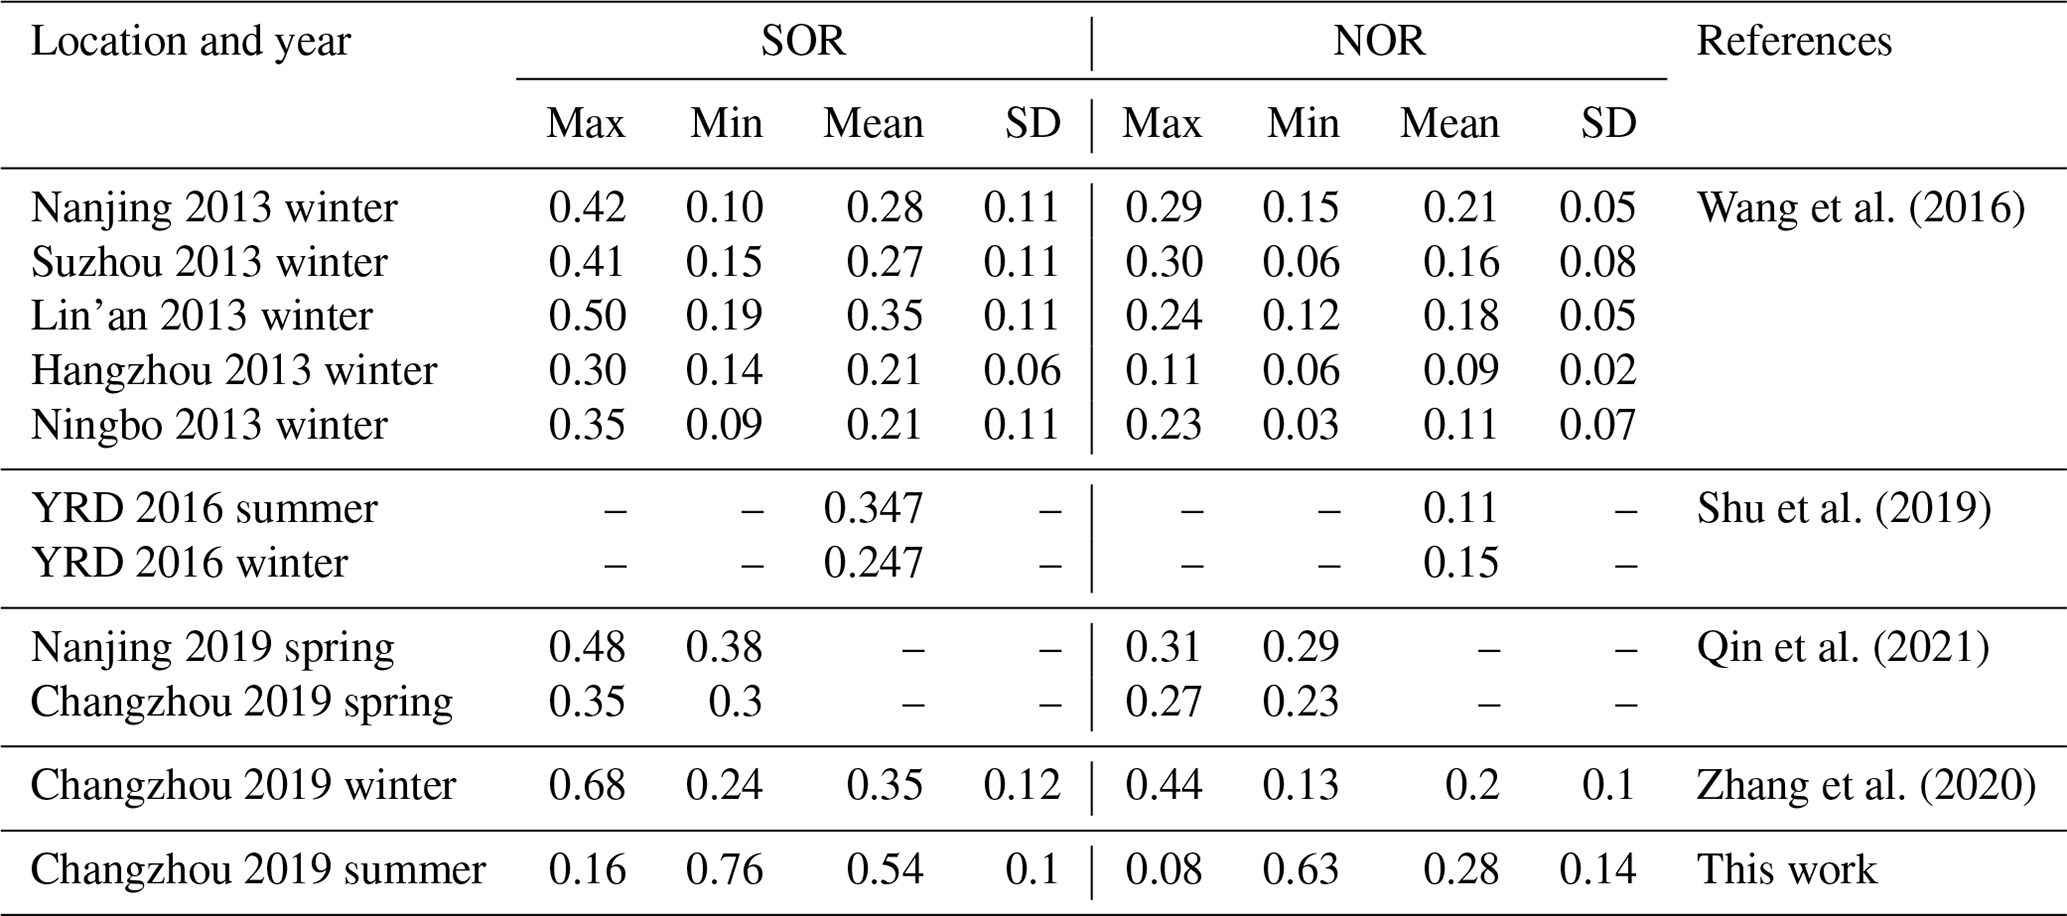
n refers to the molar concentration, and the higher SOR and NOR represent more oxidation of gaseous species into a secondary aerosol. As depicted in Fig. 4b–c, NOR rapidly increases at RH < 45 %, remains constant at 45 % < RH < 75 %, and ends with a sharp increase at RH > 75 %. During the study period, not only is the average concentration of NO2 higher among PDs, but there is also a significant difference between PD and CD NOR. The average values of NOR are 0.32 on PDs and 0.25 on CDs, respectively, which manifests in the more secondary transformation and pollution potential on PDs. In contrast, the SOR stays constant at a high value (∼0.5) during the whole RH scale, which shows a different pattern from previous research (Li et al., 2017; Zheng et al., 2015). One possible explanation is that SO2 concentration stays low during the whole campaign (4.4 ± 2.4 ppbv on average), and SO2 oxidation depends on the limit of SO2 instead of oxidation capability. Meanwhile, the mean SOR in both situations is over 0.5 (0.52 on CDs and 0.56 on PDs), further supporting the SO2-limited hypothesis. In addition, Table 2 summarizes NOR and SOR values in the YRD. NOR and SOR in this study are similar to values reported in other YRD research (Shu et al., 2019; Y. Zhang et al., 2020; Qin et al., 2021; Zhao et al., 2022), except for values in 2013, but higher than the North China study which emphasizes the solid atmospheric oxidation capacity in the YRD region.
3.3 The derivation of the N2O5 uptake coefficient
Statistical analysis of the observation above highlights the rapid formation of particulate nitrate. To assess the contribution of N2O5 hydrolysis to particulate nitrate formation, two methods are applied to calculate the N2O5 uptake coefficient. The first method is a stationary-state approximation (Brown et al., 2003). By assuming that the rates of production and loss of N2O5 are approximately in balance, the total loss rate of N2O5 () can be calculated through Eq. (9). is mainly dominated by N2O5 heterogeneous uptake, since homogeneous hydrolysis of N2O5 contributes little (Brown and Stutz, 2012). The N2O5 uptake coefficient through the steady state (denoted as γ_S) is derived as Eq. (10). Here C is the mean molecular speed of N2O5, and Sa is the aerosol surface concentration.
Due to the fast variety of NO3 loss rates from VOCs, the steady-state method has been unattainable under conditions affected by emission interferences. During the whole campaign, we only retrieve three valid fitting results. As shown in Fig. 5, the fitted γ_S ranged from 0.057 to 0.123, which is comparable with Taizhou (0.041, Wang et al., 2020a) and much higher than other results in China (C. Yu et al., 2020; Wang et al., 2018a, 2020b, 2017a). The calculated ranged from 0.002 to 0.16 s−1, representing drastic VOC change during this campaign.

Figure 5Derived N2O5 uptake coefficients from N2O5 steady lifetime (γ_S) with NO2 and Sa; plots (a–c) represent the linear fitting results on the nights of 30 May, 10 and 11 June, respectively.
The other approach is the parameterization by C. Yu et al. (2020), which is depicted as follows.
is the measured aerosol volume–surface area ratio by the SMPS, KH is Henry's law coefficient, which is set to 51 as recommended, [NO] and [Cl−] are aerosol inorganic concentrations measured by MARGA, and [H2O] is aerosol water content calculated by ISORROPIA II. The valid parameterization-calculated N2O5 uptake coefficient (denoted as γ_P) from 30 May to 8 June 2019 shows in Fig. 6 a good consistency between the trends of γ_P and aerosol water content. Nighttime γ_P varies from 0.001 to 0.024 with an average of 0.069 ± 0.0050 under polluted conditions and 0.0036 ± 0.0026 under clean conditions. The N2O5 uptake coefficient shows a good correlation between RH and aerosol water content. For the N2O5 uptake coefficient, although particulate nitrate mass concentration increased during the pollution event, an antagonistic effect on the N2O5 uptake coefficient was not obvious for the nitrate molarity decrease.
Furthermore, we compare the difference between γ_S and γ_P. Taking the night of 30 May as an example, γ_S is 0.089, while γ_P ranges from 0.024 to 0.057 with an average value of 0.013 ± 0.0051. The difference between steady state and parameterization is significant; one possible explanation is uncertainty for stationary-state approximation caused by local NO or VOC emission (Brown et al., 2009; Chen et al., 2022). Another reason is that the parameterization by C. Yu et al. (2020) ignores the impact of organic matter on the fine particles. The difference in aerosol composition between this work and C. Yu et al. (2020) may also bring uncertainty. Overall, γ_P will be chosen for the N2O5 heterogeneous uptake coefficient in later analysis and discussion.

Figure 6Results of N2O5 uptake coefficients through parameterization (γ_P). Panel (a) shows time series of γ_P and ISORROPIA II results of aerosol water content (AWC). Panel (b) is the box plot of the polluted days and clean days, the hollow square represents the mean value, and the solid line across the box shows the median score for the data set, while the top and bottom whiskers represent the 90 % and 10 % values of γ_P, respectively.
3.4 Quantifying the contribution of nitrate formation pathways
After the N2O5 uptake coefficient is counted, nitrate production potential P(NO can be calculated. Here the N2O5 uptake coefficient is set to 0.036 on clean days and 0.069 on polluted days, respectively, which are the average values derived from parameterization. The production ratio of NO (by considering the ClNO2 yield of 0.54) is set to 1.46 in the former study (Xia et al., 2020). Gas-particle distribution is considered by the result of the particulate nitrate and gas-phase nitrate by MARGA (input ratio to the model as the OH + NO2 nitrate production rate). The NO2 heterogeneous uptake coefficient is set to 5.8 × 10⁻⁶ depending on the report by Yu et al. (2021), which is the result of 70 % RH on urban grime.
The mean diurnal variations of the nitrate production potential of clean and polluted days are depicted in Fig. 7. The OH + NO2 pathway shows no significate difference between clean and polluted days and dominates CD nitrate formation potential, since the levels of OH and NO2 are less affected by the fine particle level. However, the rapid increase in the N2O5 heterogeneous uptake pathway on polluted days is fatal, and its peak formation rate at night over the OH + NO2 pathway can be used to explain nighttime nitrate explosive growth.
As shown in Fig. 7c, OH + NO2 dominates nitrate production on clean days, while the N2O5 uptake pathway only contributes 13.6 µg m−3. On polluted days, the ability of N2O5 uptake grows quickly, reaching 50.1 µg m−3, while the OH pathway does not change much. There is no distinct difference in the daytime pathway (OH + NO2) between clean days and polluted days, while the nighttime pathway ratio rises from 38.1 % on clean days to 67.2 % on polluted days. NO2 heterogeneous uptake increases from 0.93 µg m−3 on clean days to 2.0 µg m−3 on polluted days, but the contribution proportion does not change obviously. Both the higher N2O5 uptake coefficient and the higher Sa on polluted days increase the contribution of N2O5 hydrolysis to particulate nitrate under pollution conditions.
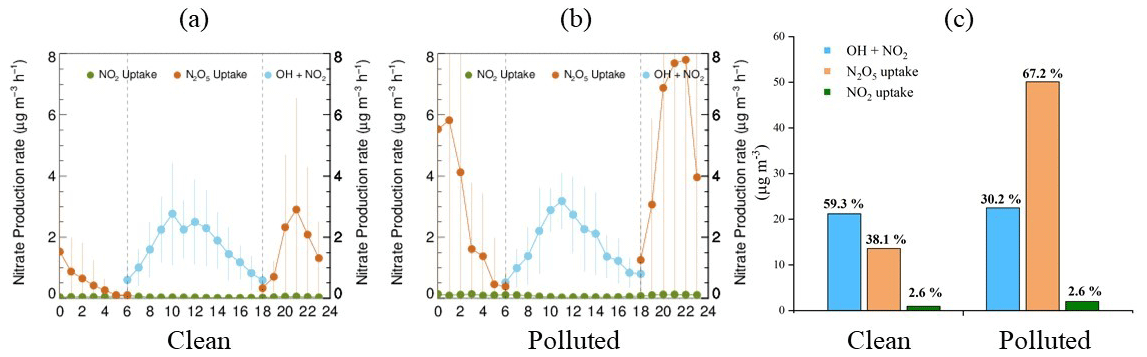
Figure 7The mean diurnal variations of the nitrate production potential of clean days (a) and polluted days (b) and the P(NO distribution of clean days and polluted days (c).
3.5 Mitigation strategies of particulate nitrate and ozone productions
We selected two pollution episodes (Episode I, 30 May 2019 00:00–2 June 2019 00:00, and IV, 14 June 2019 17:30–17 June 2019 12:00) to explore the mitigation way of ozone and nitrate pollution. Figure 8 shows the EKMA of P(O3) and P(NO of these two periods, O3 located in the VOC-controlling area in the two pollution episodes, which is consistent with a previous YRD urban ozone sensitivity study (Jiang et al., 2018; K. Zhang et al., 2020; Xu et al., 2021). The best precursor reduction for O3 is VOC : NOx = 2:1, while nitrate is located in the transition area, which means either of the precursors' reductions will mitigate nitrate pollution. For the regional and complex air pollution characteristics in this region, a fine particle-targeting reduction scheme will aggravate O3 pollution. In contrast, the O3-targeting scheme can mitigate O3 and fine particles simultaneously.
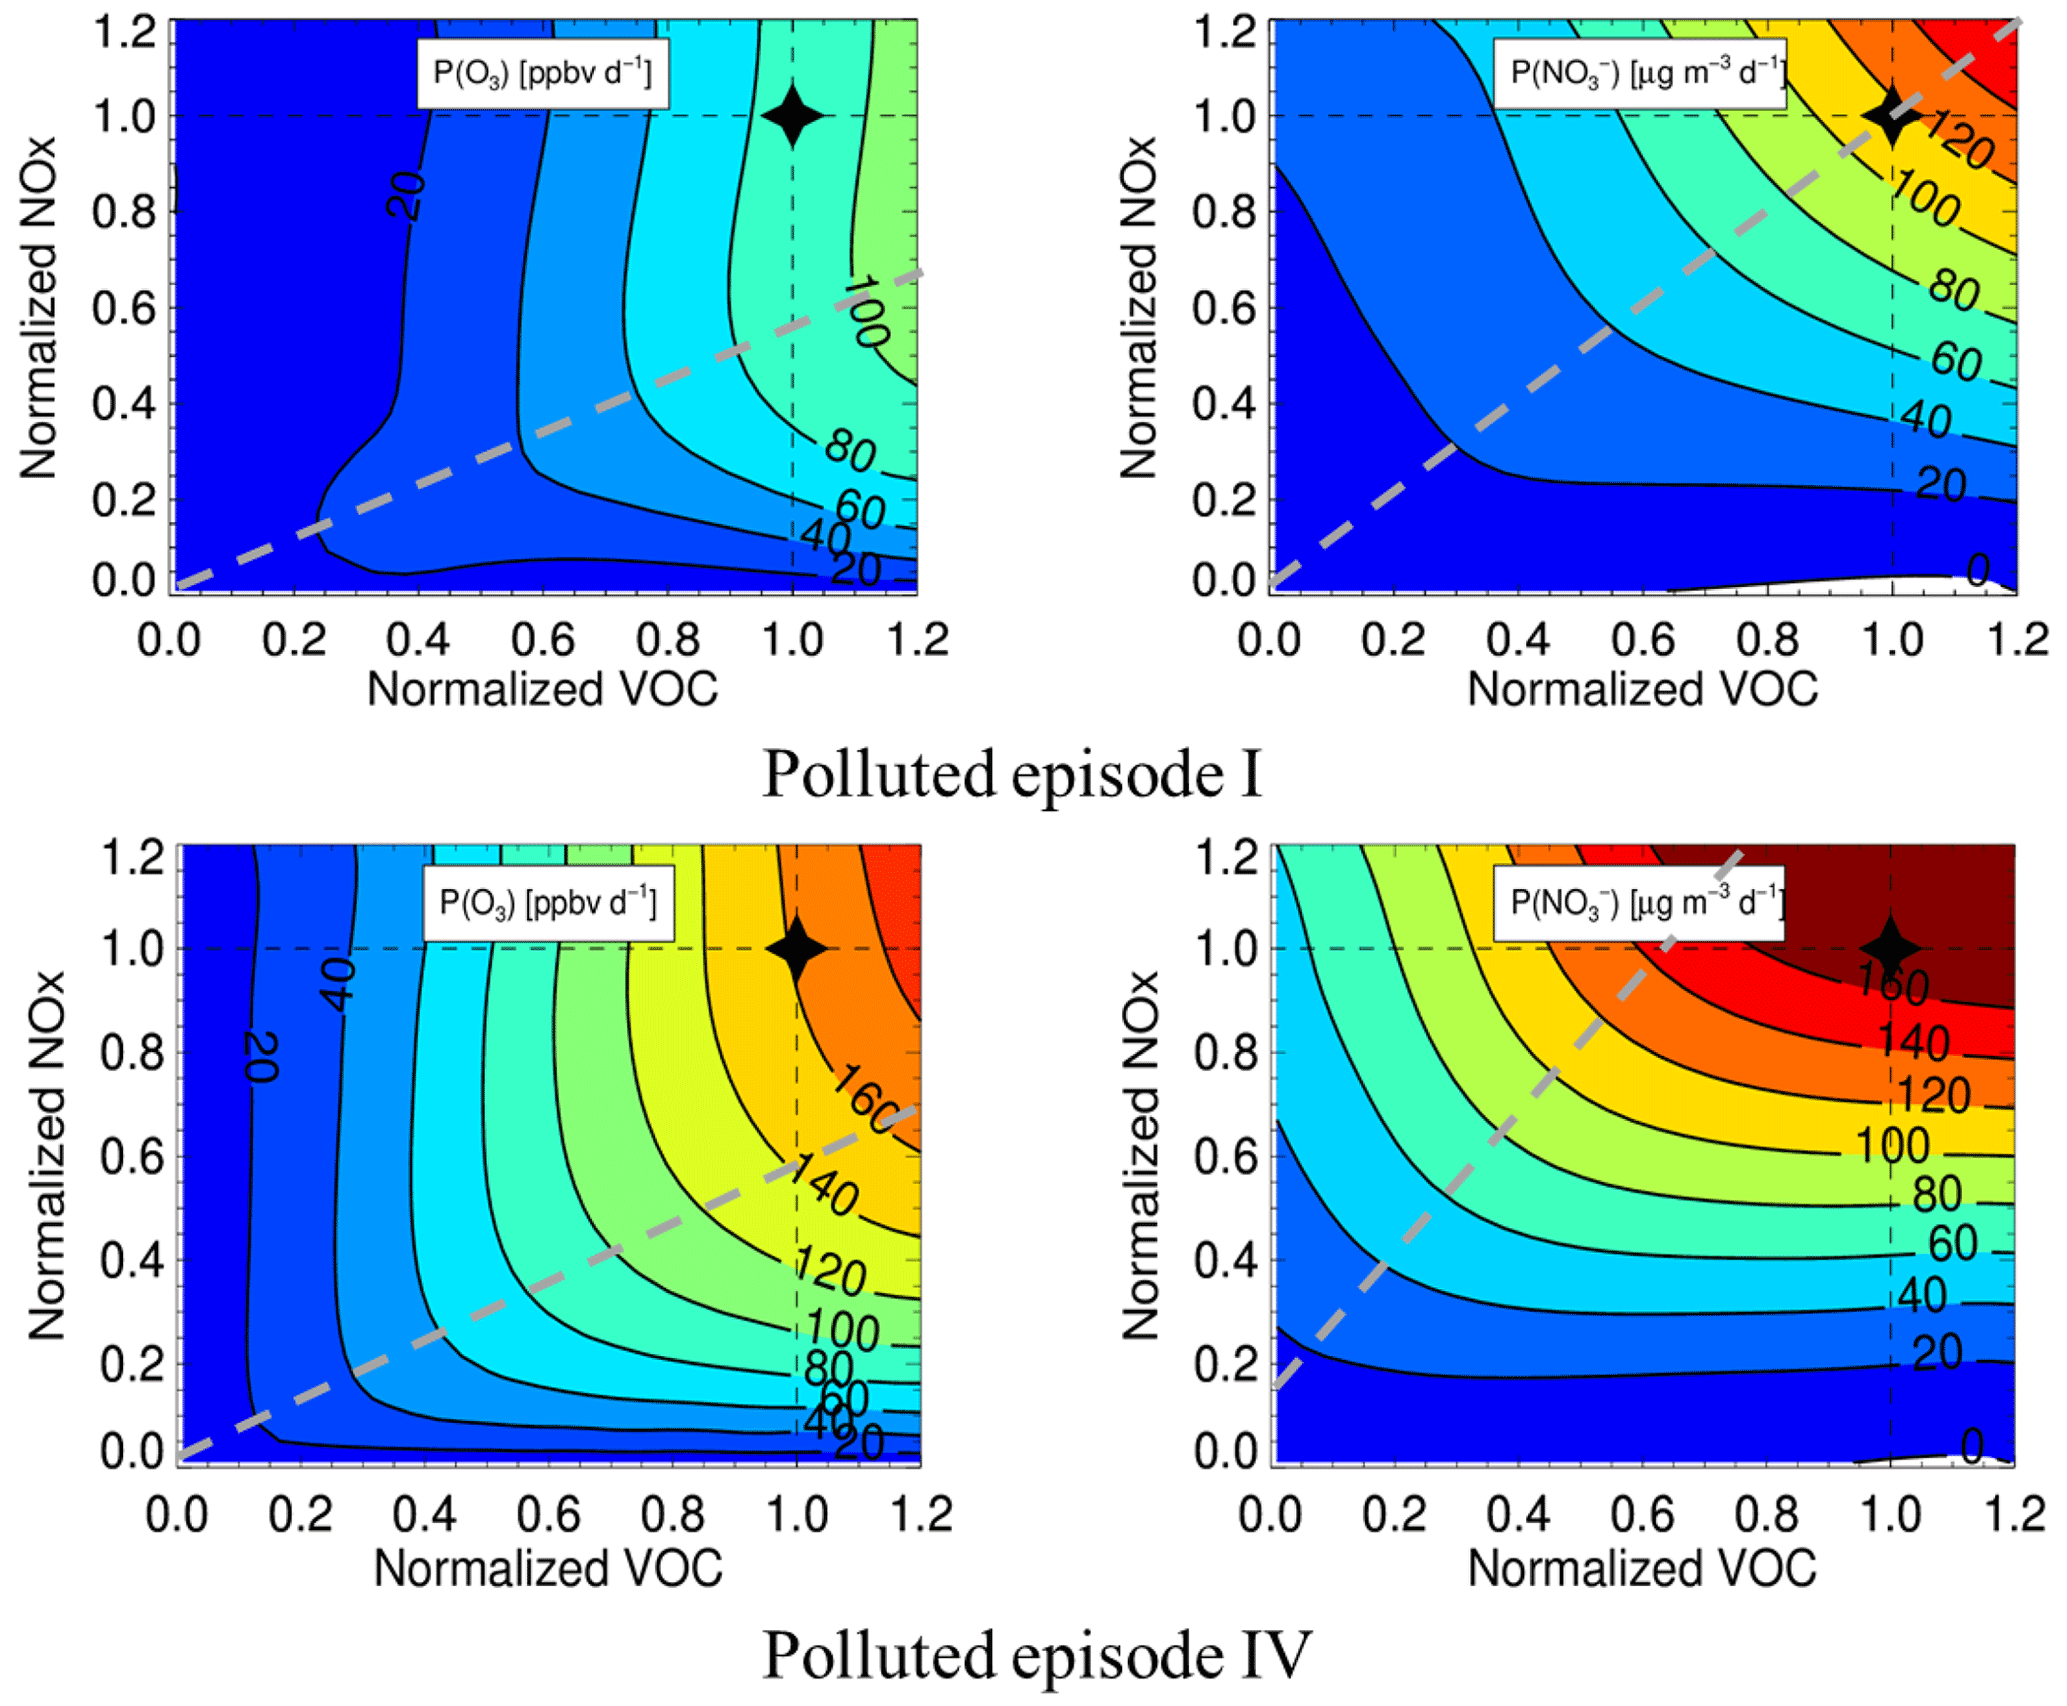
Figure 8Isogram of P(O3) and P(NO) of polluted episodes IV (30 May 2019 00:00–6 June 2019 00:00) and I (14 June 2019 17:30–17 June 2019 12:00) with different NOx and VOC reduction degrees. The grey dashed line represents the ridge line.
A comprehensive campaign was conducted to interpret the atmospheric oxidation capacity and aerosol formation from 30 May to 18 June 2019 in Changzhou, China. The high O3 and PM2.5 concentrations confirm complex air pollution characteristics in Changzhou, and nitrate accounts for 38.3 % mass concentration of total water-soluble particulate components and 32.0 % of total PM2.5. In addition, the average values of NOR are 0.32 on PDs and 0.25 on CDs. The positive correlation between NOR and RH and the inverse correlation refer to the contribution of N2O5 heterogeneous uptake to nitrate formation.
Based on field observations of OH and related parameters, we show that OH oxidation of the NO2 pathway steadily contributes to nitrate formation no matter the clean or polluted period and dominates CD nitrate production (about 22 µg m−3). N2O5 heterogeneous uptake contribution proliferated on polluted days, from 13.6 µg m−3 (38.1 %) on clean days to 50.1 µg m−3 (67.2 %) on polluted days. NO2 heterogeneous uptake contributes little to nitrate formation (2.6 %).
The precursor reduction simulation suggests the reduction ratio of VOC : NOx equaling 2:1 can simultaneously and effectively mitigate O3 and fine particle pollution during the summertime complex pollution period in Changzhou. To more precisely and delicately establish a cooperative control scheme for regional O3 and nitrate, the regional and long-time field campaigns are needed in the future to analyze the seasonal and interannual variation of O3 and nitrate and relevant parameters.
The data sets used in this study are available from the corresponding author upon request (k.lu@pku.edu.cn).
KL and YZ designed the study. TZ analyzed the data and wrote the paper with input from all the authors.
The contact author has declared that neither of the authors has any competing interests.
Publisher’s note: Copernicus Publications remains neutral with regard to jurisdictional claims in published maps and institutional affiliations.
Thanks for the data contributed by the field campaign team.
This project is supported by the National Natural Science Foundation of China (grant nos. 21976006 and 42175111), the Beijing Municipal Natural Science Foundation for Distinguished Young Scholars (JQ19031), and the National Research Program for Key Issues in Air Pollution Control (DQGG0103-01, 2019YFC0214800).
This paper was edited by Guangjie Zheng and reviewed by two anonymous referees.
Andreae, M. O., Schmid, O., Yang, H., Chand, D., Yu, J. Z., Zeng, L.-M., and Zhang, Y.-H.: Optical properties and chemical composition of the atmospheric aerosol in urban Guangzhou, China, Atmos. Environ., 42, 6335–6350, https://doi.org/10.1016/j.atmosenv.2008.01.030, 2008.
Bertram, T. H. and Thornton, J. A.: Toward a general parameterization of N2O5 reactivity on aqueous particles: the competing effects of particle liquid water, nitrate and chloride, Atmos. Chem. Phys., 9, 8351–8363, https://doi.org/10.5194/acp-9-8351-2009, 2009.
Bohn, B., Corlett, G. K., Gillmann, M., Sanghavi, S., Stange, G., Tensing, E., Vrekoussis, M., Bloss, W. J., Clapp, L. J., Kortner, M., Dorn, H.-P., Monks, P. S., Platt, U., Plass-Dülmer, C., Mihalopoulos, N., Heard, D. E., Clemitshaw, K. C., Meixner, F. X., Prevot, A. S. H., and Schmitt, R.: Photolysis frequency measurement techniques: results of a comparison within the ACCENT project, Atmos. Chem. Phys., 8, 5373–5391, https://doi.org/10.5194/acp-8-5373-2008, 2008.
Brown, S. S. and Stutz, J.: Nighttime radical observations and chemistry, Chem. Soc. Rev., 41, 6405–6447, https://doi.org/10.1039/c2cs35181a, 2012.
Brown, S. S., Stark, H., and Ravishankara, A. R.: Applicability of the steady state approximation to the interpretation of atmospheric observations of NO3 and N2O5, J. Geophys. Res.-Atmos., 108, 5439, https://doi.org/10.1029/2003jd003407, 2003.
Brown, S. S., Dube, W. P., Fuchs, H., Ryerson, T. B., Wollny, A. G., Brock, C. A., Bahreini, R., Middlebrook, A. M., Neuman, J. A., Atlas, E., Roberts, J. M., Osthoff, H. D., Trainer, M., Fehsenfeld, F. C., and Ravishankara, A. R.: Reactive uptake coefficients for N2O5 determined from aircraft measurements during the Second Texas Air Quality Study: Comparison to current model parameterizations, J. Geophys. Res.-Atmos., 114, https://doi.org/10.1029/2008jd011679, 2009.
Cao, J.-J., Shen, Z.-X., Chow, J. C., Watson, J. G., Lee, S.-C., Tie, X.-X., Ho, K.-F., Wang, G.-H., and Han, Y.-M.: Winter and Summer PM2.5 Chemical Compositions in Fourteen Chinese Cities, J. Air Waste. Manage., 62, 1214–1226, https://doi.org/10.1080/10962247.2012.701193, 2012.
Chan, Y. C., Evans, M. J., He, P. Z., Holmes, C. D., Jaegle, L., Kasibhatla, P., Liu, X. Y., Sherwen, T., Thornton, J. A., Wang, X., Xie, Z. Q., Zhai, S. T., and Alexander, B.: Heterogeneous Nitrate Production Mechanisms in Intense Haze Events in the North China Plain, J. Geophys. Res.-Atmos., 126, https://doi.org/10.1029/2021jd034688, 2021.
Chang, Y., Zhang, Y., Tian, C., Zhang, S., Ma, X., Cao, F., Liu, X., Zhang, W., Kuhn, T., and Lehmann, M. F.: Nitrogen isotope fractionation during gas-to-particle conversion of NOx to NO in the atmosphere – implications for isotope-based NOx source apportionment, Atmos. Chem. Phys., 18, 11647–11661, https://doi.org/10.5194/acp-18-11647-2018, 2018.
Chen, H., Hu, R., Xie, P., Xing, X., Ling, L., Li, Z., Wang, F., Wang, Y., Liu, J., and Liu, W.: A hydroxyl radical detection system using gas expansion and fast gating laser-induced fluorescence techniques, J. Environ. Sci., 65, 190–200, https://doi.org/10.1016/j.jes.2017.03.012, 2018.
Chen, X., Walker, J. T., and Geron, C.: Chromatography related performance of the Monitor for AeRosols and GAses in ambient air (MARGA): laboratory and field-based evaluation, Atmos. Meas. Tech., 10, 3893–3908, https://doi.org/10.5194/amt-10-3893-2017, 2017.
Chen, X., Wang, H., and Lu, K.: Interpretation of NO3-N2O5 observation via steady state in high-aerosol air mass: the impact of equilibrium coefficient in ambient conditions, Atmos. Chem. Phys., 22, 3525–3533, https://doi.org/10.5194/acp-22-3525-2022, 2022.
Chen, X. R., Wang, H. C., Liu, Y. H., Su, R., Wang, H. L., Lou, S. R., and Lu, K. D.: Spatial characteristics of the nighttime oxidation capacity in the Yangtze River Delta, China, Atmos. Environ., 208, 150–157, https://doi.org/10.1016/j.atmosenv.2019.04.012, 2019.
Chen, X. R., Wang, H. C., Lu, K. D., Li, C. M., Zhai, T. Y., Tan, Z. F., Ma, X. F., Yang, X. P., Liu, Y. H., Chen, S. Y., Dong, H. B., Li, X., Wu, Z. J., Hu, M., Zeng, L. M., and Zhang, Y. H.: Field Determination of Nitrate Formation Pathway in Winter Beijing, Environ. Sci. Technol., 54, 9243–9253, https://doi.org/10.1021/acs.est.0c00972, 2020.
Elshorbany, Y. F., Steil, B., Brühl, C., and Lelieveld, J.: Impact of HONO on global atmospheric chemistry calculated with an empirical parameterization in the EMAC model, Atmos. Chem. Phys., 12, 9977–10000, https://doi.org/10.5194/acp-12-9977-2012, 2012.
Fountoukis, C. and Nenes, A.: ISORROPIA II: a computationally efficient thermodynamic equilibrium model for K+–Ca2+–Mg2+–NH–Na+–SO–NO–Cl–H2O aerosols, Atmos. Chem. Phys., 7, 4639–4659, https://doi.org/10.5194/acp-7-4639-2007, 2007.
Goliff, W. S., Stockwell, W. R., and Lawson, C. V.: The regional atmospheric chemistry mechanism, version 2, Atmos. Environ., 68, 174–185, https://doi.org/10.1016/j.atmosenv.2012.11.038, 2013.
Guo, L., Hu, Y., Hu, Q., Lin, J., Li, C., Chen, J., Li, L., and Fu, H.: Characteristics and chemical compositions of particulate matter collected at the selected metro stations of Shanghai, China, Sci. Total Environ., 496, 443–452, https://doi.org/10.1016/j.scitotenv.2014.07.055, 2014.
Hagler, G. S. W., Bergin, M. H., Salmon, L. G., Yu, J. Z., Wan, E. C. H., Zheng, M., Zeng, L. M., Kiang, C. S., Zhang, Y. H., Lau, A. K. H., and Schauer, J. J.: Source areas and chemical composition of fine particulate matter in the Pearl River Delta region of China, Atmos. Environ., 40, 3802–3815, https://doi.org/10.1016/j.atmosenv.2006.02.032, 2006.
Jiang, M., Lu, K., Su, R., Tan, Z., Wang, H., Li, L., Fu, Q., Zhai, C., Tan, Q., Yue, D., Chen, D., Wang, Z., Xie, S., Zeng, L., and Zhang, Y.: Ozone formation and key VOCs in typical Chinese city clusters, Chinese Sci. Bull., 63, 1130–1141, 2018.
Kanaya, Y., Fukuda, M., Akimoto, H., Takegawa, N., Komazaki, Y., Yokouchi, Y., Koike, M., and Kondo, Y.: Urban photochemistry in central Tokyo: 2. Rates and regimes of oxidant (O3 + NO2) production, J. Geophys. Res.-Atmos., 113, https://doi.org/10.1029/2007jd008671, 2008.
Li, H., Zhang, Q., Zhang, Q., Chen, C., Wang, L., Wei, Z., Zhou, S., Parworth, C., Zheng, B., Canonaco, F., Prévôt, A. S. H., Chen, P., Zhang, H., Wallington, T. J., and He, K.: Wintertime aerosol chemistry and haze evolution in an extremely polluted city of the North China Plain: significant contribution from coal and biomass combustion, Atmos. Chem. Phys., 17, 4751–4768, https://doi.org/10.5194/acp-17-4751-2017, 2017.
Liu, X., Gu, J., Li, Y., Cheng, Y., Qu, Y., Han, T., Wang, J., Tian, H., Chen, J., and Zhang, Y.: Increase of aerosol scattering by hygroscopic growth: Observation, modeling, and implications on visibility, Atmos. Res., 132, 91–101, https://doi.org/10.1016/j.atmosres.2013.04.007, 2013.
Lou, S., Tan, Z., Gan, G., Chen, J., Wang, H., Gao, Y., Huang, D., Huang, C., Li, X., Song, R., Wang, H., Wang, M., Wang, Q., Wu, Y., and Huang, C.: Observation based study on atmospheric oxidation capacity in Shanghai during late-autumn: Contribution from nitryl chloride, Atmos. Environ., 271, 118902, https://doi.org/10.1016/j.atmosenv.2021.118902, 2022.
Lu, K. D., Rohrer, F., Holland, F., Fuchs, H., Bohn, B., Brauers, T., Chang, C. C., Häseler, R., Hu, M., Kita, K., Kondo, Y., Li, X., Lou, S. R., Nehr, S., Shao, M., Zeng, L. M., Wahner, A., Zhang, Y. H., and Hofzumahaus, A.: Observation and modelling of OH and HO2 concentrations in the Pearl River Delta 2006: a missing OH source in a VOC rich atmosphere, Atmos. Chem. Phys., 12, 1541–1569, https://doi.org/10.5194/acp-12-1541-2012, 2012.
Lu, K. D., Hofzumahaus, A., Holland, F., Bohn, B., Brauers, T., Fuchs, H., Hu, M., Häseler, R., Kita, K., Kondo, Y., Li, X., Lou, S. R., Oebel, A., Shao, M., Zeng, L. M., Wahner, A., Zhu, T., Zhang, Y. H., and Rohrer, F.: Missing OH source in a suburban environment near Beijing: observed and modelled OH and HO2 concentrations in summer 2006, Atmos. Chem. Phys., 13, 1057–1080, https://doi.org/10.5194/acp-13-1057-2013, 2013.
Ma, X., Tan, Z., Lu, K., Yang, X., Chen, X., Wang, H., Chen, S., Fang, X., Li, S., Li, X., Liu, J., Liu, Y., Lou, S., Qiu, W., Wang, H., Zeng, L., and Zhang, Y.: OH and HO2 radical chemistry at a suburban site during the EXPLORE-YRD campaign in 2018, Atmos. Chem. Phys., 22, 7005–7028, https://doi.org/10.5194/acp-22-7005-2022, 2022.
Meng, Z. Y., Wu, L. Y., Xu, X. D., Xu, W. Y., Zhang, R. J., Jia, X. F., Liang, L. L., Miao, Y. C., Cheng, H. B., Xie, Y. L., He, J. J., and Zhong, J. T.: Changes in ammonia and its effects on PM2.5 chemical property in three winter seasons in Beijing, China, Sci. Total Environ., 749, 142208, https://doi.org/10.1016/j.scitotenv.2020.142208, 2020.
Ming, L., Jin, L., Li, J., Fu, P., Yang, W., Liu, D., Zhang, G., Wang, Z., and Li, X.: PM2.5 in the Yangtze River Delta, China: Chemical compositions, seasonal variations, and regional pollution events, Environ. Pollut., 223, 200–212, https://doi.org/10.1016/j.envpol.2017.01.013, 2017.
Phillips, G. J., Thieser, J., Tang, M., Sobanski, N., Schuster, G., Fachinger, J., Drewnick, F., Borrmann, S., Bingemer, H., Lelieveld, J., and Crowley, J. N.: Estimating N2O5 uptake coefficients using ambient measurements of NO3, N2O5, ClNO2 and particle-phase nitrate, Atmos. Chem. Phys., 16, 13231–13249, https://doi.org/10.5194/acp-16-13231-2016, 2016.
Qin, Y., Li, J. Y., Gong, K. J., Wu, Z. J., Chen, M. D., Qin, M. M., Huang, L., and Hu, J. L.: Double high pollution events in the Yangtze River Delta from 2015 to 2019: Characteristics, trends, and meteorological situations, Sci. Total Environ., 792, 148349, https://doi.org/10.1016/j.scitotenv.2021.148349, 2021.
Qiu, X., Ying, Q., Wang, S., Duan, L., Zhao, J., Xing, J., Ding, D., Sun, Y., Liu, B., Shi, A., Yan, X., Xu, Q., and Hao, J.: Modeling the impact of heterogeneous reactions of chlorine on summertime nitrate formation in Beijing, China, Atmos. Chem. Phys., 19, 6737–6747, https://doi.org/10.5194/acp-19-6737-2019, 2019.
Seinfeld, J. H. and Pandis, S. N.: Atmospheric chemistry and physics: from air pollution to climate change, 3rd, Book, Whole, Wiley, Hoboken, New Jersey, ISBN 978-1-118-94740-1, 2016.
Shang, D. J., Peng, J. F., Guo, S., Wu, Z. J., and Hu, M.: Secondary aerosol formation in winter haze over the Beijing-Tianjin-Hebei Region, China, Front. Env. Sci. Eng., 15, 1–13, https://doi.org/10.1007/s11783-020-1326-x, 2021.
Shu, L., Wang, T. J., Xie, M., Li, M. M., Zhao, M., Zhang, M., and Zhao, X. Y.: Episode study of fine particle and ozone during the CAPUM-YRD over Yangtze River Delta of China: Characteristics and source attribution, Atmos. Environ., 203, 87–101, https://doi.org/10.1016/j.atmosenv.2019.01.044, 2019.
Song, C. H. and Carmichael, G. R.: Gas-particle partitioning of nitric acid modulated by alkaline aerosol, J. Atmos. Chem., 40, 1–22, 2001.
Staudt, S., Gord, J. R., Karimova, N. V., McDuffie, E. E., Brown, S. S., Gerber, R. B., Nathanson, G. M., and Bertram, T. H.: Sulfate and Carboxylate Suppress the Formation of ClNO2 at Atmospheric Interfaces, Acs Earth Space Chem., 3, 1987–1997, 2019.
Sun, Y. L., Zhuang, G. S., Tang, A. H., Wang, Y., and An, Z. S.: Chemical characteristics of PM2.5 and PM10 in haze-fog episodes in Beijing, Environ. Sci. Technol., 40, 3148–3155, https://doi.org/10.1021/es051533g, 2006.
Tan, Z., Fuchs, H., Lu, K., Hofzumahaus, A., Bohn, B., Broch, S., Dong, H., Gomm, S., Häseler, R., He, L., Holland, F., Li, X., Liu, Y., Lu, S., Rohrer, F., Shao, M., Wang, B., Wang, M., Wu, Y., Zeng, L., Zhang, Y., Wahner, A., and Zhang, Y.: Radical chemistry at a rural site (Wangdu) in the North China Plain: observation and model calculations of OH,HO2 and RO2 radicals, Atmos. Chem. Phys., 17, 663–690, https://doi.org/10.5194/acp-17-663-2017, 2017.
Tan, Z., Lu, K. D., Dong, H. B., Hu, M., Li, X., Liu, Y. H., Lu, S. H., Shao, M., Su, R., Wang, H. C., Wu, Y. S., Wahner, A., and Zhang, Y. H.: Explicit diagnosis of the local ozone production rate and the ozone-NOx-VOC sensitivities, Sci. Bull., 63, 1067–1076, https://doi.org/10.1016/j.scib.2018.07.001, 2018.
Tan, Z., Wang, H., Lu, K., Dong, H., Liu, Y., Zeng, L., Hu, M., and Zhang, Y.: An Observational Based Modeling of the Surface Layer Particulate Nitrate in the North China Plain During Summertime, J. Geophys. Res.-Atmos., 126, e2021JD035623, https://doi.org/10.1029/2021JD035623, 2021.
Tham, Y. J., Wang, Z., Li, Q., Wang, W., Wang, X., Lu, K., Ma, N., Yan, C., Kecorius, S., Wiedensohler, A., Zhang, Y., and Wang, T.: Heterogeneous N2O5 uptake coefficient and production yield of ClNO2 in polluted northern China: roles of aerosol water content and chemical composition, Atmos. Chem. Phys., 18, 13155–13171, https://doi.org/10.5194/acp-18-13155-2018, 2018.
Wang, H. and Lu, K. D.: Determination and Parameterization of the Heterogeneous Uptake Coefficient of Dinitrogen Pentoxide (N2O5), Prog. Chem., 28, 917–933, https://doi.org/10.7536/pc151225, 2016.
Wang, H., Zhu, B., Shen, L., Xu, H., An, J., Pan, C., Li, Y. e., and Liu, D.: Regional Characteristics of Air Pollutants during Heavy Haze Events in the Yangtze River Delta, China, Aerosol Air Qual. Res., 16, 2159–2171, https://doi.org/10.4209/aaqr.2015.09.0551, 2016.
Wang, H., Lu, K., Chen, X., Zhu, Q., Chen, Q., Guo, S., Jiang, M., Li, X., Shang, D., Tan, Z., Wu, Y., Wu, Z., Zou, Q., Zheng, Y., Zeng, L., Zhu, T., Hu, M., and Zhang, Y.: High N2O5 Concentrations Observed in Urban Beijing: Implications of a Large Nitrate Formation Pathway, Environ. Sc. Tech. Lett., 4, 416–420, https://doi.org/10.1021/acs.estlett.7b00341, 2017a.
Wang, H., Chen, J., and Lu, K.: Development of a portable cavity-enhanced absorption spectrometer for the measurement of ambient NO3 and N2O5: experimental setup, lab characterizations, and field applications in a polluted urban environment, Atmos. Meas. Tech., 10, 1465–1479, https://doi.org/10.5194/amt-10-1465-2017, 2017b.
Wang, H., Lu, K., Chen, X., Zhu, Q., Wu, Z., Wu, Y., and Sun, K.: Fast particulate nitrate formation via N2O5 uptake aloft in winter in Beijing, Atmos. Chem. Phys., 18, 10483–10495, https://doi.org/10.5194/acp-18-10483-2018, 2018a.
Wang, H., Lu, K., Guo, S., Wu, Z., Shang, D., Tan, Z., Wang, Y., Le Breton, M., Lou, S., Tang, M., Wu, Y., Zhu, W., Zheng, J., Zeng, L., Hallquist, M., Hu, M., and Zhang, Y.: Efficient N2O5 uptake and NO3 oxidation in the outflow of urban Beijing, Atmos. Chem. Phys., 18, 9705–9721, https://doi.org/10.5194/acp-18-9705-2018, 2018b.
Wang, H., Chen, X. R., Lu, K. D., Hu, R. Z., Li, Z. Y., Wang, H. L., Ma, X. F., Yang, X. P., Chen, S. Y., Dong, H. B., Liu, Y., Fang, X., Zeng, L. M., Hu, M., and Zhang, Y. H.: NO3 and N2O5 chemistry at a suburban site during the EXPLORE-YRD campaign in 2018, Atmos. Environ., 224, 117180, https://doi.org/10.1016/j.atmosenv.2019.117180, 2020a.
Wang, H., Chen, X. R., Lu, K. D., Tan, Z. F., Ma, X. F., Wu, Z. J., Li, X., Liu, Y. H., Shang, D. J., Wu, Y. S., Zeng, L. M., Hu, M., Schmitt, S., Kiendler-Scharr, A., Wahner, A., and Zhang, Y. H.: Wintertime N2O5 uptake coefficients over the North China Plain, Sci. Bull., 65, 765–774, https://doi.org/10.1016/j.scib.2020.02.006, 2020b.
Wang, S. B., Wang, L. L., Fan, X. G., Wang, N., Ma, S. L., and Zhang, R. Q.: Formation pathway of secondary inorganic aerosol and its influencing factors in Northern China: Comparison between urban and rural sites, Sci. Total Environ., 840, 156404, https://doi.org/10.1016/j.scitotenv.2022.156404, 2022.
Wang, X. F., Zhang, Y. P., Chen, H., Yang, X., Chen, J. M., and Geng, F. H.: Particulate Nitrate Formation in a Highly Polluted Urban Area: A Case Study by Single-Particle Mass Spectrometry in Shanghai, Environ. Sci. Technol., 43, 3061–3066, 2009.
Wang, Z., Wang, W., Tham, Y. J., Li, Q., Wang, H., Wen, L., Wang, X., and Wang, T.: Fast heterogeneous N2O5 uptake and ClNO2 production in power plant and industrial plumes observed in the nocturnal residual layer over the North China Plain, Atmos. Chem. Phys., 17, 12361–12378, https://doi.org/10.5194/acp-17-12361-2017, 2017.
Woodward-Massey, R., Slater, E. J., Alen, J., Ingham, T., Cryer, D. R., Stimpson, L. M., Ye, C., Seakins, P. W., Whalley, L. K., and Heard, D. E.: Implementation of a chemical background method for atmospheric OH measurements by laser-induced fluorescence: characterisation and observations from the UK and China, Atmos. Meas. Tech., 13, 3119–3146, https://doi.org/10.5194/amt-13-3119-2020
Wu, S. P., Dai, L. H., Zhu, H., Zhang, N., Yan, J. P., Schwab, J. J., and Yuan, C. S.: The impact of sea-salt aerosols on particulate inorganic nitrogen deposition in the western Taiwan Strait region, China, Atmos. Res., 228, 68–76, 2019.
Xia, M., Peng, X., Wang, W., Yu, C., Sun, P., Li, Y., Liu, Y., Xu, Z., Wang, Z., Xu, Z., Nie, W., Ding, A., and Wang, T.: Significant production of ClNO2 and possible source of Cl2 from N2O5 uptake at a suburban site in eastern China, Atmos. Chem. Phys., 20, 6147–6158, https://doi.org/10.5194/acp-20-6147-2020, 2020.
Xu, J. W., Huang, X., Wang, N., Li, Y. Y., and Ding, A. J.: Understanding ozone pollution in the Yangtze River Delta of eastern China from the perspective of diurnal cycles, Sci. Total Environ., 752, 141928, https://doi.org/10.1016/j.scitotenv.2020.141928, 2021.
Xue, H., Liu, G., Zhang, H., Hu, R., and Wang, X.: Similarities and differences in PM10 and PM2.5 concentrations, chemical compositions and sources in Hefei City, China, Chemosphere, 220, 760–765, https://doi.org/10.1016/j.chemosphere.2018.12.123, 2019.
Yang, X. P., Lu, K. D., Ma, X. F., Liu, Y. H., Wang, H. C., Hu, R. Z., Li, X., Lou, S. R., Chen, S. Y., Dong, H. B., Wang, F. Y., Wang, Y. H., Zhang, G. X., Li, S. L., Yang, S. D., Yang, Y. M., Kuang, C. L., Tan, Z. F., Chen, X. R., Qiu, P. P., Zeng, L. M., Xie, P. H., and Zhang, Y. H.: Observations and modeling of OH and HO2 radicals in Chengdu, China in summer 2019, Sci. Total Environ., 772, 144829, https://doi.org/10.1016/j.scitotenv.2020.144829, 2021.
Yu, C., Wang, Z., Xia, M., Fu, X., Wang, W., Tham, Y. J., Chen, T., Zheng, P., Li, H., Shan, Y., Wang, X., Xue, L., Zhou, Y., Yue, D., Ou, Y., Gao, J., Lu, K., Brown, S. S., Zhang, Y., and Wang, T.: Heterogeneous N2O5 reactions on atmospheric aerosols at four Chinese sites: improving model representation of uptake parameters, Atmos. Chem. Phys., 20, 4367–4378, https://doi.org/10.5194/acp-20-4367-2020, 2020.
Yu, C. A., Wang, Z., Ma, Q. X., Xue, L. K., George, C., and Wang, T.: Measurement of heterogeneous uptake of NO2 on inorganic particles, sea water and urban grime, J. Environ. Sci., 106, 124–135, https://doi.org/10.1016/j.jes.2021.01.018, 2021.
Yu, D., Tan, Z., Lu, K., Ma, X., Li, X., Chen, S., Zhu, B., Lin, L., Li, Y., Qiu, P., Yang, X., Liu, Y., Wang, H., He, L., Huang, X., and Zhang, Y.: An explicit study of local ozone budget and NOx-VOCs sensitivity in Shenzhen China, Atmos. Environ., 224, 117304, https://doi.org/10.1016/j.atmosenv.2020.117304, 2020.
Zhang, K., Xu, J. L., Huang, Q., Zhou, L., Fu, Q. Y., Duan, Y. S., and Xiu, G. L.: Precursors and potential sources of ground-level ozone in suburban Shanghai, Front. Env. Sci. Eng., 14, https://doi.org/10.1007/s11783-020-1271-8, 2020.
Zhang, R., Han, Y. H., Shi, A. J., Sun, X. S., Yan, X., Huang, Y. H., and Wang, Y.: Characteristics of ambient ammonia and its effects on particulate ammonium in winter of urban Beijing, China, Environ. Sci. Pollut. R, 28, 62828–62838, 2021.
Zhang, Y., Tang, L., Yu, H., Wang, Z., Sun, Y., Qin, W., Chen, W., Chen, C., Ding, A., Wu, J., Ge, S., Chen, C., and Zhou, H.-C.: Chemical composition, sources and evolution processes of aerosol at an urban site in Yangtze River Delta, China during wintertime, Atmos. Environ., 123, 339–349, https://doi.org/10.1016/j.atmosenv.2015.08.017, 2015.
Zhang, Y., Tang, L., Croteau, P. L., Favez, O., Sun, Y., Canagaratna, M. R., Wang, Z., Couvidat, F., Albinet, A., Zhang, H., Sciare, J., Prévôt, A. S. H., Jayne, J. T., and Worsnop, D. R.: Field characterization of the PM2.5 Aerosol Chemical Speciation Monitor: insights into the composition, sources, and processes of fine particles in eastern China, Atmos. Chem. Phys., 17, 14501–14517, https://doi.org/10.5194/acp-17-14501-2017, 2017.
Zhang, Y., Hong, Z., Chen, J., Xu, L., Hong, Y., Li, M., Hao, H., Chen, Y., Qiu, Y., Wu, X., Li, J.-R., Tong, L., and Xiao, H.: Impact of control measures and typhoon weather on characteristics and formation of PM2.5 during the 2016 G20 summit in China, Atmos. Environ., 224, 117312, https://doi.org/10.1016/j.atmosenv.2020.117312, 2020.
Zhang, Y. Y., Tang, A. H., Wang, C., Ma, X., Li, Y. Z., Xu, W., Xia, X. P., Zheng, A. H., Li, W. Q., Fang, Z. G., Zhao, X. F., Peng, X. L., Zhang, Y. P., Han, J., Zhang, L. J., Collett, J. L., and Liu, X. J.: PM2.5 and water-soluble inorganic ion concentrations decreased faster in urban than rural areas in China, J. Environ. Sci., 122, 83–91, 2022.
Zhao, P. S., Dong, F., He, D., Zhao, X. J., Zhang, X. L., Zhang, W. Z., Yao, Q., and Liu, H. Y.: Characteristics of concentrations and chemical compositions for PM2.5 in the region of Beijing, Tianjin, and Hebei, China, Atmos. Chem. Phys., 13, 4631–4644, https://doi.org/10.5194/acp-13-4631-2013, 2013.
Zhao, Z. Z., Sun, N., Zhou, W. L., Ma, S. S., Li, X. D., Li, M. L., Zhang, X., Tang, S. S., and Ye, Z. L.: Chemical Compositions in Winter PM2.5 in Changzhou of the Yangtze River Delta Region, China: Characteristics and Atmospheric Responses Along With the Different Pollution Levels, Front. Env. Sci.-Switz, 10, 907735, https://doi.org/10.3389/fenvs.2022.907735, 2022.
Zheng, G. J., Duan, F. K., Su, H., Ma, Y. L., Cheng, Y., Zheng, B., Zhang, Q., Huang, T., Kimoto, T., Chang, D., Pöschl, U., Cheng, Y. F., and He, K. B.: Exploring the severe winter haze in Beijing: the impact of synoptic weather, regional transport and heterogeneous reactions, Atmos. Chem. Phys., 15, 2969–2983, https://doi.org/10.5194/acp-15-2969-2015, 2015.