the Creative Commons Attribution 4.0 License.
the Creative Commons Attribution 4.0 License.
 | 06 Jan 2023
Annual cycle of hygroscopic properties and mixing state of the suburban aerosol in Athens, Greece
Christina Spitieri
Maria Gini
Martin Gysel-Beer
Konstantinos Eleftheriadis
The hygroscopic properties of atmospheric aerosol were investigated at a suburban environment in Athens, Greece, from August 2016 to July 2017. The growth factor distribution probability density function (GF-PDF) and mixing state were determined with a hygroscopicity tandem differential mobility analyser (HTDMA). Four dry particle sizes (D0) were selected to be analysed in terms of their hygroscopic properties at 90 % relative humidity. The annual mean GFs for D0 = 30, 50, 80 and 250 nm were found to be equal to 1.28, 1.11, 1.13 and 1.22, respectively. The hygroscopic growth spectra were divided into two distinct hygroscopic ranges: a non- and/or slightly hygroscopic mode (GF < 1.12) and a moderately hygroscopic mode (GF > 1.12), which are representative of a suburban environment influenced by local/urban emissions and background aerosol. The standard deviation σ of the GF-PDF was employed as a measure of the mixing state of ambient aerosol. The 30 nm particles were mostly internally mixed, whereas larger particles were found to be externally mixed, either with a distinct bimodal structure or with partly overlapping modes. Cluster analysis on the hourly dry number size distributions was performed to identify the link between aerosol hygroscopicity and aerosol emission sources and formation processes. The size distributions were classified into five groups, with the “mixed urban and regional background” aerosol (67 %) and the “fresh traffic-related particles” from the neighbourhood urban area (15 %) accounting for more than 80 % of the results. The hygroscopic properties for 50 and 80 nm were found to be similar in all cases, indicating particles of similar nature and origin across these sizes. This was also confirmed through the modal analysis of the average number size distributions for each cluster; the 50 and 80 nm particles were found to belong to the same Aitken mode in most cases. The 250 nm particles (i.e. accumulation mode) were generally more hygroscopic than Aitken particles but less hygroscopic than the 30 nm particles (nuclei mode).
- Article
(2610 KB) - Full-text XML
-
Supplement
(1272 KB) - BibTeX
- EndNote


Atmospheric aerosol particles in the ambient atmosphere affect the radiation budget of the planet and the regional and global climate (IPCC, 2013; Rosenfeld et al., 2014) through direct and indirect effects (Li et al., 2016). Aerosol particles interact with solar radiation through light absorption and scattering, inducing a positive or negative radiation forcing, respectively (Haywood and Boucher, 2000). Additionally, aerosol particles can act either as cloud condensation nuclei (CCN) or as ice nuclei (IN), which determines their indirect effect on clouds' microstructure and lifetime. The climate-relevant properties of atmospheric aerosol particles are largely influenced by their ability to take up water (hygroscopicity) and their state of mixing (Zhang et al., 2011; Kaufman et al., 2002; McFiggans et al., 2006).
The hygroscopic properties of atmospheric particles are strongly related to particle chemical composition (Gunthe et al., 2009; Gysel et al., 2007), while they undergo continuous changes over particle lifetime. Research results have shown that the relative non-hygroscopic fresh organic aerosol can become hygroscopic through physical and chemical atmospheric processes (Kanakidou et al., 2005). This is also the case for soot particles originating from different sources (e.g. biomass burning, diesel soot). The condensation of secondary species on the surface of primarily emitted soot (pure black carbon particles) may alter their hygroscopic properties from non-hygroscopic to hygroscopic being therefore capable to act as CCN (Tritscher et al., 2011; Kotchenruther and Hobbs, 1998). Motos et al. (2019) also studied and established the relations between the black carbon core size, mixing state and droplet activation.
Aerosol hygroscopic growth can be measured or estimated by both direct and indirect techniques (Hegg et al., 2007; Achtert et al., 2009). The most widespread real-time direct measurement technique for fine-mode aerosol is the hygroscopicity tandem differential mobility analyser (HTDMA), which determines the growth factor (GF) of particles at a given dry particle diameter and relative humidity (RH). Then, the hygroscopic parameter κ, a simplified parameter model of the composition dependence on the solution water activity, can be calculated as described by Peter and Kreidenweis (2007). The kappa values for highly hygroscopic aerosols, such as salts and sulfates, range between 0.5 and 1.4 for organics from 0.01 to 0.5, whereas for non-hygroscopic aerosol, such as soot, the kappa values are close to zero (Bezantakos et al., 2013; Gysel et al., 2007).
The cloud nucleating effectivity of aerosol particles and the overall aerosol–cloud–climate interactions depend on the distribution of components among individual particles, termed “aerosol mixing state” (Riemer et al., 2019). Ambient aerosol is usually considered a heterogeneous mixture of particles with different chemical compositions and sizes. We refer to an internal mixture of aerosol when the particles of the same size have a similar chemical composition, whereas, in an external mixture, particles of the same size have a distinctly different chemical composition. The aerosol in urban/sub-urban environments typically is an external mixture of non-hygroscopic aerosol from fresh local emissions and moderately hygroscopic background aerosol (Wang et al., 2018; Enroth et al., 2018; Swietlicki et al., 2008), whereas in marine environments the aerosols tend to be internally mixed and highly hygroscopic (Massling et al., 2007).
Long-term measurements of aerosol hygroscopicity are commonly done using CCN counters (e.g. Paramanov et al., 2015, Schmale et al., 2017 and 2018, and references therein) or HTDMAs. A few long-term studies of aerosol hygroscopicity and mixing state by means of the HTDMA technique have been published so far, and some of them are mentioned below (Kammermann et al., 2010; Fors et al., 2011; Holmgren et al., 2014). These provide a better understanding of the link between particle hygroscopic growth and particle emission sources, formation and transformation processes. The present study aims at providing insights into the hygroscopic properties and state of mixing of ambient aerosol and the origin of ambient ultrafine and fine particles through 1 year of measurements of key microphysical parameters (i.e. size distributions and time- and size-resolved HTDMA data) in a suburban environment. The hygroscopicity of ambient aerosol was investigated in the particle size range between 30 and 250 nm, providing information about the month-to-month variability, seasonal cycle and diurnal pattern of hygroscopicity and the degree of mixing state for selected particle sizes.
2.1 Sampling site
The measurement campaign was conducted from August 2016 to July 2017 at the Demokritos (DEM) station (Fig. 1), a member of Global Atmosphere Watch (GAW) and part of the ACTRIS and PANACEA infrastructures within the National Centre of Scientific Research Demokritos campus. The station is located in a vegetated area at the foot of Mount Hymettus, about 7 km to the northeast of Athens' city centre. It is an urban background station, representative of the atmospheric aerosol in the suburbs of the Athens metropolitan area. The site is partially influenced by transported pollution from the urban area of Athens (Eleftheriadis et al., 2021) (i.e. under most atmospheric conditions) and partially by the incoming regional aerosol (i.e. under northern, southern or eastern winds).
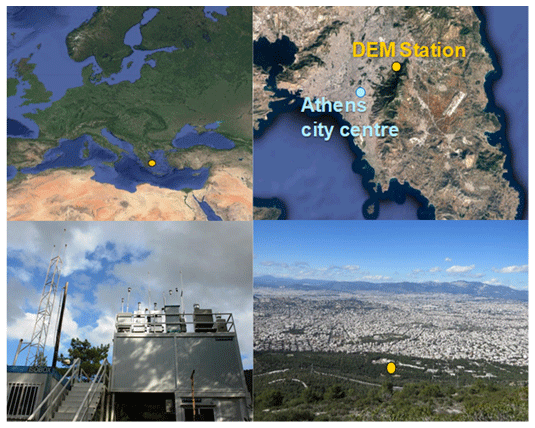
Figure 1The Demokritos atmospheric aerosol measurement station in Athens (from © Google Maps).
2.2 Instrumentation
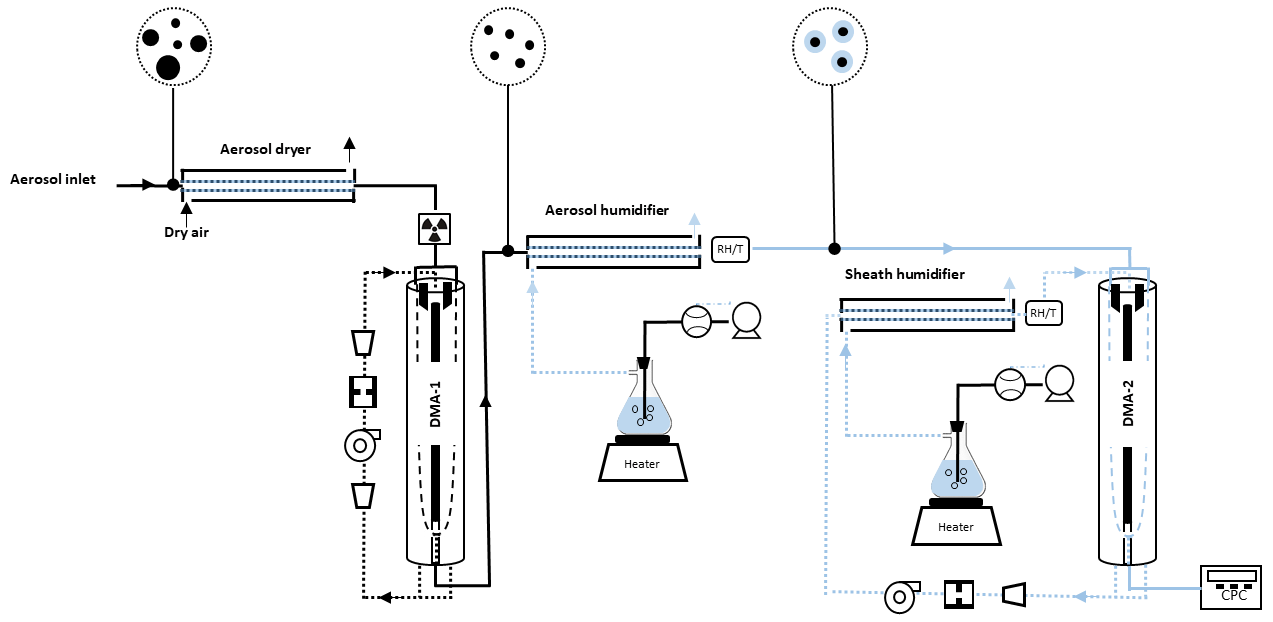
A custom-built humidified tandem differential mobility analyser (HTDMA) was used to measure the hygroscopic growth factor distributions of ambient aerosol particles with selected dry diameters D0 at certain narrow size fractions centred around 30, 50, 80 and 250 nm and exposed at relative humidity (RH) of 90 ± 2 % (Bezantakos et al., 2013). Figure 2 shows the main components of the HTDMA system. The HTDMA consists of two differential mobility analysers (DMAs) in tandem mode, a humidifier section and a condensation particle counter (CPC 3772, TSI). The polydisperse aerosol was initially dried, passing through an aerosol Nafion dryer, and brought to charge equilibrium passing through a 85Kr bipolar neutraliser before entering the first DMA (DMA-1) where the specific particle sizes were selected (monodisperse aerosol) according to their electrical mobility. Then, the monodispersed and dried particles were conditioned by passing through the humidifier section at a well-defined relative humidity (set point 90 %) before entering the second DMA (DMA-2); the sheath flow of the DMA-2 was also humidified at a relative humidity of 90 %. The DMA-2 was operated with the CPC in a scanning mobility particle sizer (SMPS) configuration to measure the particle size distribution of the conditioned wet aerosol. Both DMAs were operated with a sheath flow rate of 3 L min−1 and a sample flow rate of ∼0.3 L min−1.
The aerosol number size distributions of ambient aerosol (dry) were measured by means of a SMPS system, operated in parallel with the HTDMA at the DEM station. The SMPS consists of an electrostatic classifier (TSI Inc. model 3080), a cylindrical differential mobility analyser column (TSI Inc., model 3081) and a condensation particle counter (TSI Inc., model 3772). It was operated with a 5 min time resolution and an aerosol-to-sheath flow ratio of L min−1 covering a particle size range from 10 to 550 nm. Both aerosol and sheath flows were dried to relative humidity lower than 40 % using a Nafion drier. Data acquisition and analysis were performed using the TROPOS-SMPS data evaluation software (Wiedensohler et al., 2012). To achieve the highest measurement accuracy with SMPS measurements, the technical recommendations and quality-control procedures proposed by Wiedensohler et al. (2012) were followed.
The standard meteorological parameters (i.e. temperature, humidity, wind speed and wind direction) were recorded at an hourly time interval at the DEM station. The meteorological sensors were installed on a meteorological mast at 10 m height above ground.
2.3 Data analysis
2.3.1 HTDMA data inversion and fitting procedure
Due to water uptake, the diameter of the humidified particles (D(RH)) increase, and the ratio between humidified (D(RH)) and dry particle diameter (D0) is defined as the growth factor (GF):
where D(RH) is the particle diameter at the given RH, and D0 is the dry diameter selected by the first DMA. The particle concentration at the HTDMA outlet as a function of growth factor (GF) set at the HTDMA is referred to as the measurement distribution function (MDF).
Then, an inversion algorithm was applied to the measured MDF to retrieve the actual growth factor probability density function (GF-PDF), which describes the probability that a particle with a defined dry size exhibits a certain GF at the specified relative humidity. The methodology we follow for inverting the HTDMA data is described in detail by Gysel et al. (2009). A key element for the data inversion is the kernel function, which describes the physics of a TDMA system. The kernel width calibration, for particles exhibiting a true growth factor of 1.0, of the HTDMA and data inversion was performed according to the methodology described by Gysel et al. (2009), applying the TDMAinv algorithm. The underlying principle of the HTDMA inversion approach is to find an inverted GF-PDF such that a minimum χ2 residual is obtained between the measured MDF and the reconstituted MDF (R-MDF). The growth factor probability density functions (GF-PDFs) were afterwards normalised to unity. The GF-PDFs measured in the range 88 % < RH < 92 % were recalculated to RH = 90 % following the procedure described by Gysel et al. (2009) in order to minimise uncertainties associated with variations in RH levels. Each GF-PDF was described as a piecewise linear function with the midpoint of the first and last inversion bin at GF = 0.7 and GF = 2.5, respectively, and a resolution of ΔGF = 0.1. The GF standard deviation σ of a GF-PDF was also determined according to Eq. (C.6) in Gysel et al. (2009).
The σ is used as a measure for the spread of growth factor to describe the mixing state (Sjogren et al., 2008). In the present study, the inverted data were grouped into three cases, representative of the aerosol mixing state in Fig. 3. Specifically, σ≤0.07 indicates an internally mixed aerosol (Fig. 3a), σ≥0.15 describes an externally mixed aerosol with two distinct modes (Fig. 3c), and GF-PDFs with 0.07<σ<0.15 are considered as a continuum of mixing states with two overlapping modes or a broad mode (Fig. 3b) (almost bimodal and externally mixed). The bimodal GF-PDF spectra, either with overlapping or with well-defined modes, were divided into two distinct ranges of particle hygroscopicity: one subset comprising non- and/or slightly hygroscopic particles with GF < 1.12 and the other subset comprising moderately hygroscopic particles with GF > 1.12. This threshold GF coincides with the typical local minimum in the GF-PDFs observed in this study, which also is in line with the findings of previous studies (Kim et al., 2020). Then the different integral properties of GF-PDFs (i.e. mean GF and number fraction) for these subranges were calculated by Eqs. (C.9) and (C.8), as described by Gysel et al. (2009), by averaging GF-PDFs above and below the GF = 1.12 threshold. It has be noted that a sensitivity analysis has been performed before selecting the two subranges by changing the selected threshold GF between 1.12 and 1.20 with no significant effect on the calculated parameters. The fixed GF threshold translates to a slight size dependence of the kappa threshold, i.e. from 0.07 to 0.05 for 30 to 250 nm.
Additionally, the hygroscopicity parameter κ was calculated as follows (Petters and Kreidenweis, 2007):
where aw is the water activity at which the growth factor was measured. According to Köhler theory (Köhler, 1936), aw is obtained by the following:
where σs is the surface tension of the solution droplet (assumed to be pure water), νw is the partial molar volume of water in solution, R is the universal gas constant, T is the temperature, and D is the diameter of the droplet.
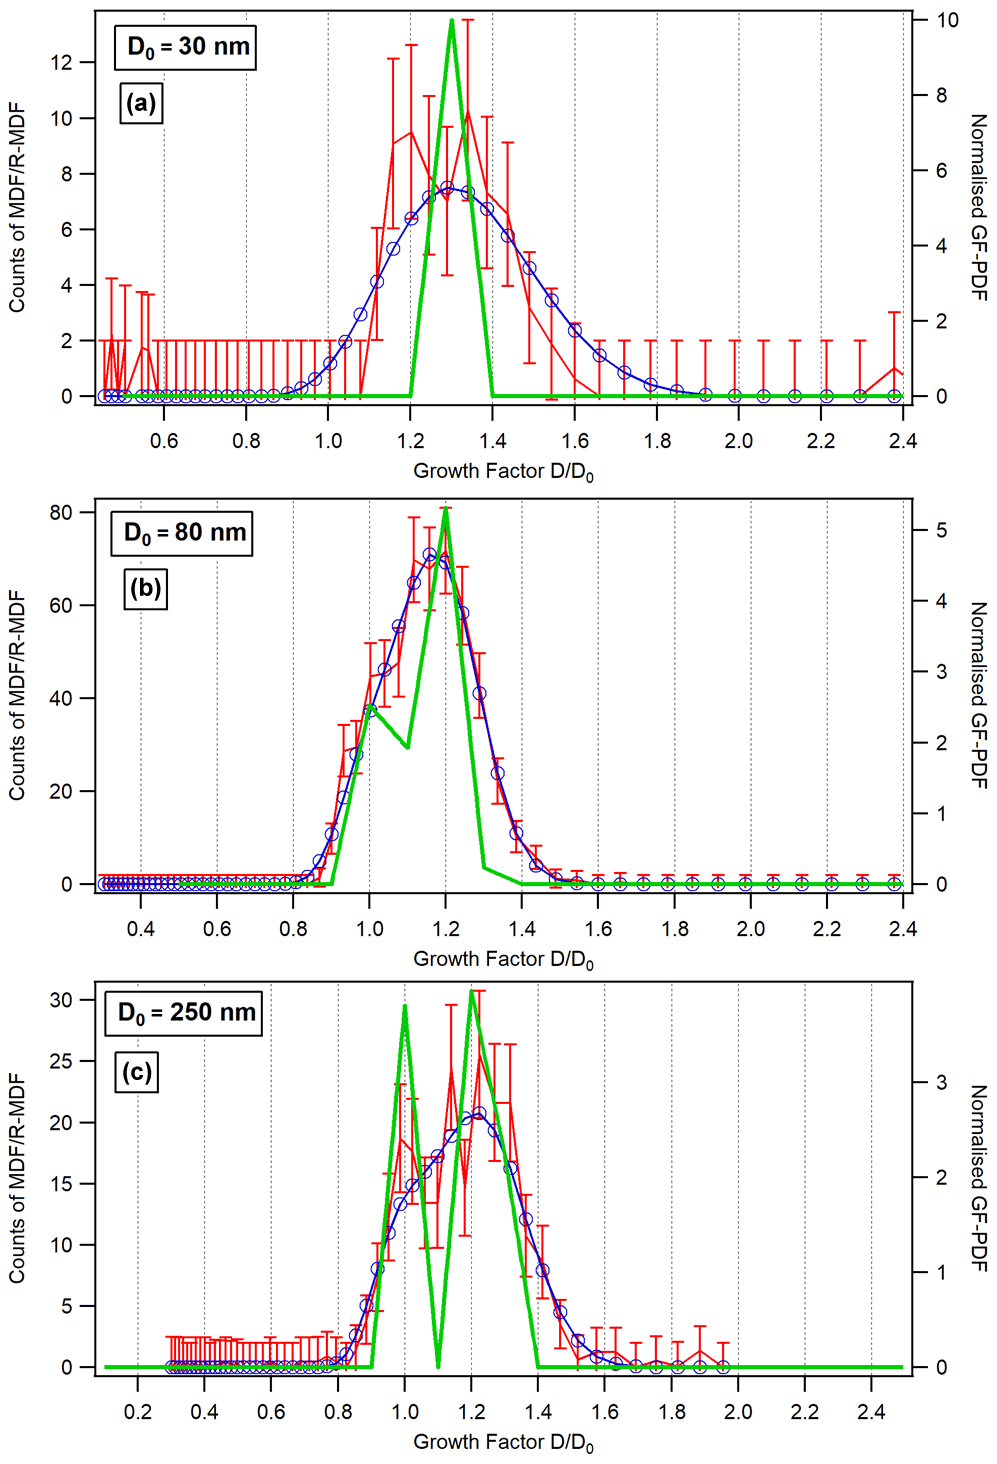
Figure 3Example of growth factor distributions measured at RH = 90 % of D0=30 nm particles (a, internally mixed), of D0=80 nm particles (b, continuum of mixing states) and of D0=250 nm particles (c, externally mixed with distinct modes). The red line represents the measured particle counts, the blue line represents the reconstructed measured distribution function, and the green line is the GF-PDF.
One of the limitations of the HTDMA technique for size-resolved hygroscopicity measurements arises from selecting several representative size fractions to study but at the same time obtaining data in a relatively high time resolution. In our case, four dry sizes were selected to be studied, i.e. 30, 50, 80 and 250 nm. Our findings reveal that the 50 and 80 nm Aitken particles presented similar hygroscopic properties, whereas larger differences were observed between the Aitken particles and the particles in the accumulation size range, i.e. 250 nm. At least from a CCN prediction perspective, our size selection might not be the optimal one, although the GF-PDFs can be interpolated in time and diameter in between the available measurements to describe the hygroscopic behaviour of the aerosol particles in each size bin of the SMPS without introducing too much error in CCN predictions as confirmed by previous studies (Kammermann et al., 2010). Alternatively, it might be more ideal that the hygroscopic properties of ambient aerosol at the dry diameters D0 of 60 and 120 nm instead of at 50 and 80 nm are investigated given that the size range between 100 and 150 nm is considered very important for CCN studies.
2.3.2 Cluster analysis
k-means cluster analysis was applied to the hourly-averaged particle number size distributions to classify the distributions of the highest degree of similarity into the same cluster, reducing in that way the complexity of the dataset. The k-means method aims to minimise the sum of the squared Euclidian distance between each dataset point and the corresponding cluster centre (i.e. the mean of all the points in a cluster). Cluster analysis was performed using the IBM SPSS software. The interpretation of the origin of each cluster was based on the dominant size modes (Hussein et al., 2014), their hourly frequency of occurrence and the average values obtained for standard meteorological parameters.
2.3.3 Multimodal analysis
The modal characteristics of the clustered average number size distributions were obtained by applying a curve-fitting algorithm as proposed by Hussein et al. (2005). The least-squares method was used to best-fit the sum of up to four modes to the multi-modal distributions to the clustered number size distributions. The log-normal distributions were described by the following characteristic modal parameters of each mode: geometrical mean mobility diameter, number concentration and geometric standard deviation. Starting from an initial assumption, the modal parameters of each log-normal distribution were successively re-defined to obtain the best-fit curve. The algorithm starts by fitting a unimodal log-normal distribution and successively tests the possibility of increasing it to a bi-, a tri- and finally a tetra-modal distribution. The optimum best-fit curve was determined by minimising the root mean square error (RMSE, %), defined by Vratolis et al. (2019) as
where n is the number of size bins of the SMPS size distribution, is the number concentration measured by the SMPS at size bin i corresponding to particle diameter dpi, and is the number concentration of the sum of fitted modes at diameter dpi.
3.1 Seasonal and monthly variability in aerosol GF and mixing state
The seasonal and the annual mean GF-PDFs, Fig. 4., were calculated by averaging the individual GF-PDF for each dry particle size and season. The GF-PDFs represent the mean distributions of the growth factors of particles with D0=30, 50, 80 and 250 nm. The selected dry sizes are representative of the nuclei (30 nm), Aitken (50 and 80 nm) and accumulation (250 nm) modes of the aerosol number size distributions. It has to be highlighted that the mean GF-PDFs represent the mean distributions of growth factors and do not necessarily provide a clear picture of the mixing state of these size fractions. Specifically, the appearance of a broad mode or two overlapping modes or two distinct modes does not imply the simultaneous existence of particles with distinctly different hygroscopic properties and therefore compositions, but it may also result as a matter of GF temporal variability. Below it will be further discussed and clarified which factor is the prominent one in different cases. The majority of the mean GF-PDFs of the nuclei mode particles with dry diameters of 30 nm were characterised by a unimodal peak during all seasons, except winter, with GFs ranging between 1.17 and 1.41, as reported in Table S1. Non- and/or slightly hygroscopic 30 nm particles with GF ∼ 1.0 are essentially missing, in contrast to particles with D0>30 nm, indicating that bare black carbon particles do not make a dominant contribution at this size either because sources of other particle types are stronger or because they rapidly acquire some hygroscopic coatings.
In wintertime, a complex state of mixing was observed indicating that both fresh (non- and/or slightly hygroscopic) and aged (more hygroscopic) combustion-generated nanoparticles (i.e. biomass burning, traffic) contribute to the nuclei mode, with the timescale and efficiency of the ageing process governing the final hygroscopic properties and state of mixing (Wang et al., 2018; Enroth et al., 2018; Swietlicki et al., 2008; Kim et al., 2020; Vu et al., 2021). The externally mixed nature of the nuclei mode reflects the less efficient ageing and coating of the fresh combustion-related nanoparticles during the dark and cold months of the year.
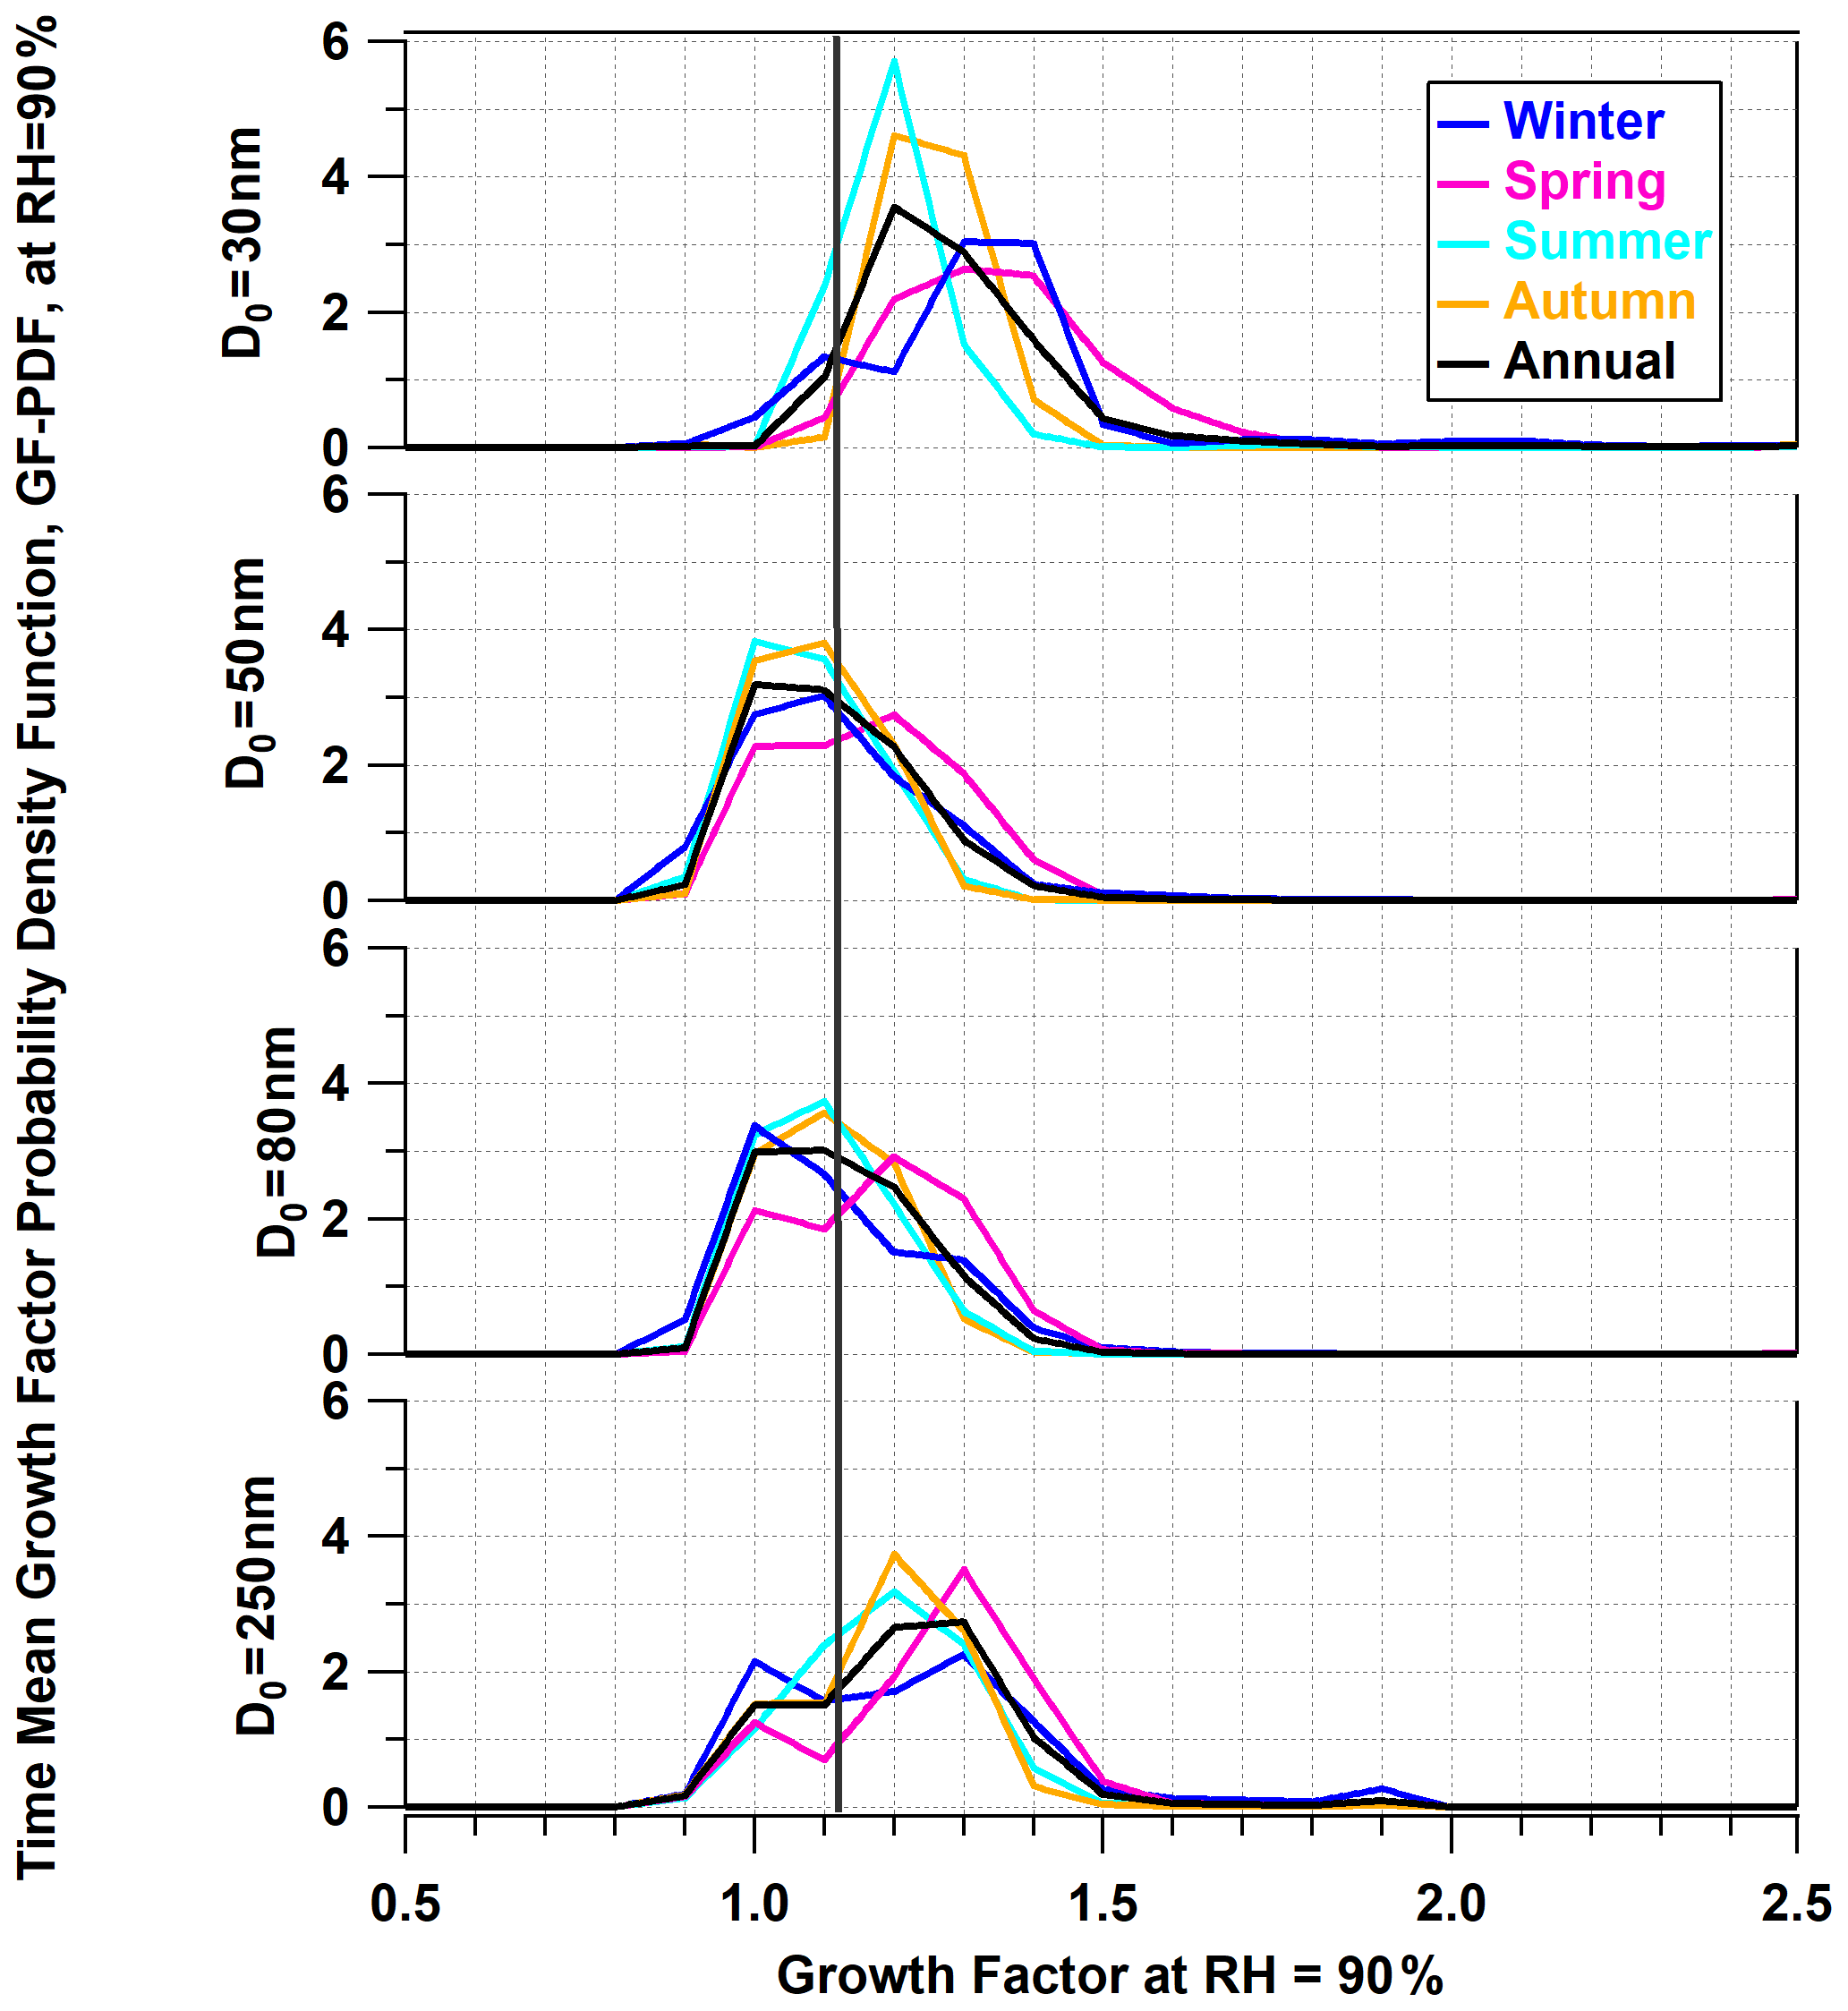
Figure 4Seasonal and annual mean GF-PDFs for different dry particle sizes (30, 50, 80 and 250 nm). The vertical black line represents the selected cutoff between the non- and/or slightly hygroscopic mode (GF < 1.12) and the moderately hygroscopic mode (GF > 1.12).
The GF-PDFs of medium to large Aitken mode particles, i.e. at 50 and 80 nm, are characterised by a broad peak within the range of 1.00 and 1.27 (Table S1). The contribution of the non- and/or slightly hygroscopic mode is higher in the Aitken mode compared to the moderately hygroscopic mode in all seasons, except spring.
The separation of the two distinct hygroscopic modes (a bimodal distribution or a continuum of mixing states) is most pronounced for the accumulation mode particles (250 nm). The contribution of the moderately hygroscopic mode to the total hygroscopicity is higher compared to the hygroscopicity of Aitken particles. Particles larger than 100 nm are usually more aged than the smaller particles, with higher values of GF (Cubison et al., 2006), and are more immediately associated with the atmospheric processing they undergo during long-range transport (Kalivitis et al., 2015). However, in winter time the expected slowing down of secondary aerosol formation processes and the existence of larger primary particles, partly from biomass burning (Bernardoni et al., 2017), make evident the distinct appearance of the fresh non- and/or slightly hygroscopic mode and moderately hygroscopic mode in this size range. Moreover, looking at the GF-PDFs of the particles in the accumulation mode a peak appeared in the highly hygroscopic range. However, the number fraction corresponding to the peak is extremely low (i.e. close to zero). Thus, we decided not to investigate further the nature of this peak.
In order to investigate the hygroscopic properties of particles in more detail, the temporal variability in mean GF, standard deviation σ, individual GF-PDF measurements and hygroscopicity parameter κ was assessed by means of the box plots presented in Fig. 5 for each month and for the dry diameters of 30, 50, 80 and 250 nm.
The 30 nm particles appeared to have a peak in GF during spring time (April–May) and a second peak during late autumn and early winter with a high variability in mean GF (Fig. 5a). The 30 nm particles were internally mixed for all months with σ≤0.07, except January and February when the mean σ was 0.10 and 0.13, respectively (Fig. 5b). In the latter case the aerosol particles were externally mixed (overlapping modes). Despite the fact that the monthly mean GF-PDFs in Fig. S1 look similarly broad in February and April, the time-resolved data are quite different. In April the 30 nm particles are characterised by a low degree of mixing state (always low sigma, σ=0.07), while considerable temporal variability in mean GF leads to a broad monthly mean GF-PDF. By contrast, in February, the mean GF exhibits limited variability, while the aerosol is externally mixed at any time (σ=0.13). The κ values corresponding to the mean GFs ranged from 0.11 to 0.33 (Fig. 5c).
The Aitken particles (50 and 80 nm) were characterised by a continuum of mixing states (externally mixed with overlapping modes), with σ values (Fig. 5e and h) ranging between 0.09 and 0.13, except August when the mean σ was 0.06, indicating an internally mixed aerosol. On average, the mean GFs and κ values of the Aitken particles appeared to follow the same trend as the 30 nm particles but with lower absolute values. The κ values of the Aitken particles (Fig. 5f and i, respectively) ranged between 0.02 and 0.13.
The D0=250 nm particles were characterised by a high degree of external mixing state (, Fig. 5k) during all months, except August and September when the aerosol displays a low degree of mixing state (σ=0.09). The mean GF and κ values were minimum in August (1.09, 0.03, respectively) and maximum in April (1.29, 0.13, respectively), indicating the seasonal variability in chemical composition of ambient aerosol throughout the year.
A higher degree of external mixing state in winter (February) was generally expected due to a less effective ageing process. The exact magnitude and timing at this seasonal effect remain elusive based on a single year of observations.
The annual mean growth factors at 90 % relative humidity were found to be 1.28, 1.11, 1.13 and 1.22 for D0=30, 50, 80 and 250 nm, respectively. The mean values of hygroscopicity parameter κ, determined according to Eqs. (1) and (2), were found to be 0.22, 0.06, 0.08 and 0.12 for particles with dry diameters of 30, 50, 80 and 250 nm, respectively.
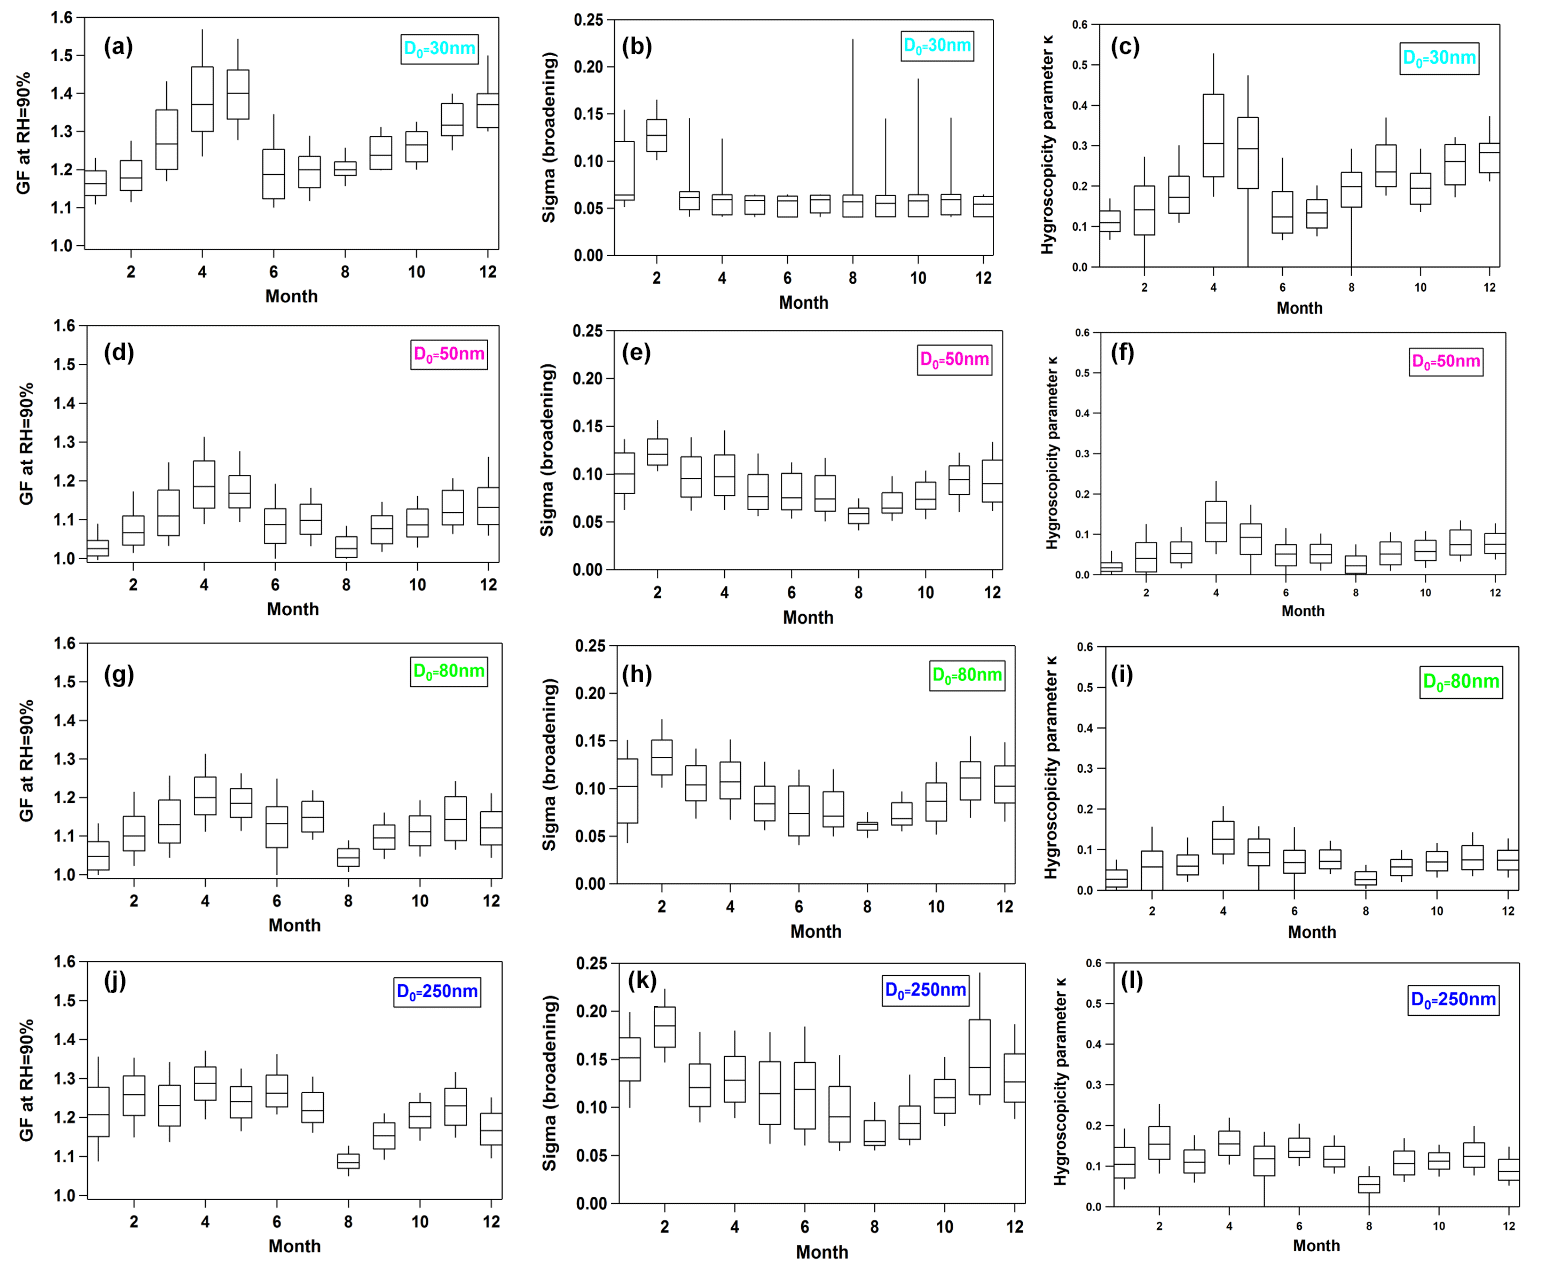
Figure 5Percentiles of the GF-PDF, standard deviation σ and hygroscopicity parameter κ for each dry size and for each month. Box plots with whiskers show 10th, 25th, 50th, 75th and 90th percentiles.
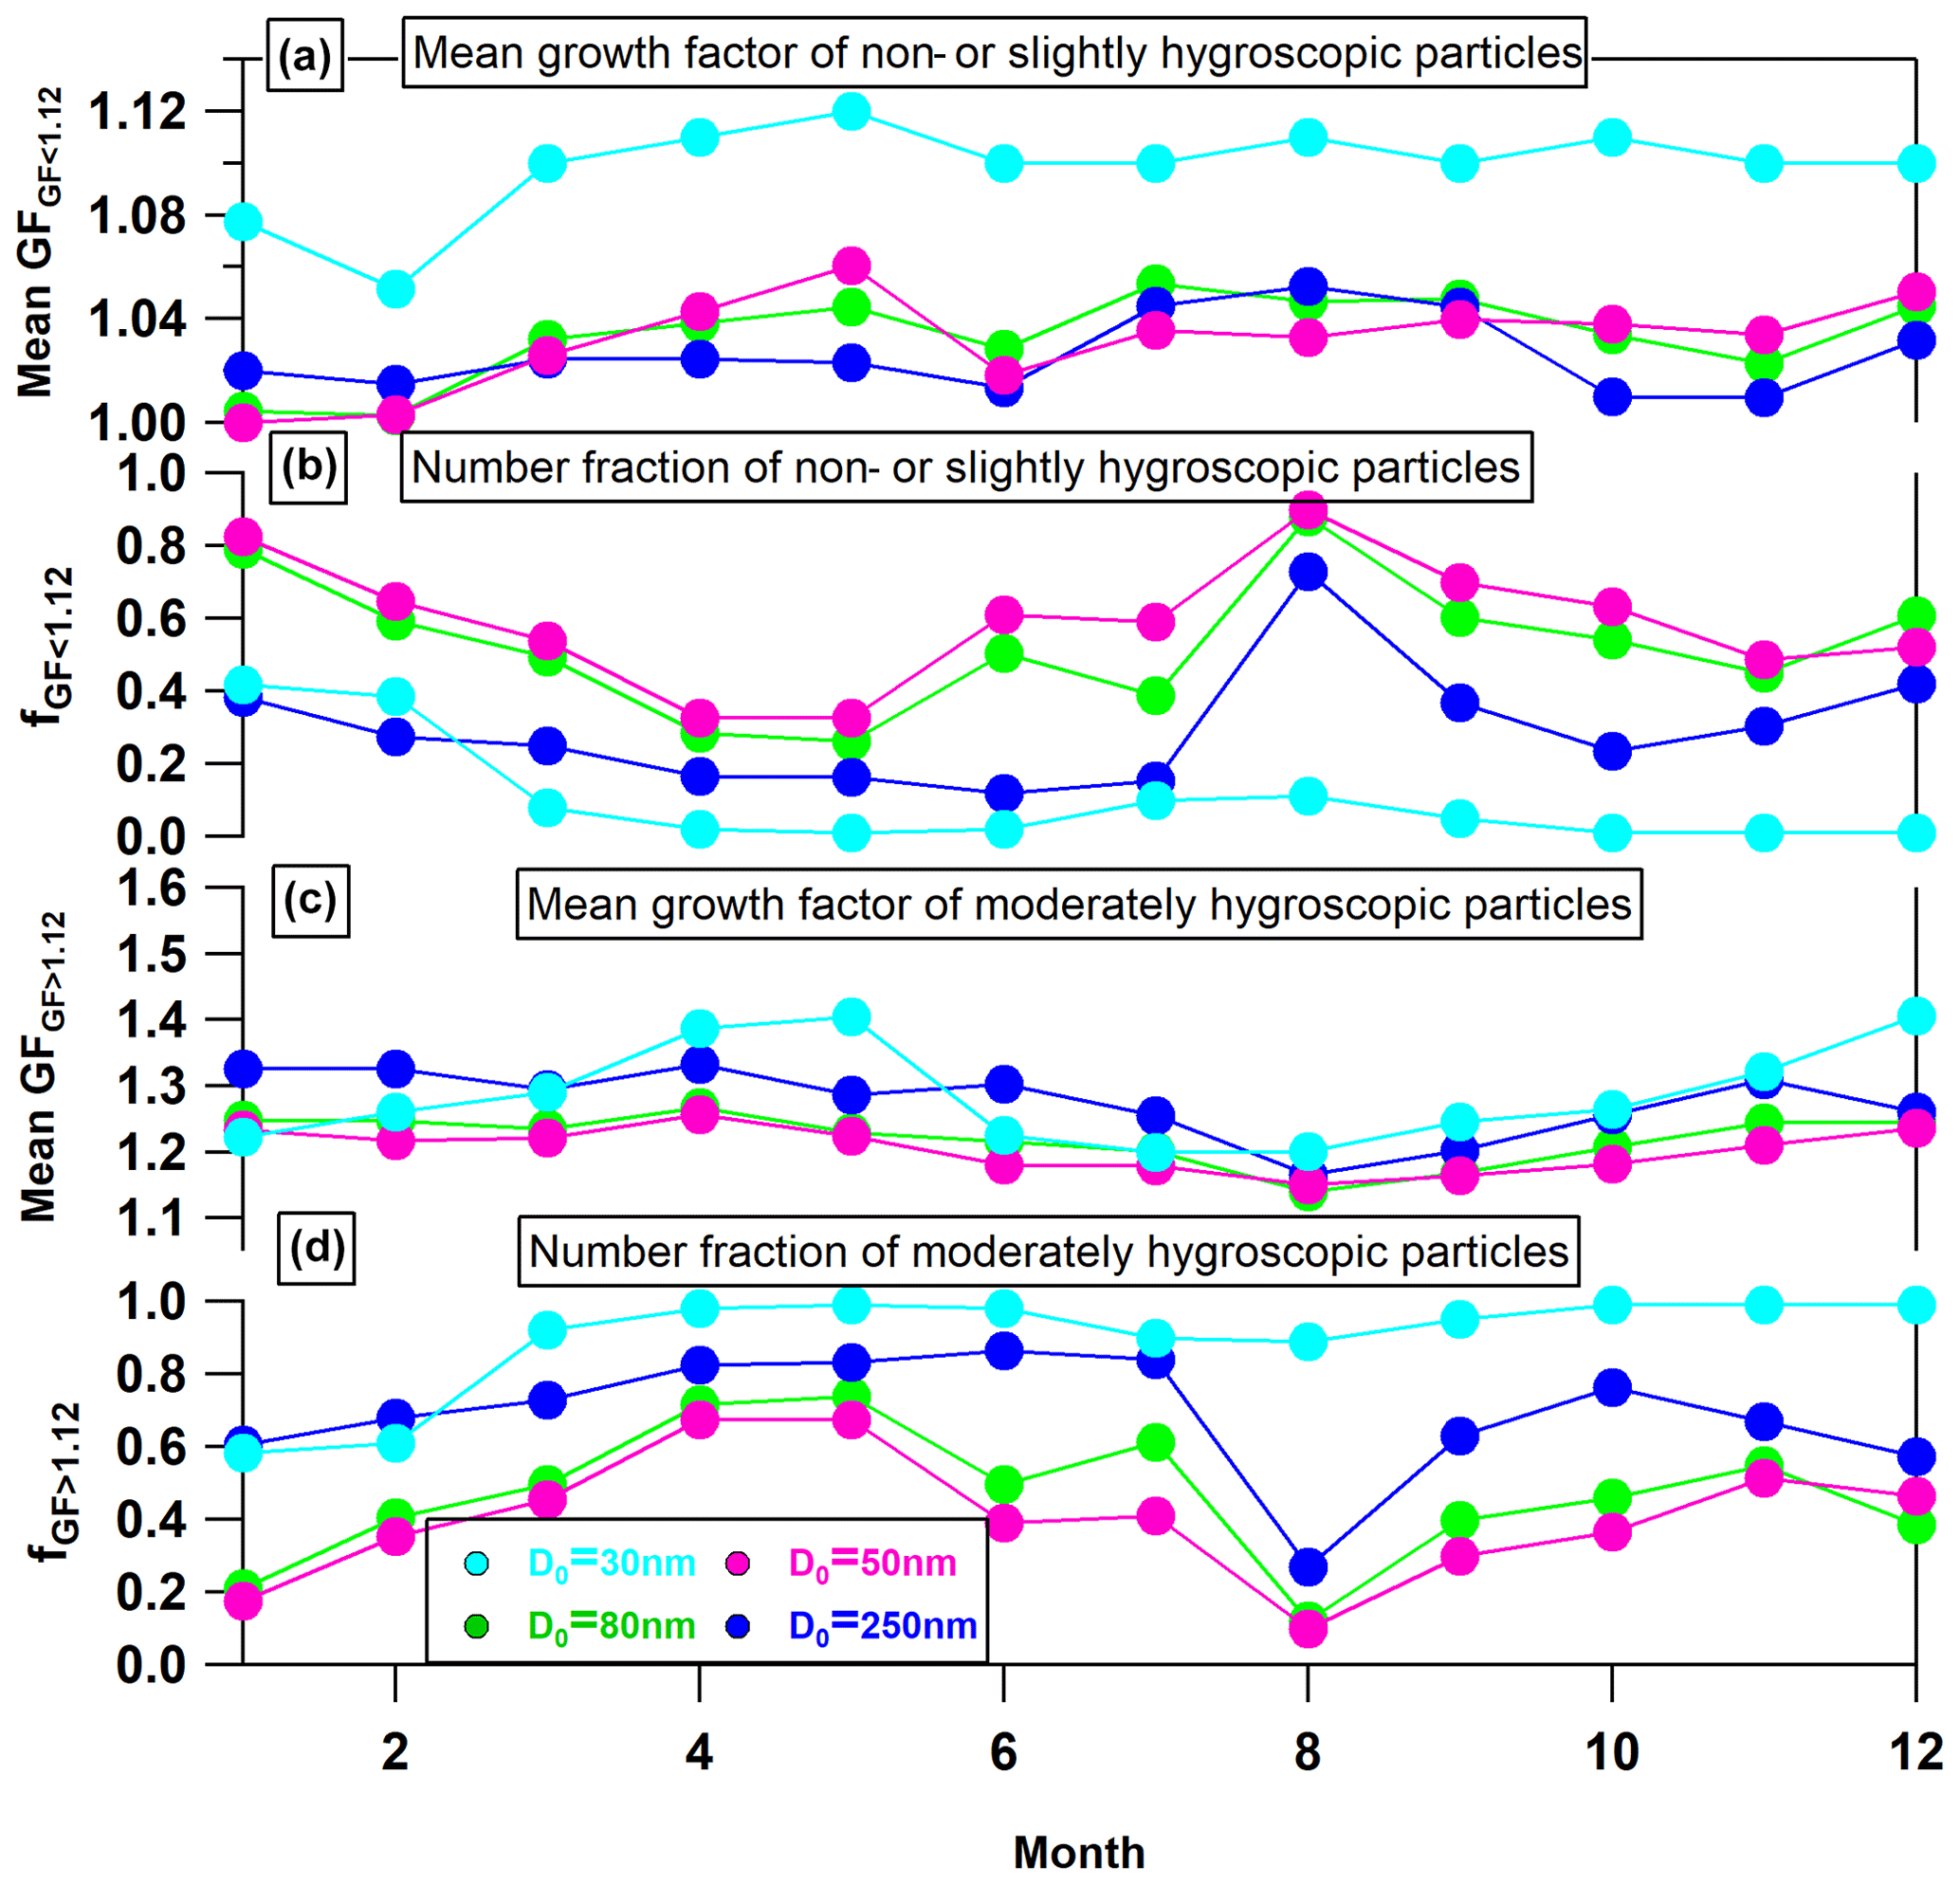
Figure 6Annual cycles (a) of the monthly mean GFs for non- or slightly hygroscopic particles at 90 % RH, (b) of the number fraction of non- and/or slightly hygroscopic particles at 90 % RH, (c) of the monthly mean GFs for moderately hygroscopic particles at 90 % RH, and (d) of number fraction of moderately hygroscopic particles for different particle sizes.
Figure 6 shows the monthly mean GFs and the number fraction fGF of non- and/or slightly hygroscopic and moderately hygroscopic mode for each D0. The variation in the mean GF for particles with GF < 1.12 is expected to be relative low, given that the upper boundary of the non- and/or slightly hygroscopic mode (1.12) is quite low and close to the lowest boundary (1.0). The mean GF of the moderately hygroscopic mode presented larger variability, with the minimum being observed in summer (i.e. August). The mean GF of the subset with GF > 1.12 was larger for the 30 and 250 nm particles compared with the 50 and 80 nm particles. The different hygroscopic properties of these particles reflect the differences in their chemical composition, with the particles in the nucleation and in the accumulation modes containing a larger fraction of more hygroscopic compounds, such as inorganics and more-oxidised organics, compared to Aitken particles (Bougiatioti et al., 2016). This trend in the size dependence of the mean GFs and consequently of the mean kappa values is in line with the results from previous studies (Xu et al., 2019; Jurányi et al., 2013; Petäjä et al., 2007). Indicative GF values for different chemical compounds are listed in Table 1.
The number fraction of each mode was also significantly different from month to month for all dry sizes, with distinct variability in the relative contributions of particles with small or moderate-to-large growth factors. For dry particle diameters D0>30 nm, the contribution of the non- and/or slightly hygroscopic mode was minimum in spring and maximum in August and in winter. For particles with D0=250 nm, the moderately hygroscopic particles clearly dominate over those with GF < 1.12 for all seasons. Specifically, the number fractions of the moderately hygroscopic particles with D0=250 nm were 0.62, 0.80, 0.67 and 0.70 in winter, spring, summer and autumn, respectively. This is consistent with the perception that the accumulation mode is dominated by aged aerosol (i.e. background aerosol) (Psichoudaki et al., 2018).
Table 1Mean growth factors measured at RH = 90 % for particles with different chemical compositions.

3.2 Annual and seasonal diurnal variability
The mean diurnal variability in critical meteorological parameters, i.e. wind speed, temperature and relative humidity, is shown in Fig. S2. The daily average temperature varied between 17.2 and 20.5 ∘C, peaking at midday, whereas the average daily relative humidity was ∼ 60 %, ranging between 68 % (night and early morning) and 49 % (midday). The daily average wind speed varied between 1.81 and 2.84 m s−1 peaking also at midday. Generally, higher concentrations of traffic-related pollutants are expected to be observed at the suburban site at midday, when conditions favour mixing and dispersion of the generated aerosol across the Athens valley. The prevailing westerly winds become stronger resulting in a well-mixed atmosphere, while the pollutants are transported from the city to the suburban site (Kalogridis et al., 2018). During the evening hours, a peak in the concentration levels of different air pollutants is typically observed reflecting the increased atmospheric stability (development of local inversion/nocturnal boundary layer) and emissions from different combustion sources especially in winter (i.e. residential heating) (Eleftheriadis et al., 2021).
Particle hygroscopicity was lower during morning rush hours, when an increase in the traffic-related emissions is expected to occur. In the afternoon an increase in hygroscopicity was observed which may be attributed to the condensation of water-soluble organics and inorganics on fresh primary particles of local and regional origin (Psichoudaki et al., 2018; Eleftheriadis et al., 2014). According to previous studies, the mass fraction of secondary organic compounds, which is generally higher in summer (Diapouli et al., 2017; Mendes et al., 2018), peaks at noon, resulting in intermediate GF values (GF < 1.3) a few hours later (Bourcier et al., 2012).
The diurnal mean GFs, standard deviation of mean GFs, and number fractions of the non- and/or slightly hygroscopic and the moderately hygroscopic modes are presented in Fig. 7 for each dry particle size. The Aitken particles are generally externally mixed throughout the day, with a higher contribution of the moderately hygroscopic mode in the early morning (03:00–05:00 UTC+2). A second but less pronounced peak also appeared in the afternoon. The 24 h cycle of the mean GF of the non- and/or slightly hygroscopic mode (GF < 1.12) appeared to have two peaks, with the major contribution of the non- and/or slightly hygroscopic particles occurring at midday. Particles in the accumulation mode appeared to have a somewhat similar hygroscopic behaviour in terms of diurnal variability to Aitken particles, even though with less pronounced changes within the day for both growth factors and number fractions.
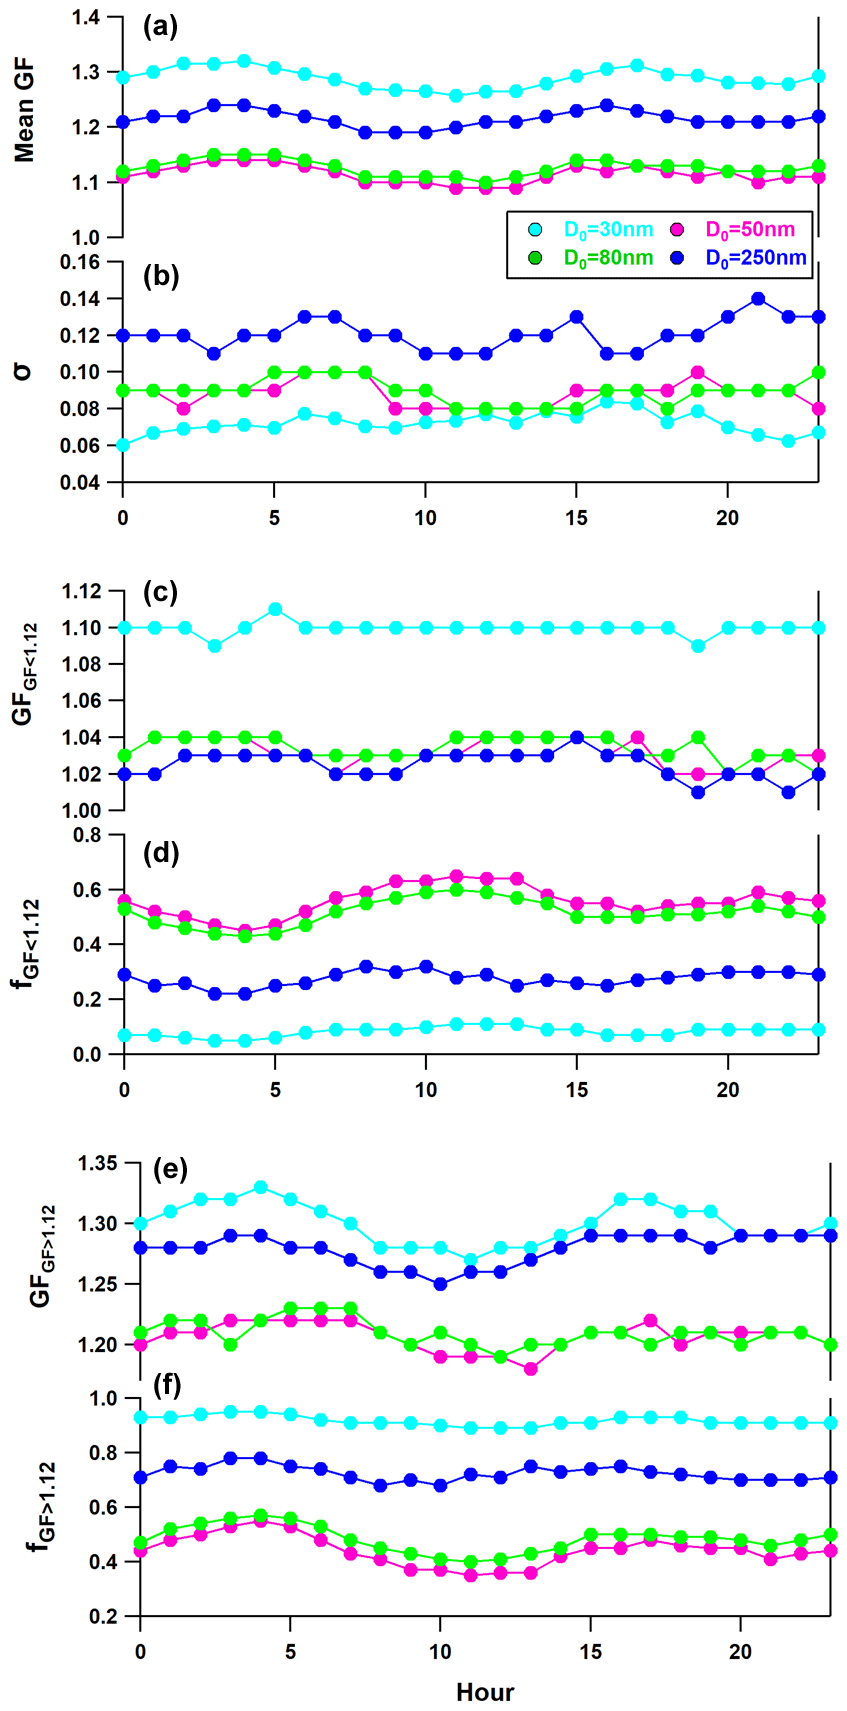
Figure 7Diurnal variation in (a) mean GF, measured at RH = 90 %, (b) standard deviation of the mean GF, (c) GF of non- or slightly hygroscopic particles, (d) the number fraction of non- or slightly hygroscopic particles, (e) GF of moderately hygroscopic particles, and (f) the number fraction of moderately hygroscopic particles.
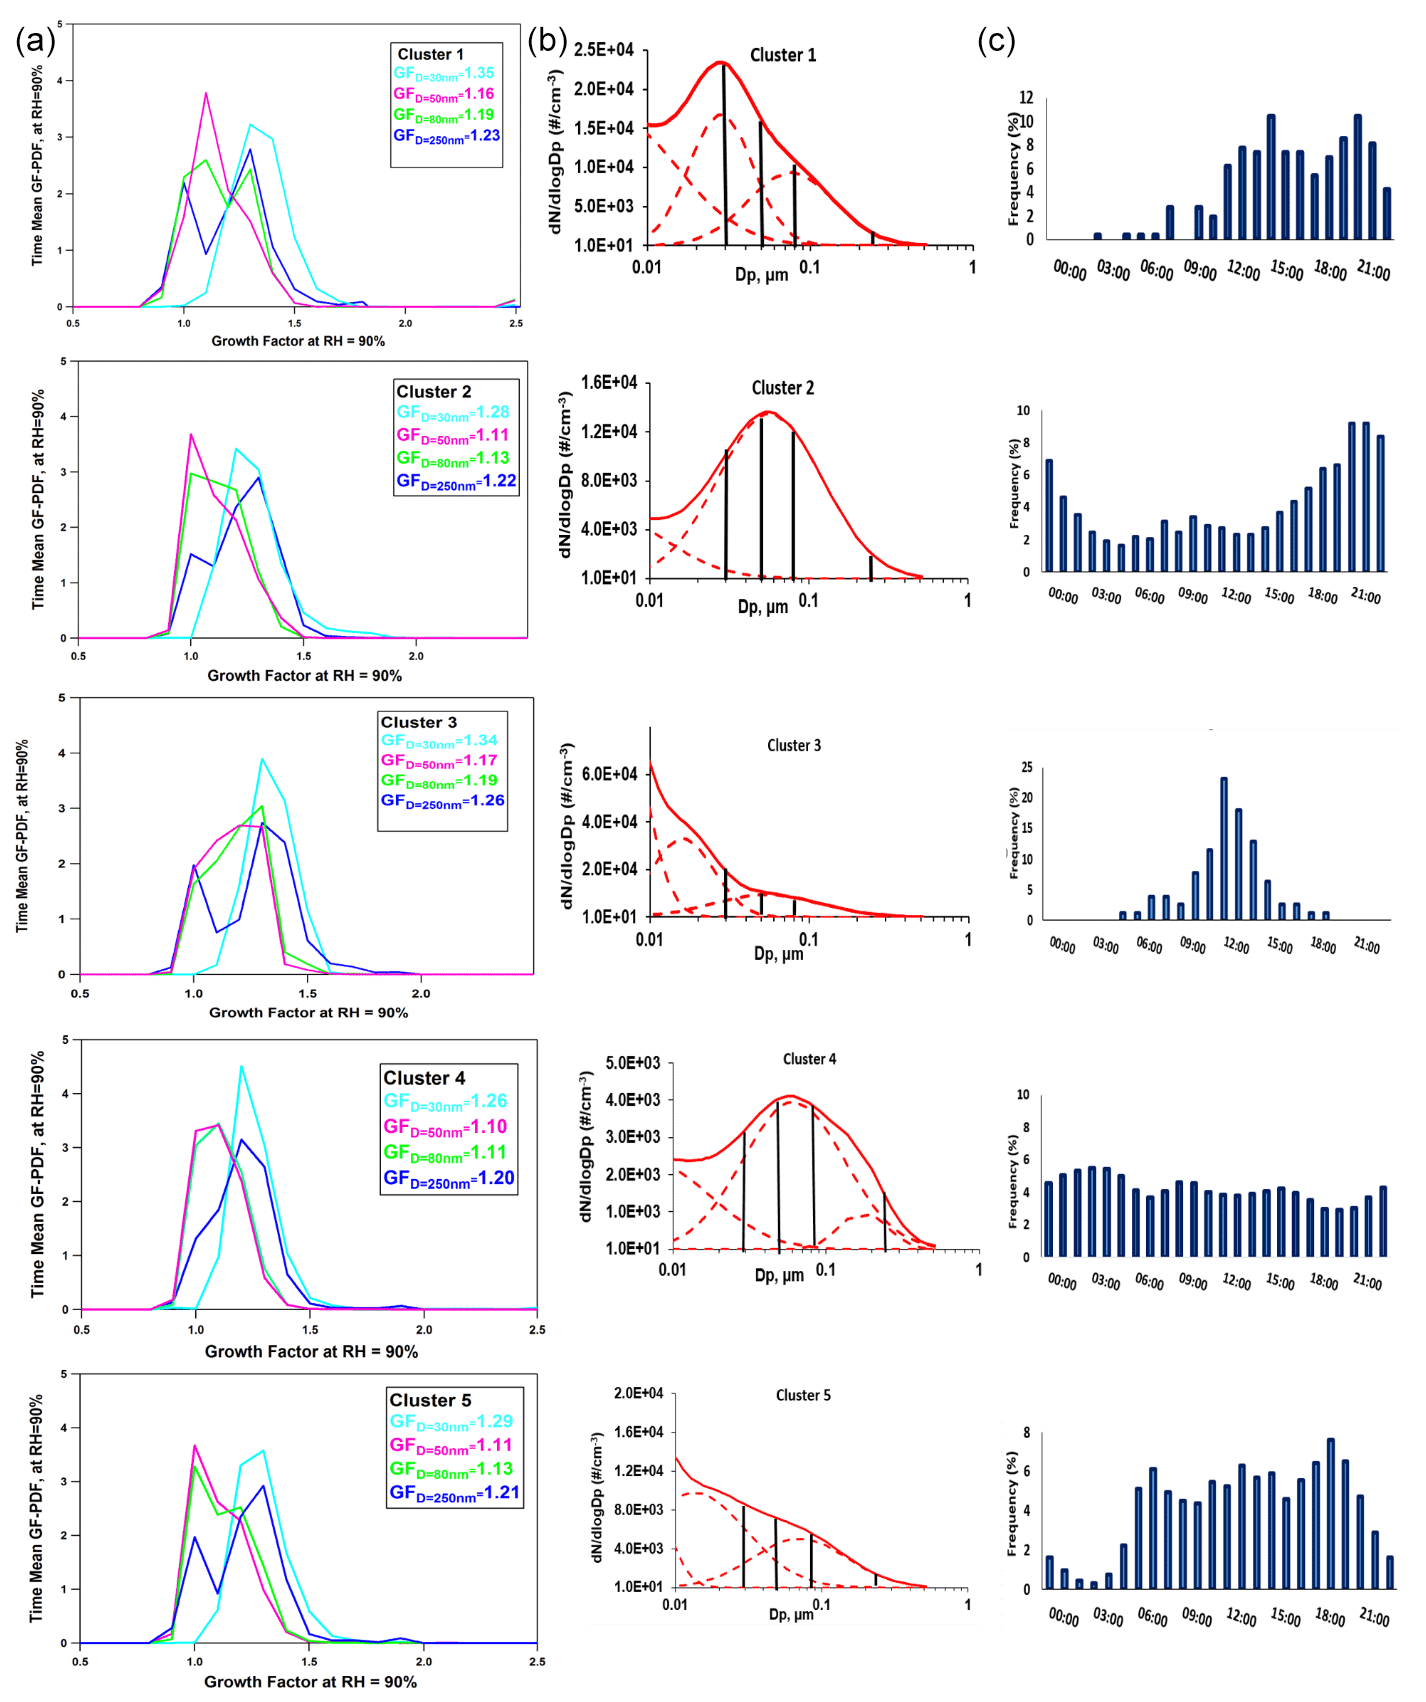
Figure 8(a) Mean GF-PDF, (b) average number size distribution and (c) hourly frequency of occurrence for each cluster.
For the 30 nm particles, it was observed that the GF of the moderately hygroscopic mode was higher (GF > 1.3) between late evening and early morning (00:00–05:00 UTC+2), when the relative humidity appeared to have the maximum values (Fig. S2), as well as at early afternoon (15:00–20:00 UTC+2). At the DEM station, the 30 nm particles are primarily related to traffic emissions and to a lesser extent to new particle formation (Vratolis et al., 2019; Zografou et al., 2022). This was also confirmed in the present study by the cluster analysis of the number size distributions. In Fig. S3, the CPF (conditional probability function) polar plot of the 75th percentile of the total number concentration in the size range from 20 to 38 nm is presented. CPF analysis was performed by using the OpenAir software (Carslaw and Ropkins, 2012). It is obvious that these particles are predominately originated from the urban area under moderate wind speeds. Taking into account that the distance between Athens' city centre and the DEM station is around 7 km, the transport time within the Athens metropolitan area at the indicative wind speeds observed yields estimated transport times between 0.5 h and a few hours. These data provide enough evidence to assume that the observed nuclei concentrations reflect a synergetic effect between different combustion-related urban emissions (e.g. fresh traffic-related aerosol from the surrounding urban area and further growth) especially during daytime and the development of the local inversion boundary layer during nighttime. As the particles undergo atmospheric ageing their composition changes, in relative terms, due to condensation of secondary aerosol.
The fact that Aitken particles appeared to be less hygroscopic than nuclei particles (Holmgren et al., 2014) reflects the differences in availability in the atmosphere between the concentrations of inorganic and organic condensable vapours and their relative contribution to the hygroscopic GF of nuclei and Aitken modes. More specifically, inorganics and especially sulfuric acid are the main component for nuclei particles in polluted urban areas (Stolzenburg et al., 2005), but subsequent growth may be affected by the type and concentrations of condensable species. This process has been already described previously in Athens (Petäjä et al., 2007), where higher GFs for 20 and 50 nm indicated higher mass flux of soluble material. The decrease in hygroscopicity in the Aitken mode in this study can be potentially attributed to the dominating influence of higher concentrations of non-hygroscopic volatile organic vapours relative to the available condensable soluble mass.
3.3 Cluster analysis and aerosol hygroscopic properties
Cluster analysis was performed on the hourly-averaged size distributions in order to identify the link between aerosol hygroscopic properties, aerosol emission sources and particle formation mechanisms in the suburban area of Athens (Fig. 8b). The mean GF-PDFs were calculated for each cluster and for the different dry particle sizes (Fig. 8a). Differences in mean GF between clusters were small, but trends in hygroscopicity across clusters were constituent for all particle sizes. Particle number size distributions vary across different regions and environments (Rose et al., 2021), and the structure of their patterns can be used as an indicator of the possible aerosol particle emission sources and formation processes. At the DEM station, secondary aerosol formation, mostly related to sulfate and organics (Kostenidou et al., 2015; Tsiflikiotou et al., 2019), and traffic-related emissions are the main sources of ambient aerosol (Zografou et al. 2022), while biomass burning also constitutes a major source in winter (Vratolis et al., 2019; Bousiotis et al., 2021). In the present study, five clusters were identified which represent a combination of the major particle emission sources and formation/transformation processes. The modal characteristics of the clustered average number size distribution are summarised in Table S3.
Cluster 1 (aged traffic mixed with background aerosol) accounts for 4.2 % of the hourly particle number size distributions. The fact that the frequency of the cluster occurrence peaks at noon and afternoon and the morning traffic-related peak is missing, together with the prevailing westerly winds (Fig. S4), hints to traffic-related pollution transported from the urban area.
Cluster 2 (urban background, nocturnal) represents 12.1 % of the hourly-averaged number size distributions. The diurnal frequency of occurrence profile of this cluster is characterised by an evening peak. The average particle number size distribution has a major mode in the Aitken size range, which is probably a synergetic effect between particle emissions from different combustion sources (aged traffic, wood burning) and the development of the local inversion nocturnal boundary layer.
Cluster 3 (nucleation and growth) accounts for 1.3 % of the hourly-averaged number size distributions. The diurnal frequency of occurrence profile is characterised by a peak at noon, and the nuclei mode at particle sizes < 10 nm seemed to contribute more than 60 % to the total number concentration. This cluster was characterised by the lowest frequency of occurrence but the highest total number concentration, previously also observed in parallel in the surrounding area, (Mendes et al., 2018). It occurs almost exclusively under westerly wind directions (Fig. S4) of low to moderately wind speeds – conditions that favour new particle nucleation.
Cluster 4 (mixed urban and regional background) is the most frequent cluster (67 %), dominated by aged and long-range transported aerosols. The diurnal profile is characterised by an almost stable frequency of occurrence within the day and minimum total number concentrations (Brines et al., 2014). The major mode of the size distribution appeared in the Aitken size range (61 nm), while an additional mode also exists in the accumulation region.
Cluster 5 (fresh traffic and further growth) has a frequency of occurrence of 15.3 % and is characterised by a peak in the frequency of occurrence during morning and late afternoon traffic rush hours, with an additional peak that appeared at noon. It is not restricted to a specific wind direction, while the size distribution is similar to cluster 1 but with a higher contribution of nuclei particles to the total particle number concentration. This cluster represents the relatively fresh particles predominately transported in the receptor site from the neighbourhood urban area.
Specifically, clusters 2 and 5, which represent 12.1 % and 15.3 % of the hourly-averaged number size distributions, respectively have similar GF-PDF patterns and average GF values for all dry particle sizes. Clusters 1 and 3, which account only for 4.2 % and 1.3 % of the hourly particle number size distributions and are related to atmospheric conditions favouring new particle formation or transport of nuclei particles from the city centre to the sampling site, were characterised by more hygroscopic particles (higher mean GFs) compared to the other clusters. The particles of cluster 4, which represent 67 % of the averaged number size distributions, had the lowest mean GF values. The GF-PDF of the 30 nm particles appeared to have one moderately hygroscopic mode whose structure does not change significantly between the clusters. For the larger particles, the distributions of the GFs appeared to have two modes with more or less distinct modes. In the case of cluster 4, which mostly consists of aged and long-range transported particles, the GF-PDFs of the Aitken particles appeared to have a broad mode with no distinct modes, whereas the particles in the accumulation mode appeared to have two modes which were less distinct than in the other clusters.
The hygroscopic properties of ambient aerosol were investigated at a suburban environment in Athens over a period of 12 months, using an HTDMA system for dry particle sizes of 30, 50, 80 and 250 nm at a relative humidity (RH) of 90 %. The standard deviation σ of the inverted GF-PDF was used as a measure of the mixing state of aerosol. The aerosol was characterised as internal, external (with two well-defined modes) or a continuum of mixing states (with two overlapping modes). In the case of an externally mixed aerosol, the growth factor spectrum was characterised by a non- and/or slightly hygroscopic mode (e.g. black carbon, fresh carbonaceous aerosol) and a moderately hygroscopic mode (e.g. aged traffic, background aerosol).
The data were analysed in terms of their temporal seasonal and diurnal variability. The 30 nm particles were mostly internally mixed and moderately hygroscopic in all seasons, except wintertime when a significant fraction of non- and/or slightly hygroscopic mode became distinct. The 50 and 80 nm Aitken particles were mostly externally mixed except August when an internally mixed and non- and/or slightly hygroscopic aerosol type dominated this size fraction. The 250 nm particles were externally mixed, with the moderately hygroscopic mode being the major contributor to particle GFs in all seasons. A higher degree of external mixing state in winter (February) was observed in all cases. This was generally expected due to the dominance of primary emissions from different combustion sources (i.e. biomass burning, traffic) and the less effective ageing process under cold and dark conditions. Exact magnitude and timing at this seasonal effect remains elusive based on a single year of observations.
The number size distributions were also analysed by means of cluster analysis to identify the link between aerosol hygroscopicity and state of mixing and aerosol origin. The data were categorised into five clusters representative of traffic-related emission sources (fresh and aged traffic), the mixed urban and regional background and urban nocturnal aerosol, and the photochemically induced new particle formation (nucleation). The clusters related to atmospheric conditions favouring new particle formation or transport of nuclei particles from the city centre, after undergoing further mixing with the background aerosol, are characterised by more hygroscopic nuclei particles compared to the other clusters. The mean GF-PDFs of the Aitken particles and the particles in the accumulation size range revealed that their patterns are significantly associated with particle origin, being characterised by either a broad mode (urban and regional background aerosol) or two more or fewer distinct modes.
The HTDMA data obtained in this study can be further parameterised and used as a proxy for CCN prediction.
Data are available upon request to the author (spitieri@ipta.demokritos.gr).
The supplement related to this article is available online at: https://doi.org/10.5194/acp-23-235-2023-supplement.
CS performed the formal analysis and wrote the original draft. CS and MG performed the investigation and data curation. CS, MG and MGB provided the methodology and conceptualisation. KE, MGB and MG provided supervision and validation. MG, KE and MGB contributed to reviewing and editing the manuscript.
The contact author has declared that none of the authors has any competing interests.
Publisher’s note: Copernicus Publications remains neutral with regard to jurisdictional claims in published maps and institutional affiliations.
This research is co-financed by Greece and the European Union (European Social Fund, ESF) through the Operational Programme “Human Resources Development, Education and Lifelong Learning” in the context of the project “Strengthening Human Resources Research Potential via Doctorate Research” (MIS-5000432), implemented by the State Scholarships Foundation (IKY).
We also acknowledge partial support by the project “PANhellenic infrastructure for Atmospheric Composition and climate change” (MIS 5021516), which is implemented under the action “Reinforcement of the Research and Innovation Infrastructure”, funded by the Operational Program “Competitiveness, Entrepreneurship and Innovation” (NSRF 2014–2020) and co-financed by Greece and the European Union (European Regional Development Fund).
We also acknowledge partial support by the action titled “National Network on Climate Change and its Impacts – CLIMPACT”, funded by the Public Investment Program of Greece, General Secretariat of Research and Technology/Ministry of Development and Investments.
This research is co-financed by Greece and the European Union (European Social Fund – ESF) through the operational programme “Human Resources Development, Education and Lifelong Learning” in the context of the project “Strengthening Human Resources Research Potential via Doctorate Research” (grant no. MIS 5000432), implemented by the State Scholarships Foundation (IKY); the project “PANhellenic infrastructure for Atmospheric Composition and climatE chAnge” (grant no. MIS 5021516), which is implemented under the action “Reinforcement of the Research and Innovation Infrastructure”, funded by the operational programme “Competitiveness, Entrepreneurship and Innovation” (NSRF 2014–2020) and co-financed by Greece and the European Union (European Regional Development Fund); and the action titled “National Νetwork on Climate Change and its Impacts – CLIMPACT”, funded by the Public Investment Program of Greece, General Secretariat of Research and Technology – Ministry of Development and Investment (grant nos. MIS 5000432, MIS 5021516).
This paper was edited by Tuukka Petäjä and reviewed by two anonymous referees.
Achtert, P., Birmili, W., Nowak, A., Wehner, B., Wiedensohler, A., Takegawa, N., Kondo, Y., Miyazaki, Y., Hu, M., and Zhu, T.: Hygroscopic growth of tropospheric particle number size distributions over the North China Plain, J. Geophys. Res., 114, D00G07, https://doi.org/10.1029/2008JD010921, 2009.
Bernardoni, V., Elser, M., Valli, G., Valentini, S., Bigi, A., Fermo, P., Piazzalunga, A., and Vecchi, R.: Size-segregated aerosol in a hot-spot pollution urban area: Chemical composition and three-way source apportionment, Environ. Pollut., 231, 601–61, 2017.
Bezantakos, S., Barmpounis, K., Giamarelou, M., Bossioli, E., Tombrou, M., Mihalopoulos, N., Eleftheriadis, K., Kalogiros, J., D. Allan, J., Bacak, A., Percival, C. J., Coe, H., and Biskos, G.: Chemical composition and hygroscopic properties of aerosol particles over the Aegean Sea, Atmos. Chem. Phys., 13, 11595–11608, https://doi.org/10.5194/acp-13-11595-2013, 2013.
Bougiatioti, A., Bezantakos, S., Stavroulas, I., Kalivitis, N., Kokkalis, P., Biskos, G., Mihalopoulos, N., Papayannis, A., and Nenes, A.: Biomass-burning impact on CCN number, hygroscopicity and cloud formation during summertime in the eastern Mediterranean, Atmos. Chem. Phys., 16, 7389–7409, https://doi.org/10.5194/acp-16-7389-2016, 2016.
Bourcier, L., Sellegri, K., Chausse, P., Pichon, J. M., and Laj, P.: Seasonal variation of water-soluble inorganic components in aerosol size-segregated at the puy de Dôme station (1,465 m a.s.l.), France, J. Atmos. Chem., 69, 47–66, https://doi.org/10.1007/s10874-012-9229-2, 2012.
Bousiotis, D., Pope, F. D., Beddows, D. C. S., Dall'Osto, M., Massling, A., Nøjgaard, J. K., Nordstrøm, C., Niemi, J. V., Portin, H., Petäjä, T., Perez, N., Alastuey, A., Querol, X., Kouvarakis, G., Mihalopoulos, N., Vratolis, S., Eleftheriadis, K., Wiedensohler, A., Weinhold, K., Merkel, M., Tuch, T., and Harrison, R. M.: A phenomenology of new particle formation (NPF) at 13 European sites, Atmos. Chem. Phys., 21, 11905–11925, https://doi.org/10.5194/acp-21-11905-2021, 2021.
Brines, M., Dall'Osto, M., Beddows, D. C. S., Harrison, R. M., and Querol, X.: Simplifying aerosol size distributions modes simultaneously detected at four monitoring sites during SAPUSS, Atmos. Chem. Phys., 14, 2973–2986, https://doi.org/10.5194/acp-14-2973-2014, 2014.
Cubison, M. J., Alfarra, M. R., Allan, J., Bower, K. N., Coe, H., McFiggans, G. B., Whitehead, J. D., Williams, P. I., Zhang, Q., Jimenez, J. L., Hopkins, J., and Lee, J.: The characterization of pollution aerosol in a changing photochemical environment, Atmos. Chem. Phys., 6, 5573–5588, https://doi.org/10.5194/acp-6-5573-2006, 2006.
Carslaw, D. C. and Ropkins, K.: openair – An R package for air quality data analysis, Environ. Model. Softw., 27/28, 52–61, https://doi.org/10.1016/j.envsoft.2011.09.008, 2012
Cocker III, D. R., Whitlock, N. E., Flagan, R. C., and Seinfeld, J. H.: Hygroscopic Properties of Pasadena, California Aerosol, Aerosol Sci. Technol., 35, 637–647, https://doi.org/10.1080/02786820120653, 2001.
Diapouli, E., Kalogridis, A.-C., Markantonaki, C., Vratolis, S., Fetfatzis, P., Colombi, C., and Eleftheriadis, K.: Annual Variability of Black Carbon Concentrations Originating from Biomass and Fossil Fuel Combustion for the Suburban Aerosol in Athens, Greece, Atmosphere, 8, 234, https://doi.org/10.3390/atmos8120234, 2017.
Eleftheriadis, K., Ochsenkuhn, K. M., Lymperopoulou, T., Karanasiou, A., Razos, P., and Ochsenkuhn-Petropoulou, M.: Influence of local and regional sources on the observed spatial and temporal variability of size resolved atmospheric aerosol mass concentrations and water-soluble species in the Athens metropolitan area, Atmos. Environ., 97, 252–261, https://doi.org/10.1016/j.atmosenv.2014.08.013, 2014.
Eleftheriadis, K., Gini, M. I., Diapouli, Vratolis, S., Vasilatou, V., Fetfatzis, P., and Manousakkas, I. M.: Aerosol microphysics and chemistry reveal the COVID19 lockdown impact on urban air quality, Sci. Rep., 11, 14477, https://doi.org/10.1038/s41598-021-93650-6, 2021.
Enroth, J., Mikkilä, J., Németh, Z., Kulmala, M., and Salma, I.: Wintertime hygroscopicity and volatility of ambient urban aerosol particles, Atmos. Chem. Phys., 18, 4533–4548, https://doi.org/10.5194/acp-18-4533-2018, 2018.
Fors, E. O., Swietlicki, E., Svenningsson, B., Kristensson, A., Frank, G. P., and Sporre, M.: Hygroscopic properties of the ambient aerosol in southern Sweden – a two year study, Atmos. Chem. Phys., 11, 8343–8361, https://doi.org/10.5194/acp-11-8343-2011, 2011.
Gunthe, S. S., King, S. M., Rose, D., Chen, Q., Roldin, P., Farmer, D. K., Jimenez, J. L., Artaxo, P., Andreae, M. O., Martin, S. T., and Pöschl, U.: Cloud condensation nuclei in pristine tropical rainforest air of Amazonia: size-resolved measurements and modeling of atmospheric aerosol composition and CCN activity, Atmos. Chem. Phys., 9, 7551–7575, https://doi.org/10.5194/acp-9-7551-2009, 2009.
Gysel, M., Weingartner, E., and Baltensperger, U.: Hygroscopicity of aerosol particles at low temperatures, 2. Theoretical and experimental hygroscopic properties of laboratory generated aerosols, Environ. Sci. Technol., 1, 63–68, https://doi.org/10.1021/es010055g, 2002.
Gysel, M., Crosier, J., Topping, D. O., Whitehead, J. D., Bower, K. N., Cubison, M. J., Williams, P. I., Flynn, M. J., McFiggans, G. B., and Coe, H.: Closure study between chemical composition and hygroscopic growth of aerosol particles during TORCH2, Atmos. Chem. Phys., 7, 6131–6144, https://doi.org/10.5194/acp-7-6131-2007, 2007.
Gysel, M., McFiggans, G. B., and Coe, H.: Inversion of tandem differential mobility analyser (TDMA) measurements, J. Aerosol Sci., 40, 134–151, https://doi.org/10.1016/j.jaerosci.2008.07.013, 2009.
Haywood, J. and Boucher, O.: Estimates of the direct and indirect radiative forcing due to tropospheric aerosols: A review, Rev. Geophys., 38, 513–543, https://doi.org/10.1029/1999RG000078, 2000.
Hegg, D. A., Covert, D. S., Jonsson, H., and Covert, P. A.: An Instrument for Measuring Size-Resolved Aerosol Hygroscopicity at both Sub- and Super-MicronSizes, Aerosol Sci. Technol., 41, 873–883, https://doi.org/10.1080/02786820701506955, 2007.
Hussein, T., Hämeri, K., Aalto, P., Paatero, P., and Kulmala, M.: Modal structure and spatial–temporal variations of urban and suburban aerosols in Helsinki – Finland, Atmos. Environ., 39, 1655–1668, https://doi.org/10.1016/j.atmosenv.2004.11.031, 2005.
Hussein, T., Mølgaard, B., Hannuniemi, H., Martikainen, J., Järvi, L., Wegner, T., Ripamonti, G., Weber, S., Vesala, T., and Hämeri, K.: Fingerprints of the urban particle number size distribution in helsinki, Finland: local versus regional characteristics, Boreal Environ. Res., 19, 1–20, 2014.
Holmgren, H., Sellegri, K., Hervo, M., Rose, C., Freney, E., Villani, P., and Laj, P.: Hygroscopic properties and mixing state of aerosol measured at the high-altitude site Puy de Dôme (1465 m a.s.l.), France, Atmos. Chem. Phys., 14, 9537–9554, https://doi.org/10.5194/acp-14-9537-2014, 2014.
IPCC: Climate Change 2013: The Physical Science Basis, Contribution oWorking Group I to the Fifth Assessment Report of the Intergovernmental Panel on Climate Change, Cambridge University Press, Cambridge, UK and Neew York, NY, USA, ISBN 978-92-9169-138-8, 2013.
Jurányi, Z., Tritscher, T., Gysel, M., Laborde, M., Gomes, L., Roberts, G., Baltensperger, U., and Weingartner, E.: Hygroscopic mixing state of urban aerosol derived from size-resolved cloud condensation nuclei measurements during the MEGAPOLI campaign in Paris, Atmos. Chem. Phys., 13, 6431–6446, https://doi.org/10.5194/acp-13-6431-2013, 2013.
Kalivitis, N., Kerminen, V.-M., Kouvarakis, G., Stavroulas, I., Bougiatioti, A., Nenes, A., Manninen, H. E., Petäjä, T., Kulmala, M., and Mihalopoulos, N.: Atmospheric new particle formation as a source of CCN in the eastern Mediterranean marine boundary layer, Atmos. Chem. Phys., 15, 9203–9215, https://doi.org/10.5194/acp-15-9203-2015, 2015.
Kalogridis, A. C., Vratolis, S., Liakakou, E., Gerasopoulos, E., Mihalopoulos, N., and Eleftheriadis, K.: Assessment of wood burning versus fossil fuel contribution to wintertime black carbon and carbon monoxide concentrations in Athens, Greece, Atmos. Chem. Phys., 18, 10219–10236, https://doi.org/10.5194/acp-18-10219-2018, 2018.
Kammermann, L., Gysel, M., Weingartner, E., and Baltensperger, U.: 13-month climatology of the aerosol hygroscopicity at the free tropospheric site Jungfraujoch (3580 m a.s.l.), Atmos. Chem. Phys., 10, 10717–10732, https://doi.org/10.5194/acp-10-10717-2010, 2010.
Kanakidou, M., Seinfeld, J. H., Pandis, S. N., Barnes, I., Dentener, F. J., Facchini, M. C., Van Dingenen, R., Ervens, B., Nenes, A., Nielsen, C. J., Swietlicki, E., Putaud, J. P., Balkanski, Y., Fuzzi, S., Horth, J., Moortgat, G. K., Winterhalter, R., Myhre, C. E. L., Tsigaridis, K., Vignati, E., Stephanou, E. G., and Wilson, J.: Organic aerosol and global climate modelling: a review, Atmos. Chem. Phys., 5, 1053–1123, https://doi.org/10.5194/acp-5-1053-2005, 2005.
Kaufman, Y., Tanré, D., and Boucher, O.: A satellite view of aerosols in the climate system, Nature, 419, 215–223, https://doi.org/10.1038/nature01091, 2002.
Kim, N., Yum, S. S., Park, M., Park, J. S., Shin, H. J., and Ahn, J. Y.: Hygroscopicity of urban aerosols and its link to size-resolved chemical composition during spring and summer in Seoul, Korea, Atmos. Chem. Phys., 20, 11245–11262, https://doi.org/10.5194/acp-20-11245-2020, 2020.
Koehler, K. A., Kreidenweis, S. M., DeMott, P. J., Prenni, A. J., Carrico, C. M., Ervens, B., and Feingold, G.: Water activity and activation diameters from hygroscopicity data – Part II: Application to organic species, Atmos. Chem. Phys., 6, 795–809, https://doi.org/10.5194/acp-6-795-2006, 2006.
Köhler, H.: The nucleous in the growth of hygroscopic droplets, Trans. Faraday Soc., 32, 1152–1161, 1936.
Kostenidou, E., Florou, K., Kaltsonoudis, C., Tsiflikiotou, M., Vratolis, S., Eleftheriadis, K., and Pandis, S. N.: Sources and chemical characterization of organic aerosol during the summer in the eastern Mediterranean, Atmos. Chem. Phys., 15, 11355–11371, https://doi.org/10.5194/acp-15-11355-2015, 2015.
Kotchenruther, R. A. and Hobbs, P. V.: Humidification factors of aerosols from biomass burning in Brazil, J. Geophys. Res.-Atmos., 103, 32081–32089, 1998.
Li, Z., W. K.-M. Lau, W. K.-M., Ramanathan, V., Wu, G., Ding, Y., Manoj, M. G., Liu, J., Qian, Y., Li, J., Zhou, T., Fan, J., Rosenfeld, D., Ming, Y., Wang, Y., Huang, J., Wang, B., Xu, X., Lee, S. S., Cribb, M., Zhang, F., Yang, X., Zhao, C., Takemura, T., Wang, K., Xia, X., Yin, Y., Zhang, H., Guo, J., Zhai, P. M., Sugimoto, N., Babu, S. S., and Brasseur, G. P.: Aerosol and monsoon climate interactions over Asia, Rev. Geophys., 54, 866–929, https://doi.org/10.1002/2015RG000500, 2016.
Massling, A., Leinert, S., Wiedensohler, A., and Covert, D.: Hygroscopic growth of sub-micrometer and one-micrometer aerosol particles measured during ACE-Asia, Atmos. Chem. Phys., 7, 3249–3259, https://doi.org/10.5194/acp-7-3249-2007, 2007.
McFiggans, G., Artaxo, P., Baltensperger, U., Coe, H., Facchini, M. C., Feingold, G., Fuzzi, S., Gysel, M., Laaksonen, A., Lohmann, U., Mentel, T. F., Murphy, D. M., O'Dowd, C. D., Snider, J. R., and Weingartner, E.: The effect of physical and chemical aerosol properties on warm cloud droplet activation, Atmos. Chem. Phys., 6, 2593–2649, https://doi.org/10.5194/acp-6-2593-2006, 2006.
Mendes, L., Gini, M. I., Biskos, G., Colbeck, I., and Eleftheriadis, K.: Airborne ultrafine particles in a naturally ventilated metro station: Dominant sources and mixing state determined by particle size distribution and volatility measurements, Environ. Pollut., 239, 82–94, https://doi.org/10.1016/j.envpol.2018.03.067, 2018.
Motos, G., Schmale, J., Corbin, J. C., Zanatta, M., Baltensperger, U., and Gysel-Beer, M.: Droplet activation behaviour of atmospheric black carbon particles in fog as a function of their size and mixing state, Atmos. Chem. Phys., 19, 2183–2207, https://doi.org/10.5194/acp-19-2183-2019, 2019.
Paramonov, M., Kerminen, V.-M., Gysel, M., Aalto, P. P., Andreae, M. O., Asmi, E., Baltensperger, U., Bougiatioti, A., Brus, D., Frank, G. P., Good, N., Gunthe, S. S., Hao, L., Irwin, M., Jaatinen, A., Jurányi, Z., King, S. M., Kortelainen, A., Kristensson, A., Lihavainen, H., Kulmala, M., Lohmann, U., Martin, S. T., McFiggans, G., Mihalopoulos, N., Nenes, A., O'Dowd, C. D., Ovadnevaite, J., Petäjä, T., Pöschl, U., Roberts, G. C., Rose, D., Svenningsson, B., Swietlicki, E., Weingartner, E., Whitehead, J., Wiedensohler, A., Wittbom, C., and Sierau, B.: A synthesis of cloud condensation nuclei counter (CCNC) measurements within the EUCAARI network, Atmos. Chem. Phys., 15, 12211–12229, https://doi.org/10.5194/acp-15-12211-2015, 2015.
Petäjä, T., Kerminen, V.-M., Dal Maso, M., Junninen, H., Koponen, I. K., Hussein, T., Aalto, P. P., Andronopoulos, S., Robin, D., Hämeri, K., Bartzis, J. G., and Kulmala, M.: Sub-micron atmospheric aerosols in the surroundings of Marseille and Athens: physical characterization and new particle formation, Atmos. Chem. Phys., 7, 2705–2720, https://doi.org/10.5194/acp-7-2705-2007, 2007.
Petters, M. D. and Kreidenweis, S. M.: A single parameter representation of hygroscopic growth and cloud condensation nucleus activity, Atmos. Chem. Phys., 7, 1961–1971, https://doi.org/10.5194/acp-7-1961-2007, 2007.
Psichoudaki, M., Nenes, A., Florou, K., Kaltsonoudis, C., and Pandis, N. S.: Hygroscopic properties of atmospheric particles emitted during wintertime biomass burning episodes in Athens, Atmos. Environ., 178, 66–72, https://doi.org/10.1016/j.atmosenv.2018.01.004, 2018.
Rose, C., Collaud Coen, M., Andrews, E., Lin, Y., Bossert, I., Lund Myhre, C., Tuch, T., Wiedensohler, A., Fiebig, M., Aalto, P., Alastuey, A., Alonso-Blanco, E., Andrade, M., Artíñano, B., Arsov, T., Baltensperger, U., Bastian, S., Bath, O., Beukes, J. P., Brem, B. T., Bukowiecki, N., Casquero-Vera, J. A., Conil, S., Eleftheriadis, K., Favez, O., Flentje, H., Gini, M. I., Gómez-Moreno, F. J., Gysel-Beer, M., Hallar, A. G., Kalapov, I., Kalivitis, N., Kasper-Giebl, A., Keywood, M., Kim, J. E., Kim, S.-W., Kristensson, A., Kulmala, M., Lihavainen, H., Lin, N.-H., Lyamani, H., Marinoni, A., Martins Dos Santos, S., Mayol-Bracero, O. L., Meinhardt, F., Merkel, M., Metzger, J.-M., Mihalopoulos, N., Ondracek, J., Pandolfi, M., Pérez, N., Petäjä, T., Petit, J.-E., Picard, D., Pichon, J.-M., Pont, V., Putaud, J.-P., Reisen, F., Sellegri, K., Sharma, S., Schauer, G., Sheridan, P., Sherman, J. P., Schwerin, A., Sohmer, R., Sorribas, M., Sun, J., Tulet, P., Vakkari, V., van Zyl, P. G., Velarde, F., Villani, P., Vratolis, S., Wagner, Z., Wang, S.-H., Weinhold, K., Weller, R., Yela, M., Zdimal, V., and Laj, P.: Seasonality of the particle number concentration and size distribution: a global analysis retrieved from the network of Global Atmosphere Watch (GAW) near-surface observatories, Atmos. Chem. Phys., 21, 17185–17223, https://doi.org/10.5194/acp-21-17185-2021, 2021.
Riemer, N., Ault, A. P., West, M., Craig, R. L., and Curtis, J. H.: Aerosol mixing state: Measurements, modeling, and impacts, Rev. Geophys., 57, 187–249, https://doi.org/10.1029/2018RG000615, 2019.
Rosenfeld, D., Andreae, M. O., Asmi, A., Chin, M., Leeuw, G., Donovan, D. P., Kahn, R., Kinne, S., Kivekäs, N., Kulmala, M., Lau, W., Schmidt, K. S., Suni, T., Wagner, T., Wild, M., and Quaas, J.: Global observations of aerosol-cloud-precipitation-climate interactions, Rev. Geophys., 52, 750–808, https://doi.org/10.1002/2013RG000441, 2014.
Schmale, J., Henning, S., Henzing, B., and Gysel, M.: Collocated observations of cloud condensation nuclei, particle size distributions, and chemical composition, Sci. Data, 4, 170003, https://doi.org/10.1038/sdata.2017.3, 2017.
Schmale, J., Henning, S., Decesari, S., Henzing, B., Keskinen, H., Sellegri, K., Ovadnevaite, J., Pöhlker, M. L., Brito, J., Bougiatioti, A., Kristensson, A., Kalivitis, N., Stavroulas, I., Carbone, S., Jefferson, A., Park, M., Schlag, P., Iwamoto, Y., Aalto, P., Äijälä, M., Bukowiecki, N., Ehn, M., Frank, G., Fröhlich, R., Frumau, A., Herrmann, E., Herrmann, H., Holzinger, R., Kos, G., Kulmala, M., Mihalopoulos, N., Nenes, A., O'Dowd, C., Petäjä, T., Picard, D., Pöhlker, C., Pöschl, U., Poulain, L., Prévôt, A. S. H., Swietlicki, E., Andreae, M. O., Artaxo, P., Wiedensohler, A., Ogren, J., Matsuki, A., Yum, S. S., Stratmann, F., Baltensperger, U., and Gysel, M.: Long-term cloud condensation nuclei number concentration, particle number size distribution and chemical composition measurements at regionally representative observatories, Atmos. Chem. Phys., 18, 2853–2881, https://doi.org/10.5194/acp-18-2853-2018, 2018.
Sjogren, S., Gysel, M., Weingartner, E., Alfarra, M. R., Duplissy, J., Cozic, J., Crosier, J., Coe, H., and Baltensperger, U.: Hygroscopicity of the submicrometer aerosol at the high-alpine site Jungfraujoch, 3580 m a.s.l., Switzerland, Atmos. Chem. Phys., 8, 5715–5729, https://doi.org/10.5194/acp-8-5715-2008, 2008.
Stolzenburg, M., McMurry, P., Sakurai, H., Smith, J., Mauldin, R., Eisele, F., and Clement, C.: Growth rates of freshly nucleated atmospheric particles in Atlanta, J. Geophys. Res., 110, D22S05, https://doi.org/10.1029/2005JD005935, 2005.
Swietlicki, E., Hansson, H.-C., Hameri, K., Svenningsson, B., Massling, A., McFiggans, G., McMurry, P. H., Petäjä, T., Tunved, P., Gysel, M., Topping, D., Weingartner, E., Baltensperger, U., Rissler, J., Wiedensohler, A., and Kulmala, M.: Hygroscopic properties of submicrometer atmospheric aerosol particles measured with H-TDMA instruments in various environments – a review, Tellus B, 60, 432–469, https://doi.org/10.1111/j.1600-0889.2008.00350.x, 2008.
Tritscher, T., Dommen, J., DeCarlo, P. F., Gysel, M., Barmet, P. B., Praplan, A. P., Weingartner, E., Prévôt, A. S. H., Riipinen, I., Donahue, N. M., and Baltensperger, U.: Volatility and hygroscopicity of aging secondary organic aerosol in a smog chamber, Atmos. Chem. Phys., 11, 11477–11496, https://doi.org/10.5194/acp-11-11477-2011, 2011.
Tsiflikiotou, M. A., Kostenidou, E., Papanastasiou, D. K., Patoulias, D., Zarmpas, P., Paraskevopoulou, D., Diapouli, E., Kaltsonoudis, C., Florou, K., Bougiatioti, A., Stavroulas, I., Theodosi, C., Kouvarakis, G., Vasilatou, V., Siakavaras, D., Biskos, G., Pilinis, C., Eleftheriadis, K., Gerasopoulos, E., Mihalopoulos, N., and Pandis, S. N.: Summertime particulate matter and its composition in Greece, Atmos. Environ., 213, 597–607, https://doi.org/10.1016/j.atmosenv.2019.06.013, 2019.
Vlasenko, S., Sjögren, E., Weingartner, H., Gäggeler, H. W., and Ammann, M.: Generation of Submicron Arizona Test Dust Aerosol: Chemical and Hygroscopic Properties, Aerosol Sci. Technol., 39, 452–460, https://doi.org/10.1080/027868290959870, 2005.
Vratolis, S., Gini, M. I., Bezentakos, S., Stavroulas, I., Kalivitis, N., Kostenidou, E., Louvaris, E., Siakavaras, D., Biskos, G., Mihalopoulos, N., Pandis, S. N., Pilinis, C., Papayannis, A., and Eleftheriadis, K.: Particle number size distribution statistics at city-centre, urban background, and remote stations in Greece during summer, Atmos. Environ., 213, 711–726, 2019.
Vu, T. V., Shi, Z., and Harrison, R. M.: Estimation of hygroscopic growth properties of source-related sub-micrometre particle types in a mixed urban aerosol, Clim. Atmos. Sci., 4, 21, https://doi.org/10.1038/s41612-021-00175-w, 2021.
Wang, X., Shen, X. J., Sun, J. Y., Zhang, X. Y., Wang, Y. Q., Zhang, Y. M., Wang, P., Xia, C., Qi, X. F., and Zhong, J. T.: Size-resolved hygroscopic behavior of atmospheric aerosols during heavy aerosol pollution episodes in Beijing in December 2016, Atmos. Environ., 194, 188–197, https://doi.org/10.1016/j.atmosenv.2018.09.041, 2018.
Wiedensohler, A., Birmili, W., Nowak, A., Sonntag, A., Weinhold, K., Merkel, M., Wehner, B., Tuch, T., Pfeifer, S., Fiebig, M., Fjäraa, A. M., Asmi, E., Sellegri, K., Depuy, R., Venzac, H., Villani, P., Laj, P., Aalto, P., Ogren, J. A., Swietlicki, E., Williams, P., Roldin, P., Quincey, P., Hüglin, C., Fierz-Schmidhauser, R., Gysel, M., Weingartner, E., Riccobono, F., Santos, S., Grüning, C., Faloon, K., Beddows, D., Harrison, R., Monahan, C., Jennings, S. G., O'Dowd, C. D., Marinoni, A., Horn, H.-G., Keck, L., Jiang, J., Scheckman, J., McMurry, P. H., Deng, Z., Zhao, C. S., Moerman, M., Henzing, B., de Leeuw, G., Löschau, G., and Bastian, S.: Mobility particle size spectrometers: harmonization of technical standards and data structure to facilitate high quality long-term observations of atmospheric particle number size distributions, Atmos. Meas. Tech., 5, 657–685, https://doi.org/10.5194/amt-5-657-2012, 2012.
Xu, W., Sun, Y., Wang, Q., Zhao, J., Wang, J., Ge, X., Xie, C., Zhou, W., Du, W., Li, J., Fu, P., Wang, Z., Worsnop, R. D., and Coe, H.: Changes in aerosol chemistry from 2014 to 2016 in winter in Beijing: Insights from high-resolution aerosol mass spectrometry, J. Geophys. Res.-Atmos., 124, 1132–1147, https://doi.org/10.1029/2018JD029245, 2019.
Zhang, Q., Jimenez, J. L., Canagaratna, M. R., Ulbrich, I. M., Ng, N. L., Worsnop, D. R., and Sun, Y.: Understanding atmospheric organic aerosols via factor analysis of aerosol mass spectrometry: a review, Anal. Bioanal. Chem., 401, 3045–3067, https://doi.org/10.1007/s00216-011-5355-y, 2011.
Zografou, O., Gini, M., Manousakas, M. I., Chen, G., Kalogridis, A. C., Diapouli, E., Pappa, A., and Eleftheriadis, K.: Combined organic and inorganic source apportionment on yearlong ToF-ACSM dataset at a suburban station in Athens, Atmos. Meas. Tech., 15, 4675–4692, https://doi.org/10.5194/amt-15-4675-2022, 2022.