the Creative Commons Attribution 4.0 License.
the Creative Commons Attribution 4.0 License.
 | 03 Jan 2023
Composited analyses of the chemical and physical characteristics of co-polluted days by ozone and PM2.5 over 2013–2020 in the Beijing–Tianjin–Hebei region
Huibin Dai
Hong Liao
Yang Yang
Jianbing Jin
Baojie Li
Xingwen Jiang
The co-polluted days by ozone (O3) and PM2.5 (particulate matter with an aerodynamic equivalent diameter of 2.5 µm or less) (O3–PM2.5PDs) were frequently observed in the Beijing–Tianjin–Hebei (BTH) region in warm seasons (April–October) of 2013–2020. We applied the 3-D global chemical transport model (GEOS-Chem) to investigate the chemical and physical characteristics of O3–PM2.5PDs by composited analyses of such days that were captured by both the observations and the model. Model results showed that, when O3–PM2.5PDs occurred, the concentrations of hydroxyl radical and total oxidant, sulfur oxidation ratio, and nitrogen oxidation ratio were all high, and the concentrations of sulfate at the surface were the highest among all pollution types. We also found unique features in vertical distributions of aerosols during O3–PM2.5PDs; concentrations of PM2.5 decreased with altitude near the surface but remained stable at 975–819 hPa. Process analyses showed that secondary aerosols (nitrate, ammonium, and sulfate) had strong chemical productions at 913–819 hPa, which were then transported downward, resulting in the quite uniform vertical profiles at 975–819 hPa on O3–PM2.5PDs. The weather patterns for O3–PM2.5PDs were characterized by anomalous high-pressure system at 500 hPa as well as strong southerlies and high RH at 850 hPa. The latter resulted in the strong chemical productions around 850 hPa on O3–PM2.5PDs. The physical and chemical characteristics of O3–PM2.5PDs are quite different from those of polluted days by either O3 alone or PM2.5 alone and have important implications for air quality management.
- Article
(6482 KB) - Full-text XML
-
Supplement
(7300 KB) - BibTeX
- EndNote


Surface ozone (O3) and PM2.5 (particulate matter with an aerodynamic equivalent diameter of 2.5 µm or less) are important air pollutants in the atmosphere that have harmful effects on public health (Gao and Ji, 2018; Jiang et al., 2019), ecosystems (Ren et al., 2011; Yue et al., 2017), and crops (Wang et al., 2005, 2007). Surface O3 is a secondary pollutant produced by photochemical oxidation of volatile organic compounds (VOCs) and nitrogen oxides (NOx ≡ NO + NO2) in the presence of intense ultraviolet light, and the major PM2.5 components (nitrate, ; ammonium, ; sulfate, ; black carbon, BC; and organic carbon, OC) are mainly caused by anthropogenic emissions of aerosols and aerosol precursors. Although surface O3 and PM2.5 have different formation mechanisms, they are coupled through the common precursors (NOx and VOCs) and photochemical reactions (Chu et al., 2020). Since 2013, stringent clean air actions have been implemented to improve air quality in China (Chinese State Council, 2013, 2018). However, O3 concentrations increased unexpectedly, while PM2.5 concentrations decreased drastically in the past years (M. Li et al., 2019). The co-polluted days by O3 and PM2.5 (concentrations of both O3 and PM2.5 exceed the national air quality standards on the same day, hereafter referred to as O3–PM2.5PDs) were also reported (Dai et al., 2021). Therefore, it is fundamental to examine the chemical and physical characteristics of O3–PM2.5PDs.
The Beijing–Tianjin–Hebei (BTH) region is the most populated region in northern China. In the past few years, concentrations of O3 and PM2.5 in BTH were among the highest in China. The observations from China National Environmental Monitoring Center (CNEMC) showed that the mean and maximum MDA8 (daily maximum 8 h average) O3 in North China in summer of 2019 were 83 and 129 ppb, respectively, and the summer mean MDA8 O3 increased with a trend of 3.3 ppb a−1 over 2013–2019 (Li et al., 2020). Gong et al. (2020) reported that O3-polluted days (i.e., MDA8 O3 concentration exceeds 80 ppb) in May–July in BTH increased from 35 d in the year 2014 to 56 d in 2018. As for observed PM2.5, the concentration averaged over BTH had a decreasing trend of 10 µg m−3 yr−1 over 2013–2019, and the mean value was 79 ± 17 µg m−3 over these years (Li et al., 2020). BTH also had the highest frequency and intensity of severe-haze-pollution days (i.e., days with daily mean PM2.5 concentration exceeding 150 µg m−3) in China from 2013 to 2017, with an observed mean frequency of 21.2 d yr−1 and an observed mean intensity of 231.6 µg m−3 (Dang and Liao, 2019).
The interactions between O3 and PM2.5 have been reported in previous studies. Zhu et al. (2019) examined the spatiotemporal characteristics of the correlations between observed O3 and PM2.5 at 1497 sites in China for 2016 and found that O3–PM2.5 had the highest positive correlations (correlation coefficients > +0.7) in July in southern China and the largest negative correlations (r values < −0.5) during January in northern China. K. Li et al. (2019) used the GEOS-Chem model to analyze the O3–PM2.5 relationship in northern China and found that O3 production was suppressed under high-PM2.5 conditions (PM2.5 concentrations > 60 µg m−3) because of the reactive uptake of hydrogen oxide radicals (HOx) by aerosol particles. Chu et al. (2020) analyzed the observed daily PM2.5 and O3 concentrations in 114 cities in China during the years of 2013–2018 and found that the correlations between O3 and PM2.5 tended to change from negative in 2013 to positive in 2018 in China as air quality improved.
Few previous studies have examined the co-occurrence of O3 and PM2.5 pollution (MDA8 O3 > 80 ppb and PM2.5 > 75 µg m−3). Zong et al. (2021) used the obliquely rotated principal component analysis in the T-mode (T-PCA) method to identify the synoptic weather pattern associated with O3–PM2.5PDs in eastern China during summer of 2015–2018 and found that O3–PM2.5PDs were associated with a stable western Pacific subtropical high ridge, which brought warm and moist airflow from the East China Sea to eastern China to promote hygroscopic growth of fine particulate matter in BTH and the northern Yangtze River Delta (YRD). Dai et al. (2021) analyzed O3–PM2.5PDs in the YRD for April–October of 2013–2019 by using observations and reported that the co-polluted days occurred mainly in April (29.6 % of co-polluted days occurred in April), May (23.0 %), June (19.5 %), and October (10.8 %) under meteorological conditions of higher relative humidity, higher surface air temperature, and lower wind speed relative to the days with O3 pollution alone. Qin et al. (2021) investigated O3–PM2.5PDs by using the hourly observed concentrations of water-soluble ions, OC, and elemental carbon (EC) in 2019 in cities of Nanjing and Changzhou. They found that inorganic aerosols mainly existed as NH4NO3, and the correlation coefficients between the secondary components , , and were relatively high during O3–PM2.5PDs in 2019, indicating a significant formation of secondary inorganic aerosols. Although these studies have discussed the meteorological conditions and some chemical characteristics of O3–PM2.5PDs, the understanding of O3–PM2.5PDs was quite limited because of the limited observations of chemical species involved.
In this work, we take advantage of the comprehensive chemical mechanism of the global chemical transport model to have better understanding of O3–PM2.5PDs. We apply the 3-D global chemical transport model (GEOS-Chem) to simulate O3–PM2.5PDs in BTH in the years of 2013–2020 and investigate the chemical and physical characteristics of O3–PM2.5PDs by composited analyses of such days that are captured by both the observations and the model. The objectives of this study are (1) to examine the underlying chemical mechanisms for O3–PM2.5PDs in BTH for warm seasons (April–October) of 2013–2020 by comparing O3–PM2.5PDs with polluted days by O3 alone or by PM2.5 alone and (2) to identify the weather patterns that are associated with O3–PM2.5PDs in BTH. The observations, the reanalyzed meteorological data, the GEOS-Chem model, and the process analysis are described in Sect. 2. The observed O3–PM2.5PDs are presented in Sect. 3.1. The evaluation of simulated concentrations of O3 and PM2.5 as well as the simulated pollution days by O3 and/or PM2.5 are shown in Sect. 3.2. The underlying mechanisms of O3–PM2.5PDs are shown in Sect. 3.3. In Sect. 3.4, the meteorological conditions for the co-occurrence of O3 and PM2.5 pollution are investigated. The conclusions are presented in Sect. 4.
2.1 Observed O3 and PM2.5 concentrations
Hourly concentrations of PM2.5 and O3 in China over the years of 2013–2020 were taken from the public website of CNEMC (https://air.cnemc.cn:18007/, last access: 17 November 2022). To ensure data quality, the daily mean PM2.5 concentration was calculated when there were valid data for more than 20 h during that day, and the MDA8 O3 concentration was calculated when there were valid data for at least 6 h for each 8 h. For the calculation of monthly and annual mean concentrations, the number of days with valid concentrations had to be more than 15 in each month. The spatial distribution of the 79 valid sites within BTH (37–41∘ N, 114–118∘ E; the black rectangle) is shown in Fig. 1. For model evaluation, the observed concentrations were averaged over sites within each of the 0.5∘ latitude × 0.625∘ longitude Modern-Era Retrospective analysis for Research and Applications (MERRA-2) grid cells. There are 18 model grids in BTH. Note that the observed O3 concentrations from this network have a unit of micrograms per cubic meter. For the consistency of observed and simulated O3 concentrations, 1 µg m−3 of O3 is approximately 0.5 ppb under the conditions of 298 K and 1013 hPa. The observed O3 concentrations reported by the CNEMC were under standard conditions of 273 K and 1013 hPa before 31 August 2018 and were under standard conditions of 298 K and 1013 hPa afterwards (http://www.mee.gov.cn/xxgk2018/xxgk/xxgk01/201808/t20180815_629602.html, last access: 17 November 2022), which were accounted for as O3 concentrations were converted to parts per billion.
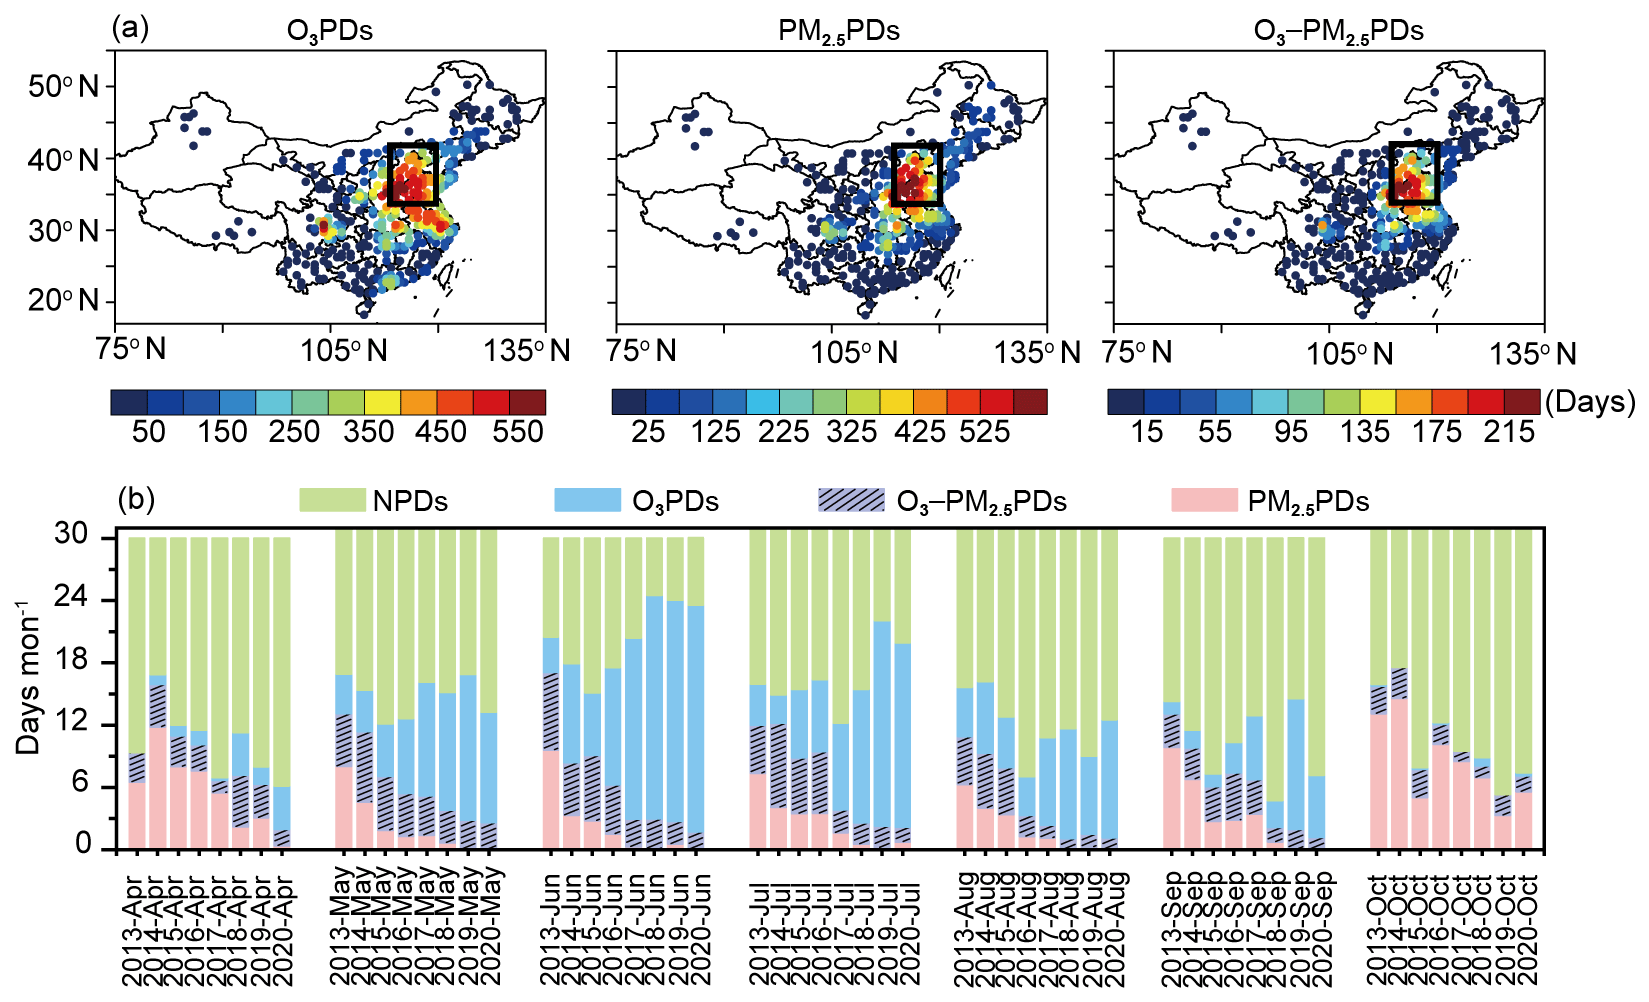
Figure 1(a) Spatial distributions of observed numbers of O3PDs, PM2.5PDs, and O3–PM2.5PDs summed over April–October of 2013–2020. The solid black rectangle indicates the BTH region. (b) The observed numbers of NPDs (non-polluted days, green), O3PDs (blue and purple with slashes), O3–PM2.5PDs (purple with slashes), and PM2.5PDs (pink and purple with slashes) averaged over all sites in BTH from April to October in 2013 to 2020.
According to the National Ambient Air Quality Standard of China (GB3095-2012), O3 (PM2.5) concentration exceeds the national air quality standard if the MDA8 O3 (daily mean PM2.5) concentration is higher than 160 µg m−3 (75 µg m−3). In this study, we define O3 polluted days (hereafter called “O3PDs”) for days with MDA8 O3 concentration > 160 µg m−3, PM2.5 polluted days (hereafter called “PM2.5PDs”) as days with daily mean PM2.5 concentration > 75 µg m−3, and the co-pollution days by O3 and PM2.5 (O3–PM2.5PDs) as days with daily MDA8 O3 concentration > 160 µg m−3 as well as a daily mean PM2.5 concentration > 75 µg m−3.
2.2 Reanalyzed meteorological fields
Meteorological fields were obtained from MERRA-2, which were generated by the NASA Global Modeling and Assimilation Office (GMAO). The MERRA-2 data have a horizontal resolution of 0.5∘ latitude × 0.625∘ longitude and 72 vertical layers (Molod et al., 2015). To analyze the meteorological conditions for O3–PM2.5PDs, vertical pressure velocity (OMEGA), planetary boundary layer height (PBLH), temperature (T), relative humidity (RH), and surface incoming shortwave flux (SWGDN) are used. Note that the temporal resolution for PBLH, T, and SWGDN is 1 h, and that for OMEGA and RH is 3 h. Daily mean geopotential heights at 850 and 500 hPa from the National Center for Environmental Prediction (NCEP) and National Center for Atmospheric Research (NCAR) global reanalysis with a resolution of 2.5∘ latitude by 2.5∘ longitude are also utilized in this study.
2.3 Observed aerosol optical depth
We obtained the version 3 datasets of observed daily aerosol optical depth (AOD) of level 2 (improved cloud screening and quality-assured) from the Aerosol Robotic Network (AERONET; https://aeronet.gsfc.nasa.gov/new_web/index.html, last access: 17 November 2022) established by NASA and LOA-PHOTONS (Giles et al., 2019). Three sites in the BTH region have observations available over 2013–2020, including Beijing (39.97∘ N, 116.38∘ E), Beijing-CAMS (39.93∘ N, 116.31∘ E), and Xianghe (39.75∘ N, 116.96∘ E). The AOD values at 440 and 675 nm at these three sites are analyzed in this study.
2.4 GEOS-Chem model
We simulated O3 and PM2.5 using the nested version of the 3-D global chemical transport model (GEOS-Chem, version 11-01) driven by the MERRA-2 meteorological data. The nested domain was set over Asia (11∘ S–55∘ N, 60–150∘ E) with a horizontal resolution of 0.5∘ latitude × 0.625∘ longitude, and the chemical boundary conditions were provided by the global GEOS-Chem simulation with 2.5∘ latitude × 2.5∘ longitude horizontal resolution.
The GEOS-Chem model includes fully coupled O3–NOx–hydrocarbon and an aerosol chemistry mechanism (Bey et al., 2001; Pye et al., 2009) to simulate aerosols including (Park et al., 2004), (Pye et al., 2009), , BC and OC (Park et al., 2003), mineral dust (Fairlie et al., 2007), and sea salt (Alexander et al., 2005) as well as the gas-phase pollutants such as NOx and O3. Over the Asian domain, the anthropogenic emissions of OC, BC, carbon monoxide (CO), sulfur dioxide (SO2), NOx, ammonia (NH3), and VOCs were obtained from the Multi-resolution Emission Inventory for China (MEIC), which includes emissions from the industry, power, residential, and transportation sectors for the years of 2014–2017 (Li et al., 2017; Zheng et al., 2018), 2019, and 2020 (Zheng et al., 2021). Emissions in 2018 were obtained by the interpolation of those in 2017 and 2019 for each grid due to the lack of publicly accessible emission inventories for that year. The biogenic emissions in GEOS-Chem are simulated using MEGAN v2.1 (Guenther et al., 2012).
The hourly O3 and PM2.5 concentrations for the years of 2013–2020 were simulated by the GEOS-Chem model and were driven by MERRA-2 meteorological fields. The model was spun up for 6 months before the integration over the studied time period.
2.5 Process analysis
Process analysis (PA) was applied to identify the relative importance of atmospheric processes on O3–PM2.5PDs. PA has been widely used in previous studies to examine the key processes contributing to air pollution episodes (Gonçalves et al., 2009; Dang and Liao, 2019; Gong and Liao, 2019) as well as the interannual and decadal variations in air pollutants (Mu and Liao, 2014; Lou et al., 2015). Five major processes that influence O3 and PM2.5 concentrations were diagnosed at every time step, including net chemical production, dry deposition, horizontal advection, vertical advection, and diffusion, for the regional pollution days (days with more than half of the sites in BTH experiencing pollution). We carried out PA for O3SPDs (excluding O3–PM2.5PDs from O3PDs), PM2.5SPDs (excluding O3–PM2.5PDs from PM2.5PDs), and O3–PM2.5PDs over BTH.
3.1 Observed polluted days by O3 and PM2.5
Figure 1a shows the spatial distributions of observed numbers of O3PDs, PM2.5PDs, and O3–PM2.5PDs summed over the warm seasons (April–October) of 2013–2020. The spatial distributions of polluted days in each year are shown in Fig. S1 in the Supplement. The numbers of O3PDs, PM2.5PDs, and O3–PM2.5PDs were high in BTH, which were, respectively, 524.3 344.6, and 128.1 d from observations, as the values were averaged over all sites in BTH. The high numbers of O3PDs, PM2.5PDs, and O3–PM2.5PDs in BTH were associated with the highest anthropogenic emissions (NOx and non-methane volatile organic compounds, NMVOCs) in this region (Dang et al., 2021).
Figure 1b shows the numbers of days averaged over all sites in BTH for non-polluted days (NPDs; MDA8 O3 < 80 ppb and PM2.5 < 75 µg m−3), O3PDs, O3–PM2.5PDs, and PM2.5PDs in each month of warm seasons from 2013 to 2020. O3PDs and O3–PM2.5PDs mainly occurred in May, June, and July, while PM2.5PDs mainly appeared in April and October. The monthly numbers of O3–PM2.5PDs (PM2.5PDs) declined from 2013 to 2020, with the fastest drop in June, from 7.5 (17.1) d in June 2013 to 1.8 (1.8) d in June 2020. In contrast, the numbers of O3PDs kept increasing, especially in June, from 10.9 d in June 2013 to 23.6 d in June 2020. The reductions in O3–PM2.5PDs were associated with the large reductions in PM2.5 since the implementation of the Clean Air Action in 2013.
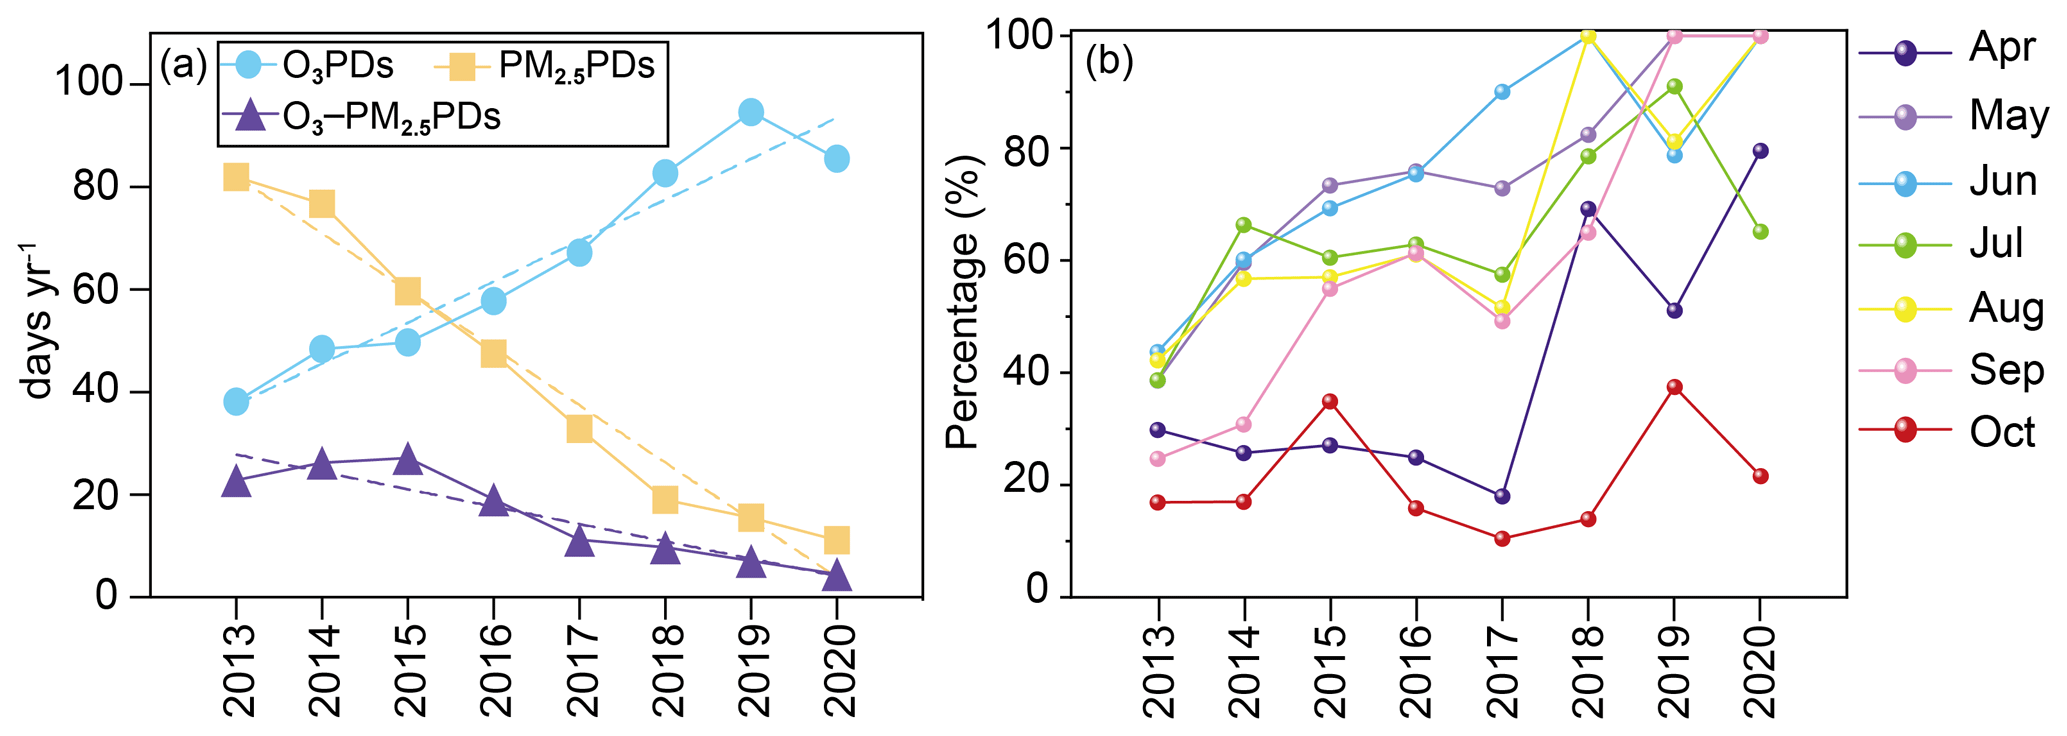
Figure 2(a) The trends of observed O3PDs, PM2.5PDs, and O3–PM2.5PDs in warm seasons from 2013 to 2020 averaged over all sites in BTH. The blue, yellow, and purple solid lines (dashed lines) represent the numbers (liner trend) of O3PDs, PM2.5PDs, and O3–PM2.5PDs, respectively. (b) The percentage of O3–PM2.5PDs on PM2.5PDs for April to October in 2013 to 2020. The polluted days were averaged over all sites in BTH.
Figure 2a shows the linear trends of observed O3PDs, PM2.5PDs, and O3–PM2.5PDs in warm seasons of 2013–2020 averaged over BTH. O3PDs showed an upward trend of 7.9 d yr−1 from 2013 to 2020. However, the numbers of PM2.5PDs and O3–PM2.5PDs decreased over 2013–2020, with linear trends of −11.2 and −3.4 d yr−1, respectively. Figure 2b shows the changes in percentage of O3–PM2.5PDs on PM2.5PDs from 2013 to 2020 for each month. It should be noted that, when PM2.5PDs occurred, the proportions of O3–PM2.5PDs had an upward trend from 2013 to 2020. In May, June, August, and September of 2020, the proportions of O3–PM2.5PDs on PM2.5PDs reached 100 %, indicating that PM2.5 pollution was accompanied by O3 pollution in recent years.
3.2 Simulated polluted days and model evaluation
3.2.1 Simulated surface-layer MDA8 O3 and PM2.5 concentrations
Figure 3a and b show, respectively, the spatial distributions of simulated and observed surface-layer concentrations of MDA8 O3 and PM2.5 in China, as the concentrations are averaged over the warm seasons (April–October) of 2013–2020. The concentrations of MDA8 O3 and PM2.5 were both high in BTH. Averaged over BTH and the studied time period, the observed concentrations of MDA8 O3 and PM2.5 were 58.1 ppb and 60.3 µg m−3, respectively, while the simulated values were 68.0 ppb and 61.1 µg m−3, respectively. Figure 3c and d compare the time series of observed and simulated daily MDA8 O3 and PM2.5 concentrations averaged over BTH. The simulated daily concentrations of MDA8 O3 (PM2.5) in eight warm seasons have a normalized mean bias (NMB) of 7.9 % (10.6 %). The model generally captures the daily variations (peaks and troughs) in the observed MDA8 O3 and PM2.5 concentrations, with R values of 0.80 and 0.72, respectively. It should be noted that mineral dust and sea-salt aerosols were not considered in this study because they are not the major aerosol components in China, and the concentrations are generally low based on previous measurements (Xuan et al., 2000; Ye et al., 2003; Duan et al., 2006; Zhao et al., 2013). However, excluding dust and sea salt may lead to low biases in simulated PM2.5 concentrations.

Figure 3Spatial distributions of simulated (shades) and observed (CNEMC, dots) surface-layer concentrations of (a) MDA8 O3 (ppb) and (b) PM2.5 (µg m−3) averaged over the eight warm seasons (April to October, 2013–2020). The solid black rectangle in (a) and (b) indicates the BTH region. Simulated and observed daily concentrations of surface-layer (c) MDA8 O3 and (d) PM2.5 averaged over BTH. The correlation coefficient (R) and normalized mean bias (NMB) are also shown for (c) and (d). NMB = %, where Oi and Mi are the observed and simulated concentrations, respectively; i refers to the ith day, and N is the total number of days.
Due to the lack of publicly accessible long-term observations of PM2.5 components in China, we compared the simulated SO2 and NO2 (precursors for and ) with observations from CNEMC in Fig. S2. The simulated daily mean concentrations of NO2 (SO2) agree well with the observations from CNEMC, with R of 0.82 (0.78) and NMB of −14.9 % (9.3 %).
3.2.2 Simulated O3PDs, PM2.5PDs, and O3–PM2.5PDs
Figure S3 shows the capability of the model in capturing the polluted days. Although the GEOS-Chem model well reproduces the spatial distributions of observed MDA8 O3 and PM2.5 concentrations, it underestimates the numbers of O3PDs, PM2.5PDs, and O3–PM2.5PDs because of the model's deficiency in capturing the peak concentrations of air pollutants. Such deficiency was also reported in previous studies that used the GEOS-Chem model or the weather Research and Forecasting with Chemistry (WFR-chem) model (Zhang and Wang, 2016; Ni et al., 2018; Gong and Liao, 2019; Dang and Liao, 2019). Therefore, to identify O3PDs, PM2.5PDs, and O3–PM2.5PDs using model results, we utilized lower thresholds by considering the NMBs of simulated MDA8 O3 and PM2.5 concentrations in each of the 18 grids of BTH. Taking the grid of Beijing as an example, simulated MDA8 O3 and PM2.5 had NMBs of −22.0 % and −26.9 %, respectively, as the simulated concentrations were compared with observations for days with observed concentrations higher than the national air quality standards over the warm seasons of 2013–2020. We then adjusted the threshold of O3PDs in this grid to be 62.4 ppb (80 ppb × 78 %) and that of PM2.5PDs to be 54.8 µg m−3 (75 µg m−3 × 73.1 %). These adjusted thresholds were also used to identify O3–PM2.5PDs. Such an approach was also used in previous studies to better capture the pollution events based on the simulations (Dang and Liao, 2019; Gong and Liao, 2019). With the adjusted thresholds, 56 %–93 % of the observed O3PDs, PM2.5PDs, and O3–PM2.5PDs can be captured by the model (Fig. S3e).
3.2.3 Simulated O3SPDs, PM2.5SPDs, and O3–PM2.5PDs
Since O3PDs or PM2.5PDs encompasses O3–PM2.5PDs, we further define O3 single pollution days (hereafter called “O3SPDs”, which exclude O3–PM2.5PDs from O3PDs) and PM2.5 single pollution days (hereafter called “PM2.5SPDs”, which exclude O3–PM2.5PDs from PM2.5PDs) for the purpose of obtaining the characteristics of different polluted days. Figure 4a and b show, respectively, the spatial distributions of numbers of O3SPDs, PM2.5SPDs, and O3–PM2.5PDs from observations and from the GEOS-Chem model using the adjusted thresholds. Considering the total of polluted days in 18 grids in BTH, observed O3SPDs, PM2.5SPDs, and O3–PM2.5PDs were, respectively, 3937, 3698, and 2024 d, in which 75.0 % (2954/3937), 58.1 % (2148/3698), and 79.7 % (1614/2024) were captured by observation and simulation simultaneously (Fig. 4c). In addition, the numbers of observed and captured O3SPDs, PM2.5SPDs, and O3–PM2.5PDs in each month are shown in Fig. S4. The model has a fairly good capability of capturing the observed polluted days in each month.

Figure 4Spatial distributions of (a) observed numbers of O3SPDs, PM2.5SPDs, and O3–PM2.5PDs; (b) numbers of polluted days that were observed and also captured by the GEOS-Chem model with adjusted thresholds; and (c) percentages of observed polluted days that were captured by the model with adjusted thresholds. The values were calculated for the warm months (April to October) of 2013–2020.
3.3 Chemical characteristics of polluted days by O3 and PM2.5
In this section, to investigate the chemical characteristics of O3SPDs, PM2.5SPDs, and O3–PM2.5PDs, we present first the simulated atmospheric oxidants in Sect. 3.3.1 and then show the simulated surface concentrations and vertical profiles of PM2.5 and MDA8 O3 in Sect. 3.3.2 and 3.3.3, respectively, followed by the process analysis in Sect. 3.3.4. The observed AOD values to verify the model results are presented in Sect. 3.3.5.
3.3.1 Atmospheric oxidants of O3SPDs, PM2.5SPDs, and O3–PM2.5PDs
Figure 5 shows the boxplots of daily concentrations of hydroxyl radical (OH) and total oxidant (Ox = O3 + NO2) from the model for days of O3SPDs, PM2.5SPDs, and O3–PM2.5PDs that were observed and also captured by the model (samples in Fig. 4b) in the warm seasons of 2013–2020 in 18 grids of BTH. The levels of OH and Ox characterize the atmospheric oxidation capacity, following Liu et al. (2020) and Nan et al. (2017). The concentrations of OH were the highest on O3SPDs, with an averaged value of 2.8 × 10⁶ molec. cm−3, followed by that on O3–PM2.5PDs (2.0 × 10⁶ molec. cm−3) and on PM2.5SPDs (1.0 × 10⁶ molec. cm−3). Due to the lack of publicly accessible observations of OH in BTH, we compare the simulated OH concentrations with observations reported in the literature (Table S1). The simulated OH concentrations agree closely with the observed values. In Wangdu of BTH, while the observed daily maximum OH concentrations in summer of 2014 were in the range of 5–15 × 106 molec. cm−3 (Tan et al., 2017), the simulated OH concentrations in the same time period in this work were 3.7–9.5 × 10⁶ molec. cm−3. In Beijing in summer of 2017, the observed daily mean OH concentration was 5.8 × 10⁶ molec. cm−3 (Woodward-Massey et al., 2020), and our simulated value was 2.4 × 10⁶ molec. cm−3.
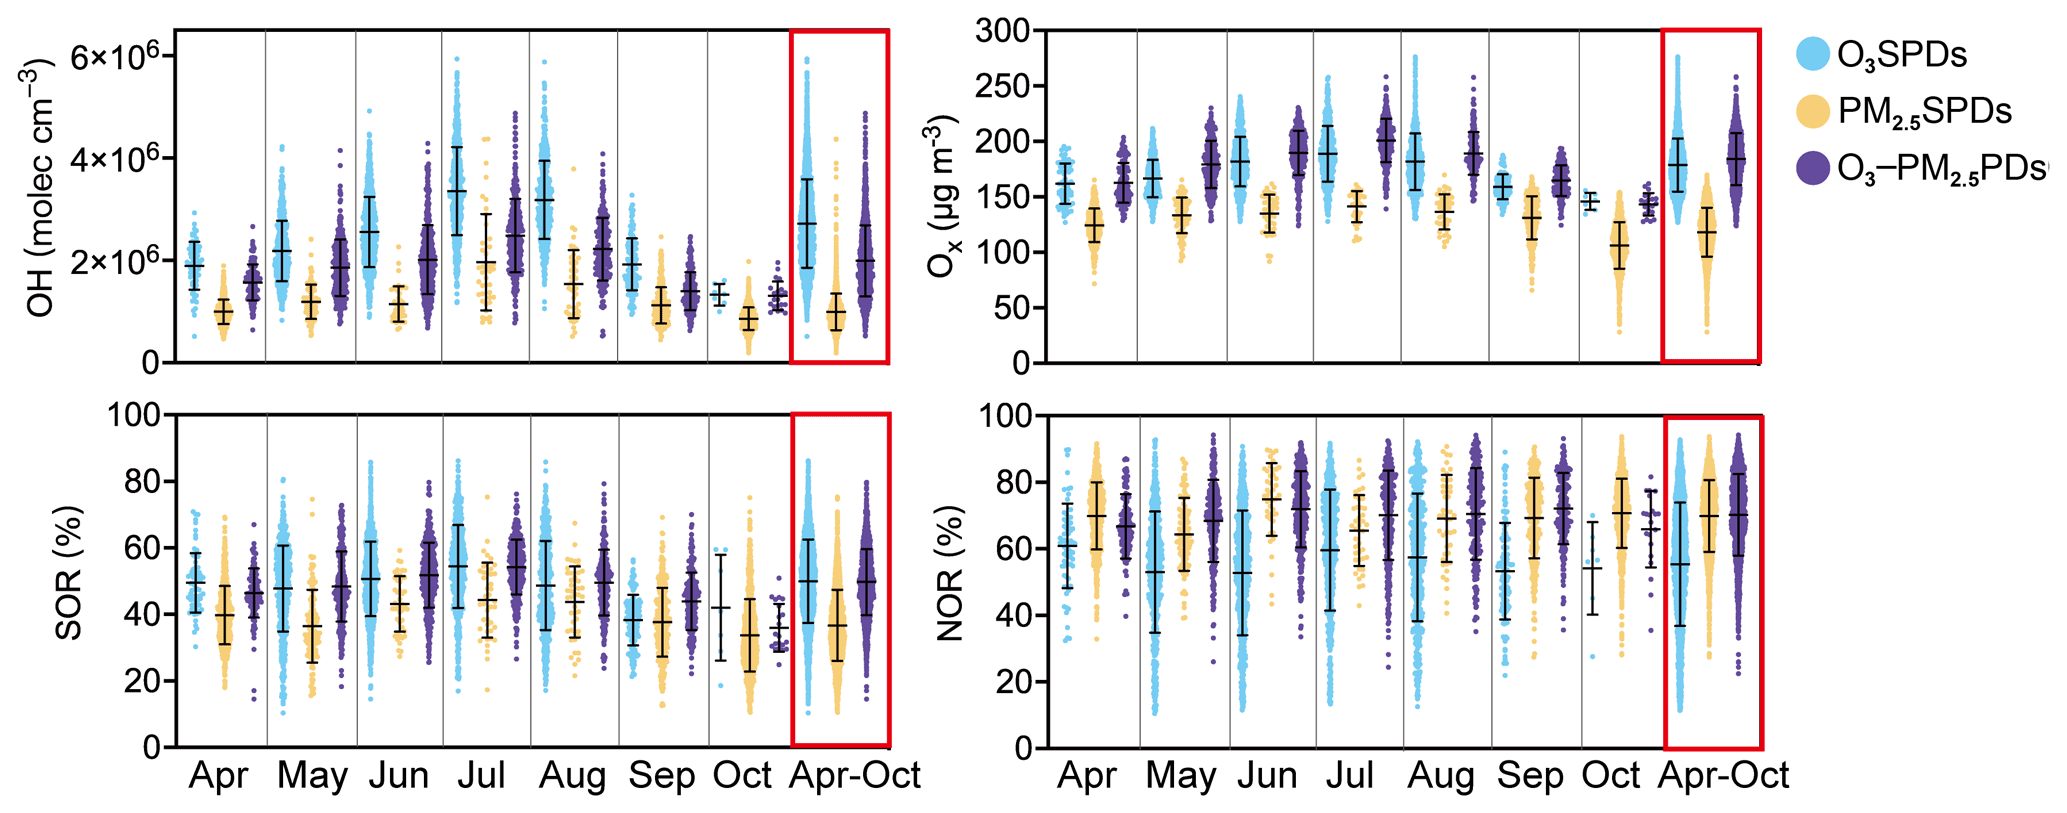
Figure 5The boxplots of surface-layer hydroxyl radical (OH, molec. cm−3), total oxidant (Ox, µg m−3), sulfur oxidation ratio (SOR, %), and nitrogen oxidation ratio (NOR, %) for model-captured O3SPDs, PM2.5SPDs, and O3–PM2.5PDs in 18 grids of BTH in the months of April to October from 2013 to 2020. The whiskers represent the standard deviation, and the black line represents the mean value of the samples.
The mean values of Ox were, respectively, 178.7, 118.1, and 184.1 µg m−3 on O3SPDs, PM2.5SPDs, and O3–PM2.5PDs, indicating that the atmospheric oxidation capacity was strong on O3–PM2.5PDs, which favored the production of secondary components of PM2.5. Figure 5 also shows sulfur oxidation ratio (SOR; n- (n- + n-SO2), where n- and n-SO2 are the concentrations of and SO2, respectively) and nitrogen oxidation ratio (NOR; n- (n- + n-NO2), where n- and n-NO2 are the concentrations of and NO2, respectively). SOR and NOR are measures of the conversion degrees of sulfur and nitrogen, respectively (Zhu et al., 2019). On O3SPDs, PM2.5SPDs, and O3–PM2.5PDs, the averaged values of SOR were 50.0 %, 36.7 %, and 49.7 %, and those of NOR were 55.4 %, 70.0 %, and 70.2 %, respectively. The high SOR and NOR on O3–PM2.5PDs indicated the strong formation of and that was promoted by high atmospheric oxidation capacity. The monthly variations in OH, Ox, and SOR were similar (Fig. 5), with the highest values in summer, owing to the high temperature that promoted high concentrations of oxidants and SOR. It is interesting that SOR and Ox values were higher on O3–PM2.5PDs than on O3SPDs or on PM2.5SPDs during May–August. Similarly, NOR values were higher on O3–PM2.5PDs than on O3SPDs or on PM2.5SPDs in May and July–September. Overall, the O3–PM2.5PDs occurred with high levels of atmospheric oxidants, SOR, and NOR, leading to combined increases in O3 and PM2.5 concentrations.
3.3.2 Surface-layer concentrations of PM2.5 components on O3SPDs, PM2.5SPDs, and O3–PM2.5PDs
The simulated concentrations of PM2.5 components (, , , BC, and OC, averaged over 18 grids of BTH, are shown in Fig. 6 for O3SPDs, PM2.5SPDs, and O3–PM2.5PDs in the warm seasons of 2013–2020 that were observed and also captured by the model. While the mean concentrations of , , BC, and OC were all the highest on PM2.5SPDs, concentration was the highest on O3–PM2.5PDs. On O3SPDs, PM2.5SPDs, and O3–PM2.5PDs, the mean concentrations of were 6.2, 9.4, and 11.97 µg m−3, respectively, and the percentages of in PM2.5 were 14.9 %, 9.0 %, and 15.0 %, respectively. In July and August, the concentrations of and MDA8 O3 on O3–PM2.5PDs were the highest compared with those on O3SPDs and PM2.5SPDs (Fig. S5).

Figure 6The concentrations of PM2.5 components (µg m−3) and percentages of PM2.5 components (%) at the surface for , , , BC, and OC. The values were averaged over the model-captured O3SPDs, PM2.5SPDs, and O3–PM2.5PDs in the months of April to October of 2013–2020 in BTH.
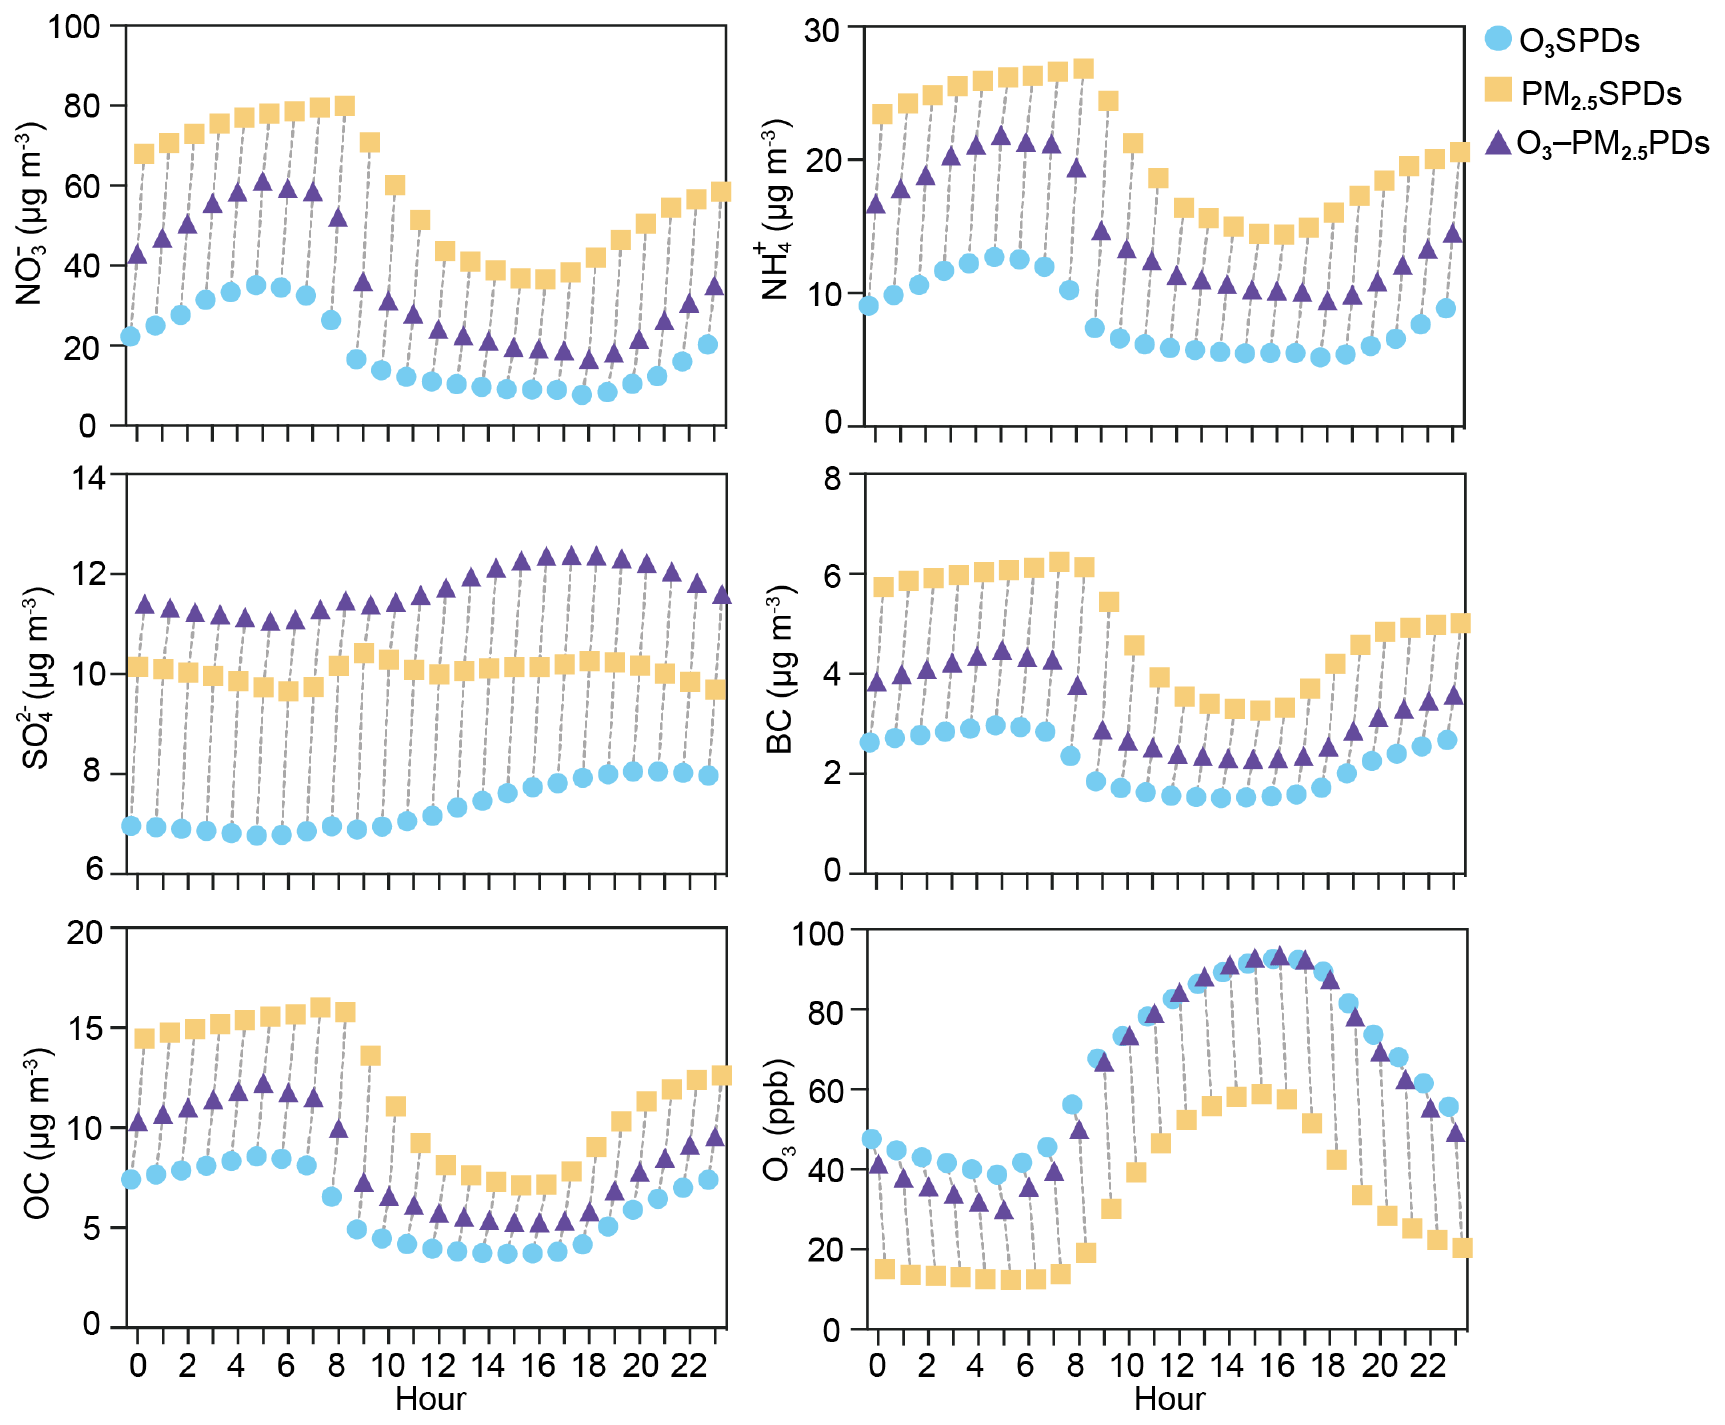
Figure 7The hourly concentrations of , , , BC, OC, and O3 averaged over the model-captured O3SPDs, PM2.5SPDs, and O3 –PM2.5PDs in BTH in the months of April to October of 2013–2020.
Figure 7 presents the hourly concentrations of , , , BC, OC, and O3 for model-captured O3SPDs, PM2.5SPDs, and O3–PM2.5PDs over all 18 grids of BTH in the warm seasons from 2013–2020. Concentrations of and had similarities in diurnal variations, all of which reached the highest values in the early morning (05:00 local time, LT, on O3SPDs and O3–PM2.5PDs, 07:00–08:00 LT on PM2.5SPDs) and had the lowest values in the late afternoon (18:00 LT on O3SPDs and O3–PM2.5PDs, 16:00 LT on PM2.5SPDs). Concentrations of BC and OC peaked at the same time as those of and and had the lowest values at 15:00 LT on O3SPDs, PM2.5SPDs, and O3–PM2.5PDs. The diurnal variations in , , BC, and OC, which generally reached their highest concentrations before the sudden uplift of PBLH in the early morning (times for uplift of PBLH: 06:00 LT on O3SPDs and O3–PM2.5PDs, 07:00 LT on PM2.5SPDs), reflected the diurnal variations in PBLH (shown in Fig. S6). Compared to O3SPDs and O3–PM2.5PDs, the PBLH of PM2.5SPDs was lower and uplifted 1 h later, which was more favorable for the accumulation of aerosols. During the daytime, PBLH on O3–PM2.5PDs was between O3SPDs and PM2.5SPDs.
It is worth noting that the diurnal variations in were different from those of other aerosol species, with the highest values at 20:00, 09:00, and 16:00 LT on O3SPDs, PM2.5SPDs, and O3–PM2.5PDs, respectively, and the lowest values in early morning and night (05:00 LT on O3SPDs and O3–PM2.5PDs, 23:00 LT on PM2.5SPDs). For the diurnal variation in O3, the highest values occurred during the daytime (16:00 LT on O3SPDs and O3–PM2.5PDs, 15:00 LT on PM2.5SPDs), and the lowest values appeared at 05:00 LT in all cases. Therefore, on O3–PM2.5PDs, the time of the highest value of was the same as that of O3, indicating that and O3 were produced synergistically during the daytime with strong atmospheric oxidation.
3.3.3 Vertical distributions of O3 and PM2.5 on O3SPDs, PM2.5SPDs, and O3–PM2.5PDs
The simulated vertical distributions of O3 and PM2.5 averaged over the 18 grids of BTH and the O3SPDs, PM2.5SPDs, and O3–PM2.5PDs in warm seasons of 2013–2020 are shown in Fig. 8. The vertical distribution of O3 on O3SPDs was similar to that on O3–PM2.5PDs (Fig. 8a). In these two cases, concentrations of O3 increased from the surface to about 975 hPa, remained high between 975 and 819 hPa and decreased with altitude between 819 and 663 hPa. Although the magnitudes of O3 were close at the surface (61.9 ppb on O3–PM2.5PDs and 58.1 ppb on O3SPDs), the concentration of O3 averaged over 975 and 819 hPa was 10.4 % higher on O3–PM2.5PDs than on O3SPDs, which was a very unique feature of O3–PM2.5PDs. For the case of PM2.5SPDs, the concentrations of O3 were the lowest among the three cases and increased gently with altitude above 975 hPa.

Figure 8The vertical distributions of (a) concentrations of O3 (ppb) and (b) PM2.5 components (µg m−3) of , , , BC, OC averaged over the model-captured O3SPDs, PM2.5SPDs, and O3–PM2.5PDs in BTH in the months of April to October of 2013–2020.
Figure 8b shows the vertical distributions of PM2.5 components. In all the cases, PM2.5 concentrations were the highest at the surface, and decreased with altitude from the surface to 975 hPa. However, concentrations of PM2.5 were quite stable between 975 and 819 hPa for O3SPDs (about 36.4 µg m−3) and O3–PM2.5PDs (about 58.1 µg m−3), corresponding to the stable O3 levels at these altitudes in these two cases (Fig. 8a). For PM2.5SPDs, while PM2.5 concentration at the surface was the highest among the three cases, it decreased rapidly between 975 and 819 hPa. The averaged PM2.5 concentration between 975 and 819 hPa was 52.4 µg m−3 on PM2.5SPDs, which was lower than that on O3–PM2.5PDs.
Table 1The ratios at 975 and 1005 hPa (shaded gray area in Fig. 8) and at 819 and 975 hPa (red frame in Fig. 8) of , , , BC, OC, and PM2.5 on O3SPDs, PM2.5SPDs, and O3–PM2.5PDs in BTH region.

To further investigate the differences in vertical profiles of , , , BC, OC, and PM2.5 on O3SPDs, PM2.5SPDs, and O3–PM2.5PDs, the ratios of concentration at 975 hPa to that at the surface as well as the concentration at 819 hPa to that at 975 hPa are shown in Table 1. The concentration of PM2.5 decreased largely, with the ratio of PM2.5(975 hPa) PM2.5(1005 hPa) of 0.78 on O3–PM2.5PDs and of 0.74 on PM2.5SPDs. For each of the PM2.5 components, the ratios near the surface (from 1005 to 975 hPa, shaded gray area in Fig. 8) were close in the three types of pollution. While the ratios of , , BC, and OC were in the range of 0.65–0.80, the ratios of were about 0.93–0.98, indicating that concentrations were quite uniform from the surface to 975 hPa in all three types of pollution.
In the upper layers (975–819 hPa, red rectangle in Fig. 8), the changes in concentrations of pollutants with altitude on PM2.5SPDs were quite different from those on O3–PM2.5PDs and O3SPDs. The decline in PM2.5 from 975 to 819 hPa was slow on O3–PM2.5PDs (PM2.5(819 hPa) PM2.5(975 hPa) = 0.89) and O3SPDs (0.86) and fast on PM2.5SPDs (0.67). Considering that the variation in BC with altitude was mainly driven by meteorology (Sun et al., 2020), the vertical variations in other components that differed significantly from BC indicated the influences of chemical processes. On PM2.5SPDs, , , and OC had about the same ratio as BC (0.64) (with large decreases with height), except for concentration, which had a ratio of 0.81. On O3–PM2.5PDs, the ratios of , , and were 0.94, 0.91, and 0.87, respectively, which were much higher than the value of BC (0.79), indicating , , and were quite uniform in the layers of 975–819 hPa with the influence of chemical processes, which is discussed further in Sect. 3.3.4 below.
3.3.4 Process analyses for O3SPDs, PM2.5SPDs, and O3–PM2.5PDs
The process analysis (PA) is applied to identify the relative importance of atmospheric processes in the three types of pollution. Figure 9 shows the net changes in O3, , , and by the processes of chemical production (Chem), horizontal advection (Horizontal_adv), vertical advection (Vertical_avd), and diffusion (Diff; vertical PBL mixing process) in the GEOS-Chem model, as well as the total of all these processes (i.e., Chem + Diff + Horizontal_avd + Vertical_avd) on O3SPDs, PM2.5SPDs, and O3–PM2.5PDs.

Figure 9The vertical profiles of net changes in O3, , , and (Gg d−1) over BTH by each process and the total processes. The values were averaged over the model-captured regional O3SPDs, PM2.5SPDs, and O3–PM2.5PDs in April–October of 2013–2020.
For O3, the net changes in O3 by all processes were positive at altitudes of 975–819 hPa on O3–PM2.5PDs and O3SPDs, in which Chem had the largest positive contribution (about 1.5 Gg d−1), indicating O3 is chemically produced at these layers. For and , the nets of all processes increased mass concentrations at 913–819 hPa on O3–PM2.5PDs and O3SPDs, in which Chem and Vertical_avd were positive, and Chem had the largest positive contribution. The vertical profiles of Chem were similar for and , both of which had the largest positive values at 913–819 hPa (2.83 Gg d−1 for and 0.88 Gg d−1 for ), leading to higher concentrations of and on O3–PM2.5PDs than on O3SPDs and PM2.5SPDs. Chem and Diff of were different from those of and . For , Chem was positive from the surface to 510 hPa, with a peak around 819 hPa, and Diff was positive at 819–771 hPa but negative from 819 hPa to the surface, which resulted in the uniform profile as shown in Fig. 8. Chem for was the highest around 819 hPa on O3–PM2.5PDs, which was related to the strong liquid-phase chemical formation of (Fig. S7). In addition to Chem, Vertical_avd also had positive contributions to the net changes in O3, , , and at 944–819 hPa. Vertical_avd was negative at 819 hPa and positive between 944 and 819 hPa, implying that the pollutants were transported from 819 to 944 hPa on O3–PM2.5PDs.
Overall, , , and all had larger chemical productions at 913–819 hPa on O3–PM2.5PDs compared to those on O3SPDs and PM2.5SPDs, accompanied by strong vertical transport from 819 hPa to near the surface, resulting in the quite uniform vertical profiles at 975–819 hPa on O3–PM2.5PDs. In addition, the vertical profiles of net changes in PM2.5 over BTH are shown in Fig. S8 for these three cases. Since , , and were the major components of PM2.5, the PA of PM2.5 is similar to that of each component.
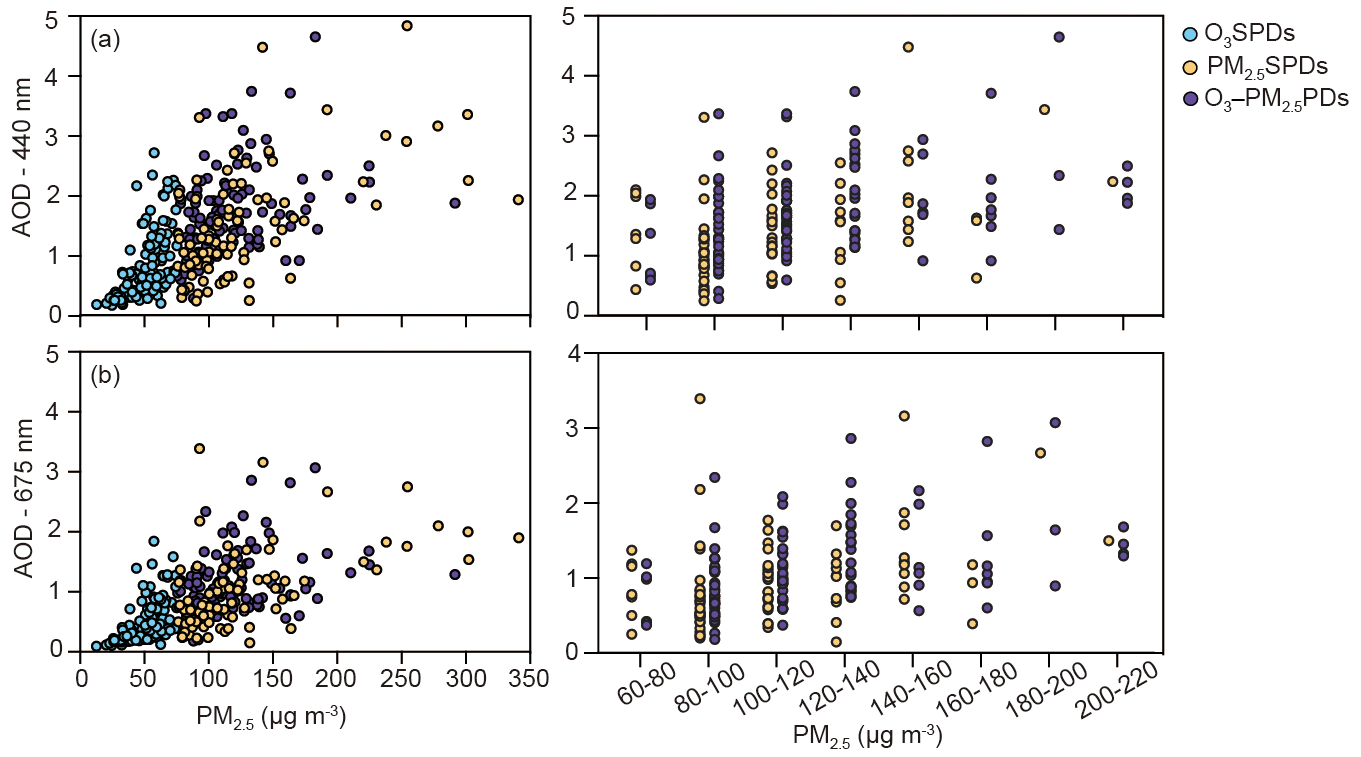
Figure 10The scatterplots of (a) AOD (440 nm) and (b) AOD (675 nm) versus observed PM2.5 concentrations on O3SPDs, PM2.5SPDs, and O3–PM2.5PDs in Beijing (39.97∘ N, 116.38∘ E) in April–October of 2013–2020.
3.3.5 Observed AOD on O3SPDs, PM2.5SPDs, and O3–PM2.5PDs
To try to support the model result that O3–PM2.5PDs had a more uniform vertical profile than PM2.5SPDs from the surface to 819 hPa altitude, we present the scatterplots of observed AOD (at 440 and 675 nm) versus observed PM2.5 concentrations on O3SPDs, PM2.5SPDs, and O3–PM2.5PDs in Fig. 10. AERONET observations of AOD from 2013 to 2020 are available at three sites in BTH (Beijing: 39.97∘ N, 116.38∘ E; Beijing-CAMS: 39.93∘ N, 116.31∘ E; Xianghe: 39.75∘ N, 116.96∘ E). At Beijing (39.97∘ N, 116.38∘ E), AOD (440 and 675 nm) increased with PM2.5 concentration in all three types of pollution. However, under the same levels of surface PM2.5 concentration, AOD values on O3–PM2.5PDs were higher than on PM2.5SPDs, implying that the column burdens of aerosols were generally higher on O3–PM2.5PDs than on PM2.5SPDs, which may support the unique vertical distribution of PM2.5 on O3–PM2.5PDs shown in Fig. 8b. The scatterplots at Beijing-CAMS and Xianghe sites are similar and are shown in Fig. S9.
3.4 Meteorological conditions for O3SPDs, PM2.5SPDs, and O3–PM2.5PDs over BTH
Figure 11 shows the vertical profiles of RH, T, and OMEGA for O3SPDs, PM2.5SPDs, and O3–PM2.5PDs captured by the model over BTH in the months of April to October from 2013–2020. It should be noted that O3–PM2.5PDs had an unique vertical distribution of RH. Near the surface, the values of RH on O3–PM2.5PDs were between those on O3SPDs and PM2.5SPDs. However, in the upper layers (883–771 hPa), O3–PM2.5PDs had the highest RH among the three cases, with a peak value of 58.2 %. As a result, the strongest aqueous chemical production of (aqueous oxidation of SO2 by H2O2) occurred on O3–PM2.5PDs around 819 to 771 hPa (Fig. S7). The vertical profiles of temperature were similar in the three types of pollution, with the lowest temperature on PM2.5SPDs. The vertical profiles of OMEGA were different in the three cases. On O3SPDs and O3–PM2.5PDs, OMEGA had positive values around 819 hPa, indicating a strong sinking airflow, leading to a downward transport of pollutants. Under O3–PM2.5PDs, the average values of PBLH and SWGDN were 946.1 m and 257.2 W m−2, respectively, which were higher (lower) than those on PM2.5SPDs (O3SPDs) (Fig. S10).
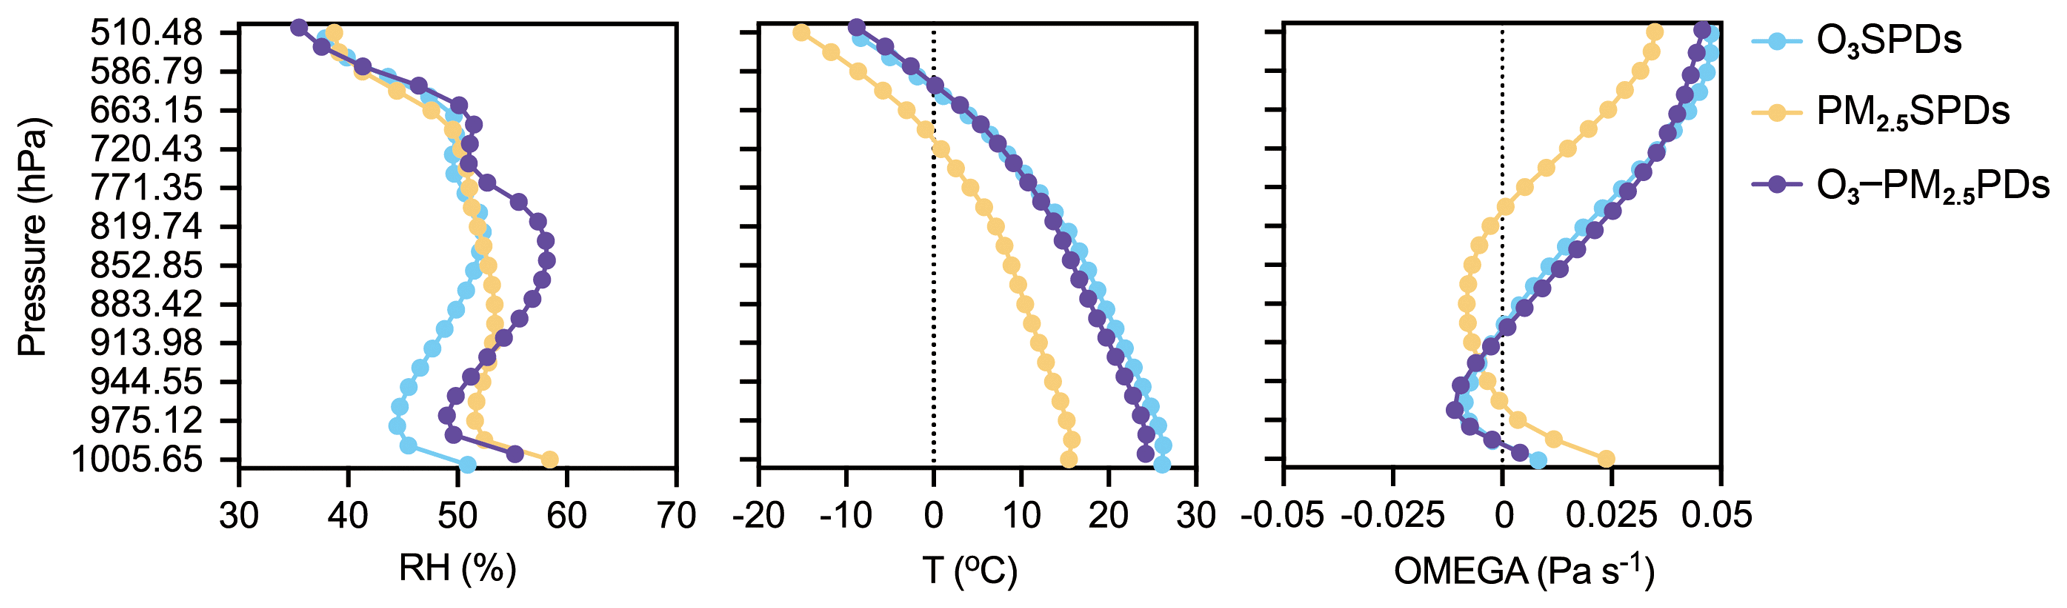
Figure 11The vertical profiles of RH (%), T (∘C), and OMEGA (Pa s−1) averaged over BTH and over the model-captured regional O3SPDs, PM2.5SPDs, and O3–PM2.5PDs in April–October of 2013–2020.

Figure 12Composites of wind field (m s−1) with SLP (sea level pressure) and with geopotential height at 850 and 500 hPa for regional O3SPDs, PM2.5SPDs, and O3–PM2.5PDs that were captured by the model in April–October of 2013–2020. The solid black rectangle indicates BTH region.
Figure 12 shows the composited weather patterns for regional O3SPDs, PM2.5SPDs, and O3–PM2.5PDs (over 50 % of the cities in BTH experienced the pollution) that were captured by the model in April–October of 2013–2020. The weather patterns of O3–PM2.5PDs were similar to some extent to those of O3SPDs but were quite different from those of PM2.5SPDs. On O3–PM2.5PDs, the BTH region was controlled by westerlies and an anomalous high-pressure system at 500 hPa (Fig. S11). At 850 hPa, BTH was at the western boundary of an anomalous anticyclone, and the associated strong anomalous southerlies at 850 hPa brought moist air to BTH (Figs. S12 and S13), resulting in a high RH that was beneficial to the aqueous chemical production of on O3–PM2.5PDs. On O3SPDs, BTH was under the influence of the high-pressure ridge of the western Pacific subtropical high (WPSH) at 850 hPa. Additionally, the northeast cold vortex was located to the southwest of BTH at 850 hPa on O3SPDs, leading to dry and warm conditions, which was favorable for the formation of O3. On PM2.5SPDs, the BTH region was under the influence of both the continental high and the WPSH at 850 hPa. At the surface, BTH was under the influence of a uniform high pressure with very weak winds and hence stagnate atmosphere, which was conducive to the accumulation of PM2.5.
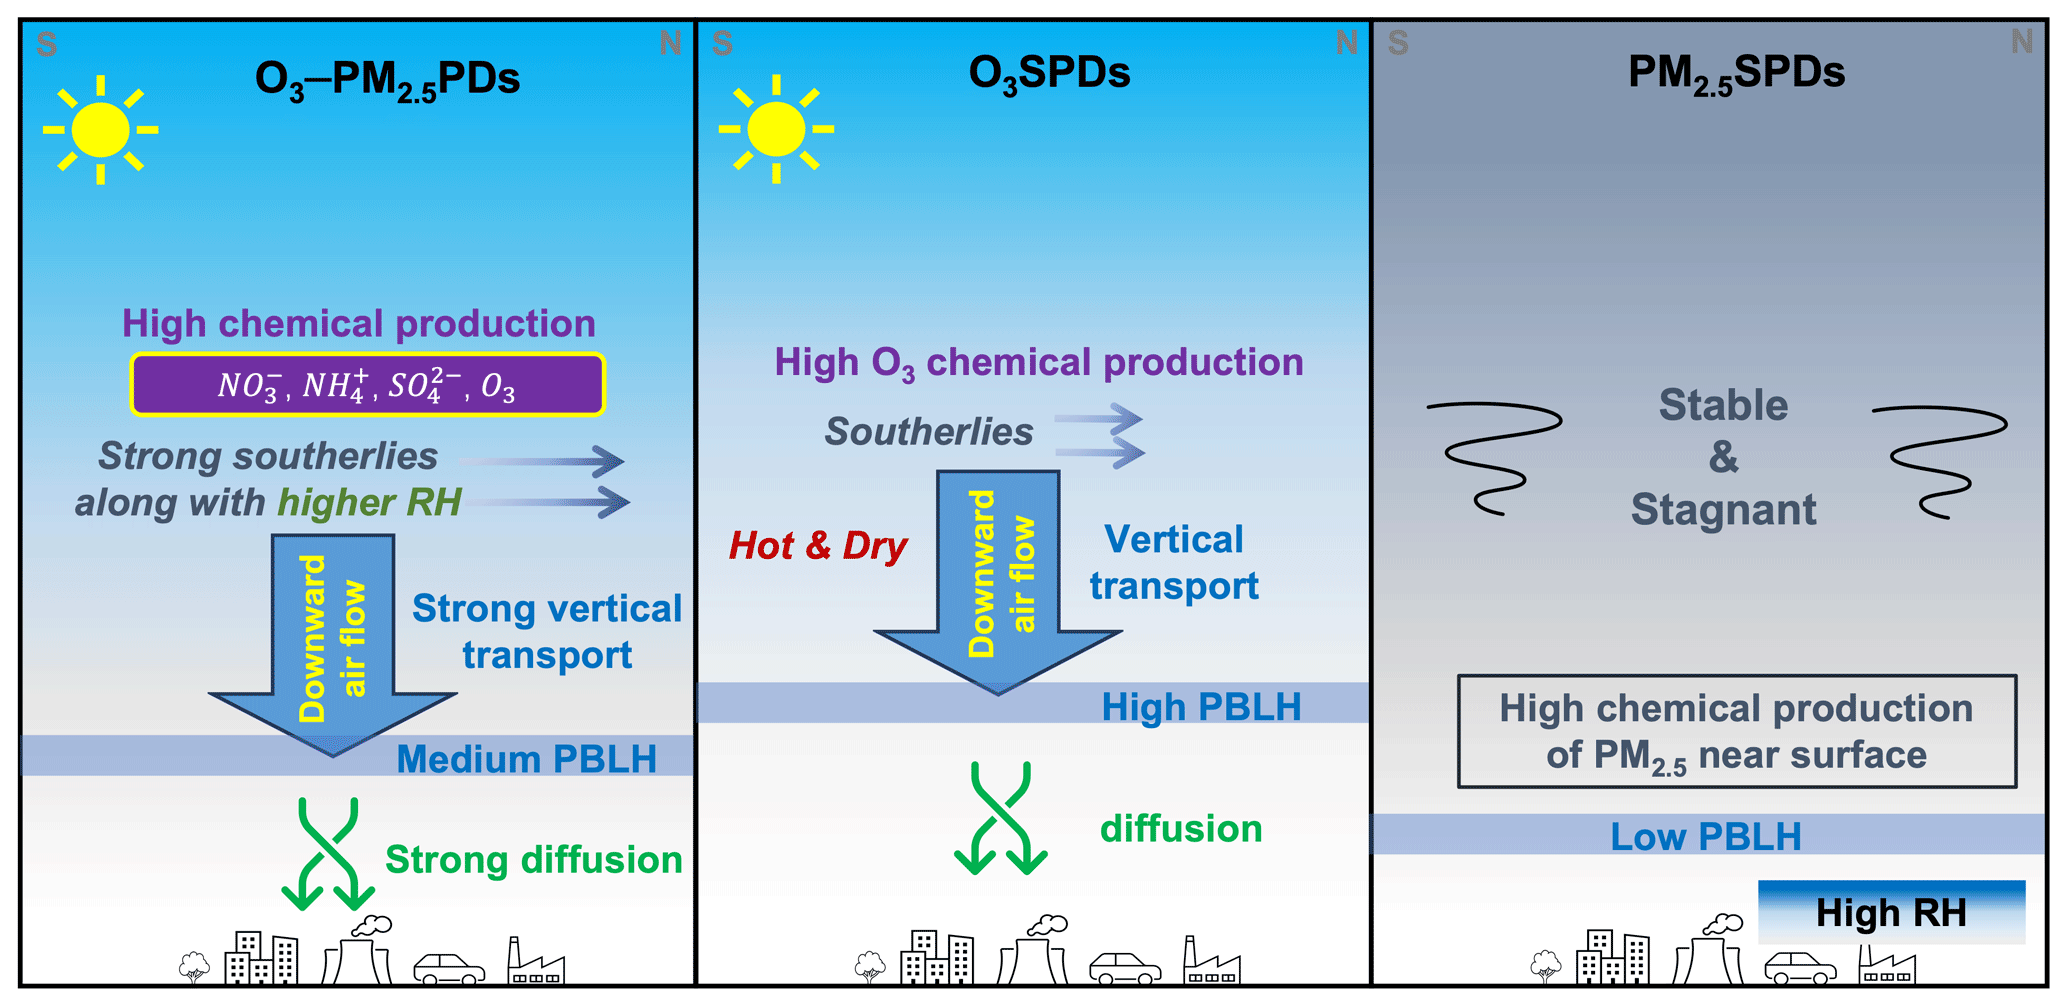
Figure 13A schematic diagram of chemical and physical and characteristics on O3SPDs, PM2.5SPDs, and O3–PM2.5PDs in BTH region.
We used the observed hourly concentrations of O3 and PM2.5 from CNEMC and the model results from the nested-grid version of the GEOS-Chem model to examine the chemical and physical characteristics of the co-polluted days by O3 and PM2.5 (O3–PM2.5PDs) over the BTH region for eight warm seasons (April–October) from 2013 to 2020. The characteristics of O3–PM2.5PDs were compared with those of the polluted days by O3 alone (O3SPDs) and by PM2.5 alone (PM2.5SPDs). In April–October of 2013–2020, the observed O3SPDs, PM2.5SPDs, and O3–PM2.5PDs were 2954, 2148, and 1614 d, respectively, in which 75.0 % (2954/3937), 58.1 % (2148/3698), and 79.7 % (1614/2024) were captured by the GEOS-Chem model, respectively. We carried out composited analyses of the chemical and physical characteristics for O3SPDs, PM2.5SPDs, and O3–PM2.5PDs by using the samples (days) captured by both the observations and the model.
The chemical characteristics of O3–PM2.5PDs were found to be different from those of O3SPDs and PM2.5SPDs at the surface. O3–PM2.5PDs occurred with high levels of atmospheric oxidants (high OH and Ox), with higher SOR and NOR compared to those on O3SPDs and PM2.5SPDs, leading to high concentrations of both O3 and PM2.5. At the surface, the composited concentrations of , , BC, and OC were the highest on PM2.5SPDs, while the composited concentration of was the highest on O3–PM2.5PDs. There was a strong formation of during the daytime on O3–PM2.5PDs in the oxidative atmosphere.
We also found unique features of the vertical distributions of O3 and PM2.5 on O3–PM2.5PDs. Concentrations of PM2.5 were stable and high between 975 and 819 hPa on O3–PM2.5PDs, unlike those on PM2.5SPDs that decreased rapidly with the altitude. On O3–PM2.5PDs, the vertical profiles of , , and were quite uniform at 975–819 hPa, corresponding to the stable O3 concentrations at these altitudes. The process analysis (PA) showed that , , and all had larger chemical productions at altitudes of 913–819 hPa on O3–PM2.5PDs compared to those on O3SPDs and PM2.5SPDs. The chemical production of had large positive values from the surface to about 500 hPa. The Vertical_avd also had positive contributions to the net changes in O3, , , and at 944–819 hPa on O3–PM2.5PDs. Therefore, the strong chemical productions at 913–819 hPa accompanied by the downward transport resulted in the quite uniform vertical profiles at 975–819 hPa on O3–PM2.5PDs.
Figure 13 summarizes the chemical and physical characteristics on O3–PM2.5PDs, O3SPDs, and PM2.5SPDs in the BTH region. On O3–PM2.5PDs, the strong chemical productions of O3, , , and occurred at high altitudes of 913–819 hPa, where RH was high, and the accompanied downward airflow caused the stable concentrations at 944–819 hPa. The composited PBLH on O3–PM2.5PDs was about 946.1 m, and the strong mixed diffusion underneath the PBLH led to high concentrations of pollutants at the ground level. In contrast, O3SPDs occurred in a hot and dry atmosphere with composited PBLH of 1073.5 m. Strong O3 chemical production occurred around 819 hPa, and O3 was then transported to the surface by downward airflow. The atmosphere was stable and stagnate when PM2.5SPDs occurred, with the lowest PBLH of 681.8 m. High RH (high chemical formation of PM2.5) and the accumulation of aerosols led to the highest surface-layer PM2.5 on PM2.5SPDs.
To summarize, O3–PM2.5PDs were characterized by high Ox, SOR, and NOR; uniform vertical profiles at 975–819 hPa, which were caused by an anomalous high-pressure system at 500 hPa; strong southerlies; and high RH at 850 hPa. Meteorological parameters around 850 hPa promoted strong chemical production of secondary aerosols and downward transport, resulting in the unique vertical profiles and high surface concentrations on O3–PM2.5PDs.
The GEOS-Chem model is available at http://acmg.seas.harvard.edu (last access: 17 November 2022; Atmospheric Chemistry Modeling group, 2022). The observed hourly surface concentrations of air pollutants are derived from the China National Environmental Monitoring Center (http://www.cnemc.cn, last access: 24 December 2022; CNEMC, 2022). The version 3 datasets of observed daily aerosol optical depth (AOD) of level 2 (improved cloud screening and quality-assured) are from the Aerosol Robotic Network (AERONET; https://aeronet.gsfc.nasa.gov/new_web/index.html, last access: 17 November 2022; AERONET, 2022). The simulation results are available upon request from the corresponding author (hongliao@nuist.edu.cn).
The supplement related to this article is available online at: https://doi.org/10.5194/acp-23-23-2023-supplement.
HD and HL conceived the study and designed the experiments. HD performed model simulations and analyzed the data. KL, XY, YY, JZ, JJ, BL, and XJ provided useful comments on the paper. HD and HL prepared the paper, with contributions from all co-authors.
The contact author has declared that none of the authors has any competing interests.
Publisher's note: Copernicus Publications remains neutral with regard to jurisdictional claims in published maps and institutional affiliations.
We acknowledge the CNEMC for making their data publicly available. We acknowledge the efforts of GEOS-Chem working groups for developing and managing the model.
This research has been supported by the National Natural Science Foundation of China (grant no. 42021004), the National Key Research and Development Program of China (grant no. 2019YFA0606800), and the Carbon Peak Carbon Neutral Science and Technology Innovation Foundation of Jiangsu Province (grant no. BK20220031).
This paper was edited by Tao Wang and reviewed by two anonymous referees.
AERONET: Aerosol Robotic Network, NASA and LOA-PHOTONS, https://aeronet.gsfc.nasa.gov/new_web/index.html, last access: 17 November 2022.
Alexander, B., Park, R. J., Jacob, D. J., Li, Q. B., Yan- tosca, R. M., Savarino, J., Lee, C. C. W., and Thiemens, M. H.: Sulfate formation in sea-salt aerosols: Constraints from oxygen isotopes, J. Geophys. Res.-Atmos., 110, D10307, https://doi.org/10.1029/2004jd005659, 2005.
Atmospheric Chemistry Modeling group: GEOS-Chem model: the Goddard Earth Observing System-Chemisty model, Harvard University, http://acmg.seas.harvard.edu, last access: 17 November 2022.
Bey, I., Jacob, D. J., Yantosca, R. M., Logan, J. A., Field, B. D., Fiore, A. M., Li, Q. B., Liu, H. G. Y., Mickley, L. J., and Schultz, M. G.: Global modeling of tropospheric chemistry with assimilated meteorology: Model description and evaluation, J. Geophys. Res.-Atmos., 106, 23073–23095, https://doi.org/10.1029/2001jd000807, 2001.
Chinese State Council: Action Plan on Air Pollution Prevention and Control, http://www.gov.cn/zwgk/2013-09/12/content_2486773.htm (last access: 24 December 2022), 2013 (in Chinese).
Chinese State Council: Three-Year Action Plan on Defending the Blue Sky, http://www.gov.cn/zhengce/content/2018-07/03/content_5303158.htm (last access: 24 December 2022), 2018 (in Chinese).
Chu, B. W., Ma, Q. X., Liu, J., Ma, J. Z., Zhang, P., Chen, T. A., Feng, Q. C., Wang. C. Y., Yang, N., Ma, H. N., Ma, J. J., Russell, A. G., and He, H.: Air Pollutant Correlations in China: Secondary Air Pollutant Responses to NOx and SO2 Control, Environ. Sci. Tech. Let., 7, 695–700, https://doi.org/10.1021/acs.estlett.0c00403, 2020.
CNEMC: China National Environmental Monitoring Center, http://www.cnemc.cn, last access: 24 December 2022 (in Chinese).
Dai, H. B., Zhu, J., Liao, H., Li, J. D., Liang, M. X., Yang, Y., and Yue, X.: Co-occurrence of ozone and PM2.5 pollution in the Yangtze River Delta over 2013–2019: spatiotemporal distribution and meteorological conditions, Atmos. Res., 249, 105363, https://doi.org/10.1016/j.atmosres.2020.105363, 2021.
Dang, R. and Liao, H.: Severe winter haze days in the Beijing–Tianjin–Hebei region from 1985 to 2017 and the roles of anthropogenic emissions and meteorology, Atmos. Chem. Phys., 19, 10801–10816, https://doi.org/10.5194/acp-19-10801-2019, 2019.
Dang, R. J., Liao, H., and Fu, Y.: Quantifying the anthropogenic and meteorological influences on summertime surface ozone in China over 2012–2017, Sci. Total. Environ., 754, 142394, https://doi.org/10.1016/j.scitotenv.2020.142394, 2021.
Duan, F., He, K., Ma, Y., Yang, F., Yu, X., Cadle, S. H., Chan, T., and Mulawa, P. A.: Concentration and chemical characteristics of PM2.5 in Beijing, China: 2001–2002, Sci. Total Environ., 355, 264–275, https://doi.org/10.1016/j.scitotenv.2005.03.001, 2006.
Fairlie, T. D., Jacob, D. J., and Park, R. J.: The impact of transpacific transport of mineral dust in the United States, Atmos. Environ., 41, 1251–1266, https://doi.org/10.1016/j.atmosenv.2006.09.048, 2007.
Gao, Y. and Ji, H. B.: Microscopic morphology and seasonal variation of health effect arising from heavy metals in PM2.5 and PM10: One-year measurement in a densely populated area of urban Beijing, Atmos. Res., 212, 213–226, https://doi.org/10.1016/j.atmosres.2018.04.027, 2018.
Giles, D. M., Sinyuk, A., Sorokin, M. G., Schafer, J. S., Smirnov, A., Slutsker, I., Eck, T. F., Holben, B. N., Lewis, J. R., Campbell, J. R., Welton, E. J., Korkin, S. V., and Lyapustin, A. I.: Advancements in the Aerosol Robotic Network (AERONET) Version 3 database – automated near-real-time quality control algorithm with improved cloud screening for Sun photometer aerosol optical depth (AOD) measurements, Atmos. Meas. Tech., 12, 169–209, https://doi.org/10.5194/amt-12-169-2019, 2019.
Gonçalves, M., Jiménez-Guerrero, P., and Baldasano, J. M.: Contribution of atmospheric processes affecting the dynamics of air pollution in South-Western Europe during a typical summertime photochemical episode, Atmos. Chem. Phys., 9, 849–864, https://doi.org/10.5194/acp-9-849-2009, 2009.
Gong, C. and Liao, H.: A typical weather pattern for ozone pollution events in North China, Atmos. Chem. Phys., 19, 13725–13740, https://doi.org/10.5194/acp-19-13725-2019, 2019.
Gong, C., Liao, H., Zhang, L., Yue, X., Dang, R. J., and Yang, Y.: Persistent ozone pollution episodes in North China exacerbated by regional transport, Environ. Pollut., 265, 115056, https://doi.org/10.1016/j.envpol.2020.115056, 2020.
Guenther, A. B., Jiang, X., Heald, C. L., Sakulyanontvittaya, T., Duhl, T., Emmons, L. K., and Wang, X.: The Model of Emissions of Gases and Aerosols from Nature version 2.1 (MEGAN2.1): an extended and updated framework for modeling biogenic emissions, Geosci. Model Dev., 5, 1471–1492, https://doi.org/10.5194/gmd-5-1471-2012, 2012.
Jiang, N., Li, L., Wang, S., Li, Q., Dong, Z., Duan, S., Zhang, R., and Li, S.: Variation tendency of pollution characterization, sources, and health risks of PM2.5-bound polycyclic aromatic hydrocarbons in an emerging megacity in China: based on three-year data, Atmos. Res., 217, 81–92, https://doi.org/10.1016/j.atmosres.2018.10.023, 2019.
Li, K., Jacob, D. J., Liao, H., Zhu, J., Shah, V., Shen, L., Bates, K., Zhang, Q., and Zhai, S. X.: A two-pollutant strategy for improving ozone and particulate air quality in China, Nat. Geosci., 12, 906–910, https://doi.org/10.1038/s41561-019-0464-x, 2019.
Li, K., Jacob, D. J., Shen, L., Lu, X., De Smedt, I., and Liao, H.: Increases in surface ozone pollution in China from 2013 to 2019: anthropogenic and meteorological influences, Atmos. Chem. Phys., 20, 11423–11433, https://doi.org/10.5194/acp-20-11423-2020, 2020.
Li, M., Zhang, Q., Kurokawa, J.-I., Woo, J.-H., He, K., Lu, Z., Ohara, T., Song, Y., Streets, D. G., Carmichael, G. R., Cheng, Y., Hong, C., Huo, H., Jiang, X., Kang, S., Liu, F., Su, H., and Zheng, B.: MIX: a mosaic Asian anthropogenic emission inventory under the international collaboration framework of the MICS-Asia and HTAP, Atmos. Chem. Phys., 17, 935–963, https://doi.org/10.5194/acp-17-935-2017, 2017.
Li, M., Wang, L., and Liu, J.: Exploring the regional pollution characteristics and meteorological formation mechanism of PM2.5 in North China during 2013–2017, Environ. Int., 134, 105283, https://doi.org/10.1016/j.envint.2019.105283, 2019.
Liu, Y. X., Zhao, Q. B., Hao, X., Zhao, J. R., Zhang, Y., Yang, X., Fu, Q. Y., Xu, X. Y., Wang, X. F., Huo, J. T., and Chen, J. M.: Increasing surface ozone and enhanced secondary organic carbon formation at a city junction site: An epitome of the Yangtze River Delta, China (2014–2017), Environ. Pollut., 265, 0269-7491, https://doi.org/10.1016/j.envpol.2020.114847, 2020.
Lou, S. J., Liao, H., Yang, Y., and Mu, Q.: Simulation of the interannual variations of tropospheric ozone over China: Roles of variations in meteorological parameters and anthropogenic emissions, Atmos. Environ., 122, 839–851, https://doi.org/10.1016/j.atmosenv.2015.08.081, 2015.
Molod, A., Takacs, L., Suarez, M., and Bacmeister, J.: Development of the GEOS-5 atmospheric general circulation model: evolution from MERRA to MERRA2, Geosci. Model Dev., 8, 1339–1356, https://doi.org/10.5194/gmd-8-1339-2015, 2015.
Mu, Q. and Liao, H.: Simulation of the interannual variations of aerosols in China: role of variations in meteorological parameters, Atmos. Chem. Phys., 14, 9597–9612, https://doi.org/10.5194/acp-14-9597-2014, 2014.
Nan, J. L., Wang, S. S., Guo, Y. L., Xiang, Y. J., and Zhou, B.: Study on the daytime OH radical and implication for its relationship with fine particles over megacity of Shanghai, China, Atmos. Environ., 154, 167–178, https://doi.org/10.1016/j.atmosenv.2017.01.046, 2017.
Ni, R., Lin, J., Yan, Y., and Lin, W.: Foreign and domestic contributions to springtime ozone over China, Atmos. Chem. Phys., 18, 11447–11469, https://doi.org/10.5194/acp-18-11447-2018, 2018.
Park, R. J., Jacob, D. J., Chin, M., and Martin, R. V.: Sources of carbonaceous aerosols over the United States and implications for natural visibility, J. Geophys. Res.-Atmos., 108, 4355, https://doi.org/10.1029/2002jd003190, 2003.
Park, R. J., Jacob, D. J., Field, B. D., Yantosca, R. M., and Chin, M.: Natural and transboundary pollution influences on sulfate-nitrate-ammonium aerosols in the United States: Implications for policy, J. Geophys. Res.-Atmos., 109, D15204, https://doi.org/10.1029/2003jd004473, 2004.
Pye, H. O. T., Liao, H., Wu, S., Mickley, L. J., Jacob, D. J., Henze, D. K., and Seinfeld, J. H.: Effect of changes in climate and emissions on future sulfate-nitrate-ammonium aerosol levels in the United States, J. Geophys. Res.-Atmos., 114, D01205, https://doi.org/10.1029/2008jd010701, 2009.
Qin, Y., Li, J. Y., Gong, K. J., Wu, Z., Chen, M. D., Qin, M. M., Huang, L., and Hu, J. L.: Double high pollution events in the Yangtze River Delta from 2015 to 2019: Characteristics, trends, and meteorological situations, Sci. Total. Environ., 792, 148349, https://doi.org/10.1016/j.scitotenv.2021.148349, 2021.
Ren, W., Tian, H., Tao, B., Chappelka, A., Sun, G., Lu, C., Liu, M., Chen, G., and Xu, X.: Impacts of tropospheric ozone and climate change on net primary productivity and net carbon exchange of China's forest ecosystems, Glob. Ecol. Biogeogr., 20, 391–406, https://doi.org/10.1111/j.1466-8238.2010.00606.x, 2011.
Sun, T., Wu, C., and Wu, D.: Time-resolved black carbon aerosol vertical distribution measurements using a 356-m meteorological tower in Shenzhen, Theor. Appl. Climatol., 140, 1263–1276, https://doi.org/10.1007/s00704-020-03168-6, 2020.
Tan, Z., Fuchs, H., Lu, K., Hofzumahaus, A., Bohn, B., Broch, S., Dong, H., Gomm, S., Häseler, R., He, L., Holland, F., Li, X., Liu, Y., Lu, S., Rohrer, F., Shao, M., Wang, B., Wang, M., Wu, Y., Zeng, L., Zhang, Y., Wahner, A., and Zhang, Y.: Radical chemistry at a rural site (Wangdu) in the North China Plain: observation and model calculations of OH, HO2 and RO2 radicals, Atmos. Chem. Phys., 17, 663–690, https://doi.org/10.5194/acp-17-663-2017, 2017.
Wang, H., Kiang, C., Tang, X., Zhou, X., and Chameides, W. L.: Surface ozone: a likely threat to crops in Yangtze delta of China, Atmos. Eviron., 39, 3843–3850, https://doi.org/10.1016/j.atmosenv.2005.02.057, 2005.
Wang, X., Manning, W., Feng, Z., and Zhu, Y.: Ground-level ozone in China: distribution and effects on crop yields, Environ. Pollut., 147, 394–400, https://doi.org/10.1016/j.envpol.2006.05.006, 2007.
Woodward-Massey, R., Slater, E. J., Alen, J., Ingham, T., Cryer, D. R., Stimpson, L. M., Ye, C., Seakins, P. W., Whalley, L. K., and Heard, D. E.: Implementation of a chemical background method for atmospheric OH measurements by laser-induced fluorescence: characterisation and observations from the UK and China, Atmos. Meas. Tech., 13, 3119–3146, https://doi.org/10.5194/amt-13-3119-2020, 2020.
Xuan, J., Liu, G., and Du, K.: Dust emission inventory in northern China, Atmos. Environ., 34, 4565–4570, https://doi.org/10.1016/S1352-2310(00)00203-X, 2000.
Ye, B., Ji, X., Yang, H., Yao, X., Chan, C. K., Cadle, S. H., Chan, T., and Mulawa, P. A.: Concentration and chemical composition of PM2.5 in Shanghai for a 1-year period, Atmos. Environ., 37, 499–510, https://doi.org/10.1016/S1352-2310(02)00918-4, 2003.
Yue, X., Unger, N., Harper, K., Xia, X., Liao, H., Zhu, T., Xiao, J., Feng, Z., and Li, J.: Ozone and haze pollution weakens net primary productivity in China, Atmos. Chem. Phys., 17, 6073–6089, https://doi.org/10.5194/acp-17-6073-2017, 2017.
Zhang, Y. and Wang, Y.: Climate-driven ground-level ozone extreme in the fall over the Southeast United States, P. Natl. Acad. Sci. USA, 113, 10025–10030, https://doi.org/10.1073/pnas.1602563113, 2016.
Zhao, X. J., Zhao, P. S., Xu, J., Meng,, W., Pu, W. W., Dong, F., He, D., and Shi, Q. F.: Analysis of a winter regional haze event and its formation mechanism in the North China Plain, Atmos. Chem. Phys., 13, 5685–5696, https://doi.org/10.5194/acp-13-5685-2013, 2013.
Zheng, B., Tong, D., Li, M., Liu, F., Hong, C., Geng, G., Li, H., Li, X., Peng, L., Qi, J., Yan, L., Zhang, Y., Zhao, H., Zheng, Y., He, K., and Zhang, Q.: Trends in China's anthropogenic emissions since 2010 as the consequence of clean air actions, Atmos. Chem. Phys., 18, 14095–14111, https://doi.org/10.5194/acp-18-14095-2018, 2018.
Zheng, B., Zhang, Q., Geng, G., Chen, C., Shi, Q., Cui, M., Lei, Y., and He, K.: Changes in China's anthropogenic emissions and air quality during the COVID-19 pandemic in 2020, Earth Syst. Sci. Data, 13, 2895–2907, https://doi.org/10.5194/essd-13-2895-2021, 2021.
Zhu, J., Chen, L., Liao, H., and Dang, R. J.: Correlations between PM2.5 and ozone over China and associated underlying reasons, Atmosphere, 10, 352, https://doi.org/10.3390/atmos10070352, 2019.
Zong, L., Yang, Y., Gao, M., Wang, H., Wang, P., Zhang, H., Wang, L., Ning, G., Liu, C., Li, Y., and Gao, Z.: Large-scale synoptic drivers of co-occurring summertime ozone and PM2.5 pollution in eastern China, Atmos. Chem. Phys., 21, 9105–9124, https://doi.org/10.5194/acp-21-9105-2021, 2021.