the Creative Commons Attribution 4.0 License.
the Creative Commons Attribution 4.0 License.
 | 06 Feb 2023
Observations of microphysical properties and radiative effects of a contrail cirrus outbreak over the North Atlantic
Tina Jurkat-Witschas
Romy Heller
Ulrike Burkhardt
Helmut Ziereis
Georgios Dekoutsidis
Martin Wirth
Silke Groß
Simon Kirschler
Stefan Kaufmann
Christiane Voigt
Contrail cirrus constitute the largest radiative forcing (RF) component to the total aviation effect on climate. However, the microphysical properties and radiative effects of contrail cirrus and natural cirrus clouds in the same meteorological conditions are still not completely resolved. Motivated by these uncertainties, we investigate an extended cirrus region perturbed by aviation in the North Atlantic region (NAR) on 26 March 2014 during the Midlatitude Cirrus (ML-CIRRUS) experiment. On that day, high air traffic density in the NAR combined with large scale cold and humid ambient conditions favored the formation of a contrail cirrus outbreak situation. In addition, low coverage by low-level water clouds and the homogeneous oceanic albedo increased the sensitivity for retrieving cirrus properties and their radiative effect from satellite remote sensing. This allowed us to extend the current knowledge on contrail cirrus by combining airborne in situ, lidar and satellite observations.
In the synoptic context of a ridge cirrus, an extended thin ice cloud with many persistent contrails and contrail cirrus has been observed for many hours with the geostationary Meteosat Second Generation (MSG)/Spinning Enhanced Visible and InfraRed Imager (SEVIRI) from the early morning hours until dissipation after noon. Airborne lidar observations aboard the German High Altitude and LOng Range Research Aircraft (HALO) suggest that this cirrus has a significant anthropogenic contribution from aviation. A new method based on in situ measurements was used to distinguish between contrails, contrail cirrus and natural cirrus based on ice number and gas phase NO concentrations. Results show that contrail effective radii (Reff) reach at most 11 µm, while contrail cirrus Reff can be as large as 51 µm. Contrail and contrail cirrus mean Reff is 18 % smaller than that of natural cirrus. We find that a difference in Reff between contrail cirrus and natural cirrus survives in this contrail cirrus outbreak event. As for radiative effects, a new method to estimate top-of-atmosphere instantaneous RF in the solar and thermal range is developed based on radiative transfer model simulations exploiting in situ and lidar measurements, satellite observations and ERA5 reanalysis data for both cirrus and cirrus-free regions. Broadband irradiances estimated from our simulations compare well with satellite observations from MSG, indicating that our method provides a good representation of the real atmosphere and can thus be used to determine the RF of ice clouds. For a larger spatial area around the flight path, we find that the contrail cirrus outbreak is warming in the early morning and cooling during the day. The methods presented here and the results will be valuable for future research to constrain uncertainties in the assessment of radiative impacts of contrail cirrus and natural cirrus and for the formulation and evaluation of contrail mitigation options.
- Article
(6375 KB) - Full-text XML
-
Supplement
(711 KB) - BibTeX
- EndNote


Aviation accounts for about 3.5 % of global effective radiative forcing (ERF) from all human activities (Lee et al., 2021). Among the individual aviation contributions, contrail cirrus contributes to more than 50 % of the total aviation ERF component (Lee et al., 2021). Contrail cirrus and natural cirrus are both high level clouds composed of ice crystals that form and evolve in ice supersaturated regions (ISSRs) (Minnis et al., 2004). Contrails form when the hot and humid jet engine exhaust at cruise levels mixes with the cool ambient atmosphere, which at temperatures lower than the Schmidt–Appleman criterion (Schumann, 1996) can lead to a local liquid saturation of the plume. The emitted soot particles act as condensation nuclei to form liquid droplets that freeze subsequently in the young contrails (Bier et al., 2017; Kärcher and Voigt, 2017; Kärcher, 2018; Kleine et al., 2018). In ISSRs, persistent contrails may grow and spread out to form contrail-induced cirrus (Burkhardt and Kärcher, 2011; Schumann et al., 2017). By reflecting incident solar radiation and trapping upwelling radiation within the Earth's atmosphere, they result in an imbalance of radiation budget in both the shortwave (SW) solar and longwave (LW) terrestrial spectrum (Stuber et al., 2006). The net radiative forcing (RF) is positive (Rädel and Shine, 2008; Burkhardt et al., 2018; Gettelman et al., 2021) and RF due to contrail cirrus greatly exceeds that from linear contrails (Burkhardt and Kärcher, 2011; Voigt et al., 2011; Burkhardt et al., 2018). Due to various reasons, including the feedback of natural clouds, the radiative response to the presence of contrail cirrus, the uncertainty in upper tropospheric water budget (including initial contrail properties, contrail cirrus properties and relative humidity), contrail cirrus schemes (see Lee et al., 2021) and the challenges in measuring and separating contrail cirrus from natural cirrus, a best central estimate of the contrail cirrus RF remains challenging. It further limits projections of aviation climate impact and formulations of mitigation options other than carbon dioxide (CO2) emissions (Voigt et al., 2021). Knowledge gaps still exist regarding the large variability in the contrail life cycles (Bier et al., 2017) and optical properties which then determine their radiative response to the climate system (Forster et al., 2007; Grewe et al., 2017).
Contrails may form in, overlap, merge and interact with natural cirrus (Duda et al., 2001; Vázquez-Navarro et al., 2015; Sanz-Morère et al., 2021). Contrail cirrus primarily differs from natural cirrus by their larger ice number concentrations (N) (Heymsfield et al., 2010b; Voigt et al., 2010, 2017; Sanz-Morère et al., 2020). Consequently, microphysical process rates, which control their life cycle, and radiative effects can be very different to those in natural cirrus and are dependent on soot number emissions (Bier et al., 2017). Furthermore, natural cirrus locally optically thickens by embedded contrails (Tesche et al., 2016; Quaas et al., 2021; Schumann et al., 2021a, b), but contrails can also cause a decrease in natural cloudiness (Burkhardt and Kärcher, 2011). These aspects are still the subject of current research (e.g., Verma and Burkhardt, 2022).
Aircraft and spaceborne measurements have provided detailed properties of contrail cirrus. Firstly, contrail cirrus can be detected and separated from natural cirrus to some extent in in situ measurements by combining ice crystal microphysical data with observations of aircraft emissions such as nitrogen oxides (NOx) or aerosols (Voigt et al., 2017, 2021; Bräuer et al., 2021a). Schumann et al. (2017) and Heymsfield et al. (2010a) provide comprehensive overviews of contrail and contrail cirrus properties, and extensive data sets exist on their microphysical properties (e.g., Petzold et al., 1997; Baumgardner and Gandrud, 1998; Jensen et al., 1998a, b; Voigt et al., 2010; Bräuer et al., 2021b), their particle shapes (Gayet et al., 2012; Järvinen et al., 2016; Sanz-Morère et al., 2020) and optical properties (Chauvigné et al., 2018), as well as the aviation influence on them (Jeßberger et al., 2013; Schumann and Graf, 2013; Marjani et al., 2022). Recent attempts used the reduced air traffic situation due to the COVID-19 pandemic to evaluate the aircraft impact on cirrus and climate (Gettleman et al., 2021; Li and Groß, 2021; Quaas et al., 2021; Schumann et al., 2021b; Meijer et al., 2022; Voigt et al., 2022). While the aircraft impact on clouds is confirmed by those studies, the magnitude of the reduced contrail cirrus forcing is variable and depends on the region, the season and the method used to derive the impact. Some studies have taken the North Atlantic and North America with the largest air traffic density as target regions and analyzed the temporal evolution of contrail cirrus coverage, outgoing radiation and properties (Duda et al., 2004, 2013; Atlas et al., 2006; Haywood et al., 2009; Graf et al., 2012; Minnis et al., 2013; Schumann and Graf, 2013).
Early climate models estimated contrail cirrus RF through associating air traffic with regional cirrus coverage and assumed equal radiative efficiencies of contrails and contrail cirrus (Stordal et al., 2005; Rädel and Shine, 2008). Later, the global climate models represented contrail cirrus as a separate cloud class (Burkhardt and Kärcher, 2011; Bock and Burkhardt, 2016). In Chen et al. (2012), contrail cirrus is simply treated as a source for the ice crystal budget of the natural cirrus, mixing the microphysical properties of contrail cirrus and natural ice clouds. Hence, despite substantial progress in recent years, the characterization of the geometrical, optical and microphysical properties of contrails and their evolution within natural cirrus fields as well as the calculation of the radiative impact are still subject to large uncertainties due to instrumental and model limitations and the large number of variables influencing the contrail life cycle (Chauvigné et al., 2018; Kaufmann et al., 2018; Rodríguez De León et al., 2018; Gierens et al., 2020).
In this study, we use in situ data measured during the Midlatitude Cirrus (ML-CIRRUS) experiment (Voigt et al., 2017) from the German High Altitude and LOng Range Research Aircraft (HALO) and simultaneous remote sensing observations (Bugliaro et al., 2011; Vázquez-Navarro et al., 2013; Strandgren et al., 2017a) with high temporal resolution from the Spinning Enhanced Visible and InfraRed Imager (SEVIRI) aboard the geostationary Meteosat Second Generation (MSG) satellite. In particular, we concentrate on one flight on 26 March 2014 over the North Atlantic region (NAR) just off the coast of Ireland, where most of the air traffic from Europe to the US and vice versa takes place. This situation enables us to investigate the properties and radiative effects of contrail cirrus and ambient natural cirrus in an ideal contrail cirrus outbreak. In particular, we develop a new method to classify cirrus along the HALO flight track from in situ measurements based on enhanced NO aircraft gas emissions and N into three representative classes: (1) contrails, (2) contrail cirrus and (3) natural cirrus, where the effect of aircraft emissions is not directly observable. For these classes we evaluate microphysical ice crystal properties and relate them to relative humidity over ice (RHi). Satellite observations from MSG/SEVIRI are inspected visually to characterize the general cloud situation and confirm the presence of various contrails, in line with in situ measurements. In a new approach developed and for the first time presented in this paper, we determine the ice cloud RF that combines in situ and satellite observations with a radiative transfer model (RTM). To this end, we use reanalysis data from ERA5 (Hersbach et al., 2020). Since ERA5 does not simulate the effect of air traffic on clouds, we collect atmospheric profiles of water vapor, liquid and ice clouds from this reanalysis and combine them with the in situ and spaceborne observations to provide inputs to the RTM to compute reflected solar radiation (RSR) and outgoing longwave radiation (OLR). After checking the consistency of our radiative transfer calculations with the corresponding RSR and OLR measured with the Geostationary Earth Radiation Budget (GERB) instrumentation, we are in the position to compute instantaneous RF of this special combination of clouds in the SW and LW spectral range by excluding the ice cloud layer from the radiative transfer calculations, thus yielding a consistent ice-cloud-free irradiance. To be specific, we operate these calculations to an area encompassing the HALO flight path to compute the diurnal cycle of RF in that region, thus exploiting the information from high resolution airborne measurements as well as geostationary satellite observations with the high repetition rate for a holistic view on the radiation budget from this ideal case in the NAR.
Detailed information about airborne and satellite data sets, as well as cirrus remote sensing techniques and the RTM are presented in Sect. 2. Microphysical properties of contrail cirrus and natural cirrus, consisting of cirrus classification, collocation of in situ and observed cirrus, and differences between contrail cirrus and natural cirrus, are summarized in Sect. 3. Radiative effects of contrail cirrus and natural cirrus, including the top-of-atmosphere (TOA) radiation estimation method, and the investigation of cirrus and RF spatial pattern are organized in Sect. 4. Finally, in the summary and conclusions in Sect. 5 we provide guidance about how to transfer our data evaluation techniques to future studies on radiative transfer calculations of contrails and contrail cirrus.
2.1 Airborne measurements
During ML-CIRRUS, the German research aircraft HALO was equipped with a comprehensive suite of novel particle measurement sondes and obtained a broad data set of microphysical properties of contrail cirrus and natural cirrus for process studies and climatological analyses. N, Reff, size distributions, ice or liquid water content (IWC and LWC) and extinction are derived from measurements of CAS-DPOL (Cloud and Aerosol Spectrometer with Detector for Polarization) for particles from 3 to 50 µm and CIP (Cloud Imaging Probe) for the size range of 15 and 960 µm (diameter as the maximum dimension). CAS-DPOL measures the forward scattered light of particles when they pass through a laser beam (Baumgardner et al., 2011). The uncertainty of the particle size measurements is ±16 % (Kleine et al., 2018) for the lower size range and can be up to ±50 % for Reff if the shape of the particles is not known. This translates into an error of up to ±100 % for the IWC derived from scattering cloud probes (Baumgardener et al., 2017). Using 64-element linear photodiode arrays, the CIP acquires two-dimensional shadow images of particles (de Reus et al., 2009). The size resolution is 15 µm, with the uncertainty decreasing considerably with diameter, reaching ±15 µm when particles are larger than 50 µm. N from CAS-DPOL, denoted by NCAS in the following, and from CIP (NCIP) are also combined to an overall N between 10−4 and 102 cm−3. Validation of the measurements has been performed, taking atmospheric and cloud chamber measurements into account (Braga et al., 2017a, b).
As for ambient conditions, the AIMS (Atmospheric Ionization Mass Spectrometer; Jurkat et al., 2016; Kaufmann et al., 2016) was applied to measure the actual water vapor concentration from ambient air using a backward heated inlet. The range of detection is between 1 and 500 ppm with an overall accuracy from 7 % to 10 %. Static pressure and temperature, measured by the BAHAMAS (Basic HALO Measurement and Sensor System; Krautstrunk and Giez, 2012) with an accuracy of 0.3 hPa and 0.5 K, were used to convert water vapor concentration to RHi with an uncertainty of 10 % to 20 % (Kaufmann et al., 2018). During the mission, nitrogen oxide (NO) and the sum of all reactive nitrogen species (NOy) were measured using the AENEAS instrument (AtmosphEric Nitrogen oxides mEAsuring System). This dual channel instrument is based on the well-established chemiluminescence technique combined with catalytic conversion of the NOy components. It has been regularly operated on HALO during several missions (e.g., Ziereis et al., 2022). A detector identical in construction has also been operated on a commercial aircraft as part of IAGOS-CARIBIC (Stratmann et al., 2016). The statistical detection limit is about 7 pmol mol−1 for NO. The overall uncertainty depends on the ambient concentration of NO and ranges from about 8 % to 6 % for volume mixing ratios between about 1 and 0.5 nmol mol−1. The time constant of the instrument for measurements in the upper troposphere is of the order of 1 s. The time offsets of NO have been shifted based on ice number.
Backscatter profiles of clouds and aerosol were acquired by the lidar system WALES (Water vapor Lidar Experiment in Space; Wirth et al., 2009) at the wavelengths of 532 and 1064 nm. In this study backscatter is used to extract information about the cirrus cloud structures, such as cloud top height (CTH), geometrical depth and others. WALES also provides 2D measurements of the water vapor mixing ratio and aerosol particle linear depolarization ratio. The backscatter ratio and aerosol depolarization (perpendicular to parallel) (Biele et al., 2000; Esselborn et al., 2008) are used to create a cloud mask, which helps to discriminate ice clouds. For these clouds the RHi is calculated from the measured water vapor mixing ratio and collocated model temperatures from the European Centre for Medium-Range Weather Forecasts (ECMWF). This instrument and method have also been applied by Groß et al. (2014) and Urbanek et al. (2018), who found that the lidar measurements were accurate when compared with in situ data. The statistical error in the retrieval of water vapor by WALES is estimated to be about 5 % (Kiemle et al., 2008), and the ECMWF temperatures induce an error of around 10 %–15 % in the final RHi values (Groß et al., 2014).
2.2 Satellite remote sensing
SEVIRI is the primary instrument aboard the geostationary MSG satellites, which provides observations of the Earth disk every 15 min from three solar and eight thermal channels with 3 km sampling distance at nadir, as well as its High-Resolution Visible (HRV) channel with 1 km spatial resolution (Schmetz et al., 2002). We use MSG-3/Meteosat-10 observations for the study on 26 March 2014 with a temporal resolution of 15 min.
2.2.1 CiPS
CiPS (Cirrus Properties from SEVIRI) detects cirrus with their transparency information and retrieves the corresponding CTH, ice optical thickness (IOT) and ice water path (Strandgren et al., 2017a). It consists of four artificial neural networks trained using SEVIRI thermal observations, CALIPSO (Cloud-Aerosol Lidar and Infrared Pathfinder Satellite Observations) cloud products, and ECMWF ERA5 surface temperature and auxiliary data. CiPS has been especially developed for thin cirrus and validated against CALIPSO. CiPS detects 20 %, 70 % and 85 % of the ice clouds with an IOT of 0.01, 0.1 and 0.2, respectively. For IOT between 0.35 and 1.8, CiPS has a mean absolute deviation smaller than 50 %. This value increases for IOT between 0.07 and 0.35. For CTHs larger than approx. 8 km, CTH has an absolute percentage error of 10 %, with underestimation for CTH > 10 km at 50∘ N and overestimation for CTH < 10 km at the same latitude. An example is shown in Fig. 1.

Figure 1(a) The false color RGB image from MSG/SEVIRI overlapped with the HALO flight track on 26 March 2014 at 10:45 UTC showing Europe and the eastern part of the North Atlantic Ocean, (b) corresponding 10.8 µm and 12.0 µm brightness temperature differences (BTDs) (K) with overlaid ice clouds, (c) CTH and (d) IOT from CiPS.
2.2.2 GERB and RRUMS
The GERB (Geostationary Earth Radiation Budget) instrument measures broadband solar and thermal components, which are subsequently converted to outgoing and reflected fluxes considering the cloud properties and surface type detected by SEVIRI (Harries et al., 2005). GERB's sampling distance is larger than that of SEVIRI, with a spatial resolution of 44.6 km × 39.3 km but the same image repeat cycle of 15 min. During the processing, the finer spatial resolution of the SEVIRI data is used to improve the original GERB resolution and results in GERB products for 3×3 SEVIRI pixels. In general, the GERB SW and LW fluxes are found to be 7.5 % higher and 1.3 % lower, respectively, compared to products from the Clouds and the Earth's Radiant Energy System (CERES), whose data records are from polar orbiting satellites (Wielicki et al., 1996). The bias of CERES is estimated to be 1 % and 0.5 % for OLR and RSR, respectively.
Based on a linear regression and a neural network, an algorithm named RRUMS (Rapid Retrieval of Upwelling Irradiances from MSG/SEVIRI) was also developed, which estimates OLR and RSR at TOA from SEVIRI at pixel levels. RRUMS shows excellent agreement with OLR from CERES within 1 % and a systematic overestimation of RSR from CERES or GERB of 5 % to 10 % in the worst cases under high viewing angles (Vázquez-Navarro et al., 2013).
2.3 Radiative transfer model
To calculate broadband solar and thermal irradiances at TOA for ice particles, the sophisticated radiative transfer package libRadtran is used (Mayer and Kylling, 2005; Emde et al., 2016). Water and ice clouds are represented in this model in detail and realistically. Optical properties of water droplets are computed using the Mie theory and tabulated as a function of wavelength and Reff. Ice crystals are not spherical in shape and habits (Letu et al., 2016), and for this simulation the parameterization of Baum et al. (2014) for ice crystal habits has been employed to define the conversion from optical to microphysical properties. In analogy to the MODIS products (Yang et al., 2018), we select rough aggregates for ice crystal shape (see Sect. 4 for a discussion about this choice). The selected one-dimensional radiative transfer solver is DISORT (Discrete Ordinate Radiative Transfer) 2.0 by Stamnes et al. (2000) with 16 streams. LibRadtran recommends the REPTRAN band parameterization with a spectral resolution of 15 cm−1 for spectral calculations (Buehler et al., 2010; Gasteiger et al., 2014).
We exploited positions of ice clouds from ML-CIRRUS measurements and CTHs estimated from WALES observations to collocate the clouds probed by HALO with the SEVIRI observed contrail cirrus and natural cirrus. We notice that satellite observations are functions of both time and space. Since the temporal frequency of in situ observations is 1 Hz, various HALO measurements are located inside each SEVIRI pixel. In general, time series of observations are produced with the original temporal resolution of the given instrument.
In this section, we describe how airborne data from HALO and images from satellite remote sensing are combined to understand microphysical properties of contrail cirrus and natural cirrus and the corresponding variation when contrails transit into contrail cirrus within the contrail life cycle.
3.1 General situation
In the night and the very early hours of 26 March 2014 a ridge cirrus cloud band built up north of Ireland down to the southern tip of Portugal (Fig. 1). Close to Iceland as well as to the southwest of Ireland, this cirrus cloud thickened (optical thickness larger than 1 at 10:45 UTC, Fig. 1d). While exactly off the coast of Ireland, in coincidence with the eastbound morning and westbound afternoon air traffic to and from the US, many linear structures can be seen in SEVIRI observations (Fig. 1, especially Fig. 1b where brightness temperature differences – BTDs – between the SEVIRI channels at 10.8 and 12.0 µm are shown) and the ice cloud is thinner (optical thickness around 0.3 at 10:45 UTC). Please notice that Fig. 1 is enlarged in Fig. 2. Considering that the peak of eastbound morning air traffic is approx. at 03:00 UTC (Graf et al., 2012), under favorable conditions with low temperature and high humidity contrails induced from these aircraft are expected to form and live for hours such that they can be identified in MSG observations in the morning of the same day. This cloud band evolves with time towards the south, and in correspondence of the Ireland coast the ice clouds dissipate around noon. In addition, this thin bluish/violet ice cloud band partly overlaps with a liquid water cloud field below (yellowish clouds in the false color composite in Fig. 1a).
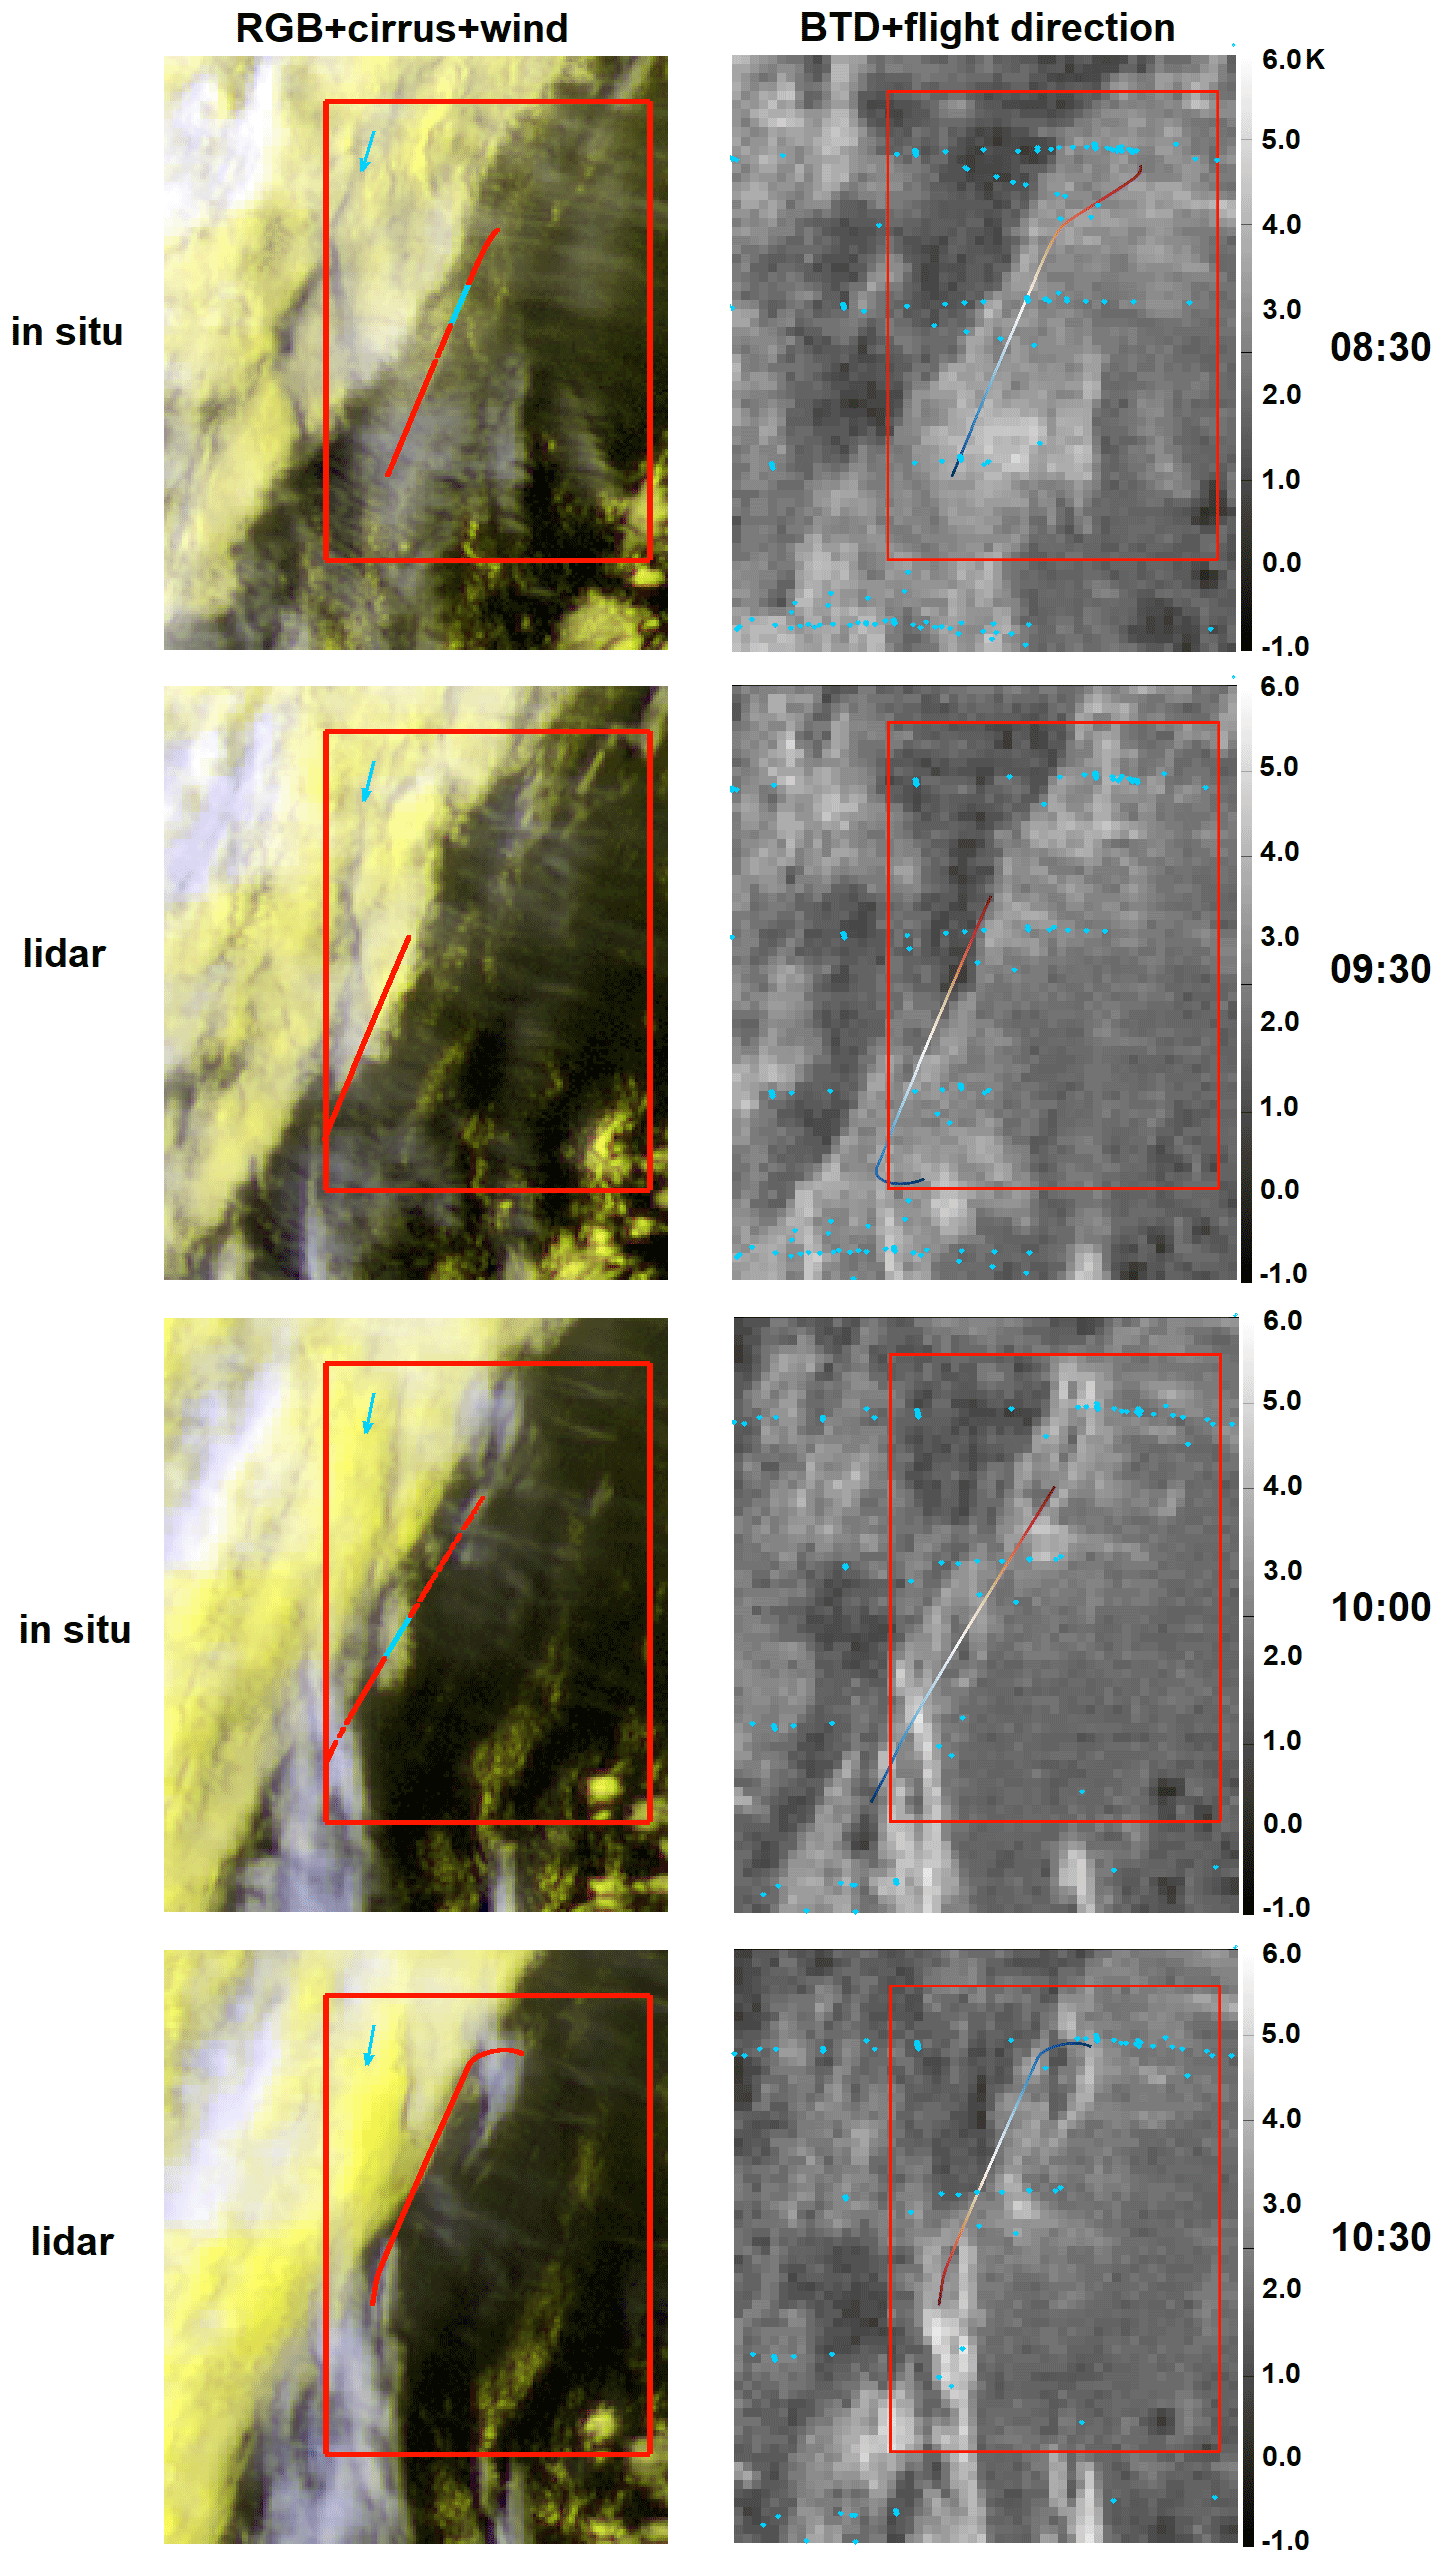
Figure 2Time series of contrail cirrus and surrounding clouds from MSG/SEVIRI observations over the NAR corridor on 26 March 2014. The first column shows RGB composite with overlaid cirrus, low-level liquid clouds pixels and in situ/lidar HALO leg at close time. The red and green lines of the HALO flight track represent contrail cirrus and natural cirrus, respectively. The blue arrow indicates the wind direction almost perpendicular to the line-shaped structures of the contrail cirrus. The second column shows 10.8 µm and 12.0 µm BTD (K) with overlaid cirrus pixels. Blue points show air traffic data set interpolated to MSG grid from EUROCONTROL's Model 3 (M3) and North Atlantic Tracks (NATS). The color of the HALO flight track indicates the flight direction. HALO flies from the red to the blue part. Top to bottom is 08:30, 09:30, 10:00 and 10:30 UTC. The red area is investigated in Sect. 4.2.
Due to its approx. 3.5 km × 4.5 km spatial resolution, SEVIRI can only observe contrails that have already grown larger (and thicker), while young contrails cannot be detected (Mannstein et al., 2010). Nevertheless, the satellite observations indicate that because of these favorable meteorological conditions and the relatively high air traffic density in this region, contrails from various aircraft could form over a long time period (∼12 h) that overlaps with “the remnants” of previous contrails. Thus, air traffic in this area has a strong impact on cloudiness on 26 March 2014.
On 26 March 2014 the HALO aircraft started from Oberpfaffenhofen in Germany at approximately 05:30 UTC and probed the cirrus over NAR from around 08:00 to 11:30 UTC with a race track pattern between approx. 51.5 and 54∘ N at a longitude of ca. −14∘E (−13.6 to −14.4∘E), see the flight track in Fig. 1a and also Voigt at al. (2017, Fig. 4). In this area, HALO flew three lidar legs almost perpendicular to the NAR tracks (07:57–08:35 UTC, south to north; 09:17–09:30 UTC, north to south; and 10:21–10:52 UTC, south to north), each followed by in situ legs at different altitudes.
Figure 2 presents the temporal variation of contrails and surrounding clouds with one HALO in situ/lidar leg at close time and air traffic data 2 to 3 h before, from 08:30 (the first in situ leg) to 10:30 UTC (the third lidar leg). In addition, the area around the flight path is investigated in Sect. 4.2 in more detail, but that serves here as orientation to easily capture the temporal evolution of the ice clouds. The wind speed in the east–west direction fluctuates around 0 while winds in the north–south orientation drive the ridge cloud to move southwards (blue arrows in Fig. 2 indicate wind direction at 225 hPa from ERA5). The aircraft fly to and from Europe. In the BTD images – where SEVIRI brightness temperatures at 10.8 and 12.0 µm are subtracted from each other – the black areas are caused by the low-level clouds, while the bright pixels correspond to thin cirrus. Small ice crystals, for instance in contrails, correspond to the largest BTDs. From 08:30 UTC, many thin lines (contrails) are seen in the false color RGBs in the first column in Fig. 2, where the HRV channel was also used. They run parallel to most air traffic routes (blue diamonds in the second column, the description of the air traffic data set in Sect. S1 in the Supplement) and are intersected perpendicularly by the HALO route. Some of the contrails are also visible in the BTD pictures (the second column in Fig. 2), that have a lower spatial resolution than the HRV channel, thus indicating the presence of small ice crystals. These contrails form a thin cirrus layer, potentially of anthropogenic origin but also with natural ice clouds (see discussion of Fig. 3 below). In the south, the ridge cirrus is thicker and no contrails can be observed. At 09:30 UTC, the flight area is dominated by contrails. With time, from 08:30 to 10:30 UTC the typical contrail lines become always fainter and fewer in number. Thus, contrails begin either to dissipate or to lose completely their linear shape due to wind shear such that they turn out to be undistinguishable. However, contrails can still be observed in the northeastern part of the satellite images at later times.
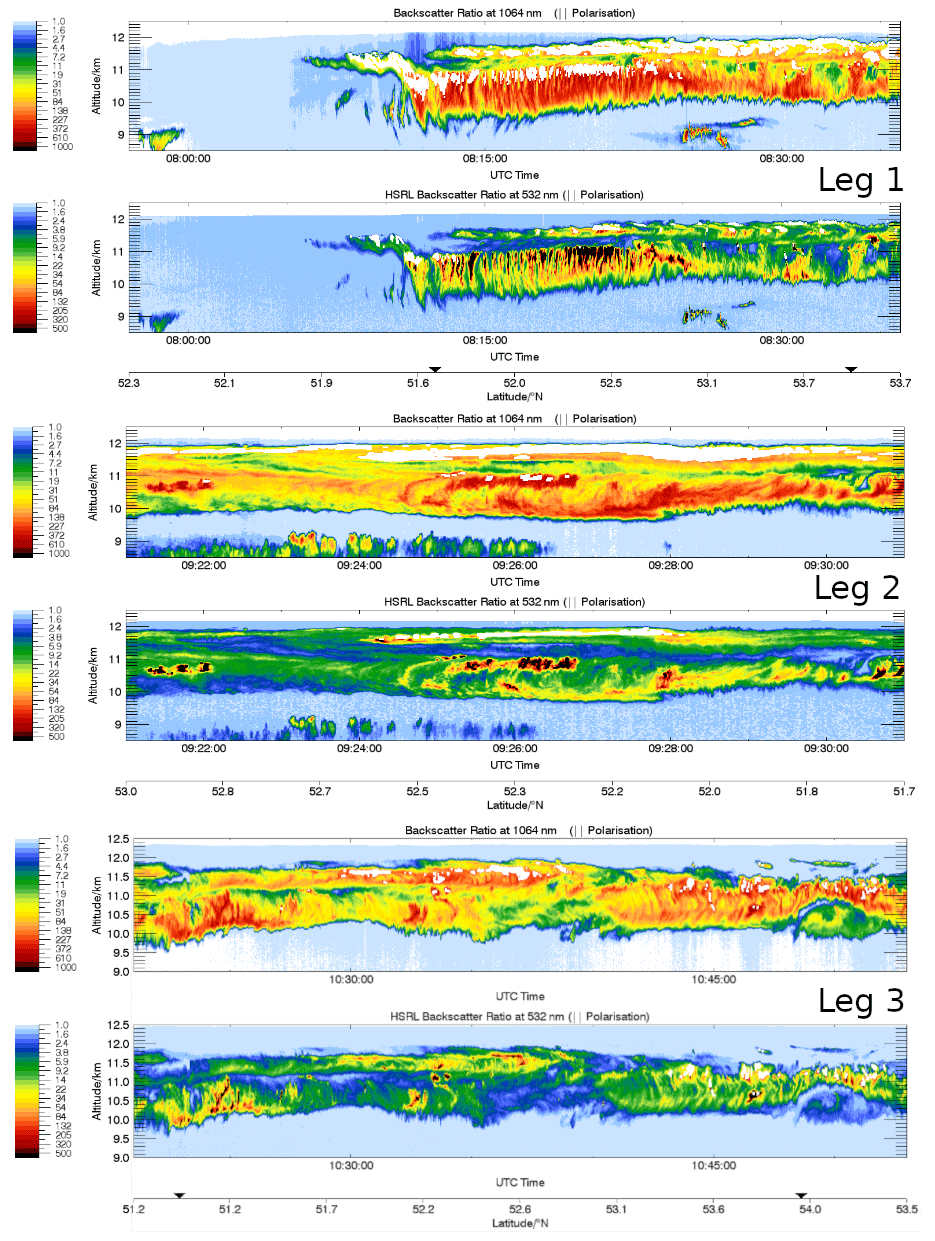
Figure 3The three panels show the three lidar legs with backscatter ratios at 1064 and 532 nm.
Figure 3 presents the backscatter ratio at 532 and 1064 nm from the WALES lidar measurements in that sequence. The lidar data show that the geometrical thickness of high-level clouds reduces from ∼2.0 km at 08:30 UTC to ∼1.5 km at around 11:00 UTC. The temporal evolution of CTH from WALES shows that the cloud first reached up to approximately 12 km and slowly descended to slightly above 11.5 km, with backscatter values becoming smaller with time, in line with the passive observations that indicate dissipation of the cloud during the day. For the investigation of contrails from in situ measurements we concentrate on the time period between 08:30 and 11:30 UTC, but we extend this time to cover the period from 06:00 to 14:00 UTC in Sect. 4.2.
Considering the three WALES legs in more detail (Fig. 3), in leg 1 between 08:10 and 08:25 UTC there is a series of connected fall streaks with high backscatter at a height of 11 km below a thin ice cloud layer top at 12 km. These structures resemble those in the large eddy simulations by Unterstrasser et al. (2017a, b) where they considered contrails within natural cirrus. Thus, these bright spots with their fall streaks can probably be identified as contrails, with many small ice particles causing high backscatter and with larger ice crystals sedimenting down. For leg 1, these contrails make up the majority of the cloud in this temporal interval. The presence of developed fall streaks is a hint that these contrails are aged (>30 min). Unfortunately, the high WALES backscatter inhibits the determination of RHi (Fig. S1) for these bright spots, but the upper level of the clouds, just below the potential contrails, shows occasional ice supersaturation, with RHi above 100 %.
Lidar leg 2, much shorter than the other two, also shows the presence of some spots with elevated backscatter ratios, although less numerous, at an altitude of 11 km at 09:26 UTC. Unlike leg 1, many high backscatter spots do not show extended fall streaks, suggesting the presence of younger contrails in addition to older ones. Furthermore, the top ice layer above 11.5 km also contains some very high backscatter areas. Finally, also above 9 km some clouds are visible that resemble contrails (or a dissipating cirrus). Thus, in this leg the contrail-like structures do not fill the entire cloud as in leg 1, but there are indications of young and older contrails, in addition to natural cirrus. The last lidar leg 3 took place 1 h later and also shows various bright spots at different levels, from 10 to almost 12 km, and elongated vertical structures that remind of those in leg 1. The cloud as a whole is slightly lower than that in leg 1, with ragged edges especially at its lower border suggesting that the cloud is sublimating and thinning out. This is confirmed by the RHi observations of WALES for leg 3 in Fig. S1 in the Supplement, where subsaturation is indicated especially at the lower and upper edges, while around 10.5 km at selected locations RHi reaches saturation. These WALES measurements are indicative for the cloud probed between 08:00 and 11:30 UTC but cannot directly be compared to in situ observations taken at different times in between.
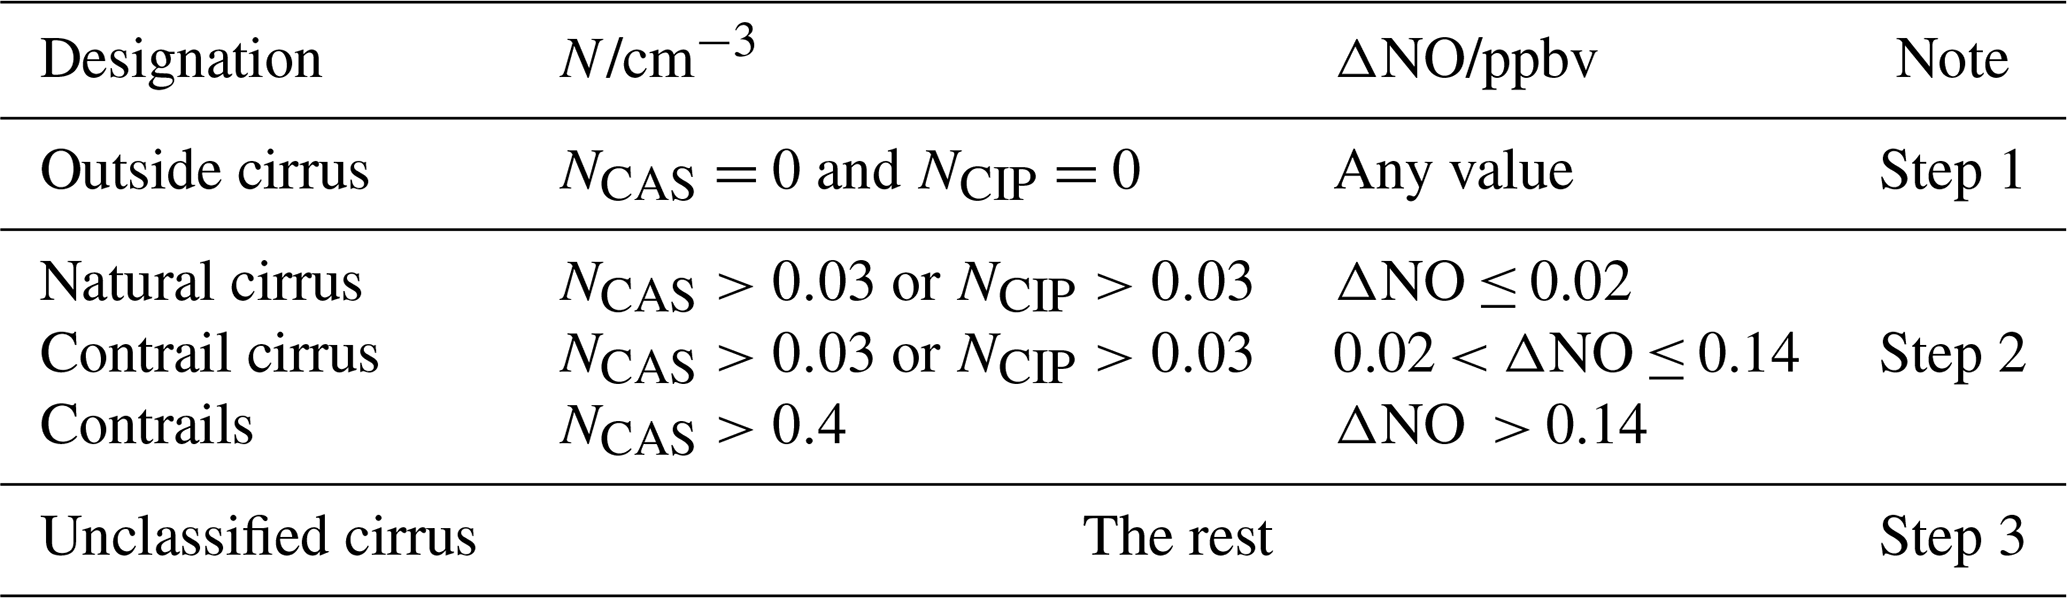
Table 1Cirrus classification according to microphysical properties (N), and tracer measurements (NO) measured by instruments aboard HALO.
3.2 Properties of contrails, contrail cirrus and natural cirrus
3.2.1 Identification of contrails, contrail cirrus and natural cirrus
In this section, we improve a method already used in Voigt et al. (2010) to identify where aircraft emissions are fresh, older or not detectable by using in situ measurements. These three situations are assigned to contrails, contrail cirrus and unperturbed cirrus, also called natural cirrus. The goal is to investigate microphysical and optical properties of these clouds. Figure 4 shows the full sequence of the airborne in situ measurements of N (NCAS, NCIP), Reff, NO, cirrus (identified using the method in this section), RHi, latitude and altitude as a function of time between 08:30 and 11:30 UTC. N for both instruments, CAS and CIP (NCAS and NCIP) and Reff (Fig. 4a and b) indicate the occurrence of cirrus at the flight levels between 10 and 13 km (Fig. 4g). According to the dilution equation by Schumann et al. (2017) and assuming 1000 particles per cm3 for 1 s-old contrail, many contrails probed here are more than 1 h old. Furthermore, some contrails are also visible in the low-resolution MSG/SEVIRI satellite images (BTDs in Fig. 2) and therefore are at least 1–2 h old (Vázquez-Navarro et al., 2015). Figure 4c thus shows variable NO concentrations and various peaks. Since other sources of NO are unlikely in this situation (no thunderstorms in the previous 12 h, no wildfires), we assume that the NO concentration increases correspond to aviation exhausts, with different peak heights caused by various factors such as contrail age, dilution and aircraft type (Voigt et al., 2010; Jurkat et al., 2011; Jeßberger et al., 2013; Schumann et al., 2013). In fact, after the emission, NO is mixed with the surrounding air and dilutes with increasing plume age such that its measured mixing ratio can be used as a rough indication for contrail age. Also, for contrails, initial ice number concentrations N are high due to the high number of soot particles emitted by the engine (Schlager et al., 1997; Kleine et al., 2018; Bräuer et al., 2021a), and N decreases due to dilution (Schumann et al., 1998) and further processes (Bier et al., 2017; Unterstrasser et al., 2017a). High NO emissions without coincident ice crystal observations correspond to situations where the Schmidt–Appleman criterion is not satisfied and no contrail is formed. This study, similarly to Voigt et al. (2010), uses N and NO to evaluate contrail evolution. Since the contrails detected during this flight are older, the lower threshold for the particle size was chosen to be 3 µm to neglect any influence from aerosol particles in the size range below 3 µm. This is consistent with other cirrus and contrail cirrus studies (Voigt at al., 2017; Righi et al., 2020).
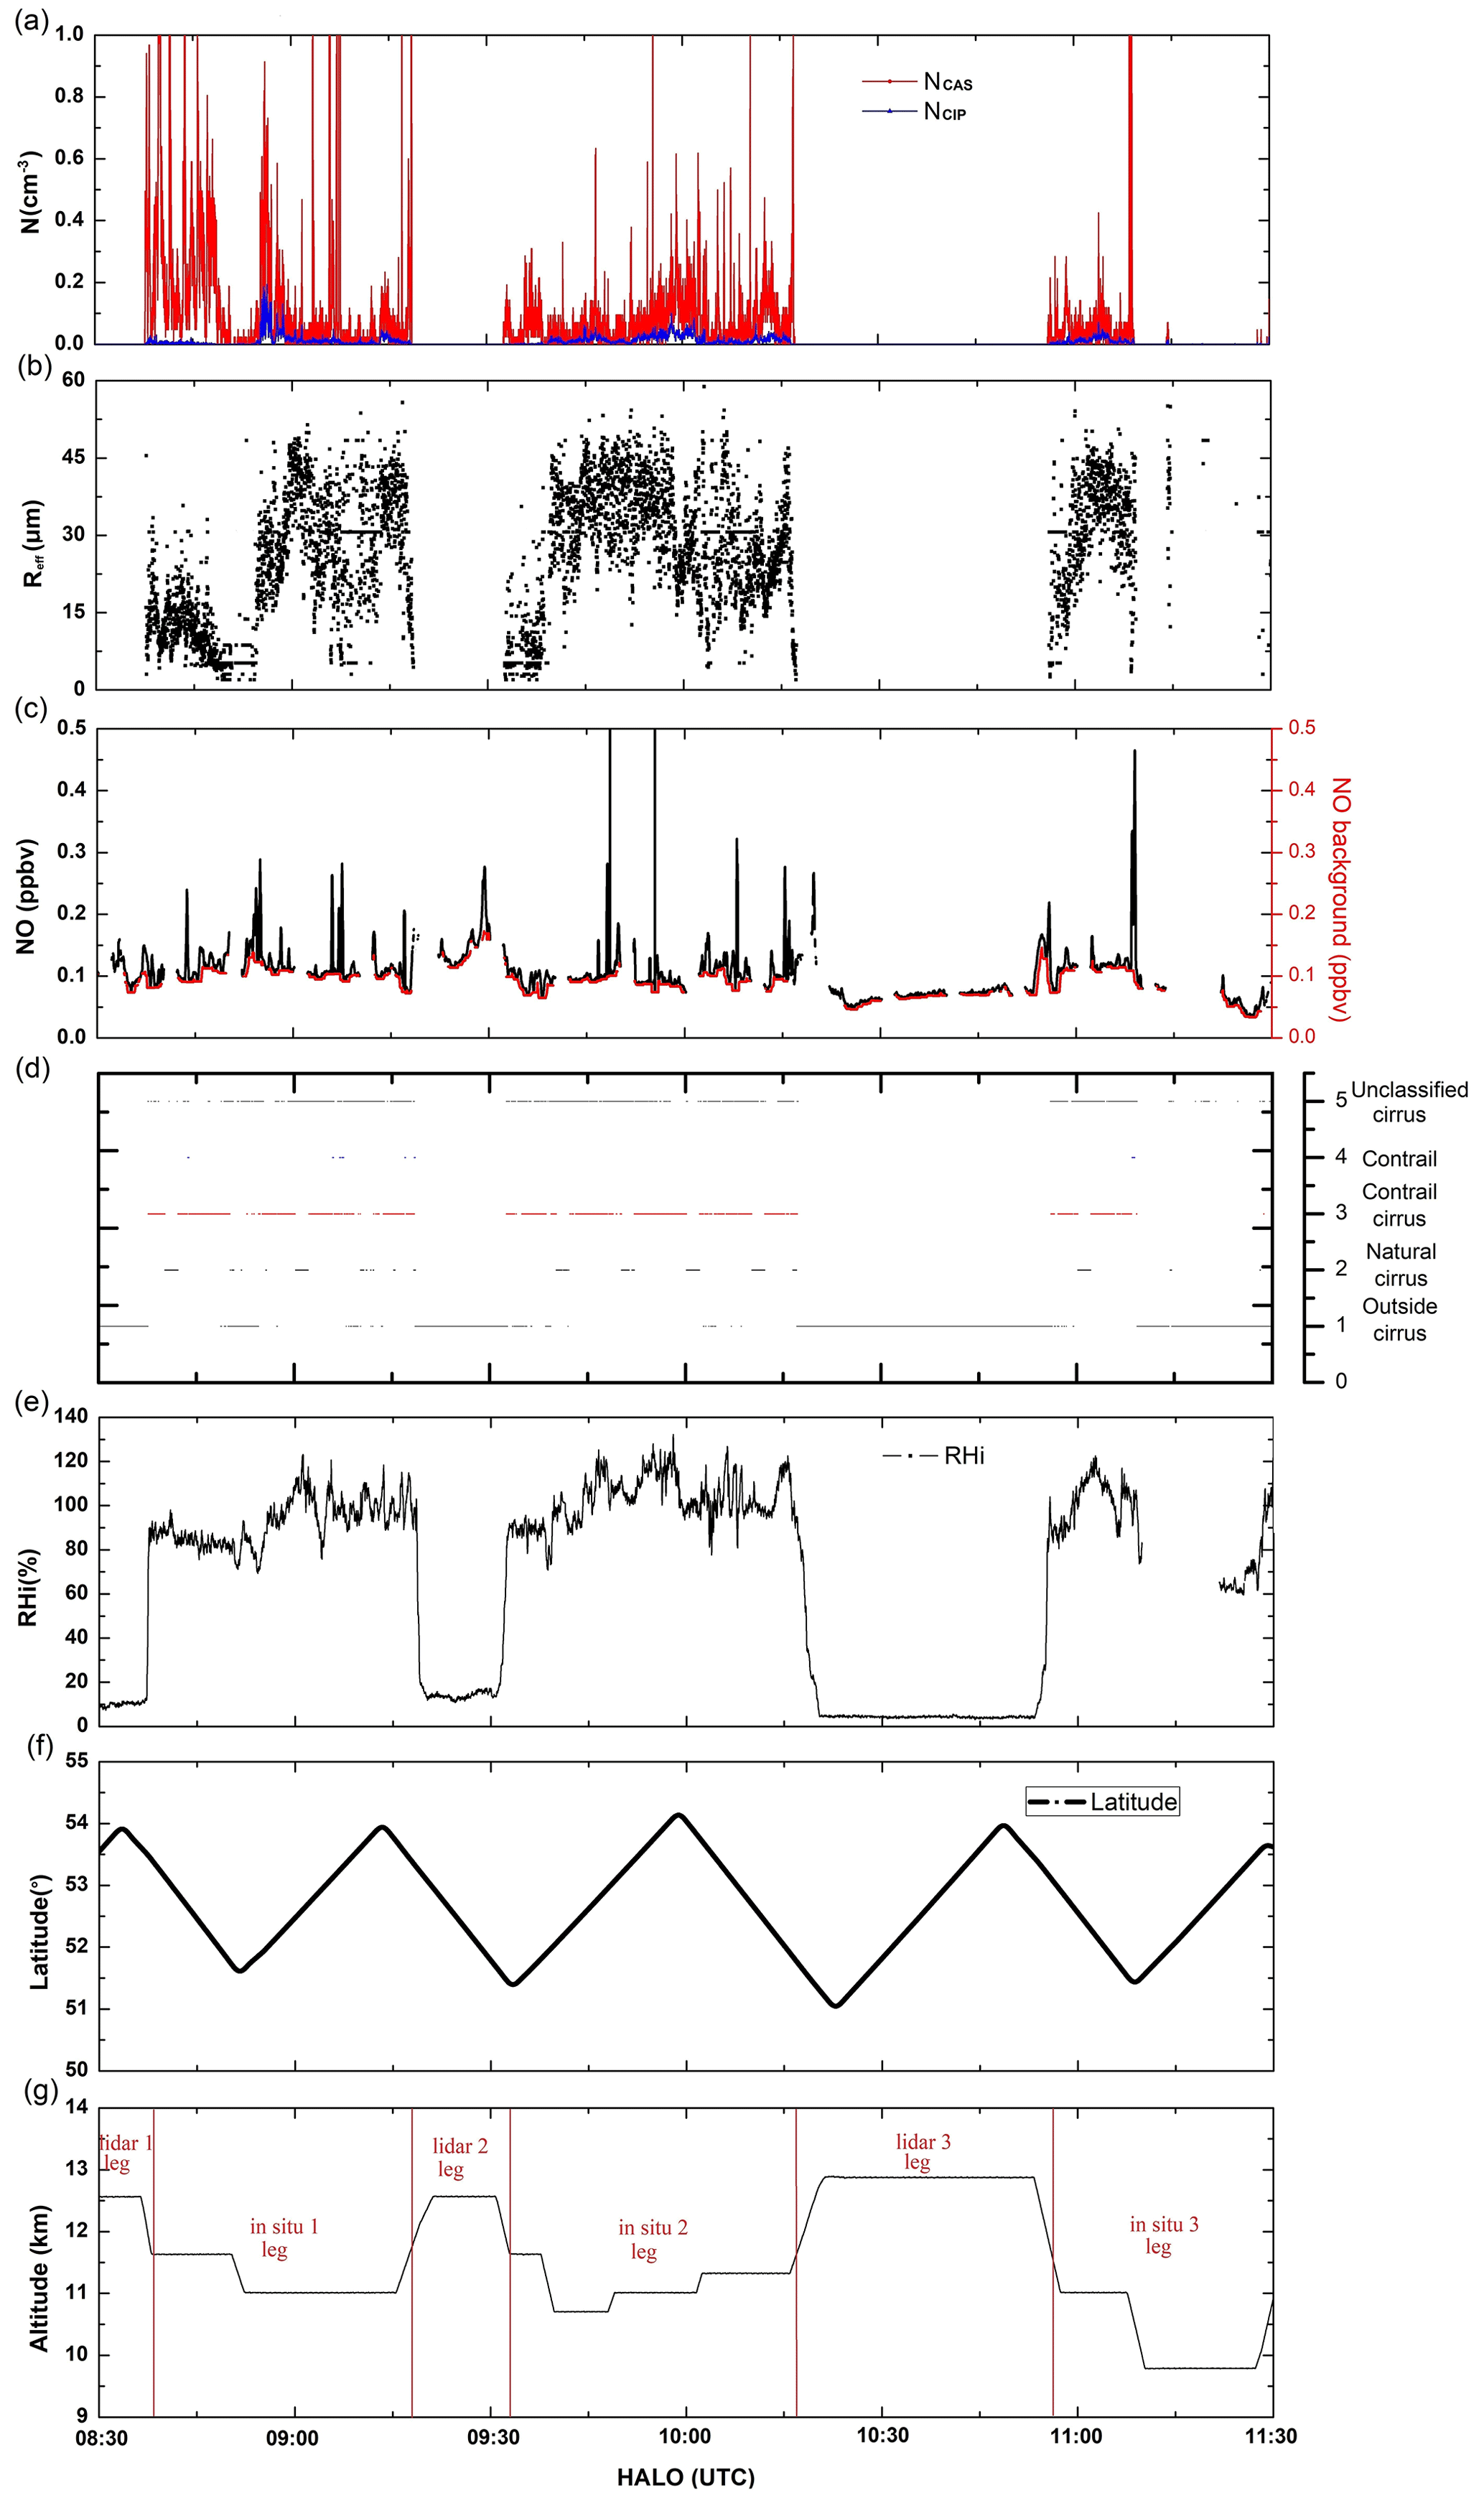
Figure 4In situ measurements of HALO on 26 March 2014 over the North Atlantic region, including (a) N, (b) Reff>1.5 µm, (c) NO and NO background, (d) cirrus classification, (e) RHi, (f) flight latitude and (g) altitude.
First, we determine dynamically the NO background concentration NOb(t) at a given time t by taking the minimum NO value in a 60 s sliding window around this time (Fig. 4c):
NOb(t) takes care of the natural variability of NO in this situation. Notably, we use the RANSAC algorithm (Fischler and Bolles, 1981) to interpret NO outliers and confirm that they have not hit the NO background but the peaks of NO values. The difference between NOb(t) and the NO(t) at each time t is termed ΔNO(t)
In a further step we consider N to classify contrails.
In accordance with Table 1, we first distinguish measurements in cirrus from “outside cirrus” when NCAS and NCIP are zero in step 1, and then separate “contrail cirrus” and “contrails” from “natural cirrus” when NO is higher than the background and NCAS or NCIP is larger than 0.03 cm−3 in step 2, reflecting the impact of air traffic. The rest is labeled as “unclassified cirrus” in step 3. This class contains on one side those clouds that we cannot classify and likely consists mainly of natural cirrus. On the other side, ice cloud measurements with high ΔNO (>0.14 ppbv) but moderate N (NCAS≤0.4 cm−3) do also fall into this category and should represent observations in younger plumes where few ice crystals could form (maybe because temperature is close to the Schmidt–Appleman criterion) or because ambient air is subsaturated leading to the evaporation of a considerable fraction of newly formed (small) ice crystals. Summarized, natural cirrus is identified when ice crystals are present with either NCAS or NCIP larger than 0.03 cm−3 and NO close to the background value, i.e., ΔNO ≤ 0.02 ppbv; contrail cirrus is characterized by moderate values of NO, i.e., 0.02 ppbv < ΔNO ≤ 0.14 ppbv, and NCAS or NCIP>0.03 cm−3; contrails are assumed to consists of many small ice crystals, NCAS>0.4 cm−3, and high NO peaks, i.e., ΔNO > 0.14 ppbv. The remaining cirrus is denoted as “unclassified cirrus”.
The determination of ΔNO and N thresholds are explained in Sect. S3 and Fig. S2. In total, from 08:30 to 11:30 UTC for each aircraft measurement with a frequency of 1 Hz we have classified 49 contrail observations, 1018 contrail cirrus observations and 2342 natural cirrus observations in Fig. 4d from in situ measurements. Unclassified cirrus encompasses 2472 cases, with 94 of them having ΔNO > 0.14 ppbv. At least 31 % of all classified cirrus was in contrails or contrail cirrus, confirming the indications gained from MSG and WALES in Sect. 3.1 about the large number of contrails.
3.2.2 Effective radii
Considering the entire flight and separating Reff measurements according to our classification enables us to study the statistical properties of the ice crystal sizes. From Fig. 5, contrail cirrus Reff probed from airborne instruments are smaller than those of natural cirrus, with an average Reff of about 22 µm. The natural cirrus has an average Reff of 27 µm, which is at the lower end of the particle size distributions observed in natural cirrus (Schröder et al., 2000). The mean radii of contrails or contrail cirrus from in situ measurements is 18 % smaller than that of natural cirrus. From contrails to contrail cirrus, the mean and medium Reff mainly show an increasing tendency by an average difference of 13 µm (144 %) for this situation. Despite the uncertainty of probed particle sizes, the radii of natural cirrus reached up to 60 µm, while the majority of maximal Reff of contrail cirrus topped at 51 µm, in agreement with findings of Voigt et al. (2017). This is consistent with the physical picture that contrails form initially as small particles and increase in size by water vapor uptake in ice supersaturated air. If no supersaturation is present, contrails dissipate. Still, contrail cirrus as well as natural cirrus can consist of sublimating particles when air becomes subsaturated (Kübbeler et al., 2011).
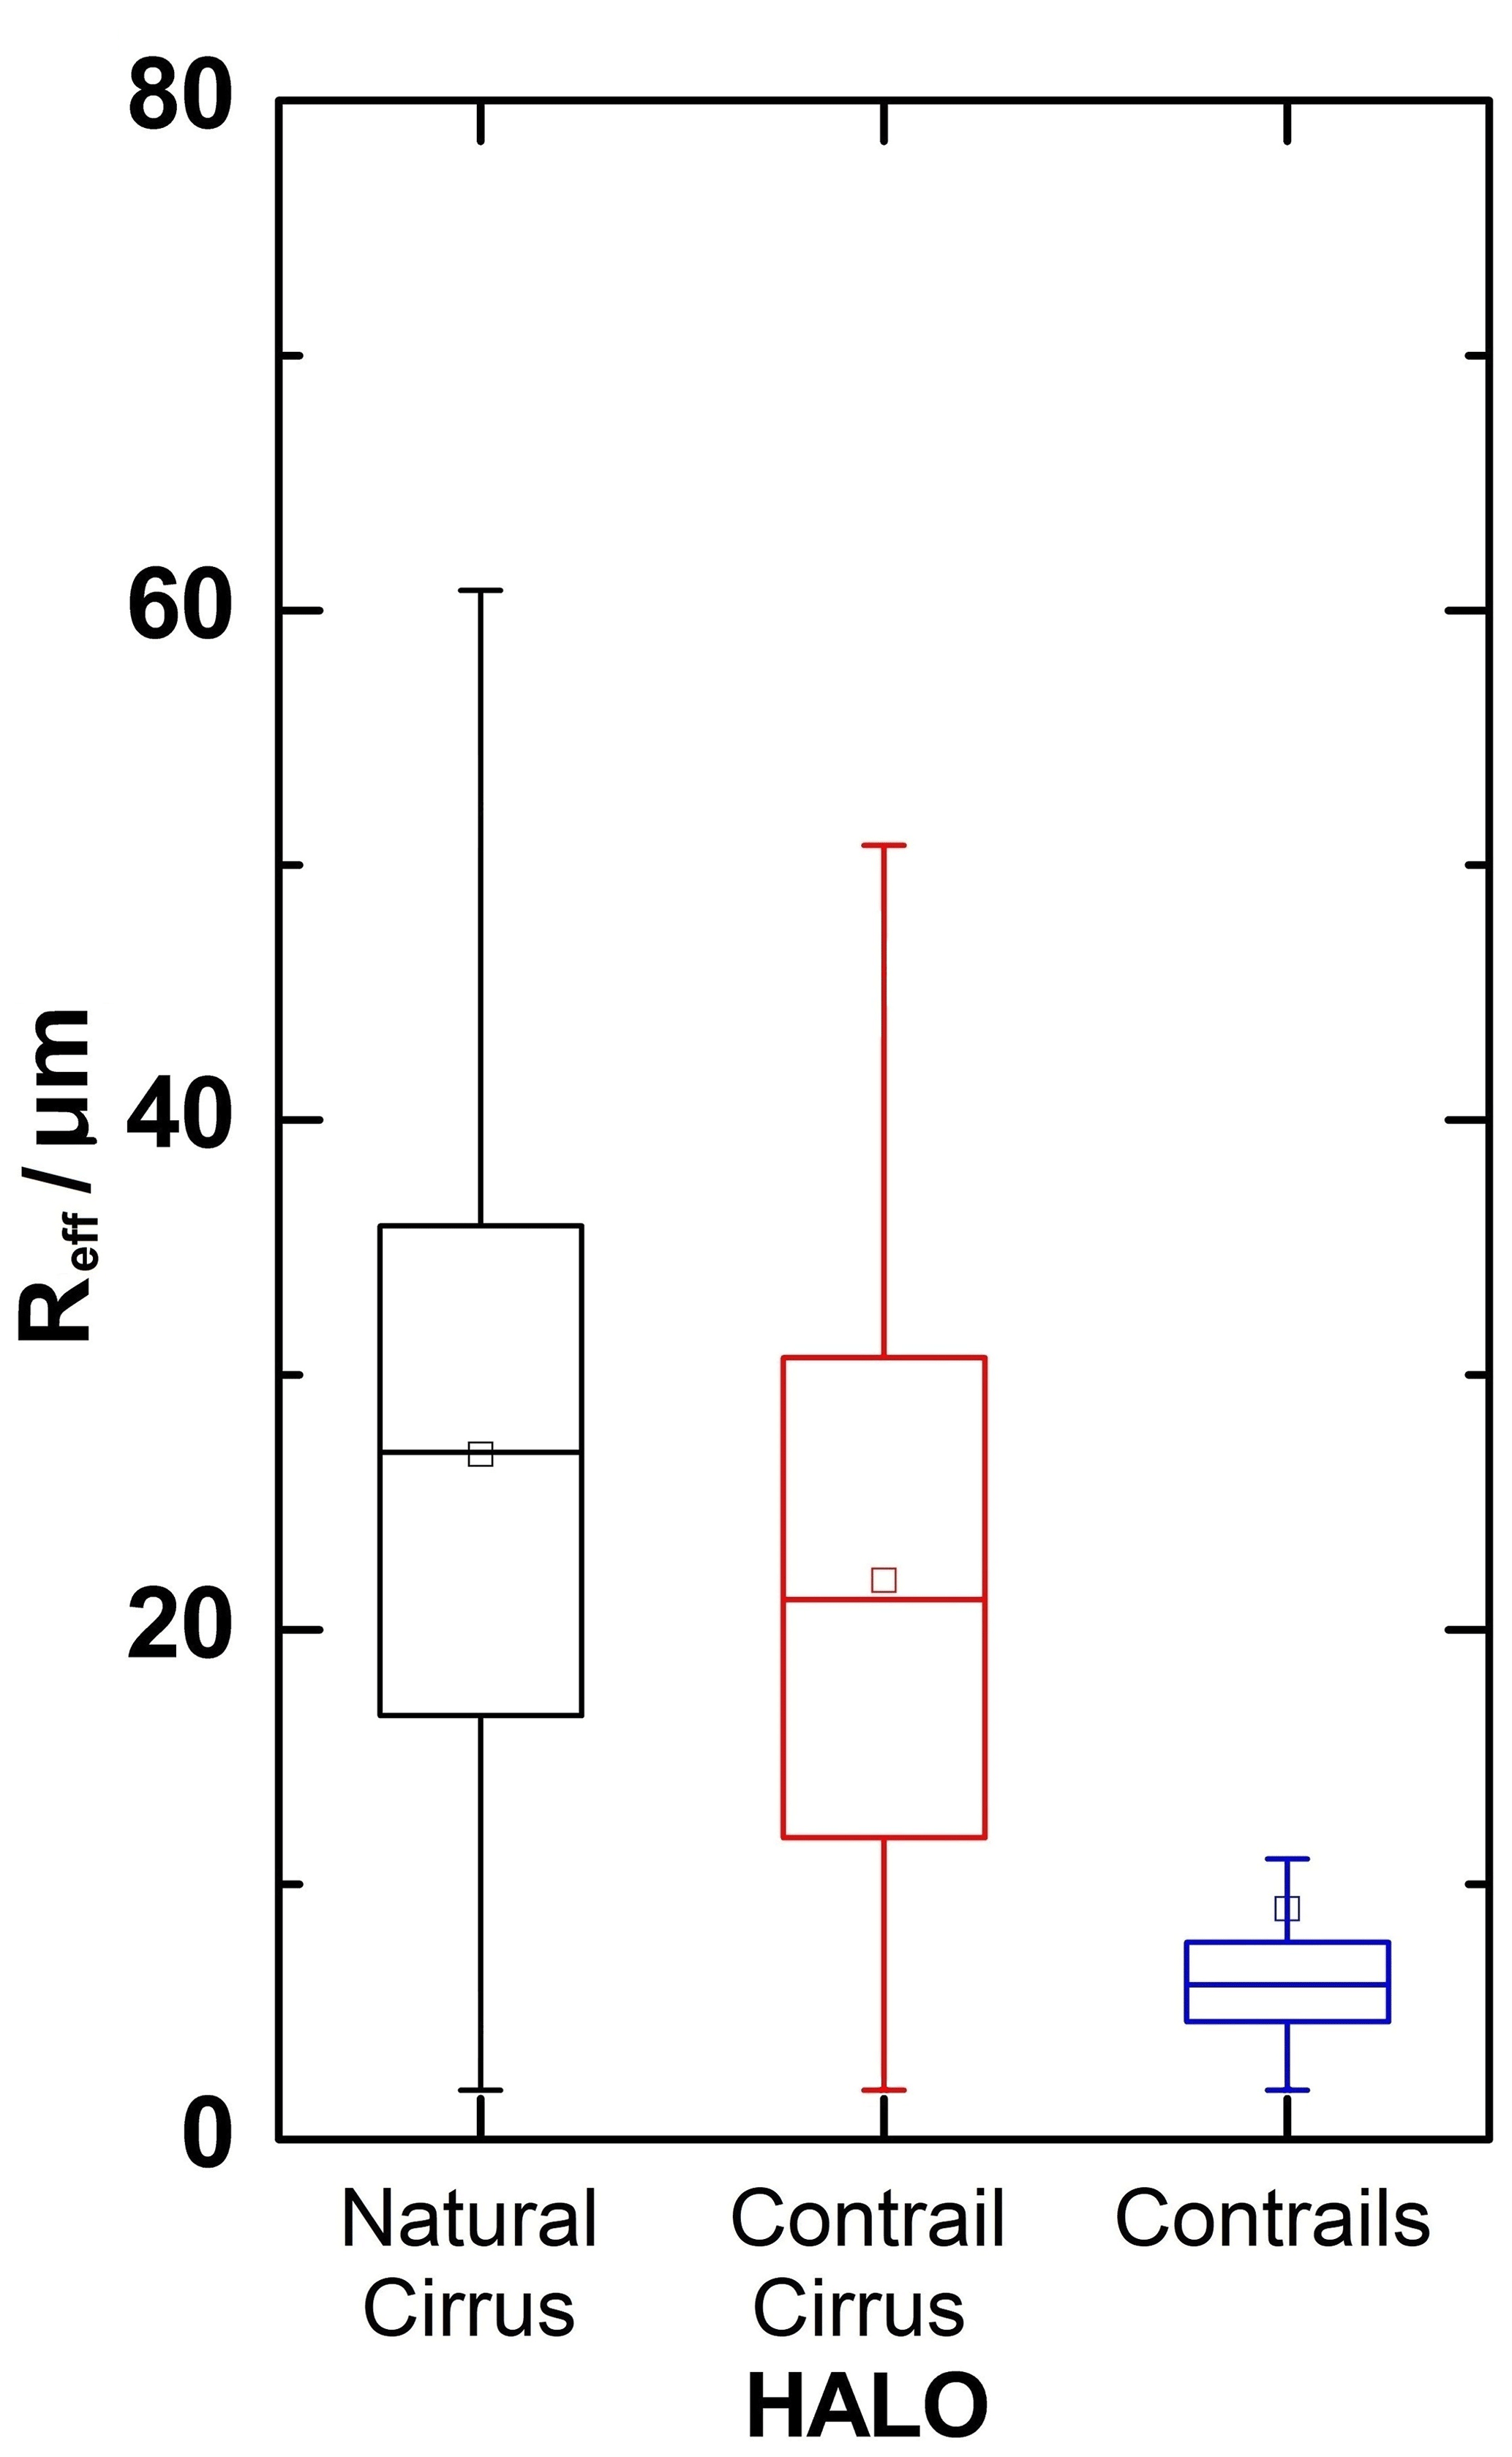
Figure 5Reff of natural cirrus, contrail cirrus and contrails from HALO in situ measurements. Each bar contains the information of the maximum, minimum, interquartile range (25th percentile to 75th percentile), median (horizontal line) and mean (square) Reff.
In sum, satellite, lidar and in situ measurements give combined evidence for an ideal case of a contrail cirrus outbreak with a high fraction of contrails and contrail cirrus embedded in natural cirrus. In the following, we investigate its radiative impact.
Here, we develop a new estimation method for TOA net instantaneous cirrus RF that relies on satellite and in situ observations. TOA irradiance of the contrail cirrus outbreak can be observed, but the comparable situation without ice clouds has to be obtained from another source, e.g., from the surroundings (e.g., in Vázquez-Navarro et al., 2015, for contrails) or from model simulations (Haywood et al., 2009, for contrail cirrus). The instantaneous net RF at TOA is the change of the total irradiation under a situation with cirrus minus the irradiances in the same situation without cirrus. In fact, the SW component of the cirrus RF RF can be diagnosed as
Notice that SW↑cirrus corresponds to the RSR that can be observed by the satellite. Similarly, the LW RF can be diagnosed from
Again, the cirrus term LW↑cirrus in Eq. (2) corresponds to the OLR that can be computed from MSG. The net cirrus RF is defined as
However, the two values (TOA irradiance with cirrus and without cirrus) are similar in size since contrail cirrus represent a small perturbation. In fact, both in Vázquez-Navarro et al. (2015) and Haywood et al. (2009) taking the difference between the cirrus contaminated and the cirrus-free irradiances leads also to negative values of RF in the thermal range (OLR with ice clouds is larger than OLR without ice clouds) or to positive RF in the solar range (RSR with ice clouds is smaller than RSR without ice clouds). This is unphysical and we would like to avoid it. To this end, in Sect. 4.1 we developed a new method based on RTM calculations exploiting airborne measurements, satellite observations and ERA5 model atmospheric data that produces TOA irradiance fully consistent for both cirrus and cirrus-free regions. So finally, to ensure that TOA irradiance calculated this way is realistic, we compare our RTM simulations of RSR and OLR for the cirrus contaminated case with satellite observations of RSR and OLR from RRUMS at pixel level. An additional comparison on a 3×3 pixel scale with the more accurate GERB products is performed to assess the RRUMS accuracy on this particular day (Sect. S4 and Fig. 3).
4.1 RTM simulations of TOA irradiance
In this section we illustrate the new method used to derive instantaneous cirrus RF and show that it compares well to observations of RSR and OLR by RRUMS. In particular, we explain a 2-step method to compute both cirrus-free and cirrus influenced TOA irradiances. First, an atmosphere is set up as input to the RTM that contains a realistic representation of the situation observed, including in particular all clouds. Then in a second step the ice clouds are removed, for which the RF is to be computed. This provides the cirrus-free reference TOA irradiance for the calculation of cirrus RF. The basic setup of the RTM is described in Sect. 2.3. Every RTM calculation needs an atmospheric state as input. This is in part obtained from ECMWF ERA5 reanalysis data (Hersbach et al., 2020). All 137 model levels are used. The horizontal and temporal resolution are and 1 h. We derived temperature profiles, logarithm of surface pressure, specific humidity, ozone mass mixing ratio and land or sea mask. Densities of gaseous water (H2O) and ozone (O3) are derived from specific humidity and O3 mass mixing ratio. CO2 is set to a volume mixing ratio of 400 ppm. Vertical profiles of liquid clouds are also extracted from ERA5 data. We choose vertical profiles close to the HALO flight time, i.e., with a time difference of 30 min at most between model and in situ measurements. We rely on the fact that reanalysis data should provide a realistic description of cloud properties and cloud positions, but we accept that this procedure might cause small temporal shifts such that observations close to cloud edges might not be represented in an optimal way through the model data. However, we refrain from interpolating cloud properties in time since also this procedure would create artificial clouds that do not exist in reality, especially in locations where no cloud is present at a given time but it is there at the next time. For liquid clouds, the parameterization by Bugliaro et al. (2011, 2022) is applied for creating Reff profiles using IWC and temperature from ERA5. The solar zenith angle corresponds to synchronous SEVIRI observations. Besides, the albedo of the ocean is parameterized following Cox and Munk (1954a, b) and Nakajima and Tanaka (1983), especially involving the wind speed from ERA5. For ice clouds, another procedure is applied. Since SEVIRI observations with CiPS are able to account for the entire cirrus cloud layers but are only dependent on thermal channels and not affected by low lying clouds (Strandgren et al., 2017b), SEVIRI provides accurate ice cloud properties (IOT) that can be used in the RTM.
The representation of cirrus at the flight level is complemented by adding their Reff from in situ measurements, CTH and cirrus bottom height (CBH) from lidar legs, as well as CiPS IOT into libRadtran in the way described in the next lines. This way we simulated a vertically homogeneous ice cloud with the correct IOT obtained by CiPS. We assumed IOT to be constant over an entire SEVIRI pixel while Reff changes according to in situ information (at the altitude levels probed by HALO). Since the RTM needs IWC as input, we determine it from IOT. First, Extinction “Ext” for IWC = 1 g m−3 (i.e., extinction in km−1 g−1 m3) for each measurement is interpolated to the given in situ Reff with the parameterization of optical properties of Baum et al. (2014) for rough aggregates. The selection of this shape for all cloud types is motivated by the fact that each cloud column, even those containing contrails, encompass ice crystals with various temporal evolution, e.g., young, small – probably round – ice particles in contrail cores together with larger sedimenting ice crystals in the fall streaks with different shapes or with evaporating ice crystals, in part still large in size, in subsaturated air that are starting to lose asphericity or maybe even natural ice crystals with unknown shape. To avoid an additional arbitrary choice with respect to ice particle shape we decided to keep the method as simple as possible and selected this shape (rough aggregates) as, e.g., for the MODIS optical property products Collection 6. A sensitivity study with respect to ice particle shape is conducted in Sect. 4.2. Note that the parametrization of this shape only covers Reff from 5 to 60 µm, which results in the inexecutable RTM calculations for larger or smaller ice crystals. Twenty cases in total are removed but have a negligible effect on the estimation of radiative effects as Reff of contrail cirrus and natural cirrus always fall in the range where RTM could simulate as indicated in Fig. 5. The IWC for each measurement of Reff corresponding to a vertically homogeneous ice cloud with given IOT is derived using the following equation:
CTH and CBH are obtained from the lidar legs since they seem to vary only slowly with time and space (Fig. 3). Thus, this IWC is used to simulate a homogeneous ice cloud layer between CBH and CTH and corresponds to the IOT observed by CiPS.
Finally, in situ measurements of Reff are assigned to a collocated IOT from CiPS as well as the ERA5 properties listed above for temperature, gas and liquid water clouds. With this atmospheric setup, TOA irradiances are computed and represent the cirrus contaminated RSR and OLR. Then, the ice clouds only are removed from the input of the RTM and other calculations are performed to compute cirrus-free irradiances. Both together are then inserted in Eqs. (3)–(5) to compute the instantaneous net RF of the cirrus cloud under consideration.
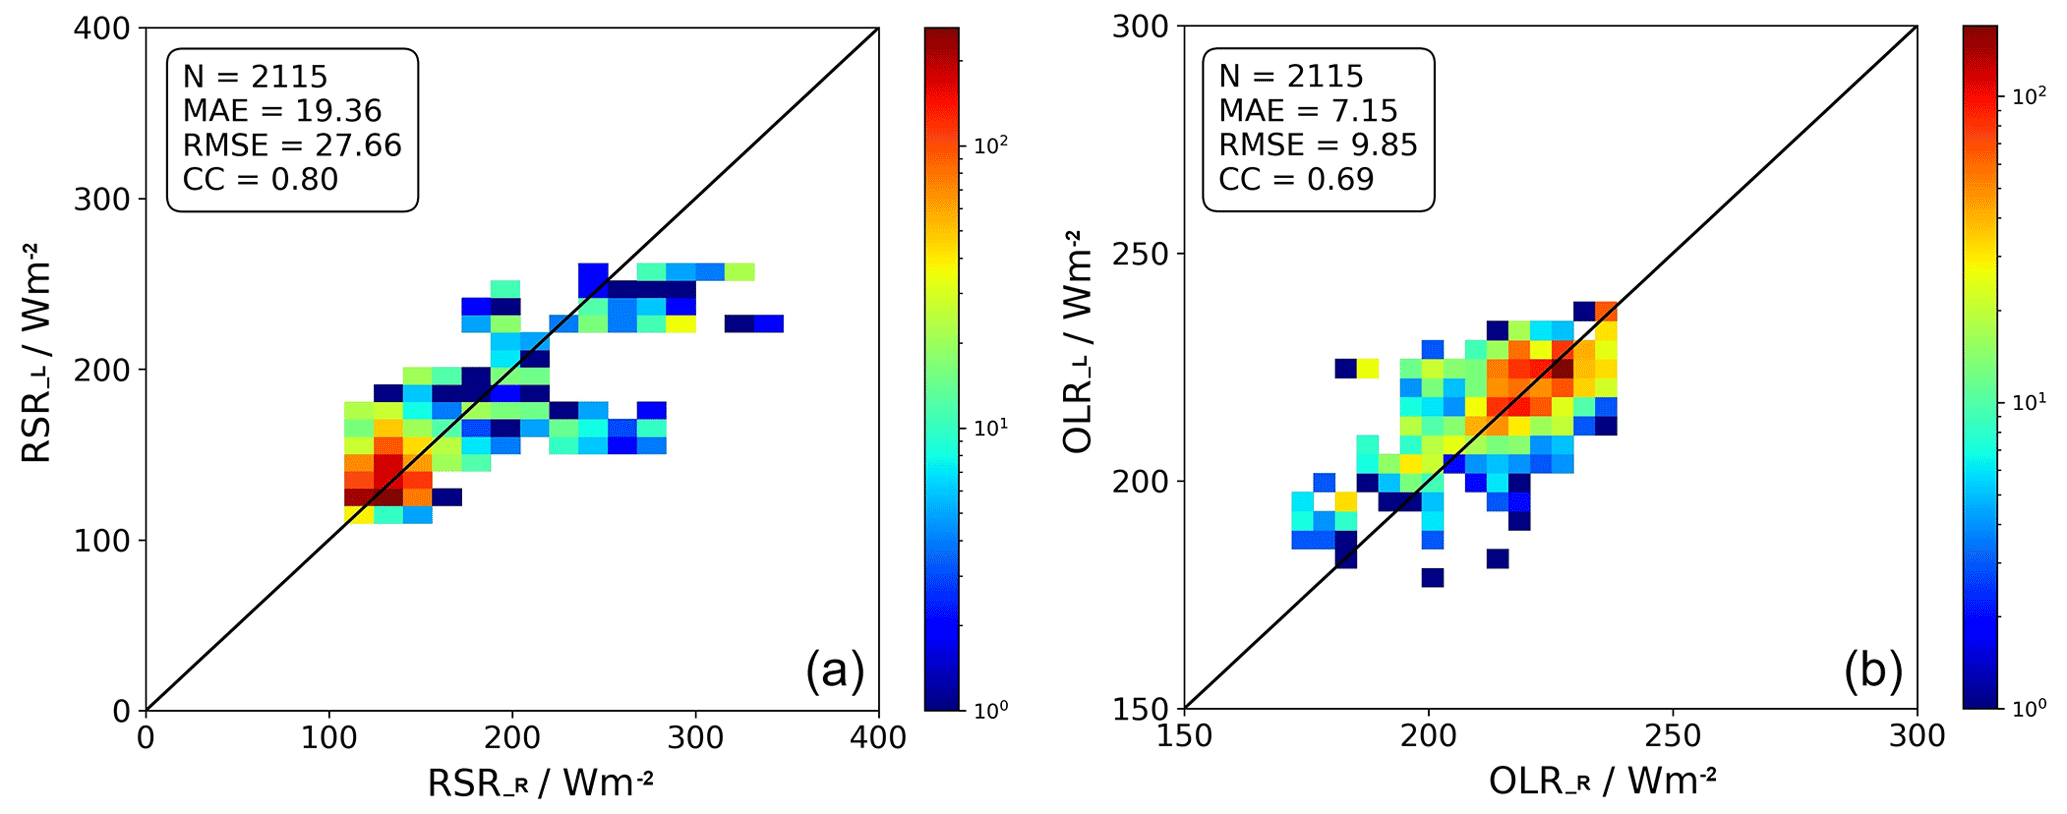
Figure 6Comparison of TOA (a) RSR and (b) OLR from our RTM simulations (RSR_L, OLR_L) for probed ice particles and RRUMS algorithm results (RSR_R, OLR_R) for single SEVIRI pixel along the HALO flight on 26 March 2014. The mean absolute error (MAE), root mean square error (RMSE) and correlation coefficient (CC) are used as metrics.
The RSR and OLR values influenced by cirrus as obtained from libRadtran simulations (RSR_L and OLR_L) and compared with RRUMS algorithm outputs (RSR_R and OLR_R) along the flight path of HALO are presented in Fig. 6. The two methods agree quite well, but the RTM calculations tend to underestimate large RSR values, probably due to too thin, missing or even mismatched liquid water clouds that are taken from ERA5. Uncertainties in ice cloud properties cannot have such a large effect on RSR since their optical thickness is very low around 0.2. Furthermore, a smaller overestimation of RSR by the RTM compared to RRUMS is also observed for the smallest RSR values below 150 W m−2, related to the bias of estimated ocean albedo but improved by the application of wind speed. For OLR, the agreement between the two data sets is good, with both slight (<10 W m−2) overestimations and underestimations.
The RTM-based TOA radiation estimation method provides a good representation of the real atmosphere and will be used to determine RF of the ice clouds in the following section.
4.2 Diurnal cycle of TOA RF of the contrail cirrus outbreak
In Sect. 4.1 we presented TOA RF for each waypoint of the probed cirrus. In order to examine microphysical properties and radiative effects of the contrail cirrus outbreak detected in this area and to analyze the corresponding temporal variation, we present the regional cirrus cover (CC), average cirrus IOT and CTH (all three quantities from CiPS), as well as mean TOA SW, LW and net RF in an area of 36×51 pixels (∼16 500 km2, the red area in Fig. 2) near the HALO flight track, characteristic for contrail cirrus and cirrus as shown in Sect. 3. This area extends mostly east of the HALO flight and thus contains the contrails or contrail cirrus formed directly east of the ridge cloud. We consider here all ice clouds in the region with high aviation impact.
RF in this section is at the SEVIRI resolution, and calculated using CTH, IOT from CiPS, Reff from in situ mean values of all cirrus (called Reff,mean in the following) and cloud thickness from WALES, assuming the latter does not change in the area with the same procedure presented in Sect. 4.1 based on the RTM libRadtran.
In Fig. 7a, we observe that CC gradually decreases from 0.77 at 06:00 UTC to 0.25 at 14:00 UTC. The positive vertical velocity from ERA5 around that region implies the local downward motion of air mass to warmer temperature layers, and the CTH also decreases. IOT in Fig. 7b decreases between 07:00 UTC (0.41) and 10:00 UTC (0.15), then slowly increases until 12:00 UTC (0.17), then falls to 0.12. CTH decreases during the day and is thus consistent with both the observations of HALO (Fig. 3) and the downward motion. Since an underestimation of CTH by CiPS with respect to WALES (Fig. 3) is observed there, we assume that CTH is also underestimated by CiPS in this area.
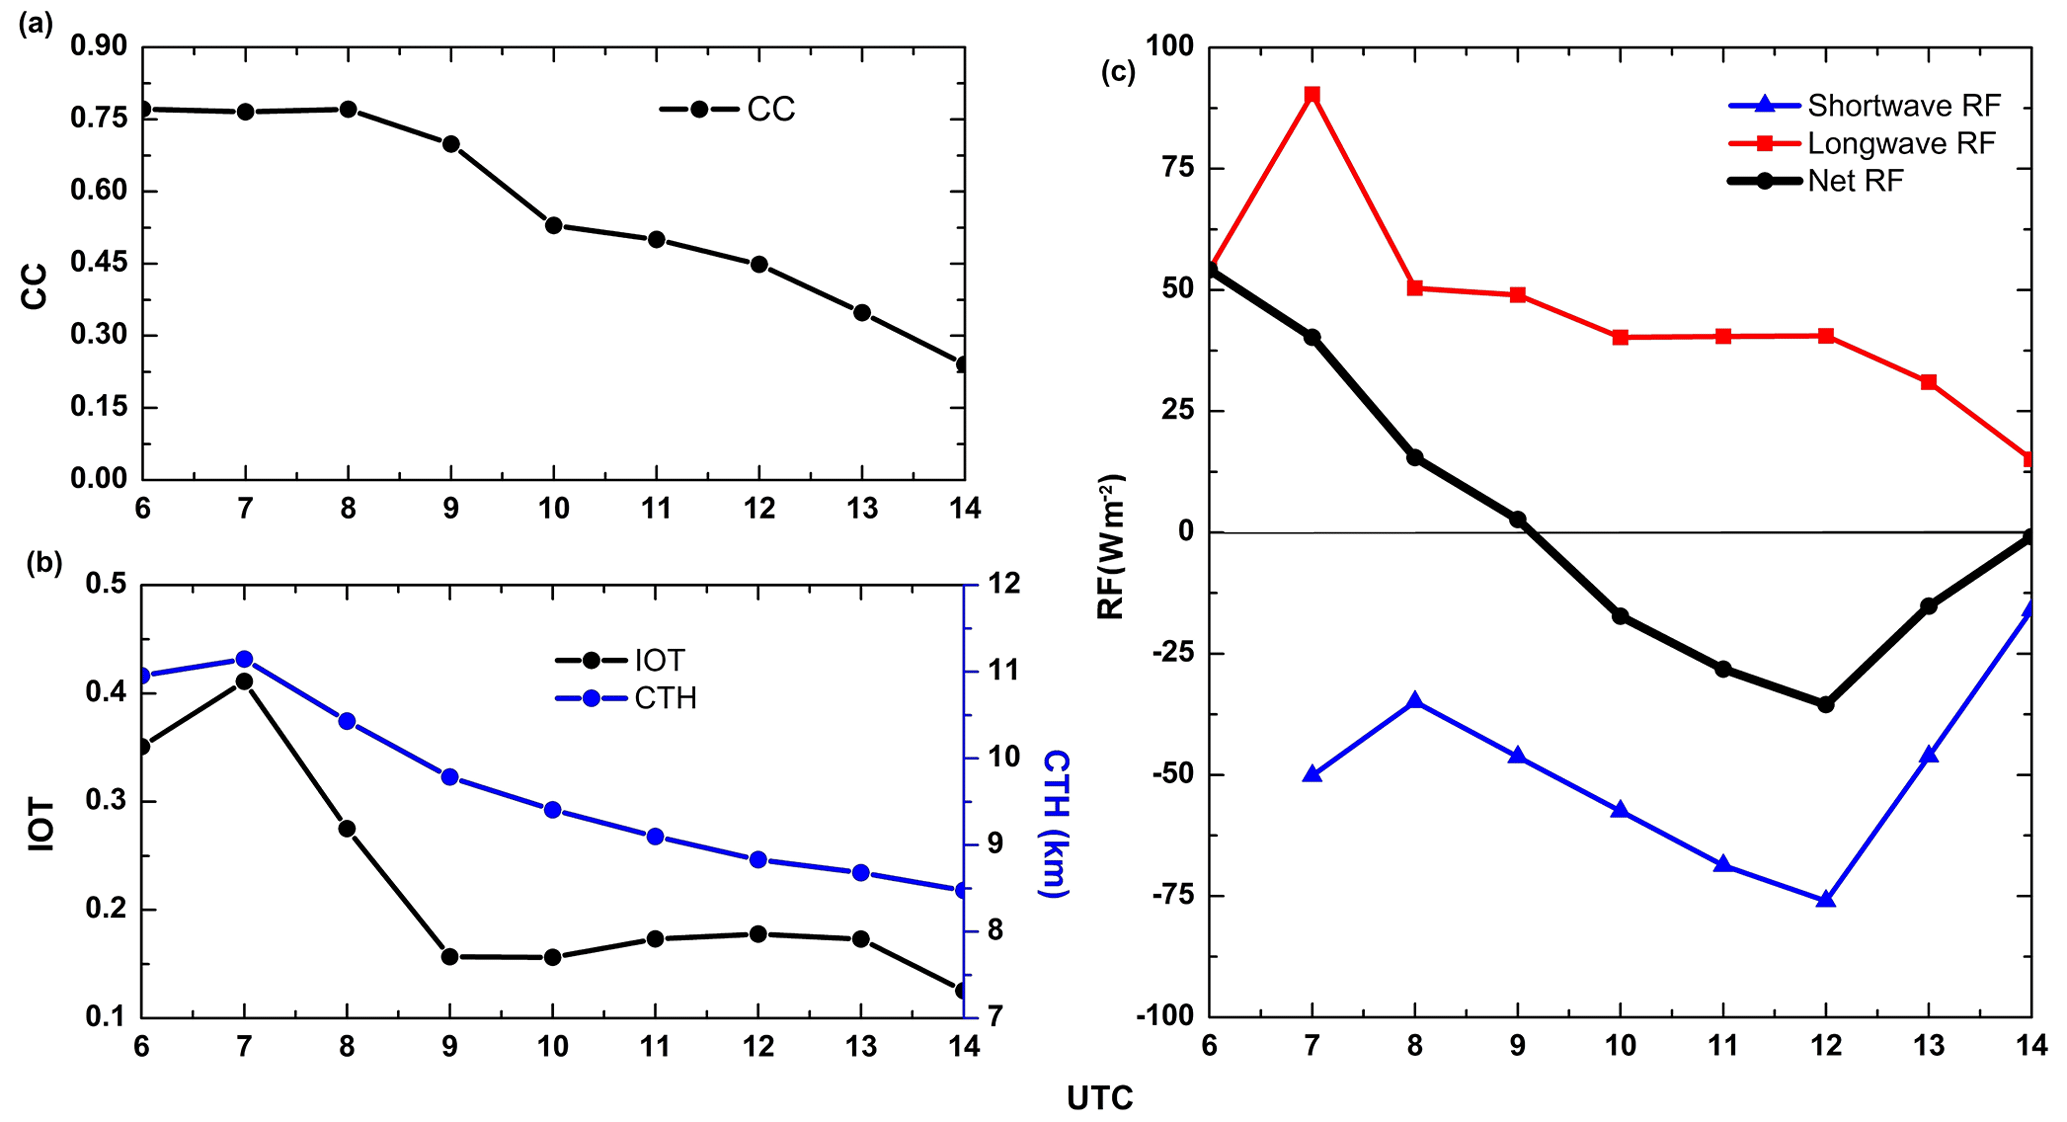
Figure 7The variations of (a) CC, (b) mean IOT and mean CTH, and (c) SW, LW and net RF within the area indicated by a red box in Fig. 2.
Mean net RF over this area in this synoptic situation is positive in the early morning until 09:00 UTC, with the maximum of net RF is at 07:00 UTC when the sun has risen. Hence the contrail cirrus outbreak is warming during night and early morning hours. After 09:00 UTC, the forcing becomes negative. More explicitly, from around 09:00 to 14:00 UTC the net RF is negative, and thus this contrail cirrus outbreak tends to cool during daytime. The strongest cooling is observed at 12:00 UTC. Notice however that the possible underestimation of CTH by CiPS in this area would result in the general underestimation of the LW RF results since a lower CTH reduces the contrast to the cirrus-free OLR. In turn, this would further shift cirrus net RF towards cooling.
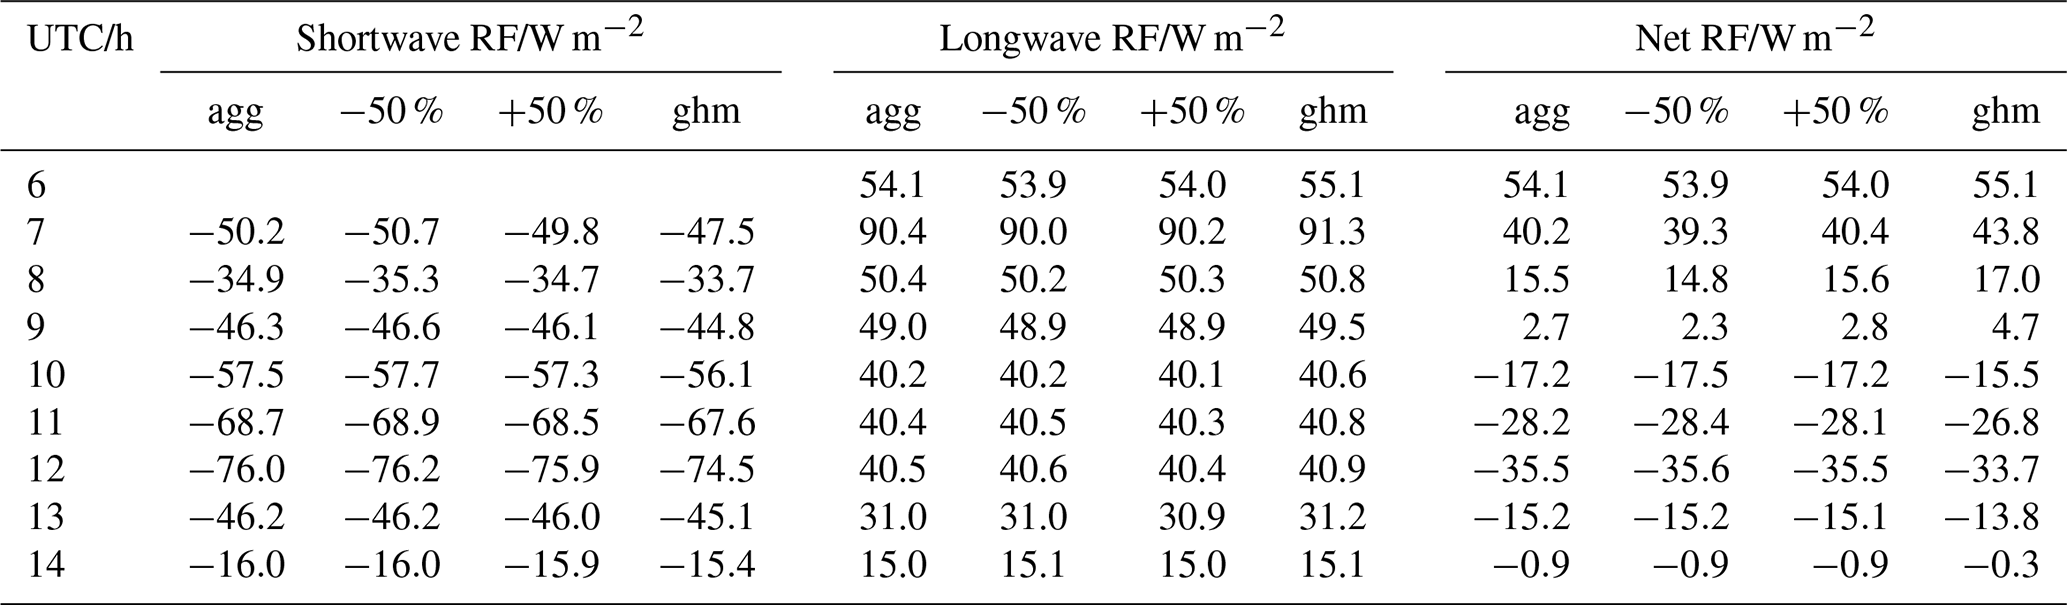
To quantify how the estimated uncertainties in Reff (and resulting IWC) as well as assumed crystal shapes influence the radiative forcing, we compute radiative forcing for aggregates (agg) with % and perform a sensitivity study about ice crystal shape using the general habit mixture (ghm), also available from Baum et al. (2014). The simulated values are recorded in Table 2. The uncertainty of RF due to Reff has an average of 0.2 W m−2 in SW and 0.1 W m−2 in LW. In total the effect on the net RF is approx. 0.1 W m−2. Compared with aggregates, the ghm model has induced a larger net RF of 1.7 W m−2, with the shift in SW and LW of 1.2 and 0.5 W m−2, respectively.
Table 2The sensitivity study on how changing the uncertainty of Reff (±50 %) and assumed crystal shapes (aggregates (agg) and general habit mixture (ghm) according to Baum et al., 2014) impact the resulting radiative forcing in Fig. 7.
This study provides a detailed investigation of an ideal contrail cirrus outbreak event with airborne in situ probes, airborne lidar measurements and geostationary satellite observations using a case study focusing on the NAR on 26 March 2014 during the ML-CIRRUS experiment. We choose this contrail cirrus outbreak case because of the large contrail cirrus coverage and high air traffic density. As flight operation in all altitudes is not easily granted due to the high air traffic load in the NAR, the data presented here are also rare and unique in the sense that HALO was able to operate and acquire in-flight measurements of contrail cirrus perpendicular to the flight tracks of the NAR. From satellite remote sensing, few low-level water clouds and the relatively homogeneous oceanic background increase the sensitivity to retrieve cirrus properties. On the morning of that day, the HALO research aircraft flew for 3 h in or above cirrus clouds, contrail cirrus and contrails. Various contrails with related fall streaks have been identified in airborne lidar backscatter data which merge to a larger cloud with a vertical extent of 2 km that dissipates with time. High resolution RGBs and BTDs from MSG/SEVIRI also reveal the presence of various line shaped structures that represent contrails. Simultaneous airborne humidity measurements from AIMS show RHi between 80 % and 120 %, in line with lidar observations indicating a region where contrails formed, evolved and merged with natural cirrus.
We identify aircraft plumes using peaks in NO data with an approach that takes care of the variable NO background and contrast contrails and contrail cirrus on the basis of measured ice number concentrations. The mean radii of contrails or contrail cirrus is about 18 % smaller than that of natural cirrus, suggesting a self-stabilizing mechanism of smaller contrail cirrus particle sizes surviving due to higher ice number concentrations in contrail cirrus compared to natural cirrus. Ice particle sizes increase by about 144 % during the transition from contrail to contrail cirrus by deposition of water vapor in regions with ice supersaturation. Thus, combined evidence from satellite and aircraft data suggest the presence of an ideal contrail cirrus outbreak event.
For the purpose of obtaining accurate radiative effects of contrail cirrus and natural cirrus, a new TOA RSR and OLR estimation method is developed, which is based on detailed RTM calculations and exploits in situ measurements, satellite observations and ERA5 model atmospheric data. Using IOT from MSG/SEVIRI (CiPS), Reff from in situ, cloud top and bottom height from the lidar, and gas, temperature and liquid water cloud profiles from ERA5, an input atmospheric state for the RTM has been defined that enables to compute RSR and OLR that compare well to MSG measurements (RRUMS). When the ice cloud layer is removed from the RTM input, RSR and OLR for cirrus-free conditions can be computed that are consistent with the corresponding cirrus data.
For a larger area of 36×51 SEVIRI pixels adjacent to the HALO flight path, the diurnal cycle of the contrail cirrus outbreak was computed. RF of cirrus is associated with the changes of cirrus coverage, CTH and IOT. Here, we find a positive net RF of the contrail cirrus outbreak region in the early morning, and the contrail cirrus outbreak warms at TOA till 09:00 UTC. Then, during the daytime the mean net RF of the contrail cirrus outbreak becomes negative, and the contrail cirrus outbreak cools. In the long-term observations or hourly resolved simulations of contrail cirrus coverage and RF in the NAR, Graf et al. (2012), Duda et al. (2013) and Vázquez-Navarro et al. (2015) also find that the contrail coverage is important and that a high variability of the contrail impact is exhibited. These studies indicate that contrail cirrus warm during the night, while a larger variability in contrail cirrus RF exists during the day. Teoh et al. (2022a, b) show that contrail cirrus often cools during the daytime and that the cooling depends on many parameters including solar zenith angle and the surface albedo. For some cases with low clouds, Teoh et al. (2022a, b) also find warming of contrail cirrus during the day. In the absence of sunlight during the night time, however, contrail cirrus warms the atmosphere. Here we use a new method to derive the RF of contrail cirrus and cirrus, and we test it using in situ and lidar observations in a contrail cirrus outbreak situation. A following study will aim at applying the method to a broader data set to investigate the radiative effects of cirrus and contrail cirrus using RTM simulations involving CTH and IOT from satellite, Reff from in situ values, and CBH and cloud thickness from lidar.
This work is valuable for identifying contrails, contrail cirrus and natural cirrus from different platforms, estimating TOA RF from satellite data, assessing microphysical properties and climate impacts of anthropogenic cirrus and natural cirrus, and can help to formulate appropriate contrail mitigation options.
Flight measurements are available at https://halo-db.pa.op.dlr.de/mission/2 (HALO database, 2023). The SEVIRI data are provided by EUMETSAT (European Organisation for the Exploitation of Meteorological Satellites) and the modeled atmospheric profiles are obtained from ECMWF (European Centre for Medium-Range Weather Forecasts). The GERB data could be accessed from EUMETSAT (GERB international team).
The supplement related to this article is available online at: https://doi.org/10.5194/acp-23-1941-2023-supplement.
ZW conducted the analysis and wrote the paper. LB advised the study and provided feedback on the paper. LB, MW and GD plotted Figs. 1–3, and S1. CV coordinated the ML-CIRRUS mission, and LB and TJW contributed to the flight planning. TJW, RH, HZ, MW, SG, SK and CV participated in the flight measurements. GD wrote the description of the WALES data sets. ZW, LB, TJW, RH, HZ and CV discussed the cirrus classification. UB helped with the interpretation of the cirrus cloud conditions and evolution. All authors contributed to and commented on the paper.
The contact author has declared that none of the authors has any competing interests.
Publisher's note: Copernicus Publications remains neutral with regard to jurisdictional claims in published maps and institutional affiliations.
We thank the DLR flight crews for excellent flight operations and EUMETSAT and ECMWF for providing the MSG/SEVIRI observations and modeled atmospheric data, as well as the Royal Meteorological Institute of Belgium (RMIB) in the team of the GERB system for supplying GERB-like data. We thank Bernhard Mayer and team for developing the LibRadtran model. We are grateful for the air traffic data set provided by M3 and NATS and edited by Ulrich Schumann. This work is supported by the German Research Foundation within SPP-1294 HALO (grant nos. VO1504/6-1 and VO1504/7-1) and TRR 301 (Project ID 428312742). Ziming Wang is supported by the DLR (Deutsches Zentrum für Luft- und Raumfahrt)/DAAD (Deutscher Akademischer Austauschdienst) Research Fellowships – Doctoral Studies in Germany, 2020. Tina Jurkat-Witschas also thanks the DLR project H2CONTRAIL. We thank Manuel Gutleben for the interesting comments that helped improve the paper. The paper was significantly improved by the editorship of Farahnaz Khosrawi and reviews of Darrel Baumgardner and two anonymous referees.
This research has been supported by the Deutsche Forschungsgemeinschaft (grant nos. SPP-1294 HALO (contract no. VO1504/6-1), SPP-1294 HALO (contract no. VO1504/7-1), and TRR 301 (project no. 428312742)), the Deutscher Akademischer Austauschdienst (grant no. 57540125 (DLR/DAAD Research Fellowships – Doctoral Studies in Germany, 2020) and the Deutsches Zentrum für Luft- und Raumfahrt (grant nos. H2CONTRAIL and Eco2Fly).
The article processing charges for this open-access publication were covered by the German Aerospace Center (DLR).
This paper was edited by Farahnaz Khosrawi and reviewed by Darrel Baumgardner and two anonymous referees.
Atlas, D., Wang, Z., and Duda, D. P.: Contrails to Cirrus–Morphology, Microphysics, and Radiative Properties, J. Appl. Meteorol. Clim., 45, 5–19, https://doi.org/10.1175/JAM2325.1, 2006.
Baum, B. A., Yang, P., Heymsfield, A. J., Bansemer, A., Cole, B. H., Merrelli, A., Schmitt, C., and Wang, C.: Ice cloud single-scattering property models with the full phase matrix at wavelengths from 0.2 to 100 µm, J. Quant. Spectrosc. Ra., 146, 123–139, https://doi.org/10.1016/j.jqsrt.2014.02.029, 2014.
Baumgardner, D. and Gandrud, B.: A comparison of the microphysical and optical properties of particles in an aircraft contrail and mountain wave cloud, Geophys. Res. Lett., 25, 1129–1132, https://doi.org/10.1029/98GL00035, 1998.
Baumgardner, D., Brenguier, J. L., Bucholtz, A., Coe, H., DeMott, P., Garrett, T. J., Gayet, J. F., Hermann, M., Heymsfield, A., Korolev, A., Krämer, M., Petzold, A., Strapp, W., Pilewskie, P., Taylor, J., Twohy, C., Wendisch, M., Bachalo, W., and Chuang, P.: Airborne instruments to measure atmospheric aerosol particles, clouds and radiation: A cook's tour of mature and emerging technology, Atmos. Res., 102, 10–29, https://doi.org/10.1016/j.atmosres.2011.06.021, 2011.
Baumgardner, D., Abel, S. J., Axisa, D., Cotton, R., Crosier, J., Field, P., Gurganus, C., Heymsfield, A., Korolev, A., Krämer, M., Lawson, P., McFarquhar, G., Ulanowski, Z., and Um, J.: In situ measurement challenges, Ice Formation and Evolution in Clouds and Precipitation: Measurement and Modeling Challenges, Meteor. Monogr. No. 58, Am. Meteorol. Soc., https://doi.org/10.1175/AMSMONOGRAPHS-D-16-0011.1, 2017.
Biele, J., Beyerle, G., and Baumgarten, G.: Polarization lidar: Corrections of instrumental effects, Opt. Express, 7, 427–435, https://doi.org/10.1364/OE.7.000427, 2000.
Bier, A., Burkhardt, U., and Bock, L.: Synoptic Control of Contrail Cirrus Life Cycles and Their Modification Due to Reduced Soot Number Emissions, J. Geophys. Res.-Atmos., 122, 11,584-511,603, https://doi.org/10.1002/2017JD027011, 2017.
Bock, L. and Burkhardt, U.: The temporal evolution of a long-lived contrail cirrus cluster: Simulations with a global climate model, J. Geophys. Res.-Atmos., 121, 3548–3565, https://doi.org/10.1002/2015JD024475, 2016.
Braga, R. C., Rosenfeld, D., Weigel, R., Jurkat, T., Andreae, M. O., Wendisch, M., Pöhlker, M. L., Klimach, T., Pöschl, U., Pöhlker, C., Voigt, C., Mahnke, C., Borrmann, S., Albrecht, R. I., Molleker, S., Vila, D. A., Machado, L. A. T., and Artaxo, P.: Comparing parameterized versus measured microphysical properties of tropical convective cloud bases during the ACRIDICON–CHUVA campaign, Atmos. Chem. Phys., 17, 7365–7386, https://doi.org/10.5194/acp-17-7365-2017, 2017a.
Braga, R. C., Rosenfeld, D., Weigel, R., Jurkat, T., Andreae, M. O., Wendisch, M., Pöschl, U., Voigt, C., Mahnke, C., Borrmann, S., Albrecht, R. I., Molleker, S., Vila, D. A., Machado, L. A. T., and Grulich, L.: Further evidence for CCN aerosol concentrations determining the height of warm rain and ice initiation in convective clouds over the Amazon basin, Atmos. Chem. Phys., 17, 14433–14456, https://doi.org/10.5194/acp-17-14433-2017, 2017b.
Bräuer, T., Voigt, C., Sauer, D., Kaufmann, S., Hahn, V., Scheibe, M., Schlager, H., Huber, F., Le Clercq, P., Moore, R. H., and Anderson, B. E.: Reduced ice number concentrations in contrails from low-aromatic biofuel blends, Atmos. Chem. Phys., 21, 16817–16826, https://doi.org/10.5194/acp-21-16817-2021, 2021a.
Bräuer, T., Voigt, C., Sauer, D., Kaufmann, S., Hahn, V., Scheibe, M., Schlager, H., Diskin, G. S., Nowak, J. B., DiGangi, J. P., Huber, F., Moore, R. H., and Anderson, B. E.: Airborne Measurements of Contrail Ice Properties – Dependence on Temperature and Humidity, Geophys. Res. Lett., 48, e2020GL092166, https://doi.org/10.1029/2020GL092166, 2021b.
Buehler, S. A., John, V. O., Kottayil, A., Milz, M., and Eriksson, P.: Efficient radiative transfer simulations for a broadband infrared radiometer – Combining a weighted mean of representative frequencies approach with frequency selection by simulated annealing, J. Quant. Spectrosc. Ra., 111, 602–615, https://doi.org/10.1016/j.jqsrt.2009.10.018, 2010.
Bugliaro, L., Zinner, T., Keil, C., Mayer, B., Hollmann, R., Reuter, M., and Thomas, W.: Validation of cloud property retrievals with simulated satellite radiances: a case study for SEVIRI, Atmos. Chem. Phys., 11, 5603–5624, https://doi.org/10.5194/acp-11-5603-2011, 2011.
Bugliaro, L., Piontek, D., Kox, S., Schmidl, M., Mayer, B., Müller, R., Vázquez-Navarro, M., Peters, D. M., Grainger, R. G., Gasteiger, J., and Kar, J.: VADUGS: a neural network for the remote sensing of volcanic ash with MSG/SEVIRI trained with synthetic thermal satellite observations simulated with a radiative transfer model, Nat. Hazards Earth Syst. Sci., 22, 1029–1054, https://doi.org/10.5194/nhess-22-1029-2022, 2022.
Burkhardt, U. and Kärcher, B.: Global radiative forcing from contrail cirrus, Nat. Clim. Change, 1, 54–58, https://doi.org/10.1038/nclimate1068, 2011.
Burkhardt, U., Bock, L., and Bier, A.: Mitigating the contrail cirrus climate impact by reducing aircraft soot number emissions, npj Clim. Atmos. Sci., 1, 37, https://doi.org/10.1038/s41612-018-0046-4, 2018.
Chauvigné, A., Jourdan, O., Schwarzenboeck, A., Gourbeyre, C., Gayet, J. F., Voigt, C., Schlager, H., Kaufmann, S., Borrmann, S., Molleker, S., Minikin, A., Jurkat, T., and Schumann, U.: Statistical analysis of contrail to cirrus evolution during the Contrail and Cirrus Experiment (CONCERT), Atmos. Chem. Phys., 18, 9803–9822, https://doi.org/10.5194/acp-18-9803-2018, 2018.
Chen, C.-C., Gettelman, A., Craig, C., Minnis, P., and Duda, D. P.: Global contrail coverage simulated by CAM5 with the inventory of 2006 global aircraft emissions, J. Adv. Model. Earth Syst., 4, M04003, https://doi.org/10.1029/2011MS000105, 2012.
Cox, C. and Munk, W.: Measurement of the roughness of the sea surface from photographs of the sun's glitter, J. Opt. Soc. USA, 44, 838–850, 1954a.
Cox, C. and Munk, W.: Statistics of the sea surface derived from sun glitter, J. Mar. Res., 13, 198–227, 1954b.
de Reus, M., Borrmann, S., Bansemer, A., Heymsfield, A. J., Weigel, R., Schiller, C., Mitev, V., Frey, W., Kunkel, D., Kürten, A., Curtius, J., Sitnikov, N. M., Ulanovsky, A., and Ravegnani, F.: Evidence for ice particles in the tropical stratosphere from in-situ measurements, Atmos. Chem. Phys., 9, 6775–6792, https://doi.org/10.5194/acp-9-6775-2009, 2009.
Duda, D. P., Minnis, P., and Nguyen, L.: Estimates of cloud radiative forcing in contrail clusters using GOES imagery, J. Geophys. Res.-Atmos., 106, 4927–4937, https://doi.org/10.1029/2000JD900393, 2001.
Duda, D. P., Minnis, P., Nguyen, L., and Palikonda, R.: A Case Study of the Development of Contrail Clusters over the Great Lakes, J. Atmos. Sci., 61, 1132–1146, https://doi.org/10.1175/1520-0469(2004)061<1132:ACSOTD>2.0.CO;2, 2004.
Duda, D. P., Minnis, P., Khlopenkov, K., Chee, T. L., and Boeke, R.: Estimation of 2006 Northern Hemisphere contrail coverage using MODIS data, Geophys. Res. Lett., 40, 612–617, https://doi.org/10.1002/grl.50097, 2013.
Emde, C., Buras-Schnell, R., Kylling, A., Mayer, B., Gasteiger, J., Hamann, U., Kylling, J., Richter, B., Pause, C., Dowling, T., and Bugliaro, L.: The libRadtran software package for radiative transfer calculations (version 2.0.1), Geosci. Model Dev., 9, 1647–1672, https://doi.org/10.5194/gmd-9-1647-2016, 2016.
Esselborn, M., Wirth, M., Fix, A., Tesche, M., and Ehret, G.: Airborne high spectral resolution lidar for measuring aerosol extinction and backscatter coefficients, Appl. Optics, 47, 346–358, 2008.
Fischler, M. A. and Bolles, R. C.: Random Sample Consensus: A Paradigm for Model Fitting with Applications to Image Analysis and Automated Cartography, Comm. ACM., 24, 381–395, https://doi.org/10.1145/358669.358692, 1981.
Forster, P., Ramaswamy, V., Artaxo, P., Berntsen, T., Betts, R., Fahey, D. W., Haywood, J., Lean, J., Lowe, D. C., Myhre, G., Nganga, J., Prinn, R., Raga, G., Schulz, M., and Van Dorland, R.: Changes in Atmospheric Constituents and in Radiative Forcing, in: Climate Change 2007: The Physical Science Basis. Contribution of Working Group I to the Fourth Assessment Report of the Intergovernmental Panel on Climate Change, edited by: Solomon, S., Qin, D., Manning, M., Chen, Z., Marquis, M., Averyt, K. B., Tignor, M., and Miller, H. L., Cambridge University Press, Cambridge, UK and New York, NY, USA, https://www.ipcc.ch/report/ar4/wg1/changes-in-atmospheric-constituents-and-radiative-forcing/ (last access: 3 February 2023), 2007.
Gasteiger, J., Emde, C., Mayer, B., Buras, R., Buehler, S. A., and Lemke, O.: Representative wavelengths absorption parameterization applied to satellite channels and spectral bands, J. Quant. Spectrosc. Ra., 148, 99-115, https://doi.org/10.1016/j.jqsrt.2014.06.024, 2014.
Gayet, J. F., Shcherbakov, V., Voigt, C., Schumann, U., Schäuble, D., Jessberger, P., Petzold, A., Minikin, A., Schlager, H., Dubovik, O., and Lapyonok, T.: The evolution of microphysical and optical properties of an A380 contrail in the vortex phase, Atmos. Chem. Phys., 12, 6629–6643, https://doi.org/10.5194/acp-12-6629-2012, 2012.
Gettelman, A., Chen, C. C., and Bardeen, C. G.: The climate impact of COVID-19-induced contrail changes, Atmos. Chem. Phys., 21, 9405–9416, https://doi.org/10.5194/acp-21-9405-2021, 2021.
Gierens, K., Matthes, S., and Rohs, S.: How Well Can Persistent Contrails Be Predicted?, Aerospace, 7, 169, https://doi.org/10.3390/aerospace7120169, 2020.
Graf, K., Schumann, U., Mannstein, H., and Mayer, B.: Aviation induced diurnal North Atlantic cirrus cover cycle, Geophys. Res. Lett., 39, L16804, https://doi.org/10.1029/2012GL052590, 2012.
Grewe, V., Dahlmann, K., Flink, J., Frömming, C., Ghosh, R., Gierens, K., Heller, R., Hendricks, J., Jöckel, P., Kaufmann, S., Kölker, K., Linke, F., Luchkova, T., Lührs, B., Van Manen, J., Matthes, S., Minikin, A., Niklaß, M., Plohr, M., Righi, M., Rosanka, S., Schmitt, A., Schumann, U., Terekhov, I., Unterstrasser, S., Vázquez-Navarro, M., Voigt, C., Wicke, K., Yamashita, H., Zahn, A., and Ziereis, H.: Mitigating the Climate Impact from Aviation: Achievements and Results of the DLR WeCare Project, Aerospace, 4, 34, https://doi.org/10.3390/aerospace4030034, 2017.
Groß, S., Wirth, M., Schäfler, A., Fix, A., Kaufmann, S., and Voigt, C.: Potential of airborne lidar measurements for cirrus cloud studies, Atmos. Meas. Tech., 7, 2745–2755, https://doi.org/10.5194/amt-7-2745-2014, 2014.
HALO database: ML-CIRRUS mission data, Mission: ML-CIRRUS, DLR [data set], https://halo-db.pa.op.dlr.de/mission/2 (last access: 3 February 2022), 2023.
Harries, J. E., Russell, J. E., Hanafin, J. A., Brindley, H., Futyan, J., Rufus, J., Kellock, S., Matthews, G., Wrigley, R., Last, A., Mueller, J., Mossavati, R., Ashmall, J., Sawyer, E., Parker, D., Caldwell, M., Allan, P. M., Smith, A., Bates, M. J., Coan, B., Stewart, B. C., Lepine, D. R., Cornwall, L. A., Corney, D. R., Ricketts, M. J., Drummond, D., Smart, D., Cutler, R., Dewitte, S., Clerbaux, N., Gonzalez, L., Ipe, A., Bertrand, C., Joukoff, A., Crommelynck, D., Nelms, N., Llewellyn-Jones, D. T., Butcher, G., Smith, G. L., Szewczyk, Z. P., Mlynczak, P. E., Slingo, A., Allan, R. P., and Ringer, M. A.: The Geostationary Earth Radiation Budget Project, B. Am. Meteorol. Soc., 86, 945–960, https://doi.org/10.1175/BAMS-86-7-945, 2005.
Haywood, J. M., Allan, R. P., Bornemann, J., Forster, P. M., Francis, P. N., Milton, S., Rädel, G., Rap, A., Shine, K. P., and Thorpe, R.: A case study of the radiative forcing of persistent contrails evolving into contrail-induced cirrus, J. Geophys. Res.-Atmos., 114, D24201, https://doi.org/10.1029/2009JD012650, 2009.
Hersbach, H., Bell, B., Berrisford, P., Hirahara, S., Horányi, A., Muñoz-Sabater, J., Nicolas, J., Peubey, C., Radu, R., Schepers, D., Simmons, A., Soci, C., Abdalla, S., Abellan, X., Balsamo, G., Bechtold, P., Biavati, G., Bidlot, J., Bonavita, M., De Chiara, G., Dahlgren, P., Dee, D., Diamantakis, M., Dragani, R., Flemming, J., Forbes, R., Fuentes, M., Geer, A., Haimberger, L., Healy, S., Hogan, R. J., Hólm, E., Janisková, M., Keeley, S., Laloyaux, P., Lopez, P., Lupu, C., Radnoti, G., de Rosnay, P., Rozum, I., Vamborg, F., Villaume, S., and Thépaut, J.-N.: The ERA5 global reanalysis, Q. J. Roy. Meteorol. Soc., 146, 1999–2049, https://doi.org/10.1002/qj.3803, 2020.
Heymsfield, A., Baumgardner, D., DeMott, P., Forster, P., Gierens, K., and Kärcher, B.: Contrail Microphysics, B. Am. Meteorol. Soc., 91, 465–472, https://doi.org/10.1175/2009BAMS2839.1, 2010a.
Heymsfield, A. J., Kennedy, P. C., Massie, S., Schmitt, C., Wang, Z., Haimov, S., and Rangno, A.: Aircraft-Induced Hole Punch and Canal Clouds: Inadvertent Cloud Seeding, B. Am. Meteorol. Soc., 91, 753–766, https://doi.org/10.1175/2009BAMS2905.1, 2010b.
Järvinen, E., Schnaiter, M., Mioche, G., Jourdan, O., Shcherbakov, V. N., Costa, A., Afchine, A., Krämer, M., Heidelberg, F., Jurkat, T., Voigt, C., Schlager, H., Nichman, L., Gallagher, M., Hirst, E., Schmitt, C., Bansemer, A., Heymsfield, A., Lawson, P., Tricoli, U., Pfeilsticker, K., Vochezer, P., Möhler, O., and Leisner, T.: Quasi-Spherical Ice in Convective Clouds, J.e Atmos. Sci., 73, 3885–3910, https://doi.org/10.1175/JAS-D-15-0365.1, 2016.
Jensen, E. J., Ackerman, A. S., Stevens, D. E., Toon, O. B., and Minnis, P.: Spreading and growth of contrails in a sheared environment, J. Geophys. Res.-Atmos., 103, 31557–31567, https://doi.org/10.1029/98JD02594, 1998a.
Jensen, E. J., Toon, O. B., Kinne, S., Sachse, G. W., Anderson, B. E., Chan, K. R., Twohy, C. H., Gandrud, B., Heymsfield, A., and Miake-Lye, R. C.: Environmental conditions required for contrail formation and persistence, J. Geophys. Res.-Atmos., 103, 3929–3936, https://doi.org/10.1029/97JD02808, 1998b.
Jeßberger, P., Voigt, C., Schumann, U., Sölch, I., Schlager, H., Kaufmann, S., Petzold, A., Schäuble, D., and Gayet, J. F.: Aircraft type influence on contrail properties, Atmos. Chem. Phys., 13, 11965–11984, https://doi.org/10.5194/acp-13-11965-2013, 2013.
Jurkat, T., Voigt, C., Arnold, F., Schlager, H., Kleffmann, J., Aufmhoff, H., Schäuble, D., Schaefer, M., and Schumann, U.: Measurements of HONO, NO, NOy and SO2 in aircraft exhaust plumes at cruise, Geophys. Res. Lett., 38, L10807, https://doi.org/10.1029/2011GL046884, 2011.
Jurkat, T., Kaufmann, S., Voigt, C., Schäuble, D., Jeßberger, P., and Ziereis, H.: The airborne mass spectrometer AIMS – Part 2: Measurements of trace gases with stratospheric or tropospheric origin in the UTLS, Atmos. Meas. Tech., 9, 1907–1923, https://doi.org/10.5194/amt-9-1907-2016, 2016.
Kärcher, B.: Formation and radiative forcing of contrail cirrus, Nat. Commun., 9, 1824, https://doi.org/10.1038/s41467-018-04068-0, 2018.
Kärcher, B. and Voigt, C.: Susceptibility of contrail ice crystal numbers to aircraft soot particle emissions, Geophys. Res. Lett., 44, 8037–8046, https://doi.org/10.1002/2017GL074949, 2017.
Kaufmann, S., Voigt, C., Jurkat, T., Thornberry, T., Fahey, D. W., Gao, R. S., Schlage, R., Schäuble, D., and Zöger, M.: The airborne mass spectrometer AIMS – Part 1: AIMS-H2O for UTLS water vapor measurements, Atmos. Meas. Tech., 9, 939–953, https://doi.org/10.5194/amt-9-939-2016, 2016.
Kaufmann, S., Voigt, C., Heller, R., Jurkat-Witschas, T., Krämer, M., Rolf, C., Zöger, M., Giez, A., Buchholz, B., Ebert, V., Thornberry, T., and Schumann, U.: Intercomparison of midlatitude tropospheric and lower-stratospheric water vapor measurements and comparison to ECMWF humidity data, Atmos. Chem. Phys., 18, 16729–16745, https://doi.org/10.5194/acp-18-16729-2018, 2018.
Kiemle, C., Wirth, M., Fix, A., Ehret, G., Schumann, U., Gardiner, T., Schiller, C., Sitnikov, N., and Stiller, G.: First airborne water vapor lidar measurements in the tropical upper troposphere and mid-latitudes lower stratosphere: accuracy evaluation and intercomparisons with other instruments, Atmos. Chem. Phys. 8, 5245–5261, https://doi.org/10.5194/acp-8-5245-2008, 2008.
Kleine, J., Voigt, C., Sauer, D., Schlager, H., Scheibe, M., Jurkat-Witschas, T., Kaufmann, S., Kärcher, B., and Anderson, B. E.: In Situ Observations of Ice Particle Losses in a Young Persistent Contrail, Geophys. Res. Lett., 45, 13553–13561, https://doi.org/10.1029/2018GL079390, 2018.
Krautstrunk, M. and Giez, A.: The Transition from FALCON to HALO Era Airborne Atmospheric Research, in: Atmospheric Physics. Research Topics in Aerospace, edited by: Schumann, U., Springer, Berlin, Heidelberg, https://doi.org/10.1007/978-3-642-30183-4_37, 2012.
Kübbeler, M., Hildebrandt, M., Meyer, J., Schiller, C., Hamburger, Th., Jurkat, T., Minikin, A., Petzold, A., Rautenhaus, M., Schlager, H., Schumann, U., Voigt, C., Spichtinger, P., Gayet, J.-F., Gourbeyre, C., and Krämer, M.: Thin and subvisible cirrus and contrails in a subsaturated environment, Atmos. Chem. Phys., 11, 5853–5865, https://doi.org/10.5194/acp-11-5853-2011, 2011.
Lee, D. S., Fahey, D. W., Skowron, A., Allen, M. R., Burkhardt, U., Chen, Q., Doherty, S. J., Freeman, S., Forster, P. M., Fuglestvedt, J., Gettelman, A., De León, R. R., Lim, L. L., Lund, M. T., Millar, R. J., Owen, B., Penner, J. E., Pitari, G., Prather, M. J., Sausen, R., and Wilcox, L. J.: The contribution of global aviation to anthropogenic climate forcing for 2000 to 2018, Atmos. Environ., 244, 117834, https://doi.org/10.1016/j.atmosenv.2020.117834, 2021.
Letu, H., Ishimoto, H., Riedi, J., Nakajima, T. Y., C.-Labonnote, L., Baran, A. J., Nagao, T. M., and Sekiguchi, M.: Investigation of ice particle habits to be used for ice cloud remote sensing for the GCOM-C satellite mission, Atmos. Chem. Phys., 16, 12287–12303, https://doi.org/10.5194/acp-16-12287-2016, 2016.
Li, Q. and Groß, S.: Changes in cirrus cloud properties and occurrence over Europe during the COVID-19-caused air traffic reduction, Atmos. Chem. Phys., 21, 14573–14590, https://doi.org/10.5194/acp-21-14573-2021, 2021.
Mannstein, H., Brömser, A., and Bugliaro, L.: Ground-based observations for the validation of contrails and cirrus detection in satellite imagery, Atmos. Meas. Tech., 3, 655–669, https://doi.org/10.5194/amt-3-655-2010, 2010.
Marjani, S., Tesche, M., Bräuer, P., Sourdeval, O., and Quaas, J.: Satellite Observations of the Impact of Individual Aircraft on Ice Crystal Number in Thin Cirrus Clouds, Geophys. Res. Lett., 49, e2021GL096173, https://doi.org/10.1029/2021GL096173, 2022.
Mayer, B. and Kylling, A.: Technical note: The libRadtran software package for radiative transfer calculations – description and examples of use, Atmos. Chem. Phys., 5, 1855–1877, https://doi.org/10.5194/acp-5-1855-2005, 2005.
Meijer, V. R., Kulik, L., Eastham, S. D., Allroggen, F., Speth, R. L., Karaman, S., and Barrett, S. R. H.: Contrail coverage over the United States before and during the COVID-19 pandemic, Environ. Res. Lett., 17, 034039, https://doi.org/10.1088/1748-9326/ac26f0, 2022.
Minnis, P., Ayers, J. K., Palikonda, R., and Phan, D.: Contrails, Cirrus Trends, and Climate, J. Climate, 17, 1671–1685, https://doi.org/10.1175/1520-0442(2004)017<1671:CCTAC>2.0.CO;2, 2004.
Minnis, P., Bedka, S. T., Duda, D. P., Bedka, K. M., Chee, T., Ayers, J. K., Palikonda, R., Spangenberg, D. A., Khlopenkov, K. V., and Boeke, R.: Linear contrail and contrail cirrus properties determined from satellite data, Geophys. Res. Lett., 40, 3220–3226, https://doi.org/10.1002/grl.50569, 2013.
Nakajima, T. and Tanaka, M.: Effect of wind-generated waves on the transfer of solar radiation in the atmosphere-ocean system, J. Quant. Spectrosc. Ra., 29, 521–537, https://doi.org/10.1016/0022-4073(83)90129-2, 1983.
Petzold, A., Busen, R., Schröder, F. P., Baumann, R., Kuhn, M., Ström, J., Hagen, D. E., Whitefield, P. D., Baumgardner, D., Arnold, F., Borrmann, S., and Schumann, U.: Near-field measurements on contrail properties from fuels with different sulfur content, J. Geophys. Res.-Atmos., 102, 29867–29880, https://doi.org/10.1029/97JD02209, 1997.
Quaas, J., Gryspeerdt, E., Vautard, R., and Boucher, O.: Climate impact of aircraft-induced cirrus assessed from satellite observations before and during COVID-19, Environ. Res. Lett., 16, 064051, https://doi.org/10.1088/1748-9326/abf686, 2021.
Rädel, G. and Shine, K. P.: Radiative forcing by persistent contrails and its dependence on cruise altitudes, J. Geophys. Res.- Atmos., 113, D07105, https://doi.org/10.1029/2007JD009117, 2008.
Righi, M., Hendricks, J., Lohmann, U., Beer, C. G., Hahn, V., Heinold, B., Heller, R., Krämer, M., Ponater, M., Rolf, C., Tegen, I., and Voigt, C.: Coupling aerosols to (cirrus) clouds in the global EMAC-MADE3 aerosol–climate model, Geosci. Model Dev., 13, 1635–1661, https://doi.org/10.5194/gmd-13-1635-2020, 2020.
Rodríguez De León, R., Lim, L. L., Lee, D. S., Bennett, M., and Krämer, M.: Simple Versus Complex Physical Representation of the Radiative Forcing From Linear Contrails: A Sensitivity Analysis, J. Geophys. Res.-Atmos., 123, 2831–2840, https://doi.org/10.1002/2017JD027861, 2018.
Sanz-Morère, I., Eastham, S. D., Speth, R. L., and Barrett, S. R. H.: Reducing Uncertainty in Contrail Radiative Forcing Resulting from Uncertainty in Ice Crystal Properties, Environ. Sci. Technol. Lett., 7, 371–375, https://doi.org/10.1021/acs.estlett.0c00150, 2020.
Sanz-Morère, I., Eastham, S. D., Allroggen, F., Speth, R. L., and Barrett, S. R. H.: Impacts of multi-layer overlap on contrail radiative forcing, Atmos. Chem. Phys., 21, 1649–1681, https://doi.org/10.5194/acp-21-1649-2021, 2021.
Schlager, H., Konopka, P., Schulte, P., Schumann, U., Ziereis, H., Amold, F., Klemm, M., Hagen, D. E., Whitefield, P. D., and Ovarlez, J.: In situ observations of airtraffic emission signatures in the North Atlantic Flight Corridor, J. Geophys. Res.-Atmos., 102, 10739–10750, https://doi.org/10.1029/96JD03748, 1997.
Schmetz, J., Pili, P., Tjemkes, S., Just, D., Kerkmann, J., Rota, S., and Ratier, A.: An Introduction To METEOSAT Second Generation (MSG), B. Am. Meteorol. Soc., 83, 977–992, https://doi.org/10.1175/1520-0477(2002)083<0977:AITMSG>2.3.CO;2, 2002.
Schröder, F., Brock, C. A., Baumann, R., Petzold, A., Busen, R., Schulte, P., and Fiebig, M.: In situ studies on volatile jet exhaust particle emissions: Impact of fuel sulfur content and environmental conditions on nuclei mode aerosols, J. Geophys. Res.-Atmos., 105, 19941–19954, https://doi.org/10.1029/2000JD900112, 2000.
Schumann, U.: On conditions for contrail formation from aircraft exhausts, Meteorol. Z., 5, 4–23, https://doi.org/10.1127/metz/5/1996/4, 1996.
Schumann, U. and Graf, K.: Aviation-induced cirrus and radiation changes at diurnal timescales, J. Geophys. Res.-Atmos., 118, 2404–2421, https://doi.org/10.1002/jgrd.50184, 2013.
Schumann, U., Schlager, H., Arnold, F., Baumann, R., Haschberger, P., and Klemm, O.: Dilution of aircraft exhaust plumes at cruise altitudes, Atmos. Environ., 32, 3097–3103, https://doi.org/10.1016/S1352-2310(97)00455-X, 1998.
Schumann, U., Jeßberger, P., and Voigt, C.: Contrail ice particles in aircraft wakes and their climatic importance, Geophys. Res. Lett., 40, 2867–2872, https://doi.org/10.1002/grl.50539, 2013.
Schumann, U., Baumann, R., Baumgardner, D., Bedka, S. T., Duda, D. P., Freudenthaler, V., Gayet, J. F., Heymsfield, A. J., Minnis, P., Quante, M., Raschke, E., Schlager, H., Vázquez-Navarro, M., Voigt, C., and Wang, Z.: Properties of individual contrails: a compilation of observations and some comparisons, Atmos. Chem. Phys., 17, 403–438, https://doi.org/10.5194/acp-17-403-2017, 2017.
Schumann, U., Bugliaro, L., Dörnbrack, A., Baumann, R., and Voigt, C.: Aviation Contrail Cirrus and Radiative Forcing Over Europe During 6 Months of COVID-19, Geophys. Res. Lett., 48, e2021GL092771, https://doi.org/10.1029/2021GL092771, 2021a.
Schumann, U., Poll, I., Teoh, R., Koelle, R., Spinielli, E., Molloy, J., Koudis, G. S., Baumann, R., Bugliaro, L., Stettler, M., and Voigt, C.: Air traffic and contrail changes over Europe during COVID-19: a model study, Atmos. Chem. Phys., 21, 7429–7450, https://doi.org/10.5194/acp-21-7429-2021, 2021b.
Stamnes, K., Tsay, S.-C., and Laszlo, I.: DISORT, A General Purpose Fortran Program for Discrete-Ordinate-Method Radiative Transfer in Scattering and Emitting Layered Media: Documentation and Methodology, Tech. rep., Stevens Insitute of Technology, Hoboken, NJ, USA, http://www.libradtran.org/lib/exe/fetch.php?media=disortreport1.1.pdf (last access: 3 February 2023), 2000.
Stordal, F., Myhre, G., Stordal, E. J. G., Rossow, W. B., Lee, D. S., Arlander, D. W., and Svendby, T.: Is there a trend in cirrus cloud cover due to aircraft traffic? Atmos. Chem. Phys., 5, 2155–2162, https://doi.org/10.5194/acp-5-2155-2005, 2005.
Strandgren, J., Bugliaro, L., Sehnke, F., and Schröder, L.: Cirrus cloud retrieval with MSG/SEVIRI using artificial neural networks, Atmos. Meas. Tech., 10, 3547–3573, https://doi.org/10.5194/amt-10-3547-2017, 2017a.
Strandgren, J., Fricker, J., and Bugliaro, L.: Characterisation of the artificial neural network CiPS for cirrus cloud remote sensing with MSG/SEVIRI, Atmos. Meas. Tech., 10, 4317–4339, https://doi.org/10.5194/amt-10-4317-2017, 2017b.
Stratmann, G., Ziereis, H., Stock, P., Brenninkmeijer, C. A. M., Zahn, A., Rauthe-Schöch, A., Velthoven, P. V., Schlager, H., and Volz-Thomas, A.: NO and NOy in the upper troposphere: Nine years of CARIBIC measurements onboard a passenger aircraft, Atmos. Environ., 133, 93–111, https://doi.org/10.1016/j.atmosenv.2016.02.035, 2016.
Stuber, N., Forster, P., Rädel, G., and Shine, K.: The importance of the diurnal and annual cycle of air traffic for contrail radiative forcing, Nature, 441, 864–867, https://doi.org/10.1038/nature04877, 2006.
Teoh, R., Schumann, U., Gryspeerdt, E., Shapiro, M., Molloy, J., Koudis, G., Voigt, C., and Stettler, M. E. J.: Aviation contrail climate effects in the North Atlantic from 2016 to 2021, Atmos. Chem. Phys., 22, 10919–10935, https://doi.org/10.5194/acp-22-10919-2022, 2022a.
Teoh, R., Schumann, U., Voigt, C., Schripp, T., Shapiro, M., Engberg, Z., Molloy, J., Koudis, G., and Stettler, M. E. J.: Targeted Use of Sustainable Aviation Fuel to Maximize Climate Benefits, Environ. Sci. Technol., 56, 17246–17255, https://doi.org/10.1021/acs.est.2c05781, 2022b.
Tesche, M., Achtert, P., Glantz, P., and Noone, K. J.: Aviation effects on already-existing cirrus clouds, Nat. Commun., 7, 12016, https://doi.org/10.1038/ncomms12016, 2016.
Unterstrasser, S., Gierens, K., Sölch, I., and Lainer, M.: Numerical simulations of homogeneously nucleated natural cirrus and contrail-cirrus. Part 1: How different are they?, Meteorol. Z., 26, 621–642, https://doi.org/10.1127/metz/2016/0777, 2017a.
Unterstrasser, S., Gierens, K., Sölch, I., and Wirth, M.: Numerical simulations of homogeneously nucleated natural cirrus and contrail-cirrus. Part 2: Interaction on local scale, Meteorol. Z., 26, 643–661, https://doi.org/10.1127/metz/2016/0780, 2017b.
Urbanek, B., Groß, S., Wirth, M., Rolf, C., Krämer, M., and Voigt, C.: High Depolarization Ratios of Naturally Occurring Cirrus Clouds Near Air Traffic Regions Over Europe, Geophys. Res. Lett., 45, 13166–13172, https://doi.org/10.1029/2018GL079345, 2018.
Vázquez-Navarro, M., Mayer, B., and Mannstein, H.: A fast method for the retrieval of integrated longwave and shortwave top-of-atmosphere upwelling irradiances from MSG/SEVIRI (RRUMS), Atmos. Meas. Tech., 6, 2627–2640, https://doi.org/10.5194/amt-6-2627-2013, 2013.
Vázquez-Navarro, M., Mannstein, H., and Kox, S.: Contrail life cycle and properties from 1 year of MSG/SEVIRI rapid-scan images, Atmos. Chem. Phys., 15, 8739–8749, https://doi.org/10.5194/acp-15-8739-2015, 2015.
Verma, P. and Burkhardt, U.: Contrail formation within cirrus: ICON-LEM simulations of the impact of cirrus cloud properties on contrail formation, Atmos. Chem. Phys., 22, 8819–8842, https://doi.org/10.5194/acp-22-8819-2022, 2022.
Voigt, C., Schumann, U., Jurkat, T., Schäuble, D., Schlager, H., Petzold, A., Gayet, J. F., Krämer, M., Schneider, J., Borrmann, S., Schmale, J., Jessberger, P., Hamburger, T., Lichtenstern, M., Scheibe, M., Gourbeyre, C., Meyer, J., Kübbeler, M., Frey, W., Kalesse, H., Butler, T., Lawrence, M. G., Holzäpfel, F., Arnold, F., Wendisch, M., Döpelheuer, A., Gottschaldt, K., Baumann, R., Zöger, M., Sölch, I., Rautenhaus, M., and Dörnbrack, A.: In-situ observations of young contrails – overview and selected results from the CONCERT campaign, Atmos. Chem. Phys., 10, 9039–9056, https://doi.org/10.5194/acp-10-9039-2010, 2010.
Voigt, C., Schumann, U., Jessberger, P., Jurkat, T., Petzold, A., Gayet, J. F., Krämer, M., Thornberry, T., and Fahey, D. W.: Extinction and optical depth of contrails, Geophys. Res. Lett., 38, L11806, https://doi.org/10.1029/2011GL047189, 2011.
Voigt, C., Schumann, U., Minikin, A., Abdelmonem, A., Afchine, A., Borrmann, S., Boettcher, M., Buchholz, B., Bugliaro, L., Costa, A., Curtius, J., Dollner, M., Dörnbrack, A., Dreiling, V., Ebert, V., Ehrlich, A., Fix, A., Forster, L., Frank, F., Fütterer, D., Giez, A., Graf, K., Grooß, J.-U., Groß, S., Heimerl, K., Heinold, B., Hüneke, T., Järvinen, E., Jurkat, T., Kaufmann, S., Kenntner, M., Klingebiel, M., Klimach, T., Kohl, R., Krämer, M., Krisna, T. C., Luebke, A., Mayer, B., Mertes, S., Molleker, S., Petzold, A., Pfeilsticker, K., Port, M., Rapp, M., Reutter, P., Rolf, C., Rose, D., Sauer, D., Schäfler, A., Schlage, R., Schnaiter, M., Schneider, J., Spelten, N., Spichtinger, P., Stock, P., Walser, A., Weigel, R., Weinzierl, B., Wendisch, M., Werner, F., Wernli, H., Wirth, M., Zahn, A., Ziereis, H., and Zöger, M.: ML-CIRRUS: The Airborne Experiment on Natural Cirrus and Contrail Cirrus with the High-Altitude Long-Range Research Aircraft HALO, B. Am. Meteorol. Soc., 98, 271–288, https://doi.org/10.1175/BAMS-D-15-00213.1, 2017.
Voigt, C., Kleine, J., Sauer, D., Moore, R. H., Bräuer, T., Le Clercq, P., Kaufmann, S., Scheibe, M., Jurkat-Witschas, T., Aigner, M., Bauder, U., Boose, Y., Borrmann, S., Crosbie, E., Diskin, G. S., DiGangi, J., Hahn, V., Heckl, C., Huber, F., Nowak, J. B., Rapp, M., Rauch, B., Robinson, C., Schripp, T., Shook, M., Winstead, E., Ziemba, L., Schlager, H., and Anderson, B. E.: Cleaner burning aviation fuels can reduce contrail cloudiness, Commun. Earth Environ., 2, 114, https://doi.org/10.1038/s43247-021-00174-y, 2021.
Voigt, C., Lelieveld, J., Schlager, H., Schneider, J., Curtius, J., Meerkötter, R., Sauer, D., Bugliaro, L., Bohn, B., Crowley, J. N., Erbertseder, T., Groβ, S., Hahn, V., Li, Q., Mertens, M., Pöhlker, M. L., Pozzer, A., Schumann, U., Tomsche, L., Williams, J., Zahn, A., Andreae, M., Borrmann, S., Bräuer, T., Dörich, R., Dörnbrack, A., Edtbauer, A., Ernle, L., Fischer, H., Giez, A., Granzin, M., Grewe, V., Harder, H., Heinritzi, M., Holanda, B. A., Jöckel, P., Kaiser, K., Krüger, O. O., Lucke, J., Marsing, A., Martin, A., Matthes, S., Pöhlker, C., Pöschl, U., Reifenberg, S., Ringsdorf, A., Scheibe, M., Tadic, I., Zauner-Wieczorek, M., Henke, R., and Rapp, M.: Cleaner skies during the COVID-19 lockdown, B. Am. Meteorol. Soc., 103, E1796–E1827, https://doi.org/10.1175/BAMS-D-21-0012.1, 2022.
Wielicki, B. A., Barkstrom, B. R., Harrison, E. F., Lee, R. B., Smith, G. L., and Cooper, J. E.: Clouds and the Earth's Radiant Energy System (CERES): An Earth Observing System Experiment, B. Am. Meteorol. Soc., 77, 853–868, https://doi.org/10.1175/1520-0477(1996)077<0853:CATERE>2.0.CO;2, 1996.
Wirth, M., Fix, A., Mahnke, P., Schwarzer, H., Schrandt, F., and Ehret, G.: The airborne multi-wavelength water vapor differential absorption lidar WALES: system design and performance, Appl. Phys. B, 96, 201–213, 2009.
Yang, P., Hioki, S., Saito, M., Kuo, C.-P., Baum, B. A., and Liou, K.-N.: A Review of Ice Cloud Optical Property Models for Passive Satellite Remote Sensing, Atmosphere, 9, 499, https://doi.org/10.3390/atmos9120499, 2018.
Ziereis, H., Hoor, P., Grooß, J.-U., Zahn, A., Stratmann, G., Stock, P., Lichtenstern, M., Krause, J., Bense, V., Afchine, A., Rolf, C., Woiwode, W., Braun, M., Ungermann, J., Marsing, A., Voigt, C., Engel, A., Sinnhuber, B.-M., and Oelhaf, H.: Redistribution of total reactive nitrogen in the lowermost Arctic stratosphere during the cold winter 2015/2016, Atmos. Chem. Phys., 22, 3631–3654, https://doi.org/10.5194/acp-22-3631-2022, 2022.
- Abstract
- Introduction
- Data and approaches
- Microphysical properties of contrail cirrus and natural cirrus
- Radiative effects of contrail cirrus and natural cirrus
- Summary and conclusions
- Data availability
- Author contributions
- Competing interests
- Disclaimer
- Acknowledgements
- Financial support
- Review statement
- References
- Supplement