the Creative Commons Attribution 4.0 License.
the Creative Commons Attribution 4.0 License.
 | 26 Jan 2023
Summertime ozone pollution in China affected by stratospheric quasi-biennial oscillation
Mengyun Li
Hailong Wang
Huimin Li
Pinya Wang
Hong Liao
In recent years, the near-surface ozone (O3) level has been rising fast in China, with increasing damage to human health and ecosystems. In this study, the impact of stratospheric quasi-biennial oscillation (QBO) on interannual variations in summertime tropospheric O3 over China is investigated based on GEOS-Chem model simulations and satellite retrievals. QBO has a significant positive correlation with near-surface O3 concentrations over central China (92.5–112.5∘ E, 26–38∘ N) when the sea surface temperature (SST) over the eastern tropical Pacific is warmer than normal, with a correlation coefficient of 0.53, but QBO has no significant effect on O3 under the cold SST anomaly. Compared to the easterly phase of QBO, the near-surface O3 concentrations have an increase of up to 3 ppb (5 % relative to the average) over central China during its westerly phase under the warm SST anomaly. O3 also increases above the surface and up to the upper troposphere, with a maximum increase of 2–3 ppb (3 %–5 %) in 850–500 hPa over central China when comparing westerly phase to easterly phase. Process-based analysis and sensitivity simulations suggest that the O3 increase over central China is mainly attributed to the anomalous downward transport of O3 during the westerly phase of QBO when a warm SST anomaly occurs in the eastern tropical Pacific, while the local chemical reactions and horizontal transport processes partly offset the O3 increase. This work suggests a potentially important role of QBO and the related vertical transport process in affecting near-surface O3 air quality, with an indication for O3 pollution prediction and prevention.
- Article
(7420 KB) - Full-text XML
-
Supplement
(376 KB) - BibTeX
- EndNote


Ozone (O3) is an important atmospheric trace gas. The presence of O3 in the stratosphere plays a crucial role in protecting the environment and humans from UV light, but surface O3 is detrimental to human health, ecosystems, and agricultural production within the troposphere (Wang et al., 2007; Nuvolone et al., 2018; Zhao et al., 2020). Tropospheric O3 is primarily produced by photochemical reactions of nitrogen oxides (NOx) and volatile organic compounds (VOCs) (Wang et al., 2017; Zeng et al., 2017). Apart from precursor emissions, the temporal and spatial distributions of tropospheric O3 are highly impacted by meteorological conditions, among which low relative humidity (RH), cloud-free strong solar radiation, and high temperatures can lead to O3 pollution by enhancing its chemical production (Camalier et al., 2007; Porter et al., 2019; Gong and Liao, 2019; Qu et al., 2021; Wang et al., 2022). The intrusion of stratospheric O3 into the troposphere is also one of the sources for near-surface O3 (Zeng et al., 2010; Wespes et al., 2017).
With the accelerated industrialization and urbanization in recent decades, the air quality problem has become serious in China (Verstraeten et al., 2015; Yang et al., 2022a). Although many environmental protection and control measures have been implemented to prevent air pollution (Feng et al., 2019), O3 pollution has been getting worse in China in recent years (Li et al., 2019; Gao et al., 2022). Therefore, the factors causing O3 pollution have been a research focus in recent years. Many previous studies found that interannual variations in large-scale circulations modulated the O3 pollution in China (e.g., Yang et al., 2014; Yin et al., 2017; Zhao and Wang, 2017). For example, Yang et al. (2014) showed that summertime O3 levels in China were positively correlated with the strength of East Asian summer monsoons (EASMs) associated with variations in large-scale circulations, which led to an increase in O3 concentration exceeding 6 % in the strong EASM years relative to the weak ones.
The El Niño–Southern Oscillation (ENSO) is the most pronounced mode of internal variability of the Earth's climate system, which contains warm (El Niño) and cold (La Niña) phases, describing anomalous warming and cooling of surface waters, respectively, in the central-eastern tropical Pacific Ocean. It can be responsible for global and regional oceanic and atmospheric pattern anomalies, having significant impacts on wind, temperature, and precipitation in China (Zhou and Chan, 2007; Xu et al., 2007; Li et al., 2020; Zeng et al., 2021). Recent studies have shown that the interannual variations in O3 concentrations over China are influenced by ENSO events (Jiang and Li, 2022; Li et al., 2022; Yang et al., 2022b). Using the GEOS-Chem model, Yang et al. (2022b) showed that summertime O3 over southern China had a positive correlation with the Niño 3.4 index. Near-surface O3 concentrations increased by a maximum over 20 % in southern China during El Niño compared to La Niña, which was closely linked to a weakened southerly over southern China that was conducive to the accumulation of O3. However, they also reported an unusual O3 change over 30–40∘ N in China that could not be explained by the ENSO impact alone.
The quasi-biennial oscillation (QBO) is a major mode of variability of zonal wind in the stratosphere, characterized by alternating easterly and westerly phases, with a period close to 28 months. The QBO is able to modulate large-scale vertical and meridional circulations between tropics and subtropics (Punge et al., 2009), which impacts the East Asian climate. For example, it is reported that the southern China sea summer monsoon is weakened during the QBO westerly phase due to the associated anomalous Hadley-like circulation (Zheng et al., 2007). Kim et al. (2020) revealed that there was stronger precipitation over East Asia with a larger Madden–Julian oscillation (MJO) amplitude when the QBO is in easterly phase, which is because MJO-induced vertical motion and moisture transport are amplified by easterly QBO. Therefore, it is of interest to explore the influence of QBO on interannual variations in summertime O3 pollution over China and their connections during anomalous modes of sea surface temperature (SST) over the eastern tropical Pacific, as well as the mechanisms involved.
In the present study, the impact of QBO on O3 variations in China is examined based on GEOS-Chem simulations over 1981–2020 together with satellite retrievals. The paper is organized as follows. In Sect. 2, we describe the model, numerical experiments, the reanalysis datasets, the indices used in this study, and satellite retrieval data. The connection between QBO and tropospheric O3 in China and the possible mechanisms are explored in Sect. 3. Conclusions and discussion are given in Sect. 4.
2.1 GEOS-Chem model simulations
GEOS-Chem is a global three-dimensional chemical transport model with comprehensive chemistry mechanisms of O3–NOx–hydrocarbon–aerosol involved in the model (Zhai et al., 2021). In this study, we apply the GEOS-Chem version 12.9.3 to simulate O3 from 1981 to 2020. The horizontal grid of the model is (latitude × longitude) with 47 vertical levels above the surface. Stratospheric O3 is calculated based on the linearized chemistry mechanism (McLinden et al., 2000). Meteorological fields driving the GEOS-Chem simulations are from the Modern-Era Retrospective Analysis for Research and Applications version 2 (MERRA-2) (Gelaro et al., 2017), produced by NASA's Global Modeling and Assimilation Office.
Anthropogenic emissions in China are obtained from the Multi-resolution Emission Inventory for China (MEIC) (Zheng et al., 2018). Anthropogenic emissions outside China are adopted from the Community Emissions Data System (CEDS) version 20210205 (Hoesly et al., 2018). Biogenic emissions employ the Model of Emissions of Gases and Aerosols from Nature (MEGAN) version 2.1 (Guenther et al., 2012). Global biomass burning emissions are from the Global Fire Emissions Database version 4 (GFED4) (van der Werf et al., 2017). Soil NOx emissions are estimated in a soil parameterization scheme (Hudman et al., 2012). Lightning-produced NOx emissions are estimated in the model based on Murray et al. (2012) and Ott et al. (2010).
The GEOS-Chem simulations are performed to assess the impact of QBO on interannual variation of O3 covering the period of 1981–2020, following a 6-month model spin-up. In order to minimize the impact of interannual variations in emissions on the modeled O3 concentrations, the anthropogenic, biogenic burning, and natural emissions of O3 precursors are all fixed at their 2017 levels in the base simulation (BASE). The BASE simulation is analyzed to quantify the impact of QBO on O3, unless stated otherwise.
A sensitivity simulation (NO_CHN) is conducted with a different emission configuration than BASE, aiming to investigate the impact of domestic emissions in China on tropospheric O3 during QBO events. Different from BASE, anthropogenic emissions of NOx, CO, and VOCs in China are turned off in NO_CHN. Considering that O3 pollution is most critical during the boreal summer in many regions of China, only summer months (June–July–August, JJA) are examined in this study. Time-varying meteorological fields follow those from MERRA-2 during all simulations.
Figure 1 compares the year-by-year changes in JJA O3 concentrations in observations and BASE simulation. GEOS-Chem can roughly capture the interannual variation in surface O3 concentrations in China during 2016–2020. The spatial correlation coefficients between the observed and modeled year-by-year changes in O3 concentrations are about 0.5–0.6, except the 2018–2019 changes in O3, which could be attributed to the influence of the changes in precursor emissions on the observed O3 concentrations after Phase 2 of the Chinese Clean Air Action Plan launched in 2018 (Li et al., 2020).
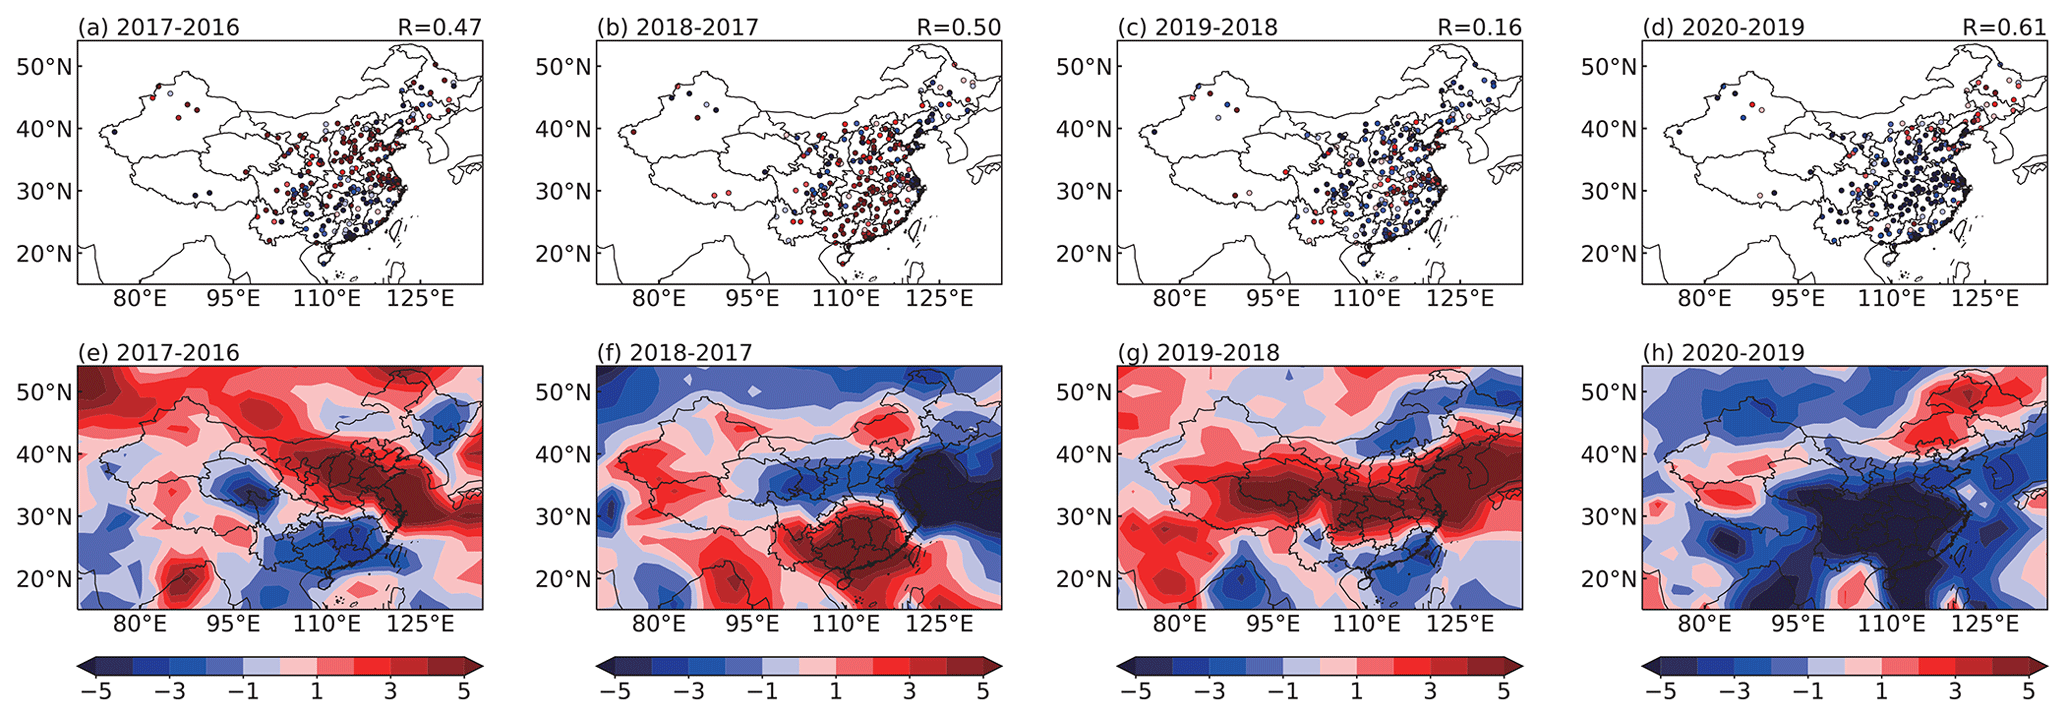
Figure 1Spatial distributions of year-by-year changes in the (a–d) observed and (e–h) modeled JJA O3 concentrations (ppbv) during 2016–2020. The O3 observations are obtained from the China National Environmental Monitoring Centre (CNEMC). Spatial correlation coefficients between simulations and observations are shown at the top right corner of (a–d).
2.2 QBO and Niño 3.4 indices
The QBO phases are determined by the zonal average of 30 hPa zonal wind over the Equator (5∘ S–5∘ N) based on MERRA-2 reanalysis (Fig. 2a), with the averages during JJA used in this study. Positive values denote westerly QBO phase (QBOW), while negative values denote easterly QBO phase (QBOE).

Figure 2Time series of the JJA mean (a) QBO index (m s−1) and (b) Niño 3.4 index (∘) over 1981–2020. The warm phase of SST anomalies over the eastern tropical Pacific includes 22 years (1982, 1983, 1986, 1987, 1990, 1991, 1992, 1993, 1994, 1997, 2002, 2003, 2004, 2005, 2006, 2009, 2012, 2014, 2015, 2017, 2018, 2019), and the cold phase includes 18 years (1981, 1984, 1985, 1988, 1989, 1995, 1996, 1998, 1999, 2000, 2001, 2007, 2008, 2010, 2011, 2013, 2016, 2020). Colored bars in (a) indicate years with Niño 3.4 index above zero. The black solid lines represent the indices based on MERRA-2 reanalysis. Bars are the QBO index from NCEP/NCEP reanalysis in (a) and the Niño 3.4 index from HadlSST1 in (b). The correlation coefficients of the indices between MERRA-2 and the NCEP–NCEP reanalysis and between MERRA-2 and HadlSST1 are shown in the top right of the panels.
The Niño 3.4 index averaged over JJA is used to characterize the warm and cold phases of SST anomalies over the eastern tropical Pacific in boreal summer, which is estimated as the SST anomalies over the Niño 3.4 region (5∘ S–5∘ N, 170–120∘ W) (Fig. 2b). A positive (negative) Niño 3.4 index indicates a warm (cold) phase when the SST in the eastern tropical Pacific is higher (lower) than the climatological mean (1981–2020). The 40 years can be divided into the warm and cold phases of the JJA SST anomalies over the eastern tropical Pacific according to the Niño 3.4 index.
The QBO and Niño 3.4 indices calculated in this study using MERRA-2 reanalysis are highly correlated with those derived from NCEP/NCAR (National Centers for Environmental Prediction and the National Center for Atmospheric Research) reanalysis and HadlSST1, with correlation coefficients of 0.97 and 0.98, respectively. It suggests that the QBO and the eastern tropical Pacific SST anomaly are well represented in the GEOS-Chem simulations, which is important for appropriately quantifying impacts of QBO on the interannual variations in O3 variations over China.
2.3 Satellite data
The monthly mean tropospheric column O3 (TCO) data from the Ozone Monitoring Instrument – Microwave Limb Sounder (OMI–MLS) that have been on board the Aura satellite since 2004 are used to verify the modeled impact of QBO on O3 pollution in China. The grid resolution of OMI–MLS data is 1.25∘ longitude × 1.0∘ latitude, covering the measurement area between 60∘ S and 60∘ N. TCO is calculated by subtracting MLS stratospheric column O3 from OMI total column O3 (Ziemke et al., 2011). The tropopause height is calculated according to 2 K km−1 lapse rate, which generally locates around 150 hPa in mid-latitudes (Jing et al., 2006; Peiro et al., 2018). In this study, we used 150 hPa as an approximation of the tropopause level for the calculation of TCO from the model simulation, although it may lead to a small bias in the magnitude of TCO.
3.1 Impact of QBO on tropospheric O3 in China
To illustrate the effects of QBO on summertime near-surface O3 over China, the spatial distribution of the correlation coefficients between the JJA O3 concentrations and concurrent QBO index is presented in Fig. 3a. It shows that the correlation coefficients between QBO index and surface O3 are insignificant over most regions of China, except for part of Qinghai province, which means that the single impact of QBO events cannot significantly affect O3 pollution in China. The lag-correlation analysis is also performed but shows even weaker correlations. Previous studies have shown that the impact of QBO can be compounded with ENSO (Sun et al., 2019; Xue et al., 2015). Motivated by these studies, we further examine the relationships between QBO and summertime O3 in the warm and cold phases of SST anomalies of the eastern tropical Pacific. Note that the correlation coefficient between QBO index and Niño 3.4 index is only 0.09, indicating that there is no direct linear relationship between QBO and ENSO, which has also been reported in previous studies (Christiansen et al., 2016; Sun et al., 2019).

Figure 3(a) Spatial distribution of the correlation coefficients between JJA near-surface O3 concentrations and QBO index over 1981–2020; (b) and (c) are the same as (a), but during years that have positive (22 years) and negative (18 years) SST anomalies over the eastern tropical Pacific, respectively. The stippled areas indicate statistical significance at the 90 % confidence level.
The influences of QBO on O3 under different SST anomalies over the eastern tropical Pacific are quite different (Fig. 3b and c). During years under the warm SST phase, significant correlations between JJA near-surface O3 concentrations and QBO index are located over the latitudinal band of 25–40∘ N in China. In central China (92.5–112.5∘ E, 26–38∘ N), the correlation coefficient between the regionally averaged O3 concentration and QBO index under the warm phase is 0.53, which is much higher than 0.23 during the whole 40-year period. However, under the cold ENSO phase, there is no significant correlation over China, with a regional correlation coefficient of −0.06. These results suggest that QBO may have a remarkable effect on tropospheric O3 over central China during the warm anomaly of the eastern tropical Pacific SST, while it has little impact on O3 in China during years with cold SST anomalies. Once there is a coincidence of QBOW and warm SST anomaly in the eastern tropical Pacific, the combined effects could worsen the O3 pollution over China. Therefore, the three strongest QBOW (1990, 1997, and 2019) and QBOE (1994, 2012, and 2018) years under the warm phase of the SST anomaly during the past four decades are chosen to further quantify the influence of QBO on O3 pollution in China.
Figure 4 presents JJA O3 anomalies in the selected QBOW and QBOE years relative to the climatological mean (1981–2020). Under the combined influence of QBOW and the warm SST anomaly, positive O3 concentration anomalies are observed over central and southern China. In contrast, the surface O3 concentration increases over southern China and decreases in central China during QBOE years. The increases in O3 levels over southern China under the warm SST anomaly in both QBOW and QBOE years are due to the positive correlation between Niño 3.4 index and tropospheric O3 concentrations in southern China. Previous studies have reported that O3 concentrations increased over southern China during El Niño years, which is related to O3 convergence due to weakened southerlies (Yang et al., 2022b; Li et al., 2022). The different characteristics of O3 changes in central China highlight the role of QBO in affecting the distribution of O3 over China under the warm SST anomalies of the eastern tropical Pacific.
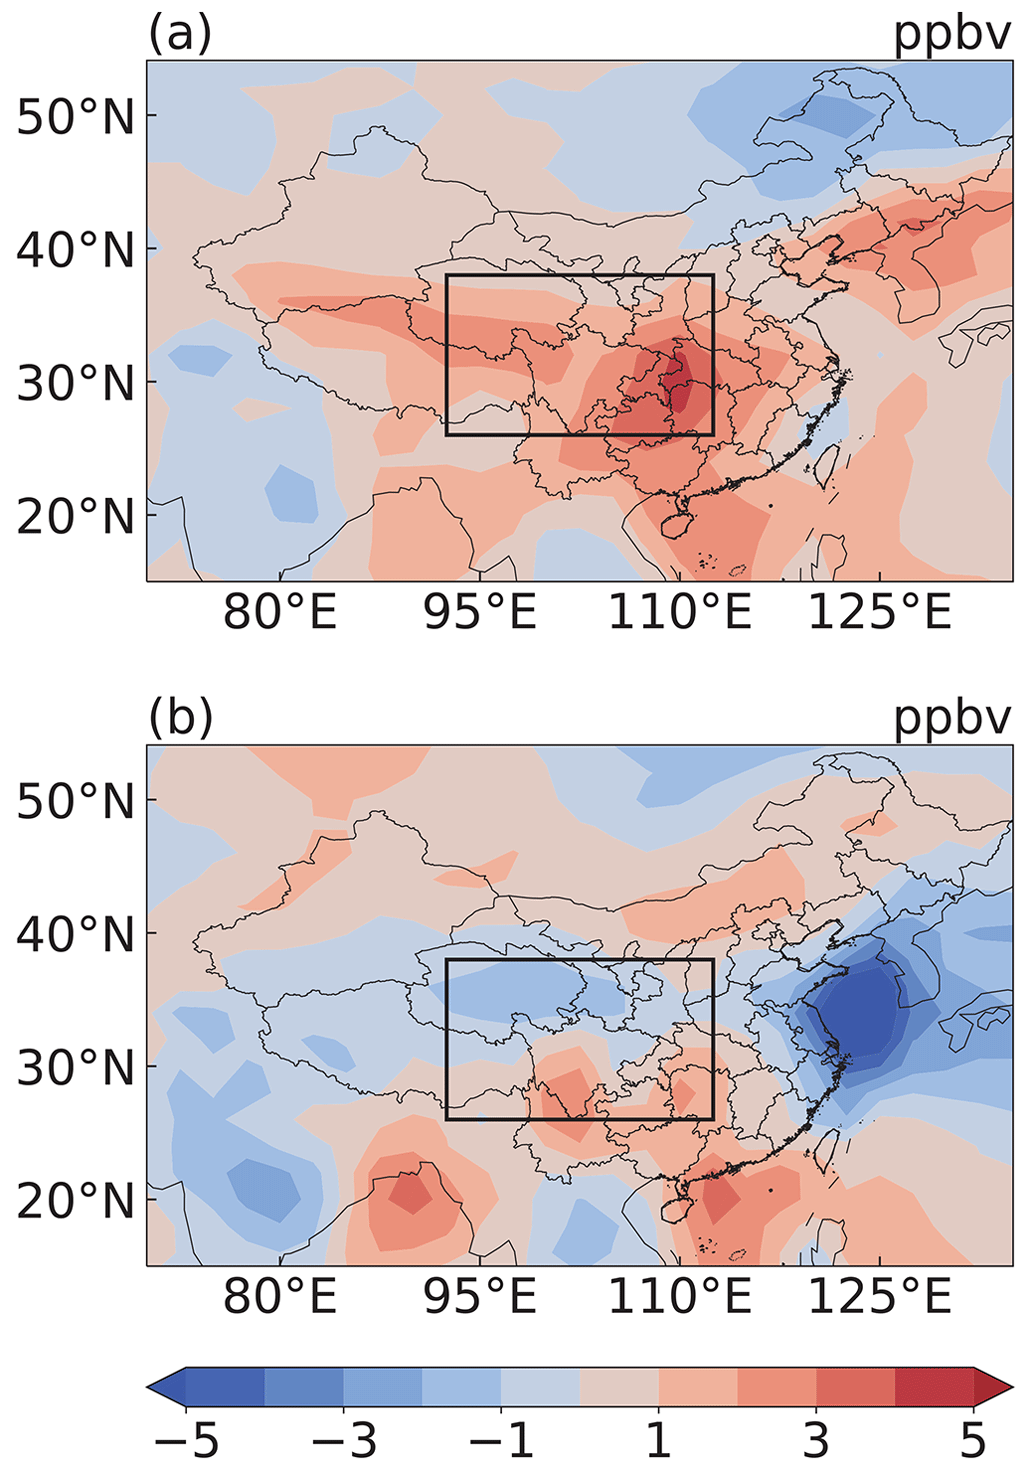
Figure 4Spatial distribution of JJA surface O3 concentration anomalies of (a) the selected three QBOW years (1990, 1997, and 2019) and (b) the selected three QBOE years (1994, 2012, and 2018), respectively, relative to the climatological average (1981–2020).
Figure 5 presents the spatial distribution near the surface and pressure–longitude cross sections of absolute and percentage differences between QBOW and QBOE in O3 concentrations over China under the warm SST anomaly. Compared with QBOE years, positive O3 concentration anomalies are located between 25 and 40∘ N over China during QBOW, especially over central China where the maximum anomaly exceeds 3 ppb (parts per billion) (or 5 % relative to the climatological average). The differences are higher than the standard deviation during the analyzed period, suggesting that the differences are significant. The simulated O3 pollution enhancement is also shown in the vertical distribution of the zonal mean (26–38∘ N) composite differences (Fig. 5b, d). For QBOW years, increased O3 occurred in the whole troposphere, with the maximum increase of 2–3 ppb (3 %–5 %) between 850 and 500 hPa over central China, indicating a high probability of enhanced O3 pollution during QBOW relative to QBOE. O3 concentrations also increase in the coastal area of eastern China, which is mainly due to the decreases in O3 concentrations in the selected QBOE years relative to the climatological mean, as the O3 concentrations only slightly increase in the QBOW years. The correlation between O3 and QBO index over this region is not as strong as that over central China, which indicates that the anomalous increase in O3 over the coastal area of eastern China may not be a typical feature of the QBO impact and will not be discussed hereafter.
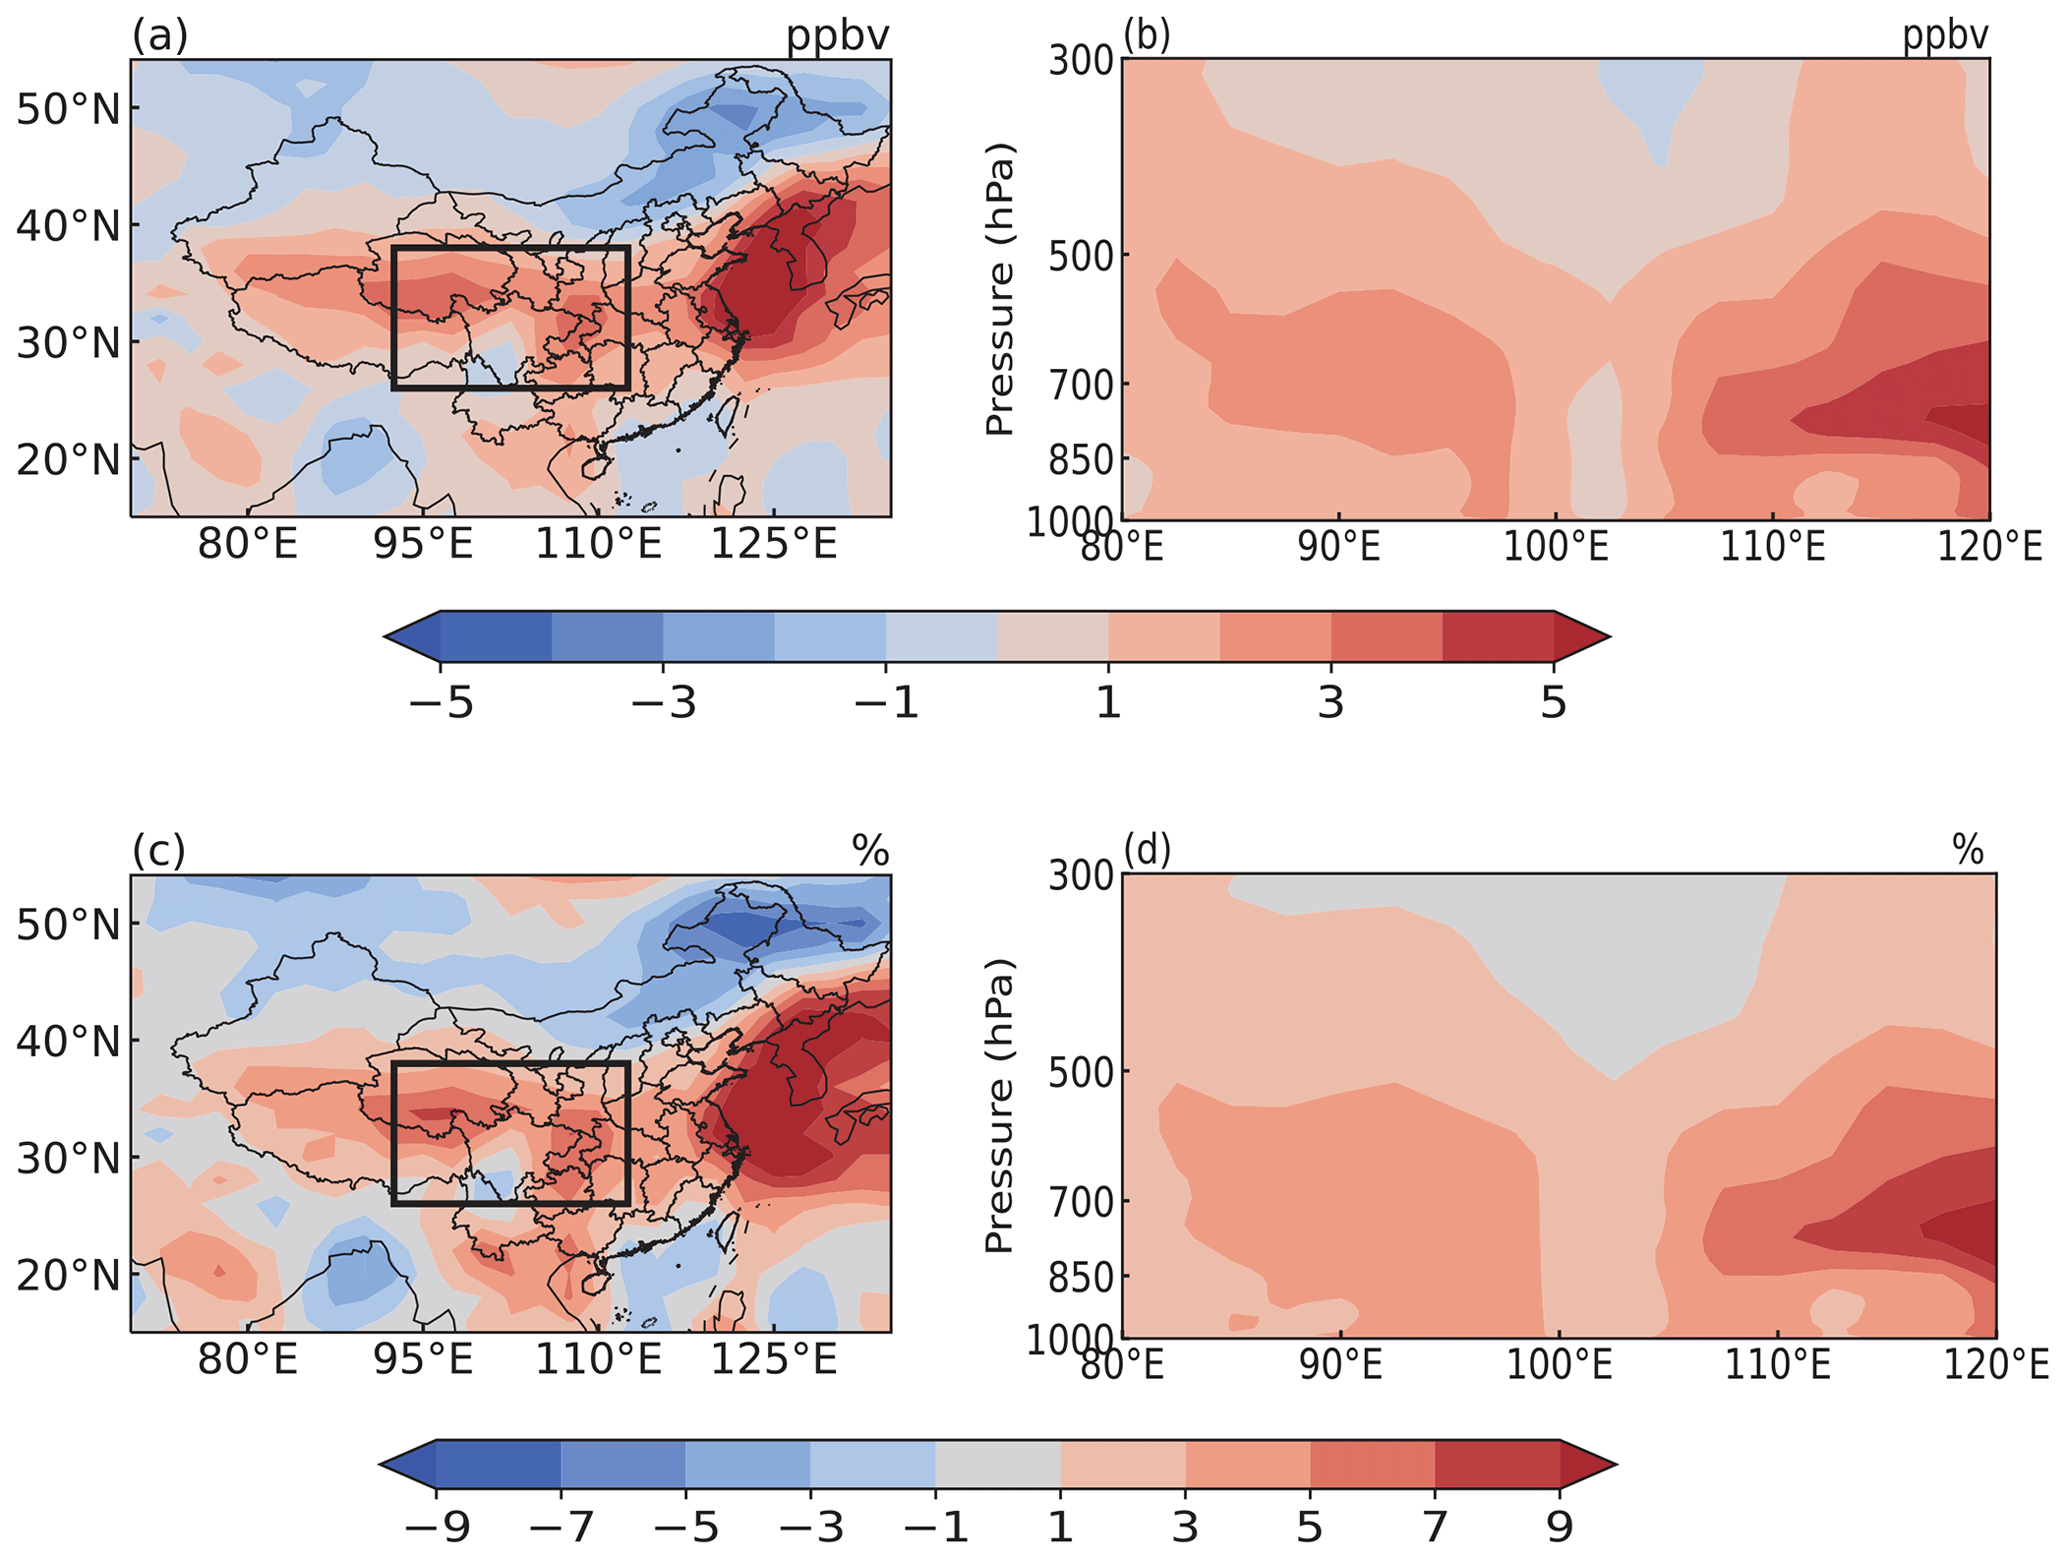
Figure 5Spatial distributions of (a) absolute (ppbv) and (c) percentage (%) differences relative to the climatological mean (1981–2020) in JJA near-surface O3 concentrations between the selected three QBOW years (1990, 1997, and 2019) and QBOE years (1994, 2012, and 2018) (QBOW–QBOE). The pressure–longitude cross sections averaged over the latitudes of 26–38∘ N show (b) absolute (ppbv) and (d) percentage (%) differences relative to the climatological mean in JJA O3 concentrations between the selected three QBOW years and QBOE years.
The modeled difference in summertime tropospheric O3 between the QBOW and QBOE years can also be observed from satellite (Fig. 6). The OMI–MLS-retrieved TCOs are higher in QBOW than QBOE years between 25–35∘ N in China, which is in accordance with the model results. Averaged over central China, the difference in TCO between the selected QBOW (2019) and QBOE years (2012 and 2018) from satellite data is 2.8 DU, similar to the 2.5 DU from model simulation. Both model simulations and satellite retrievals suggest that the QBO can significantly influence tropospheric O3 in China. Also, the simulated change in TCO is also higher than the standard deviation (1.4 DU). However, it is also noted that the spatial variation of the differences in TCO varies between OMI–MLS and model simulations. It is partly because the emissions were fixed at the 2017 levels during model simulations. These potential biases in satellite retrievals also strongly contribute to the different spatial pattern (Schoeberl et al., 2007; Liu et al., 2010; Ziemke et al., 2006, 2014).
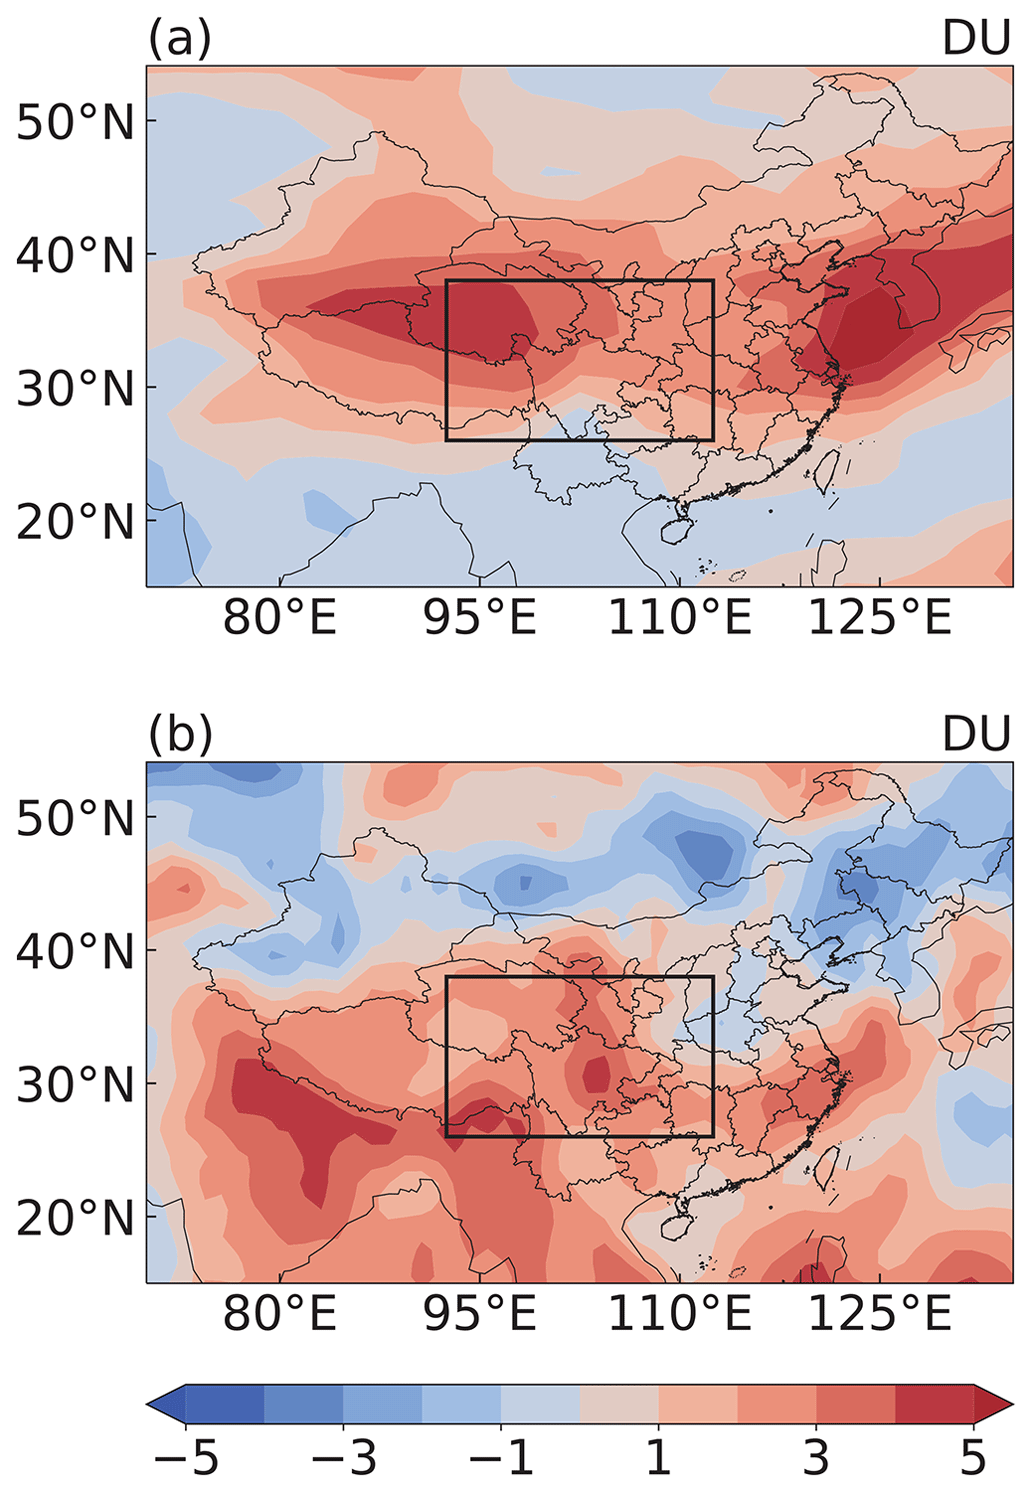
Figure 6Spatial distribution of JJA tropospheric column O3 (TCO, DU) differences between the selected QBOW year (2019) and QBOE year (2012, 2018) based on (a) GEOS-Chem simulations and (b) Aura OMI–MLS.
3.2 Mechanism of the QBO impacts on O3 in China
Composite differences of relevant meteorological variables between the selected QBOW and QBOE years are shown in Fig. 7 to illustrate the mechanisms of the QBO impacts on O3 in China. During QBOW years under the warm SST anomaly, the decrease in cloud fraction (Fig. 7g) allows more solar radiation to reach the surface (Fig. 7h), and the RH also decreases over central China (Fig. 7e) relative to QBOE years. These changes in meteorological parameters tend to increase the photochemical production of O3. However, the air temperature significantly decreases in the lower (Fig. 7i) and middle troposphere (Fig. 7f) in QBOW years compared to QBOE years, which suppresses the O3 production. Integrated process rate analysis has been widely conducted to assess the contribution of individual chemical or physical processes to the production and distribution of O3 pollution per unit time in the study domain (Lou et al., 2015; Qu et al., 2021; Zhu et al., 2021). The combined effect of the changes in these meteorological parameters leads to a reduction in net O3 chemical production by about 1 % over central China in QBOW compared to QBOE years based on an integrated process rate analysis (Table S1). Therefore, the chemical production change is not the major process causing the O3 pollution deterioration during QBOW years under the warm SST anomaly.
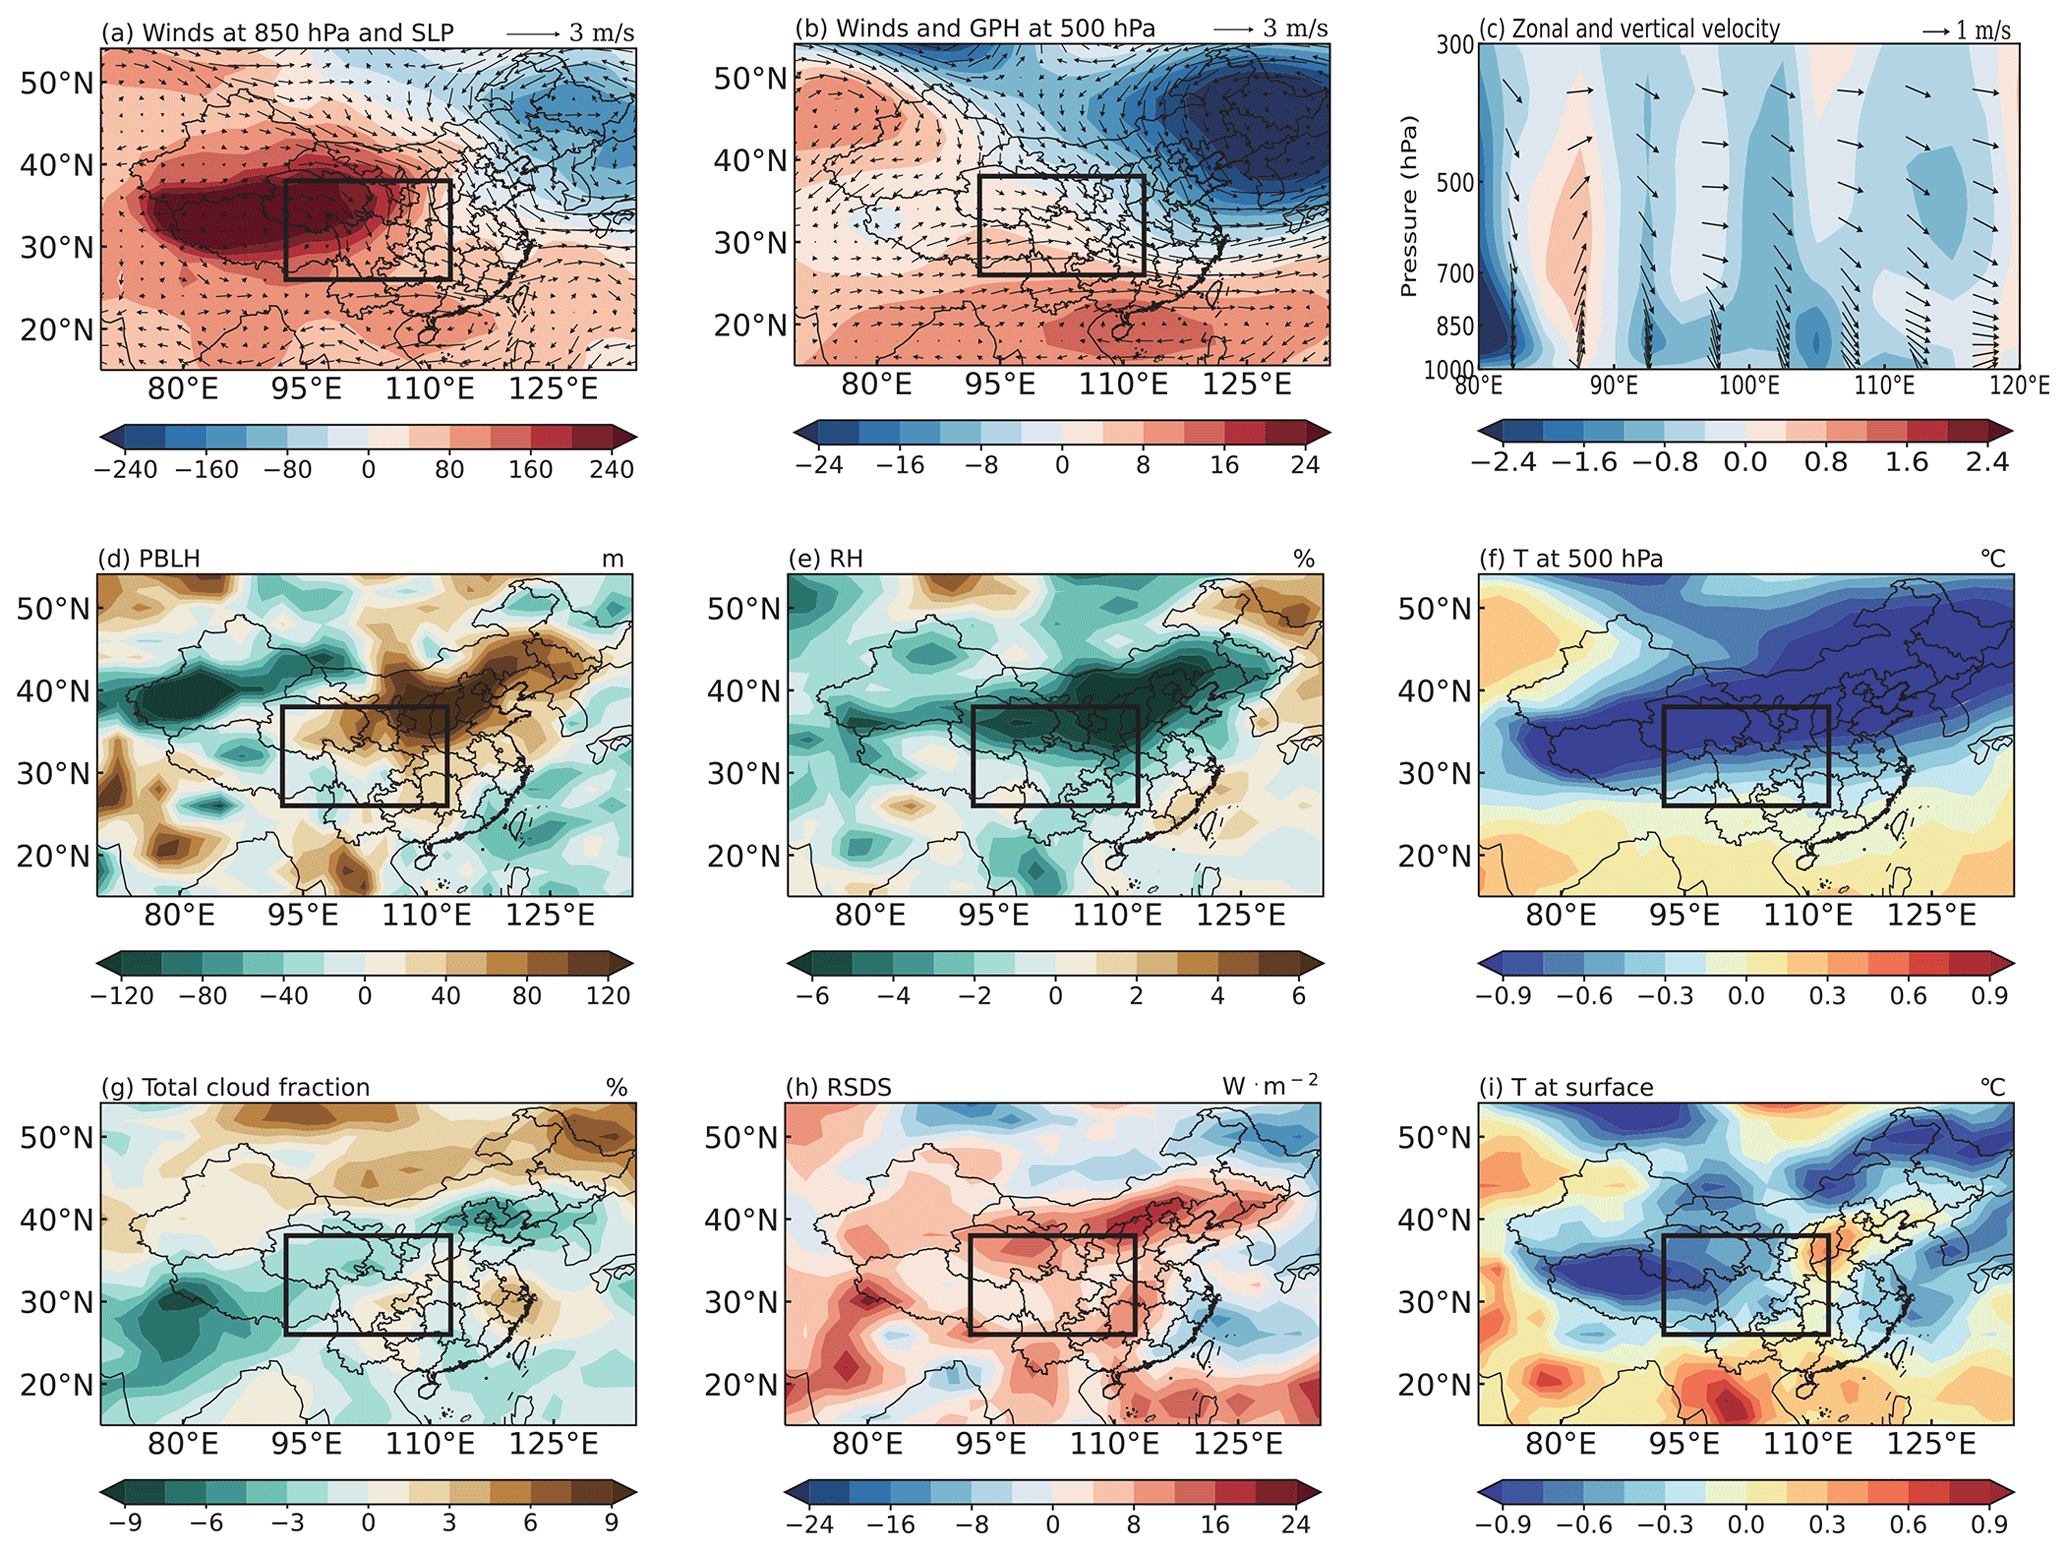
Figure 7Composite differences in the spatial distribution of JJA mean (a) wind fields (m s−1, vector) at 850 hPa and sea-level pressure (SLP, Pa, contour), (b) wind fields (m s−1, vector) and geopotential height (GPH, m, contour) at 500 hPa, (d) planetary boundary layer height (PBLH, m), (e) relative humidity (RH, %) at the surface, (f) air temperature (T, ∘) at 500 hPa, (g) total cloud fraction (%), (h) downwelling shortwave radiation at the surface (RSDS, W m−2), and (i) surface air temperature (T, ∘) between three QBOW years (1990, 1997, and 2019) and QBOE years (1994, 2012, and 2018) (QBOW–QBOE). In (c) is the differences in JJA mean zonal wind (m s−1, vector) and vertical velocity (OMEGA, Pa s−1, vector and contour) multiplied by a factor of −100, averaged over 26–38∘ N between three QBOW years (1990, 1997, and 2019) and QBOE years (1994, 2012, and 2018) (QBOW–QBOE). The solid black boxes mark central China (92.5–112.5∘ E, 26–38∘ N).
Compared with QBOE years, anomalous northwesterly winds at 850 hPa occurred over central China during the QBOW years, located at the east edge of an anomalous high over western China (Fig. 7a). Under the influence of this anomalous high, the anomalous downdraft throughout the troposphere over central China (Fig. 7c) can reduce the vertical transport of O3 to the upper troposphere, which leads to an O3 accumulation in the lower and middle troposphere. In addition, the increase in planetary boundary layer (PBL) height (Fig. 7d) favors the vertical mixing of air within the PBL and the O3-enriched air above the PBL (Ma et al., 2021).
Considering the effect of winds on O3 transport, the horizontal JJA O3 mass fluxes from the surface to 850 hPa and the vertical mass flux at 850 hPa over central China are calculated and summarized in Table 1. Due to an anomalous northwesterly, the outflow transport of O3 from the north boundary of central China is reduced by 1.11 Tg during QBOW years relative to QBOE years. However, through the east boundary of central China, an inflow transport of O3 is reduced by 1.35 Tg, which overwhelms the gain from the reduced northward transport. The O3 flux changes through the west and south boundaries are relatively small and almost offset each other. The overall changes in the horizontal transport result in a decrease in O3 mass by 0.29 Tg from surface to 850 hPa in QBOW relative to QBOE years, suggesting that the horizontal advection change is also not the primary process causing the enhanced O3 pollution.
Table 1The horizontal mass flux (Tg) of JJA O3 from the surface to 850 hPa and the vertical mass flux (Tg) at 850 hPa over central China (92.5–112.5∘ E, 26–38∘ N). The values are averaged over the selected three QBOW years (1990, 1997, and 2019) and QBOE (1994, 2012, and 2018) years and their differences (QBOW–QBOE). Positive values indicate incoming fluxes, and negative values indicate outgoing fluxes.
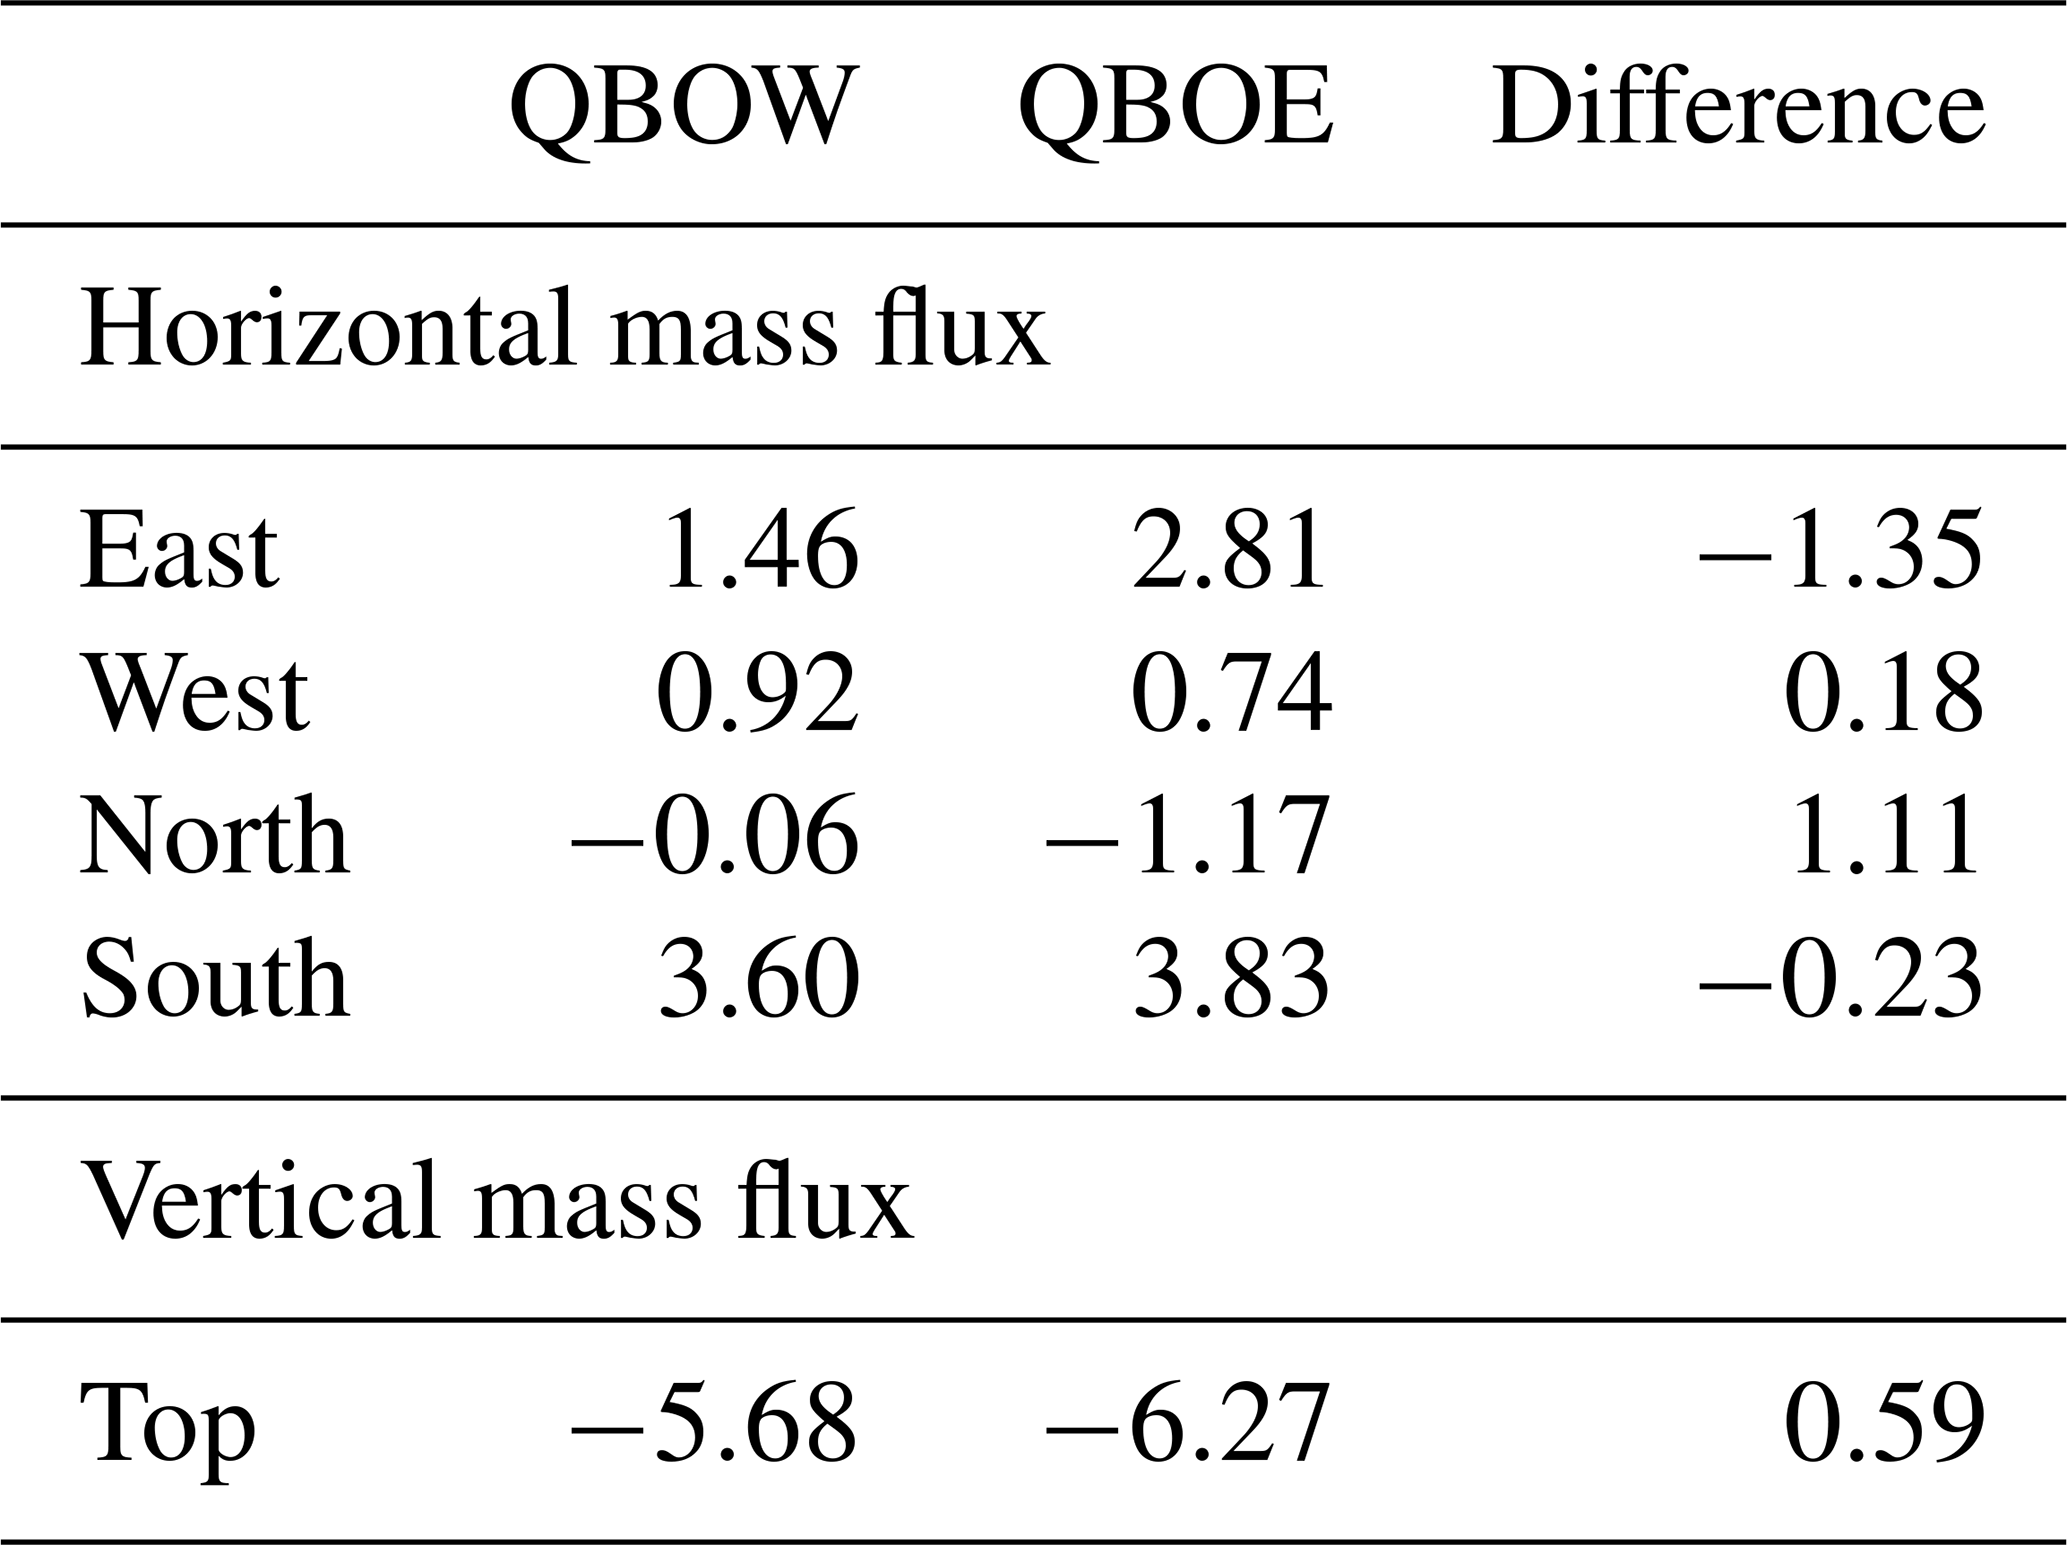
The anomalous downdraft over central China weakens the upward mixing of high lower-tropospheric O3 concentrations and causes an anomalous downward transport of O3 by 0.59 Tg at 850 hPa, contributing to the increase in surface O3 concentrations. Therefore, the impact of the QBO under the warm SST anomaly on the distribution of tropospheric O3 over central China is mainly via changes in the vertical motion.
3.3 Role of Chinese domestic anthropogenic emission
Comparison of the O3 anomaly in BASE and NO_CHN identifies the impact of Chinese domestic emissions on O3 concentrations. When domestic anthropogenic emissions of O3 precursors are turned off, JJA mean near-surface O3 concentrations largely increase across China, especially between 30–40∘ N, with maximum increases exceeding 5 ppb during QBOW compared to QBOE years (Fig. 8a). Averaged over central China, the anomalous increase in the near-surface O3 concentration is 3.0 ppb in NO_CHN, even higher than that (1.7 ppb) in BASE simulation. It results from the reduction in the net export of horizontal mass flux of O3 due to the removal of domestic emissions (Table S2), leading to a more significant increase in O3 over central China in the NO_CHN experiment.
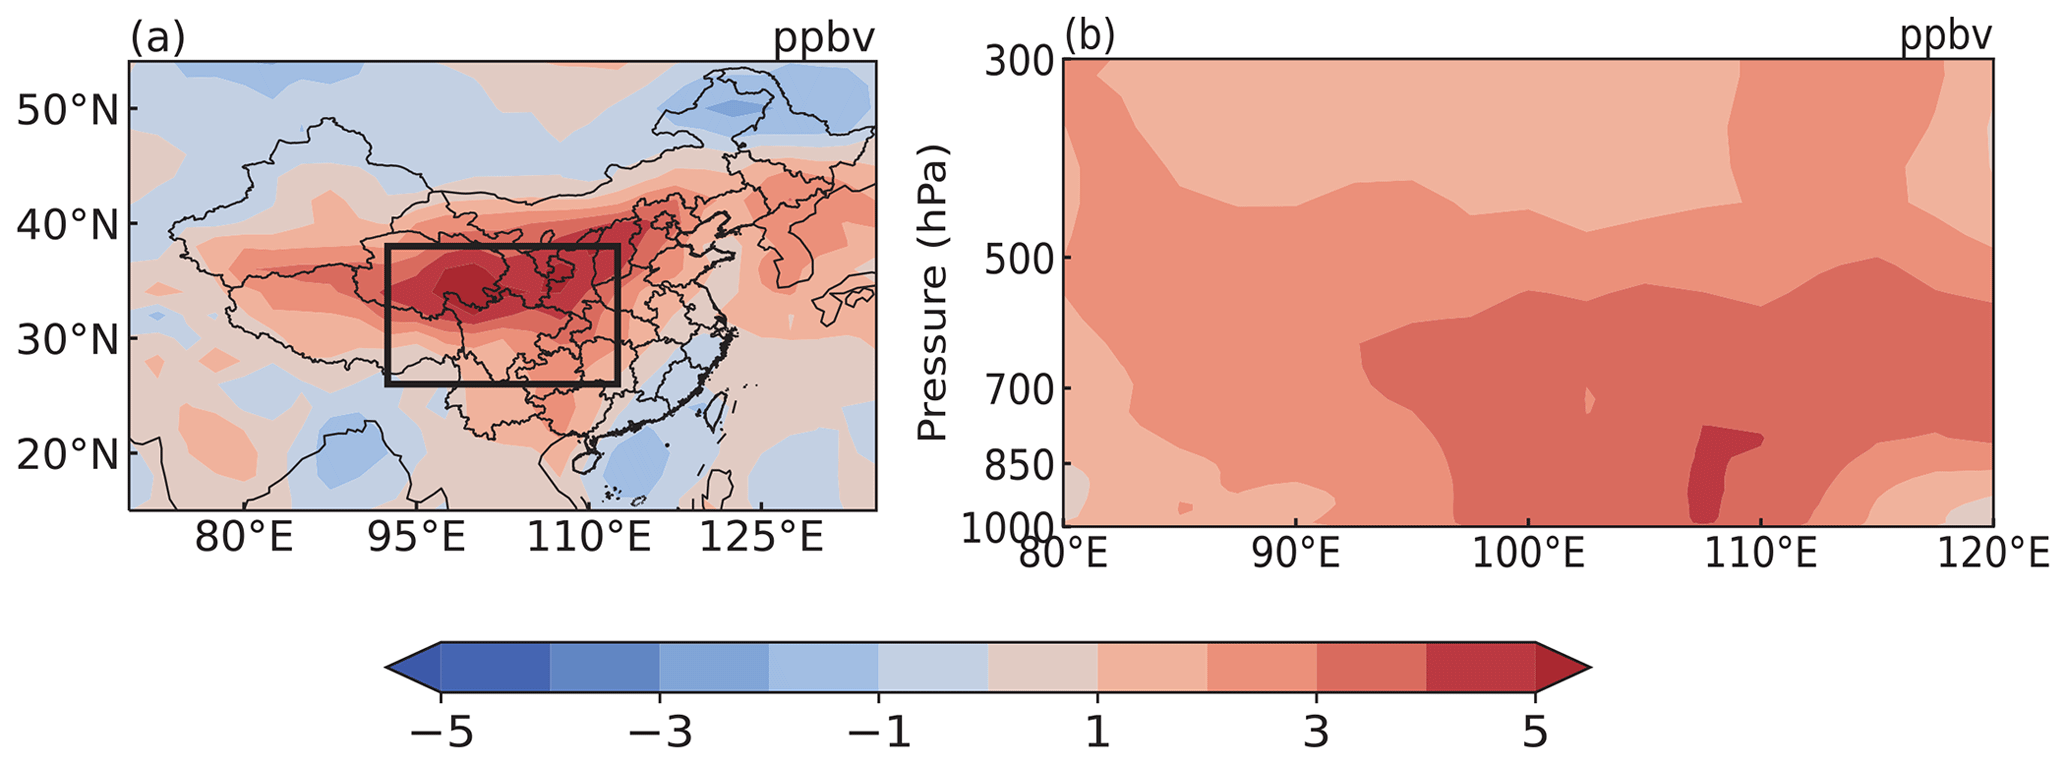
Figure 8(a) Spatial distribution of differences in JJA near-surface O3 concentrations (ppbv) and (b) the pressure–longitude cross sections averaged over the latitudes of 26–38∘ N of the differences in JJA O3 concentrations (ppbv) between three QBOW years (1990, 1997, and 2019) and QBOE years (1994, 2012, and 2018) (QBOW–QBOE) from the simulation that has the Chinese anthropogenic emissions of O3 precursors turned off (NO_CHN). The solid black box in (a) marks central China.
Figure 8b shows the simulated vertical distribution of O3 concentration difference between the selected QBOW and QBOE years from the NO_CHN experiment. The positive O3 anomaly in the troposphere is similar to that from the BASE experiment, but the increases are mainly between 95 and 115∘ E from the surface to 500 hPa over central China. These results suggest that the vertical transport process dominates the increase in summertime tropospheric O3 concentrations over central China during QBOW under the warm SST anomaly of the eastern tropical Pacific. In the NO_CHN experiment, the reduction in the O3 horizontal export results in a more significant increase of O3 concentration during QBOW compared to QBOE years.
Based on GEOS-Chem model simulations over 1981–2020, we investigate the impacts of different QBO events on the surface and tropospheric O3 over China. Although only weak correlations are found between JJA mean near-surface O3 concentrations and QBO index over China, their positive correlation is significant in years with warm SST anomalies over the eastern tropical Pacific. Averaged over central China (92.5–112.5∘ E, 26–38∘ N), the correlation coefficient between the regional near-surface O3 concentration and QBO index during the warm ENSO phase is 0.53. It suggests that the co-occurrence of the westerly phase of QBO and warm SST anomalies over the eastern tropical Pacific would exacerbate summertime O3 pollution in China. Compared with QBOE years, near-surface O3 concentrations increase by up to 3 ppb (5 % relative to the average) across China during QBOW, especially over central China, and the increase in O3 extends from the surface to the upper troposphere, especially between 850 and 500 hPa.
A combined effect of changes in meteorological conditions (i.e., less cloud, higher RH, and lower temperature) leads to a slightly lower net O3 chemical production rate in QBOW years than in QBOE years. Central China is influenced by anomalous northwesterlies during QBOW, which weakens O3 import from the east boundary and the export from the north boundary of central China, leading to a net O3 export of 0.29 Tg during QBOW, compared to QBOE years, from surface to 850 hPa. However, change in the vertical transport is the main process causing O3 concentration increases in QBOW years. An anomalous downdraft leads to the O3 mass increase of 0.59 Tg below 850 hPa by suppressing vertical mixing and promoting O3 accumulation in the lower troposphere. The sensitivity experiment with Chinese domestic anthropogenic emissions of O3 precursors turned off shows a greater increase of O3 (3.0 ppb) than that in the default simulation (1.7 ppb). It indicates that the O3 increase over central China during QBOW years under the warm SST anomaly is mainly due to the anomalous vertical transport, while a decrease in local chemical production partly offsets the O3 increases in central China. Moreover, the positive anomaly of TCO based on GEOS-Chem model simulation is consistent with the satellite retrieval from the OMI–MLS.
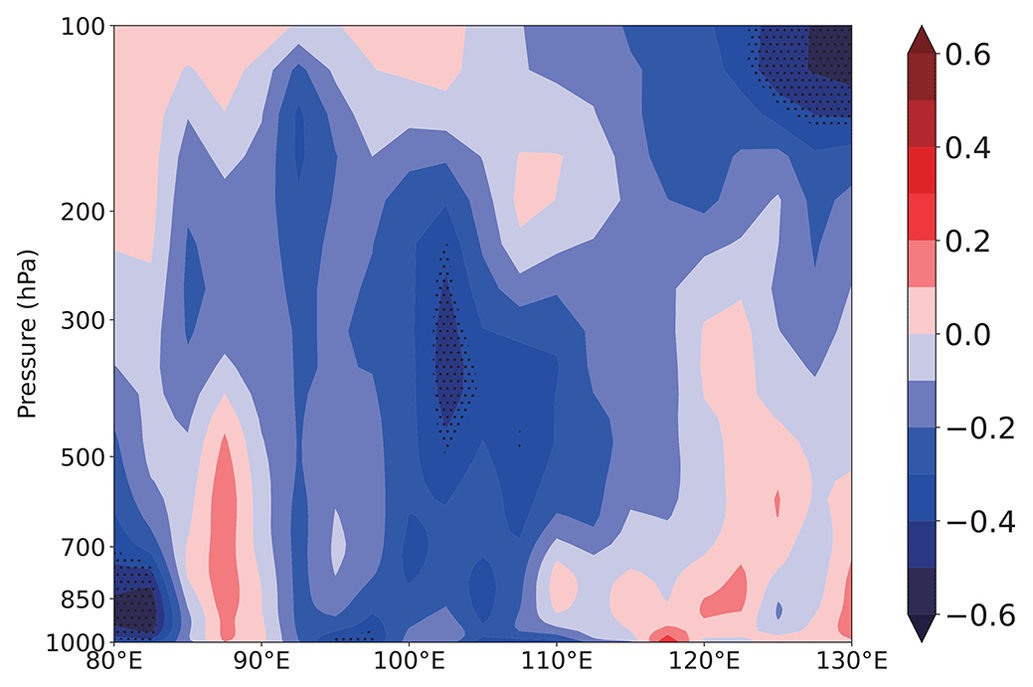
Figure 9Pressure–longitude distribution of the correlation coefficients between QBO index and vertical velocity (OMEGA, multiplied by a factor of −100) in JJA averaged over 26–38∘ N for years with the warm SST anomaly. The stippled areas indicate statistical significance at the 90 % confidence level.
This study explores the effect of QBO on tropospheric O3 over China and the underlying mechanisms during the warm SST anomalies of the eastern tropical Pacific, which can improve the understanding of causes of O3 pollution over China. For a climatological average, prevailing easterly winds at 30 hPa dominate the Equator, accompanied by the upward motion over central China within the troposphere. During QBOW years, the prevailing winds reverse to westerlies, which may induce the anomalous downward motion over central China. However, the dynamical mechanism of how the stratospheric QBO drives changes in the vertical motion and circulation patterns in China along with the SST anomaly over the eastern tropical Pacific is out of the scope of this study and merits further investigation. Nevertheless, the QBO index is positively correlated with the vertical velocity throughout the troposphere over China, especially between 100 and 110∘ E (Fig. 9), where the lower tropospheric O3 increases the most in the NO_CHN experiment during QBOW years under the warm SST anomaly. These positive correlations demonstrate that the weakened (strengthened) upward motion increases (decreases) tropospheric O3 concentrations during QBOW (QBOE) years, confirming that changes in the vertical transport driven by QBO events play an important role in modulating summertime O3 pollution over China. The phenomenon of changes in tropospheric O3 between different QBO phases is also verified by satellite retrievals. Compared with cold conditions, stratospheric QBO forcing is strengthened due to the increase of tropospheric temperature and changes of analytical and parametric waves under the warm SST anomalies of the eastern tropical Pacific, which causes a faster downward propagation in QBO (Taguchi, 2010; Schirber et al., 2015; Geller et al., 2016; Zheng et al., 2007). This may explain why the correlation coefficient between the O3 and QBO indices is insignificant but shows a significant correlation during the warm SST anomalies of the eastern tropical Pacific. The mechanisms deserve further investigation in future studies. Also, it is assumed that the vertical motion over China is influenced by the anomaly of Walker circulation caused by the QBO (Huangfu et al., 2021). Although the physical mechanism remains elusive, we believe that our findings would be useful for future air pollution prediction and control.
The GEOS-Chem model is available at https://doi.org/10.5281/zenodo.3974569 (The International GEOS-Chem User Community, 2020). MERRA-2 reanalysis data can be downloaded at http://geoschemdata.wustl.edu/ExtData/GEOS_2x2.5/MERRA2 (MERRA-2, 2022). The monthly mean tropospheric O3 data from OMI–MLS are downloaded from https://acd-ext.gsfc.nasa.gov/Data_services/cloud_slice/new_data.html (OMI/MLS Tropo O3, 2023). Our model results are available at https://doi.org/10.5281/zenodo.6793180 (Yang, 2022). O3 observations are obtained from the public website of the China Ministry of Ecology and Environment (https://quotsoft.net/air/, Wang, 2020).
The supplement related to this article is available online at: https://doi.org/10.5194/acp-23-1533-2023-supplement.
YY designed the research; ML performed simulations and analyzed the data. All authors, including HW, LH, PW, and HL, discussed the results and wrote the paper.
The contact author has declared that none of the authors has any competing interests.
Publisher's note: Copernicus Publications remains neutral with regard to jurisdictional claims in published maps and institutional affiliations.
Hailong Wang acknowledges the support by the US Department of Energy (DOE), Office of Science, Office of Biological and Environmental Research (BER), as part of the Earth and Environmental System Modeling program. The Pacific Northwest National Laboratory (PNNL) is operated for DOE by the Battelle Memorial Institute under contract no. DE-AC05-76RLO1830.
This research has been supported by the National Natural Science Foundation of China (grant nos. 41975159 and 42293320), the National Key Research and Development Program of China (grant nos. 2020YFA0607803 and 2019YFA0606800), the Jiangsu Science Fund for Carbon Neutrality (grant no. BK20220031), and the Natural Science Foundation of Jiangsu Province for Distinguished Young Scholars (grant no. BK20211541).
This paper was edited by Jayanarayanan Kuttippurath and reviewed by two anonymous referees.
Camalier, L., Cox, W. M., and Dolwick, P.: The effects of meteorology on ozone in urban areas and their use in assessing ozone trends, Atmos. Environ., 41, 7127–7137, https://doi.org/10.1016/j.atmosenv.2007.04.061, 2007.
Christiansen, B., Yang, S., and Madsen, M. S.: Do strong warm ENSO events control the phase of the stratospheric QBO?, Geophys. Res. Lett., 43, 10489–10495, https://doi.org/10.1002/2016gl070751, 2016.
Feng, Y., Ning, M., Lei, Y., Sun, Y., Liu, W., and Wang, J.: Defending blue sky in China: Effectiveness of the “Air Pollution Prevention and Control Action Plan” on air quality improvements from 2013 to 2017, J. Environ. Manage., 252, 109603–109603, https://doi.org/10.1016/j.jenvman.2019.109603, 2019.
Gao, J., Yang, Y., Wang, H., Wang, P., Li, H., Li, M., Ren, L., Yue, X., and Liao, H.: Fast climate responses to emission reductions in aerosol and ozone precursors in China during 2013–2017, Atmos. Chem. Phys., 22, 7131–7142, https://doi.org/10.5194/acp-22-7131-2022, 2022.
Gelaro, R., McCarty, W., Suárez, M. J., Todling, R., Molod, A., Takacs, L., Randles, C. A., Darmenov, A., Bosilovich, M. G., Reichle, R., Wargan, K., Coy, L., Cullather, R., Draper, C., Akella, S., Buchard, V., Conaty, A., da Silva, A. M., Gu, W., Kim, G.-K., Koster, R., Lucchesi, R., Merkova, D., Nielsen, J. E., Partyka, G., Pawson, S., Putman, W., Rienecker, M., Schubert, S. D., Sienkiewicz, M., and Zhao, B.: The Modern-Era Retrospective Analysis for Research and Applications, Version 2 (MERRA-2), J. Clim., 30, 5419–5454, https://doi.org/10.1175/JCLI-D-16-0758.1, 2017.
Gong, C. and Liao, H.: A typical weather pattern for ozone pollution events in North China, Atmos. Chem. Phys., 19, 13725–13740, https://doi.org/10.5194/acp-19-13725-2019, 2019.
Geller, M. A., Zhou, T., and Yuan, W.: The QBO, gravity waves forced by tropical convection, and ENSO, J. Geophys. Res.-Atmos., 121, 8886–8895, https://doi.org/10.1002/2015JD024125, 2016.
Guenther, A. B., Jiang, X., Heald, C. L., Sakulyanontvittaya, T., Duhl, T., Emmons, L. K., and Wang, X.: The Model of Emissions of Gases and Aerosols from Nature version 2.1 (MEGAN2.1): an extended and updated framework for modeling biogenic emissions, Geosci. Model Dev., 5, 1471–1492, https://doi.org/10.5194/gmd-5-1471-2012, 2012.
Hoesly, R. M., Smith, S. J., Feng, L., Klimont, Z., Janssens-Maenhout, G., Pitkanen, T., Seibert, J. J., Vu, L., Andres, R. J., Bolt, R. M., Bond, T. C., Dawidowski, L., Kholod, N., Kurokawa, J.-I., Li, M., Liu, L., Lu, Z., Moura, M. C. P., O'Rourke, P. R., and Zhang, Q.: Historical (1750–2014) anthropogenic emissions of reactive gases and aerosols from the Community Emissions Data System (CEDS), Geosci. Model Dev., 11, 369–408, https://doi.org/10.5194/gmd-11-369-2018, 2018.
Huangfu, J., Tang, Y., Ma, T., Chen, W., and Wang, L.: Influence of the QBO on tropical convection and its impact on tropical cyclone activity over the western North Pacific, Clim. Dyn., 57, 657–669, https://doi.org/10.1007/s00382-021-05731-x, 2021.
Hudman, R. C., Moore, N. E., Mebust, A. K., Martin, R. V., Russell, A. R., Valin, L. C., and Cohen, R. C.: Steps towards a mechanistic model of global soil nitric oxide emissions: implementation and space based-constraints, Atmos. Chem. Phys., 12, 7779–7795, https://doi.org/10.5194/acp-12-7779-2012, 2012.
Jiang, Z. and Li, J.: Impact of eastern and central Pacific El Niño on lower tropospheric ozone in China, Atmos. Chem. Phys., 22, 7273–7285, https://doi.org/10.5194/acp-22-7273-2022, 2022.
Jing, P., Cunnold, D., Choi, Y., and Wang, Y.: Summertime tropospheric ozone columns from Aura OMI/MLS measurements versus regional model results over the United States, Geophys. Res. Lett., 33, L17817, https://doi.org/10.1029/2006GL026473, 2006
Kim, H., Son, S. W., and Yoo, C.: QBO modulation of the MJO-related precipitation in East Asia, J. Geophys. Res., 125, e2019JD031929, https://doi.org/10.1029/2019JD031929, 2020.
Li, H., Fan, K., He, S., Liu, Y., Yuan, X., and Wang, H.: Intensified Impacts of Central Pacific ENSO on the Reversal of December and January Surface Air Temperature Anomaly over China since 1997, J. Clim., 34, 1601–1618, https://doi.org/10.1175/jcli-d-20-0048.1, 2020.
Li, K., Jacob, D. J., Liao, H., Shen, L., Zhang, Q., and Bates, K.: Anthropogenic drivers of 2013–2017 trends in summer surface ozone in China, P. Natl. Acad. Sci. USA, 116, 422–427, https://doi.org/10.1073/pnas.1812168116, 2019.
Li, K., Jacob, D. J., Shen, L., Lu, X., De Smedt, I., and Liao, H.: Increases in surface ozone pollution in China from 2013 to 2019: anthropogenic and meteorological influences, Atmos. Chem. Phys., 20, 11423–11433, https://doi.org/10.5194/acp-20-11423-2020, 2020.
Li, M., Yang, Y., Wang, P., Ji, D., and Liao, H.: Impacts of strong El Niño on summertime near-surface ozone over China, Atmos. Ocean. Sci. Lett., 15, 100193, https://doi.org/10.1016/j.aosl.2022.100193, 2022.
Liu, X., Bhartia, P. K., Chance, K., Spurr, R. J. D., and Kurosu, T. P.: Ozone profile retrievals from the Ozone Monitoring Instrument, Atmos. Chem. Phys., 10, 2521–2537, https://doi.org/10.5194/acp-10-2521-2010, 2010.
Lou, S., Liao, H., Yang, Y., and Mu, Q.: Simulation of the interannual variations of tropospheric ozone over China: Roles of variations in meteorological parameters and anthropogenic emissions, Atmos. Environ., 122, 839–851, https://doi.org/10.1016/j.atmosenv.2015.08.081, 2015.
Ma, X., Huang, J., Zhao, T., Liu, C., Zhao, K., Xing, J., and Xiao, W.: Rapid increase in summer surface ozone over the North China Plain during 2013–2019: a side effect of particulate matter reduction control?, Atmos. Chem. Phys., 21, 1–16, https://doi.org/10.5194/acp-21-1-2021, 2021.
McLinden, C. A., Olsen, S. C., Hannegan, B., Wild, O., Prather, M. J., and Sundet, J.: Stratospheric ozone in 3-D models: A simple chemistry and the cross-tropopause flux, J. Geophys. Res., 105, 14653–14665, https://doi.org/10.1029/2000JD900124, 2000.
MERRA-2: GEOS_2x2.5/MERRA2, MERRA-2 [data set], http://geoschemdata.wustl.edu/ExtData/GEOS_2x2.5/MERRA2, last access: 1 July 2022.
Murray, L. T., Jacob, D. J., Logan, J. A., Hudman, R. C., and Koshak, W. J.: Optimized regional and interannual variability of lightning in a global chemical transport model constrained by LIS/OTD satellite data, J. Geophys. Res., 117, 100193, https://doi.org/10.1029/2012JD017934, 2012.
Nuvolone, D., Petri, D., and Voller, F.: The effects of ozone on human health, Environ. Sci. Pollut. R., 25, 8074–8088, https://doi.org/10.1007/s11356-017-9239-3, 2018.
OMI/MLS Tropo O3: TROPOSPHERIC OZONE DATA FROM AURA OMI/MLS, OMI/MLS [data set], https://acd-ext.gsfc.nasa.gov/Data_services/cloud_slice/new_data.html, last access: 1 January 2023.
Ott, L. E., Pickering, K. E., Stenchikov, G. L., Allen, D. J., DeCaria, A. J., Ridley, B., Lin, R.-F., Lang, S., and Tao, W. K.: Production of lightning NOx and its vertical distribution calculated from three-dimensional cloud-scale chemical transport model simulations, J. Geophys. Res., 115, D04301, https://doi.org/10.1029/2009JD011880, 2010.
Peiro, H., Emili, E., Cariolle, D., Barret, B., and Le Flochmoën, E.: Multi-year assimilation of IASI and MLS ozone retrievals: variability of tropospheric ozone over the tropics in response to ENSO, Atmos. Chem. Phys., 18, 6939–6958, https://doi.org/10.5194/acp-18-6939-2018, 2018.
Porter, W. C. and Heald, C. L.: The mechanisms and meteorological drivers of the summertime ozone–temperature relationship, Atmos. Chem. Phys., 19, 13367–13381, https://doi.org/10.5194/acp-19-13367-2019, 2019.
Punge, H. J., Konopka, P., Giorgetta, M. A., and Müller, R.: Effects of the quasi-biennial oscillation on low-latitude transport in the stratosphere derived from trajectory calculations, J. Geophys. Res., 114, D03102, https://doi.org/10.1029/2008JD010518, 2009.
Qu, K., Wang, X., Yan, Y., Shen, J., Xiao, T., Dong, H., Zeng, L., and Zhang, Y.: A comparative study to reveal the influence of typhoons on the transport, production and accumulation of O3 in the Pearl River Delta, China, Atmos. Chem. Phys., 21, 11593–11612, https://doi.org/10.5194/acp-21-11593-2021, 2021.
Schirber, S.: Influence of ENSO on the QBO: Results from an ensemble of idealized simulations, J. Geophys. Res.-Atmos., 120, 1109–1122, https://doi.org/10.1002/2014JD022460, 2015.
Schoeberl, M. R., Ziemke, J. R., Bojkov, B., Livesey, N., Duncan, B., Strahan, S., Froidevaux, L., Kulawik, S., Bhartia, P. K., Chandra, S., Levelt, P. F., Witte, J. C., Thompson, A. M., Cuevas, E., Redondas, A., Tarasick, D. W., Davies, J., Bodeker, G., Hansen, G., Johnson, B. J., Oltmans, S. J., Vömel, H., Allaart, M., Kelder, H., Newchurch, M., Godin-Beekmann, S., Ancellet, G., Claude, H., Andersen, S. B., Kyrö, E., Parrondos, M., Yela, M., Zablocki, G., Moore, D., Dier, H., von der Gathen, P., Viatte, P., Stübi, R., Calpini, B., Skrivankova, P., Dorokhov, V., de Backer, H., Schmidlin, F. J., Coetzee, G., Fujiwara, M., Thouret, V., Posny, F., Morris, G., Merrill, J., Leong, C. P., Koenig-Langlo, G., and Joseph, E.: A trajectory-based estimate of the tropospheric ozone column using the residual method, J. Geophys. Res., 112, D24S49, https://doi.org/10.1029/2007JD008773, 2007.
Sun, L., Wang, H., and Liu, F.: Combined effect of the QBO and ENSO on the MJO, Atmos. Ocean. Sci. Lett., 12, 170–176, https://doi.org/10.1080/16742834.2019.1588064, 2019.
Taguchi, M.: Observed connection of the stratospheric quasi-biennial oscillation with El Niño–Southern Oscillation in radiosonde data, J. Geophys. Res., 115, D18120, https://doi.org/10.1029/2010jd014325, 2010.
The International GEOS-Chem User Community: geoschem/geos-chem: GEOS-Chem 12.9.3 (12.9.3), Zenodo [code], https://doi.org/10.5281/zenodo.3974569, 2020.
van der Werf, G. R., Randerson, J. T., Giglio, L., van Leeuwen, T. T., Chen, Y., Rogers, B. M., Mu, M., van Marle, M. J. E., Morton, D. C., Collatz, G. J., Yokelson, R. J., and Kasibhatla, P. S.: Global fire emissions estimates during 1997–2016, Earth Syst. Sci. Data, 9, 697–720, https://doi.org/10.5194/essd-9-697-2017, 2017.
Verstraeten, W. W., Neu, J. L., Williams, J. E., Bowman, K. W., Worden, J. R., and Boersma, K. F.: Rapid increases in tropospheric ozone production and export from China, Nat. Geosci., 8, 690–695, https://doi.org/10.1038/ngeo2493, 2015.
Wang, P., Yang, Y., Li, H., Chen, L., Dang, R., Xue, D., Li, B., Tang, J., Leung, L. R., and Liao, H.: North China Plain as a hot spot of ozone pollution exacerbated by extreme high temperatures, Atmos. Chem. Phys., 22, 4705–4719, https://doi.org/10.5194/acp-22-4705-2022, 2022.
Wang, T., Xue, L., Brimblecombe, P., Lam, Y. F., Li, L., and Zhang, L.: Ozone pollution in China: A review of concentrations, meteorological influences, chemical precursors, and effects, Sci. Total Environ., 575, 1582–1596, https://doi.org/10.1016/j.scitotenv.2016.10.081, 2017.
Wang, X., Manning, W. J., Feng, Z., and Zhu, Y.-G.: Ground-level ozone in China: Distribution and effects on crop yields, Environ. Pollut., 147, 394–400, https://doi.org/10.1016/j.envpol.2006.05.006, 2007.
Wang, X.: Historical air quality data in China, https://quotsoft.net/air, last access: 1 January 2023.
Wespes, C., Hurtmans, D., Clerbaux, C., and Coheur, P.-F.: O3 variability in the troposphere as observed by IASI over 2008–2016: Contribution of atmospheric chemistry and dynamics, J. Geophys. Res.-Atmos., 122, 2429–2451, https://doi.org/10.1002/2016jd025875, 2017.
Xu, Z. X., Li, J. Y., Takeuchi, K., and Ishidaira, H.: Long-term trend of precipitation in China and its association with the El Niño–southern oscillation, Hydrol. Process., 21, 61–71, https://doi.org/10.1002/hyp.6180, 2007.
Xue, X., Chen, W., Chen, S., and Zhou, D.: Modulation of the connection between boreal winter ENSO and the South Asian high in the following summer by the stratospheric quasi-biennial oscillation, J. Geophys. Res.-Atmos., 120, 7393–7411, https://doi.org/10.1002/2015JD023260, 2015.
Yang, Y.: Data for ozone pollution in China affected by stratospheric quasi-biennial oscillation, Zenodo [data set], https://doi.org/10.5281/zenodo.6793180, 2022.
Yang, Y., Liao, H., and Li, J.: Impacts of the East Asian summer monsoon on interannual variations of summertime surface-layer ozone concentrations over China, Atmos. Chem. Phys., 14, 6867–6879, https://doi.org/10.5194/acp-14-6867-2014, 2014.
Yang, Y., Ren, L., Wu, M., Wang, H., Song, F., Leung, L. R., Hao, X., Li, J., Chen, L., Li, H., Zeng, L., Zhou, Y., Wang, P., Liao, H., Wang, J., and Zhou, Z.-Q.: Abrupt emissions reductions during COVID-19 contributed to record summer rainfall in China, Nat. Commun., 13, 959, https://doi.org/10.1038/s41467-022-28537-9, 2022a.
Yang, Y., Li, M., Wang, H., Li, H., Wang, P., Li, K., Gao, M., and Liao, H.: ENSO modulation of summertime tropospheric ozone over China, Environ. Res. Lett., 17, 034020, https://doi.org/10.1088/1748-9326/ac54cd, 2022b.
Yin, P., Chen, R., Wang, L., Meng, X., Liu, C., Niu, Y., Lin, Z., Liu, Y., Liu, J., Qi, J., You, J., Zhou, M., and Kan, H.: Ambient Ozone Pollution and Daily Mortality: A Nationwide Study in 272 Chinese Cities, Environ. Health Perspect., 125, 117006, https://doi.org/10.1289/EHP1849, 2017.
Zeng, G., Morgenstern, O., Braesicke, P., and Pyle, J. A.: Impact of stratospheric ozone recovery on tropospheric ozone and its budget, Geophys. Res. Lett., 37, L09805, https://doi.org/10.1029/2010gl042812, 2010.
Zeng, G., Morgenstern, O., Shiona, H., Thomas, A. J., Querel, R. R., and Nichol, S. E.: Attribution of recent ozone changes in the Southern Hemisphere mid-latitudes using statistical analysis and chemistry–climate model simulations, Atmos. Chem. Phys., 17, 10495–10513, https://doi.org/10.5194/acp-17-10495-2017, 2017.
Zeng, L., Yang, Y., Wang, H., Wang, J., Li, J., Ren, L., Li, H., Zhou, Y., Wang, P., and Liao, H.: Intensified modulation of winter aerosol pollution in China by El Niño with short duration, Atmos. Chem. Phys., 21, 10745–10761, https://doi.org/10.5194/acp-21-10745-2021, 2021.
Zhai, S., Jacob, D. J., Brewer, J. F., Li, K., Moch, J. M., Kim, J., Lee, S., Lim, H., Lee, H. C., Kuk, S. K., Park, R. J., Jeong, J. I., Wang, X., Liu, P., Luo, G., Yu, F., Meng, J., Martin, R. V., Travis, K. R., Hair, J. W., Anderson, B. E., Dibb, J. E., Jimenez, J. L., Campuzano-Jost, P., Nault, B. A., Woo, J.-H., Kim, Y., Zhang, Q., and Liao, H.: Relating geostationary satellite measurements of aerosol optical depth (AOD) over East Asia to fine particulate matter (PM2.5): insights from the KORUS-AQ aircraft campaign and GEOS-Chem model simulations, Atmos. Chem. Phys., 21, 16775–16791, https://doi.org/10.5194/acp-21-16775-2021, 2021.
Zhao, H., Zheng, Y., Zhang, Y., Li, T., and Li, T.: Evaluating the effects of surface O3 on three main food crops across China during 2015–2018, Environ. Pollut., 258, 113794–113794, https://doi.org/10.1016/j.envpol.2019.113794, 2020.
Zhao, Z. and Wang, Y.: Influence of the West Pacific subtropical high on surface ozone daily variability in summertime over eastern China, Atmos. Environ., 170, 197–204, https://doi.org/10.1016/j.atmosenv.2017.09.024, 2017.
Zheng, B., Gu, D., Lin, A., and Li, C.: Dynamical mechanism of the stratospheric quasi-biennial oscillation impact on the South China Sea Summer Monsoon, Sci. China Earth Sci., 50, 1424–1432, https://doi.org/10.1007/s11430-007-0075-z, 2007.
Zheng, B., Tong, D., Li, M., Liu, F., Hong, C., Geng, G., Li, H., Li, X., Peng, L., Qi, J., Yan, L., Zhang, Y., Zhao, H., Zheng, Y., He, K., and Zhang, Q.: Trends in China's anthropogenic emissions since 2010 as the consequence of clean air actions, Atmos. Chem. Phys., 18, 14095–14111, https://doi.org/10.5194/acp-18-14095-2018, 2018.
Zhou, W. and Chan, J. C. L.: ENSO and the South China Sea summer monsoon onset, Int. J. Climatol., 27, 157–167, https://doi.org/10.1002/joc.1380, 2007.
Zhu, J., Chen, L., Liao, H., Yang, H., Yang, Y., and Yue, X.: Enhanced PM2.5 Decreases and O3 Increases in China During COVID-19 Lockdown by Aerosol-Radiation Feedback, Geophys. Res. Lett., 48, e2020GL090260, https://doi.org/10.1029/2020gl090260, 2021.
Ziemke, J. R., Chandra, S., Duncan, B. N., Froidevaux, L., Bhartia, P. K., Levelt, P. F., and Waters, J. W.: Tropospheric ozone determined from Aura OMI and MLS: Evaluation of measurements and comparison with the Global Modeling Initiative's Chemical Transport Model, J. Geohys. Res., 111, D19303, https://doi.org/10.1029/2006JD007089, 2006.
Ziemke, J. R., Chandra, S., Labow, G. J., Bhartia, P. K., Froidevaux, L., and Witte, J. C.: A global climatology of tropospheric and stratospheric ozone derived from Aura OMI and MLS measurements, Atmos. Chem. Phys., 11, 9237–9251, https://doi.org/10.5194/acp-11-9237-2011, 2011.
Ziemke, J. R., Olsen, M. A., Witte, J. C., Douglass, A. R., Strahan, S. E., Wargan, K., Liu, X., Schoeberl, M. R., Yang, K., Kaplan, T. B., Pawson, S., Duncan, B. N., Newman, P. A., Bhartia, P. K., and Heney, M. K.: Assessment and applications of NASA ozone data products derived from Aura OMI/MLS satellite measurements in context of the GMI chemical transport model, J. Geophys. Res.-Atmos., 119, 5671–5699, https://doi.org/10.1002/2013JD020914, 2014.