the Creative Commons Attribution 4.0 License.
the Creative Commons Attribution 4.0 License.
 | 15 Dec 2023
Investigating the contribution of grown new particles to cloud condensation nuclei with largely varying preexisting particles – Part 1: Observational data analysis
Xing Wei
Yanjie Shen
Xiao-Ying Yu
Huiwang Gao
Ming Chu
Yujiao Zhu
Xiaohong Yao
This study employed multiple techniques to investigate the contribution of grown new particles to the number concentration of cloud condensation nuclei (CCN) at various supersaturation (SS) levels at a rural mountain site in the North China Plain from 29 June to 14 July 2019. On 8 new particle formation (NPF) days, the total particle number concentrations (Ncn) were 8.4 ± 6.1×103 cm−3, which was substantially higher compared to 4.7 ± 2.6×103 cm−3 on non-NPF days. However, the CCN concentration (Nccn) at 0.2 % SS and 0.4 % SS on the NPF days was significantly lower than those observed on non-NPF days (p<0.05). This was due to the lower cloud activation efficiency of preexisting particles resulting from organic vapor condensation and smaller number concentrations of preexisting particles on NPF days. A case-by-case examination showed that the grown new particles only yielded a detectable contribution to Nccn at 0.4 % SS and 1.0 % SS during the NPF event on 1 July 2019, accounting for 12 % ± 11 % and 23 % ± 12 % of Nccn, respectively. The increased Nccn during two other NPF events and at 0.2 % SS on 1 July 2019 were detectable but determined mainly by varying preexisting particles rather than grown new particles. In addition, the hygroscopicity parameter values, concentrations of inorganic and organic particulate components, and surface chemical composition of different sized particles were analyzed in terms of chemical drivers to grow new particles. The results showed that the grown new particles via organic vapor condensation generally had no detectable contribution to Nccn but incidentally did. However, this conclusion was drawn from a small size of observational data, leaving more observations, particularly long-term observations and the growth of preexisting particles to the CCN required size, needed for further investigation.
- Article
(5468 KB) - Full-text XML
-
Supplement
(1792 KB) - BibTeX
- EndNote


Global warming and climate change have become significant topics of discussion and debate in recent decades (IPCC, 2021). Atmospheric aerosols, activated as cloud condensation nuclei (CCN) at super saturation (SS) conditions, can form cloud droplets and provide substantial global cooling, subsequently alleviating warming (Twohy, 2005; Dusek et al., 2006; Small et al., 2009; Kerminen et al., 2012, 2018; Sullivan et al., 2018; Zaveri et al., 2021; Yu et al., 2020). However, compared to other climate forcing factors, aerosol–cloud interactions remain the largest uncertainty (IPCC, 2021). The CCN may act as one of the key contributors to this uncertainty, considering their roles in increasing the number concentration of cloud droplets and decreasing the size of cloud droplets (Twomey, 1977; Albrecht, 1989; Andreae and Rosenfeld, 2008; Bulgin et al., 2008). To minimize the large uncertainty in aerosol–cloud interactions, significant efforts have been made to improve the understanding of CCN regarding their primary and secondary sources and regarding aerosol activation properties in different size ranges with varying SS from the polluted atmosphere to the remote clean atmosphere (Yu and Luo, 2009; Kerminen et al., 2012, 2018; J. Li et al., 2017; Williamson et al., 2019; J. Zhu et al., 2019; Iwamoto et al., 2021; Zaveri et al., 2021; Gong et al., 2022).
New particle formation (NPF) refers to the phenomenon of gas–particle nucleation followed by the growth of newly formed particles in the atmosphere. During an NPF event, particle number concentrations (PNCs) can rapidly increase in different size ranges (Kulmala et al., 2004; Chu et al., 2019; Lee et al., 2019). The grown new particles have been reported to contribute to the budget of CCN based on field measurements and modeling studies (Kuang et al., 2009; Kerminen et al., 2012; Ehn et al., 2014; Kalivitis et al., 2015; Leng et al., 2014; Ma et al., 2016; Tröstl et al., 2016; Gordon et al., 2017; Y. Li et al., 2017; Williamson et al., 2019; Fang et al., 2021; Ren et al., 2021; Sebastian et al., 2021). However, field studies are often affected by perturbations associated with varying preexisting particles in PNCs, size spectra, and cloud activation properties. As a result, observational evidence on the net contribution of the grown new particles to CCN concentrations is limited, particularly at low ambient SS; i.e., SS<0.2 %–0.3 % (Kerminen et al., 2012; Tröstl et al., 2016; Rose et al., 2017; Ren et al., 2021; Sebastian et al., 2021).
Organic vapors have been found to play a dominant role in the growth of newly formed particles, ranging from a few nanometers to submicron scales (Pierce et al., 2012; Wu et al., 2013; Ehn et al., 2014; Kalivitis et al., 2015; Kawana et al., 2017; Ma et al., 2021; Wan et al., 2020; Chang et al., 2022). This organic-driven growth may reduce the Kelvin effect for water vapor condensation on small-sized particles (Dusek et al., 2006). Considering that the global average of the hygroscopicity parameter (κ) values of atmospheric aerosols is around 0.27 (Petters and Kreidenweis, 2007; Kerminen et al., 2012), the condensation of low-volatility organic vapors on grown new particles and preexisting particles might lead to a decrease in aerosol hygroscopicity due to their low κ values, which approach 0.1 (Petters and Kreidenweis, 2007; Dusek et al., 2010; Wu et al., 2013; Y. Zhu et al., 2019; Fang et al., 2021; Chang et al., 2022). However, some semi-volatile organic species, such as oxalic acid, have been found to have high cloud activation potentials, with a κ value of 0.81, and their neutralized salts also have κ values of 0.59–0.70 (Boreddy and Kawamura, 2018). Additionally, secondary organic aerosols (SOAs) from dark ozonolysis of γ-terpinene under different reaction conditions have shown moderate cloud activation potentials, with κ values of 0.20–0.24 (Bouzidi et al., 2022). During an NPF event, when different organic vapors condense simultaneously on grown new particles and preexisting particles, the κ values of differently sized particles can either decrease, increase, or remain invariant, leading to corresponding changes in CCN concentrations. Therefore, statistical analysis is essential in understanding the complex interactions between organic vapors and particle hygroscopicity, which is currently scarce in the literature.
Various studies have reported that sulfuric acid vapor generated from photochemical reactions in the atmosphere contributes to the growth of newly formed particles (Birmili et al., 2003; Boy et al., 2005; Yue et al., 2011; Bzdek et al., 2012; Vakkari et al., 2015; Ma et al., 2016; Fang et al., 2021). However, the contribution of sulfuric acid vapor to growing secondary particles from 40–50 nm to larger sizes is highly questionable, as the subsequently observed growth often occurs at nighttime (Man et al., 2015; Ma et al., 2021). Furthermore, the relative contribution of ammonium nitrate (NH4NO3), one of the most important components in atmospheric particles, increases with a faster decrease in SO2 emissions globally (Chan and Yao, 2008; Cao et al., 2017; Ge et al., 2017; Rodelas et al., 2019; Wu et al., 2019; Bressi et al., 2021; Zhu et al., 2021a). Current modeling studies suggest the importance of NH4NO3 aerosols in regional cooling (Drugé et al., 2019; Jones et al., 2021). Our previous studies have found that the formation of particulate NH4NO3 via HNO3 and NH3 gases plays a key role in the second-phase growth of newly formed particles from 40–50 nm to larger sizes at nighttime without photochemical reactions (Zhu et al., 2014; Man et al., 2015; Ma et al., 2021). Recently, Wang et al. (2020) proposed rapid particle formation and growth of newly formed particles by NH4NO3 formation. Unlike organic vapors, NH4NO3 formation on newly formed particles and preexisting particles should always yield a net increase in CCN concentrations during NPF events. However, to the best of our knowledge, no field studies have reported this phenomenon.
The objective of this study is to investigate the relationship between newly formed particles and CCN using particle number size distributions (PNSDs), CCN concentrations, and the derived κ values of atmospheric aerosols at various SSs. Chemical composition of atmospheric particles was also analyzed by multiple techniques to support the analysis. The observations were conducted at a rural mountain site (1100 m above sea level) in the North China Plain (NCP) from June to July in 2019, during the rainy season when morning mist frequently occurred among mountain peaks with ambient relative humidity (RH) approaching 90 %–100 % and decreasing ambient temperature (T) (Fig. S1a and b in the Supplement). Additionally, cloud optical thickness (COT) and cloud effective radius (CER) were recorded in the midafternoon using Aqua satellite data, showing variations from 1.46 to 36.7 and 8.64 to 24.4 µm, respectively (Fig. S1c and d). The observed CCN were directly related to the formation of cloud droplets at the elevated mountain site. Three scientific questions were addressed. (1) Does the organic-driven growth of newly formed particles contribute to the observed CCN at various SSs? Is the effect of organic condensation reduced on preexisting particles during NPF events? (2) What is the relative role of organic condensation and NH4NO3 formation in determining the contribution of grown new particles to the observed CCN at various SSs? (3) What implications do our findings have for knowledge gaps for CCN sources in NCP? In the upcoming companion paper to this publication, a modeling study is applied to illustrate the link in three dimensions and quantify the contributions of different chemical species to the growth of newly formed particles (Chu et al., 2023).
2.1 Sampling period and site
A research campaign was performed from 23 June to 14 July 2019 at a mountain site ( N, E) in western Beijing to investigate the CCN activation of atmospheric aerosols in the rural atmosphere over the North China Plain (NCP). The sampling site, located at an altitude of approximately 1100 m (Fig. 1a–h), belongs to a forest ecosystem research station of the Chinese Academy of Science. The mountain site is surrounded by secondary forests and is approximately 110 km southwest downwind from Beijing. NO2 column densities during the study period showed that anthropogenic combustion emission sources were mainly distributed in the east and south of the site (Fig. 1a–h), while the north and west directions frequently displayed lower NO2 column densities, indicating a cleaner rural environment.
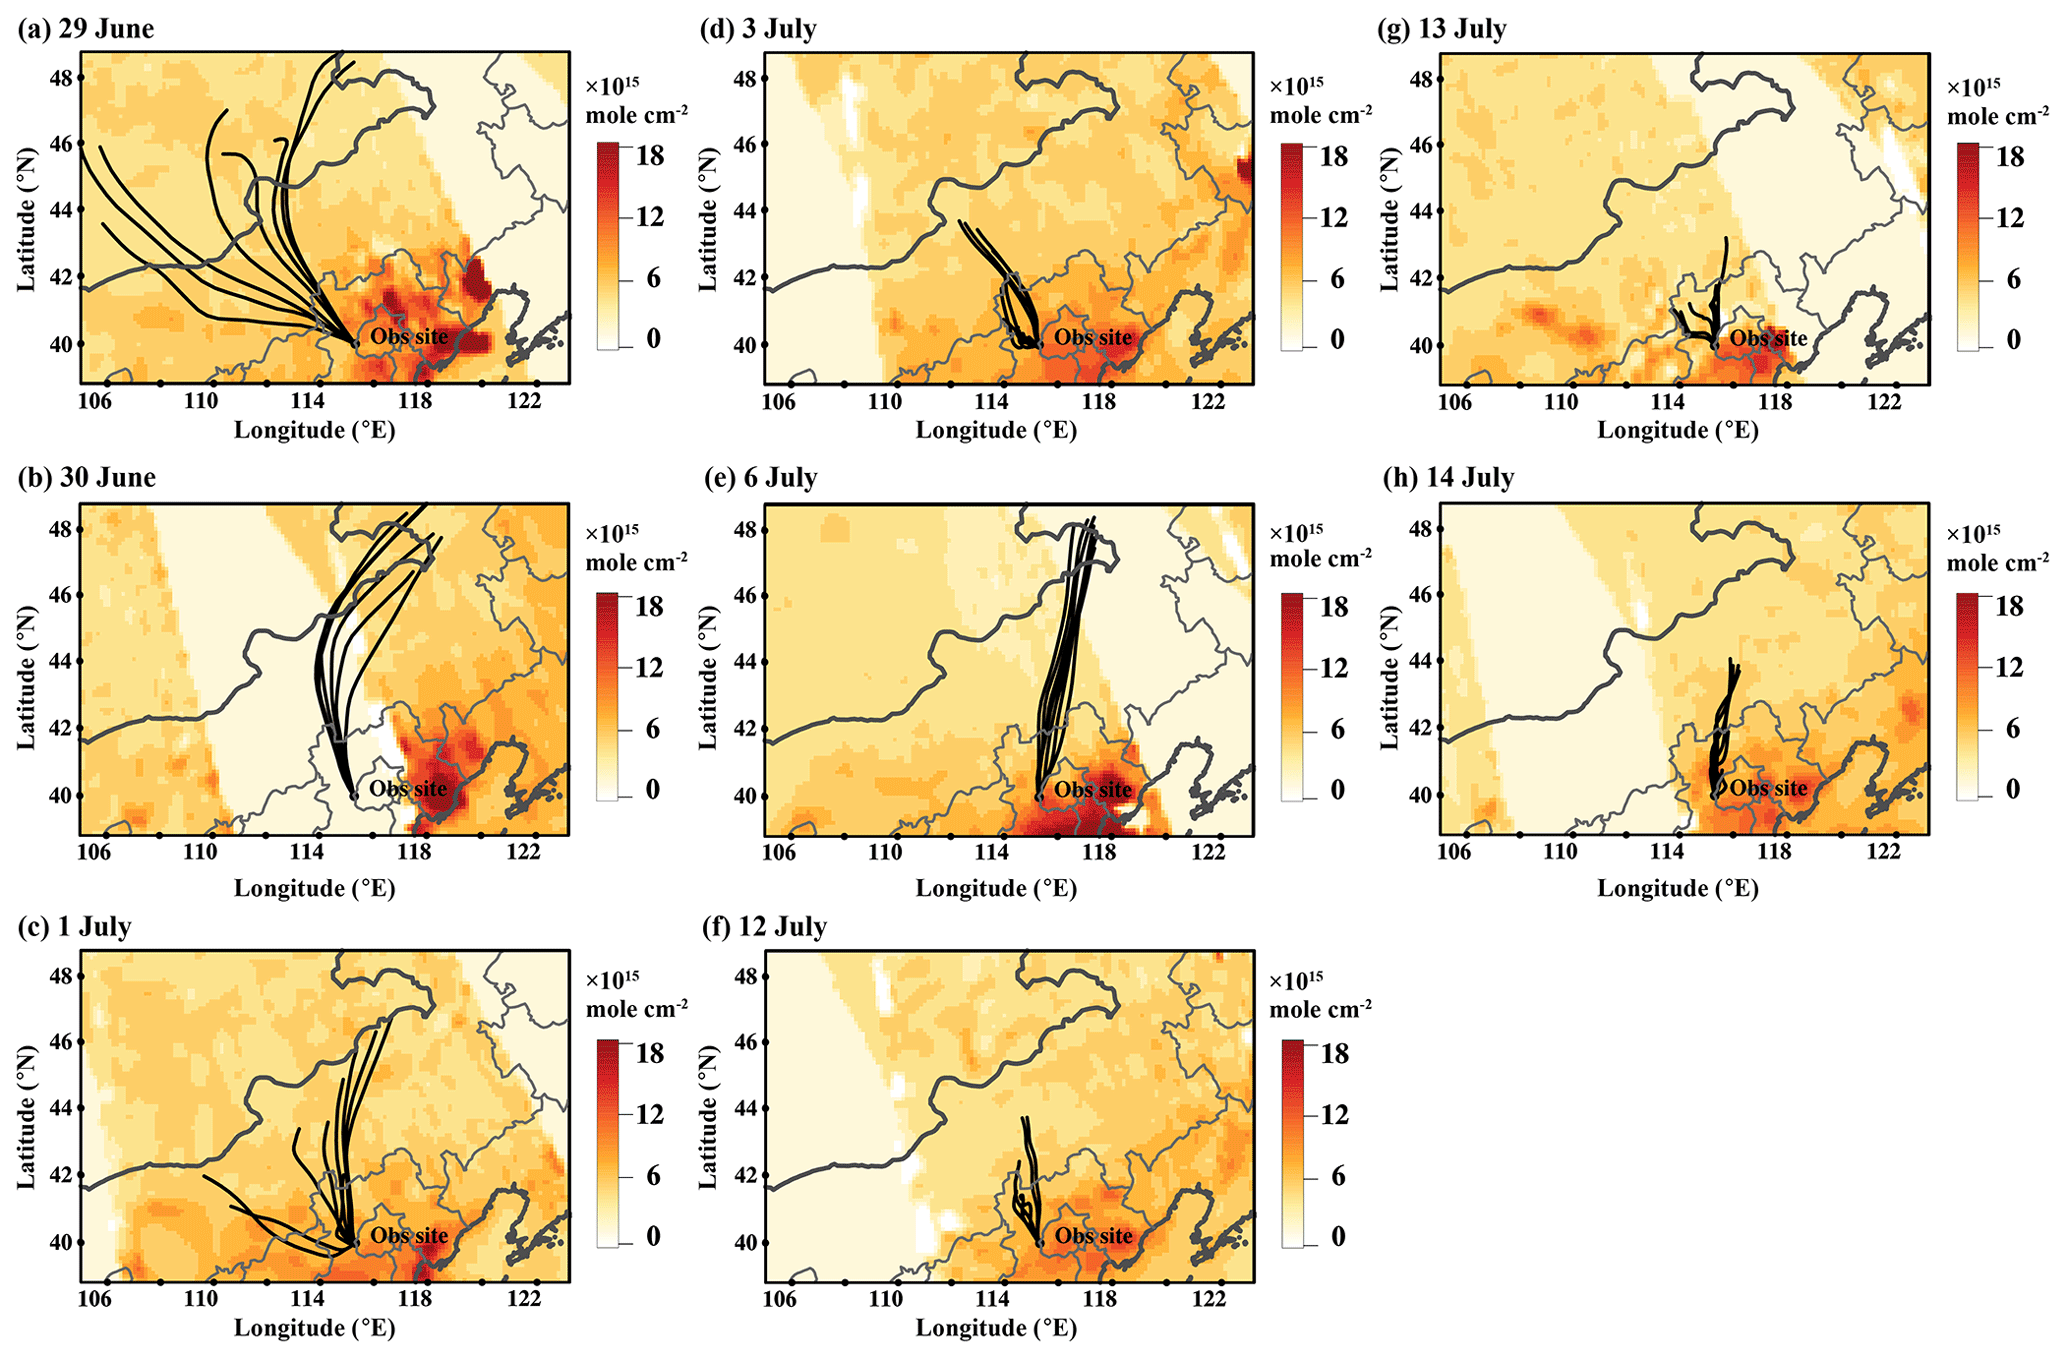
Figure 1Satellite NO2 column density over the observational site and surrounding areas and 24 h air mass back trajectories during eight NPF event days in June–July 2019 (a–h corresponded to the NO2 column density recorded on 29 June, 30 June, 1 July, 3 July, 6 July, 12–14 July, respectively).
2.2 Particle collection
Four different instruments were installed on the third floor of the major station building, at a height of 10 m above ground. These instruments include a fast mobility particle sizer (FMPS; TSI, 3091) downstream of a dryer (TSI, 3062), a condensation particle counter (CPC; TSI, 3775), a continuous-flow CCN counter (CCNC; DMT Model 100), and a differential mobility analyzer (DMA; Grimm) coupled with a nanometer aerosol sampler (NAS; Grimm). The FMPS was used to measure particle concentrations in the size range of 5.6 to 560 nm in 32 channels at a frequency of 1 Hz. For the purpose of this study, the total particle number concentration (total Ncn) and number concentrations of particles larger than 100 nm (Ncn>100) were defined as the sum of number concentrations from 5.6 to 560 nm and 100 to 560 nm, respectively. The FMPS had undergone maintenance at the TSI factory in the US. before the campaign, and the ratios of the measured total particle number concentrations against those measured by the CPC remained stable until the end of 2021. The CPC shared a splitter with the FMPS and generated data at a 2 s time resolution to correct the FMPS data (Zimmerman et al., 2015). The CCNC was used to measure the bulk CCN concentration (Nccn) at five different supersaturation (SS) levels of 0.2 %, 0.4 %, 0.6 %, 0.8 %, and 1.0 %. Each SS setting lasted for 5 min, while the first and last 30 s of data was removed. An additional 5 min was used for switching SS from 1.0 % to 0.2 % to establish the supersaturation equilibrium. The CCNC was calibrated for the campaign using the commercial service provided by the instrument vendor in Beijing. However, the SSs were referred to as the lab-calibrated values in this study since no on-site calibration was conducted during the campaign. The divergence in height between the observational site and the calibration location (∼1000 m) may introduce uncertainties in SS and the consequently measured Nccn (Lance et al., 2006; Rose et al., 2008; Lathem and Nenes, 2011). Based on these previous studies, the five on-site SS at the mountain site might be approximately 10 % smaller than the corresponding lab-calibrated values, i.e., 0.18 %, 0.36 %, 0.54 %, 0.72 %, and 0.9 %. These smaller SS values were referred as the approximated on-site values in this study. Moreover, the errors in the measured Nccn between each pair of lab-calibrated and approximated on-site SSs were smaller than 10 %, as presented in the Supplement (Figs. 3–5 and S6). Nevertheless, these analytical errors are less likely to affect the comparison of Nccn at different times within a single day, as it can be reasonably assumed that the percentage of analytical errors remains constant. Figure S2 in the Supplement showed the sampling system diagram. Further details about these instruments can be found in Li et al. (2015), Wang et al. (2019), and Gao et al. (2020), and the inter-comparison results of these particle-number-related measurements during the campaign and afterwards were presented in the Supplement and Figs. S3–S5 in the Supplement.
The DMA coupled with the NAS was used to collect atmospheric nanoparticles at four diameters: 30, 60, 100, and 200 nm. The DMA initially separated atmospheric particles, which were then collected on transmission electron microscopy (TEM) grids (01814-F, TED PELLA, INC.) by the NAS using electrostatic force. To ensure that sufficient particles were collected for chemical analysis, each sample was collected for 2 h, with a sampling rate of 1 L min−1 and a sheath flow rate of 10 L min−1. A total of 14 sample sets and three field blanks were collected. The chemical composition of the samples collected on 30 June and 1 July 2019 was successfully analyzed. Additionally, field blanks were analyzed to identify interference peaks from substrates.
During the campaign, a total of 11 total suspended particle (TSP) samples were collected from 06:00 LT on that day to 06:00 LT on the next day. These samples were collected on quartz filters using a high-volume sampler, which operated at a flow rate of approximately 1 m3 min−1. The collected samples were utilized for analyzing inorganic ions, organic carbon (OC), elemental carbon (EC), and organic tracers. The sampling duration of each sample was around 24 h, which ensured sufficient particle loading for multiple chemical analyses. Additionally, meteorological data such as wind speed (WS), wind direction (WD), ambient temperature (T), and relative humidity (RH) were continuously measured at a height of 10 m above ground level at the station.
2.3 Chemical analysis of particles
A ToF-SIMS (time-of-flight secondary ion mass spectrometer) instrument (IONTOF V, IONTOF GmbH, Münster, Germany) was utilized to analyze the chemical composition of atmospheric nanoparticles collected using the DMA coupled with NAS at four different sizes. During analysis, the main chamber pressure was kept under a vacuum of 10−8 mbar. The primary ion beam was Bi3+ (25 keV) with 10 kHz pulse energy, a pulse width of 0.8 ns, and a current set at approximately 0.6 pA. The SIMS spectra were acquired over an area of 150 µm×150 µm for 60 scans, with at least four positive and four negative data points collected for each sample. The IONTOF Surface Lab 6.3 software was used for SIMS data analysis. The mass spectra were calibrated using 15 , 55 , and 91 in the positive ion mode and 26 CN−, 41 C2HO−, and 77 in the negative ion mode, respectively. Principal component analysis (PCA) was conducted using MATLAB software to study the differences in chemical composition among the selected-size particles. Prior to conducting spectral PCA, the interference peaks from substrate were excluded, and the mass-calibrated data were treated by mean-centering, normalization to the total ion intensity of all selected peaks, and square-root transformation (Ding et al., 2016, 2019; Zhang et al., 2019; Sui et al., 2017; Fu et al., 2018; Cheng et al., 2014). It should be noted that inorganic signals with weak signal-to-noise ratios were excluded from the analysis.
For the analysis of TSP samples, a 0.25 fraction of each filter was utilized to measure organic tracers using gas chromatography mass spectroscopy (GC-MS) with an Agilent 6890 GC/5975 MSD, as described in previous studies (Kleindienst et al., 2007; Feng et al., 2013). The OC and EC concentrations were analyzed using a thermal/optical carbon analyzer (DRI 2001A, Atmoslytic Inc., USA) with the IMPROVE (Interagency Monitoring of Protected Visual Environments)temperature program. First, the OC was volatilized under helium by heating the filter to 580 ∘C in four steps and then to 870 ∘C in three steps in a He : O2 environment. The charring of OC was monitored using a He–Ne laser of 650 nm. The secondary OC (SOC) was estimated as () following the method of Bauer et al. (2009). Inorganic and organic ions were analyzed using ion chromatography (Dionex 3000) from a fraction of each TSP sample filter (Hu et al., 2015; Teng et al., 2017). More experimental details can be found in the Supplement.
2.4 Definition of NPF events and calculation methods
NPF events were identified using the criteria proposed by Dal Maso et al. (2005) and Kulmala et al. (2012), which require the observation of new nucleation mode particles in the spectra and their prevalence or growth over several hours. These criteria distinguish NPF particles from plume and preexisting particles. NPF events were considered to have ended when the new particle signals disappeared, and the total particle number concentration returned to the background levels before the NPF events or when the newly formed particles were suddenly overwhelmed by plumes and could no longer be identified. NPF days (non-NPF days) were defined as the presence (absence) of NPF events. Two metrics, the apparent formation rate (FR) and the net maximum increase in the nucleation mode number concentration (NMINP), were used to quantify the intensity of NPF events (Sihto et al., 2006; Kulmala et al., 2012; Zhu et al., 2021a). FR and NMINP during the NPF events were calculated based on the nucleation mode particles in the size range of 5.6 to 30 nm. Particle number size distributions (PNSDs) in this study were fitted using multi-lognormal distribution functions in which the median mode mobility diameter and its corresponding half width (standard deviation) were used to characterize the distribution (Whitby, 1978; Yao et al., 2005; Chen et al., 2023). The related calculation methods are described in detail in the Supplement.
The κ was calculated in Eq. (1) that proposed by Petters and Kreidenweis (2007):
where Dd is the particle dry diameter, and it was assumed to be equal to the critical diameter for CCN activation (Dcrit). Sc is the supersaturation. σs/a is set as 0.0072 J m−2, representing the surface tension over the interface of solution and air, Mw is the molecular of water, R is the universal gas constant, T is temperature, and ρw is water density. In this study, the hourly κ values at 0.2 %, 0.4 %, and 1.0 % SS were calculated for analysis. Dcrit is defined as the particle diameter, which is regarded as the lower limit of the integral on particle number, and the upper limit was set as the largest particle diameter, yielding the total integrated particle number concentration equal to the CCN concentration (Hung et al., 2014; Cheung et al., 2020; Gao et al., 2020). The calculated hourly κ values reflect the overall effect on particle size, chemical composition, and mixing state, which are thereby referred to as the bulk κ values under different SS conditions.
Satellite products do not provide accurate retrievals of cloud droplet number concentration (CDNC) due to uncertainties introduced by lidar-derived biases. Building on the “adiabatic cloud model” assumption (Bennartz, 2007; Bennartz and Rausch, 2017), an effective computational method is established to estimate liquid-phase CDNCs based on cloud optical thickness (COT) and cloud effective radius (CER) in Eqs. (2) and (3):
where τ is the cloud optical thickness, k equal to 0.8 presents the dispersion of the assumed cloud droplet size distribution, Q is approximately 2 as the scattering efficiency of droplet, and cw is the condensation rate and it is calculated following previous studies (Ahmad et al., 2013; Grosvenor et al., 2018; Li et al., 2018). W is liquid water path (LWP), and re is cloud effective radius. COT and CER were derived from daily mean level-3 daily 1∘ cloud retrieval product (MYD08_D3) retrieved from Aqua-MODIS and the dataset was from June 2019 to July 2019. The Aqua satellite scanned the cloud coverage over the observational site within the time range of 12:30 and 14:30 LT on each day.
We modeled 24 h air mass back trajectories at 1000 m by using the Hybrid Single-Particle Lagrangian Integrated Trajectory (HYSPLIT) model from the NOAA Air Resources Laboratory. Simulations were performed every 2 h starting from 2 h before the NPF and ended when the NPF signals disappeared (Fig. 1a–h). NO2 column densities were downloaded from https://so2.gsfc.nasa.gov/no2/no2_index.html (last access: 18 June 2021).
3.1 Overview of the measured Nccn related to NPF events
Figure 2a showed the hourly average Nccn at the lab-calibrated 0.2 %, 0.4 %, and 1.0 % SS and the 1 min average total Ncn from 29 June to 14 July 2019, respectively. Table S1 in the Supplement provides the daily average Nccn (average ± standard deviation) at SS values ranging from 0.2 % to 1.0 %, the daily average Ncn>100, and the total Ncn. The Nccn varied by approximately 1 order of magnitude, ranging from 0.10×10³ to 4.7×103 cm−3 (1.4 ± 0.7×103 cm−3) at 0.2 % SS and from 0.10×10³ to 4.8×103 cm−3 (1.7 ± 0.9×103 cm−3) at 0.4 % SS. The temporal trend in Nccn at 1.0 % SS was consistent with those at 0.2 % and 0.4 % SS, while the values of Nccn at 1.0 % SS were 2.2 ± 1.1×103 cm−3, which was approximately 60 % higher than that at 0.2 % SS. The Nccn values observed on 29–30 June 2019 were 0.69 ± 0.27×10³, 0.83 ± 0.36×10³, and 1.2 ± 0.6×103 cm−3 at 0.2 %, 0.4 %, and 1.0 % SS, respectively. These values decreased by approximately 50 % relative to the campaign averages observed during the 16 d. However, the total Ncn on those 2 d ranked at a moderately high level (see Table S1), leading to lower activation ratios (ARs) of the observed aerosols, i.e., 0.12 ± 0.07 at 0.2 % SS, 0.15 ± 0.09 at 0.4 % SS, and 0.20 ± 0.13 at 1.0 % SS (Fig. 2b). Although no size-dependent chemical components were measured, the calculated ratios of in TSP on those 2 d were substantially larger than those from other days (see Fig. 2c), implying that the larger fraction of organics prevented aerosols from being activated as CCN (Petters and Kreidenweis, 2007; Kawana et al., 2017; Y. Zhu et al., 2019; Crumeyrolle et al., 2021; Chang et al., 2022). Surprisingly, the satellite-derived CDNC values of 341–386 cm−3 over the mountain area were higher on those 2 d (see Fig. 2d). These values were higher compared to the CDNC levels observed in June–July of 2019, which varied around 141 ± 122 cm−3 (inset in Fig. 2d). On the other 14 d, the CDNC were determined to be 106 ± 55 cm−3, approximately 1 order of magnitude smaller than the observed corresponding to Nccn at 0.2 % SS. The difference between the observed Nccn and the CDNC implied that the SS required for cloud droplet formation in the NCP atmospheres might be substantially smaller than 0.2 %, even though Nccn may decrease to some extent at higher altitudes from 1000 m (Li et al., 2019; Yang et al., 2020; Che et al., 2021). Thus, we will further explore this difference in Sect. 3.5. Note that the estimation CDNC might suffer from the uncertainty to some extent because of complex microphysics of cloud (Pruppacher and Klett, 2012). However, this uncertainty is unlikely to have significantly affected the comparison results of CNDC with Nccn since the latter difference generally exceeded 1 order of magnitude.
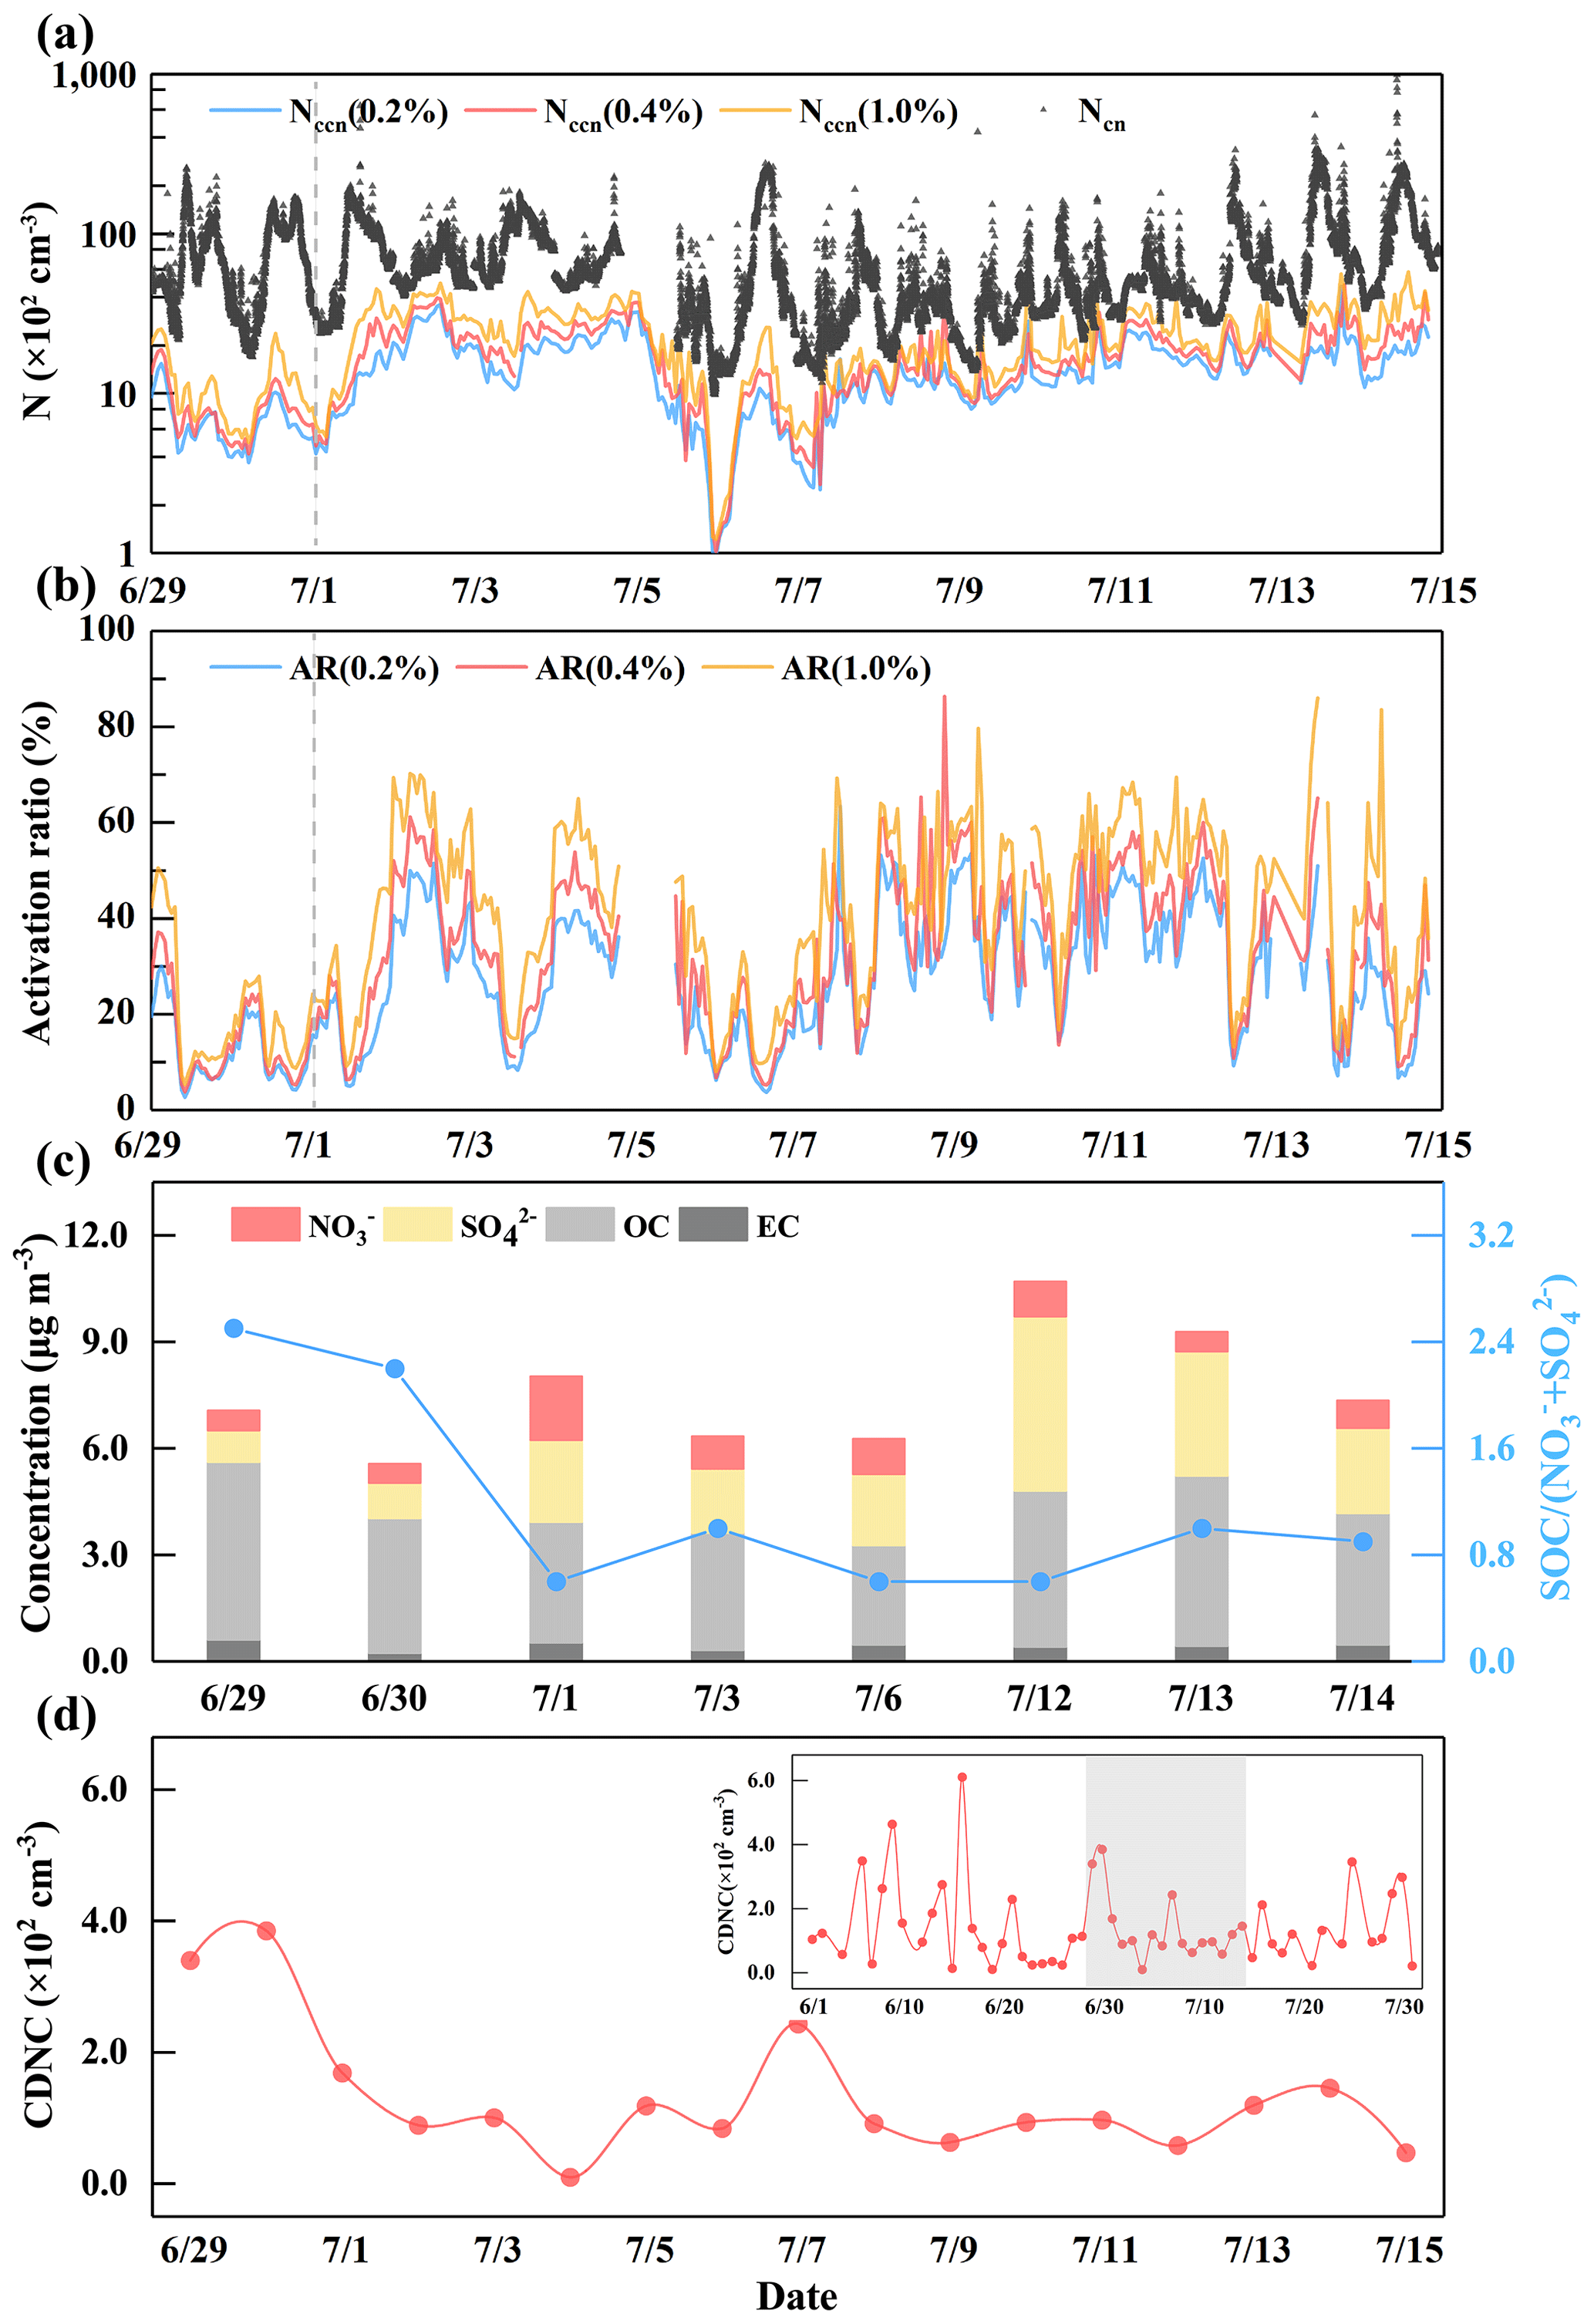
Figure 2Temporal variations in Nccn at 0.2 %, 0.4 %, and 1.0 % SS and Ncn (a); AR at 0.2 %, 0.4 %, and 1.0 % SS (b); daily average concentrations of chemical components in TSP and related ratios of (c); satellite-derived CDNC from 29 June to 15 July 2019 (CNDC in June to July were included as an inset in d) (d).
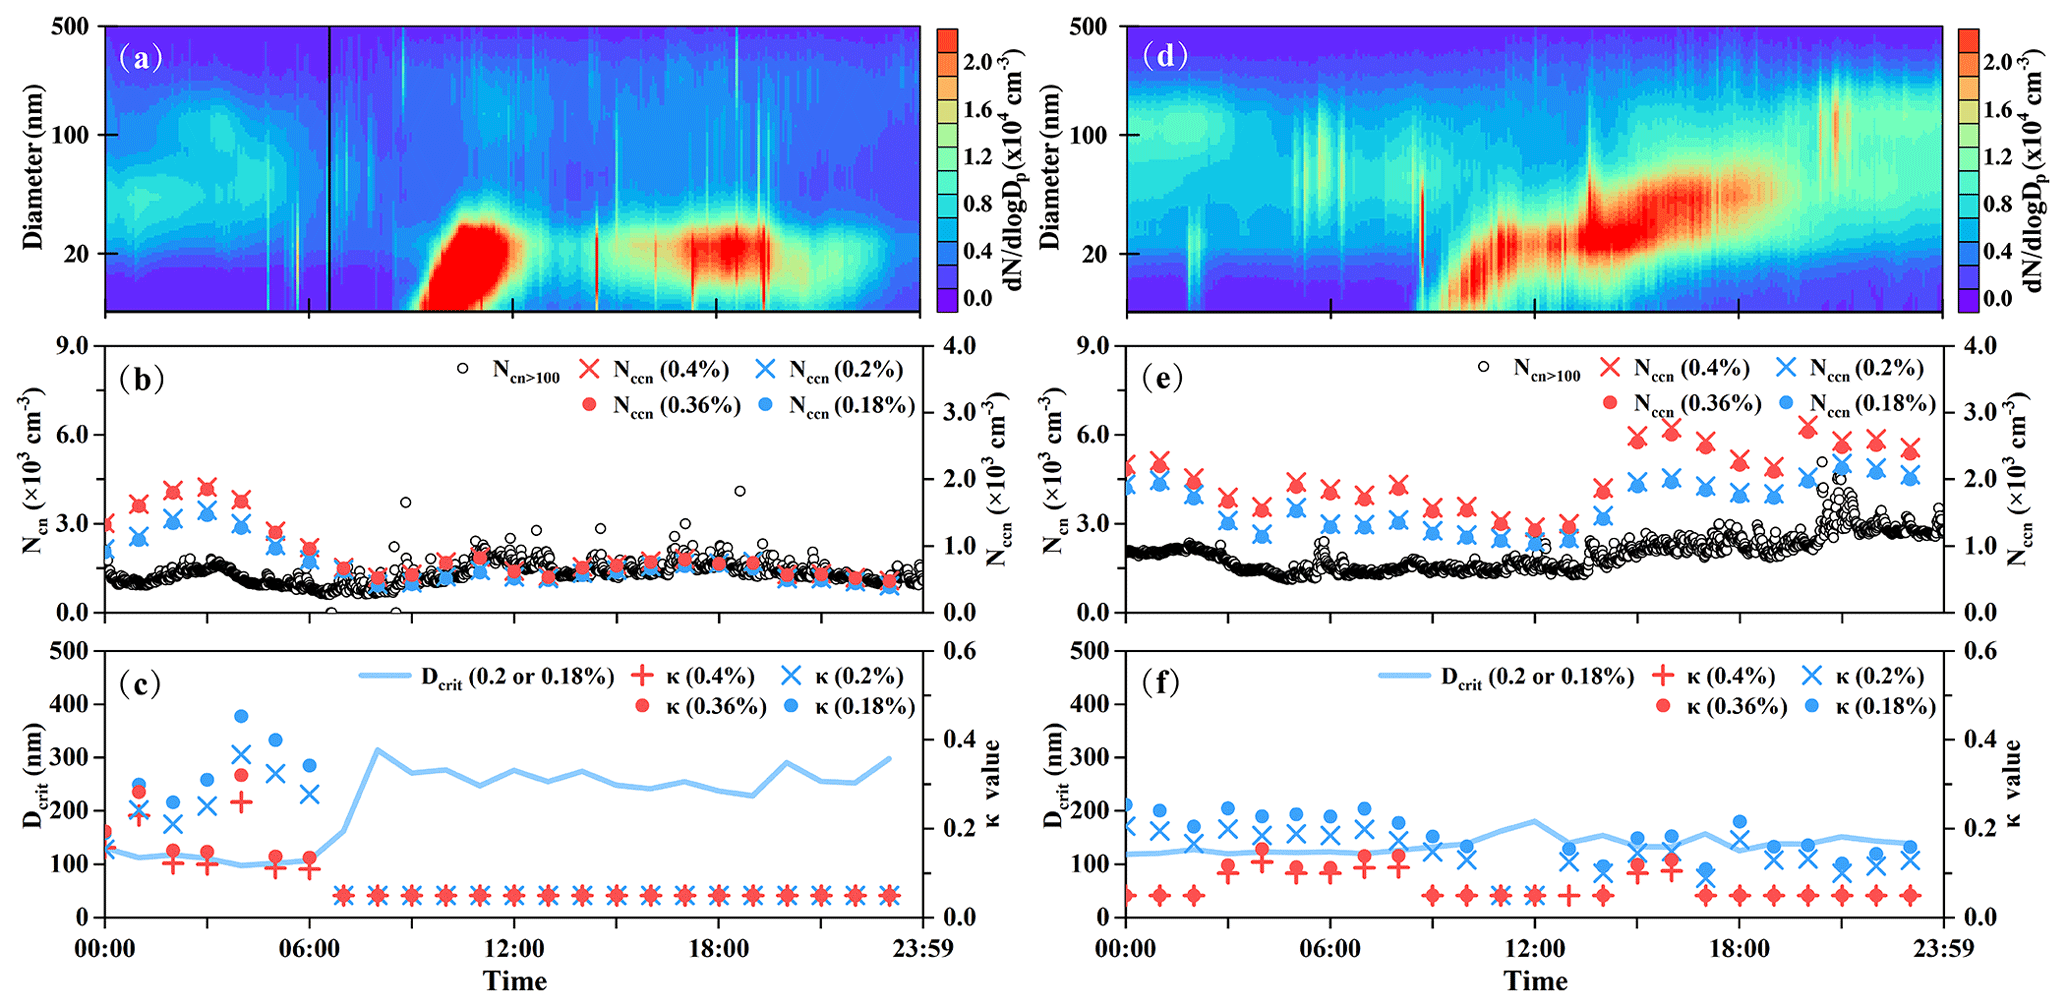
Figure 3The contour plots of particle number size distribution, time series for Ncn>100, and time series for Nccn, κ values, and Dcrit at the lab-calibrated SS and the corresponding on-site approximated values, on 29 June and 3 July, respectively (a and d contour plots of PNSD; b and e, Ncn>100 and Nccn at the lab-calibrated 0.2 % and 0.4 % SS and the on-site approximated Nccn at 0.18 % and 0.36 % SS; c and f, Dcrit at 0.2 % or 0.18 % SS, κ values at the lab-calibrated 0.2 % and 0.4 % SS and the on-site approximated κ values at 0.18 % and 0.36 % SS).
Compared to observations at 0.2 % SS reported in the literature, the campaign average Nccn during the 16 d in this study was almost double the value of 0.8 ± 0.7×103 cm−3 measured during 3 weeks of summer in 2014 on Mount Huangshan (Anhui Province, China) (Miao et al., 2015) and 0.7 ± 0.4×103 cm−3 measured during 4 weeks of summer in 2019 on the Tian Mountains (Xinjiang Uygur Autonomous Region, China) (Liu et al., 2020). In addition, even lower seasonal averages of Nccn at 0.2 % SS were recently observed on Liupan Mountains (Ningxia Hui Autonomous Region, China) from August 2020 to November 2021, with the lowest seasonal average being 0.4×103 cm−3 in summer and the highest being 0.7×103 cm−3 in winter (Lin et al., 2022). However, the average Nccn was only half of that observed at a suburban site of Qingdao (Shandong Province, China) in the spring of 2013 (Li et al., 2015). Schmale et al. (2018) also analyzed Nccn at 0.2 % SS observed at 12 regionally representative sites, including two mountain sites, i.e., Jungfraujoch (JFJ) mountain station in Switzerland from January 2012 to December 2014 and Puy de Dôme (PUY) mountain station in France from November 2014 to September 2015. The recorded maximum values at the JFJ and PUY did not exceed 1×103 cm−3. They also reported a notable seasonal variation in Nccn at these mountain sites, with the highest median concentrations occurring in summer associated with the uplifted boundary layer air masses. However, the summer median values were far smaller than 1.0×103 cm−3, e.g., 0.2×103 cm−3 at JFJ. At 0.4 % SS, the average Nccn during the 16 d was also double the values observed at the SMEAR II station (a rural forest site) in Hyytiälä in July 2008 and June 2009 (Sihto et al., 2011) and substantially larger than the values of 166–700 cm−3 at 0.11 %–0.80 % SS over a midlatitude forest in Japan (Deng et al., 2018). Assuming that the rural seasonal or campaign averages of 0.3–0.8×103 cm−3 Nccn at 0.2 % SS observed at these remote mountain sites in China represent upper limits for natural contributions, it is likely that at least 50 % of the observed Nccn in this study were derived from primary and secondary anthropogenic aerosols. In Beijing, NPF events have also been observed in polluted atmospheres with air masses originating from the south and southwest (Wu et al., 2007). In those cases, anthropogenic aerosols expectedly yield an even larger contribution to Nccn. Moreover, the measured concentrations of EC in TSP were only 0.23–0.53 µg m−3 in this study (see Table 2), consistent with values of 0.10–0.43 µg m−3 in PM2.5 in remote atmospheres across North America (Ahangar et al., 2021). Given the low CCN activation of primary aerosols (Gao et al., 2020), it is expected that secondary anthropogenic aerosols contributed significantly to Nccn (Ma et al., 2021) and were therefore investigated below.
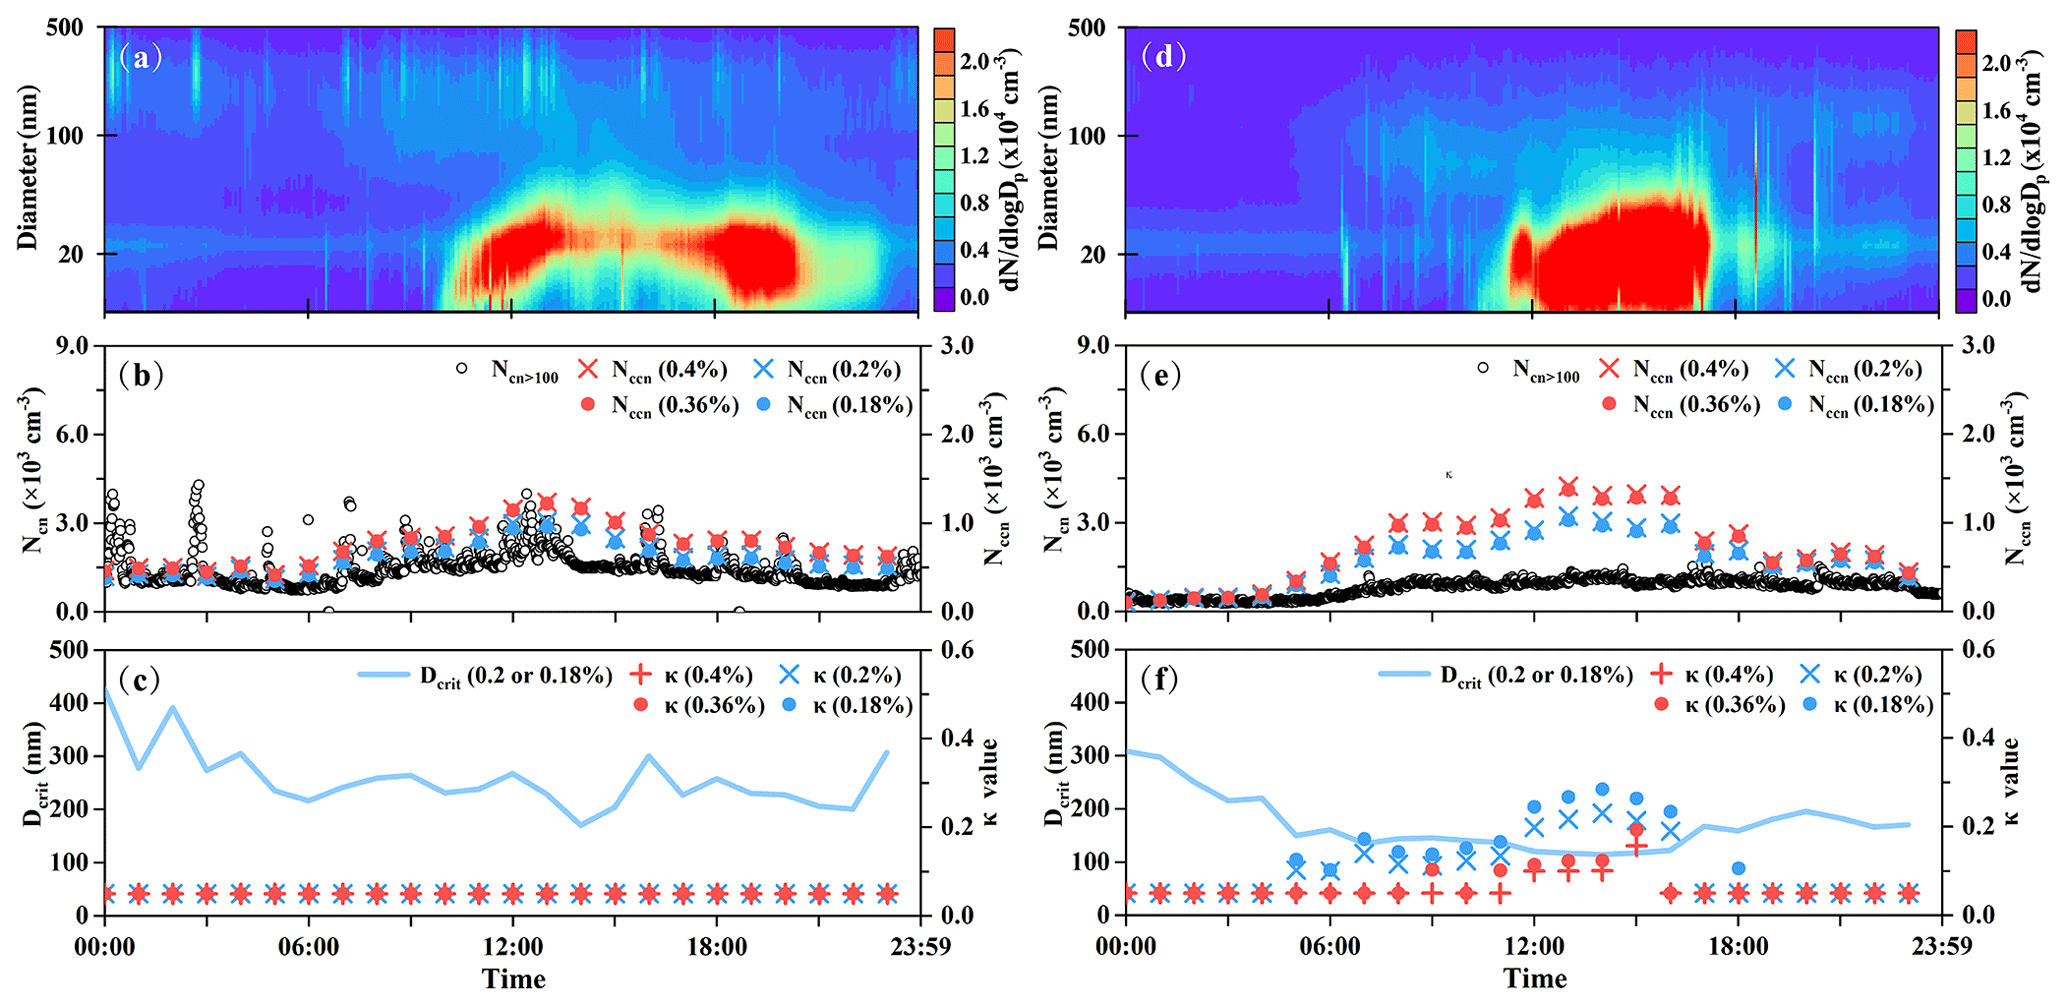
Figure 4The contour plots of particle number size distribution, time series for Ncn>100, and time series for Nccn, κ values, and Dcrit at the lab-calibrated SS and the corresponding on-site approximated values on 30 June and 6 July, respectively (a and d, contour plots of PNSD; b and e, Ncn>100 and Nccn at the lab-calibrated 0.2 % and 0.4 % SS and the on-site approximated Nccn at 0.18 % and 0.36 % SS; c and f, Dcrit at 0.2 % or 0.18 % SS, κ values at the lab-calibrated 0.2 % and 0.4 % SS and the on-site approximated κ values at 0.18 % and 0.36 % SS).
Nucleation events have been identified as significant sources of atmospheric particles in terms of number concentration (Kulmala et al., 2004; Chu et al., 2019; Lee et al., 2019). In this study, such events were observed frequently on 8 out of the total 16 d (Figs. 3–5 and S7 in the Supplement), with air masses mainly originating from the northwest, north, and northeast during these events (Fig. 1a–h). Shorter air mass back trajectories were obtained from 12 to 14 July, and shorter durations of nucleation events were observed. Wu et al. (2007) reported statistical analysis of NPF events using a year measurement in Beijing; i.e., NPF events occurred under low-RH and sunny conditions while non-NPF events were usually associated with strong condensational sink or absence of sunny conditions. The air masses from the north and northwest usually carry dry and clean air, favoring the occurrence of NPF events. As shown in Table S1, significantly lower Nccn values were observed on nucleation days compared to non-nucleation days (with p<0.05), namely, 1.2 ± 0.7×103 cm−3 on nucleation days versus 1.6 ± 0.8×103 cm−3 on non-nucleation days at 0.2 % SS. The same trend was observed at 0.4 % SS, with the values of 1.5 ± 0.9×103 cm−3 on nucleation days and 1.8 ± 0.9×103 cm−3 on non-nucleation days. However, the Nccn values at 1.0 % SS on nucleation days (2.1 ± 1.2×103 cm−3) did not differ significantly from those observed on non-nucleation days (2.3 ± 1.1×103 cm−3) (p>0.05). Hirshorn et al. (2022) analyzed 15 years of observational data from a mountaintop location in North America and found that Nccn did not show a significant increase during NPF events in either summer or autumn. Kawana et al. (2017) also reported lower mean Nccn values on nucleation days compared to non-nucleation days at a forest site in Wakayama (Japan) during the summer, which were likely due to biogenic secondary organic condensation on atmospheric particles. A comprehensive survey on this issue reported in the literature will be presented in Sect. 3.4. Theoretically, newly formed particles may continue to grow even after the new particle signal disappears from observations. However, the occurrence of preexisting particle growth seemed infrequent and was observed only on 4 July (1 of 16 d). On that day, larger and smaller preexisting particle growth was observed from 88 to 116 nm and from 24 to 32 nm, respectively (see Fig. S8 in the Supplement). Moreover, the growth of newly formed particles extended to the next day, occurring only during one nucleation event, where newly formed particles grew from 1 July to the early morning of 2 July. Therefore, the observations on 2 July were reclassified as nucleation days and removed from non-nucleation days. The re-calculated Nccn values on nucleation days did not differ significantly from those on non-nucleation days at SS=0.2 % and 0.4 % with p>0.05, namely, 1.3 ± 0.5×103 cm−3 (nucleation days) versus 1.4 ± 0.5×103 cm−3 (non-nucleation days) at 0.2 % SS and 1.6 ± 0.7×103 cm−3 (nucleation days) versus 1.6 ± 0.6×103 cm−3 (non-nucleation days) at 0.4 % SS. The change suggested that the significance of the Nccn discrepancy between nucleation and non-nucleation days at 0.2 % and 0.4 % SS was sensitive to the applied data size. However, further investigation through long-term observations is required to determine whether nucleation events can contribute to a statistically significant increase in CCN concentration.
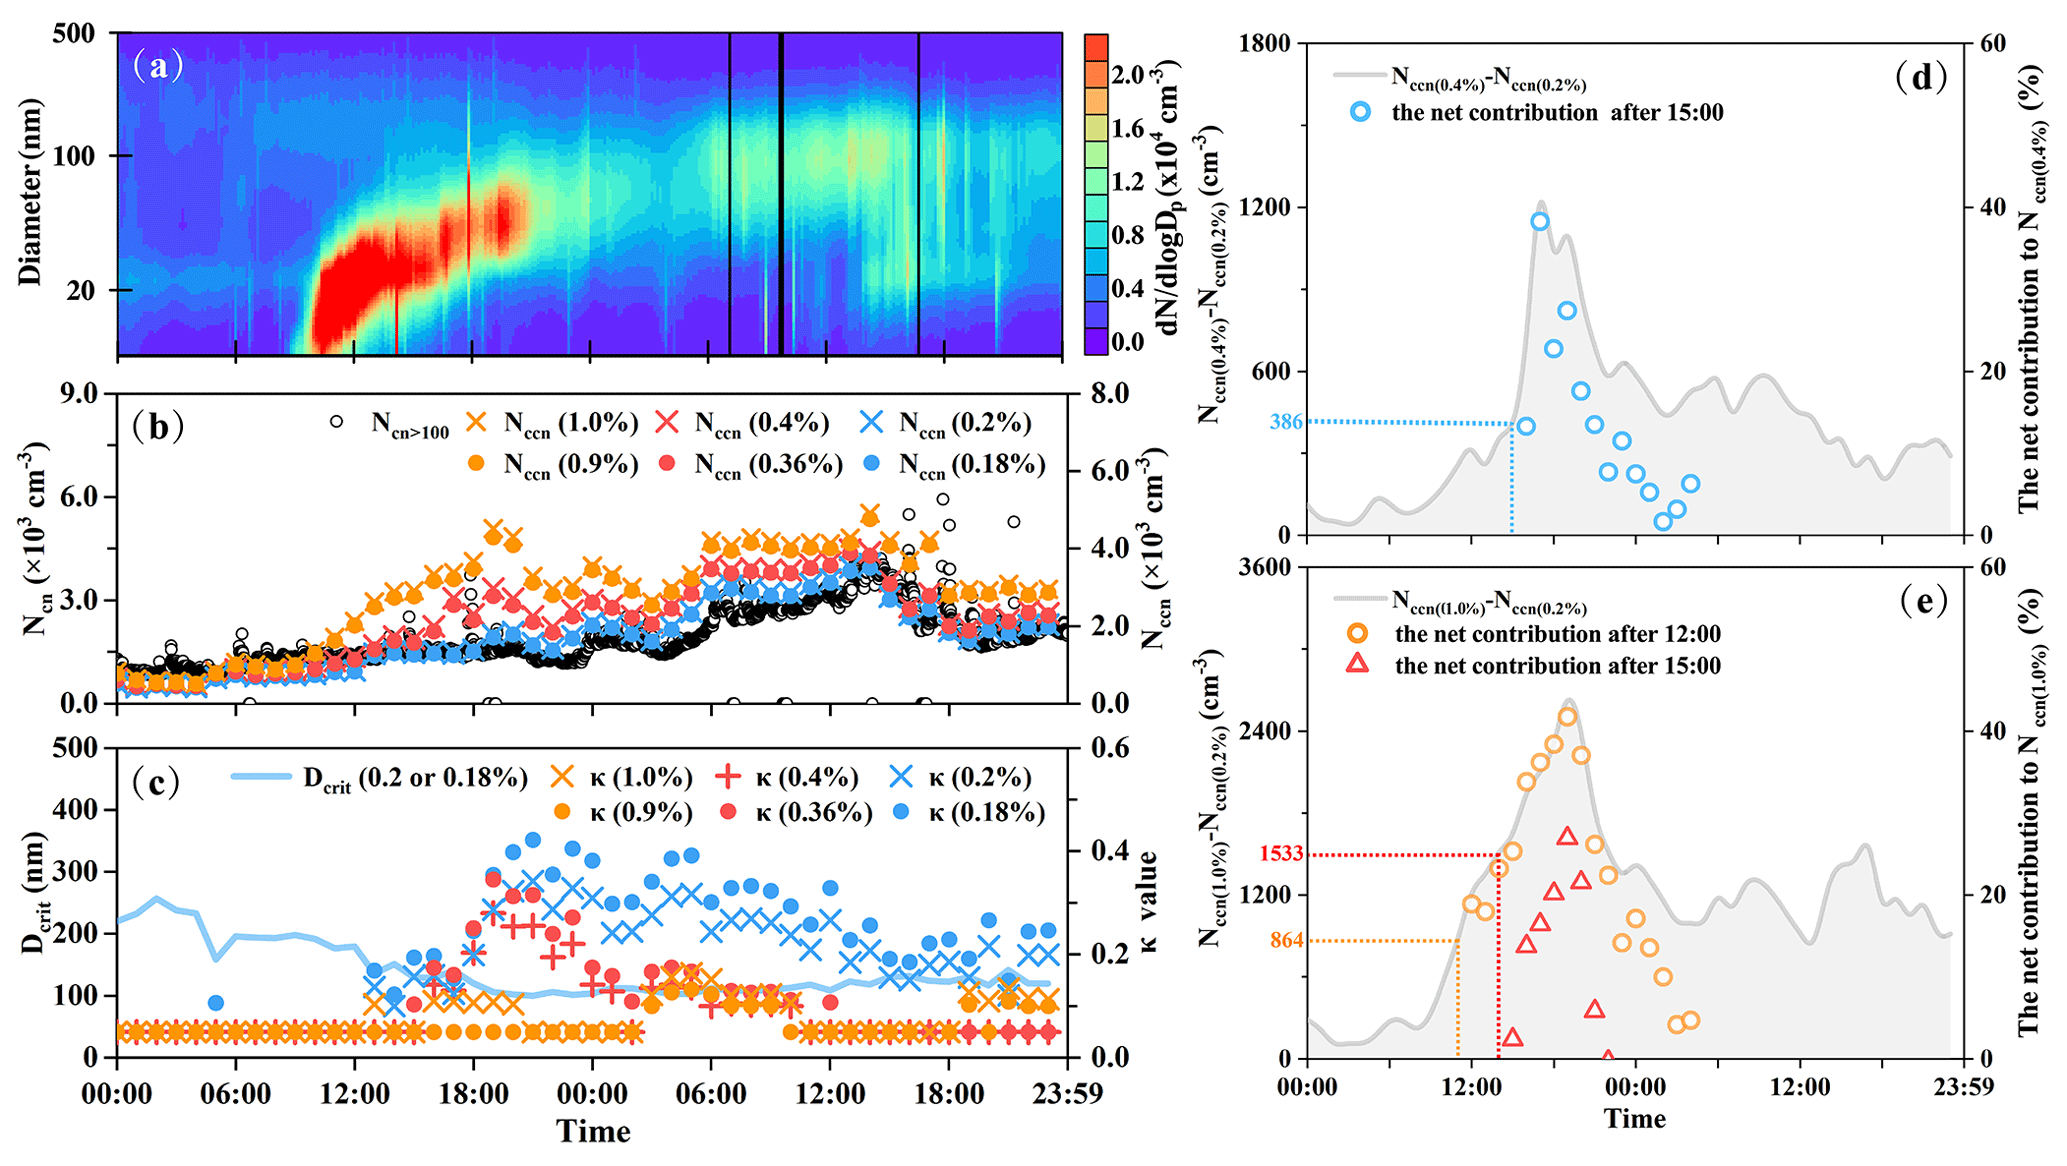
Figure 5The contour plots of particle number size distribution (a); time series for Ncn>100, Nccn at the lab-calibrated 0.2 % and 0.4 % SS, and the on-site approximated Nccn at 0.18 % and 0.36 % SS (b); time series for Dcrit at 0.2 % or 0.18 % SS, κ values at the lab-calibrated 0.2 % and 0.4 % SS, and the on-site approximated κ values at 0.18 % and 0.36 % SS (c); time series of (Nccn(0.4 %)−Nccn(0.2 %)) and ratios of (d); time series of (Nccn(1.0 %)−Nccn(0.2 %)) ratios of (e) on 1–2 July.
Excluding 2 July, the Ncn>100 on NPF days were significantly lower at (1.6 ± 0.8×103 cm−3) compared to non-NPF days (1.8 ± 1.0×103 cm−3) with p<0.05 (Table S1), which partially explained the lower Nccn at 0.2 % SS. However, the total Ncn substantially increased on NPF days to 8.4 ± 6.1×103 cm−3 compared to 4.7 ± 2.6×103 cm−3 on non-NPF days. During the first 2–3 h of the NPF events, the total Ncn increased significantly from 4.2 ± 1.1×10³ to 21 ± 5.4×103 cm−3 with the NMINP of 17 ± 6.0×103 cm−3 (Fig. 2a). Nonetheless, the increase in the total Ncn did not result in a statistically significant increase in the observed Nccn at the lab-calibrated SS from 0.2 % to 1.0 % on NPF days compared to non-NPF days, regardless of including or excluding 2 July from NPF days. It is important to note that the observational data alone cannot provide evidence of any additional evolution of grown new particles and their additional contribution to Nccn after the new particle signal disappears, particularly considering the infrequent occurrence of the preexisting particle growth.
The statistical comparisons between NPF and non-NPF days in this study showed contradictory results to those previously reported in the literature. In other words, the findings of this study contradicted the idea that NPF events are important secondary sources of CCN, which has been reported in previous studies (Sotiropoulou et al., 2006; Kuwata et al., 2008; Wiedensohler et al., 2009; Sihto et al., 2011; Ma et al., 2016; Rose et al., 2017; Kerminen et al., 2018; Wan et al., 2020; Fang et al., 2021; Ren et al., 2021; Chang et al., 2022). Therefore, this paper presents a case-by-case examination from Sects. 3.2 to 3.5, where the contributions of NPF events to the Nccn are elaborated at various SSs by considering the grown new particles in different sizes. Section 3.2 presents the analysis results of five NPF events on 29 June, 3 and 12–14 July. The NPF events did not cause an increase in Nccn at 0.2 %, 0.4 %, and 1.0 % SS (see Figs. 3 and S7). Section 3.3 includes two NPF events on 30 June and 6 July when an increase in Nccn was indeed observed (see Fig. 4). However, this increase was associated mainly with changing number concentrations and/or κ values of preexisting particles. On 1 July, an increase in Nccn was observed during the NPF event (see Fig. 5), while the grown new particles unlikely contributed to Nccn at 0.2 % SS. The results are analyzed in the first part of Sect. 3.4. When the Nccn at 0.4 % and 1.0 % SS were analyzed in the NPF event on 1 July, the contributions of the grown new particles to Nccn could be reasonably qualified at nighttime with a large increase in κ values of atmospheric particles. These results will also be included in the second part of Sect. 3.4.
3.2 Case study with no detectable contribution to Nccn during NPF events
Figure 3a–f show that there was no detectable contribution of grown new particles to Nccn in the NPF events on 29 June and 3 July. Specifically, higher values of Nccn at the lab-calibrated 0.2 % and 0.4 % SS were observed before 06:00 (24 h used here and afterwards) on 29 June, which were associated with the intrusion of aerosol plumes and higher κ values of 0.26 ± 0.06 at 0.2 % SS and 0.16 ± 0.03 at 0.4 % SS (see Fig. 3a–c). The κ values at 0.2 % SS were close to the global average values and those reported in suburban or rural polluted atmospheres of China (Petters and Kreidenweis, 2007; Rose et al., 2010, 2011; Ma et al., 2016; Fang et al., 2021). Assuming that the activated aerosols at 0.2 % SS were internally mixed and mainly composed of inorganic ammonium salts and organics (Petters and Kreidenweis, 2007; Rose et al., 2010, 2011), both of them likely yielded an appreciable contribution to the total mass concentration of the associated aerosols. However, the exact percentages relied on the κ values of various organics. The κ values of 0.16 ± 0.03 at 0.4 % SS were also reported in remote forest or less polluted areas (Gunthe et al., 2009; Dusek et al., 2010; Cerully et al., 2011; Sihto et al., 2011; Levin et al., 2014; Kawana et al., 2017; Fang et al., 2021; Park et al., 2021). The calculated κ values almost halved with SS increasing from 0.2 % to 0.4 % before 06:00, suggesting that the observed aerosols in smaller sizes had lower cloud activation potentials. Similar results were frequently reported in the literature; i.e., the fraction of organics in atmospheric nanometer particles increased with the decrease in particle sizes (Rose et al., 2010, 2011; Crippa et al., 2014; Cai et al., 2017). After 06:00, the calculated κ values at 0.2 % and 0.4 % SS largely decreased to be less than 0.1. The low κ values suggested that atmospheric aerosols measured after 06:00 mainly consisted of low CCN-activated organics (Petters and Kreidenweis, 2007; Kerminen et al., 2018; Chang et al., 2022). When the approximated on-site SSs were used to derive the κ values before 06:00, they were 0.32 ± 0.08 at 0.18 % SS and 0.19 ± 0.07 at 0.36 % SS. After 06:00, they also decreased to be below 0.1.
On 29 June, the NPF became noticeable at 08:35, causing the total Ncn to increase rapidly by over 1 order of magnitude within 2 h with a FR of 2.3 and NMINP of 2.0×104 cm−3. The newly formed particles took approximately 3 h to grow from the initial median mode diameter of <10 nm to the maximum median mode diameter of 20 nm with the corresponding half width of 12 nm in 99.7 % confidence. However, similar to our previous findings and other studies reviewed by Chu et al. (2019), new particles stopped growing after approximately 10 h and could even shrink slightly before disappearing. With κ values <0.1, only atmospheric particles larger than 120–200 nm could be activated as CCN at 0.2 % and 0.4 % SS (Petters and Kreidenweis, 2007), which is conventionally referred to as the CCN-activated size. Even at 1.0 % SS, the CCN-activated size at κ values <0.1 (Fig. S9 in the Supplement) should be larger than 70 nm. Therefore, the newly grown particles were too small to act as CCN, regardless of ambient SS, as previously reported (Hammer et al., 2014; Hudson et al., 2015; Shen et al., 2018). Moreover, the variations in Nccn at 0.2 % SS were likely determined by the number concentrations of larger preexisting particles based on the correlation between Nccn at 0.2 % SS and Ncn>100 from 09:00 to 24:00 on 29 June. The regression equation can be expressed as follows: , with an R2 of 0.70 and p<0.01, at 0.2 % SS.
On 3 July, NPF event commenced at 08:10 with FR of 0.75 and NMINP of 9.5×10³ (refer to Fig. 3d–f). However, between 06:00 to 13:00, the Nccn at the lab-calibrated 0.2 % and 0.4 % SS decreased with decreasing κ values. Meanwhile, Ncn>100 slightly increased during the same time period. It is likely that less CCN-activated vapor condensation had a significant effect on the growth of preexisting particles resulting in the increase in Ncn>100 and decrease in Nccn. Following 13:00, Nccn values at 0.2 % and 0.4 % SS experienced two stepwise increases, accompanied by an increase in Ncn>100. For example, Nccn values at 0.2 % and 0.4 % SS almost doubled with the median mode diameter of the grown new particles narrowing to 25–33 nm from 13:00 to 15:00, and the two values then slightly decreased till 20:00. However, the grown new particles were still too small to be activated as CCN at 13:00–15:00 with the median mode diameter plus the corresponding half width of 24–30 nm in 99.7 % confidence to be considered. From 18:00 to 24:00, the maximum median mode diameter of the grown new particles stopped at 48 nm and the corresponding half width of 47 nm in 99.7 % confidence. The calculated κ values were 0.13 ± 0.03 at 0.2 % SS and <0.1 at 0.4 % SS (0.15 ± 0.03 at 0.18 % SS and <0.1 at 0.36 % SS). For CCN activation, particles need to be larger than 100–140 nm for lab-calibrated and approximated on-site SS. In this case, the increase in Nccn after 13:00 may have been due to the observed growth of preexisting particles from ∼50 nm to particles larger than 100 nm (refer to Fig. 3d). It is possible that the growth of preexisting particles was driven by organic vapor with lower CCN activation since κ values at 0.4 % SS decreased from 0.11 to lower values. However, the increasing size of the preexisting particles may have canceled out the decreasing effect of κ on Nccn. It is worth noting that even smaller κ values were calculated at 1.0 % SS on 3 July (refer to Fig. S9). Thus, the grown new particles could not have contributed to Nccn at the lab-calibrated 1.0 % SS.
During the NPF events that occurred from 12–14 July (refer to Fig. S7a–c), no discernible increase in Nccn at the lab-calibrated 0.2 % and 0.4 % SS was observed in contrast to the events immediately prior. The three NPF events were often linked to the intrusion of various aerosol plumes. However, based on the combination of lower κ values calculated at 0.2 % and 0.4 % SS and the size of the newly formed particles during these events, it can be inferred that there was likely no net contribution of the grown particles to the observed Nccn.
3.3 Case study with positive contributions to Nccn during NPF events but not from grown new particles
During NPF events on 30 June and 6 July, an increase in Nccn values at the lab-calibrated 0.2 % and 0.4 % SS was observed (see Fig. 4a–f). However, the maximum median mode diameter of the newly formed particles stopped at 19 ± 1 nm on 30 June and 25 ± 1 nm on 6 July with the corresponding half width of 28 and 37 nm in 99.7 % confidence, respectively (see Fig. 4a and d). On 30 June, the particles grew rapidly before 12:00, stopped growing, and even shrank slightly in the next 11 h. On 6 July, the particles reached their maximum size at 13:00, stopped growing in the next 3 h, and disappeared shortly after. The calculated κ values at 0.2 % and 0.4 % SS were smaller than 0.1 on 30 June, and the same was true at approximated on-site 0.18 % and 0.36 % SS. On 6 July, the maximum κ values at 0.2 % SS were 0.21 ± 0.02 (or 0.26 ± 0.02 at 0.18 % SS) during 12:00–16:00, and the maximum value at 0.4 % was 0.16 (or 0.19 at 0.36 % SS) at 16:00. The small size of the newly formed particles made it unlikely for them to contribute to the increase in Nccn at 0.2 % and 0.4 % SS during the NPF events. Even at 1.0 % SS, the grown new particles were too small to act as CCN due to even smaller κ values (see Fig. S9).
On 30 June, the observed increase in Nccn was partially attributed to the increased number concentration of preexisting particles. This was demonstrated by a significant correlation between Nccn and Ncn>100 from 10:00 to 14:00 on that day, with an equation of , R2=0.83, and p<0.05 at 0.2 % SS. However, on 6 July, there was no significant correlation between Nccn at 0.2 % SS and Ncn>100 during the NPF event, implying that the increase in Nccn at 0.2 % and 0.4 % SS was mainly due to the increased κ values of the preexisting particles (see Fig. 4e and f).
3.4 The contributions of grown new particles to Nccn at various SS on 1 July
In contrast to the seven NPF events discussed above, the newly formed particles experienced continuous growth from <10 nm at 08:30 on 1 July to 65 ± 3 nm at 00:00–04:50 on 2 July (see Fig. 5a). The corresponding half width in the latter 5 h varied from 153 to 203 nm with 99.7 % confidence and from 114 to 138 nm with 99 % confidence. Thus, at least 1 % of the grown new particles (61–73 cm−3) were large enough to be activated as CCN. Supposing that part of the grown new particles was totally activated as cloud droplets, they should yield an appreciable contribution to CNDC. Local meteorological data recorded 0.2 mm rainfall at 04:00–05:00 on 2 July. However, after 04:50 on 2 July, the new particle signal was overwhelmed by the intrusion of aerosol plumes because the Ncn varied significantly with an invariant median accumulation mode diameter (see Fig. 2a). The spatial inhomogeneity of the NPF occurrence could not be completely excluded (Zhou et al., 2021). The FR of the NPF event was only 0.82 on that day, suggesting a weak NPF event. This value ranked lower than the values of 0.06–5.95 reported in other forest areas (Fiedler et al., 2005; Dal Maso et al., 2005; Han et al., 2013).
During the NPF event on 1 July, a large increase in Nccn was observed at 0.2 % SS (see Fig. 5b). Prior to the NPF event, the Nccn at 0.2 % SS had been 0.6 ± 0.1×103 cm−3 for 4 h. During the event, there were three stepwise increases: the first stage was 0.8 ± 0.06×103 cm−3, followed by the second stage, which reached 1.3 ± 0.04×103 cm−3 between 13:00 and 19:00. The Nccn then increased to a high level and fluctuated around 1.8 ± 0.2×103 cm−3 (third stage) until the new particle signal disappeared at 04:00–05:00 on 2 July (see Fig. 5b). Overall, the Nccn at 0.2 % SS increased by approximately 200 % during the NPF event compared to the stable values prior to its occurrence.
The maximum κ values at 0.2 % SS were calculated to be 0.30 ± 0.03 from 19:00 on 1 July to 05:00 on 2 July, which was close to the values observed before 06:00 on 29 June and during the non-NPF period observed on 12–14 July. However, the calculated κ values were below 0.2 before 19:00, with the CCN-activated size larger than 120 nm. The new particles grew with median mode diameters below 43 nm plus half width below 12 nm in 99.7 % confidence, which were unlikely to contribute to Nccn before 19:00. The same was true when the approximated on-site 0.18 % SS was considered. Therefore, the increased Nccn were likely caused by the preexisting particles with increasing κ values. The hourly average Ncn>100 stayed around 1.4 ± 0.02×103 cm−3 from 09:00 to 13:00 and 1.5 ± 0.06×103 cm−3 from 13:00 to 19:00. The stepwise increase in Ncn>100 was also likely to reflect the change in preexisting particle number concentration instead of the continuous growth of newly formed particles and subsequent increase in Ncn>100.
From 19:00 on 1 July to 05:00 on 2 July, the Nccn at 0.2 % SS was highly correlated with the Ncn>100; i.e., , R2=0.89, p<0.01. However, the Ncn>100 varied around 1.6 ± 0.2×103 cm−3 during the period and exhibited a stable trend tested by the Mann–Kendall method with p value of 0.44. The stable trend implied that the contribution from the grown new particles to Ncn>100 was statistically undetectable. The grown new particles were unlikely to compete with the preexisting particles to form cloud droplets at 0.2 % SS because of their smaller sizes and lower κ values, despite the possibility of decreased ambient SS with rapid uptake of water vapor on particles (Crumeyrolle et al., 2021; Gong et al., 2023).
Upon analyzing the data at 0.4 % SS on 1–2 July, it was found that the newly grown particles likely contributed significantly to the observed increase in Nccn after 15:00 on 1 July. Prior to this time, although the Nccn at 0.4 % SS had increased, the calculated κ values were below 0.1 for CCN-activated sizes larger than 100 nm. However, the maximum median mode diameter of the newly grown particles was smaller than 27 nm with the corresponding half width of 12 nm in 99.7 % confidence before 15:00. Hence, the increase in Nccn was attributed to the increased κ values of preexisting particles. After 15:00, the increased κ values led to a smaller CCN-activated size of 67–87 nm at 0.4 % SS. The larger difference in Nccn between 0.2 % and 0.4 % SS was likely due to the increased contribution of the newly grown particles to Nccn at 0.4 % SS (refer to Fig. 5d). Note that the calculated κ values at 0.4 % SS after 15:00 might suffer from an error to some extent (Wex et al., 2010). In this case, the grown new particles externally existed with preexisting particles and were unable to satisfy the internal mixing assumption required in Eq. (1).
To quantify the contribution of grown new particles to Nccn at 0.4 % SS, we introduced a new term, Nccn,diff, which represents the difference between Nccn at 0.4 % SS and Nccn at 0.2 % SS. We made two assumptions: first, that the Nccn,diff value at 14:00 (386 cm−3) represented the Nccn,diff of preexisting particles and, second, that the Nccn,diff values of preexisting particles remained constant after 15:00. Therefore, the difference between Nccn,diff after 15:00 and Nccn,diff at 14:00 represented the net contribution of grown new particles to Nccn at 0.4 % SS. The net contribution of grown new particles was 316 ± 304 cm−3 from 15:00 on 1 July to 05:00 on 2 July, accounting for only 12 % ± 11 % of Nccn at 0.4 % SS. The maximum net contribution occurred at 16:00 on 1 July and was determined to be 1.0×103 cm−3, accounting for 38 % of Nccn at 0.4 % SS. These rough estimates suggest that preexisting particles were still the major contributor to Nccn at 0.4 % SS, outnumbering new particles.
We used the same method to analyze the contribution of grown new particles to Nccn at 1.0 % SS by calculating Nccn,diff, which was the difference between Nccn at 1.0 % and 0.2 % SS (see Fig. 5e). However, using Nccn,diff at 11:00 appeared to be more reasonable than using Nccn,diff at 14:00 to estimate the net contribution of the grown new particles to Nccn at 1.0 % SS. The results of the test are presented below. We assumed the Nccn,diff value at 11:00 (864 cm−3) to represent the Nccn,diff of preexisting particles after 12:00 and assumed that the Nccn,diff was invariant after 12:00. It can obtain that the net contribution of the grown new particles was 769 ± 514 cm−3 from 12:00 on 1 July to 05:00 on 2 July, accounting for only 23 % ± 12 % of Nccn at 1.0 % SS. The maximum net contribution was 1.9×103 cm−3 at 18:00 on 1 July, which accounted for 42 % of Nccn at 1.0 % SS. We also observed a minimum contribution of 4 % at 03:00 on 2 July, which was consistent with the disappearance of new particle signals. Alternatively, We attempted to use the Nccn,diff at 14:00 (1533 cm−3) representing the substrate constant Nccn,diff of the preexisting particles after 15:00. However, negative net contributions of the grown new particles to Nccn at 1.0 % SS were observed after 22:00 on 1 July, suggesting that the Nccn,diff of preexisting particles was overestimated. The above-mentioned conclusions were also valid when the approximated on-site SSs were used.
In the literature, the impact of NPF events on CCN has been widely investigated, e.g., the observational results from 35 sites worldwide summarized by Ren et al. (2021), and the studies can be classified into three categories. Category 1: the concentrations of CCN were measured and the contribution of grown new particles to CCN loadings at various SS levels were calculated by tentatively deducting the perturbation from varying preexisting particles during the NPF events. Category 2: the concentrations of CCN were also measured during the NPF events. However, the preexisting particles were assumed to be invariant when calculating the contribution of grown new particles to CCN loading during the NPF events. No tentative approach was conducted to deduct the perturbation from varying preexisting particles on the increase in Nccn relative to those immediately observed before NPF events. Category 3: the concentrations of CCN were not directly measured. Instead, the values were estimated either by the size of grown new particles beyond a certain threshold or a combination of the grown new particle size and κ values. Here, we compared our results with those previously reported at mountain sites or several remote continental sites on this issue (Table 1).
Table 1Details regarding the impact of NPF to Nccn at various sites. The information includes the percentage improvement in CCN attributable to NPF as well as the number of NPF events that increase CCN.
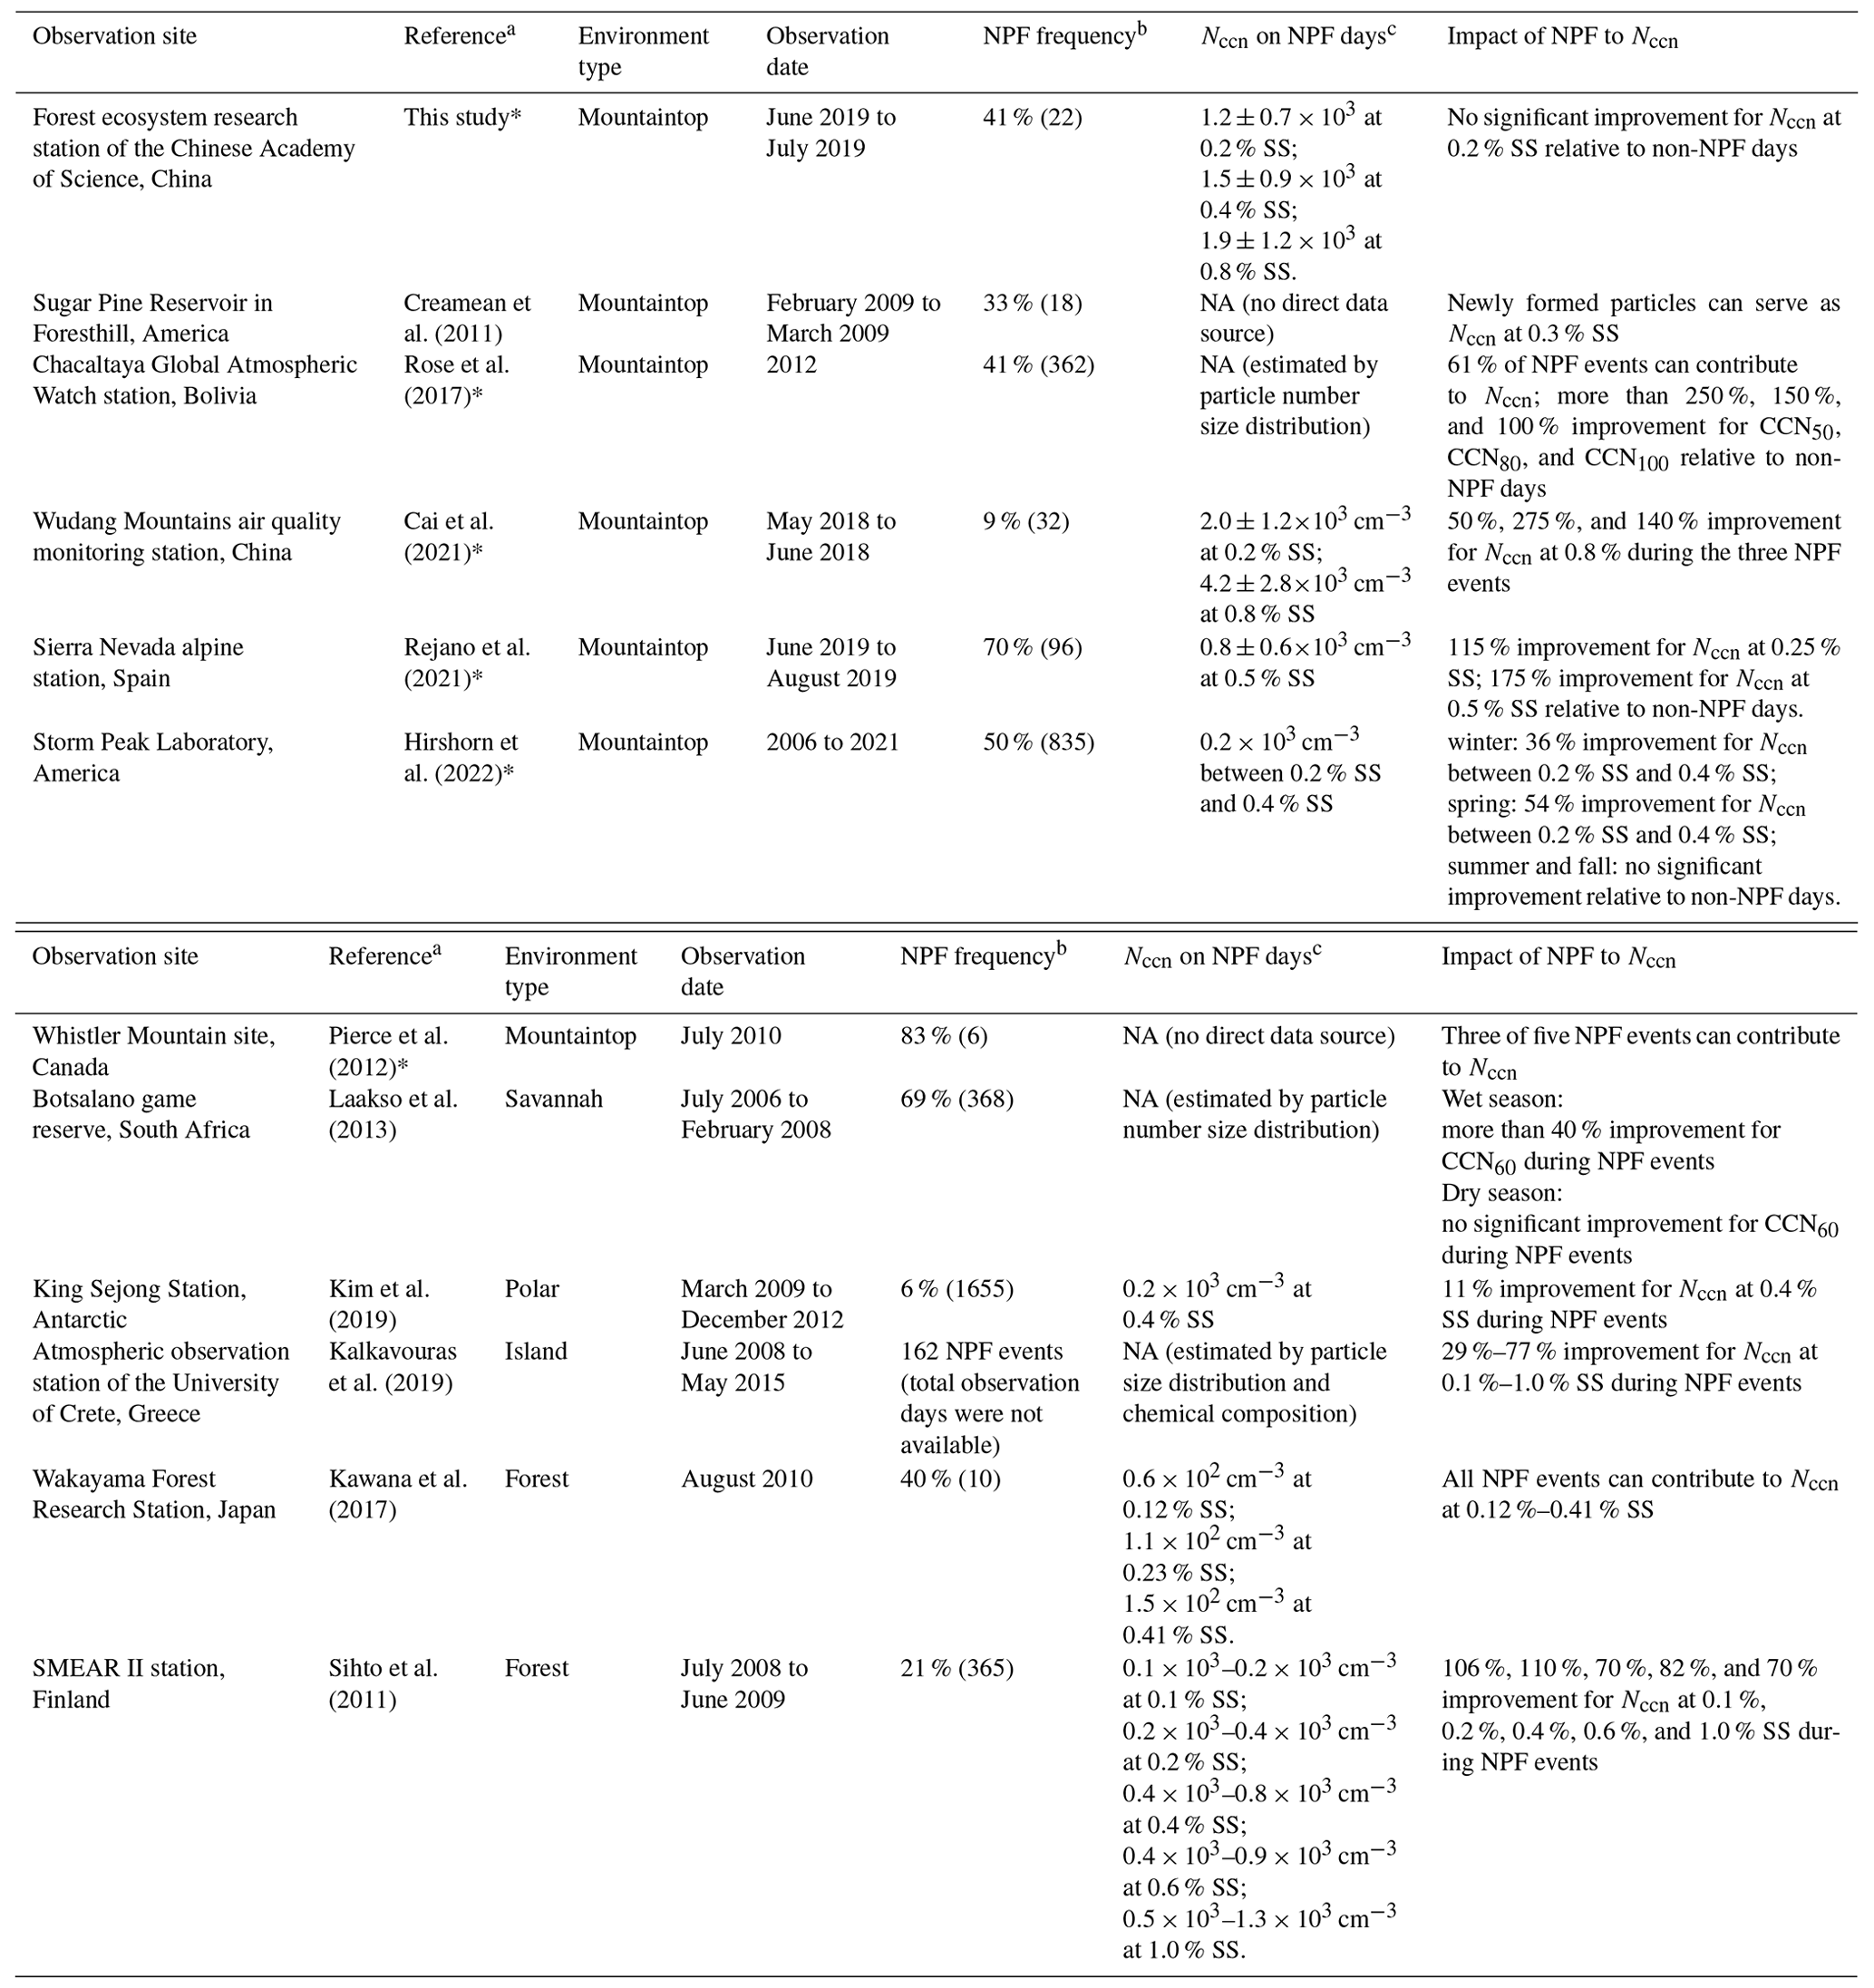
a Events that remove the influence of preexisting particles were indicated with asterisks. b The total observation days of data in parentheses. c NA refers to the CCN observation data were not available, and the reasons are indicated in parentheses.
For Category 1, there were only two studies reported in the literature. Cai et al. (2021) analyzed the contribution of 3–80 nm particles to Nccn at the Wudang Mountains during three NPF events when there were more than 50 %, 275 %, and 140 % increases in Nccn at 0.8 % SS. During the three events, the Dp of grown new particles was below 40 nm (see Fig. 2a in Cai et al., 2021). However, their Fig. 2a also showed that the concentrations of preexisting particles at 40–80 nm during the NPF events clearly increased relative to those observed immediately before the events. It seemed that the selected contribution of 3–80 nm particles to Nccn alone might be insufficient to deduct the perturbation from varying preexisting particles. Moreover, Cai et al. (2021) did not analyze the contribution at 0.2 % SS because the grown new particles were too small to be activated as CCN at 0.2 % SS. Rejano et al. (2021) compared the maximum increase during NPF events with that during non-NPF events, with a relative increase of 115 % at 0.25 % SS and 175 % at 0.5 % SS, respectively. In their study, they clearly assumed that the preexisting particles were invariant between NPF events and non-NPF events. However, the assumption appeared to be invalid on the basis of the results shown in their Figs. 4d and 6d; i.e., Nccn at 0.5 % SS peaked at 13:00 and then decreased. However, the Dp of grown new particles at approximately 25 nm at 13:00 (shown in their Fig. 4b) was obviously too small to be activated as CCN at 0.5 % SS and the larger increase in Nccn before 13:00 might have had a high possibility mainly due to varying preexisting particles rather than grown new particles.
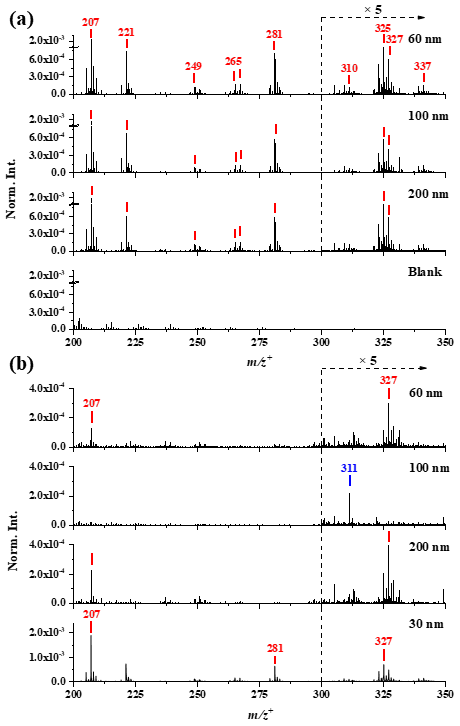
Figure 6ToF-SIMS spectral comparison of atmospheric nanometer particles collected on 30 June (a) and 1 July 2019 (b) in the positive ion mode ( 200–350).
For Category 2, more studies were available in the literature. For example, Kim et al. (2019) reported Nccn at 0.2×103 cm−3 at 0.4 % SS during the NPF events in the polar measurement and estimated the contribution of NPF to CCN to be 11 %. Hirshorn et al. (2022) observed a substantial increase in Nccn at 0.2 %–0.4 % SS during the NPF events relative to those during the non-NPF days in winter (36 %) and spring (54 %) at a mountaintop site in America, while there were no significant increases in summer and fall. In a forest study conducted by Sihto et al. (2011), the Nccn at 0.2 %–0.6 % SS on NPF events was lower than those on non-NPF days. However, the Nccn during NPF events exhibited 70 %–110 % increases at 0.1 %–1.0 % SS relative to those observed immediately before NPF events. Other studies have also reported an increase in Nccn during the NPF events relative to those values immediately observed before, but they did not report quantitative contributions (Creamean et al., 2011; Kawana et al., 2017; Pierce et al., 2012).
For Category 3, Rose et al. (2017) used 50 or 100 nm as lower limits for a critical diameter (Dc) to activate as CCN and reported enhancements ranging from 250 % to 100 % for CCN50 to CCN100 during NPF events compared to non-NPF days. The same method was employed by Laakso et al. (2013) in Savannah, where more than 40 % improvement for CCN60 was found during NPF events in the wet season but no significant improvement in the dry season. Kalkavouras et al. (2019) employed particles size distribution and chemical composition measurements to determine the Dc, and found Nccn improvements ranged from 29 % to 77 % at SS levels of 0.1 % to 1.0 %. In addition to the three studies, there are dozens of studies including our previous one conducted at Mount Tai (Zhu et al., 2021b), subject to Category 3. Due to a lack of direct measurements of Nccn, their uncertainties cannot be evaluated.
Overall, it appears that a big challenge still exists to reasonably deduct the perturbation from varying preexisting particles in calculating the net contribution of Nccn from grown new particles in the research community.
3.5 Hydrophilic organics dominated the new particle growth, but only NH4NO3 formation or hygroscopic organic condensation increased Nccn
Organic species have been widely reported to participate in nucleation and play a significant role in driving the growth of newly formed particles, particularly in forested areas (Makela et al., 2001; Ehn et al., 2007; Smith et al., 2008, 2010; Riipinen et al., 2009). In our study, at 1.0 % SS, the calculated κ values were consistently smaller than 0.13 during all NPF events, with a maximum κ value of 0.08 ± 0.02 from 12:00 on 1 July to 05:00 on 2 July (see Fig. 5c). These results strongly suggest that less hygroscopic organics with low volatility were dominant in the growth of newly formed particles to large sizes. However, the calculated κ values might suffer from the error to some extent on 1–2 July when newly grown particles can be activated as CCN at 1.0 % SS. In this case, the external mixing of grew new particles and preexisting particles cannot satisfy the assumption required by Eq. (1).
Sulfuric acid vapor has been widely acknowledged as a crucial factor in the growth of newly formed particles to the size required to become CCN (Birmili et al., 2003; Kulmala et al., 2004; Young et al., 2008; Boy et al., 2005; Kerminen et al., 2018; Chu et al., 2019; Cai et al., 2021). Bzdek et al. (2012) found that sulfate contributed 29 %–46 % of the total mass in the grown new particles during two campaigns conducted in Delaware, USA. If H2SO4 condensation had surpassed organic condensation in shaping preexisting particles and increasing their κ values on 1 and 6 July, its amount should have been sufficient to dominate newly formed particles. However, this scenario was practically impossible because the κ values at 1.0 % SS were much lower than those at 0.2 % SS. Nonetheless, κ values did increase during the NPF events on 1 and 6 July at 0.2 % SS and were significantly larger than those on other NPF days with p<0.05. Although secondary formation of H2SO4 and its ammoniated salts on preexisting particles can occur (Bzdek et al., 2012; Cai et al., 2021), the process was unlikely to be significant in growing newly formed particles based on the low κ values at SS=1.0 %. In fact, the concentrations of in TSP ranged from 0.9 to 4.9 µg m−3 and were not significantly increased on 1 and 6 July when compared with those on the other 6 NPF days (see Table 2). These complex results indicate the importance of accurately measuring in different-sized nanometer particles.
Table 2Concentrations of SOA tracers, OC, EC, and ions in TSP on NPF days.
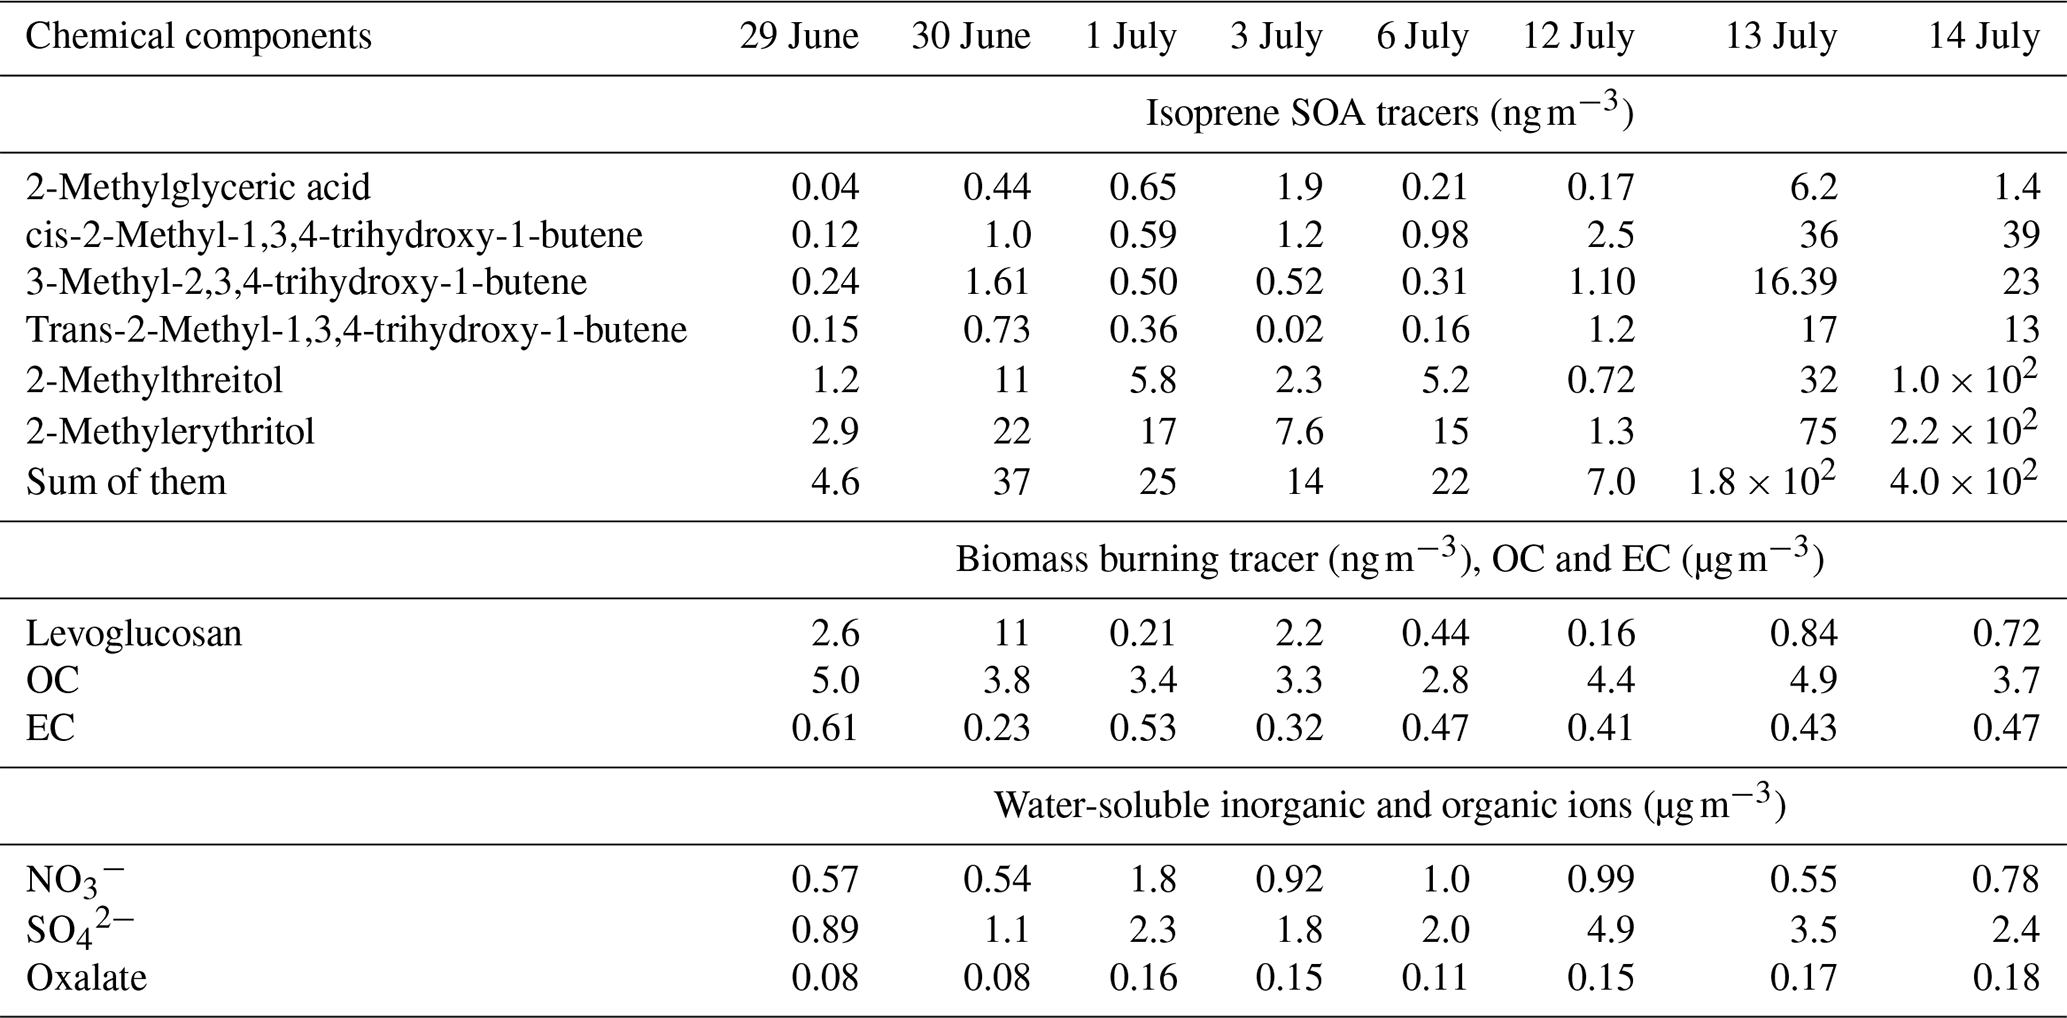
NH4NO3 formation on newly formed particles was unlikely to occur on those 2 d based on the calculated low κ values at 1.0 % SS. Theoretically, NH4NO3 formation requires the product of NH3 and HNO3 mixing ratios to be larger than its equilibrium constant plus the Kelvin effect term (Lee et al., 2019; Wang et al., 2020). However, on 1 and 6 July, NH4NO3 formation may have taken over low CCN-activated organic condensation on preexisting particles larger than 100 nm. For example, the concentrations of were 1.0 and 1.8 µg m−3 on 1 and 6 July, respectively, and these values were significantly higher than those on the other 6 NPF days (0.5–1.0 µg m−3) with p<0.05. Additionally, the SOC concentrations of 1.8–2.3 µg m−3 on 1 and 6 July were significantly lower than those of 2.7–4.0 µg m−3 on the other 6 d with p<0.05. The organic condensation on newly formed and preexisting particles was likely reduced, indirectly enhancing the NH4NO3 formation effects on increasing Nccn and κ values. However, the size-dependent chemical composition of atmospheric particles needs to be confirmed for further analysis.
We further examined four types of secondary organic tracers derived from isoprene, monoterpene, sesquiterpene, and aromatics as well as primary organic tracers including levoglucosan (LEVO), mannosan, and galactosan, between the two NPF periods (see Tables 2 and S1). However, there was no significant difference in the concentrations of any type of organic tracers between the two NPF periods. It is worth noting that oxalic acid and its salts had high κ values and could be important contributors to increasing κ values at various SSs on 1 and 6 July, particularly during the daytime. However, the measured concentrations of oxalate on those 2 d did not show a significant increase compared to the other days. In the literature (Rollins et al., 2012; Ehn et al., 2014), organonitrates were reported as an important secondary aerosol composition at nighttime. However, the species were not measured in this study. Thus, the influence of organonitrates on κ values of the observed atmospheric particles is unknown.
We examined the satellite-derived CDNC over the mountain area during and after the NPF days. The values were 169, 89, and 101 cm−3 on 1, 2, and 3 July, respectively (see Fig. 2d). These values were approximately 1 order of magnitude smaller than the observed Nccn at 0.2 % SS on those 3 d. The CDNC is a strong function of the actual SS present in the atmosphere in addition to Nccn and the actual SS is determined by the ascent velocity of the air mass, the amount of moisture, etc. (Pruppacher and Klett, 2012). This large difference between the observed Nccn and satellite-derived CDNC implies that the actual SS in the atmosphere might be substantially smaller than 0.2 %. In fact, Gao et al. (2021) recently conducted aircraft observations over Beijing and calculated the SS at cloud base to be approximately 0.048 %. Moreover, Shen et al. (2018) also reported the actual SS values varying from 0.01 % to 0.05 % during fog events observed in the NCP. Iwamoto et al. (2021) reported the mean SS around 0.34 % during cloud-shrouded periods at Mount Fuji in Japan. Notably, their observed SS decreased to 0.24 % when the air mass originated from continental sources. The higher SS observed at Mount Fuji might be related to substantially lower Nccn (around 108 cm−3 at 0.21 % SS) than those in Beijing. The reduced effect on SS levels with increasing Nccn was also obtained in Oklahoma (Jia et al., 2019), in which the estimated SS of stratocumulus and cumulus in relatively polluted atmospheres approximately equaled 0.2 %. However, the Nccn values in their relatively polluted atmospheres were smaller than half of the observed Nccn in this study. Thus, it is not surprising to find that only a small fraction of CCN could competitively capture water vapor to form cloud droplets during the study period (Shen et al., 2018; Jiang et al., 2021; Gong et al., 2023). Moreover, the CDNC during the period from 29 June to 14 July was 138 ± 99 cm−3 and close to the seasonal average in June and July. The satellite-derived CDNC on 2–3 July was even lower than the average, suggesting that the NPF event was unlikely to have any influence on CNDC at such low actual SS.
When the COT and CER were compared during NPF days and non-NPF days, the former COT values around 14.2 ± 5.9 had no significant difference from the latter values around 17.2 ± 11.8 with p=0.53. The same was true for the CER values, i.e., 13.2 ± 3.1 µm during NPF days versus 16.8 ± 4.0 µm during non-NPF days with p=0.067. Lack of significant differences on the two cloud parameters between NPF days and non-NPF days might be related to the small dataset.
3.6 Molecular evidence for organics dominating the new particle growth
Figures 6a and b and S10–S12 in the Supplement compare the static SIMS spectra of atmospheric nanometer particles collected on 30 June and 1 July. On 30 June, the collected particles with diameters of 60 nm (09:20–11:20), 100 nm (07:00–09:00), and 200 nm (13:30–15:30) likely represented the preexisting particles in the atmosphere, since the maximum median mode diameter of the grown new particles was only 19 ± 1 nm. In the lower mass range of 0–200, the fragments of organics suffered from strong interference from the substrate material (Fig. S10) and were not included in the analysis. The same was true on 1 July. However, the interference from the substrate in the mass range of 200–350 was negligible and was analyzed. Large differences in organic fragment peaks were observed in the mass region of 200–350 between nanometer particles collected on 30 June and 1 July (Fig. 6a and b). Organic peaks, such as 207.047 , 221.158 , 265.053 , 267.059 , 281.081 , 325.013 , and 327.018 , appeared on particle surfaces with sizes of 60, 100, and 200 nm on 30 June. These organic fragment peaks rarely appeared or had much lower intensities on particle surfaces with sizes of 60 nm (13:00–15:00), 100 nm (18:23–20:23), and 200 nm (06:10–08:10) on 1 July. However, the organic fragment peaks such as , , , and were detected with high intensities on the surface of 30 nm particles collected at 15:10–17:10 on 1 July. The collected particles with a diameter of 30 nm mainly consisted of grown new particles as shown in Fig. 5a. The results suggest that high molecular-weight organic vapors may preferentially condense on the nanometer particles. However, this was not the case for particles with sizes of 60, 100, and 200 nm on 1 July, when semi-volatile organic and inorganic vapors may have overwhelmingly condensed on the particle-sized surfaces and covered up the high-molecular-weight organic fragment signals.
The ToF-SIMS spectral comparisons in the negative ion mode (Figs. S11 and S12) yielded similar results, which support the conclusion that the high molecular-weight organic fragment signals were concealed on the surfaces of the sampled nanometer particles with diameters of 60, 100, and 200 nm on 1 July.
The selected spectral peak of SIMS data were also analyzed to identify variations among the samples using principal component analysis (PCA) (Fig. 7a–c). Score plots were generated to show the similarities and dissimilarities among the samples. The most important principal component (PC1) and the second important principal component (PC2) explained 84.5 % and 9.1 % of the data, respectively. The former separated the 30 nm particles collected on 1 July from the 100 and 200 nm particles collected on 30 June as well as from the 60 nm particles collected on 30 June and 1 July (Fig. 7a). This indicates that PC1 positive loadings shared commonalities for the 30 nm particles on 1 July and the 100 and 200 nm particles on 30 June. The organic fragment signals of the 30 nm particles collected on 1 July were significantly different from those of the larger particles on the same day. Some characteristic peaks were identified as components of organics, such as 73 C4H9O+, 131 C8H5NO+, 133 , 147 , 161 , 207 , 221 , and 281 (Fig. 7b), and they contributed to PC1 positive loadings. These findings support the conclusion that organic vapors drove the condensation growth of 30 nm particles on 30 June and the sized particles on 1 July. Additionally, the PCA results in the negative ion mode showed consistent results with those in positive ion mode (Fig. S13 in the Supplement).
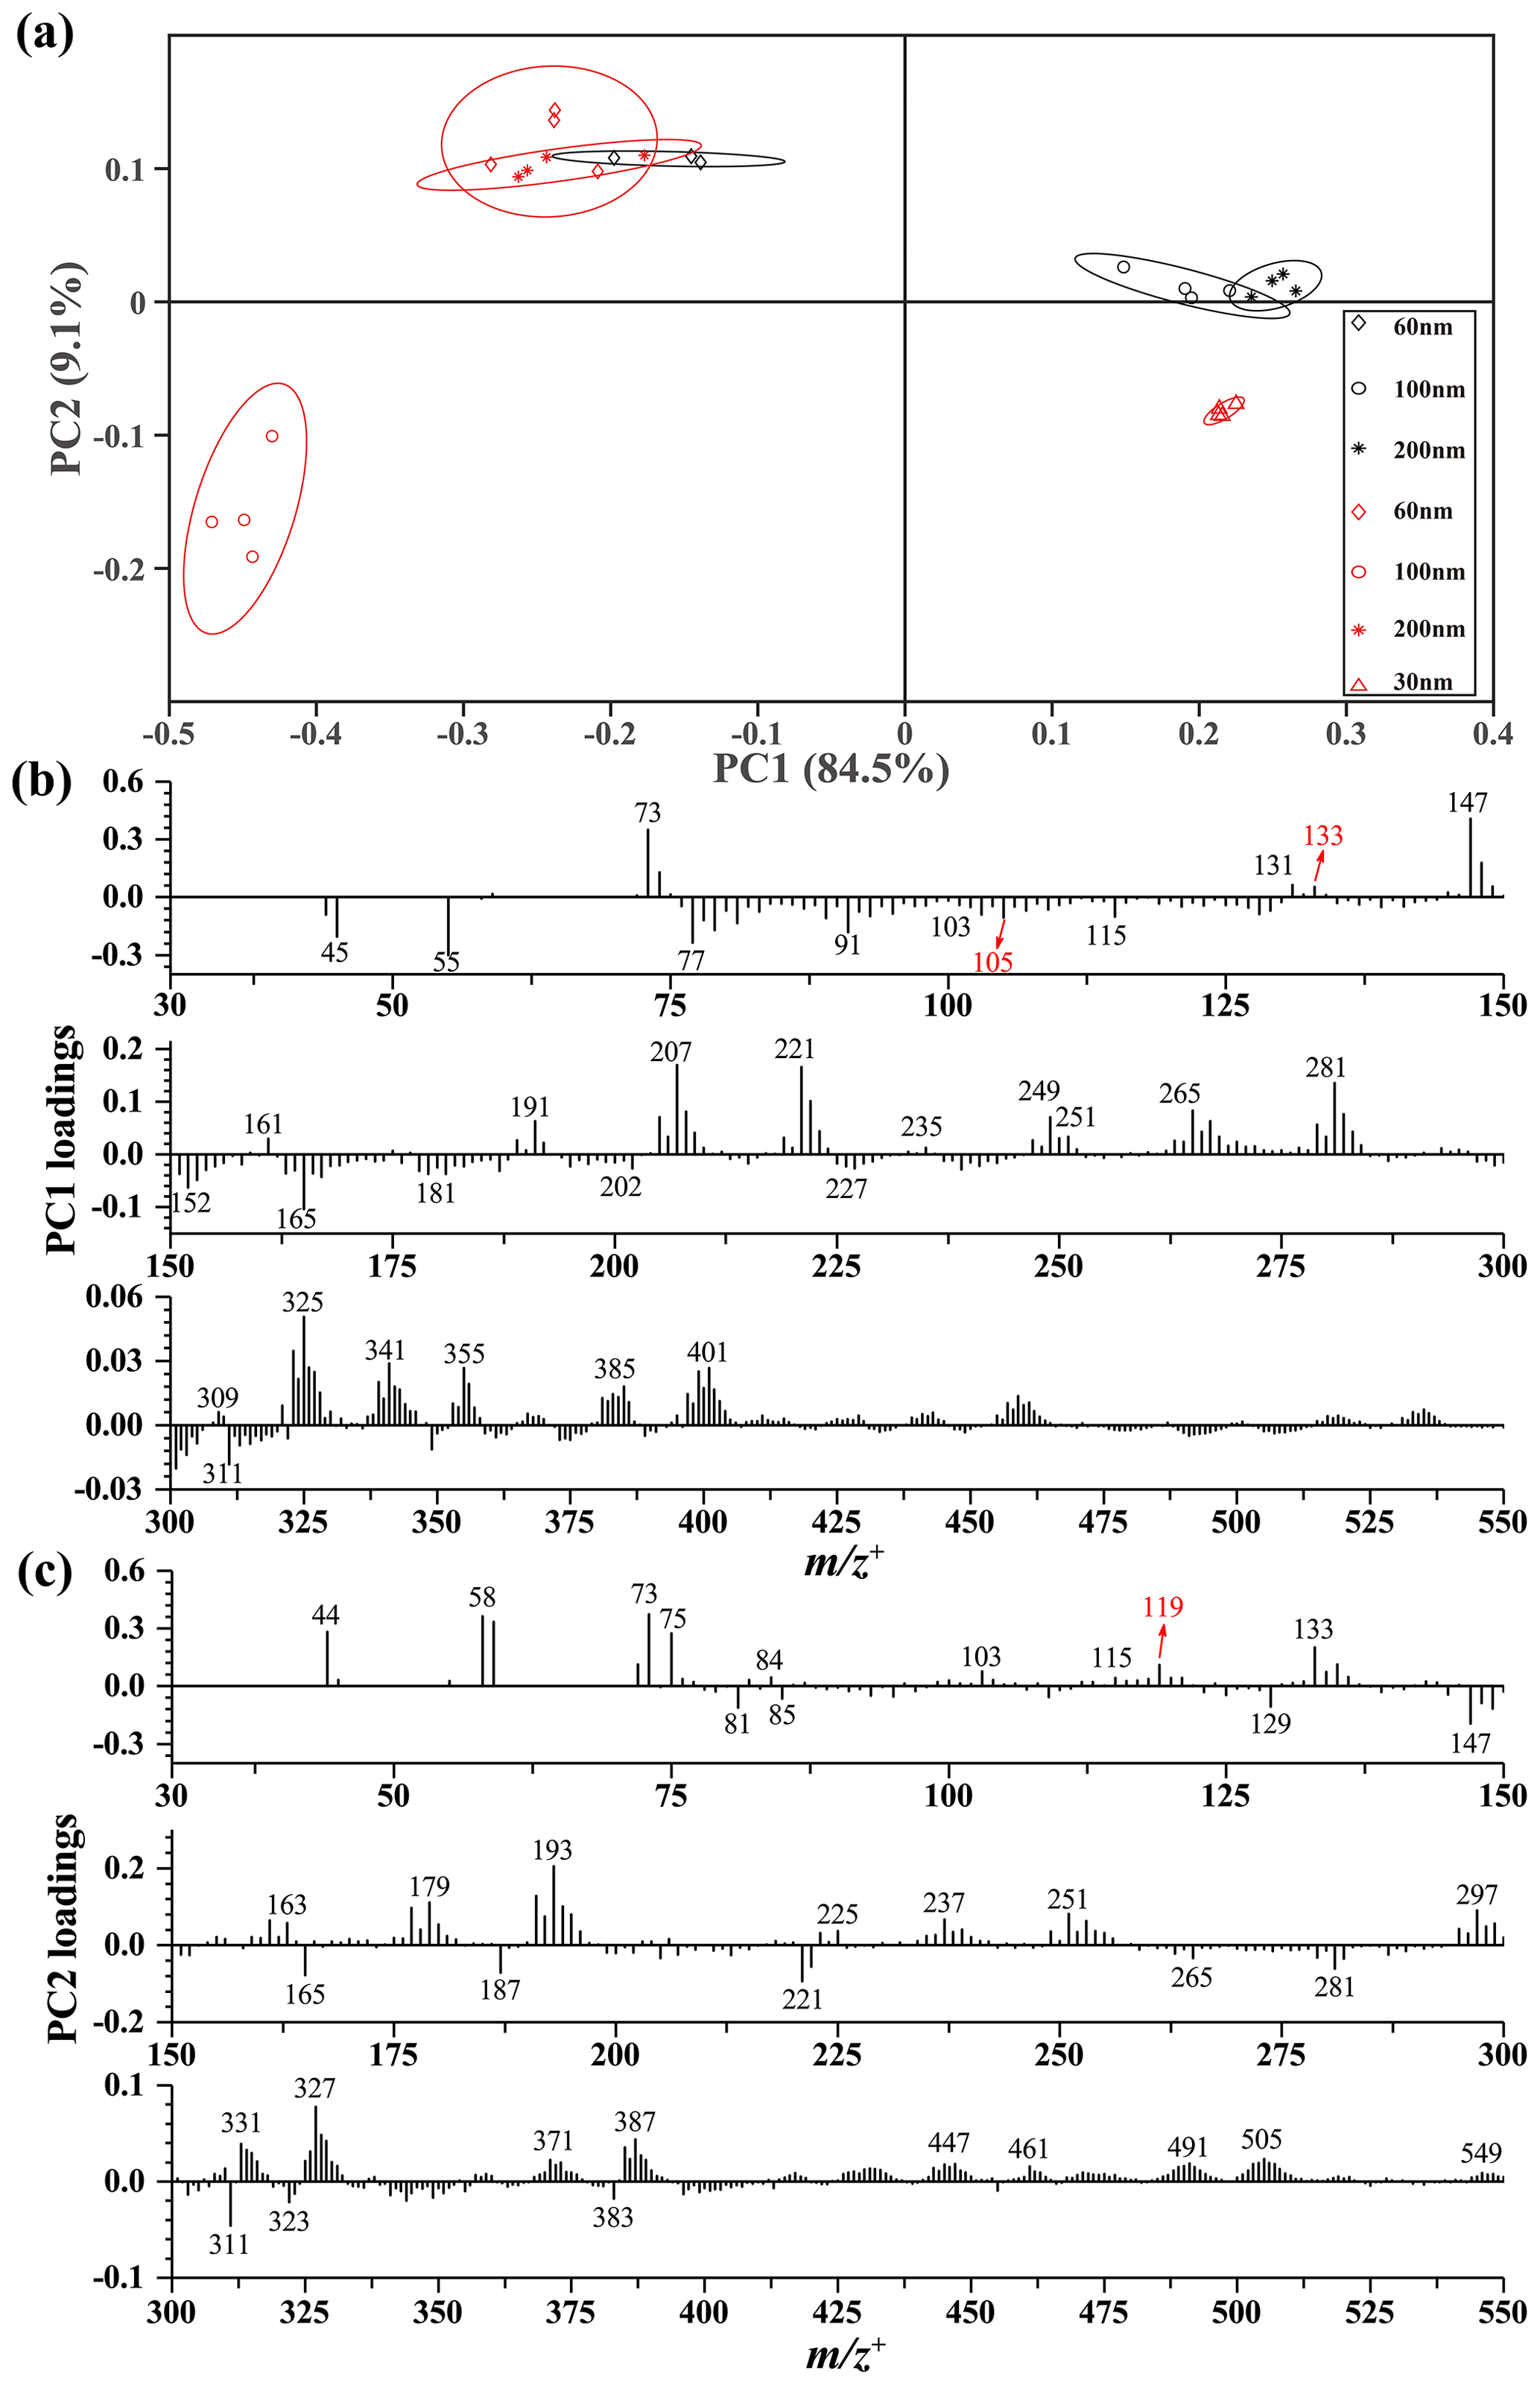
Figure 7ToF-SIMS-selected peak spectral PCA results of 60, 100, and 200 nm particles on 30 June (gray markers) as well as 30, 60, 100, and 200 nm particles on 1 July (red markers) in the positive mode: score plots of PC1 vs. PC2 (a), PC1 loading plots in 30–550 (b), and PC2 loading plots in 30–550 (c). Peaks are labeled in their center masses.
During the 2-week field campaign from 29 June to 14 July 2019 at a rural mountain site in NCP, we observed and analyzed eight NPF events. On these NPF days, the total Ncn was 8.4 ± 6.1×103 cm−3, which was substantially higher than the 4.7 ± 2.6×103 cm−3 observed on non-NPF days. However, the Nccn at 0.2 % SS and 0.4 % SS on NPF days was significantly lower than that on non-NPF days, with a p value less than 0.05. For instance, the Nccn at 0.2 % SS was 1.2 ± 0.7×103 cm−3 on NPF days versus 1.6 ± 0.8×103 cm−3 on non-NPF days. Although the observational data size in this study is small, the comparison suggests that NPF events may not statistically increase Nccn in the middle and low SS levels. In five of the eight NPF events, we observed either decreases or irregular changes in Nccn with decreasing κ values at various SSs. The decreasing κ values were likely attributed to the condensation of hydrophilic organics on newly formed particles and preexisting particles. Only in one of the eight NPF events did the grown new particles yield detectable net contributions to Nccn at 0.4 % SS and 1.0 % SS with larger sizes of grown new particles and increased κ values. The detectable net contributions accounted for 12 % ± 11 % at 0.4 % SS and 23 % ± 12 % of Nccn at 1.0 % SS during the latter growth period of the NPF event. The above-mentioned conclusions were also valid when the approximated on-site SSs at 0.18 %, 0.36 %, and 0.9 % were used.
During all eight NPF events, the estimated κ values at 1.0 % SS were below 0.13 (or 0.16 at 0.9 % SS), indicating that hydrophilic organics played a crucial role in the growth of newly formed particles. The estimated κ values at 0.2 % SS were generally smaller than 0.20 (or 0.25 at 0.18 % SS) and decreased during six of the eight NPF events. In these cases, less hygroscopic organic vapors likely condensed on preexisting particles, reducing their CCN activation. However, at two of the NPF events (1 and 6 July), the κ values at 0.2 % SS increased. The significantly higher concentrations of on those days suggested that NH4NO3 formation may have contributed to the increased κ values at 0.2 % SS. However, NH4NO3 formation on grown new particles was unlikely due to the Kelvin effect.
On 1 July, the SIMS results indicated that high molecular-weight organic vapors preferentially condensed on the 30 nm particles. In contrast, on >60 nm particle surfaces, inorganic vapors overwhelmingly condensed, concealing the high molecular-weight organic fragment signals. However, these signals were consistently detected on >60 nm particle surfaces on 30 June due to limited or no condensation of inorganic vapors.
The contribution of NPF events to Nccn needs to be re-evaluated by taking into account the condensation of organic vapors or the formation of NH4NO3 on preexisting particles. Moreover, the Nccn observed in the rural mountain atmosphere was considerably higher than the cloud droplet number concentrations derived from satellites. This suggests that the actual SS required to form cloud droplets in the NCP atmospheres may be substantially smaller than 0.2 %. Again, the grown new particles did not yield a detectable contribution to Nccn at 0.2 % SS during all eight NPF events. Thus, it is reasonably argued that the grown new particles might not act as Nccn and form cloud droplets in NCP atmospheres with actual SS largely smaller than 0.2 %.
The data of this paper are available upon contacting the authors, Xiaohong Yao (xhyao@ouc.edu.cn) and Xing Wei (17667565924@163.com). The MODIS level-3 daily averaged product (MYD08_D3) used in this paper are available from the Level-3 and Atmosphere Archive and Distribution System (LAADS) Distributed Active Archive Center (DAAC) of NASA (https://doi.org/10.5067/MODIS/MYD08_D3.061, NASA LAADS DAAC, 2022).
The supplement related to this article is available online at: https://doi.org/10.5194/acp-23-15325-2023-supplement.
XY designed the experiments. XYY supervised the SIMS analysis. XW and YS analyzed the data and wrote the paper. XY, XYY, HG, and YG provided advice on data processing. XY and XYY revised the original draft of the paper. All the authors contributed to editing and improving the paper.
The contact author has declared that none of the authors has any competing interests.
Publisher's note: Copernicus Publications remains neutral with regard to jurisdictional claims made in the text, published maps, institutional affiliations, or any other geographical representation in this paper. While Copernicus Publications makes every effort to include appropriate place names, the final responsibility lies with the authors.
This research was funded by the National Natural Science Foundation of China (grant no. 42276036) and Hainan Provincial Natural Science Foundation of China (grant no. 422MS098). The paper preparation for XYY was supported partially by the strategic Laboratory Directed Research and Development (LDRD) of the Physical Sciences Directorate of the Oak Ridge National Laboratory (ORNL).
The authors acknowledge the Beijing Forest Experimental Station of the Institute of Botany, Chinese Academy of Sciences, for the help with logistics and permission to access to the site. ChatGPT was used to polish the language paragraph by paragraph.
This paper has been authored by UT-Battelle, LLC, under contract no. DE-AC05-00OR22725 with the U.S. Department of Energy. The United States Government retains and the publisher, by accepting the article for publication, acknowledges that the United States Government retains a non-exclusive, paid-up, irrevocable, worldwide license to publish or reproduce the published form of this paper, or allow others to do so, for United States Government purposes. The Department of Energy will provide public access to these results of federally sponsored research in accordance with the DOE Public Access Plan (http://energy.gov/downloads/doe-public-access-plan, last access: 1 September 2023).
This research was supported by the National Natural Science Foundation of China (grant no. 42276036) and the Hainan Provincial Natural Science Foundation of China (grant no. 422MS098).
This paper was edited by Veli-Matti Kerminen and reviewed by two anonymous referees.
Ahangar, E. F., Pakbin, P., Hasheminassab, S., Epstein, S. A., Li, X., Polidori, A., and Low, J.: Long-term trends of PM2.5 and its carbon content in the south coast air basin: A focus on the impact of wildfires, Atmos. Environ., 255, 118431, https://doi.org/10.1016/j.atmosenv.2021.118431, 2021.
Ahmad, I., Mielonen, T., Grosvenor, D. P., Portin, H. J., Arola, A., Mikkonen, S., Kühn, T., Leskinen, A., Joutsensaari, J., Komppula, M., Lehtinen, K. E. J., Laaksonen, A., and Romakkaniemi, S.: Long-term measurements of cloud droplet concentrations and aerosol–cloud interactions in continental boundary layer clouds, Tellus B, 65, 20138, https://doi.org/10.3402/tellusb.v65i0.20138, 2013.
Albrecht, B. A.: Aerosols, cloud microphysics, and fractional cloudiness, Science, 245, 1227–1230, https://doi.org/10.1126/science.245.4923.1227, 1989.
Andreae, M. O. and Rosenfeld, D.: Aerosol–cloud–precipitation interactions. Part 1. The nature and sources of cloud-active aerosols, Earth-Sci. Rev., 89, 13–41, https://doi.org/10.1016/j.earscirev.2008.03.001, 2008.
Bauer, J. J., Yu, X.-Y., Carry, R., Laulalein, N., and Berkowitz, C.: Characterization of the Sunset semi-continuous carbon aerosol analyzers, J. Air. Waste. Manage., 59, 826–833, https://doi.org/10.3155/1047-3289.59.7.826, 2009.
Bennartz, R.: Global assessment of marine boundary layer cloud droplet number concentration from satellite, J. Geophys. Res., 112, D02201, https://doi.org/10.1029/2006jd007547, 2007.
Bennartz, R. and Rausch, J.: Global and regional estimates of warm cloud droplet number concentration based on 13 years of AQUA-MODIS observations, Atmos. Chem. Phys., 17, 9815–9836, https://doi.org/10.5194/acp-17-9815-2017, 2017.
Birmili, W., Berresheim, H., Plass-Dülmer, C., Elste, T., Gilge, S., Wiedensohler, A., and Uhrner, U.: The Hohenpeissenberg aerosol formation experiment (HAFEX): a long-term study including size-resolved aerosol, H2SO4, OH, and monoterpenes measurements, Atmos. Chem. Phys., 3, 361–376, https://doi.org/10.5194/acp-3-361-2003, 2003.
Boreddy, S. K. R. and Kawamura, K.: Investigation on the hygroscopicity of oxalic acid and atmospherically relevant oxalate salts under sub- and supersaturated conditions, Environ. Sci.-Proc. Imp., 20, 1069–1080, https://doi.org/10.1039/c8em00053k, 2018.
Bouzidi, H., Fayad, L., Coeur, C., Houzel, N., Petitprez, D., Faccinetto, A., Wu, J., Tomas, A., Ondracek, J., Schwarz, J., Zdimal, V., and Zuend, A.: Hygroscopic growth and CCN activity of secondary organic aerosol produced from dark ozonolysis of γ-terpinene, Sci. Total Environ., 817, 153010, https://doi.org/10.1016/j.scitotenv.2022.153010, 2022.
Boy, M., Kulmala, M., Ruuskanen, T. M., Pihlatie, M., Reissell, A., Aalto, P. P., Keronen, P., Dal Maso, M., Hellen, H., Hakola, H., Jansson, R., Hanke, M., and Arnold, F.: Sulphuric acid closure and contribution to nucleation mode particle growth, Atmos. Chem. Phys., 5, 863–878, https://doi.org/10.5194/acp-5-863-2005, 2005.
Bressi, M., Cavalli, F., Putaud, J. P., Fröhlich, R., Petit, J. E., Aas, W., Äijälä, M., Alastuey, A., Allan, J. D., Aurela, M., Berico, M., Bougiatioti, A., Bukowiecki, N., Canonaco, F., Crenn, V., Dusanter, S., Ehn, M., Elsasser, M., Flentje, H., Graf, P., Green, D. C., Heikkinen, L., Hermann, H., Holzinger, R., Hueglin, C., Keernik, H., Kiendler-Scharr, A., Kubelová, L., Lunder, C., Maasikmets, M., Makeš, O., Malaguti, A., Mihalopoulos, N., Nicolas, J. B., O'Dowd, C., Ovadnevaite, J., Petralia, E., Poulain, L., Priestman, M., Riffault, V., Ripoll, A., Schlag, P., Schwarz, J., Sciare, J., Slowik, J., Sosedova, Y., Stavroulas, I., Teinemaa, E., Via, M., Vodička, P., Williams, P. I., Wiedensohler, A., Young, D. E., Zhang, S., Favez, O., Minguillón, M. C., and Prevot, A. S. H.: A European aerosol phenomenology-7: High-time resolution chemical characteristics of submicron particulate matter across Europe, Atmos. Environ., 10, 100108, https://doi.org/10.1016/j.aeaoa.2021.100108, 2021.
Bulgin, C. E., Palmer, P. I., Thomas, G. E., Arnold, C. P. G., Campmany, E., Carboni, E., Grainger, R. G., Poulsen, C., Siddans, R., and Lawrence, B. N.: Regional and seasonal variations of the Twomey indirect effect as observed by the ATSR-2 satellite instrument, Geophys. Res. Lett., 35, L02811, https://doi.org/10.1029/2007gl031394, 2008.
Bzdek, B. R., Zordan, C. A., Pennington, M. R., Luther III, G. W., and Johnston, M. V.: Quantitative assessment of the sulfuric acid contribution to new particle growth, Environ. Sci. Technol., 46, 4365–4373, https://doi.org/10.1021/es204556c, 2012.
Cai, M., Tan, H., Chan, C. K., Mochida, M., Hatakeyama, S., Kondo, Y., Schurman, M. I., Xu, H., Li, F., Shimada, K., Li, L., Deng, Y., Yai, H., Matsuki, A., Qin, Y., and Zhao, J.: Comparison of aerosol hygroscopicity, volatility, and chemical composition between a suburban site in the pearl river delta region and a marine site in Okinawa, Aerosol Air Qual. Res., 17, 3194–3208, https://doi.org/10.4209/aaqr.2017.01.0020, 2017.
Cai, M., Liang, B., Sun, Q., Zhou, S., Yuan, B., Shao, M., Tan, H., Xu, Y., Ren, L., and Zhao, J.: Contribution of new particle formation to cloud condensation nuclei activity and its controlling factors in a mountain region of inland China, J. Geophys. Res.-Atmos., 126, e2020JD034302, https://doi.org/10.1029/2020jd034302, 2021.
Cao, Z., Zhou, X., Ma, Y., Wang, L., Wu, R., Chen, B., and Wang, W.: The concentrations, formations, relationships and modeling of sulfate, nitrate and ammonium (SNA) aerosols over China, Aerosol Air Qual. Res., 17, 84–97, https://doi.org/10.4209/aaqr.2016.01.0020, 2017.
Cerully, K. M., Raatikainen, T., Lance, S., Tkacik, D., Tiitta, P., Petäjä, T., Ehn, M., Kulmala, M., Worsnop, D. R., Laaksonen, A., Smith, J. N., and Nenes, A.: Aerosol hygroscopicity and CCN activation kinetics in a boreal forest environment during the 2007 EUCAARI campaign, Atmos. Chem. Phys., 11, 12369–12386, https://doi.org/10.5194/acp-11-12369-2011, 2011.
Chan, C. K. and Yao, X.: Air pollution in mega cities in China, Atmos. Environ., 42, 1–42, https://doi.org/10.1016/j.atmosenv.2007.09.003, 2008.
Chang, R. Y.-W., Abbatt, J. P. D., Boyer, M. C., Chaubey, J. P., and Collins, D. B.: Characterizing the hygroscopicity of growing particles in the Canadian Arctic summer, Atmos. Chem. Phys., 22, 8059–8071, https://doi.org/10.5194/acp-22-8059-2022, 2022.
Che, Y., Zhang, J., Fang, C., Zhou, X., Xue, W., Hu, X., Duan, J., Li, W., Gao, Y., Lu, G., Zhao, D., and Zhao, C.: Aerosol and cloud properties over a coastal area from aircraft observations in Zhejiang, China, Atmos. Environ., 267, 118771, https://doi.org/10.1016/j.atmosenv.2021.118771, 2021.
Chen, Y., Wang, X., Dai, W., Wang, Q., Guo, X., Liu, Y., Qi, W., Shen, M., Zhang, Y., Li, L., Cao, Y., Wang, Y., and Li, J.: Particle number size distribution of wintertime alpine aerosols and their activation as cloud condensation nuclei in the Guanzhong plain, Northwest China, J. Geophys. Res.-Atmos., 128, e2022JD037877, https://doi.org/10.1029/2022jd037877, 2023.
Cheng, W., Weng, L.-T., Li, Y., Lau, A., Chan, C., and Chan, C.-M.: Characterization of size-segregated aerosols using ToF-SIMS imaging and depth profiling, Surf. Interface Anal., 46, 480–488, https://doi.org/10.1002/sia.5552, 2014.
Cheung, H. C., Chou, C. C.-K., Lee, C. S. L., Kuo, W.-C., and Chang, S.-C.: Hygroscopic properties and cloud condensation nuclei activity of atmospheric aerosols under the influences of Asian continental outflow and new particle formation at a coastal site in eastern Asia, Atmos. Chem. Phys., 20, 5911–5922, https://doi.org/10.5194/acp-20-5911-2020, 2020.
Chu, B., Kerminen, V.-M., Bianchi, F., Yan, C., Petäjä, T., and Kulmala, M.: Atmospheric new particle formation in China, Atmos. Chem. Phys., 19, 115–138, https://doi.org/10.5194/acp-19-115-2019, 2019.
Chu, M., Wei, X., Hai, S., Gao, Y., Gao, H., Zhu, Y., Chu, B., Ma, N., Hong, J., Sun, Y., and Yao, X.: Investigating the contribution of grown new particles to cloud condensation nuclei with largely varying pre-existing particles – Part 2: Modeling chemical drivers and 3-D NPF occurrence, EGUsphere [preprint], https://doi.org/10.5194/egusphere-2023-540, 2023.
Creamean, J. M., Ault, A. P., Ten Hoeve, J. E., Jacobson, M. Z., Roberts, G. C., and Prather, K. A.: Measurements of aerosol chemistry during new particle formation events at a remote rural mountain site, Environ. Sci. Technol., 45, 8208–8216, https://doi.org/10.1021/es103692f, 2011.
Crippa, M., Canonaco, F., Lanz, V. A., Äijälä, M., Allan, J. D., Carbone, S., Capes, G., Ceburnis, D., Dall'Osto, M., Day, D. A., DeCarlo, P. F., Ehn, M., Eriksson, A., Freney, E., Hildebrandt Ruiz, L., Hillamo, R., Jimenez, J. L., Junninen, H., Kiendler-Scharr, A., Kortelainen, A.-M., Kulmala, M., Laaksonen, A., Mensah, A. A., Mohr, C., Nemitz, E., O'Dowd, C., Ovadnevaite, J., Pandis, S. N., Petäjä, T., Poulain, L., Saarikoski, S., Sellegri, K., Swietlicki, E., Tiitta, P., Worsnop, D. R., Baltensperger, U., and Prévôt, A. S. H.: Organic aerosol components derived from 25 AMS data sets across Europe using a consistent ME-2 based source apportionment approach, Atmos. Chem. Phys., 14, 6159–6176, https://doi.org/10.5194/acp-14-6159-2014, 2014.
Crumeyrolle, S., Mensah, A., Khlystov, A., Kos, G., and ten Brink, H.: On the importance of nitrate for the droplet concentration in stratocumulus in the North-Sea region, Atmos. Environ., 252, 118278, https://doi.org/10.1016/j.atmosenv.2021.118278, 2021.
Dal Maso, M., Kulmala, M., Riipinen, I., Wagner, R., Hussein, T., Aalto, P., and Lehtinen, K. E. J.: Formation and growth of fresh atmospheric aerosols: Eight years of aerosol size distribution data from SMEAR II, Hyytiälä, Finland, Boreal Environ. Res., 10, 323–336, 2005.
Deng, Y., Kagami, S., Ogawa, S., Kawana, K., Nakayama, T., Kubodera, R., Adachi, K., Hussein, T., Miyazaki, Y., and Mochida, M.: Hygroscopicity of organic aerosols and their contributions to CCN concentrations over a midlatitude forest in Japan, J. Geophys. Res.-Atmos., 123, 9703–9723, https://doi.org/10.1029/2017jd027292, 2018.
Ding, Y., Zhou, Y., Yao, J., Szymanski, C., Fredrickson, J., Shi, L., Cao, B., Zhu, Z., and Yu, X. Y.: In situ molecular imaging of the biofilm and its matrix, Anal. Chem., 88, 11244–11252, https://doi.org/10.1021/acs.analchem.6b03909, 2016.
Ding, Y., Zhou, Y., Yao, J., Xiong, Y., Zhu, Z., and Yu, X. Y.: Molecular evidence of a toxic effect on a biofilm and its matrix, Analyst, 144, 2498–2503, https://doi.org/10.1039/c8an02512f, 2019.
Drugé, T., Nabat, P., Mallet, M., and Somot, S.: Model simulation of ammonium and nitrate aerosols distribution in the Euro-Mediterranean region and their radiative and climatic effects over 1979–2016, Atmos. Chem. Phys., 19, 3707–3731, https://doi.org/10.5194/acp-19-3707-2019, 2019.
Dusek, U., Frank, G. P., Hildebrandt, L., Curtius, J., Schneider, J., Walter, S., Chand, D., Drewnick, F., Hings, S., Jung, D., Borrmann, S., and Andreae, M. O.: Size matters more than chemistry for cloud-nucleating ability of aerosol particles, Science, 312, 1375–1378, https://doi.org/10.1126/science.1125261, 2006.
Dusek, U., Frank, G. P., Curtius, J., Drewnick, F., Schneider, J., Kürten, A., Rose, D., Andreae, M. O., Borrmann, S., and Pöschl, U.: Enhanced organic mass fraction and decreased hygroscopicity of cloud condensation nuclei (CCN) during new particle formation events, Geophys. Res. Lett., 37, L03804, https://doi.org/10.1029/2009gl040930, 2010.
Ehn, M., Petäjä, T., Birmili, W., Junninen, H., Aalto, P., and Kulmala, M.: Non-volatile residuals of newly formed atmospheric particles in the boreal forest, Atmos. Chem. Phys., 7, 677–684, https://doi.org/10.5194/acp-7-677-2007, 2007.
Ehn, M., Thornton, J. A., Kleist, E., Sipila, M., Junninen, H., Pullinen, I., Springer, M., Rubach, F., Tillmann, R., Lee, B., Lopez-Hilfiker, F., Andres, S., Acir, I. H., Rissanen, M., Jokinen, T., Schobesberger, S., Kangasluoma, J., Kontkanen, J., Nieminen, T., Kurten, T., Nielsen, L. B., Jorgensen, S., Kjaergaard, H. G., Canagaratna, M., Maso, M. D., Berndt, T., Petaja, T., Wahner, A., Kerminen, V. M., Kulmala, M., Worsnop, D. R., Wildt, J., and Mentel, T. F.: A large source of low-volatility secondary organic aerosol, Nature, 506, 476–479, https://doi.org/10.1038/nature13032, 2014.
Fang, X., Hu, M., Shang, D., Tan, T., Zhao, G., Zong, T., Tang, L., Ma, X., Yang, X., Dong, H., Yu, X., Chen, S., Li, X., Liu, Y., Wang, H., Gao, Y., Lou, S., Zhao, C., Zeng, L., Lu, K., Zhang, Y., Wu, Z., and Guo, S.: New particle formation and its CCN enhancement in the Yangtze River Delta under the control of continental and marine air masses, Atmos. Environ., 254, 118400, https://doi.org/10.1016/j.atmosenv.2021.118400, 2021.
Feng, J., Li, M., Zhang, P., Gong, S., Zhong, M., Wu, M., Zheng, M., Chen, C., Wang, H., and Lou, S.: Investigation of the sources and seasonal variations of secondary organic aerosols in PM2.5 in Shanghai with organic tracers, Atmos. Environ., 79, 614–622, https://doi.org/10.1016/j.atmosenv.2013.07.022, 2013.
Fiedler, V., Dal Maso, M., Boy, M., Aufmhoff, H., Hoffmann, J., Schuck, T., Birmili, W., Hanke, M., Uecker, J., Arnold, F., and Kulmala, M.: The contribution of sulphuric acid to atmospheric particle formation and growth: a comparison between boundary layers in Northern and Central Europe, Atmos. Chem. Phys., 5, 1773–1785, https://doi.org/10.5194/acp-5-1773-2005, 2005.
Fu, Y., Zhang, Y., Zhang, F., Chen, J., Zhu, Z., and Yu, X.-Y.: Does interfacial photochemistry play a role in the photolysis of pyruvic acid in water?, Atmos. Environ., 191, 36–45, https://doi.org/10.1016/j.atmosenv.2018.07.061, 2018.
Gao, Q., Liu, Q., Bi, K., Wang, F., Sheng, J., He, H., and Liu, X.: Estimation of aerosol activation ratio and water vapor supersaturation at cloud base using aircraft measurement, J. Appl. Meteor. Sci., 32, 653–664, https://doi.org/10.11898/1001-7313.20210602, 2021.
Gao, Y., Zhang, D., Wang, J., Gao, H., and Yao, X.: Variations in Ncn and Nccn over marginal seas in China related to marine traffic emissions, new particle formation and aerosol aging, Atmos. Chem. Phys., 20, 9665–9677, https://doi.org/10.5194/acp-20-9665-2020, 2020.
Ge, X., He, Y., Sun, Y., Xu, J., Wang, J., Shen, Y., and Chen, M.: Characteristics and formation mechanisms of fine particulate nitrate in typical urban areas in China, Atmosphere-Basel, 8, 62, https://doi.org/10.3390/atmos8030062, 2017.
Gong, J., Zhu, Y., Chen, D., Gao, H., Shen, Y., Gao, Y., and Yao, X.: The occurrence of lower-than-expected bulk Nccn values over the marginal seas of China-implications for competitive activation of marine aerosols, Sci. Total Environ., 858, 159938, https://doi.org/10.1016/j.scitotenv.2022.159938, 2023.
Gong, X., Wex, H., Müller, T., Henning, S., Voigtländer, J., Wiedensohler, A., and Stratmann, F.: Understanding aerosol microphysical properties from 10 years of data collected at Cabo Verde based on an unsupervised machine learning classification, Atmos. Chem. Phys., 22, 5175–5194, https://doi.org/10.5194/acp-22-5175-2022, 2022.
Gordon, H., Kirkby, J., Baltensperger, U., Bianchi, F., Breitenlechner, M., Curtius, J., Dias, A., Dommen, J., Donahue, N. M., Dunne, E. M., Duplissy, J., Ehrhart, S., Flagan, R. C., Frege, C., Fuchs, C., Hansel, A., Hoyle, C. R., Kulmala, M., Kürten, A., Lehtipalo, K., Makhmutov, V., Molteni, U., Rissanen, M. P., Stozkhov, Y., Tröstl, J., Tsagkogeorgas, G., Wagner, R., Williamson, C., Wimmer, D., Winkler, P. M., Yan, C., and Carslaw, K. S.: Causes and importance of new particle formation in the present-day and preindustrial atmospheres, J. Geophys. Res.-Atmos., 122, 8739–8760, https://doi.org/10.1002/2017jd026844, 2017.
Grosvenor, D. P., Sourdeval, O., Zuidema, P., Ackerman, A., Alexandrov, M. D., Bennartz, R., Boers, R., Cairns, B., Chiu, J. C., Christensen, M., Deneke, H., Diamond, M., Feingold, G., Fridlind, A., Hunerbein, A., Knist, C., Kollias, P., Marshak, A., McCoy, D., Merk, D., Painemal, D., Rausch, J., Rosenfeld, D., Russchenberg, H., Seifert, P., Sinclair, K., Stier, P., van Diedenhoven, B., Wendisch, M., Werner, F., Wood, R., Zhang, Z., and Quaas, J.: Remote sensing of droplet number concentration in warm clouds: A review of the current state of knowledge and perspectives, Rev. Geophys., 56, 409–453, https://doi.org/10.1029/2017RG000593, 2018.
Gunthe, S. S., King, S. M., Rose, D., Chen, Q., Roldin, P., Farmer, D. K., Jimenez, J. L., Artaxo, P., Andreae, M. O., Martin, S. T., and Pöschl, U.: Cloud condensation nuclei in pristine tropical rainforest air of Amazonia: size-resolved measurements and modeling of atmospheric aerosol composition and CCN activity, Atmos. Chem. Phys., 9, 7551–7575, https://doi.org/10.5194/acp-9-7551-2009, 2009.
Hammer, E., Bukowiecki, N., Gysel, M., Jurányi, Z., Hoyle, C. R., Vogt, R., Baltensperger, U., and Weingartner, E.: Investigation of the effective peak supersaturation for liquid-phase clouds at the high-alpine site Jungfraujoch, Switzerland (3580 m a.s.l.), Atmos. Chem. Phys., 14, 1123–1139, https://doi.org/10.5194/acp-14-1123-2014, 2014.
Han, Y., Iwamoto, Y., Nakayama, T., Kawamura, K., Hussein, T., and Mochida, M.: Observation of new particle formation over a mid-latitude forest facing the north Pacific, Atmos. Environ., 64, 77–84, https://doi.org/10.1016/j.atmosenv.2012.09.036, 2013.
Hirshorn, N. S., Zuromski, L. M., Rapp, C., McCubbin, I., Carrillo-Cardenas, G., Yu, F., and Hallar, A. G.: Seasonal significance of new particle formation impacts on cloud condensation nuclei at a mountaintop location, Atmos. Chem. Phys., 22, 15909–15924, https://doi.org/10.5194/acp-22-15909-2022, 2022.
Hu, Q., Li, K., Zhu, Y., Yu, P., Gao, H., and Yao, X.: Concentration, size distribution, and formation of trimethylaminium and dimethylaminium ions in atmospheric particles over marginal seas of China, J. Atmos. Sci., 72, 3487–3498, https://doi.org/10.1175/jas-d-14-0393.1, 2015.
Hudson, J. G., Noble, S., and Tabor, S.: Cloud supersaturations from CCN spectra hoppel minima, J. Geophys. Res.-Atmos., 120, 3436–3452, https://doi.org/10.1002/2014jd022669, 2015.
Hung, H.-M., Lu, W.-J., Chen, W.-N., Chang, C.-C., Chou, C. C. K., and Lin, P.-H.: Enhancement of the hygroscopicity parameter kappa of rural aerosols in Northern Taiwan by anthropogenic emissions, Atmos. Environ., 84, 78–87, https://doi.org/10.1016/j.atmosenv.2013.11.032, 2014.
IPCC: Climate Change 2021: The Physical science basis, in: Contribution of working group I to the sixth assessment report of the intergovernmental panel on climate change, edited by: Masson-Delmotte, V., Zhai, P., Pirani, A., Connors, S. L., Péan, C., Berger, S., Caud, N., Chen, Y., Goldfarb, L., Gomis, M. I., Huang, M., Leitzell, K., Lonnoy, E., Matthews, J. B. R., Maycock, T. K., Waterfield, T., Yelekçi, O., Yu, R., and Zhou, B., Cambridge University Press, Cambridge, United Kingdom and New York, NY, USA, in press, https://doi.org/10.1017/9781009157896, 2021.
Iwamoto, Y., Watanabe, A., Kataoka, R., Uematsu, M., and Miura, K.: Aerosol–cloud interaction at the summit of Mt. Fuji, Japan: Factors influencing cloud droplet number concentrations, Appl. Sci.-Basel, 11, 8439, https://doi.org/10.3390/app11188439, 2021.
Jia, H., Ma, X., Yu, F., Liu, Y., and Yin, Y.: Distinct impacts of increased aerosols on cloud droplet number concentration of stratus/stratocumulus and cumulus, Geophys. Res. Lett., 46, 13517–13525, https://doi.org/10.1029/2019gl085081, 2019.
Jiang, S., Zhang, F., Ren, J., Chen, L., Yan, X., Liu, J., Sun, Y., and Li, Z.: Evaluation of the contribution of new particle formation to cloud droplet number concentration in the urban atmosphere, Atmos. Chem. Phys., 21, 14293–14308, https://doi.org/10.5194/acp-21-14293-2021, 2021.
Jones, A. C., Hill, A., Remy, S., Abraham, N. L., Dalvi, M., Hardacre, C., Hewitt, A. J., Johnson, B., Mulcahy, J. P., and Turnock, S. T.: Exploring the sensitivity of atmospheric nitrate concentrations to nitric acid uptake rate using the Met Office's Unified Model, Atmos. Chem. Phys., 21, 15901–15927, https://doi.org/10.5194/acp-21-15901-2021, 2021.
Kalivitis, N., Kerminen, V.-M., Kouvarakis, G., Stavroulas, I., Bougiatioti, A., Nenes, A., Manninen, H. E., Petäjä, T., Kulmala, M., and Mihalopoulos, N.: Atmospheric new particle formation as a source of CCN in the eastern Mediterranean marine boundary layer, Atmos. Chem. Phys., 15, 9203–9215, https://doi.org/10.5194/acp-15-9203-2015, 2015.
Kalkavouras, P., Bougiatioti, A., Kalivitis, N., Stavroulas, I., Tombrou, M., Nenes, A., and Mihalopoulos, N.: Regional new particle formation as modulators of cloud condensation nuclei and cloud droplet number in the eastern Mediterranean, Atmos. Chem. Phys., 19, 6185–6203, https://doi.org/10.5194/acp-19-6185-2019, 2019.
Kawana, K., Nakayama, T., Kuba, N., and Mochida, M.: Hygroscopicity and cloud condensation nucleus activity of forest aerosol particles during summer in Wakayama, Japan, J. Geophys. Res.-Atmos., 122, 3042–3064, https://doi.org/10.1002/2016jd025660, 2017.
Kerminen, V.-M., Paramonov, M., Anttila, T., Riipinen, I., Fountoukis, C., Korhonen, H., Asmi, E., Laakso, L., Lihavainen, H., Swietlicki, E., Svenningsson, B., Asmi, A., Pandis, S. N., Kulmala, M., and Petäjä, T.: Cloud condensation nuclei production associated with atmospheric nucleation: a synthesis based on existing literature and new results, Atmos. Chem. Phys., 12, 12037–12059, https://doi.org/10.5194/acp-12-12037-2012, 2012.
Kerminen, V. M., Chen, X., Vakkari, V., Petäjä, T., Kulmala, M., and Bianchi, F.: Atmospheric new particle formation and growth: Review of field observations, Environ. Res. Lett., 13, 103003, https://doi.org/10.1088/1748-9326/aadf3c, 2018.
Kim, J., Yoon, Y. J., Gim, Y., Choi, J. H., Kang, H. J., Park, K.-T., Park, J., and Lee, B. Y.: New particle formation events observed at King Sejong Station, Antarctic Peninsula – Part 1: Physical characteristics and contribution to cloud condensation nuclei, Atmos. Chem. Phys., 19, 7583–7594, https://doi.org/10.5194/acp-19-7583-2019, 2019.
Kleindienst, T. E., Jaoui, M., Lewandowski, M., Offenberg, J. H., Lewis, C. W., Bhave, P. V., and Edney, E. O.: Estimates of the contributions of biogenic and anthropogenic hydrocarbons to secondary organic aerosol at a Southeastern US location, Atmos. Environ., 41, 8288–8300, https://doi.org/10.1016/j.atmosenv.2007.06.045, 2007.
Kuang, C., McMurry, P. H., and McCormick, A. V.: Determination of cloud condensation nuclei production from measured new particle formation events, Geophys. Res. Lett., 36, L09822, https://doi.org/10.1029/2009gl037584, 2009.
Kulmala, M., Vehkamäki, H., Petäjä, T., Dal Maso, M., Lauri, A., Kerminen, V. M., Birmili, W., and McMurry, P. H.: Formation and growth rates of ultrafine atmospheric particles: A review of observations, J. Aerosol Sci., 35, 143–176, https://doi.org/10.1016/j.jaerosci.2003.10.003, 2004.
Kulmala, M., Petaja, T., Nieminen, T., Sipila, M., Manninen, H. E., Lehtipalo, K., Dal Maso, M., Aalto, P. P., Junninen, H., Paasonen, P., Riipinen, I., Lehtinen, K. E., Laaksonen, A., and Kerminen, V. M.: Measurement of the nucleation of atmospheric aerosol particles, Nat. Protoc., 7, 1651–1667, https://doi.org/10.1038/nprot.2012.091, 2012.
Kuwata, M., Kondo, Y., Miyazaki, Y., Komazaki, Y., Kim, J. H., Yum, S. S., Tanimoto, H., and Matsueda, H.: Cloud condensation nuclei activity at Jeju Island, Korea in spring 2005, Atmos. Chem. Phys., 8, 2933–2948, https://doi.org/10.5194/acp-8-2933-2008, 2008.
Laakso, L., Merikanto, J., Vakkari, V., Laakso, H., Kulmala, M., Molefe, M., Kgabi, N., Mabaso, D., Carslaw, K. S., Spracklen, D. V., Lee, L. A., Reddington, C. L., and Kerminen, V.-M.: Boundary layer nucleation as a source of new CCN in savannah environment, Atmos. Chem. Phys., 13, 1957–1972, https://doi.org/10.5194/acp-13-1957-2013, 2013.
Lance, S., Nenes, A., Medina, J., and Smith, J. N.: Mapping the operation of the DMT continuous flow CCN counter, Aerosol Sci. Tech., 40, 242–254, https://doi.org/10.1080/02786820500543290, 2006.
Lathem, T. L. and Nenes, A.: Water vapor depletion in the DMT continuous-flow CCN chamber: Effects on supersaturation and droplet growth, Aerosol Sci. Tech., 45, 604–615, https://doi.org/10.1080/02786826.2010.551146, 2011.
Lee, S. H., Gordon, H., Yu, H., Lehtipalo, K., Haley, R., Li, Y., and Zhang, R.: New particle formation in the atmosphere: From molecular clusters to global climate, J. Geophys. Res.-Atmos., 124, 7098–7146, https://doi.org/10.1029/2018jd029356, 2019.
Leng, C., Zhang, Q., Tao, J., Zhang, H., Zhang, D., Xu, C., Li, X., Kong, L., Cheng, T., Zhang, R., Yang, X., Chen, J., Qiao, L., Lou, S., Wang, H., and Chen, C.: Impacts of new particle formation on aerosol cloud condensation nuclei (CCN) activity in Shanghai: case study, Atmos. Chem. Phys., 14, 11353–11365, https://doi.org/10.5194/acp-14-11353-2014, 2014.
Levin, E. J. T., Prenni, A. J., Palm, B. B., Day, D. A., Campuzano-Jost, P., Winkler, P. M., Kreidenweis, S. M., DeMott, P. J., Jimenez, J. L., and Smith, J. N.: Size-resolved aerosol composition and its link to hygroscopicity at a forested site in Colorado, Atmos. Chem. Phys., 14, 2657–2667, https://doi.org/10.5194/acp-14-2657-2014, 2014.
Li, J., Wang, X., Chen, J., Zhu, C., Li, W., Li, C., Liu, L., Xu, C., Wen, L., Xue, L., Wang, W., Ding, A., and Herrmann, H.: Chemical composition and droplet size distribution of cloud at the summit of Mount Tai, China, Atmos. Chem. Phys., 17, 9885–9896, https://doi.org/10.5194/acp-17-9885-2017, 2017.
Li, J., Jian, B., Huang, J., Hu, Y., Zhao, C., Kawamoto, K., Liao, S., and Wu, M.: Long-term variation of cloud droplet number concentrations from space-based Lidar, Remote Sens. Environ., 213, 144–161, https://doi.org/10.1016/j.rse.2018.05.011, 2018.
Li, J., Li, P., Ren, G., Yuan, L., Li, Y., and Yang, J.: Aircraft measurements of aerosol distribution, warm cloud microphysical properties, and their relationship over the Eastern Loess Plateau in China, Tellus B, 71, 166394, https://doi.org/10.1080/16000889.2019.1663994, 2019.
Li, K., Zhu, Y., Gao, H., and Yao, X.: A comparative study of cloud condensation nuclei measured between non-heating and heating periods at a suburb site of Qingdao in the north China, Atmos. Environ., 112, 40–53, https://doi.org/10.1016/j.atmosenv.2015.04.024, 2015.
Li, Y., Zhang, F., Li, Z., Sun, L., Wang, Z., Li, P., Sun, Y., Ren, J., Wang, Y., Cribb, M., and Yuan, C.: Influences of aerosol physiochemical properties and new particle formation on CCN activity from observation at a suburban site of China, Atmos. Res., 188, 80–89, https://doi.org/10.1016/j.atmosres.2017.01.009, 2017.
Lin, T., Shu, Z., Wu, H., Tao, T., Cao, N., Zhu, H., Liu, C., Mu, J., and Tian, L.: Variation characteristics and source analysis of cloud condensation nuclei at the ridge of Liupan mountain located in Western China, Atmosphere-Basel, 13, 1483, https://doi.org/10.3390/atmos13091483, 2022.
Liu, A., Wang, H., Li, Y., Yin, Y., Li, B., Chen, K., Cui, Y., He, C., and Dai, M.: Distribution characteristics of aerosol size and CCN during the summer on Mt. Tian and their influencing factors, Atmosphere-Basel, 11, 912, https://doi.org/10.3390/atmos11090912, 2020.
Ma, L., Zhu, Y., Zheng, M., Sun, Y., Huang, L., Liu, X., Gao, Y., Shen, Y., Gao, H., and Yao, X.: Investigating three patterns of new particles growing to the size of cloud condensation nuclei in Beijing's urban atmosphere, Atmos. Chem. Phys., 21, 183–200, https://doi.org/10.5194/acp-21-183-2021, 2021.
Ma, N., Zhao, C., Tao, J., Wu, Z., Kecorius, S., Wang, Z., Größ, J., Liu, H., Bian, Y., Kuang, Y., Teich, M., Spindler, G., Müller, K., van Pinxteren, D., Herrmann, H., Hu, M., and Wiedensohler, A.: Variation of CCN activity during new particle formation events in the North China Plain, Atmos. Chem. Phys., 16, 8593–8607, https://doi.org/10.5194/acp-16-8593-2016, 2016.
Makela, J. M., Yli-Koivisto, S., Hiltunen, V., Seidl, W., Swietlicki, E., Teinila, K., Sillanpaa, M., Koponen, I. K., Paatero, J., Rosman, K., and Hameri, K.: Chemical composition of aerosol during particle formation events in boreal forest, Tellus B, 53, 380–393, https://doi.org/10.1034/j.1600-0889.2001.530405.x, 2001.
Man, H., Zhu, Y., Ji, F., Yao, X., Lau, N. T., Li, Y., Lee, B. P., and Chan, C. K.: Comparison of daytime and nighttime new particle growth at the HKUST supersite in Hong Kong, Environ. Sci. Technol., 49, 7170–7178, https://doi.org/10.1021/acs.est.5b02143, 2015.
Miao, Q., Zhang, Z., Li, Y., Qin, X., Xu, B., Yuan, Y., and Gao, Z.: Measurement of cloud condensation nuclei (CCN) and CCN closure at Mt. Huang based on hygroscopic growth factors and aerosol number-size distribution, Atmos. Environ., 113, 127–134, https://doi.org/10.1016/j.atmosenv.2015.05.006, 2015.
NASA LAADS DAAC: MODIS Level-3 Daily Averaged Product (MYD08_D3), Earth Data [data set], https://doi.org/10.5067/MODIS/MYD08_D3.061, 2022.
Park, K. T., Yoon, Y. J., Lee, K., Tunved, P., Krejci, R., Ström, J., Jang, E., Kang, H. J., Jang, S., Park, J., Lee, B. Y., Traversi, R., Becagli, S., and Hermansen, O.: Dimethyl sulfide-induced increase in cloud condensation nuclei in the Arctic atmosphere, Global Biogeochem. Cy., 35, e2021GB006969, https://doi.org/10.1029/2021gb006969, 2021.
Petters, M. D. and Kreidenweis, S. M.: A single parameter representation of hygroscopic growth and cloud condensation nucleus activity, Atmos. Chem. Phys., 7, 1961–1971, https://doi.org/10.5194/acp-7-1961-2007, 2007.
Pierce, J. R., Leaitch, W. R., Liggio, J., Westervelt, D. M., Wainwright, C. D., Abbatt, J. P. D., Ahlm, L., Al-Basheer, W., Cziczo, D. J., Hayden, K. L., Lee, A. K. Y., Li, S.-M., Russell, L. M., Sjostedt, S. J., Strawbridge, K. B., Travis, M., Vlasenko, A., Wentzell, J. J. B., Wiebe, H. A., Wong, J. P. S., and Macdonald, A. M.: Nucleation and condensational growth to CCN sizes during a sustained pristine biogenic SOA event in a forested mountain valley, Atmos. Chem. Phys., 12, 3147–3163, https://doi.org/10.5194/acp-12-3147-2012, 2012.
Pruppacher, H. R. and Klett, J. D.: Microphysics of clouds and precipitation: Reprinted 1980, Springer Science & Business Media, Berlin, Germany, ISBN 978-0-7923-4211-3, 2010.
Rejano, F., Titos, G., Casquero-Vera, J. A., Lyamani, H., Andrews, E., Sheridan, P., Cazorla, A., Castillo, S., Alados-Arboledas, L., and Olmo, F. J.: Activation properties of aerosol particles as cloud condensation nuclei at urban and high-altitude remote sites in Southern Europe, Sci. Total Environ., 762, 143100, https://doi.org/10.1016/j.scitotenv.2020.143100, 2021.
Ren, J., Chen, L., Fan, T., Liu, J., Jiang, S., and Zhang, F.: The NPF effect on CCN number concentrations: A review and re-evaluation of observations from 35 sites worldwide, Geophys. Res. Lett., 48, e2021GL095190, https://doi.org/10.1029/2021gl095190, 2021.
Riipinen, I., Manninen, H. E., Yli-Juuti, T., Boy, M., Sipilä, M., Ehn, M., Junninen, H., Petäjä, T., and Kulmala, M.: Applying the Condensation Particle Counter Battery (CPCB) to study the water-affinity of freshly-formed 2–9 nm particles in boreal forest, Atmos. Chem. Phys., 9, 3317–3330, https://doi.org/10.5194/acp-9-3317-2009, 2009.
Rodelas, R. R., Perdrix, E., Herbin, B., and Riffault, V.: Characterization and variability of inorganic aerosols and their gaseous precursors at a suburban site in Northern France over one year (2015–2016), Atmos. Environ., 200, 142–157, https://doi.org/10.1016/j.atmosenv.2018.11.041, 2019.
Rollins, A. W., Browne, E. C., Min, K. E., Pusede, S. E., Wooldridge, P. J., Gentner, D. R., Goldstein, A. H., Liu, S., Day, D. A., Russell, L. M., and Cohen, R. C.: Evidence for NOx control over nighttime SOA formation, Science, 337, 1210–1212, https://doi.org/10.1126/science.1221520, 2012.
Rose, C., Sellegri, K., Moreno, I., Velarde, F., Ramonet, M., Weinhold, K., Krejci, R., Andrade, M., Wiedensohler, A., Ginot, P., and Laj, P.: CCN production by new particle formation in the free troposphere, Atmos. Chem. Phys., 17, 1529–1541, https://doi.org/10.5194/acp-17-1529-2017, 2017.
Rose, D., Gunthe, S. S., Mikhailov, E., Frank, G. P., Dusek, U., Andreae, M. O., and Pöschl, U.: Calibration and measurement uncertainties of a continuous-flow cloud condensation nuclei counter (DMT-CCNC): CCN activation of ammonium sulfate and sodium chloride aerosol particles in theory and experiment, Atmos. Chem. Phys., 8, 1153–1179, https://doi.org/10.5194/acp-8-1153-2008, 2008.
Rose, D., Nowak, A., Achtert, P., Wiedensohler, A., Hu, M., Shao, M., Zhang, Y., Andreae, M. O., and Pöschl, U.: Cloud condensation nuclei in polluted air and biomass burning smoke near the mega-city Guangzhou, China – Part 1: Size-resolved measurements and implications for the modeling of aerosol particle hygroscopicity and CCN activity, Atmos. Chem. Phys., 10, 3365–3383, https://doi.org/10.5194/acp-10-3365-2010, 2010.
Rose, D., Gunthe, S. S., Su, H., Garland, R. M., Yang, H., Berghof, M., Cheng, Y. F., Wehner, B., Achtert, P., Nowak, A., Wiedensohler, A., Takegawa, N., Kondo, Y., Hu, M., Zhang, Y., Andreae, M. O., and Pöschl, U.: Cloud condensation nuclei in polluted air and biomass burning smoke near the mega-city Guangzhou, China – Part 2: Size-resolved aerosol chemical composition, diurnal cycles, and externally mixed weakly CCN-active soot particles, Atmos. Chem. Phys., 11, 2817–2836, https://doi.org/10.5194/acp-11-2817-2011, 2011.
Schmale, J., Henning, S., Decesari, S., Henzing, B., Keskinen, H., Sellegri, K., Ovadnevaite, J., Pöhlker, M. L., Brito, J., Bougiatioti, A., Kristensson, A., Kalivitis, N., Stavroulas, I., Carbone, S., Jefferson, A., Park, M., Schlag, P., Iwamoto, Y., Aalto, P., Äijälä, M., Bukowiecki, N., Ehn, M., Frank, G., Fröhlich, R., Frumau, A., Herrmann, E., Herrmann, H., Holzinger, R., Kos, G., Kulmala, M., Mihalopoulos, N., Nenes, A., O'Dowd, C., Petäjä, T., Picard, D., Pöhlker, C., Pöschl, U., Poulain, L., Prévôt, A. S. H., Swietlicki, E., Andreae, M. O., Artaxo, P., Wiedensohler, A., Ogren, J., Matsuki, A., Yum, S. S., Stratmann, F., Baltensperger, U., and Gysel, M.: Long-term cloud condensation nuclei number concentration, particle number size distribution and chemical composition measurements at regionally representative observatories, Atmos. Chem. Phys., 18, 2853–2881, https://doi.org/10.5194/acp-18-2853-2018, 2018.
Sebastian, M., Kanawade, V. P., Soni, V. K., Asmi, E., Westervelt, D. M., Vakkari, V., Hyvärinen, A. P., Pierce, J. R., and Hooda, R. K.: New particle formation and growth to climate-relevant aerosols at a background remote site in the Western Himalaya, J. Geophys. Res.-Atmos., 126, e2020JD033267, https://doi.org/10.1029/2020jd033267, 2021.
Shen, C., Zhao, C., Ma, N., Tao, J., Zhao, G., Yu, Y., and Kuang, Y.: Method to estimate water vapor supersaturation in the ambient activation process using aerosol and droplet measurement data, J. Geophys. Res.-Atmos., 123, 10606–10619, https://doi.org/10.1029/2018jd028315, 2018.
Sihto, S.-L., Kulmala, M., Kerminen, V.-M., Dal Maso, M., Petäjä, T., Riipinen, I., Korhonen, H., Arnold, F., Janson, R., Boy, M., Laaksonen, A., and Lehtinen, K. E. J.: Atmospheric sulphuric acid and aerosol formation: implications from atmospheric measurements for nucleation and early growth mechanisms, Atmos. Chem. Phys., 6, 4079–4091, https://doi.org/10.5194/acp-6-4079-2006, 2006.
Sihto, S.-L., Mikkilä, J., Vanhanen, J., Ehn, M., Liao, L., Lehtipalo, K., Aalto, P. P., Duplissy, J., Petäjä, T., Kerminen, V.-M., Boy, M., and Kulmala, M.: Seasonal variation of CCN concentrations and aerosol activation properties in boreal forest, Atmos. Chem. Phys., 11, 13269–13285, https://doi.org/10.5194/acp-11-13269-2011, 2011.
Small, J. D., Chuang, P. Y., Feingold, G., and Jiang, H.: Can aerosol decrease cloud lifetime?, Geophys. Res. Lett., 36, L16806, https://doi.org/10.1029/2009gl038888, 2009.
Smith, J. N., Dunn, M. J., VanReken, T. M., Iida, K., Stolzenburg, M. R., McMurry, P. H., and Huey, L. G.: Chemical composition of atmospheric nanoparticles formed from nucleation in Tecamac, Mexico: Evidence for an important role for organic species in nanoparticle growth, Geophys. Res. Lett., 35, L04808, https://doi.org/10.1029/2007gl032523, 2008.
Smith, J. N., Barsanti, K. C., Friedli, H. R., Ehn, M., Kulmala, M., Collins, D. R., Scheckman, J. H., Williams, B. J., and McMurry, P. H.: Observations of ammonium salts in atmospheric nanoparticles and possible climatic implications, P. Natl. Acad. Sci. USA, 107, 6634–6639, https://doi.org/10.1073/pnas.0912127107, 2010.
Sotiropoulou, R. E. P., Tagaris, E., Pilinis, C., Anttila, T., and Kulmala, M.: Modeling new particle formation during air pollution episodes: Impacts on aerosol and cloud condensation nuclei, Aerosol Sci. Tech., 40, 557–572, https://doi.org/10.1080/02786820600714346, 2006.
Sui, X., Zhou, Y., Zhang, F., Zhang, Y., Chen, J., Zhu, Z., and Yu, X. Y.: ToF-SIMS characterization of glyoxal surface oxidation products by hydrogen peroxide: A comparison between dry and liquid samples, Surf. Interface Anal., 50, 927–938, https://doi.org/10.1002/sia.6334, 2017.
Sullivan, R. C., Crippa, P., Matsui, H., Leung, L. R., Zhao, C., Thota, A., and Pryor, S. C.: New particle formation leads to cloud dimming, npj Clim. Atmos. Sci., 1, 9, https://doi.org/10.1038/s41612-018-0019-7, 2018.
Teng, X., Hu, Q., Zhang, L., Qi, J., Shi, J., Xie, H., Gao, H., and Yao, X.: Identification of major sources of atmospheric NH3 in an urban environment in Northern China during wintertime, Environ. Sci. Technol., 51, 6839–6848, https://doi.org/10.1021/acs.est.7b00328, 2017.
Tröstl, J., Herrmann, E., Frege, C., Bianchi, F., Molteni, U., Bukowiecki, N., Hoyle, C. R., Steinbacher, M., Weingartner, E., Dommen, J., Gysel, M., and Baltensperger, U.: Contribution of new particle formation to the total aerosol concentration at the high-altitude site Jungfraujoch (3580 m a.s.l., Switzerland), J. Geophys. Res.-Atmos., 121, 11692–11711, https://doi.org/10.1002/2015jd024637, 2016.
Twohy, C. H.: Evaluation of the aerosol indirect effect in marine stratocumulus clouds: Droplet number, size, liquid water path, and radiative impact, J. Geophys. Res., 110, D08203, https://doi.org/10.1029/2004jd005116, 2005.
Twomey, S.: The influence of pollution on the shortwave albedo of clouds, J. Atmos. Sci., 34, 1149–1152, https://doi.org/10.1175/1520-0469(1977)034<1149:Tiopot>2.0.Co;2, 1977.
Vakkari, V., Tiitta, P., Jaars, K., Croteau, P., Beukes, J. P., Josipovic, M., Kerminen, V. M., Kulmala, M., Venter, A. D., Zyl, P. G., Worsnop, D. R., and Laakso, L.: Reevaluating the contribution of sulfuric acid and the origin of organic compounds in atmospheric nanoparticle growth, Geophys. Res. Lett., 42, 10486–10493, https://doi.org/10.1002/2015gl066459, 2015.
Wan, Y., Huang, X., Jiang, B., Kuang, B., Lin, M., Xia, D., Liao, Y., Chen, J., Yu, J. Z., and Yu, H.: Probing key organic substances driving new particle growth initiated by iodine nucleation in coastal atmosphere, Atmos. Chem. Phys., 20, 9821–9835, https://doi.org/10.5194/acp-20-9821-2020, 2020.
Wang, J., Shen, Y., Li, K., Gao, Y., Gao, H., and Yao, X.: Nucleation-mode particle pool and large increases in Ncn and Nccn observed over the northwestern Pacific Ocean in the spring of 2014, Atmos. Chem. Phys., 19, 8845–8861, https://doi.org/10.5194/acp-19-8845-2019, 2019.
Wang, M., Kong, W., Marten, R., He, X. C., Chen, D., Pfeifer, J., Heitto, A., Kontkanen, J., Dada, L., Kurten, A., Yli-Juuti, T., Manninen, H. E., Amanatidis, S., Amorim, A., Baalbaki, R., Baccarini, A., Bell, D. M., Bertozzi, B., Brakling, S., Brilke, S., Murillo, L. C., Chiu, R., Chu, B., De Menezes, L. P., Duplissy, J., Finkenzeller, H., Carracedo, L. G., Granzin, M., Guida, R., Hansel, A., Hofbauer, V., Krechmer, J., Lehtipalo, K., Lamkaddam, H., Lampimaki, M., Lee, C. P., Makhmutov, V., Marie, G., Mathot, S., Mauldin, R. L., Mentler, B., Muller, T., Onnela, A., Partoll, E., Petaja, T., Philippov, M., Pospisilova, V., Ranjithkumar, A., Rissanen, M., Rorup, B., Scholz, W., Shen, J., Simon, M., Sipila, M., Steiner, G., Stolzenburg, D., Tham, Y. J., Tome, A., Wagner, A. C., Wang, D. S., Wang, Y., Weber, S. K., Winkler, P. M., Wlasits, P. J., Wu, Y., Xiao, M., Ye, Q., Zauner-Wieczorek, M., Zhou, X., Volkamer, R., Riipinen, I., Dommen, J., Curtius, J., Baltensperger, U., Kulmala, M., Worsnop, D. R., Kribi, J., Seinfeld, J. H., El-Haddad, I., Flagman, R. C., and Donahue, N. M.: Rapid growth of new atmospheric particles by nitric acid and ammonia condensation, Nature, 581, 184–189, https://doi.org/10.1038/s41586-020-2270-4, 2020.
Wex, H., McFiggans, G., Henning, S., and Stratmann, F.: Influence of the external mixing state of atmospheric aerosol on derived CCN number concentrations, Geophys. Res. Lett., 37, 10805–10808, https://doi.org/10.1029/2010gl043337, 2010.
Whitby, K. T.: The physical characteristics of sulfur aerosols, Atmos. Environ., 12, 135–159, https://doi.org/10.1016/0004-6981(78)90196-8, 1978.
Wiedensohler, A., Cheng, Y. F., Nowak, A., Wehner, B., Achtert, P., Berghof, M., Birmili, W., Wu, Z. J., Hu, M., Zhu, T., Takegawa, N., Kita, K., Kondo, Y., Lou, S. R., Hofzumahaus, A., Holland, F., Wahner, A., Gunthe, S. S., Rose, D., Su, H., and Pöschl, U.: Rapid aerosol particle growth and increase of cloud condensation nucleus activity by secondary aerosol formation and condensation: A case study for regional air pollution in Northeastern China, J. Geophys. Res., 114, D00G08, https://doi.org/10.1029/2008jd010884, 2009.
Williamson, C. J., Kupc, A., Axisa, D., Bilsback, K. R., Bui, T., Campuzano-Jost, P., Dollner, M., Froyd, K. D., Hodshire, A. L., Jimenez, J. L., Kodros, J. K., Luo, G., Murphy, D. M., Nault, B. A., Ray, E. A., Weinzierl, B., Wilson, J. C., Yu, F., Yu, P., Pierce, J. R., and Brock, C. A.: A large source of cloud condensation nuclei from new particle formation in the tropics, Nature, 574, 399–403, https://doi.org/10.1038/s41586-019-1638-9, 2019.
Wu, P., Huang, X., Zhang, J., Luo, B., Luo, J., Song, H., Zhang, W., Rao, Z., Feng, Y., and Zhang, J.: Characteristics and formation mechanisms of autumn haze pollution in Chengdu based on high time-resolved water-soluble ion analysis, Environ. Sci. Pollut. R., 26, 2649–2661, https://doi.org/10.1007/s11356-018-3630-6, 2019.
Wu, Z., Hu, M., Liu, S., Wehner, B., Bauer, S., Ma ßling, A., Wiedensohler, A., Petäjä, T., Dal Maso, M., and Kulmala, M.: New particle formation in Beijing, China: Statistical analysis of a 1 year data set, J. Geophys. Res., 112, D09209, https://doi.org/10.1029/2006jd007406, 2007.
Wu, Z., Birmili, W., Poulain, L., Wang, Z., Merkel, M., Fahlbusch, B., van Pinxteren, D., Herrmann, H., and Wiedensohler, A.: Particle hygroscopicity during atmospheric new particle formation events: implications for the chemical species contributing to particle growth, Atmos. Chem. Phys., 13, 6637–6646, https://doi.org/10.5194/acp-13-6637-2013, 2013.
Yang, J., Li, J., Li, P., Sun, G., Cai, Z., Yang, X., Cui, C., Dong, X., Xi, B., Wan, R., Wang, B., and Zhou, Z.: Spatial distribution and impacts of aerosols on clouds under meiyu frontal weather background over central China based on aircraft observations, J. Geophys. Res.-Atmos., 125, e2019JD031915, https://doi.org/10.1029/2019jd031915, 2020.
Yao, X., Lau, N. T., Fang, M., and Chan, C. K.: Real-time observation of the transformation of ultrafine atmospheric particle modes, Aerosol Sci. Tech., 39, 831–841, https://doi.org/10.1080/02786820500295248, 2005.
Young, L. H., Benson, D. R., Kameel, F. R., Pierce, J. R., Junninen, H., Kulmala, M., and Lee, S.-H.: Laboratory studies of binary homogeneous nucleation from the SO2+OH reaction: evaluation of the experimental setup and preliminary results, Atmos. Chem. Phys., 8, 4997–5016, https://doi.org/10.5194/acp-8-4997-2008, 2008.
Yu, F. and Luo, G.: Simulation of particle size distribution with a global aerosol model: contribution of nucleation to aerosol and CCN number concentrations, Atmos. Chem. Phys., 9, 7691–7710, https://doi.org/10.5194/acp-9-7691-2009, 2009.
Yu, F., Luo, G., Nair, A. A., Schwab, J. J., Sherman, J. P., and Zhang, Y.: Wintertime new particle formation and its contribution to cloud condensation nuclei in the Northeastern United States, Atmos. Chem. Phys., 20, 2591–2601, https://doi.org/10.5194/acp-20-2591-2020, 2020.
Yue, D. L., Hu, M., Zhang, R. Y., Wu, Z. J., Su, H., Wang, Z. B., Peng, J. F., He, L. Y., Huang, X. F., Gong, Y. G., and Wiedensohler, A.: Potential contribution of new particle formation to cloud condensation nuclei in Beijing, Atmos. Environ., 45, 6070–6077, https://doi.org/10.1016/j.atmosenv.2011.07.037, 2011.
Zaveri, R. A., Easter, R. C., Singh, B., Wang, H., Lu, Z., Tilmes, S., Emmons, L. K., Vitt, F., Zhang, R., Liu, X., Ghan, S. J., and Rasch, P. J.: Development and evaluation of chemistry-aerosol-climate model CAM5-Chem-MAM7-MOSAIC: Global atmospheric distribution and radiative effects of nitrate aerosol, J. Adv. Model. Earth Sy., 13, e2020MS002346, https://doi.org/10.1029/2020MS002346, 2021.
Zhang, F., Yu, X., Chen, J., Zhu, Z., and Yu, X.-Y.: Dark air-liquid interfacial chemistry of glyoxal and hydrogen peroxide, npj Clim. Atmos. Sci., 2, 28, https://doi.org/10.1038/s41612-019-0085-5, 2019.
Zhou, Y., Hakala, S., Yan, C., Gao, Y., Yao, X., Chu, B., Chan, T., Kangasluoma, J., Gani, S., Kontkanen, J., Paasonen, P., Liu, Y., Petäjä, T., Kulmala, M., and Dada, L.: Measurement report: New particle formation characteristics at an urban and a mountain station in northern China, Atmos. Chem. Phys., 21, 17885–17906, https://doi.org/10.5194/acp-21-17885-2021, 2021.
Zhu, J., Penner, J. E., Yu, F., Sillman, S., Andreae, M. O., and Coe, H.: Decrease in radiative forcing by organic aerosol nucleation, climate, and land use change, Nat. Commun., 10, 423, https://doi.org/10.1038/s41467-019-08407-7, 2019.
Zhu, Y., Sabaliauskas, K., Liu, X., Meng, H., Gao, H., Jeong, C.-H., Evans, G. J., and Yao, X.: Comparative analysis of new particle formation events in less and severely polluted urban atmosphere, Atmos. Environ., 98, 655–664, https://doi.org/10.1016/j.atmosenv.2014.09.043, 2014.
Zhu, Y., Li, K., Shen, Y., Gao, Y., Liu, X., Yu, Y., Gao, H., and Yao, X.: New particle formation in the marine atmosphere during seven cruise campaigns, Atmos. Chem. Phys., 19, 89–113, https://doi.org/10.5194/acp-19-89-2019, 2019.
Zhu, Y., Shen, Y., Li, K., Meng, H., Sun, Y., Yao, X., Gao, H., Xue, L., and Wang, W.: Investigation of particle number concentrations and new particle formation with largely reduced air pollutant emissions at a coastal semi-urban site in Northern China, J. Geophys. Res.-Atmos., 126, e2021JD035419, https://doi.org/10.1029/2021jd035419, 2021a.
Zhu, Y., Xue, L., Gao, J., Chen, J., Li, H., Zhao, Y., Guo, Z., Chen, T., Wen, L., Zheng, P., Shan, Y., Wang, X., Wang, T., Yao, X., and Wang, W.: Increased new particle yields with largely decreased probability of survival to CCN size at the summit of Mt. Tai under reduced SO2 emissions, Atmos. Chem. Phys., 21, 1305–1323, https://doi.org/10.5194/acp-21-1305-2021, 2021b.
Zimmerman, N., Jeong, C.-H., Wang, J. M., Ramos, M., Wallace, J. S., and Evans, G. J.: A source-independent empirical correction procedure for the fast mobility and engine exhaust particle sizers, Atmos. Environ., 100, 178–184, https://doi.org/10.1016/j.atmosenv.2014.10.054, 2015.