the Creative Commons Attribution 4.0 License.
the Creative Commons Attribution 4.0 License.
 | 14 Dec 2023
A satellite chronology of plumes from the April 2021 eruption of La Soufrière, St Vincent
Isabelle A. Taylor
Roy G. Grainger
Andrew T. Prata
Simon R. Proud
Tamsin A. Mather
David M. Pyle
Satellite instruments play a valuable role in detecting, monitoring and characterising emissions of ash and gas into the atmosphere during volcanic eruptions. This study uses two satellite instruments, the Infrared Atmospheric Sounding Interferometer (IASI) and the Advanced Baseline Imager (ABI), to examine the plumes of ash and sulfur dioxide (SO2) from the April 2021 eruption of La Soufrière, St Vincent. The frequent ABI data have been used to construct a 14 d chronology of a series of explosive events at La Soufrière, which is then complemented by measurements of SO2 from IASI, which is able to track the plume as it is transported around the globe. A minimum of 35 eruptive events were identified using true, false and brightness temperature difference maps produced with the ABI data. The high temporal resolution images were used to identify the approximate start and end times, as well as the duration and characteristics of each event. From this analysis, four distinct phases within the 14 d eruption have been defined, each consisting of multiple explosive events with similar characteristics: (1) an initial explosive event, (2) a sustained event lasting over 9 h, (3) a pulsatory phase with 25 explosive events in a 65.3 h period and (4) a waning sequence of explosive events. It is likely that the multiple explosive events during the April 2021 eruption contributed to the highly complex plume structure that can be seen in the IASI measurements of the SO2 column amounts and heights. The bulk of the SO2 from the first three phases of the eruption was transported eastwards, which based on the wind direction at the volcano implies that the SO2 was largely in the upper troposphere. Some of the SO2 was carried to the south and west of the volcano, suggesting a smaller emission of the gas into the stratosphere, there being a shift in wind direction around the height of the tropopause. The retrieved SO2 heights show that the plume had multiple layers but was largely concentrated between 13 and 19 km, with the majority of the SO2 being located in the upper troposphere and around the height of the tropopause, with some emission into the stratosphere. An average e-folding time of 6.07±4.74 d was computed based on the IASI SO2 results: similar to other tropical eruptions of this magnitude and height. The SO2 was trackable for several weeks after the eruption and is shown to have circulated the globe, with parts of it reaching as far as 45∘ S and 45∘ N. Using the IASI SO2 measurements, a time series of the total SO2 mass loading was produced, with this peaking on 13 April (descending orbits) at 0.31±0.09 Tg. Converting these mass values to a temporally varying SO2 flux demonstrated that the greatest emission occurred on 10 April with that measurement incorporating SO2 from the second phase of the eruption (sustained emission) and the beginning of the pulsatory phase. The SO2 flux is then shown to fall during the later stages of the eruption: suggesting a reduction in eruptive energy, something also reflected in ash height estimates obtained with the ABI instrument. A total SO2 emission of 0.63±0.5 Tg of SO2 has been derived, although due to limitations associated with the retrieval, particularly in the first few days after the eruption began, this, the retrieved column amounts and the total SO2 mass on each day should be considered minimum estimates. There are a number of similarities between the 1979 and 2021 eruptions at La Soufrière, with both eruptions consisting of a series of explosive events with varied heights and including some emission into the stratosphere. These similarities highlight the importance of in-depth investigations into eruptions and the valuable contribution of satellite data for this purpose; as these studies aid in learning about a volcano's behaviour, which may allow for better preparation for future eruptive activity.
- Article
(4207 KB) - Full-text XML
-
Supplement
(22264 KB) - BibTeX
- EndNote


La Soufrière (13.33∘ N, 61.18∘ W, summit elevation of 1220 m), a volcano on the island of St Vincent, entered a phase of explosive activity on 9 April 2021 after having been in a lower level state of eruption, including the slow extrusion of a lava dome, since late December 2020 (Global Volcanism Program, 2021a; Joseph et al., 2022). The volcano is part of the eastern Caribbean volcanic arc and has erupted on at least five occasions since the 18th century in both explosive (1718, 1812, 1902–1903, 1979) and lava-dome-forming eruptions (1971–1972, 1979) (Robertson, 1995; Pyle, 2017).
Eruptive activity since 1970 included the non-explosive extrusion of a basaltic andesite lava dome into the flooded crater from November 1971–January 1972 and a violent series of explosions that began in the flooded summit crater on 13 April 1979 (Aspinall et al., 1973; Shepherd et al., 1979). The 1979 explosions were very well documented at the time and persisted for 2 weeks. They were followed by about 6 months of lava dome extrusion across the crater floor, which by then had been infilled by pyroclastic ejecta (Brazier et al., 1982; Fiske and Sigurdsson, 1982; Shepherd and Sigurdsson, 1982). The explosive eruption of La Soufrière in April 1979 was one of the first eruptions to have occurred during the “satellite era” (Fiske and Sigurdsson, 1982). Observations from the infra-red radiometer on the Synchronous Meteorological Satellite 1 (SMS-1) were used to measure the growth of the volcanic ash plumes (Krueger, 1982), the Stratospheric Aerosol and Gas Experiment (SAGE) measured stratospheric aerosol from the eruption (McCormick et al., 1982), and SO2 from the eruption was observed by the Total Ozone Mapping Spectrometer (TOMS; Carn et al., 2003, 2016).
After the 1979 eruption, La Soufrière showed no detectable signs of activity or unrest until late 2020. An increase in seismicity was noted by seismologists at The University of the West Indies Seismic Research Centre (UWI-SRC) in November and December 2020 (Joseph et al., 2022). An effusive eruption began on 27 December 2020 with the emplacement of a new lava dome, which grew over the following months. On 8 April 2021, the alert level was raised to the highest level and an evacuation of the highest risk communities was ordered (Global Volcanism Program, 2021b). The first of a number of explosive eruptive events began on 9 April 2021 at 08:41 LT (12:41 UTC) (Joseph et al., 2022). Multiple explosive events occurred over the following 2 weeks, with the last explosive event occurring on 22 April 2021. Activity during this eruptive period led to the closure of local airports, and ashfall affected much of St Vincent, as well as neighbouring islands, including the Grenadines, Barbados and Saint Lucia (Global Volcanism Program, 2021b). Details of the eruption, its impacts and the crisis management can be found within a special issue on the eruption published by the Geological Society (Robertson et al., 2024).
Technological developments in the 4 decades since the 1979 eruption mean that numerous aspects of the 2021 eruption were observed with multiple satellite instruments, including thermal anomalies; dome growth; lightning; and the evolution of the SO2, ash, and sulfate plumes (Global Volcanism Program, 2021a, b; Smart and Sales, 2021; Babu et al., 2022; Thompson et al., 2022; Yue et al., 2022; Horváth et al., 2022; Dualeh et al., 2023; Bruckert et al., 2023; Camejo-Harry et al., 2024; Esse et al., 2024). Measurements made by satellite instruments allow the detection of SO2 and ash and quantification of the plume properties, which is essential for assessing the potential hazard to aviation (Prata and Tupper, 2009; Thomas and Watson, 2010; Lechner et al., 2017) and providing more sophisticated information on eruption source parameters (Aubry et al., 2021). Of particular value is the ability of satellite instruments to track the evolution of these plumes as they are transported away from the source. Geostationary instruments with a high temporal resolution (e.g. up to 30 s) are extremely valuable for identifying hazardous plumes and can also help to characterise eruptive events (e.g. Gupta et al., 2022; Prata et al., 2022).
This paper uses data from the Infrared Atmospheric Sounding Interferometer (IASI) on the three MetOp satellites and the Advanced Baseline Imager (ABI) on the Geostationary Operational Environmental Satellite (GOES) to analyse the plumes of ash and SO2 from the 2021 eruption of La Soufrière. Further details on the instruments and methods used to retrieve information about the plumes are given in Sect. 2. The eruption sequence and plume characteristics are discussed in Sect. 3. These instruments provide a complementary view of the eruption, with the high temporal resolution of ABI allowing the eruption sequence to be evaluated, while using IASI it possible to study the dispersion of the plumes as they travel across the globe.
2.1 The Infrared Atmospheric Sounding Interferometer
2.1.1 Instrument
The Infrared Atmospheric Sounding Interferometer (IASI) is a Fourier transform spectrometer on-board three meteorological satellite instruments: MetOp-A, -B and -C launched in 2006, 2012 and 2018, respectively, with data from all three instruments used in this study. The instrument's field of view consists of four circular pixels, each with a 12 km diameter (at nadir) within a 50 km by 50 km square at nadir (Clerbaux et al., 2009). The instruments measure across a wide spectral range within the infrared part of the electromagnetic spectrum between 645 and 2760 cm−1 (3.6–15.5 µm) with a high spectral sampling of 0.25 cm−1 and apodised spectral resolution of 0.5 cm−1 (Blumstein et al., 2004). More information on the IASI instrument can be found in Clerbaux et al. (2009). Within the instrument's spectral range there is sensitivity to volcanic ash (v-shaped absorption feature between 750 and 1250 cm−1; Clarisse et al., 2010a) and SO2 (three absorption features ν1, ν3 and ν1+ν3, centred at 8.7, 7.3 and 4 µm, respectively). A number of methods have been developed to extract information about SO2 from the IASI spectra (e.g. Clarisse et al., 2008; Walker et al., 2011, 2012; Clarisse et al., 2012; Carboni et al., 2012; Clarisse et al., 2014). Retrieval techniques have also been developed for other volcanic gases and aerosols including H2S (Clarisse et al., 2011), CO (Martínez-Alonso et al., 2012), sulfate (Guermazi et al., 2021) and ash particles (Clarisse et al., 2010a, b; Maes et al., 2016; Ventress et al., 2016; Taylor et al., 2019). Each IASI instrument obtains near-global coverage twice a day, and as they are infrared measurements there is no break in coverage at night and during high-latitude winters. This coverage and sensitivity to gases and aerosols associated with volcanic eruptions makes the IASI instruments well suited for studying the evolution of volcanic plumes. This study uses retrieval schemes developed by Walker et al. (2011, 2012) and Carboni et al. (2012) for quantifying SO2 emissions from La Soufrière and Sears et al. (2013) for the detection of volcanic ash.
2.1.2 Retrievals
In this study, two methods have been used to analyse SO2 plumes from the La Soufrière eruption. The first method is a linear retrieval, which is applied in this case to detect pixels that contain elevated quantities of columnar SO2; see Walker et al. (2011, 2012). The second method is an optimal estimation retrieval scheme, which has been applied to the flagged pixels to quantify the column amount, height, and the effective radiating temperature, and the errors associated with each of these. In broad terms, this method works by comparing the IASI-measured spectra against SO2 spectra simulated by the fast-radiative transfer model RTTOV (version 9; Saunders et al., 1999); see Carboni et al. (2012, 2016, 2019) for more details. The following changes have been made to the retrieval setup.
-
A higher a priori height has been used. In most previous applications, an a priori height of 400 hPa (∼ 7.6 km) has been used. This has been changed to 150 hPa (∼ 14.3 km; upper troposphere) to reflect the higher injection height of the La Soufrière eruption as reported in Global Volcanism Program (2021b). The a priori variance has been kept at 500 hPa.
-
In previous applications of the retrieval, the 1σ plume thickness was constrained and set to 100 hPa. This is more appropriate for a plume in the lower troposphere (∼ 1.9 km at 400 hPa), but due to the exponential change in pressure with height in the atmosphere, this thickness is inappropriate in the upper troposphere and lower stratosphere (UTLS) (∼ 4.8 km at 150 hPa). In this application the a priori plume thickness has been set to 30 hPa (∼ 1.2 km at 150 hPa). This is the minimum thickness that can be set given the spacing of the pressure levels in the RTTOV forward model.
The results have been divided into descending (satellite travelling N to S; ∼ 09:30 local overpass time at the Equator) and ascending (satellite travelling S to N; ∼ 21:30 local overpass time at the Equator). This approach can lead to artefacts in the results at the point where the data cross into the next day. This is particularly notable in the ascending orbits at La Soufrière, with the date change occurring around the location of the volcano. To minimise this impact, the descending and ascending results have been offset from each other: the descending results are a 24 h composite of the descending nodes of orbits starting on each date, while the ascending results are compiled from 24 h of ascending nodes of orbits starting from midday on each date and up until midday of the following day. In this way the artefact is moved to the other side of the globe, minimising its impact. In this paper, the ascending results are referred to by the start date.
To estimate the total mass of SO2 the retrieved column amounts are first gridded to a regular grid of 0.125 by 0.125∘(roughly 13.5 by 13.91 km at 13∘ N, 61∘ W): the retrieved values are interpolated to fill gaps created by the IASI field of view and where pixels fail the quality control. Using the area of each grid box, the column amounts are converted to a mass and the total mass on each day is then computed by summing all the gridded masses within a defined region (−45 to 45∘ N and −180 and 180∘ E). The total mass errors are computed in the same way, which may lead to an overestimation of the mass error, but to sum the errors in quadrature could lead to an underestimation due to the systematic errors. Note that this overestimation in the errors is carried forward into the flux and total emission errors. A vertical distribution of the SO2 mass can be obtained by combining the mass grid with a height grid generated from the retrieved heights.
Error analysis by Carboni et al. (2012) explored the effects of cloud and volcanic ash on the iterative SO2 retrieval, demonstrating that ash with an optical depth of 1 (at 550 nm) can significantly affect the output of the retrieval. An ash optical depth of 2 was shown to cause a 50 % underestimation in the SO2 column amount, and an ash optical depth of 5 was shown to mask the SO2 signal completely. To investigate the effect of ash on the La Soufrière results, a linear ash retrieval as described in Sears et al. (2013) has been applied to the IASI data for the first few days after the first eruptive event to detect pixels containing volcanic ash that may affect the retrieved SO2 values. This retrieval is run at three pressure levels (400, 600 and 800 hPa) to obtain three estimates of the ash optical depth. Pixels are then flagged as containing volcanic ash if any one of these ash optical depths exceeds a threshold. In this study, the results for the 400 hPa (∼ 7.6 km) level are used as it is the closest level to the retrieved heights. The linear ash retrieval makes a number of assumptions, which means that the retrieved ash optical depths are not necessarily accurate, and it is being used here to simply indicate the possibility of ash affecting the SO2 retrieval output. Note that there are spectral similarities between volcanic ash, desert dust and desert surfaces that can lead to false ash flags in desert regions such as the Sahara (e.g. Prata et al., 2001; Simpson et al., 2003; Park et al., 2014). To avoid this, the ash linear retrieval has been run for a smaller region (−5 to 25∘ N, −68 to −20∘ E) than the main analysis.
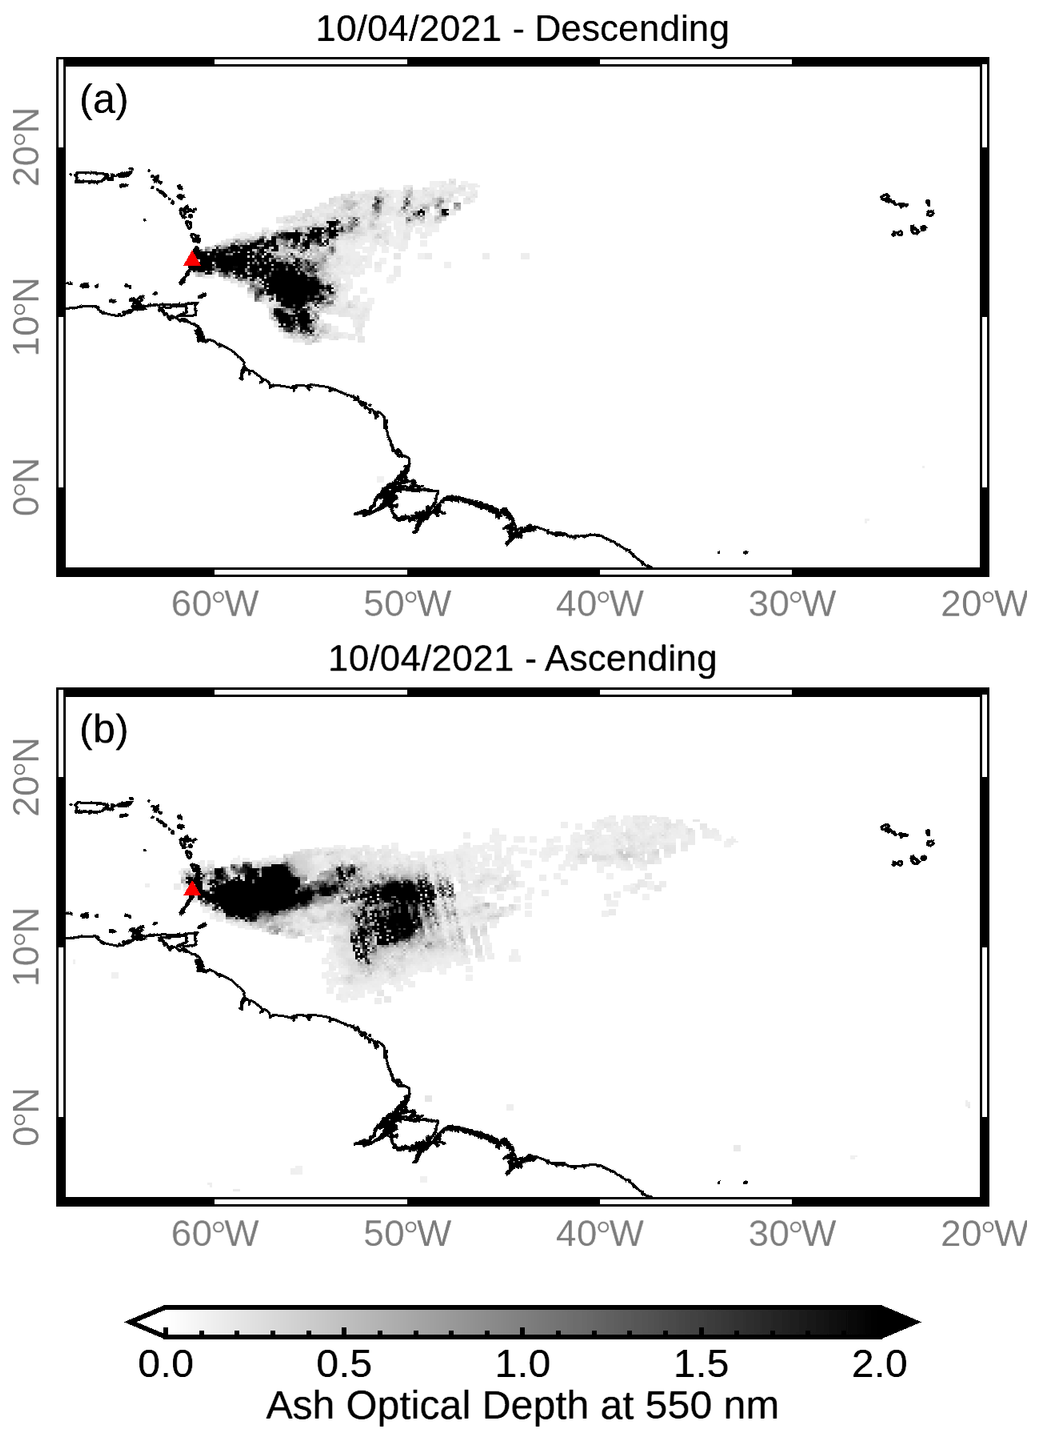
Figure 1Ash optical depths at 550 nm from the IASI linear ash retrieval for 10 April 2021. This retrieval was run assuming a height of 400 hPa. The volcano's location is indicated by a red triangle. The results are a composite of multiple orbits which have been divided into descending (∼ 09:30 local overpass time at the Equator) and ascending (∼ 21:30 local overpass time at the Equator). The ascending results are a composite of orbits from 12:00 UTC on 10 April to 12:00 UTC on 11 April. For further details see Sect. 2.1.2.
Table 1Percentage of IASI SO2 pixels on 9 to 12 April 2021 that may be affected by volcanic ash. This has been calculated for the region −5 to 25∘ N, −68 to −20∘ E. AOD refers to ash optical depth. Note that the results are split into descending and ascending nodes, with the ascending results consisting of orbits beginning after 12:00 UTC on the date indicated and ending at 12:00 UTC of the following day. See Sect. 2.1.2 for further information.
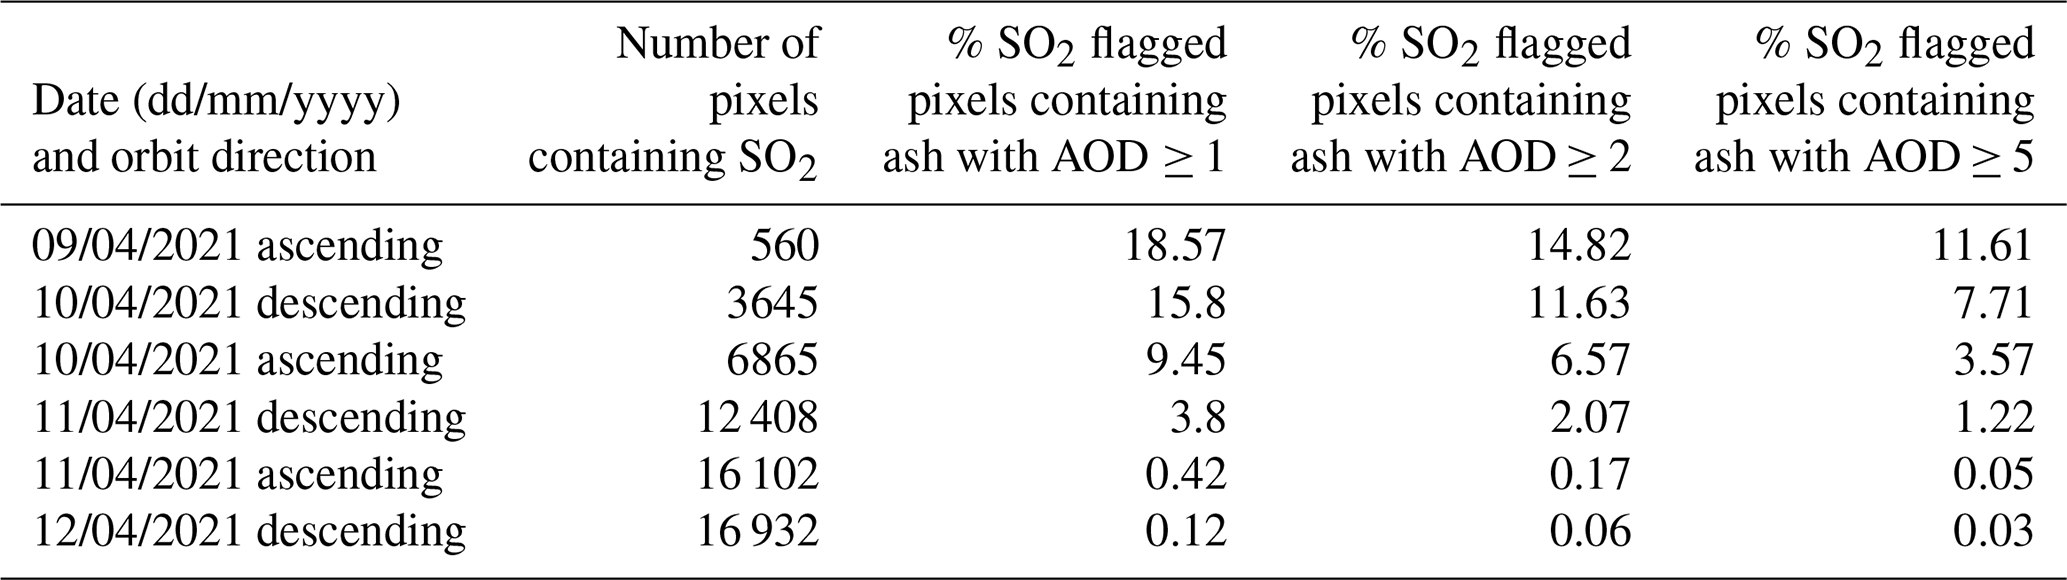
Figure 1 shows examples of an optically thick ash plume travelling east from the volcano on 10 April 2021. Analysis of the percentage ash detections (Table 1) show that the SO2 column amounts may be strongly affected by the presence of ash, and so the column amount and mass values presented in this paper should be considered minimum estimates, especially in the first few days after the eruption began (before the ash falls out). Future work should consider the simultaneous retrieval of ash and SO2 so as to reduce the impact of ash on the SO2 iterative retrieval. Additionally, SO2 may be missed where it falls below the retrieval detection limit.
2.1.3 Estimating SO2 e-folding time and flux
The decrease in the total mass of SO2 (m) in the atmosphere with time (t) can be described as follows:
where τ is the average SO2 e-folding time. The e-folding time refers to the lifetime of SO2 in the atmosphere and incorporates the loss of SO2 due to oxidation and deposition and where the SO2 amount falls below the detection limit of the instrument being used. Fitting Eq. (1) to the total SO2 atmospheric burden obtained with a satellite instrument can give a simple estimate of the average e-folding time over a given period. For an eruption like La Soufrière, where there are multiple emission events, the total SO2 mass loading is a function of both the average e-folding time and variable SO2 flux (f):
where i is the time step and Δt is the time interval between measurements.
Carboni et al. (2019) uses Eq. (2) within an optimal estimation approach to estimate both the SO2 flux at each time step and an average e-folding time for the entire eruptive period. This approach has been applied here to the total masses obtained for La Soufrière. The average e-folding estimate can be strongly influenced by the a priori value, and thus for this study an independent estimate of the e-folding time was computed by fitting Eq. (1) to the IASI SO2 masses computed for the 23 to 30 April 2021 (the period after the last explosive event occurred). This is shown in Fig. 2 and produced an e-folding estimate of 5.47 d. This value was used as the a priori in the optimal estimation approach to generate a time-varying emission flux for the 14 d emission period (9 to 22 April 2021). The optimal estimation scheme produced an average e-folding time of 6.07±4.74 d. On days with no explosive events, as identified with the ABI data (see Sect. 2.2.2), the a priori SO2 flux and uncertainty are set to 0.
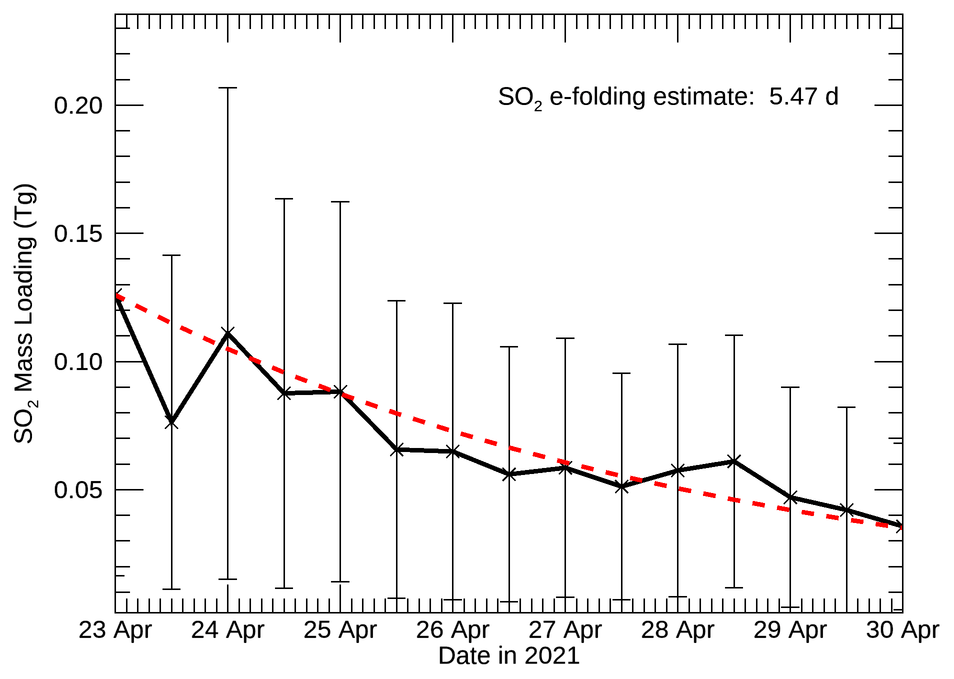
Figure 2IASI SO2 masses for 23–30 April 2021, which is the period after the last eruptive event at La Soufrière. A simple and independent estimate of SO2 e-folding time has been computed by fitting Eq. (1) to the IASI total SO2 mass estimates. This has been used as an independent a priori in the optimal estimation method for obtaining the flux and average e-folding time for the eruptive period (9–22 April).
To compute the total mass of SO2 erupted over the studied period, the fluxes were summed and then multiplied by the time difference (Δt) between the descending and ascending orbits (assumed to be 12 h). To estimate the total erupted mass error, the individual flux errors are summed in quadrature (i.e. a quadratic mean of the errors), and then multiplied by Δt. An upper and lower bound of the total emission estimate is obtained by summing the SO2 flux plus or minus the errors at each time step (excluding negative values), respectively, and multiplying by Δt.
2.2 The Advanced Baseline Imager (ABI)
2.2.1 Instrument
The Advanced Baseline Imager (ABI) is on-board three of the Geostationary Operational Environmental Satellite platforms: GOES-16 (or GOES-East), GOES-17 (or GOES-West) and GOES-18, launched in 2016, 2018 and 2022, respectively. The GOES-16 instrument is used in this study. Recent images produced with this instrument can be accessed at https://www.star.nesdis.noaa.gov/goes/fulldisk.php?sat=G16 (last access: 5 April 2023). The area imaged by GOES-16 (positioned at 75.2∘ W) covers most of the continental United States, Eastern Canada, Central and South America and the Caribbean, extending across the Eastern Pacific and a large part of the North Atlantic Ocean. The ABI instrument has 16 channels spanning the 0.45 to 13.7 µm spectral range, with the spatial resolution for the different channels varying from 0.5 to 2 km at nadir (Schmit et al., 2005). Having seven channels between 7.3 and 13.3 µm means that the instrument has sensitivity to ash and SO2, and the instrument has previously been used for the detection of ash and SO2 and quantification of ash properties (e.g. Pavolonis et al., 2020). Previous versions of the ABI instruments have also been used for this purpose (e.g. Yu et al., 2002; Ackerman et al., 2008). During the eruption of La Soufrière, the ABI sensor recorded a new full disc image every 10 min. In addition, on GOES-16 there are two moveable mesoscale regions, covering an area of 1000×1000 km (at subsatellite point), which can provide data every minute (Schmit et al., 2017). These are moved to provide higher temporal coverage for events such as severe weather, hurricanes and forest fires (Schmit et al., 2017). During the La Soufrière eruption, one mesoscale region was moved over the volcano. This started at 09:00 UTC on 10 April (missing the earlier eruptive events) and ended at 06:00 UTC on 16 April 2021 (before the last three eruptive events). In this study, the ABI data have been used to identify the start and end times of each eruptive event and for determining the height of the ash cloud. When available, the 1 min mesoscale data have been used to identify the start and end times of the eruptive events. The 10 min resolution data have been used for the remaining days. The 10 min data have been used for the height analysis. While the ABI instrument has sensitivity to ash and SO2, it has not been used to quantify the amount of either in this study. Instead, the ABI data have been used to document the sequence of explosive events produced by the 2021 La Soufrière eruption.
2.2.2 Analysis of ash
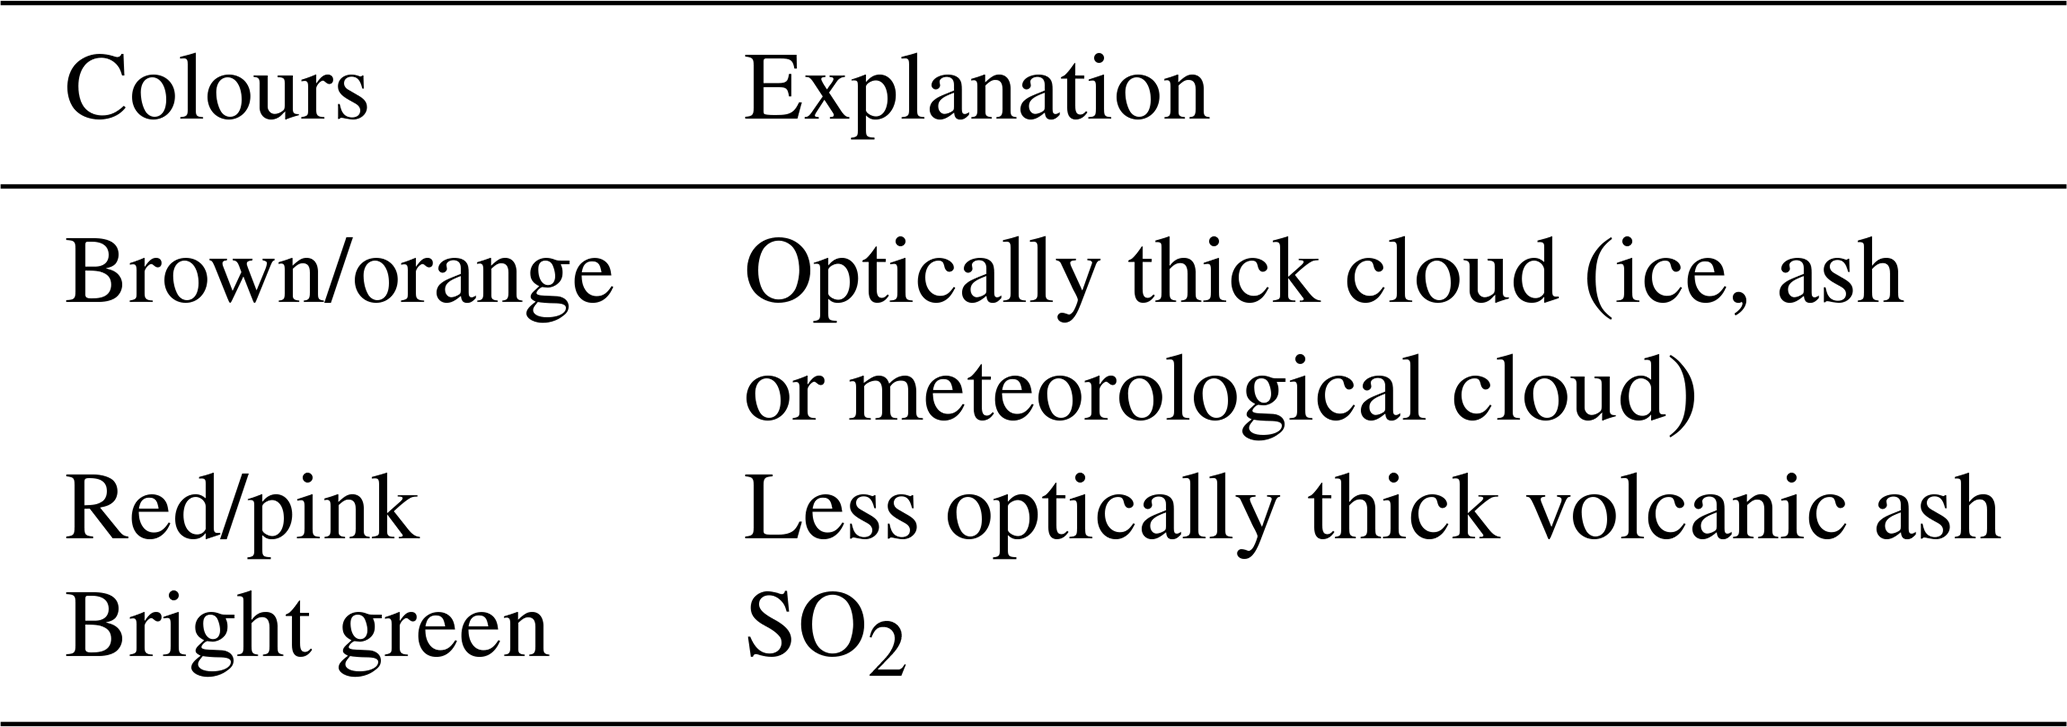
The Satpy Python package has been used to load true- and false-colour products from the ABI data for the eruption period. In both cases, the RGB components of this were then normalised and used to produce maps showing the volcanic plumes from this eruption (9–22 April). The false-colour images have been constructed by assigning the 12.3–10.3 µm, 11.2–8.4 and 10.3 µm channels to red, green and blue, respectively (for further information on the ash RGB product, see Fuell, 2018). Table 2 shows how to interpret the images. An example of these plots can be seen in Fig. 3. In addition, the 11.2–12.3 and 10.3–11.2 µm brightness temperature differences (BTDs) have been calculated. The 11.2–12.3 µm BTD combination has been widely used to distinguish volcanic ash in satellite data and uses the positive transmission gradient between 10 and 12 µm caused by volcanic ash (Prata, 1989a, b). The 10.3 µm channel is less affected by water vapour (Lindsey et al., 2012), and thus the 10.3–11.2 µm BTD may be more appropriate in tropical atmospheres. A threshold can be used to flag pixels containing ash. The BTD approach can be limited for a number of reasons; for example, false detections can occur in regions with high surface emissivities (e.g. deserts) and strong temperature inversions or due to desert dust, while ash clouds may not be identified if they are too optically thin or thick or if there are significant quantities of ice or water within the plume (Rose et al., 1995; Simpson et al., 2000; Prata et al., 2001). There is also no generally applicable threshold that can be set for ash detection, with the most appropriate value varying with region and time.
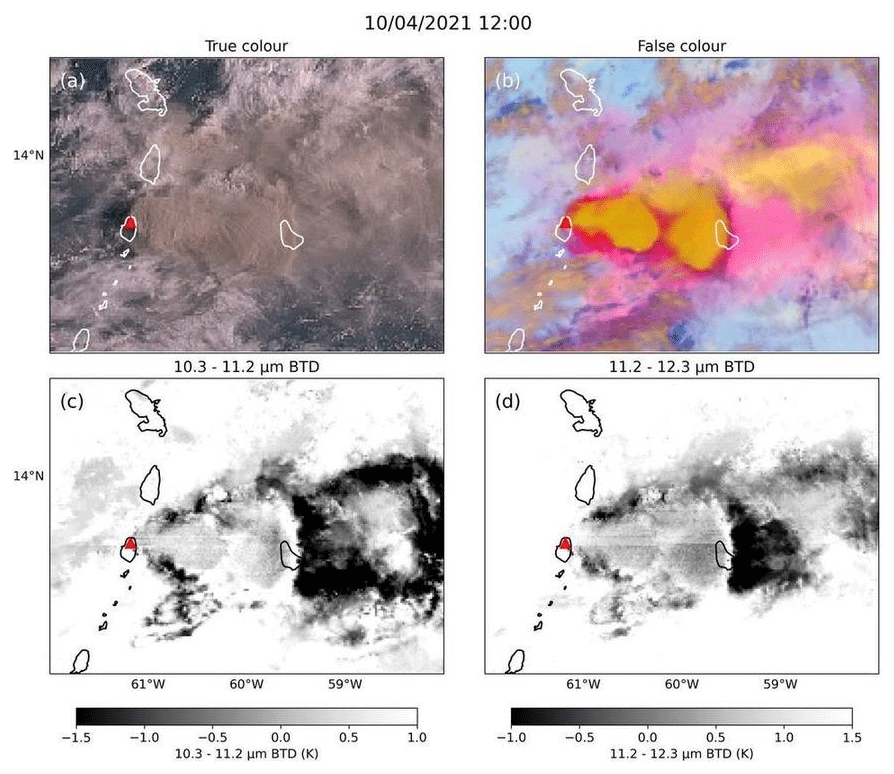
Figure 3Examples of results from the ABI instrument for the La Soufrière plume at 12:00 UTC on 10 April 2021. (a) True-colour image. (b) False-colour image (12.3–10.3, 11.2–8.4 and 10.3 µm channels assigned to red, green and blue, respectively). (c) Map showing 10.3–11.2 µm BTD. (d) Map showing 11.2–12.3 µm BTD. Animations for each event can be found in Taylor et al. (2023).
Table 2Outline of how to interpret the ABI false-colour images (see Fuell, 2018 for more information but note that differences in how the data is normalised may lead to variations in colour). An example image is shown in Fig. 3.
Together, the true, false and BTD images have been used to study the evolution of the plumes from La Soufrière. Careful examination of the plots allowed the identification of the approximate start and end times of each eruptive event. It should be noted that the start and end times reported here will be different to those observed on the ground. Here, the start time is the first time that the plume is observed in the ABI data, while the end time incorporates the time taken for the plume to rise and disperse away from the volcano. For this reason, the times reported here are different to those reported in Sparks et al. (2024) using seismic data. Additionally, the ABI analysis is limited by the 10 or 1 min resolution of the instrument and can be complicated by the presence of cloud. The interpretation of the start and end times is a subjective process, with the end time being particularly challenging to establish. In general, the end time was determined when the plume moved away from the volcano. This can be affected by the wind speed and so the end times should be considered approximate. As determining the end time was especially challenging, an end time range has been given for most events. It is also likely that lower-magnitude explosive events or degassing between events may not be identifiable in the ABI data. Note that for the full disc the measurement time over La Soufrière has been computed based on the latitude of the volcano and the measurement start and end times, approximately 243 s from the start time. This has been used to report the approximate times for the full disc results in this study. No such adjustment has been made to the mesoscale results, where the 1 min temporal resolution ensures a higher accuracy.
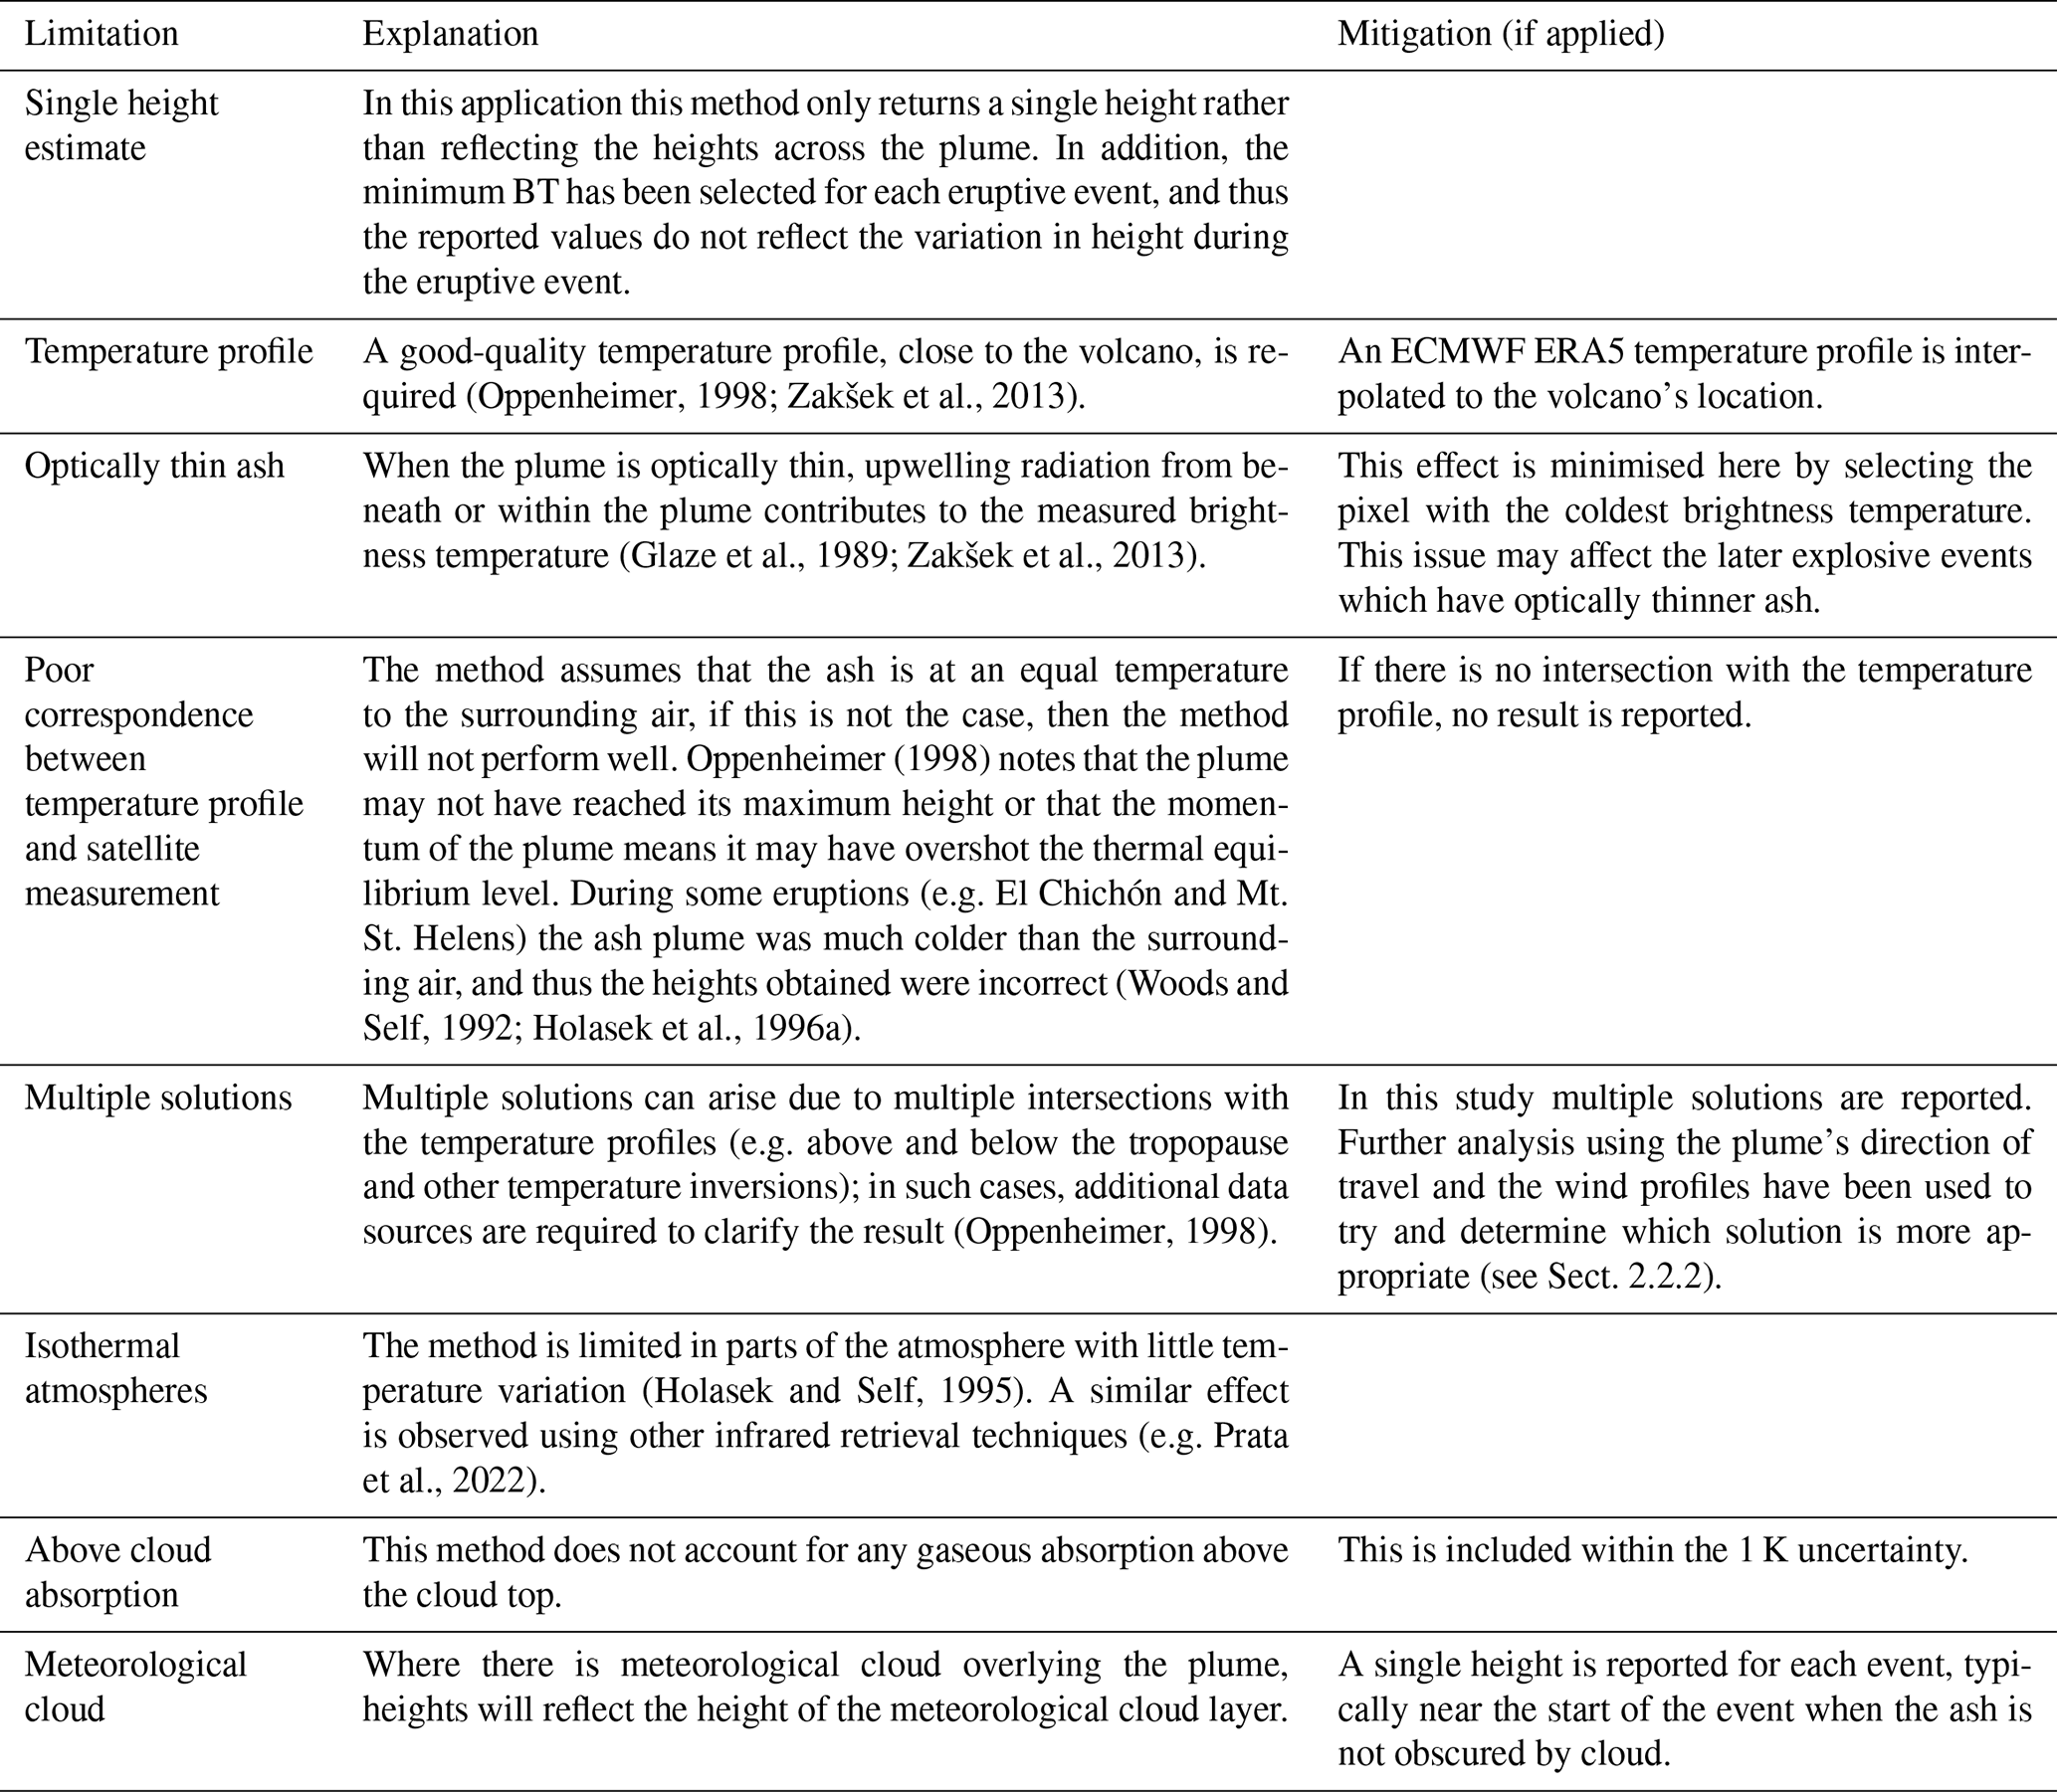
An estimate of the ash height is obtained by comparing the brightness temperature in the 11.2 µm band (ABI channel 14) for each eruptive event in a 0.1∘ box around the volcano with the ERA-5 ECMWF temperature profile interpolated to the volcano's location (European Centre for Medium-Range Weather Forecasts, 2021). Here this is referred to as the “brightness temperature (BT) method”. The measured brightness temperature is representative of the temperature at the top of the ash or cloud layer and can thus be used to approximate the height. The 11.2 µm channel is within an atmospheric window that has little sensitivity to water vapour. The minimum (or coldest) value within the 0.1∘ box around the volcano helps to select the optically thickest part of the plume, and therefore the pixel that is least likely to be affected by radiation from beneath the plume. The 0.1∘ box size should remove any significant effect due to parallax. In its application here, only one value is returned for each eruptive event (referred to as the “optically thick height method/solution”), which ensures the result from the most optically thick part of the plume is reported but subsequently does not show any variability within the event. This method has been widely used to estimate the ash cloud top height (e.g. Prata and Grant, 2001). There are, however, a few limitations that have been discussed in several papers (e.g. Oppenheimer, 1998; Prata and Grant, 2001; Zakšek et al., 2013) and which are highlighted in Table 3. Despite the various limitations of this method, it is a quick and frequently used approach for estimating ash cloud heights. For this application, an uncertainty of 1 K has been assumed for the instrument measurement encompassing the instrument noise and gaseous absorption above the cloud. Horváth et al. (2022) also applied the BT method to ABI data for La Soufrière for comparison against GOES-17 side view heights and noted a number of limitations with the BT method, including an underestimation of the heights for smaller eruptions due to a warm bias. The results here will likely share these limitations and thus should be treated with caution. However, Horváth et al. (2022) noted that the side view and BT method heights showed better agreement for cold plumes or for plumes spreading around the height of the tropopause.
(Oppenheimer, 1998; Zakšek et al., 2013)(Glaze et al., 1989; Zakšek et al., 2013)Oppenheimer (1998)(Woods and Self, 1992; Holasek et al., 1996a)(Oppenheimer, 1998)(Holasek and Self, 1995)(e.g. Prata et al., 2022)Table 3Summary of the sources of error associated with estimating the height of volcanic plumes by comparing the brightness temperature at 11.2 µm (ABI channel 14) with a temperature profile. In this paper this is termed the “brightness temperature (BT) method”. These limitations are discussed in several papers (Oppenheimer, 1998; Prata and Grant, 2001; Zakšek et al., 2013).
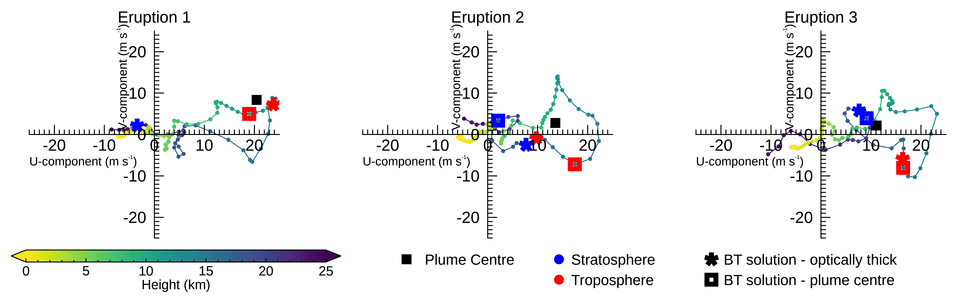
In this study, there was commonly a tropospheric and stratospheric solution when using the BT method. Additional information has been obtained by comparing the plume direction and speed with the ERA-5 ECMWF wind profiles. Figure 4a shows the average and standard deviation of the wind direction with height, and the average wind speed with height is shown in Fig. 4b. At heights of less than 5 km, the wind is primarily travelling to the west (e.g. 267.5∘ at 4.3 km) with wind speeds of less than 10 m s−1. At around 5 km, the wind direction shifts to the east. Between 7 and 17 km the wind direction is fairly consistent (varying between 101 and 126∘) before shifting back to the west at 19 to 20 km. The easterly winds in the stratosphere are a characteristic associated with a phase of the quasi-biennial oscillation (QBO): alternating strong easterly and westerly zonal winds around the Equator that propagate through the stratosphere to the tropopause (Reed et al., 1961; Baldwin et al., 2001). The wind speed is shown to increase between 5 and 14 km and then fall between 15 and 20 km. Figure 4c and d show the average plume direction and speed. This has been computed by visually identifying the centre of the optically thick plume in the RGB image 1 h or 30 min after the start of each eruptive event (as identified with ABI). For the first 6 d of the eruption, where there is some uncertainty with regard to the height, the plume is shown to broadly be travelling to the east, supporting a tropospheric solution. To take this analysis further, at the location identified as the centre of the optically thick plume, the BT method was used to obtain a second set of height solutions (referred to as the “BT method-centre” solutions). The wind directions at the heights obtained with both BT methods are compared against the horizontal velocity components from the motion of the plume (based on distance travelled in 1 h or 30 min, as above) to assign a degree of confidence to the height results for each eruptive event. Figure 5 shows examples from the first three eruptive events, which were shown to be tropospheric, uncertain and stratospheric, respectively.
There are differences between the heights obtained with the “BT method” applied in this study and the results obtained using the BT method found in Horváth et al. (2022), which may arise from different sampling approaches. This is also the case for the BT heights presented in Sparks et al. (2024) where differences may also arise due to the different meteorological data and channels used.
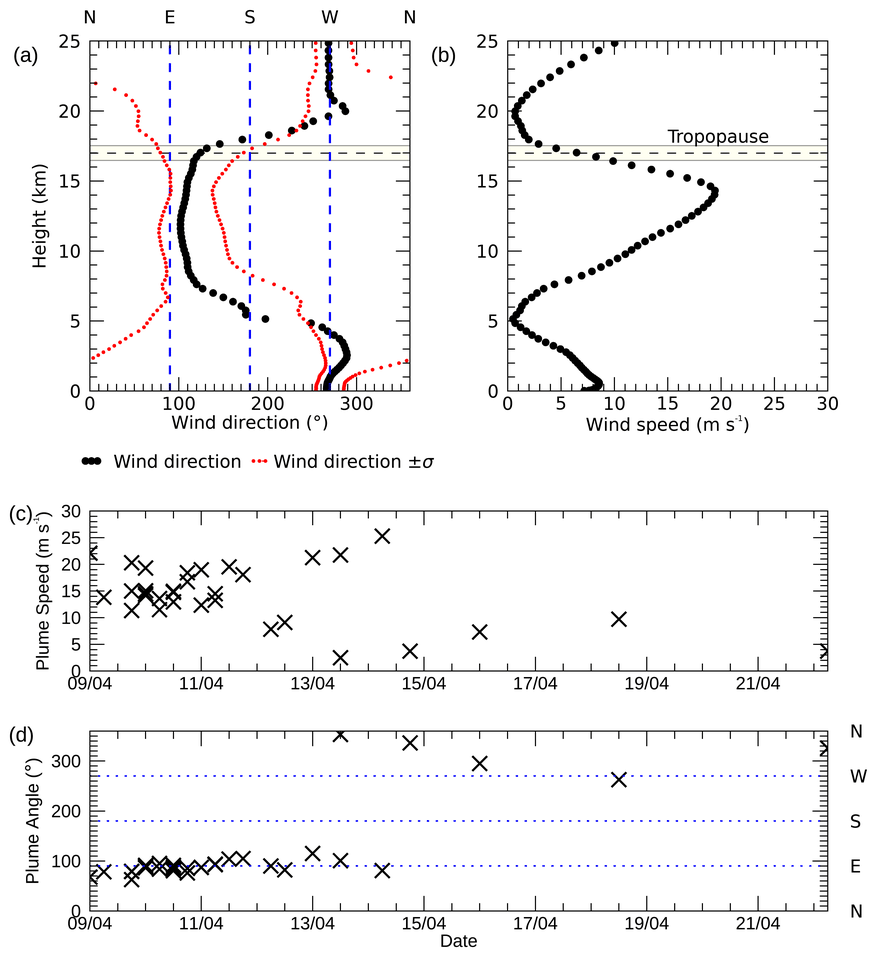
Figure 4(a) The average and standard deviation of the ERA5 ECMWF wind direction for different height levels between 9 and 22 April. (b) Average wind direction profile of the ERA5 ECMWF wind direction for different height levels between 9 and 22 April. (c) Plume speed for the different explosive events. (d) Plume direction of travel for the different explosive events.
3.1 Eruption sequence
True- and false-colour maps and ash BTDs were produced from the ABI data for the entire eruptive period (9 to 22 April 2021) using the instrument's high temporal resolution. An example from 10 April at 12:00 UTC is shown in Fig. 3. Animations showing the true- and false-colour images and the BTD maps for each eruptive event can be found at https://ora.ox.ac.uk/objects/uuid:ca4e7a94-37c6-4d5f-b94a-1f287e661f8a (Taylor et al., 2023, last access: 2 October 2023). These images have been carefully examined to get start and end times for each of the explosive events identified. The start and end times are reported in Table 4. The heights obtained with the BT method are reported in Table 5.
Using the ABI data, a minimum of 35 explosive events containing volcanic ash were identified. The number identified is limited by the temporal resolution of the instrument and cloud cover that might obscure the plume, and thus could potentially be higher. For example, explosive events that last less than 10 min may not be identified in the 10 min resolution data, while discrete eruptions or pulses that occur within the 1 or 10 min between images may be classified as the same eruption. Times where this is suspected are mentioned in Table 4. Additionally, lower-level activity may not be visible within the ABI data. Figure 6a shows the number of explosive events that started on each day as determined with the ABI data. This is shown to be highest on 10 April and decreases throughout the remainder of the eruptive sequence, with Fig. 6c showing that the repose time between explosive events increases over time. The duration of the eruptive events (Fig. 6b) is also shown to generally increase throughout the 9–22 April eruptive period, as also noted by Joseph et al. (2022).
Table 4Summary of plumes from La Soufrière seen with the ABI satellite instrument. The start and end times have been determined with the ABI images. These do not necessarily correspond to activity observed on the ground: the start time refers to when the plume is first visible in the ABI data, while the end time incorporates the time taken for the plume to rise and disperse away from the volcano. For a number of reasons discussed in Sect. 2.2.2, the times presented here should be considered approximate. Due to the uncertainty with the end times, in some cases these are presented as a range. The eruption has been split into four phases based on the general character of the events. The phase numbers correspond to (1) the initial explosive event, (2) sustained ash emission, (3) the pulsatory phase and (4) the waning phase.
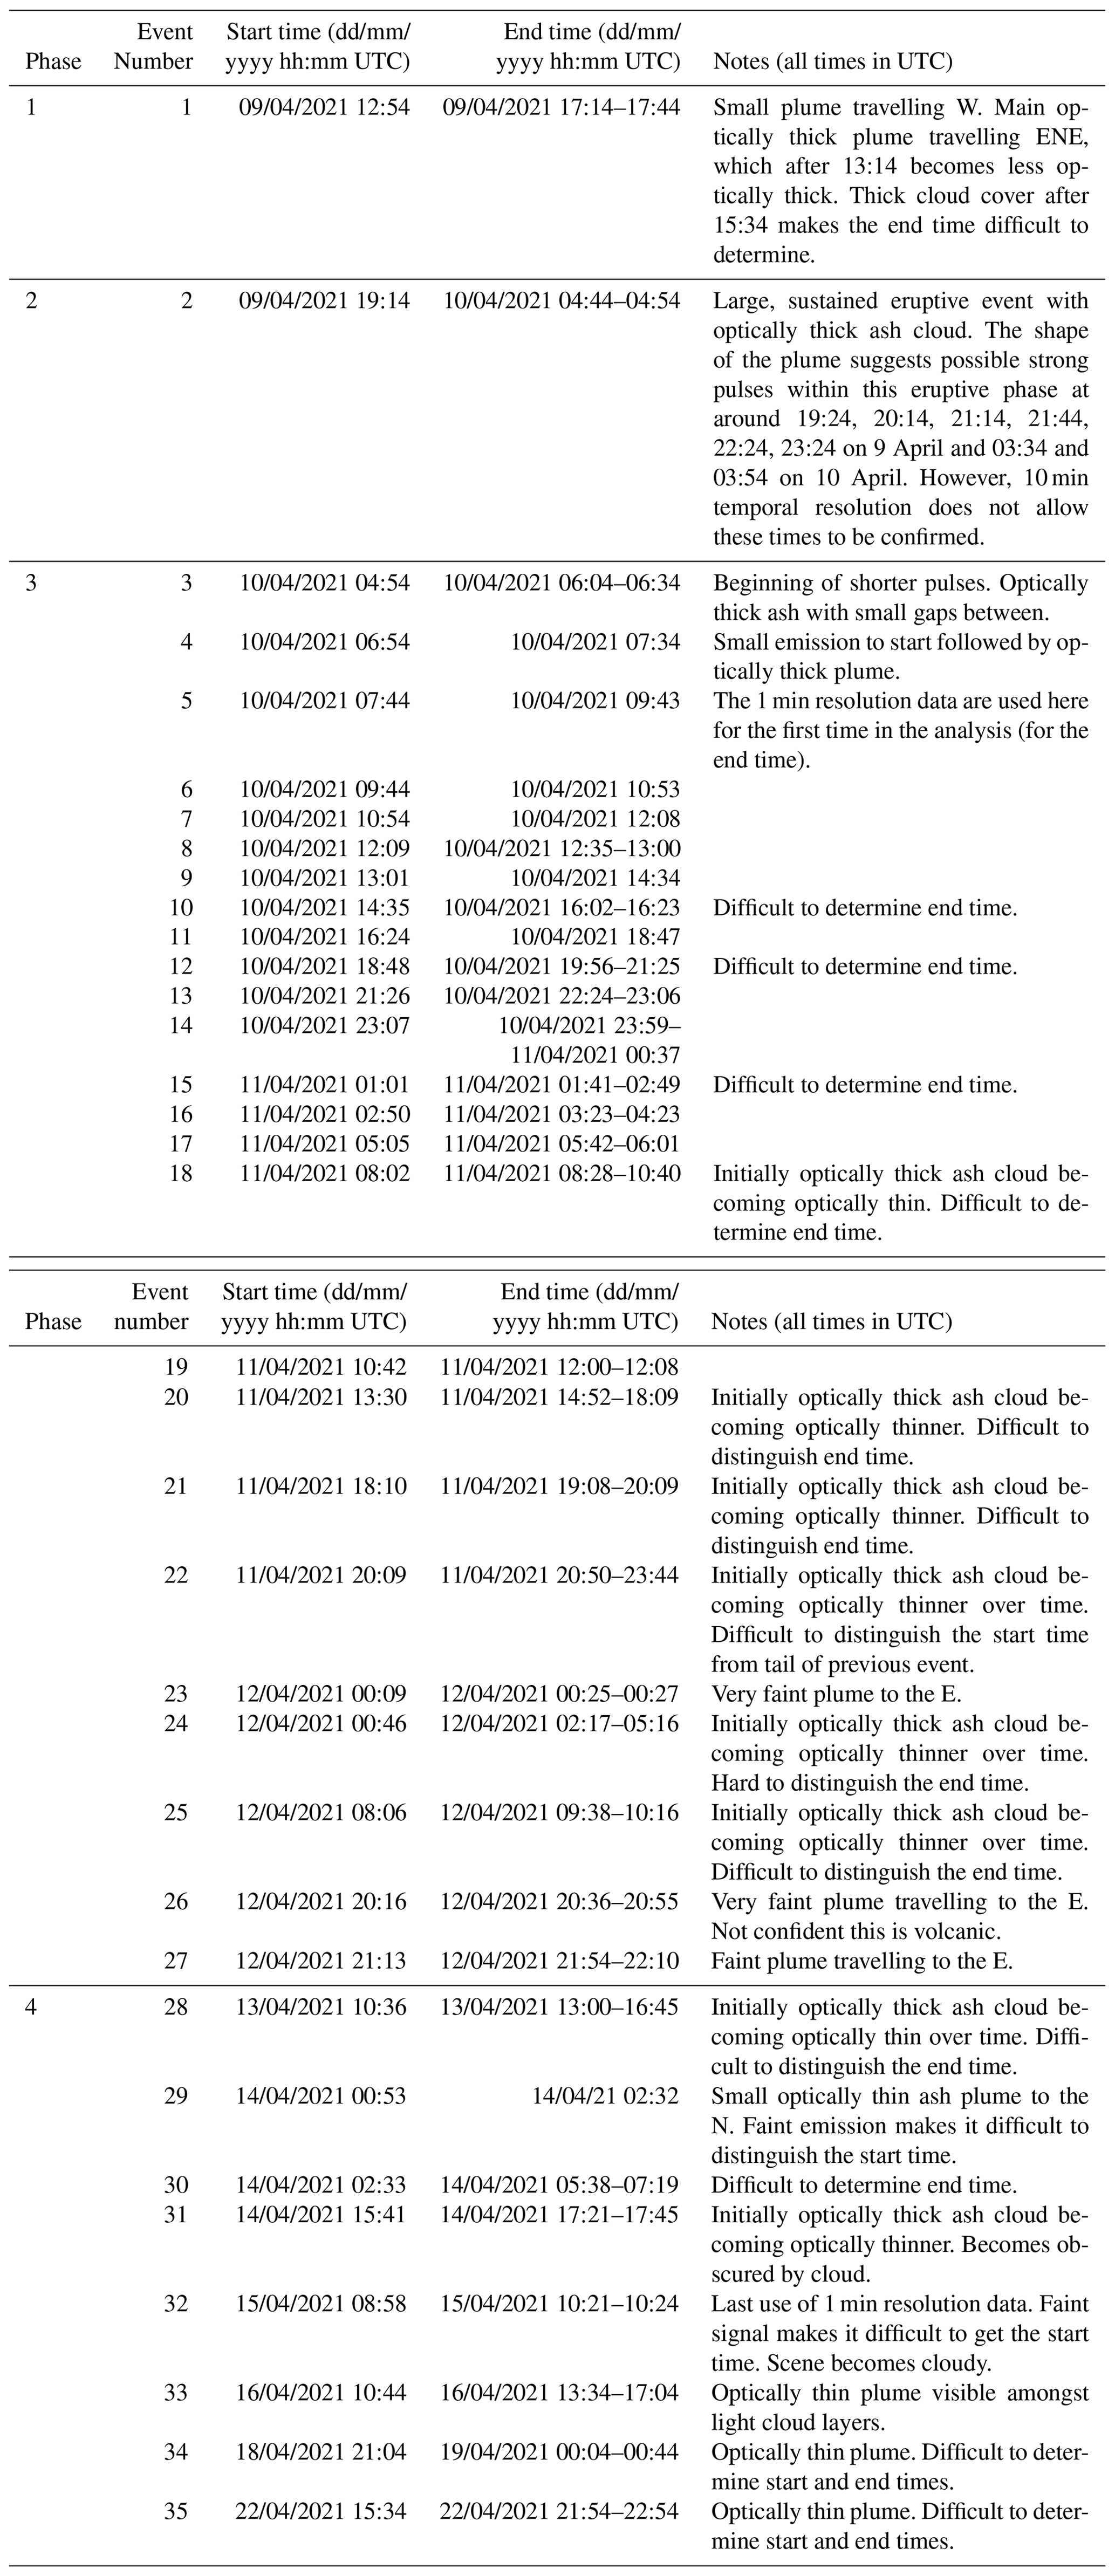
Table 5Heights retrieved using brightness temperature (BT) method applied to ABI data.
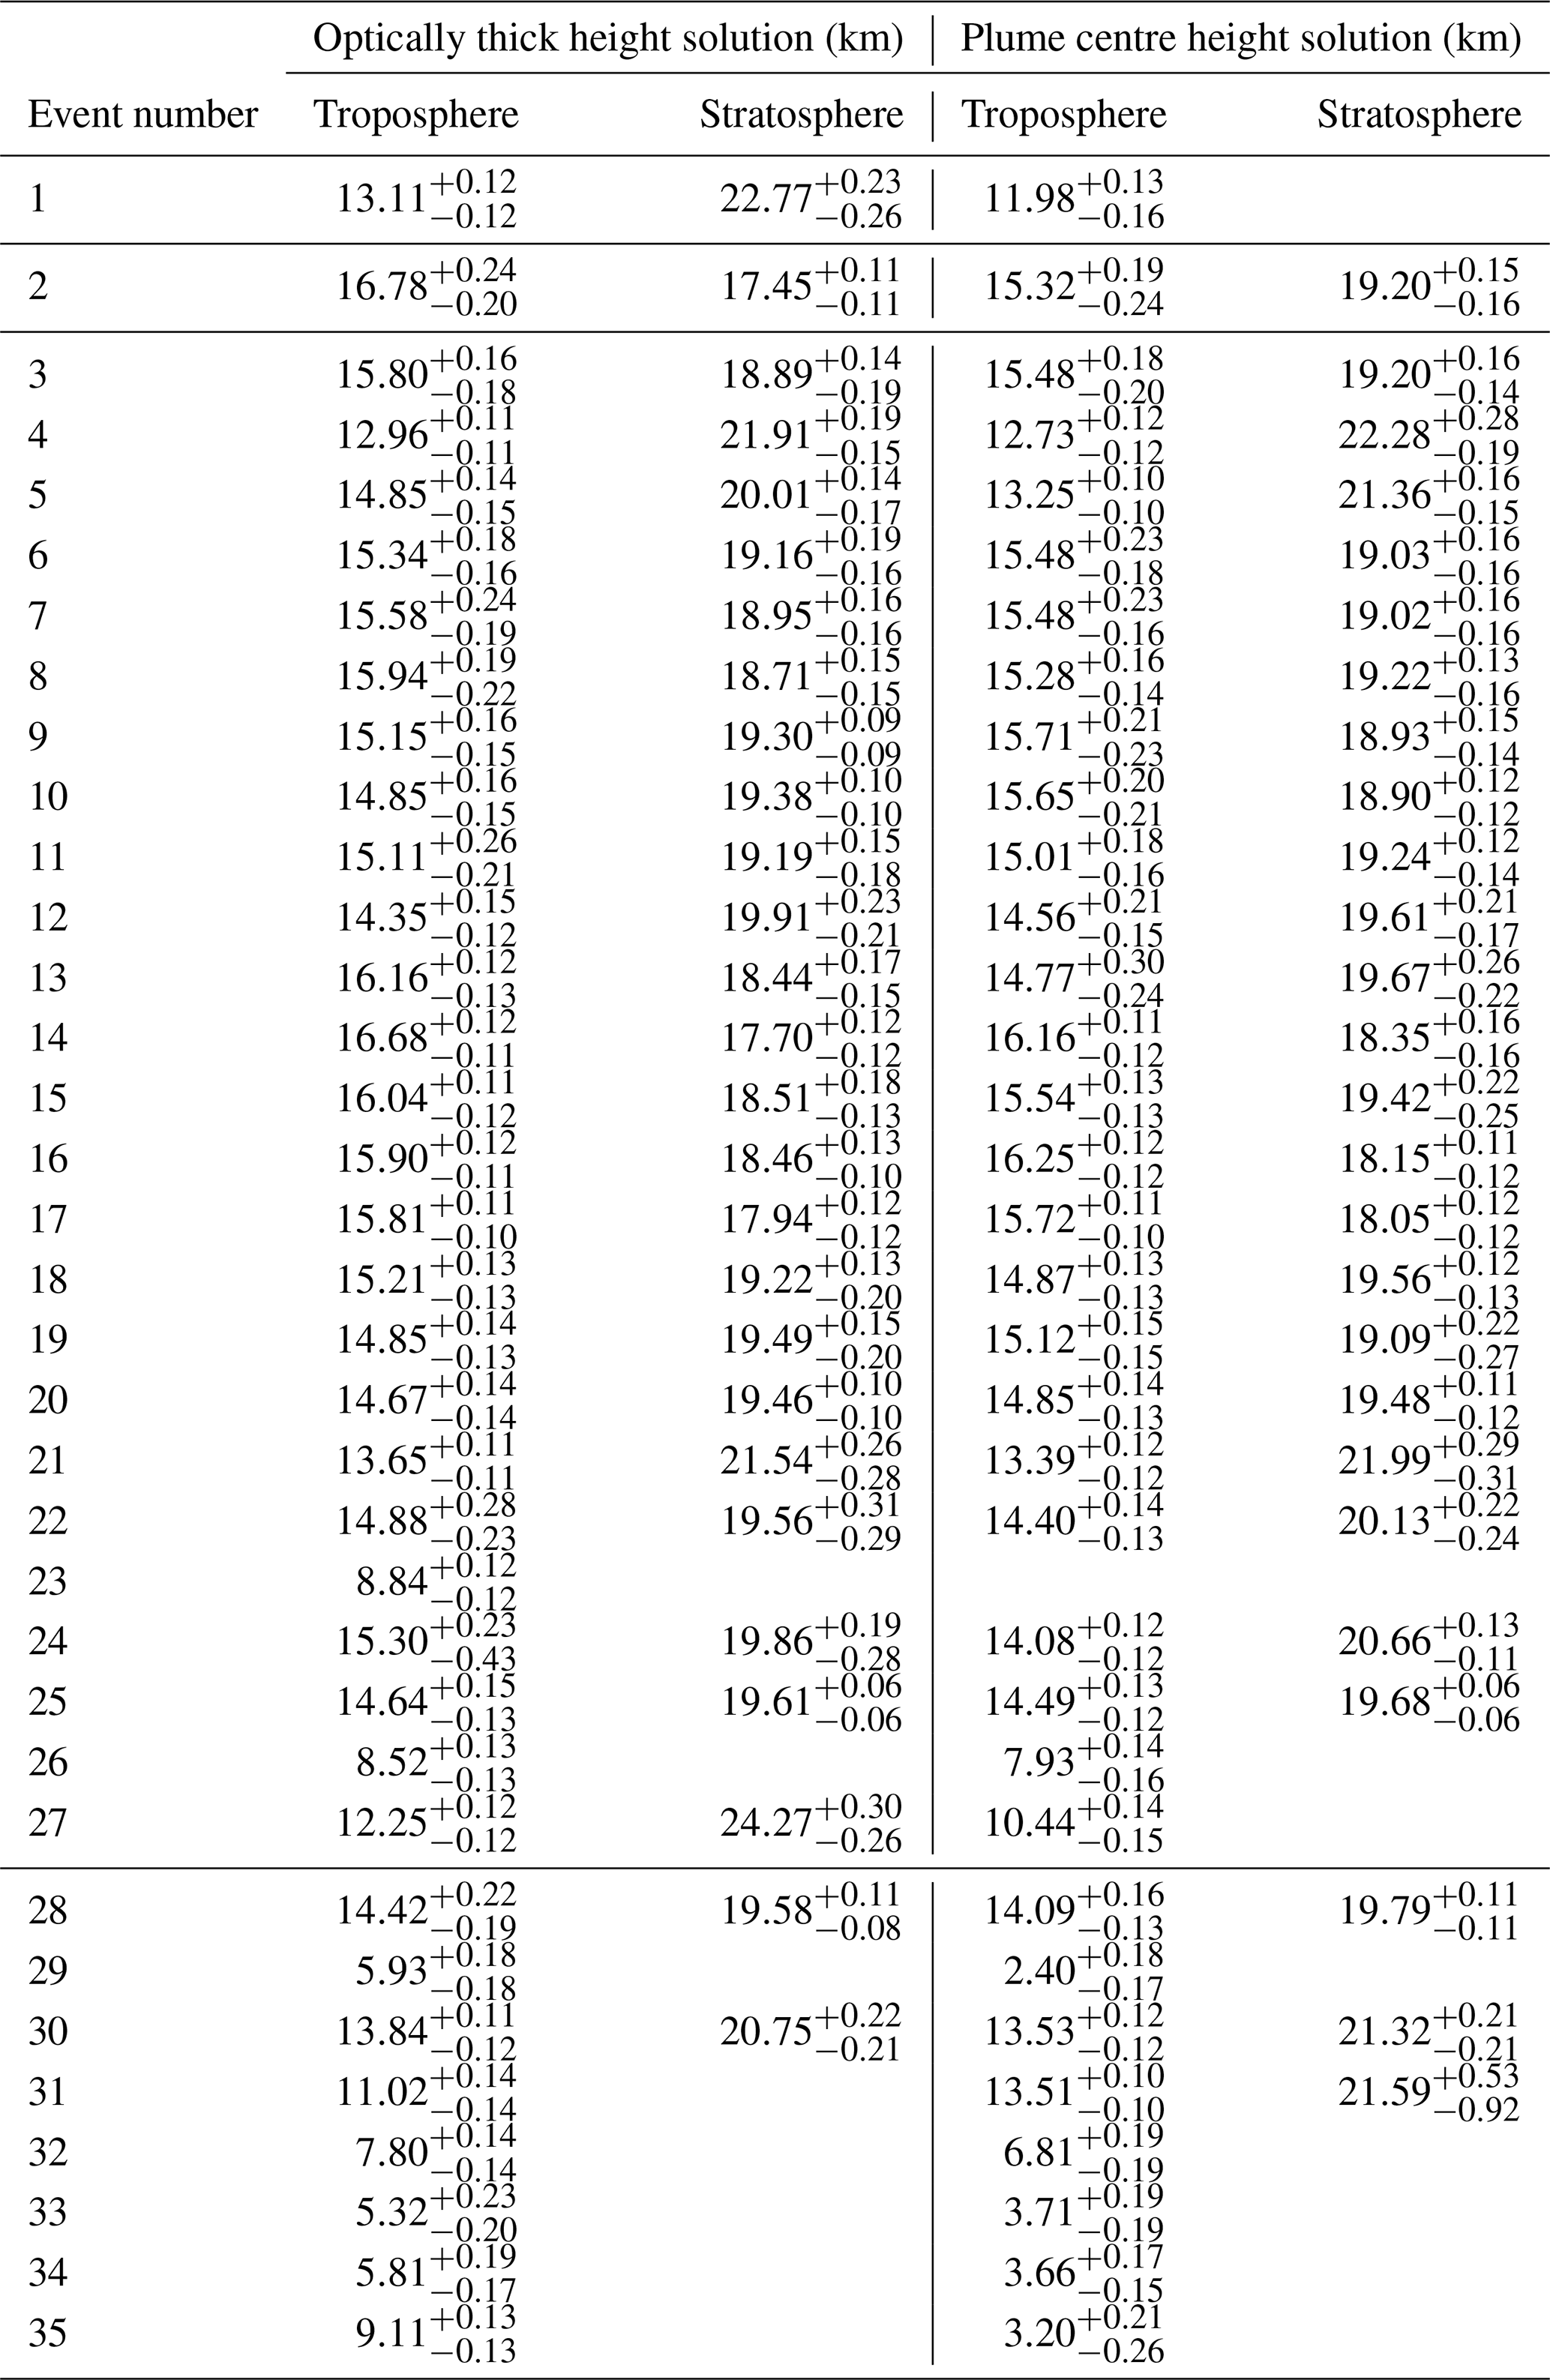
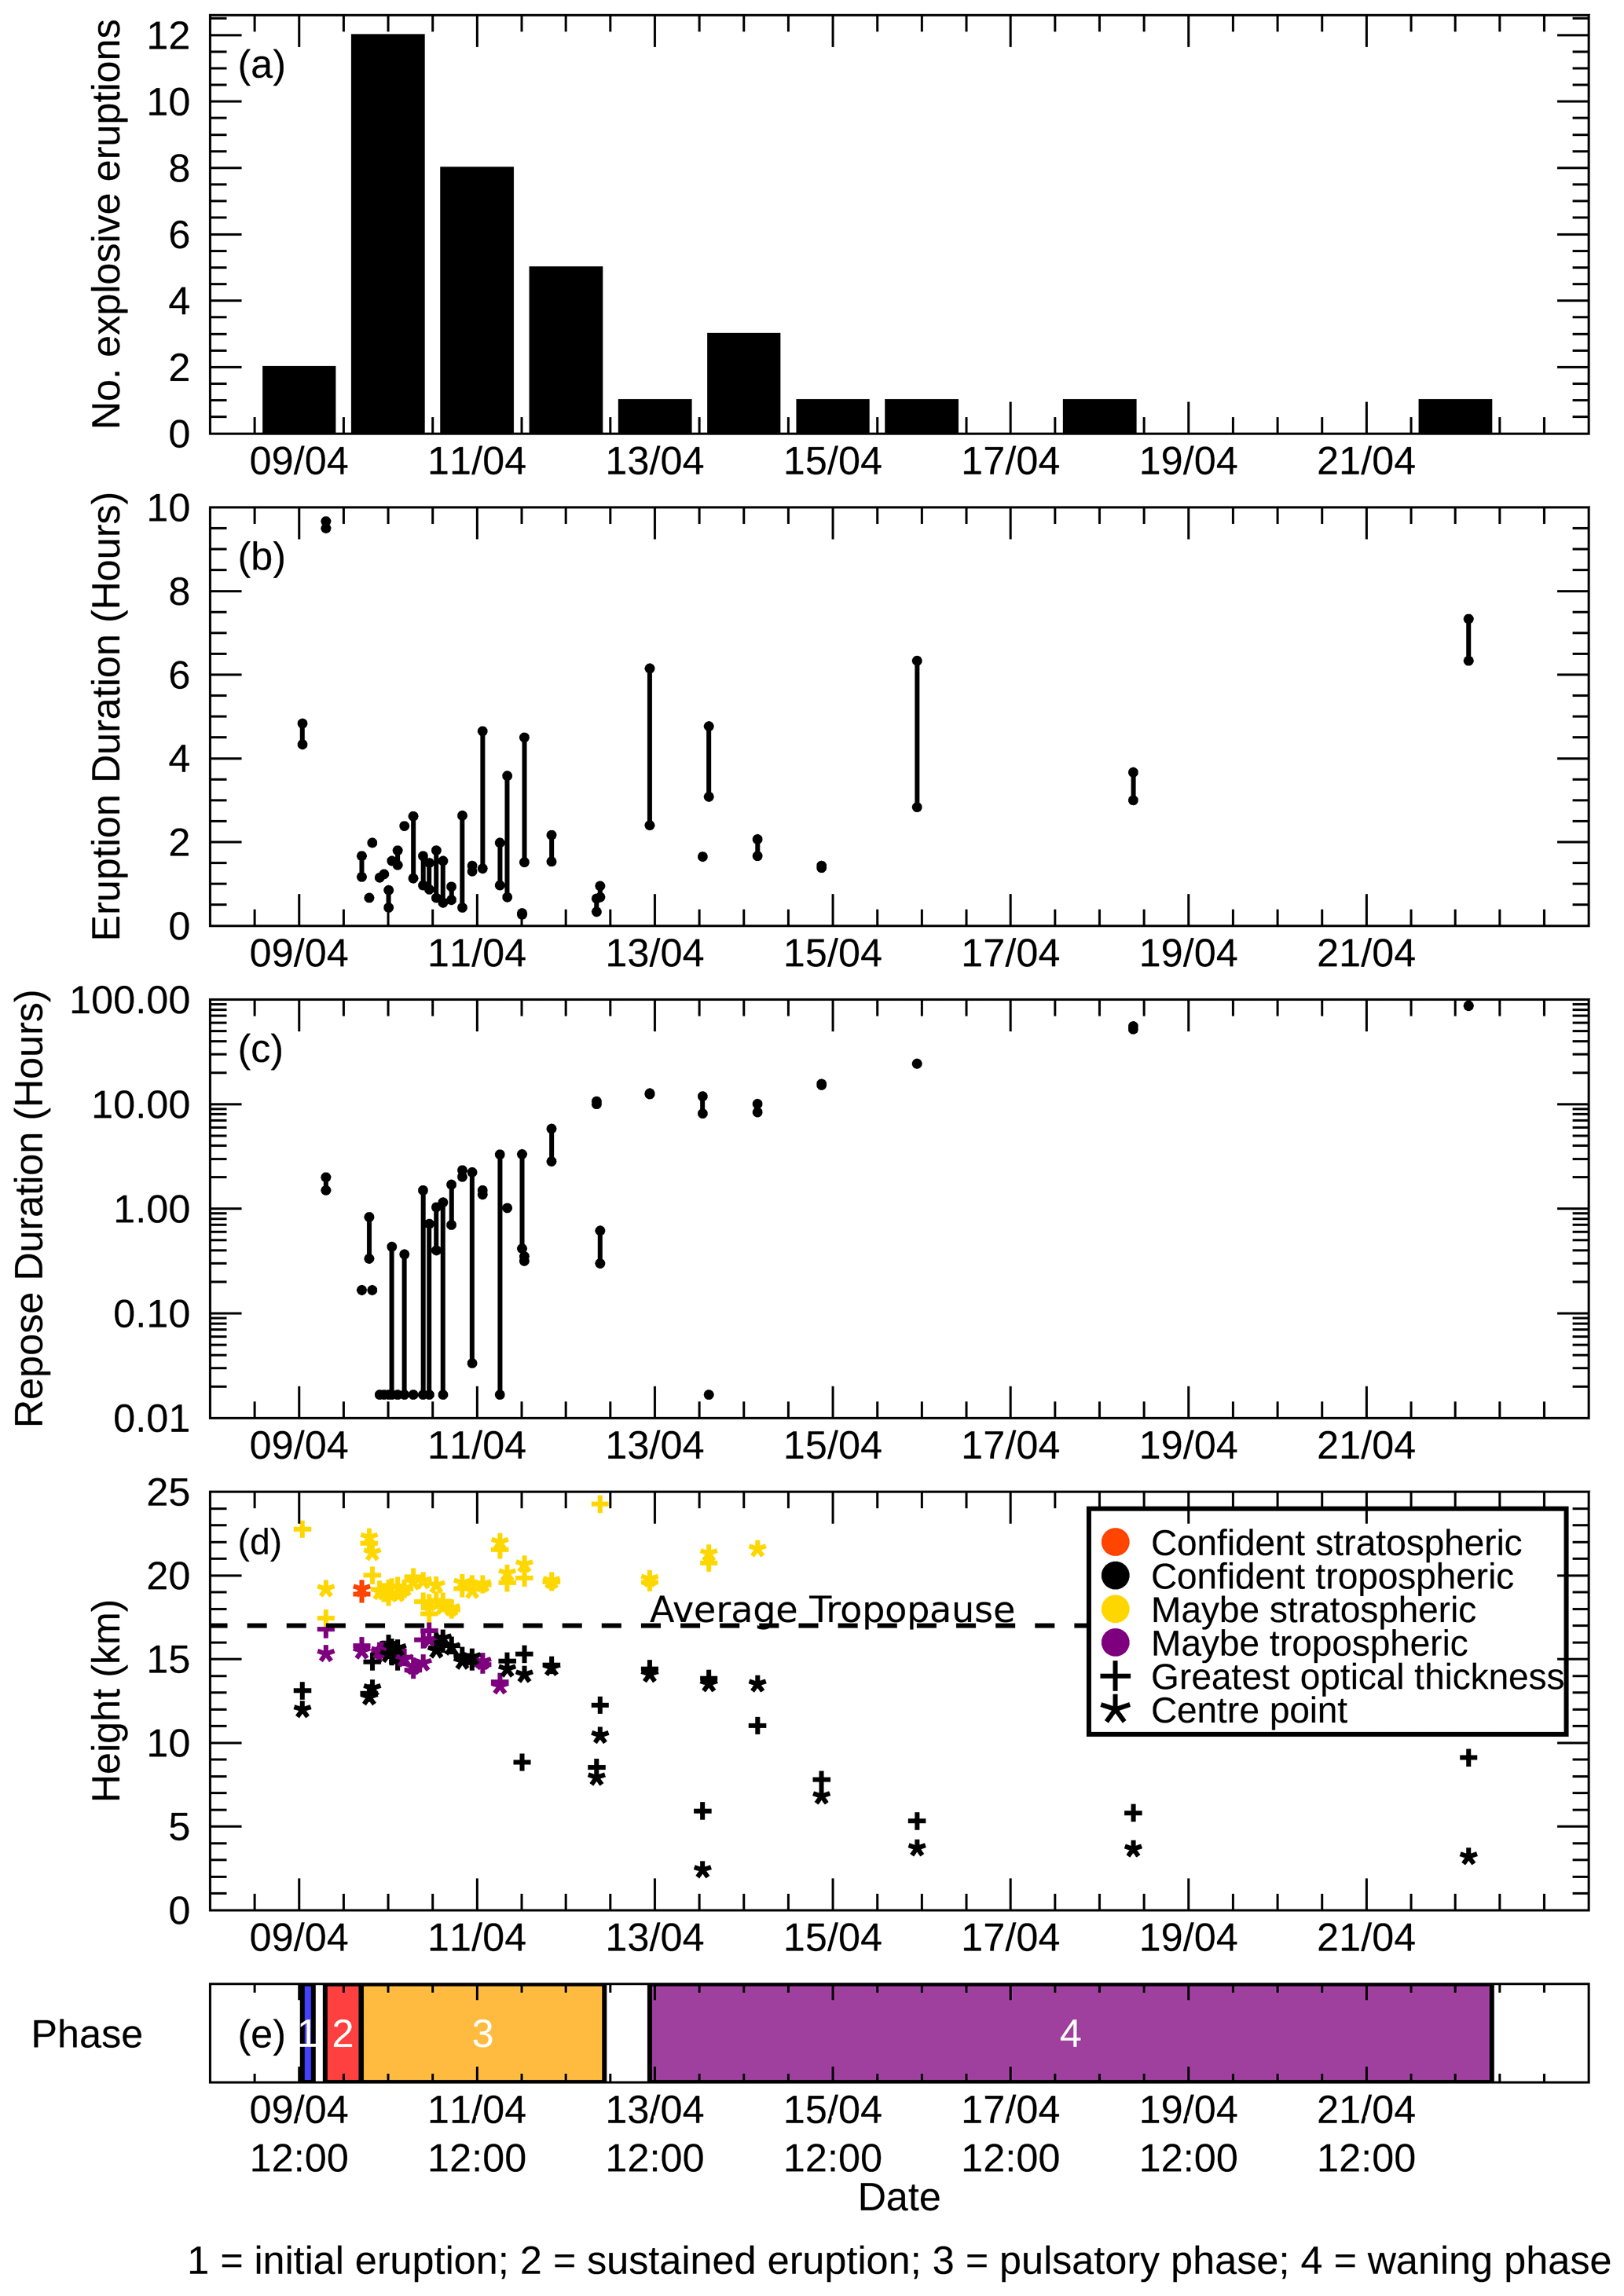
Figure 6Summary of ABI results. (a) Number of explosive eruptions on each day. (b) Duration of each explosive event. (c) Repose duration between events. (d) Heights retrieved with optically thick and centre BT methods. (e) Using the ABI data, the 2021 eruption has been divided into the four phases with the timing shown here.
The eruptive events identified from the ABI data have been split into four phases, each with distinct characteristics. The first emission (and first phase of the eruption) is likely to correspond to arrival of gas-rich magma at the surface and loss of the lava dome cap. This is seen with ABI at around 12:54 UTC (08:54 LT) on 9 April and corresponds well with the 08:41 LT (12:41 UTC) eruption start time stated in Joseph et al. (2022). Using the ABI data, this emission appears to be relatively short lived, lasting around 4.3 to 4.8 h, finishing at around 17:14–17:44 UTC (although significant cloud cover makes the end time difficult to distinguish). During this time two plumes are evident: a low-altitude plume can be seen travelling to the west from the volcano, while the main plume travels to the east–northeast, with a height of around 13.11 km based on the optically thick BT method. This is greater than the 8 km reported by the Belmont Observatory (Global Volcanism Program, 2021b). However, differences between ground-based and satellite measurements can arise for a number of reasons, including the different viewing angles and assumptions, poor visibility on the ground, the plume rising too high for the height to be accurately obtained from the ground, and different definitions of plume height (e.g. Tupper et al., 2004; Tupper and Kinoshita, 2003; Tupper and Wunderman, 2009).
Following a short pause of around 1.5 to 2 h, the second phase of the eruption started at around 19:14 UTC on 9 April. This is characterised by a sustained ash emission event with a duration of around 9.5 to 9.67 h. Height estimates based on the BT method are between 15.32 and 19.20 km. In this case, the plume direction and wind profile do not help determine whether the tropospheric or stratospheric solution is more likely. The structures of the plume suggest that there may have been some strong pulses within this sustained phase (see Table 4), but these cannot be easily resolved from the 10 min ABI images. The observations using the ABI instrument are generally consistent with those made by Joseph et al. (2022), who mention a “sustained” and “pulsing” explosive phase starting at 16:00 UTC on 9 April and finishing at 06:00 UTC on 10 April.
The explosive events identified with the ABI instrument suggest that the eruption entered a third phase at 04:54 UTC on 10 April. This phase appears more pulsatory, with a further 25 discrete ash emission events identified within a 65.3 h period. The use of the 1 min ABI data during this phase greatly helped to identify the event timings: highlighting the considerable advantage of this instrument. Joseph et al. (2022) characterise this phase as one of “ash venting”. The length of these explosive events identified from the ABI data varied from around 16 min to up to 4.65 h. This style of repetitive ash bursts is similar to the “Vulcanian” explosions documented at multiple andesite volcanoes, which is considered to reflect the rapid sealing, pressurisation and failure of magma within the conduit (e.g. Druitt et al., 2002; Watt et al., 2007; Joseph et al., 2022). The first pulse is shown to most likely be in the stratosphere with height solutions of 18.89 and 19.20 km for the optically thick and centre BT methods, respectively. The majority of the remaining pulses in this phase have been labelled as most likely tropospheric or uncertain. The height results for each event are shown in Table 5.
The fourth and final phase of the eruption, as defined with the ABI data, began on 13 April at 10:36 UTC and continued to the 22 April. During this phase there were a further eight distinct events, each lasting a few hours, with generally longer repose times than the previous phases and with each event emitting ash into the troposphere (heights between and 14.42 km). Figure 6d shows that during this phase the heights for each eruptive event fall, suggesting a decrease in eruptive power. Compared to the earlier phases, the RGB images suggest that the plumes in this waning stage are more optically thin and it is possible, especially for events 29 and 33–35, that the heights obtained are underestimates due to upwelling radiation from beneath the plume. A number of the explosive events in this phase appear to have an explosive eruption which produces a small optically thick cloud, followed by a longer emission of a less optically thick ash cloud, while the last three events consist of small plumes with ash that is optically thin. The final eruptive event emitted ash into the lower troposphere for around 6.3–7.3 h.
In contrast to this study, Horváth et al. (2022) count 49 explosive events between 9 and 22 April using the ABI data. The higher number reported by Horváth et al. (2022) is partly because they have divided event 2 (as termed in this paper) into multiple explosive events. Sparks et al. (2024) also document the sequence of eruptive events occurring during the April 2021 eruption. Their analysis is primarily based on seismic data, but they also make note of the first observation times with the ABI instrument. As expected, there are differences between the start times identified with the seismic and ABI instruments, as there is some time before the plume becomes visible with the satellite instrument. On the whole, their ABI observation times (only start time reported) agree well with the ones presented here; however, there are a few differences. Firstly, there are differences in the timings of the events: they used the 10 min full disc rather than the mesoscale data, and other differences may arise from the subjective nature of this exercise. Secondly, this study identifies some events that are not included in Sparks et al. (2024) time series, while Sparks et al. (2024) is able to split event 2 (as referred to here) into multiple events using the seismic data. Finally, Sparks et al. (2024) also identify four phases to the eruption, and while there is some overlap with the phases outlined here, there is disagreement with the timings reflecting the different datasets and metrics used.
3.2 SO2 dispersion
The linear and iterative SO2 retrievals have been applied to IASI spectra from 9 to 30 April 2021. The iterative retrieval column amounts for 9 to 26 April are displayed in Fig. . Figure 8 shows examples of the column amount and height outputs from the iterative retrieval for 10 and 11 April. Animations of the iterative retrieval column amount and height outputs for the full time period explored can be found in the Supplement along with animations showing the error outputs. The mapped results have been obtained by gridding the outputs for all three IASI instruments to a regular 0.125 by 0.125 degree grid.
Figure shows the SO2 column amounts from the iterative retrieval. In these maps it is possible to see the evolution of the La Soufrière SO2 plumes between 9 and 26 April. The plume is first apparent as a faintly elevated emission to the east of the volcano in the ascending overpass on 9 April 2021 (incorporates ascending orbits from 12:00 UTC 9 April to 12:00 UTC 10 April). A stronger signal is then visible in the descending orbits on 10 April fanning out to the east of the volcano across the North Atlantic. The general east and southeastward transport of the plume between 9 and 11 April implies that the bulk of SO2 has been emitted into the troposphere, with Fig. 4a indicating wind directions between ∼ 90–140∘ dominating in the troposphere between 8 and 17 km. By the ascending orbits on 11 April (incorporates ascending orbits from 12:00 UTC 11 April to 12:00 UTC 12 April), the plume has travelled across the Atlantic and has almost reached the western coast of Africa. The higher values for the column amounts leading back to the source reflect the frequent eruptive events that occurred over this time period. The general eastward transport of the plume is consistent with observations by Babu et al. (2022), who tracked the plume with the Ozone Monitoring Instrument. On 12 April, while the bulk of the plume is still advancing towards the east (Fig. ), a fraction of the plume travels to the south and west of the volcano. The wind directions shown in Fig. 4a imply that for southward or westward transport, either some SO2 has been emitted into the lower parts of the troposphere (less than 5 km) or more likely some SO2 has been emitted or lofted into the stratosphere. Over the next few days the plume continues to be transported both to the east and west of the volcano, and by the 21 April the plume has been transported around the circumference of the globe. Note that there is an emission of SO2 from an eruption at Sangay in Ecuador from 12 April (Global Volcanism Program, 2021d). This combines with the plume from La Soufrière, and the two cannot be easily distinguished from each other from 13 April.
Figure 9b shows the distribution of the SO2 mass with latitude. The largest concentration of SO2 (up to 17 April) is between 0 and 20∘ N, but parts of the plume have reached 45∘ north and south. This highlights the ability of tropical eruptions to transport SO2 across both hemispheres, rather than being confined to a narrower latitude band like plumes from eruptions at high latitudes (Schmidt and Black, 2022). Also highlighted in Fig. 9 is a line of elevated SO2 around 15∘ S. This is the latitude of the Sabancaya volcano (15.787∘ S, 71.857∘ W, summit elevation of 5.96 km) in Peru, which was erupting throughout the studied time period. Plumes from Sabancaya can be distinguished in the iterative retrieval maps in the Supplement.
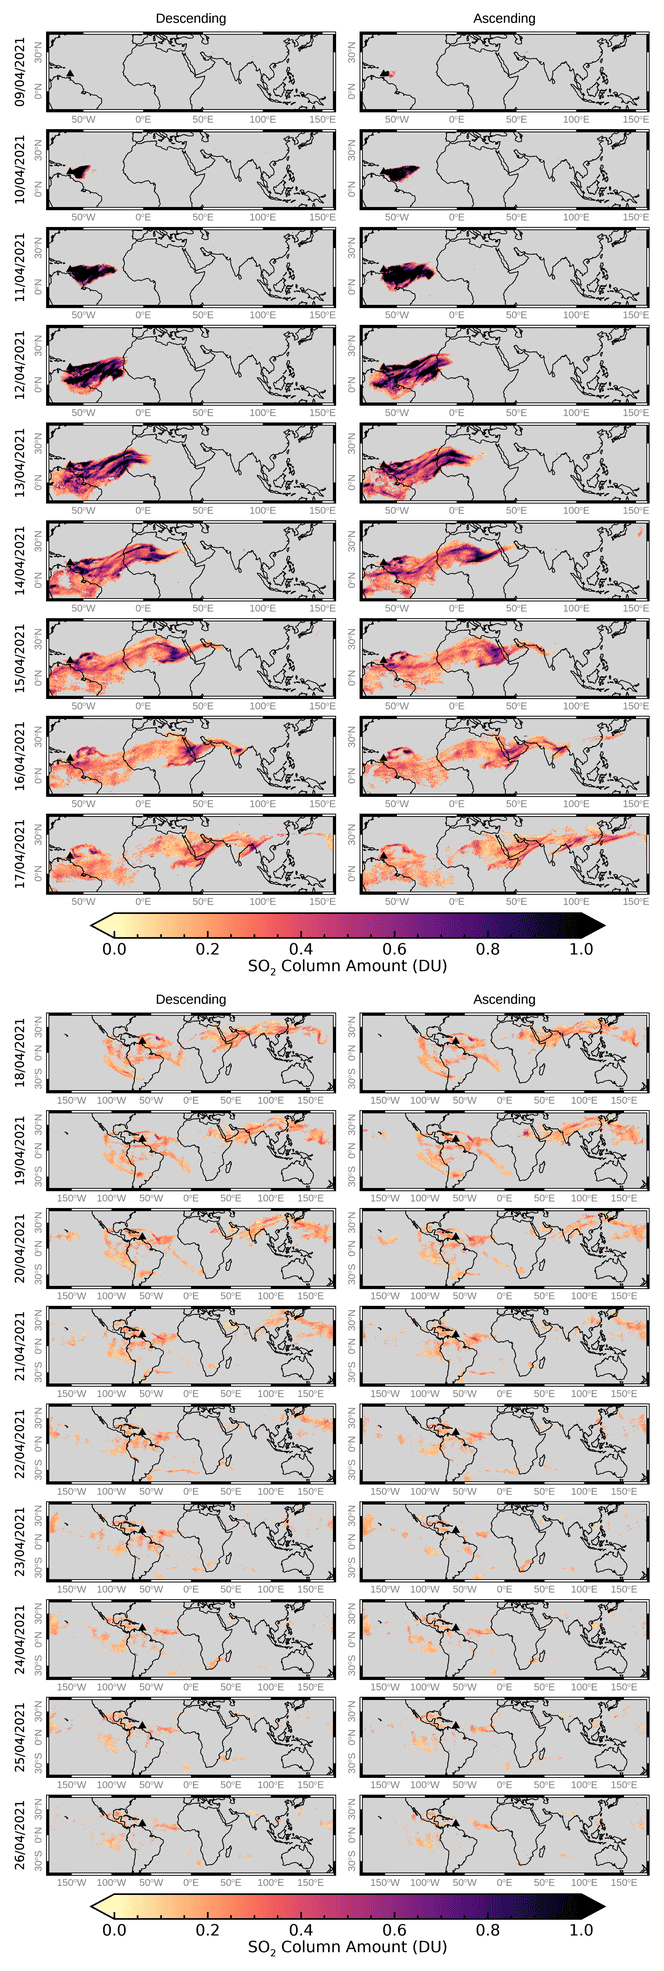
Figure 7Continued.
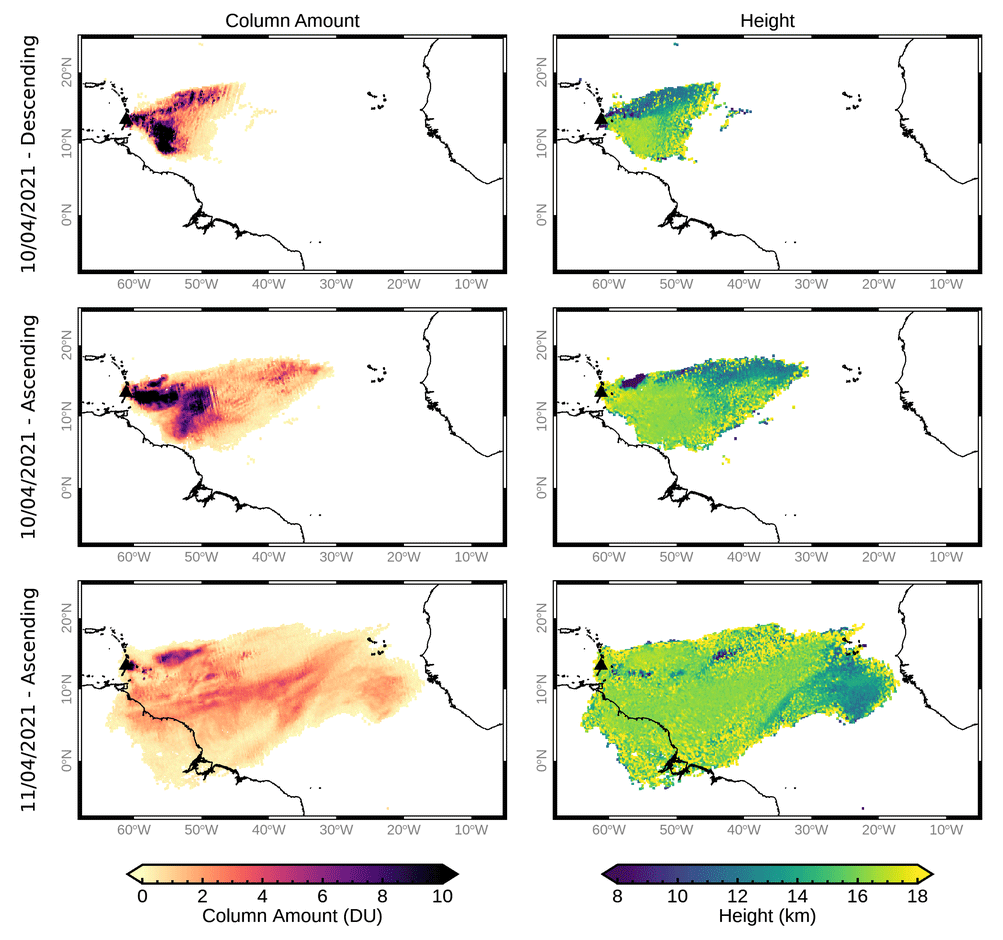
Figure 8Examples of the IASI SO2 iterative retrieval gridded column amounts and heights for scenes from 10 and 11 April 2021. The date and orbit direction are indicated on the left-hand side of the figure. Maps of the results for the entire time period studied can be found in the Supplement.
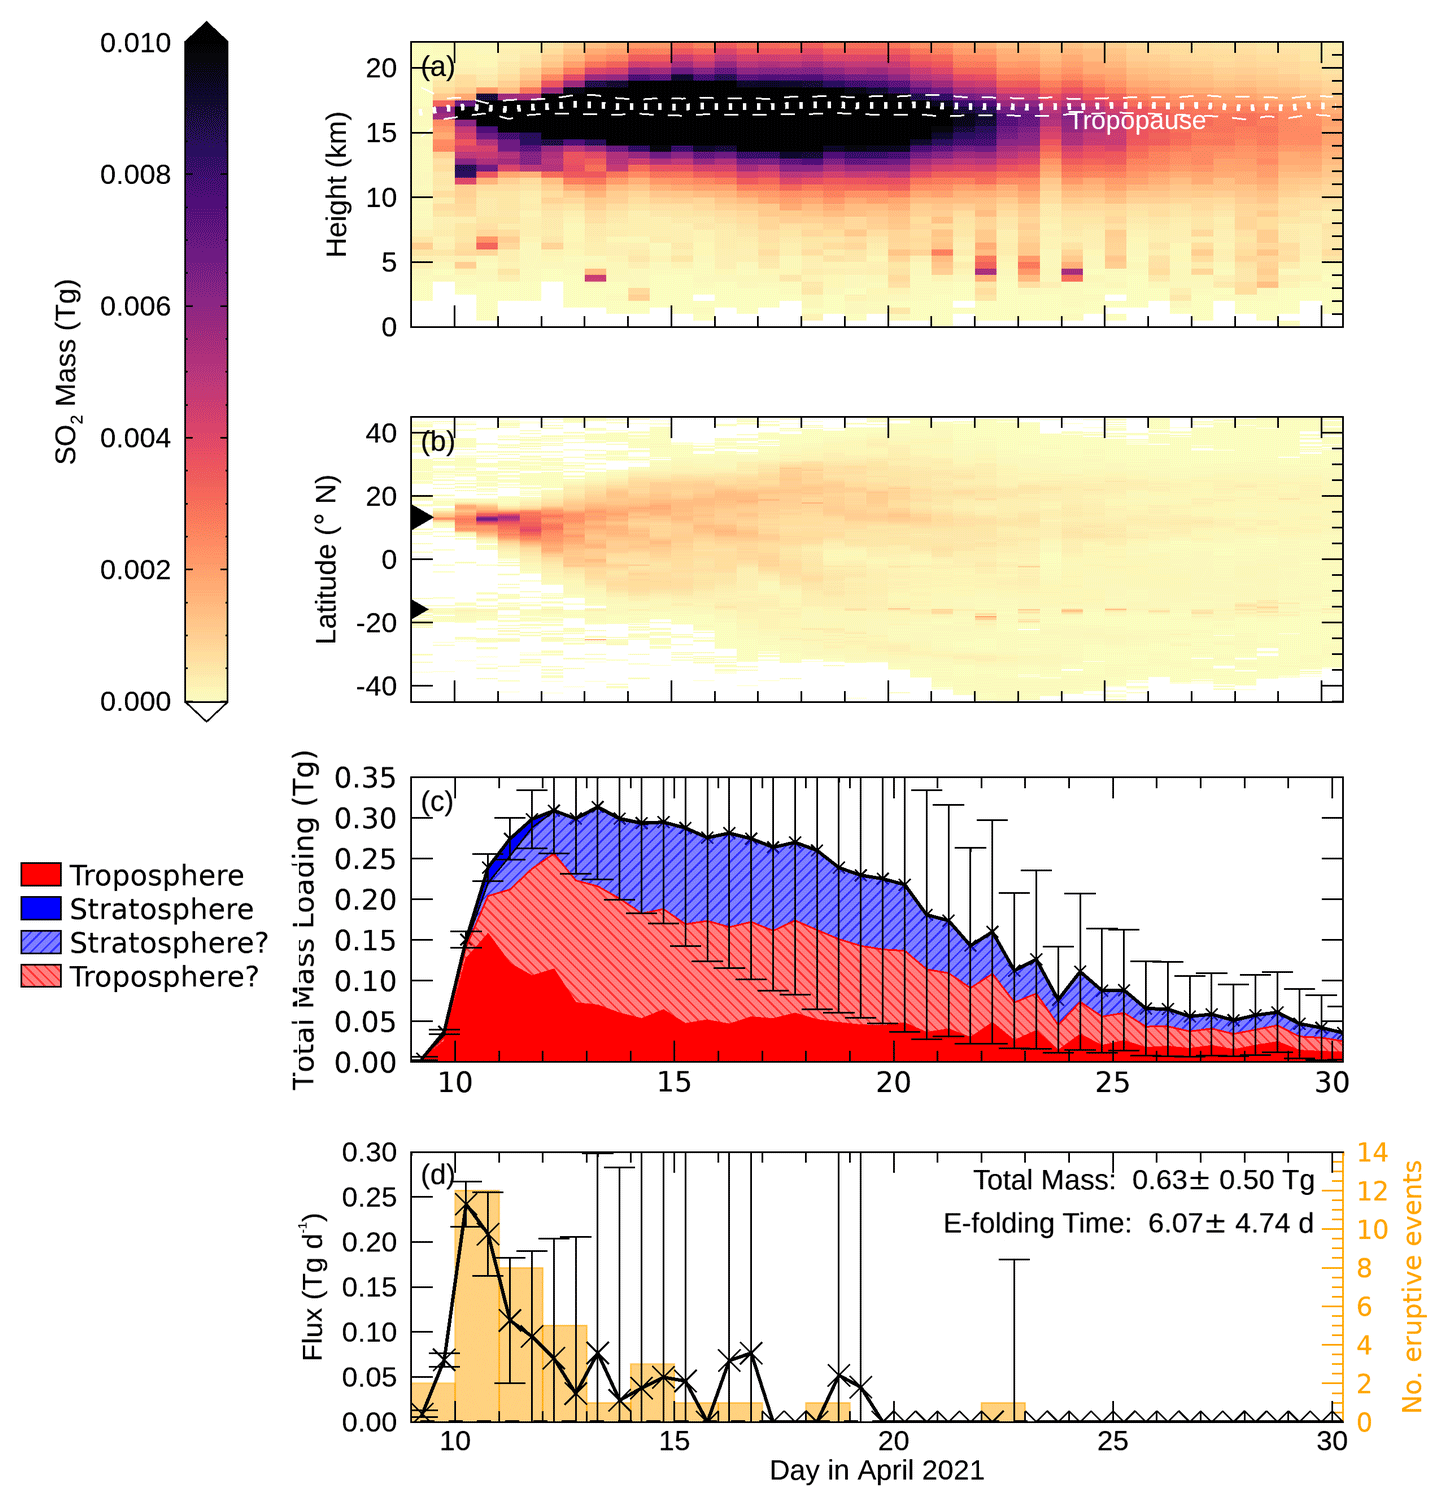
Figure 9Summary of the IASI SO2 results generated from iterative retrieval outputs for 9 to 30 April 2021. Each of these has been computed for the −45 to 45∘ N and −180 and 180∘ E region. (a) Vertical distribution of the SO2 mass across the plume with time. The dashed lines show the mean height of the tropopause and 1 standard deviation from that point. (b) Distribution of the SO2 mass with latitude. The black triangle at 13.33∘ N indicates the latitude of La Soufrière. The smaller triangle at 15.79∘ S shows the latitude of Sabancaya in Peru, which also erupted during the studied time period. (c) Time series of the total mass of SO2 with errors. Using the retrieved SO2 heights and the tropopause heights, this has been divided into tropospheric and stratospheric SO2. The height errors have also been used to create two more categories: heights that are stratospheric but given the height error could be tropospheric and heights that are tropospheric but could be stratospheric. (d) The flux of SO2 with time and the number of eruptive events identified from the ABI data on each day.
3.3 SO2 mass and flux
A total mass time series, derived from the IASI iterative retrieval output for the −45 to 45∘ N and −180 and 180∘ E region, is shown in Fig. 9c. Note that other volcanoes (e.g. Sabancaya in Peru and Sangay in Ecuador) were erupting at this time, and any SO2 from these eruptions entering the region will affect the total mass, e-folding and flux estimates. However, given that these are smaller emissions than La Soufrière, their impact is negligible and within the reported errors. The IASI-derived SO2 mass loading peaks at 0.31 ± 0.09 Tg in the descending orbits on 13 April. This is fairly small compared to other eruptions studied by IASI, including Nabro (1.6 Tg), Kasatochi (0.9 Tg), Grímsvötn (0.75 Tg), Copahue (0.72 Tg) and Sarychev (0.6 Tg) in 2011, 2008, 2012 and 2009, respectively (Carboni et al., 2016). It is more similar to the maximum mass loading recorded from Alu Dalafila (0.2 Tg) in November 2008 (Carboni et al., 2016).
The fact that the total SO2 mass loading for La Soufrière peaks a few days after the 2021 eruption began could be linked to the multiple explosive events which occurred between 9 and 13 April, leading to an increase in the total atmospheric SO2 loading: SO2 emitted at a rate greater than the existing SO2 declines. The Global Volcanism Program (2021c) reported an early satellite estimate of the SO2 mass of 0.4 Tg on 10 April: larger than the estimate from IASI on the same day 0.24±0.02 Tg, ascending result). Differences between instruments and retrievals are expected due to the varying sensitivities to SO2, different height assumptions, the differing effects of volcanic ash and aerosols, and different spatial resolutions and observation times. Carn et al. (2016), for example, note that there are often differences between the results from UV and infrared sensors. As mentioned in Sect. 2, the IASI iterative SO2 retrieval column amounts, and subsequently the total masses, are affected by volcanic ash and instrument sensitivity, and thus the column amounts and total mass values presented here should be considered minimum estimates.
From 13 April the total mass of SO2 is shown to fall as the SO2 is removed from the atmosphere through deposition by conversion to sulfate aerosol or dilution below the detection limit of the instrument. The e-folding time used here (see Sect. 2.1.3) describes this loss process. This varies with a number of factors including the latitude of the volcano, the injection height of the plume, meteorological conditions, cloud cover, water vapour, season and the presence of ash (Carn et al., 2016; Zhu et al., 2020, 2022; Schmidt and Black, 2022). Typically, the e-folding time varies from hours to days in the lower troposphere to weeks in the stratosphere. A first estimate of 5.47 d for the SO2 e-folding time was estimated by fitting Eq. (1) to the IASI total SO2 masses between 23 and 30 April 2021. Following the application of the Carboni et al. (2019) method to compute the flux and average e-folding time, the average e-folding time was adjusted to 6.07±4.74 d. This is in line with other eruptions including Jebel at Tair (2007) and Merapi (2010), both of which are located in the tropics, emitted plumes between 15 and 18 km, and had e-folding times of between 2 and 4 d (Carn et al., 2016). Given that there was ash emission during the La Soufrière eruption, it is possible that the e-folding time could have been reduced as a result of accelerated oxidation of SO2 due to reactions on the ash surface, as was seen for the Kelut eruption in a study by Zhu et al. (2020). Some of the SO2 emitted during the La Soufrière eruption was converted to sulfate aerosol, as is shown in Babu et al. (2022) and Bruckert et al. (2023).
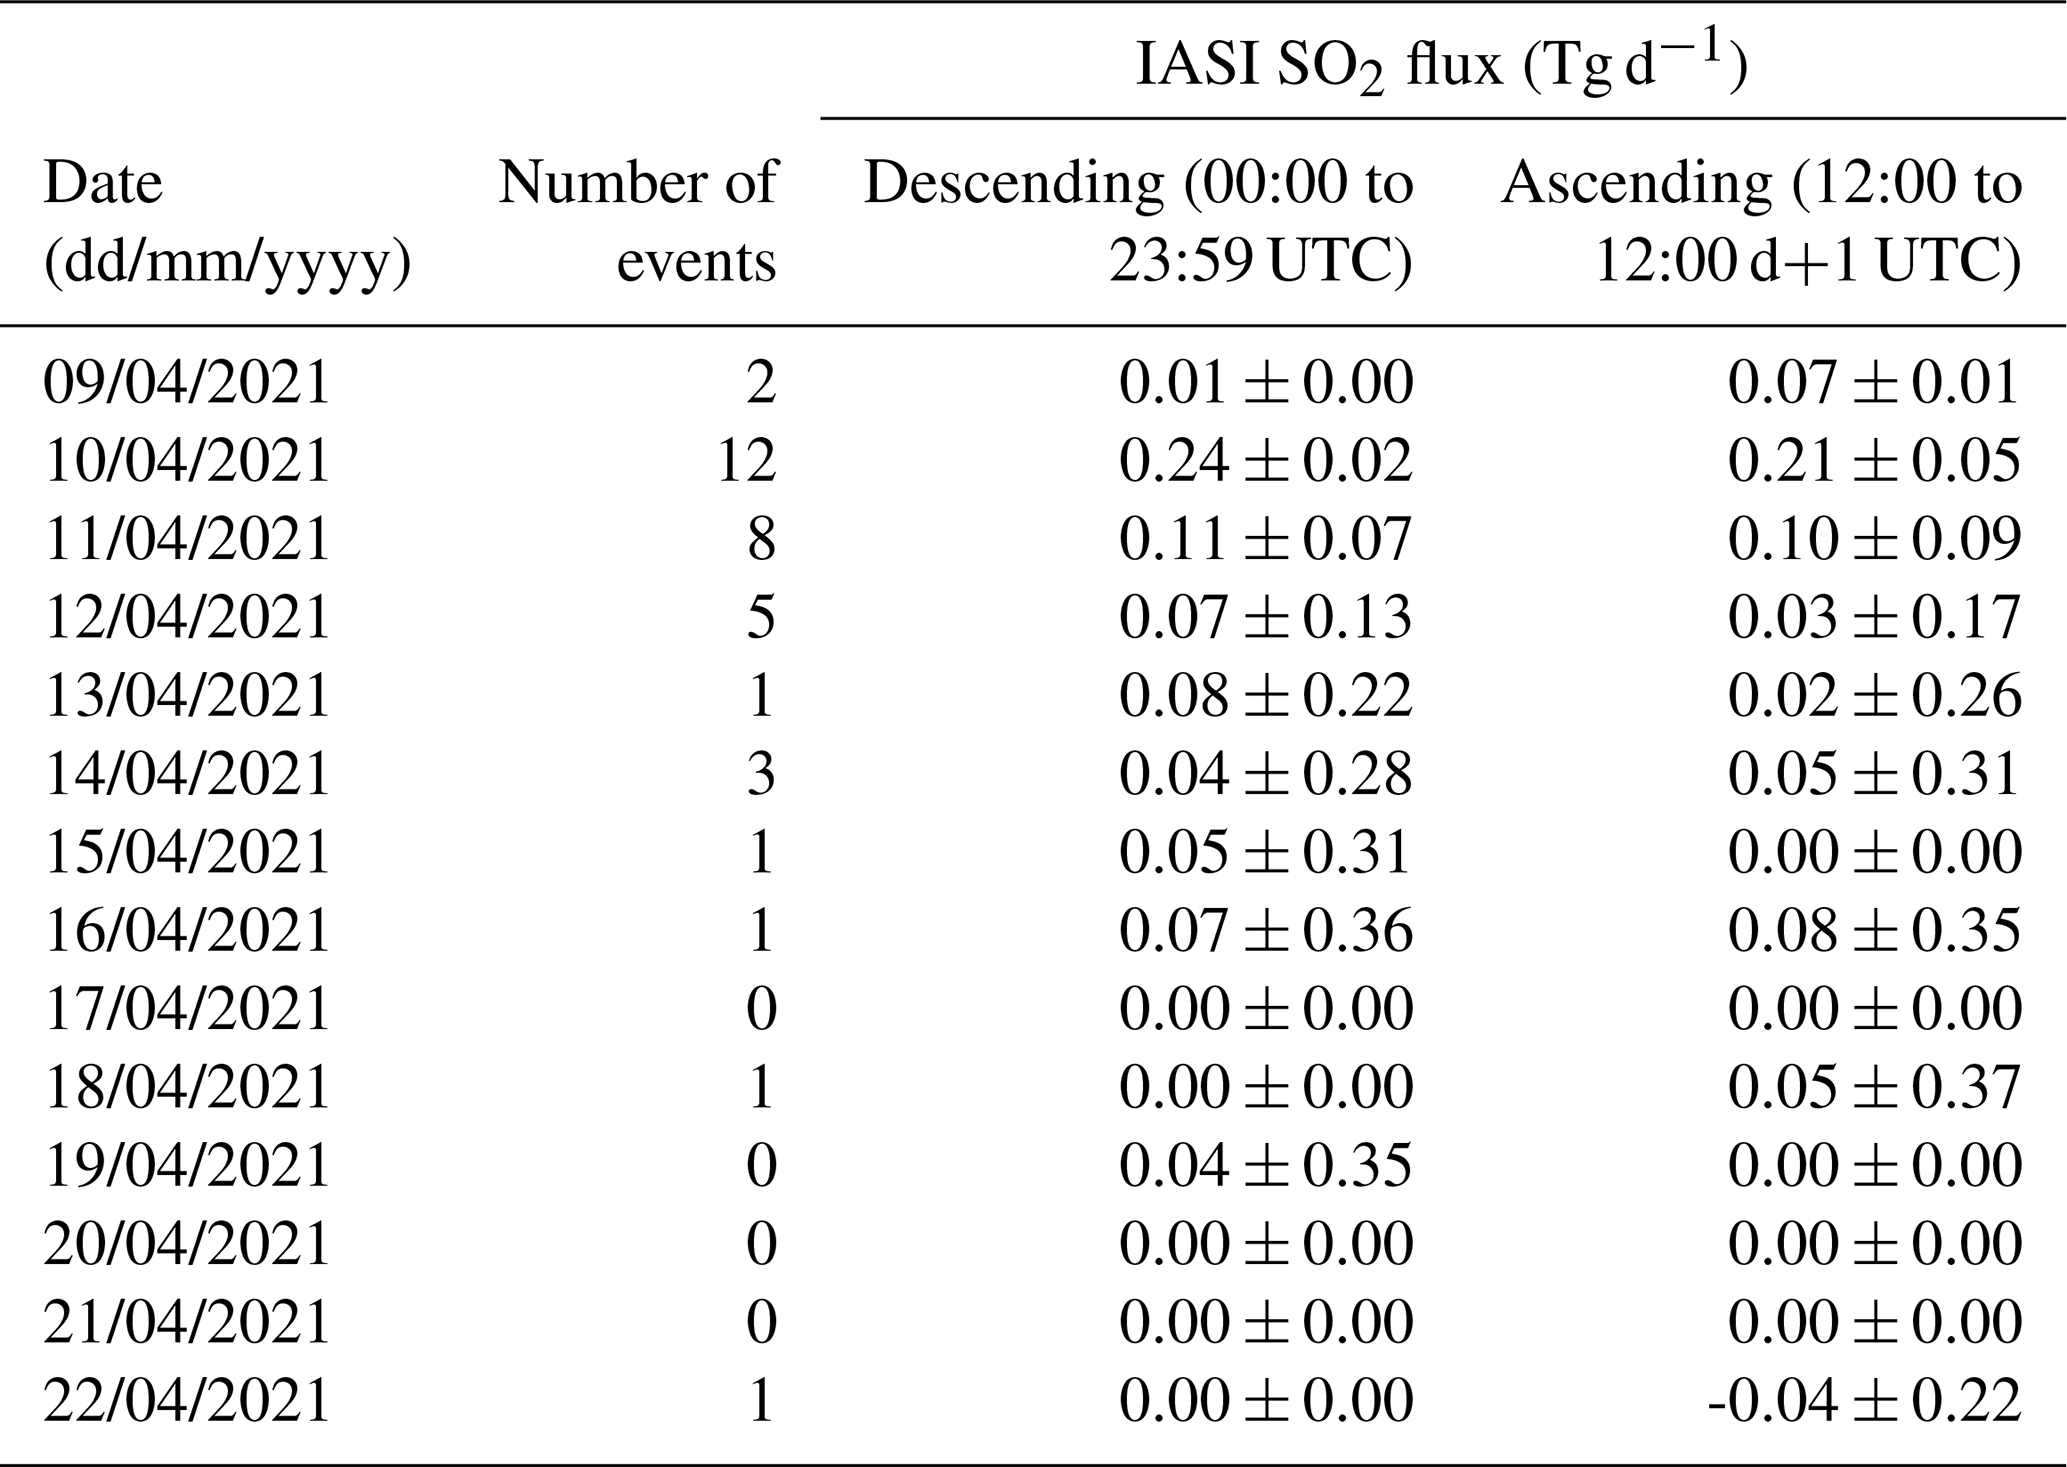
The SO2 masses from IASI were converted to flux estimates following the method described in Sect. 2.1.3 (note that underestimates in the total masses may affect these results). The daily SO2 fluxes computed from the IASI results are shown in Fig. 9d along with the number of explosive events which started on each day as determined with ABI data. Both are also reported in Table 6. There is generally a good correspondence between the number of eruptive events and the SO2 flux. The greatest flux (0.24±0.02 Tg d−1) from the IASI data occurs on 10 April in the descending overpasses which incorporates the second eruptive phase (sustained emission), and the beginning of the pulsatory phase. Following this, the SO2 flux derived from IASI data is shown to decrease over the third eruptive phase that ends on 12 April. The flux on 12–13 April may incorporate some of the SO2 emitted by Sangay in Ecuador. The flux remains low for the final phase of the eruption and no emission is visible following the eruption on 22 April. These fluxes agree reasonably well with the flux range reported in Joseph et al. (2022), which varied between 2.76×10⁵ t d−1 (0.276 Tg d−1) on 10 April to 331 t d−1 (0.0003 Tg d−1) on 22 April.
By summing the retrieved IASI SO2 fluxes and multiplying by the time step between the images (assumed to be 12 h) it is estimated that in total this eruption emitted 0.63±0.5 Tg of SO2. The error is likely to be overestimated due to the way in which the total mass errors are computed (see Sect. 2.1.2). An alternative way of computing the minimum and maximum total emitted SO2 is to add and subtract, respectively, the flux and error for each time step and then multiply by the time step rather than sum the errors in quadrature. This gives a minimum and maximum estimates of the total SO2 mass of 0.24 and 2.43 Tg, respectively.
Table 6Number of eruptive events identified with ABI and IASI SO2 fluxes for 9 to 22 April 2021. Note that these estimates may be affected by other volcanoes that erupted during this period.
3.4 SO2 plume heights
Examples of the iterative retrieval height results are shown in Fig. 8. The heights in the descending orbits on 10 April are variable. The heights in the northern edge of the plume (mostly 10 to 13 km, some less than 10 km) are lower than the rest of the plume. The southern part of the SO2 plume is higher, primarily between 13 and 18 km, and in some cases exceeds this. Similar structures can be seen in the following few days. There is no obvious gradient to the heights in the upper part of the plume as can be seen in IASI SO2 height measurements shown in the supplementary material of Koukouli et al. (2022) for 10 and 11 April (using the Clarisse et al., 2014 method). Koukouli et al. (2022) show heights increasing from south to north of the plume, which matches well with the wind directions shown in Fig. 4a. The IASI retrieval used here relies on temperature and water variations in the atmosphere, which do not vary as significantly around the tropopause and may affect the results. Multiple retrieval setups were explored (including varying the retrieval first guess height and varying the plume thickness), but the results were similar in each case. Nevertheless, there is a broad agreement with Koukouli et al. (2022), which reports average heights of 15.7±1.16 km for IASI using Clarisse et al. (2014) retrieval and 14.94±3.87 km from TROPOMI (Hedelt et al., 2019 method) (note that these averages are based on a subset of the plume). Additionally, there is agreement with the 13 to 15 km injection heights obtained by Esse et al. (2024) using backwards trajectory modelling. The IASI SO2 heights are also generally consistent with ash height estimates reported in Global Volcanism Program (2021b) bulletin report. However, it should be noted that SO2 and ash are not always co-located spatially, temporally or in height (e.g. Holasek et al., 1996b; Thomas and Prata, 2011; Moxnes et al., 2014; Prata et al., 2017). The IASI results presented here are similar to observations made by the Multi-angle Imaging Spectroradiometer (MISR) onboard the Terra satellite (Yue et al., 2022). Results from this instrument on 10 April showed that there are multiple layers of ash, with two primary layers at 12 and 18 km and some parts of the plume reaching 20 km (Yue et al., 2022). Horváth et al. (2022) analysed 30 of the eruptive events using the ABI side view and found that most of the plumes rose to around the height of the tropopause (16 to 17 km) or entered the lower stratosphere (18 to 20 km). They also reported the heights of the overshooting tops, which went up to 23 km for the largest explosive events. Finally, there is agreement the IASI SO2 heights here and those from the Cloud-Aerosol Lidar with Orthogonal Polarization (CALIOP) and ICON-ART model that show a volcanic plume layer between 15 and 20 km on 13 April (Bruckert et al., 2023).
The IASI results show that the structures within the plume evolve as the plume stretches across the Atlantic, with the higher values (15 to 17 km) making up the majority of the image. Note that over time there appears to be more speckle in the height results (see animation in the Supplement), which reflects increased uncertainty. The variations in height across the entire SO2 plume are likely to be linked to the multiple injection heights and pulses which occurred during the earlier eruptive events, as discussed in Sect. 3.1. The lower heights obtained from the ABI data and mentioned in the Global Volcanism Program (2021b) bulletin report, for the later stages of the eruption (e.g. 14–22 April), are not reflected in the IASI results. This is potentially because the retrieval has been setup in a way that is optimised for higher plumes, the fact that these eruptive events emitted less SO2 (below the detection limit of the retrieval) or due to multiple layers of SO2.
The evolution of the vertical distribution of the SO2 mass across the plume is shown in Fig. 9a. This is computed from the gridded column amounts (converted to mass values) and the gridded heights for each day (descending and ascending). On 10 April, SO2 is shown to be emitted at multiple heights: a smaller emission between 11 and 13 km and a larger quantity between 15 and 18 km. The lower layer largely disappears within 3 d. Between 12 and 18 April the SO2 mass is shown to be spread over 13 to 19 km. Lines showing the average tropopause height and one standard deviation from this are displayed in Fig. 9a. This was estimated based on the World Meteorological Organisation's (WMO) definition of the tropopause, i.e. that the tropopause occurs at the lowest level where the temperature lapse rate falls beneath 2 K km−1 for at least 2 km. Note that this is computed from the tropopause heights for the pixels containing SO2 and where the iterative retrieval output passes the quality control: this means that the number of pixels used in this calculation varies over time. Much of the SO2 appears to be in the upper troposphere and around the height of the tropopause, which supports the observation made by Carboni et al. (2016) that SO2 from explosive eruptions often ends up at the tropopause. This observation is consistent with the direction of travel of the plume (to the east) and the wind direction at these heights (which has an easterly direction in the upper troposphere and around the tropopause, Fig. 4a). A fairly persistent lower layer of SO2 can be observed between 3 and 7 km. Some of this can be attributed to emissions at Sabancaya volcano in Peru. From 19 April a layer can also be observed at 14 to 14.5 km. This is around the height of the a priori and so is most likely due to a loss of height information in the IASI spectra as the plume thins.
Figure 9c shows the fraction of SO2 which has been categorised as either tropospheric or stratospheric. Note that this has been calculated on a pixel-by-pixel basis using the height of the tropopause. Also shown in this plot is the degree of uncertainty with regard to the height of SO2 relative to the tropopause. Figure 9c highlights that a fraction of the SO2 mass which while classified as stratospheric could in fact be tropospheric when the height errors are considered. Similarly it shows that the fraction of the mass classified as tropospheric which could be stratospheric. In general it appears that there is a larger amount of SO2 in the troposphere. For example, in the descending orbits on 13 April, 68.88 % and 31.12 % of the SO2 was shown to be in the troposphere and stratosphere, respectively. However, based on the error bars, 67.78 % of the tropospheric result could also be classed as stratospheric given the overlap of the error bars with the tropopause height, and 98.65 % of the SO2 classed as stratospheric could be tropospheric.
There are a number of similarities between the 1979 and 2021 eruptions at La Soufrière. Shepherd et al. (1979) give a detailed account of the eruptive sequence for the 1979 eruption and report a series of explosive eruptions between 13 and 26 April 1979, with the first explosions occurring from within a water-filled summit crater lake. In the first few hours after the eruption began on 13 April 1979 (09:30 to 15:00 UTC), continuous emissions of steam were punctuated with explosive eruptions producing ash clouds that reached greater than 8 km (Shepherd et al., 1979). This activity was followed by a series of six explosive events with varying durations between 20:05 on 13 April and 15:50 on 14 April. Estimates from satellite data on 13 and 14 April give ash heights of 17 to 18 km for two of these plumes (Shepherd et al., 1979). Following this, between 14 and 17 April, the volcano entered a new phase with only occasional ash emissions rising 1 to 2 km above the vent. Another explosive event occurred on 17 April with ash emissions reaching 18.7 km. Following this, the intensity of activity generally declined, although two more explosive events occurred on 22 and 26 April (Shepherd et al., 1979). By the end of the 1979 explosive sequence, the crater had been infilled with pyroclastic debris, and the summit lake had disappeared. The 2021 explosive eruption sequence shares a number of similarities with the 1979 eruption, even though the early stages of the 2021 eruption were rather different, i.e. 3 months of dome effusion into a “dry” summit crater. Both the 1979 and 2021 eruptions consisted of a series of explosive events and both had a pulsatory phase in the first few days after the start of the eruption. However, it is notable that a larger number of discrete events occurred during the 2021 eruptive period. The later eruptive events in both the 1979 and 2021 eruptions also had a longer repose time.
Another similarity between the 1979 and 2021 eruptive periods is the plume height. Measurements of the 1979 heights were far sparser, with estimates coming from relatively infrequent satellite data, ground- and ship-based observations, and aircraft observations. As mentioned above, Shepherd et al. (1979) gives height estimates for individual eruptive events ranging between 8 and 18.7 km, similar to the heights reported here for the April 2021 eruption. This is similar to this study, which reports a fairly wide range of heights for the 2021 eruption. Krueger (1982) used SMS-1 satellite data to estimate that part of the plume exceeded 18 km, placing it in the stratosphere. Another study using an airborne lidar by Fuller et al. (1982) showed layers of ash between 16 and 19.5 km. These heights for ash are in a similar range to those for SO2 reported in this study, although again the difficulty of using ash as a proxy for SO2 is noted. While both Krueger (1982) and Fuller et al. (1982) indicate that parts of the plume reached the stratosphere, it is possible that there was significant variability across the full extent of the plume that was unmeasured, and so it is difficult to quantify how much of the plume was tropospheric and stratospheric for the 1979 eruption.
A significant difference between the two eruptions is the quantity of SO2 observed by satellite instruments. The 1979 eruption of La Soufrière is one of the first observations of volcanic SO2 made by the Total Ozone Monitoring Instrument (TOMS), but elevated emissions were only seen on 2 different days (Carn et al., 2003). In total, only ∼ 3 kt of SO2 was measured with TOMS (Carn et al., 2016), which is substantially lower than the estimates reported here from IASI for the 2021 eruption. Carn et al. (2016) indicates that the TOMS SO2 estimate is only a fraction of the total emitted with Scaillet et al. (2004), obtaining a total sulfur mass of 0.46 Tg based on petrological methods (∼ 1 Tg SO2; Carn et al., 2016). Carn et al. (2016) suggests that the majority of sulfur emission may have been in the form of H2S, with slow oxidation preventing SO2 detection with TOMS. It is also possible that part of the low SO2 mass estimate from TOMS could be attributed to the lower resolution of the instrument compared to the satellite instruments observing the 2021 eruption.
This study has used satellite data to gain insights into the chronology of events and the various emissions of ash and SO2 during the April 2021 eruption of La Soufrière. Using data from ABI it is possible to identify the emission of ash, and in this study the instrument's high temporal resolution (up to 1 min) was used to identify and characterise different phases of the April 2021 La Soufrière eruption. Careful examination of true- and false-colour images and BTD maps allowed the identification of the start and end times of 35 explosive events that took place during the eruption; however, this should be considered a minimum estimate. Based on these observations, the following four eruptive phases have been identified: (1) an initial explosive event producing an ash cloud; (2) a strong and sustained ash emission lasting several hours and producing a large optically thick ash cloud; (3) a pulsatory phase with 25 discrete explosive events in a 65.3 h period, varying in duration between 16 min and 4.65 h, each producing optically thick ash clouds; and (4) a waning phase with eight eruptive events with lower plume heights, optically thinner ash clouds, and greater durations between explosive events.
Measurements with retrievals developed for the IASI satellite instrument were able to track the plumes of SO2 from the 2021 La Soufrière eruption for several weeks after the first eruption occurred. A peak value of 0.31 ± 0.09 Tg was obtained for the total SO2 mass burden on 13 April. However, it is likely that this is an underestimate due to the effects of volcanic ash on the results and the presence of SO2 below the detection limit of the instrument. Using the daily IASI SO2 fluxes it was possible to estimate the total emission of SO2 to the atmosphere, which was 0.63±0.5 Tg with an upper and lower limit of 2.43 and 0.24 Tg, respectively (considering the full extent of the uncertainties on each day). Again, due to the potential underestimation of the mass, these should be considered minimum estimates. The retrieved heights show interesting structures in the plume that reflect the multiple eruptive pulses; this is consistent with observations on the ground and made by other satellite instruments. The height results suggest that the majority of SO2 was emitted into the upper troposphere and lower stratosphere, with most of the gas being concentrated between 13 and 19 km.
The 2021 eruption showed some remarkable similarities with the 1979 eruption in terms of both the height and the eruptive sequence. This emphasises the importance of studying these eruptions, utilising as many data sources as possible, in order to better understand the volcano and the character of its eruptions so as to be better prepared for future eruptive events (e.g. Joseph et al., 2022; Barclay et al., 2022).
GOES-16 satellite data are available through NOAA's Big Data Program (https://www.noaa.gov/information-technology/open-data-dissemination; NOAA, 2022). The IASI level 1c data are available from EUMETSAT (EUMETSAT, 2009a). The meteorological profiles used in this study are from ECMWF. The IASI level 1c and ECMWF data were accessed at the Centre for Environmental Data Analysis (CEDA) (EUMETSAT, 2009b, 2014, 2021; European Centre for Medium-Range Weather Forecasts, 2021, 2012). The IASI SO2 results for each orbit are available at https://doi.org/10.5285/b80870de014a43a498fc2684e78f32af (Taylor and Grainger, 2023). The data to reproduce Fig. 9 can be found in the Supplement.
The map animations for each eruptive event created with the ABI data can be accessed at https://doi.org/10.5287/ora-b7ox6djxe (Taylor et al., 2023).
The supplement related to this article is available online at: https://doi.org/10.5194/acp-23-15209-2023-supplement.
The IASI SO2 retrievals and ash linear retrievals were run by IAT with guidance from RGG. The ABI images were studied by IAT, RGG and SRP. ATP and SRP provided guidance on using the ABI data. IAT obtained height information from the ABI data, did the flux analysis and produced the figures. TAM and DMP provided insights into the volcanological processes and historical context of this eruption. All authors contributed to discussion of results and editing of the manuscript.
The contact author has declared that none of the authors has any competing interests.
Publisher's note: Copernicus Publications remains neutral with regard to jurisdictional claims made in the text, published maps, institutional affiliations, or any other geographical representation in this paper. While Copernicus Publications makes every effort to include appropriate place names, the final responsibility lies with the authors.
We are grateful to EUMETSAT for the provision of the MetOp IASI level 1c data (EUMETSAT, 2009a) and to ECMWF for the meteorological data used. The JASMIN data analysis facility was used to run the IASI retrievals and to run the code estimating the heights from ABI. We also acknowledge the NOAA big data programme for making the GOES ABI data available.
David M. Pyle thanks Dan Goss, Jenni Barclay and Pat Joseph for discussions. Isabelle A. Taylor thanks Anu Dudhia, Elisa Carboni and Richard Siddans for some of the code used. We would like to thank two anonymous reviewers for their constructive feedback that greatly improved the paper. Additionally, we would like to thank Steve Sparks for his feedback.
Isabelle A. Taylor, Roy G. Grainger, Tamsin A. Mather and David M. Pyle acknowledge the support of the NERC Centre for the Observation and Modelling of Earthquakes, Volcanoes and Tectonics (COMET), a partnership between UK Universities and the British Geological Survey. This study was in part funded through NERC's support of the National Centre for Earth Observation (NCEO). Isabelle A. Taylor, Roy G. Grainger and Tamsin A. Mather were supported by the Natural Environment Research Council (NERC) project VPLUS (grant no. NE/S004025/1). Andrew T. Prata and Roy G. Grainger were supported by the NERC project R4-Ash (grant no. NE/S003843/1). Simon R. Proud's work on this study was funded as part of NERC's support of the National Centre for Earth Observation (award ref. NE/R016518/1) and by a NERC Innovation fellowship (award ref. NE/R013144/1). David M. Pyle acknowledges support from a NERC Urgency grant (grant no. NE/W000725/1).
This paper was edited by Eduardo Landulfo and reviewed by three anonymous referees.
Ackerman, S. A., Schreiner, A. J., Schmit, T. J., Woolf, H. M., Li, J., and Pavolonis, M.: Using the GOES Sounder to monitor upper level SO2 from volcanic eruptions, J. Geophys. Res.-Atmos., 113, D14S11, https://doi.org/10.1029/2007JD009622, 2008. a
Aspinall, W., Sighurdsson, H., and Shepherd, J.: Eruption of Soufrière Volcano on St. Vincent Island, 1971–1972, Science, 181, 117–124, https://doi.org/10.1126/science.181.4095.117, 1973. a
Aubry, T. J., Engwell, S., Bonadonna, C., Carazzo, G., Scollo, S., Van Eaton, A. R., Taylor, I. A., Jessop, D., Eychenne, J., Gouhier, M., Mastin, L. G., Wallace, K. L., Biass, S., Bursik, M., Grainger, R. G., Jellinek, A. M., and Schmidt, A.: The Independent Volcanic Eruption Source Parameter Archive (IVESPA, version 1.0): A new observational database to support explosive eruptive column model validation and development, J. Volcanol. Geothermal Res., 417, 107295, https://doi.org/10.1016/j.jvolgeores.2021.107295, 2021. a
Babu, S., Nguyen, L., Sheu, G.-R., Griffith, S., Pani, S., Huang, H.-Y., and Lin, N.-H.: Long-range transport of La Soufrière volcanic plume to the western North Pacific: Influence on atmospheric mercury and aerosol properties, Atmos. Environ., 268, 118806, https://doi.org/10.1016/j.atmosenv.2021.118806, 2022. a, b, c
Baldwin, M. P., Gray, L. J., Dunkerton, T. J., Hamilton, K., Haynes, P. H., Randel, W. J., Holton, J. R., Alexander, M. J., Hirota, I., Horinouchi, T., Jones, D. B. A., Kinnersley, J. S., Marquardt, C., Sato, K., and Takahashi, M.: The quasi-biennial oscillation, Rev. Geophys., 39, 179–229, https://doi.org/10.1029/1999RG000073, 2001. a
Barclay, J., Robertson, R., Scarlett, J. P., Pyle, D. M., and Armijos, M. T.: Disaster aid? Mapping historical responses to volcanic eruptions from 1800–2000 in the English-speaking Eastern Caribbean: their role in creating vulnerabilities, Disasters, 46, S10–S50, https://doi.org/10.1111/disa.12537, 2022. a
Blumstein, D., Chalon, G., Carlier, T., Buil, C., Hebert, P., Maciaszek, T., Ponce, G., Phulpin, T., Tournier, B., Simeoni, D., Astruc, P., Clauss, A., Kayal, G., and Jegou, R.: IASI instrument: Technical overview and measured performances, P. Soc. Photo.-Opt. Ins., 5543, 196–207, https://doi.org/10.1117/12.560907, 2004. a
Brazier, S., Davis, A., Sigurdsson, H., and Sparks, R.: Fall-out and deposition of volcanic ash during the 1979 explosive eruption of the soufriere of St. Vincent, J. Volcanol. Geotherm. Res., 14, 335–359, https://doi.org/10.1016/0377-0273(82)90069-5, 1982. a
Bruckert, J., Hirsch, L., Horváth, A., Kahn, R. A., Kölling, T., Muser, L. O., Timmreck, C., Vogel, H., Wallis, S., and Hoshyaripour, G. A.: Dispersion and Aging of Volcanic Aerosols after the La Soufrière Eruption in April 2021, J. Geophys. Res.-Atmos., 128, e2022JD037694, https://doi.org/10.1029/2022JD037694, 2023. a, b, c
Camejo-Harry, M., Pascal, K., Euillades, P., Grandin, R., Hamling, I., Euillades, L., Contreras-Arratia, R., Ryan, G. A., Latchman, J. L., Lynch, L., and Jo, M.: Monitoring volcano deformation at La Soufrière, St. Vincent during the 2020-21 eruption with insights into its magma plumbing system architecture, Geol. Soc., London, Special Publications, 539, SP539–2022–270, https://doi.org/10.1144/SP539-2022-270, 2024. a
Carboni, E., Grainger, R., Walker, J., Dudhia, A., and Siddans, R.: A new scheme for sulphur dioxide retrieval from IASI measurements: application to the Eyjafjallajökull eruption of April and May 2010, Atmos. Chem. Phys., 12, 11417–11434, https://doi.org/10.5194/acp-12-11417-2012, 2012. a, b, c, d
Carboni, E., Grainger, R. G., Mather, T. A., Pyle, D. M., Thomas, G. E., Siddans, R., Smith, A. J. A., Dudhia, A., Koukouli, M. E., and Balis, D.: The vertical distribution of volcanic SO2 plumes measured by IASI, Atmos. Chem. Phys., 16, 4343–4367, https://doi.org/10.5194/acp-16-4343-2016, 2016. a, b, c, d
Carboni, E., Mather, T. A., Schmidt, A., Grainger, R. G., Pfeffer, M. A., Ialongo, I., and Theys, N.: Satellite-derived sulfur dioxide (SO2) emissions from the 2014–2015 Holuhraun eruption (Iceland), Atmos. Chem. Phys., 19, 4851–4862, https://doi.org/10.5194/acp-19-4851-2019, 2019. a, b, c
Carn, S., Krueger, A., Bluth, G., Schaefer, S., Krotkov, N., Watson, I., and Datta, S.: Volcanic eruption detection by the Total Ozone Mapping Spectrometer (TOMS) instruments: a 22-year record of sulphur dioxide and ash emissions, 177–202, Geological Society, London, https://doi.org/10.1144/GSL.SP.2003.213.01.11, 2003. a, b
Carn, S., Clarisse, L., and Prata, A.: Multi-decadal satellite measurements of global volcanic degassing, J. Volcanol. Geotherm. Res., 311, 99–134, https://doi.org/10.1016/j.jvolgeores.2016.01.002, 2016. a, b, c, d, e, f, g, h
Clarisse, L., Coheur, P. F., Prata, A. J., Hurtmans, D., Razavi, A., Phulpin, T., Hadji-Lazaro, J., and Clerbaux, C.: Tracking and quantifying volcanic SO2 with IASI, the September 2007 eruption at Jebel at Tair, Atmos. Chem. Phys., 8, 7723–7734, https://doi.org/10.5194/acp-8-7723-2008, 2008. a
Clarisse, L., Prata, F., Lacour, J.-L., Hurtmans, D., Clerbaux, C., and Coheur, P.-F.: A correlation method for volcanic ash detection using hyperspectral infrared measurements, Geophys. Res. Lett., 37, L19806, https://doi.org/10.1029/2010GL044828, 2010a. a, b
Clarisse, L., Hurtmans, D., Prata, A. J., Karagulian, F., Clerbaux, C., De Mazière, M., and Coheur, P.-F.: Retrieving radius, concentration, optical depth, and mass of different types of aerosols from high-resolution infrared nadir spectra, Appl. Opt., 49, 3713–3722, https://doi.org/10.1364/AO.49.003713, 2010b. a
Clarisse, L., Coheur, P.-F., Chefdeville, S., Lacour, J.-L., Hurtmans, D., and Clerbaux, C.: Infrared satellite observations of hydrogen sulfide in the volcanic plume of the August 2008 Kasatochi eruption, Geophys. Res. Lett., 38, L10804, https://doi.org/10.1029/2011GL047402, 2011. a
Clarisse, L., Hurtmans, D., Clerbaux, C., Hadji-Lazaro, J., Ngadi, Y., and Coheur, P.-F.: Retrieval of sulphur dioxide from the infrared atmospheric sounding interferometer (IASI), Atmos. Meas. Tech., 5, 581–594, https://doi.org/10.5194/amt-5-581-2012, 2012. a
Clarisse, L., Coheur, P.-F., Theys, N., Hurtmans, D., and Clerbaux, C.: The 2011 Nabro eruption, a SO2 plume height analysis using IASI measurements, Atmos. Chem. Phys., 14, 3095–3111, https://doi.org/10.5194/acp-14-3095-2014, 2014. a, b, c
Clerbaux, C., Boynard, A., Clarisse, L., George, M., Hadji-Lazaro, J., Herbin, H., Hurtmans, D., Pommier, M., Razavi, A., Turquety, S., Wespes, C., and Coheur, P.-F.: Monitoring of atmospheric composition using the thermal infrared IASI/MetOp sounder, Atmos. Chem. Phys., 9, 6041–6054, https://doi.org/10.5194/acp-9-6041-2009, 2009. a, b
Druitt, T. H., Young, S. R., Baptie, B., Bonadonna, C., Calder, E. S., Clarke, A. B., Cole, P. D., Harford, C. L., Herd, R. A., Luckett, R., Ryan, G., and Voight, B.: Episodes of cyclic Vulcanian explosive activity with fountain collapse at Soufrière Hills Volcano, Montserrat, Geological Society, London, Memoirs, 21, 281–306, https://doi.org/10.1144/GSL.MEM.2002.021.01.13, 2002. a
Dualeh, E., Ebmeier, S., Wright, T., Poland, M., Grandin, R., Stinton, A., Camejo-Harry, M., Esse, B., and Burton, M.: Rapid pre-explosion increase in dome extrusion rate at La Soufrière, St. Vincent quantified from synthetic aperture radar backscatter, Earth Planet. Sci. Lett., 603, 117980, https://doi.org/10.1016/j.epsl.2022.117980, 2023. a
Esse, B., Burton, M., Hayer, C., Contreras-Arratia, R., Christopher, T., Joseph, E. P., Varnam, M., and Johnson, C.: SO2 emissions during the 2021 eruption of La Soufrière St. Vincent, revealed with back-trajectory analysis of TROPOMI imagery, Geological Society, London, Special Publications, 539, SP539–2022–77, https://doi.org/10.1144/SP539-2022-77, 2024. a, b
EUMETSAT: IASI Level 1C – All Spectral Samples – Metop – Global, https://data.eumetsat.int/product/EO:EUM:DAT:METOP:IASIL1C-ALL?query=IASI Level 1C - All Spectral Samples - Metop - Global&s=extended# (last access: 5 December 2023), 2009a. a, b
EUMETSAT: IASI atmospheric spectra (L1C product) from the EPS Metop-A satellite: CEDA mirror archive for STFC, NCAS, NCEO. EUMETSAT [data set], https://catalogue.ceda.ac.uk/uuid/ea46600afc4559827f31dbfbb8894c2e (last access: 28 June 2022), 2009b. a
EUMETSAT: IASI atmospheric spectra (L1C product) from the EPS Metop-B satellite: CEDA mirror archive for STFC, NCAS, NCEO. NERC Earth Observation Data Centre [data set], https://catalogue.ceda.ac.uk/uuid/0092c4fe29f76c1b99b4dc19133f361a (last access: 28 June 2022), 2014. a
EUMETSAT: IASI atmospheric spectra (L1C product) from the EPS Metop - C satellite: CEDA mirror archive for STFC, NCAS, NCEO. EUMETSAT [data set], https://catalogue.ceda.ac.uk/uuid/58648f7210c84c44a91dc128d8d750d8 (last access: 28 June 2022), 2021. a
European Centre for Medium-Range Weather Forecasts: ECMWF Operational Regular Gridded Data at 1.125 degrees resolution. NCAS British Atmospheric Data Centre [data set], https://catalogue.ceda.ac.uk/uuid/a67f1b4d9db7b1528b800ed48198bdac (last access:28 June 2022), 2012. a
European Centre for Medium-Range Weather Forecasts: ECMWF ERA5: model level analysis parameter data. Centre for Environmental Data Analysis [data set], https://catalogue.ceda.ac.uk/uuid/f809e61a61ee4eb9a64d4957c3e5bfac (last access: 28 June 2022), 2021. a, b
Fiske, R. and Sigurdsson, H.: Soufriere Volcano, St. Vincent: Observations of Its 1979 Eruption from the Ground, Aircraft, and Satellites, 216, 1105–1106, https://doi.org/10.1126/science.216.4550.1105, 1982. a, b
Fuell, K.: Ash RGB – Quick Guide, https://rammb2.cira.colostate.edu/wp-content/uploads/2020/01/GOES_Ash_RGB-1.pdf (last access: 28 March 2023), 2018. a, b
Fuller, W. H., Sokol, S., and Hunt, W. H.: Airborne Lidar Measurements of the Soufriere Eruption of 17 April 1979, Science, 216, 1113–1115, https://doi.org/10.1126/science.216.4550.1113, 1982. a, b
Glaze, L., Francis, P., Self, S., and Rothery, D.: The 16 September 1986 eruption of Lascar volcano, north Chile: Satellite investigations, Bull. Volcanol., 51, 149–160, https://doi.org/10.1007/BF01067952, 1989. a
Global Volcanism Program: Report on Soufrière St. Vincent (Saint Vincent and the Grenadines) — March 2021, edited by: Bennis, K. L. and Venzke, E., Bulletin of the Global Volcanism Network, 46:3, Smithsonian Institution, https://doi.org/10.5479/si.GVP.BGVN202103-360150, 2021a. a, b
Global Volcanism Program: Report on Soufrière St. Vincent (Saint Vincent and the Grenadines), edited by: Bennis, K. L. and Venzke, E., Bulletin of the Global Volcanism Network, 46:5, Smithsonian Institution, https://doi.org/10.5479/si.GVP.BGVN202105-360150, 2021b. a, b, c, d, e, f, g
Global Volcanism Program: Report on Soufriere St. Vincent (Saint Vincent and the Grenadines), in: Weekly Volcanic Activity Report, 7 April–13 April 2021, edited by: Sennert, S K., Smithsonian Institution and US Geological Survey, https://volcano.si.edu/showreport.cfm?wvar=GVP.WVAR20210407-360150 (last access: 4 December 2023), 2021c. a
Global Volcanism Program: Report on Sangay (Ecuador), edited by: Crafford, A. E. and Venzke, E., Bulletin of the Global Volcanism Network, 46, 7, Smithsonian Institution, https://doi.org/10.5479/si.GVP.BGVN202107-352090, 2021d. a
Guermazi, H., Sellitto, P., Cuesta, J., Eremenko, M., Lachatre, M., Mailler, S., Carboni, E., Salerno, G., Caltabiano, T., Menut, L., Serbaji, M. M., Rekhiss, F., and Legras, B.: Quantitative Retrieval of Volcanic Sulphate Aerosols from IASI Observations, Remote Sens., 13, 1808, https://doi.org/10.3390/rs13091808, 2021. a
Gupta, A., Bennartz, R., Fauria, K., and Mittal, T.: Eruption chronology of the December 2021 to January 2022 Hunga Tonga-Hunga Ha’apai eruption sequence, Commun. Earth Environ., 3, 314, https://doi.org/10.1038/s43247-022-00606-3, 2022. a
Hedelt, P., Efremenko, D. S., Loyola, D. G., Spurr, R., and Clarisse, L.: Sulfur dioxide layer height retrieval from Sentinel-5 Precursor/TROPOMI using FP_ILM, Atmos. Meas. Tech., 12, 5503–5517, https://doi.org/10.5194/amt-12-5503-2019, 2019. a
Holasek, R. E. and Self, S.: GOES weather satellite observations and measurements of the May 18, 1980, Mount St. Helens eruption, J. Geophys. Res.-Solid Earth, 100, 8469–8487, https://doi.org/10.1029/94JB03137, 1995. a
Holasek, R. E., Self, S., and Woods, A. W.: Satellite observations and interpretation of the 1991 Mount Pinatubo eruption plumes, J. Geophys. Res.-Solid Earth, 101, 27635–27655, https://doi.org/10.1029/96JB01179, 1996a. a
Holasek, R. E., Woods, A. W., and Self, S.: Experiments on gas-ash separation processes in volcanic umbrella plumes, J. Volcanol. Geotherm. Res., 70, 169–181, https://doi.org/10.1016/0377-0273(95)00054-2, 1996b. a
Horváth, Á., Carr, J. L., Wu, D. L., Bruckert, J., Hoshyaripour, G. A., and Buehler, S. A.: Measurement report: Plume heights of the April 2021 La Soufrière eruptions from GOES-17 side views and GOES-16–MODIS stereo views, Atmos. Chem. Phys., 22, 12311–12330, https://doi.org/10.5194/acp-22-12311-2022, 2022. a, b, c, d, e, f, g
Joseph, E., Camejo-Harry, M., Christopher, T., Contrera-Arratia, R., Edwards, S., Graham, O., Johnson, M., Juman, A., Latchman, J. L., Lynch, L., Miller, V. L., Papadopoulos, I., Pascal, K., Robertson, R., Ryan, G., Stinton, A., Grandin, R., Hamling, I., Jo, M.-J., Barclay, J., Cole, P., Davies, B., and Sparks, R.: Responding to eruptive transitions during the 2020–2021 eruption of La Soufrière volcano, St. Vincent, Nat. Commun., 13, 4129, https://doi.org/10.1038/s41467-022-31901-4, 2022. a, b, c, d, e, f, g, h, i, j
Koukouli, M.-E., Michailidis, K., Hedelt, P., Taylor, I. A., Inness, A., Clarisse, L., Balis, D., Efremenko, D., Loyola, D., Grainger, R. G., and Retscher, C.: Volcanic SO2 layer height by TROPOMI/S5P: evaluation against IASI/MetOp and CALIOP/CALIPSO observations, Atmos. Chem. Phys., 22, 5665–5683, https://doi.org/10.5194/acp-22-5665-2022, 2022. a, b, c
Krueger, A. F.: Geostationary Satellite Observations of the April 1979 Soufriere Eruptions, Science, 216, 1108–1109, https://doi.org/10.1126/science.216.4550.1108, 1982. a, b, c
Lechner, P., Tupper, A., Guffanti, M., Loughlin, S., and Casadevall, T.: Volcanic Ash and Aviation – The Challenges of Real-Time, Global Communication of a Natural Hazard, 51–64, Adv. Volcanol., Springer, Berlin, Heidelberg, https://doi.org/10.1007/11157_2016_49, 2017. a
Lindsey, D., Schmit, T. J., MacKenzie, W. M., Jewitt, C. P., Gunshor, M. M., and Grasso, L.: 10.35 µm: atmospheric window on the GOES-R Advanced Baseline Imager with less moisture attenuation, J. Appl. Remote Sens., 6, 063598, https://doi.org/10.1117/1.JRS.6.063598, 2012. a
Maes, K., Vandenbussche, S., Klüser, L., Kumps, N., and de Mazière, M.: Vertical Profiling of Volcanic Ash from the 2011 Puyehue Cordón Caulle Eruption Using IASI, Remote Sens., 8, 103, https://doi.org/10.3390/rs8020103, 2016. a
Martínez-Alonso, S., Deeter, M. N., Worden, H. M., Clerbaux, C., Mao, D., and Gille, J. C.: First satellite identification of volcanic carbon monoxide, Geophys. Res. Lett., 39, L21809, https://doi.org/10.1029/2012GL053275, 2012. a
McCormick, M. P., Kent, G. S., Yue, G. K., and Cunnold, D. M.: Stratospheric Aerosol Effects from Soufriere Volcano as Measured by the SAGE Satellite System, Science, 216, 1115–1118, https://doi.org/10.1126/science.216.4550.1115, 1982. a
Moxnes, E. D., Kristiansen, N. I., Stohl, A., Clarisse, L., Durant, A., Weber, K., and Vogel, A.: Separation of ash and sulfur dioxide during the 2011 Grímsvötn eruption, J. Geophys. Res.-Atmos., 119, 7477–7501, https://doi.org/10.1002/2013JD021129, 2014. a
NOAA: About the NOAA Open Data Dissemination (NODD) Program, NOAA, https://www.noaa.gov/information-technology/open-data-dissemination, last access: 9 November 2022. a
Oppenheimer, C.: Review article: Volcanological applications of meteorological satellites, Int. J. Remote Sens., 19, 2829–2864, https://doi.org/10.1080/014311698214307, 1998. a, b, c, d, e
Park, S. S., Kim, J., Lee, J., Lee, S., Kim, J. S., Chang, L. S., and Ou, S.: Combined dust detection algorithm by using MODIS infrared channels over East Asia, Remote Sens. Environ., 141, 24–39, https://doi.org/10.1016/j.rse.2013.09.019, 2014. a
Pavolonis, M. J., Sieglaff, J. M., and Cintineo, J. L.: Chapter 10 - Remote Sensing of Volcanic Ash with the GOES-R Series, in: The GOES-R Series, edited by: Goodman, S. J., Schmit, T. J., Daniels, J., and Redmon, R. J., 103–124, Elsevier, ISBN 978-0-12-814327-8, https://doi.org/10.1016/B978-0-12-814327-8.00010-X, 2020. a
Prata, A.: Observations of volcanic ash clouds in the 10-12 μm window using AVHRR/2 data, Int. J. Remote Sens., 10, 751–761, https://doi.org/10.1080/01431168908903916, 1989a. a
Prata, A. J.: Infrared radiative transfer calculations for volcanic ash clouds, Geophys. Res. Lett., 16, 1293–1296, https://doi.org/10.1029/GL016i011p01293, 1989b. a
Prata, A. and Tupper, A.: Aviation hazards from volcanoes: the state of the science, Nat. Hazards, 51, 239–244, https://doi.org/10.1007/s11069-009-9415-y, 2009. a
Prata, A. J. and Grant, I. F.: Retrieval of microphysical and morphological properties of volcanic ash plumes from satellite data: Application to Mt Ruapehu, New Zealand, Q. J. Roy. Meteorol. Soc., 127, 2153–2179, https://doi.org/10.1002/qj.49712757615, 2001. a, b, c
Prata, A. T., Grainger, R. G., Taylor, I. A., Povey, A. C., Proud, S. R., and Poulsen, C. A.: Uncertainty-bounded estimates of ash cloud properties using the ORAC algorithm: application to the 2019 Raikoke eruption, Atmos. Meas. Tech., 15, 5985–6010, https://doi.org/10.5194/amt-15-5985-2022, 2022. a, b
Prata, F., Bluth, G., Rose, B., Schneider, D., and Tupper, A.: Comments on “Failures in detecting volcanic ash from a satellite-based technique”, Remote Sens. Environ., 78, 341–346, https://doi.org/10.1016/S0034-4257(01)00231-0, 2001. a, b
Prata, F., Woodhouse, M., Huppert, H. E., Prata, A., Thordarson, T., and Carn, S.: Atmospheric processes affecting the separation of volcanic ash and SO2 in volcanic eruptions: inferences from the May 2011 Grímsvötn eruption, Atmos. Chem. Phys., 17, 10709–10732, https://doi.org/10.5194/acp-17-10709-2017, 2017. a
Pyle, D. M.: What Can We Learn from Records of Past Eruptions to Better Prepare for the Future?, in: Observing the Volcano World. Advances in Volcanology, edited by: Fearnley, C. J., Bird, D. K., Haynes, K., McGuire, W. J., and Jolly, G., 445–462, Springer, Cham, ISBN 978-3-319-44097-2, 2017. a
Reed, R. J., Campbell, W. J., Rasmussen, L. A., and Rogers, D. G.: Evidence of a downward-propagating, annual wind reversal in the equatorial stratosphere, J. Geophys. Res., 66, 813–818, https://doi.org/10.1029/JZ066i003p00813, 1961. a
Robertson, R.: An assessment of the risk from future eruptions of the Soufriere volcano of St. Vincent, West Indies, Nat. Hazards, 11, 163–191, https://doi.org/10.1007/BF00634531, 1995. a
Robertson, R. E. A., Joseph, E. P., Barclay, J., and Sparks, R. S. J.: About this title – The 2020-21 Eruption of La Soufrière Volcano, St Vincent, Geological Society, London, Special Publications, 539, SP539, https://doi.org/10.1144/SP539-000, 2024. a
Rose, W. I., Delene, D. J., Schneider, D. J., Bluth, G. J. S., Krueger, A. J., Sprod, I., McKee, C., Davies, H. L., and Ernst, G. G. J.: Ice in the 1994 Rabaul eruption cloud: implications for volcano hazard and atmospheric effects, Nature, 375, 477–479, https://doi.org/10.1038/375477a0, 1995. a
Saunders, R., Matricardi, M., and Brunel, P.: An Improved Fast Radiative Transfer Model for Assimilation of Satellite Radiance Observations, Q. J. Roy. Meteorol. Soc., 125, 1407–1425, https://doi.org/10.1002/qj.1999.49712555615, 1999. a
Scaillet, B., Luhr, J. F., and Carroll, M. R.: Petrological and Volcanological Constraints on Volcanic Sulfur Emissions to the Atmosphere, in: Volcanism and the Earth's Atmosphere, edited by: Robock, A. and Oppenheimer, C., 11–40, American Geophysical Union (AGU), ISBN 9781118668542, https://doi.org/10.1029/139GM02, 2004. a
Schmidt, A. and Black, B. A.: Reckoning with the Rocky Relationship Between Eruption Size and Climate Response: Toward a Volcano-Climate Index, Annu. Rev. Earth Planet. Sci., 50, 627–661, https://doi.org/10.1146/annurev-earth-080921-052816, 2022. a, b
Schmit, T. J., Gunshor, M. M., Menzel, W. P., Gurka, J. J., Li, J., and Bachmeier, A. S.: Introducing the Next-Generation Advanced Baseline Imager on GOES-R, B. Am. Meteorol. Soc., 86, 1079–1096, https://doi.org/10.1175/BAMS-86-8-1079, 2005. a
Schmit, T. J., Griffith, P., Gunshor, M. M., Daniels, J. M., Goodman, S. J., and Lebair, W. J.: A Closer Look at the ABI on the GOES-R Series, B. Am. Meteorol. Soc., 98, 681 – 698, https://doi.org/10.1175/BAMS-D-15-00230.1, 2017. a, b
Sears, T., Thomas, G., Carboni, E., Smith, A., and Grainger, R.: SO2 as a possible proxy for volcanic ash in aviation hazard avoidance, J. Geophys. Res.-Atmos., 118, 5698‐5709, https://doi.org/10.1002/jgrd.50505, 2013. a, b
Shepherd, J. and Sigurdsson, H.: Mechanism of the 1979 explosive eruption of soufriere volcano, St. Vincent, J. Volcanol. Geotherm. Res., 13, 119–130, https://doi.org/10.1016/0377-0273(82)90023-3, 1982. a
Shepherd, J., Aspinall, W., Rowley, K., Pereira, J., Sigurdsson, H., Fiske, R., and Tomblin, J.: The eruption of Soufrière volcano, St Vincent April–June 1979, Nature, 282, 24–28, https://doi.org/10.1038/282024a0, 1979. a, b, c, d, e, f
Simpson, J. J., Hufford, G., Pieri, D., and Berg, J.: Failures in Detecting Volcanic Ash from a Satellite-Based Technique, Remote Sens. Environ., 72, 191–217, https://doi.org/10.1016/S0034-4257(99)00103-0, 2000. a
Simpson, J. J., Hufford, G. L., Servranckx, R., Berg, J., and Pieri, D.: Airborne Asian Dust: Case Study of Long-Range Transport and Implications for the Detection of Volcanic Ash, Weather Forecast., 18, 121–141, https://doi.org/10.1175/1520-0434(2003)018<0121:AADCSO>2.0.CO;2, 2003. a
Smart, D. and Sales, T.: Volcanic lightning observed at La Soufrière, Saint Vincent and the Grenadines, Lesser Antilles, Weather, 76, 277–278, https://doi.org/10.1002/wea.4021, 2021. a
Sparks, S. R. J., Aspinall, W. P., Barclay, J., Renfrew, I. A., Contreras-Arratia, R., and Stewart, R.: Analysis of magma flux and eruption intensity during the 2021 explosive activity at La Soufrière, St Vincent, West Indies, Geological Society, London, Special Publications, 539, SP539–2022–286, https://doi.org/10.1144/SP539-2022-286, 2024. a, b, c, d, e, f
Taylor, I. A. and Grainger, R. G.: Retrieved sulfur dioxide column amounts and heights from the IASI instrument (9–30 April 2021) v1.0, NERC EDS Centre for Environmental Data Analysis, [dataset], https://doi.org/10.5285/b80870de014a43a498fc2684e78f32af, 2023. a
Taylor, I. A., Carboni, E., Ventress, L. J., Mather, T. A., and Grainger, R. G.: An adaptation of the CO2 slicing technique for the Infrared Atmospheric Sounding Interferometer to obtain the height of tropospheric volcanic ash clouds, Atmos. Meas. Tech., 12, 3853–3883, https://doi.org/10.5194/amt-12-3853-2019, 2019. a
Taylor, I. A., Grainger, R. G., Prata, A. T., Proud, S. R., Mather, T. A., and Pyle, D. M.: Animations of images produced with data from the Advanced Baseline Instrument (ABI) showing plumes from the April 2021 La Soufrière eruption, University of Oxford [data set, video], https://doi.org/10.5287/ora-b7ox6djxe, 2023. a, b
Thomas, H. E. and Prata, A. J.: Sulphur dioxide as a volcanic ash proxy during the April–May 2010 eruption of Eyjafjallajökull Volcano, Iceland, Atmos. Chem. Phys., 11, 6871–6880, https://doi.org/10.5194/acp-11-6871-2011, 2011. a
Thomas, H. E. and Watson, I. M.: Observations of volcanic emissions from space: current and future perspectives, Nat. Hazards, 54, 323–354, https://doi.org/10.1007/s11069-009-9471-3, 2010. a
Thompson, J. O., Contreras-Arratia, R., Befus, K. S., and Ramsey, M. S.: Thermal and seismic precursors to the explosive eruption at La Soufrière Volcano, St. Vincent in April 2021, Earth Planet. Sci. Lett., 592, 117621, https://doi.org/10.1016/j.epsl.2022.117621, 2022. a
Tupper, A. and Kinoshita, K.: Satellite, Air and Ground Observations of Volcanic Clouds over Islands of the Southwest Pacific, South Pacific Study, 23, 21–46, 2003. a
Tupper, A. and Wunderman, R.: Reducing discrepancies in ground and satellite-observed eruption heights, J. Volcanol. Geotherm. Res., 186, 22–31, https://doi.org/10.1016/j.jvolgeores.2009.02.015, 2009. a
Tupper, A., Carn, S., Davey, J., Kamada, Y., Potts, R., Prata, F., and Tokuno, M.: An evaluation of volcanic cloud detection techniques during recent significant eruptions in the western “Ring of Fire”, Remote Sens. Environ., 91, 27–46, https://doi.org/10.1016/j.rse.2004.02.004, 2004. a
Ventress, L. J., McGarragh, G., Carboni, E., Smith, A. J., and Grainger, R. G.: Retrieval of ash properties from IASI measurements, Atmos. Meas. Tech., 9, 5407–5422, https://doi.org/10.5194/amt-9-5407-2016, 2016. a
Walker, J. C., Dudhia, A., and Carboni, E.: An effective method for the detection of trace species demonstrated using the MetOp Infrared Atmospheric Sounding Interferometer, Atmos. Meas. Tech., 4, 1567–1580, https://doi.org/10.5194/amt-4-1567-2011, 2011. a, b, c
Walker, J., Carboni, E., Dudhia, A., and Grainger, R.: Improved detection of sulphur dioxide in volcanic plumes using satellite-based hyperspectral infrared measurements: Application to the Eyjafjallajökull 2010 eruption, J. Geophys. Res.-Atmos., 117, D00U16, https://doi.org/10.1029/2011JD016810, 2012. a, b, c
Watt, S., Mather, T., and Pyle, D.: Vulcanian explosion cycles: Patterns and predictability, Geology, 35, 839–842, https://doi.org/10.1130/G23562A.1, 2007. a
Woods, A. and Self, S.: Thermal disequilibrium at the top of volcanic clouds and its effect on estimates of the column height, Nature, 355, 628–630, https://doi.org/10.1038/355628a0, 1992. a
Yu, T., Rose, W. I., and Prata, A. J.: Atmospheric correction for satellite-based volcanic ash mapping and retrievals using “split window” IR data from GOES and AVHRR, J. Geophys. Res.-Atmos., 107, AAC10-1–AAC10-19, https://doi.org/10.1029/2001JD000706, 2002. a
Yue, J., Miller, S. D., Straka III, W. C., Noh, Y.-J., Chou, M.-Y., Kahn, R., and Flower, V.: La Soufriere Volcanic Eruptions Launched Gravity Waves Into Space, Geophys. Res. Lett., 49, e2022GL097952, https://doi.org/10.1029/2022GL097952, 2022. a, b, c
Zakšek, K., Hort, M., Zaletelj, J., and Langmann, B.: Monitoring volcanic ash cloud top height through simultaneous retrieval of optical data from polar orbiting and geostationary satellites, Atmos. Chem. Phys., 13, 2589–2606, https://doi.org/10.5194/acp-13-2589-2013, 2013. a, b, c, d
Zhu, Y., Toon, O., Jensen, E., Bardeen, C., Mills, M., Tolbert, M., Yu, P., and Woods, S.: Persisting volcanic ash particles impact stratospheric SO2 lifetime and aerosol optical properties, Nat. Commun., 11, 4526, https://doi.org/10.1038/s41467-020-18352-5, 2020. a, b
Zhu, Y., Bardeen, C., Tilmes, S., Mills, M., Wang, X., Harvey, V., Taha, G., Kinnison, D., Portmann, R., Yu, P., Rosenlof, K., Avery, M., Kloss, C., Li, C., Glanville, A., Millán, L., Deshler, T., Krotkov, N., and Toon, O.: Perturbations in stratospheric aerosol evolution due to the water-rich plume of the 2022 Hunga-Tonga eruption, Commun. Earth Environ., 3, 248, https://doi.org/10.1038/s43247-022-00580-w, 2022. a