the Creative Commons Attribution 4.0 License.
the Creative Commons Attribution 4.0 License.
 | 26 Jan 2023
Ground-level gaseous pollutants (NO2, SO2, and CO) in China: daily seamless mapping and spatiotemporal variations
Jing Wei
Pawan Gupta
Maureen Cribb
Gaseous pollutants at the ground level seriously threaten the urban air quality environment and public health. There are few estimates of gaseous pollutants that are spatially and temporally resolved and continuous across China. This study takes advantage of big data and artificial-intelligence technologies to generate seamless daily maps of three major ambient pollutant gases, i.e., NO2, SO2, and CO, across China from 2013 to 2020 at a uniform spatial resolution of 10 km. Cross-validation between our estimates and ground observations illustrated a high data quality on a daily basis for surface NO2, SO2, and CO concentrations, with mean coefficients of determination (root-mean-square errors) of 0.84 (7.99 µg m−3), 0.84 (10.7 µg m−3), and 0.80 (0.29 mg m−3), respectively. We found that the COVID-19 lockdown had sustained impacts on gaseous pollutants, where surface CO recovered to its normal level in China on around the 34th day after the Lunar New Year, while surface SO2 and NO2 rebounded more than 2 times slower due to more CO emissions from residents' increased indoor cooking and atmospheric oxidation capacity. Surface NO2, SO2, and CO reached their peak annual concentrations of 21.3 ± 8.8 µg m−3, 23.1 ± 13.3 µg m−3, and 1.01 ± 0.29 mg m−3 in 2013, then continuously declined over time by 12 %, 55 %, and 17 %, respectively, until 2020. The declining rates were more prominent from 2013 to 2017 due to the sharper reductions in anthropogenic emissions but have slowed down in recent years. Nevertheless, people still suffer from high-frequency risk exposure to surface NO2 in eastern China, while surface SO2 and CO have almost reached the World Health Organization (WHO) recommended short-term air quality guidelines (AQG) level since 2018, benefiting from the implemented stricter “ultra-low” emission standards. This reconstructed dataset of surface gaseous pollutants will benefit future (especially short-term) air pollution and environmental health-related studies.
- Article
(15400 KB) - Full-text XML
-
Supplement
(5387 KB) - BibTeX
- EndNote


Air pollution has been a major environmental concern, affecting human health, weather, and climate (Anenberg et al., 2022; Kan et al., 2012; Z. Li et al., 2017; GBD 2019 Risk Factors Collaborators, 2020; Orellano et al., 2020), thus drawing worldwide attention. The sources of air pollution are complex. They include natural sources such as wildfires and anthropogenic emissions, including pollutants discharged from industrial production (e.g., smoke or dust, sulfur oxides, nitrogen oxides – NOx, and volatile organic compounds – VOCs), hazardous substances released from burning coal during heating seasons (e.g., dust, sulfur dioxide – SO2, and carbon monoxide – CO), and waste gases (e.g., CO, SO2, and NOx) generated by transportation, especially in big cities.
Among various air pollutants, the following have been most widely recognized: particulate matter with diameters smaller than 2.5 and 10 µm (PM2.5 and PM10) and gaseous pollutants (e.g., ozone (O3), nitrogen dioxide (NO2), SO2, and CO, among others). Many countries have built ground-based networks to monitor a variety of conventional pollutants in real time. China has experienced serious ambient air pollution for a long time, prompting the establishment of a large-scale air quality monitoring network (MEE, 2018a). Over the years, much effort has been made to model different species of air pollutants. Many studies that focused on particulate matter in China have been carried out (Gao et al., 2022; T. Li et al., 2017; H. Li et al., 2022; Ma et al., 2022; Yang et al., 2022; Zhang et al., 2018). The global COVID-19 pandemic has motivated many attempts to estimate surface NO2 concentrations from satellite-retrieved tropospheric NO2 products (Tian et al., 2020; WHO, 2020), e.g., from the Ozone Monitoring Instrument (OMI) on board the NASA Aura spacecraft and the TROPOspheric Monitoring Instrument (TROPOMI) on board the Copernicus Sentinel-5 Precursor satellite, adopting different statistical regression (Chi et al., 2021; Qin et al., 2017; Zhang et al., 2018) and artificial intelligence (Chen et al., 2019; Chi et al., 2022; Dou et al., 2021; Liu, 2021; Wang et al., 2021; Zhan et al., 2018) models. By comparison, surface SO2 and CO in China are less studied, limited by weaker signals and a lack of good-quality satellite tropospheric products (W. Han et al., 2022; Li et al., 2020; Liu et al., 2019; Wang et al., 2021). Such studies still face more challenges, e.g., satellite data gaps and missing values that seriously limit their application and the neglect of spatiotemporal differences in air pollution in the modeling process. In addition, most previous studies mainly focused on studying a single or a few species during relatively short observational periods.
In view of the above problems, the purpose of this paper is to reconstruct daily concentrations of three ambient gaseous pollutants (i.e., NO2, SO2, and CO) in China. To this end, relying on the dense national ground-based observation network and big data, including satellite remote sensing products, meteorological reanalysis, chemical model simulations, and emission inventories, we are capable of mapping three pollutant gases seamlessly (100 % spatial coverage) on a daily basis at a uniform spatial resolution of 10 km since 2013 in China. Estimates were made using an extended and powerful machine-learning model incorporating spatiotemporal information, i.e., Space–Time Extra-Trees (Wei et al., 2022a). Natural and anthropogenic effects on air pollution, including their physical mechanisms and chemical reactions, were accounted for in the modeling. Using this dataset, spatiotemporal variations of the gaseous pollutants, the impacts of environmental protection policies and the COVID-19 pandemic, and population risk exposure to gaseous pollution are investigated.
To date, we have combined the advantages of artificial intelligence and big data to construct a virtually complete set of major air quality parameters concerning both particulate and gaseous pollutants over a long period of time across China, including PM1 (1 km, 2000–present) (Wei et al., 2019), PM2.5 (1 km, 2000–present) (Wei et al., 2020, 2021a), PM10 (1 km, 2000–present) (Wei et al., 2021b), O3 (10 km, 1979–present) (Wei et al., 2022a; L. He et al., 2022), and NO2 (1 km, 2019–present) (Wei et al., 2022b), serving environmental, public health, economy, and other related research. This study is the continuation of our previous studies, adding two new species of SO2 and CO for the first time and also dating the data records of NO2 back to 2013. Instead of devoting itself to a single pollutant, this study deals with all gaseous pollutants of compatible quality over the same period with the same spatial coverage and resolution. In particular, considering that there are few public datasets of these three gaseous pollutants with such spatiotemporal coverages focusing on the whole of China, this is highly valuable for the sake of studying their variations, relative proportions, and attribution of emission sources, as well as the diverse and joint effects of different pollutant species on public health.
2.1 Big data
2.1.1 Ground-based measurements
Hourly measurements of ground-level NO2, SO2, and CO concentrations from ∼ 1600 reference-grade ground-based monitoring stations (Fig. 1) collected from the China National Environmental Monitoring Centre (CNEMC) network were employed in the study. This network includes urban assessing stations, regional assessing stations, background stations, source impact stations, and traffic stations, set up in a reasonable overall layout that covers industrial (∼ 14 %), urban (∼ 31 %), suburban (∼ 39 %), and rural (∼ 16 %) areas to improve the spatial representations, continuity, and comparability of observations (HJ 664-2013; MEE, 2013a). NO2 is measured by chemiluminescence and differential optical absorption spectroscopy (DOAS), and SO2 uses ultraviolet fluorescence and DOAS, while CO adopts non-dispersive infrared spectroscopy and gas filter correlation infrared spectroscopy. These measurements have been fully validated and have the same average error of indication of ±2 % of full scale (FS) for the three gaseous pollutants considered here, with additional quality control checks such as zero and span noise and zero and span drift (HJ 654-2013 and HJ 655-2013; MEE, 2013b, c). They have also been used as ground truth in almost all air pollutant modeling studies in China (Ma et al., 2022; B. Zhang et al., 2022). All stations use the same technique to measure each gas routinely and continuously for 24 h a day at about sea level without time series gaps. However, the reference state (i.e., observational conditions like temperature and pressure) changed from the standard condition (i.e., 273 K and 1013 hPa) to the room condition (i.e., 298 K and 1013 hPa) on 31 August 2018 (MEE, 2018a). We thus first converted observations of the three gaseous pollutants after this date to the uniform standard condition for consistency. Here, daily values for each air pollutant were averaged from at least 30 % of valid hourly measurements at each station in each year from 2013 to 2020.
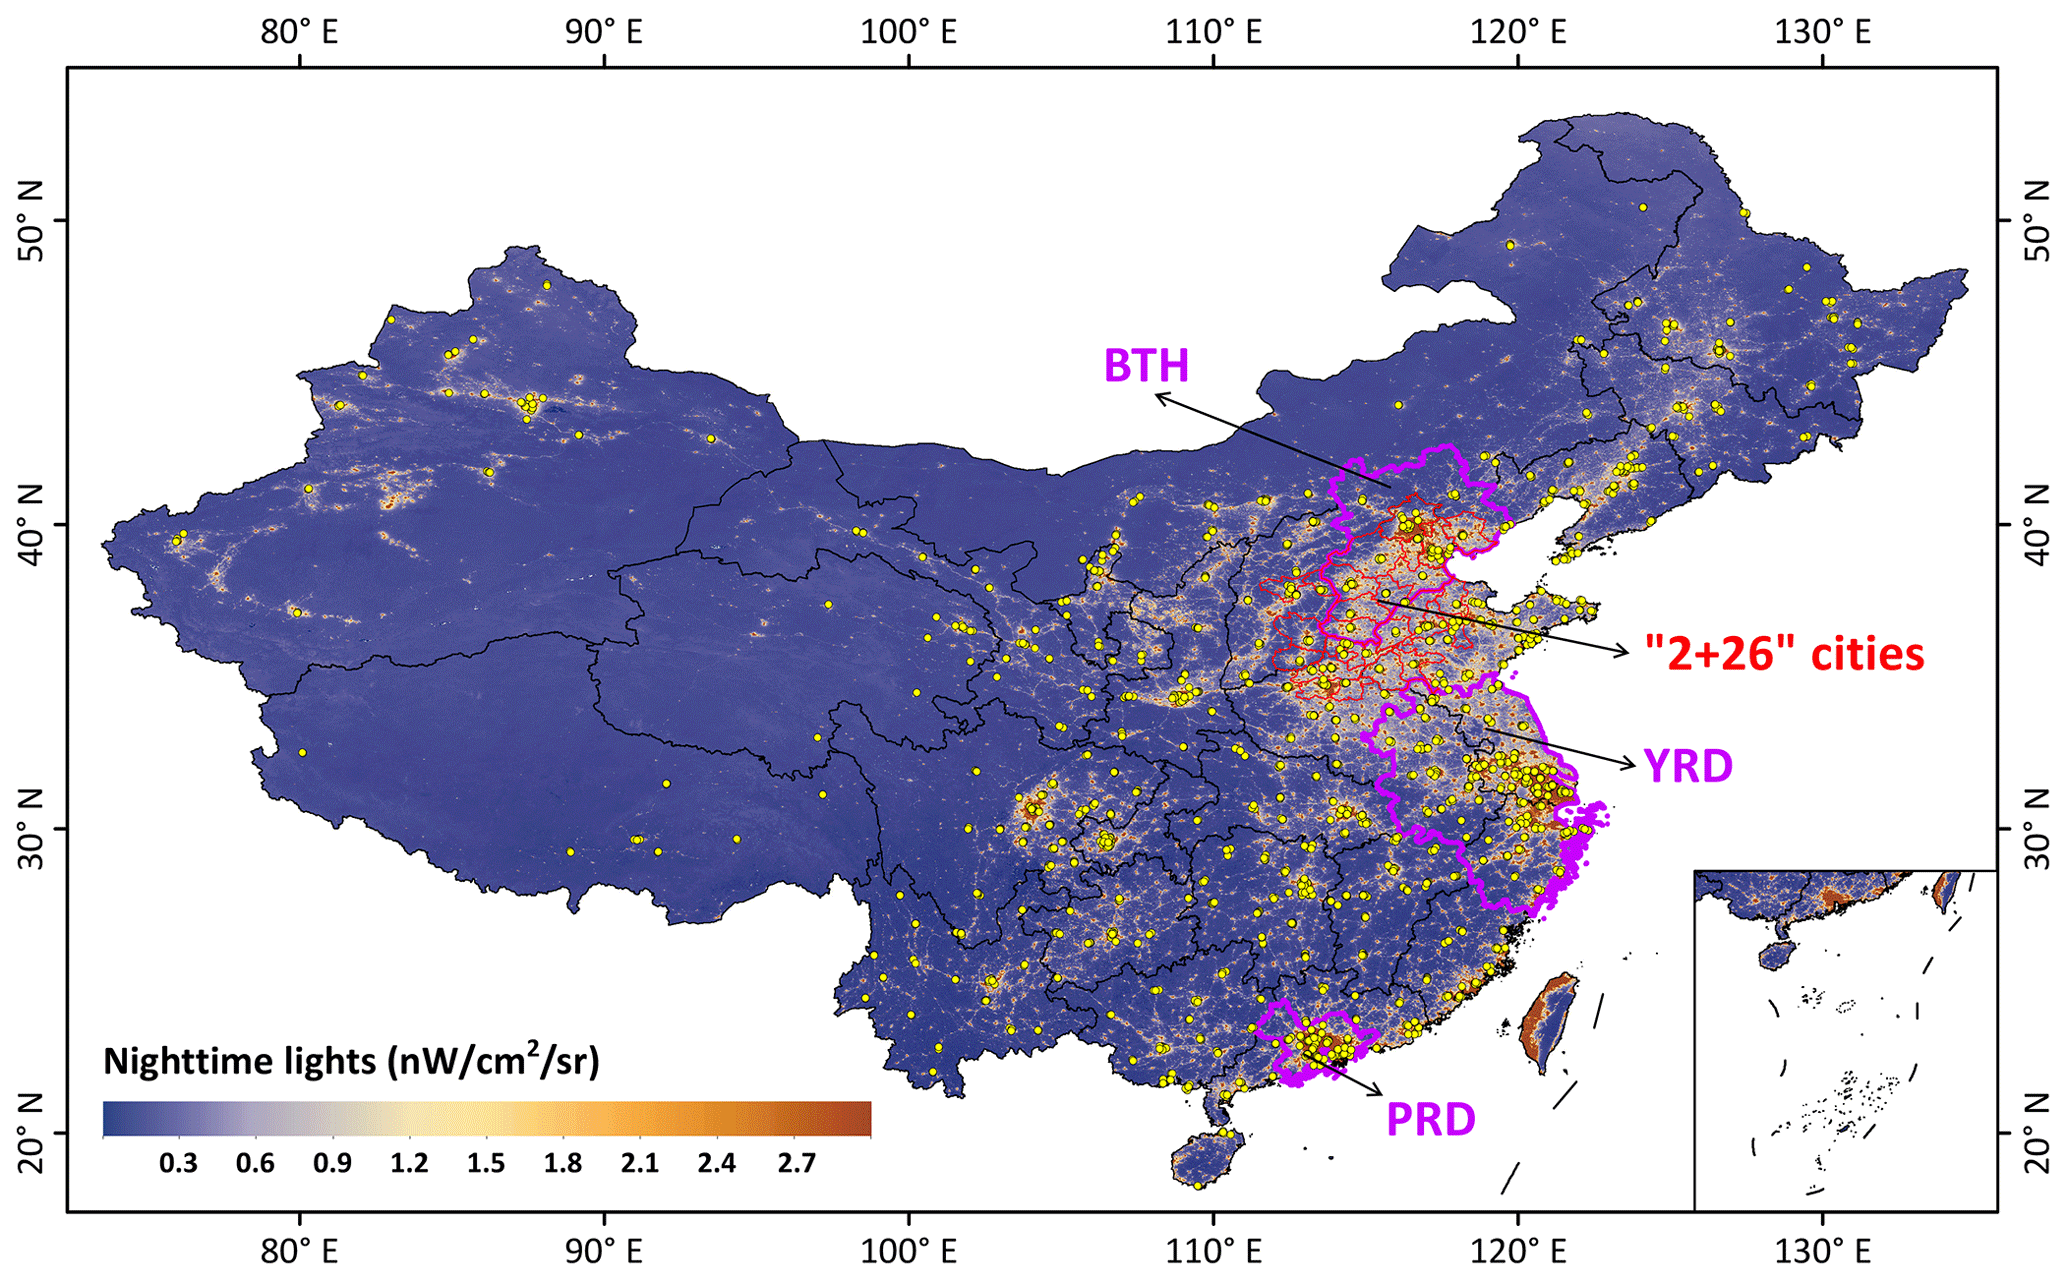
Figure 1Geographical locations of ground-based stations from the China National Environmental Monitoring Centre network (marked as yellow dots) monitoring gaseous pollutants across China. The background shows the nighttime light level, an estimate of population. Purple delineates three typical urban agglomerations: the Beijing–Tianjin–Hebei (BTH) region, the Yangtze River Delta (YRD), and the Pearl River Delta (PRD).
2.1.2 Main predictors
A new daily tropospheric NO2 dataset at a horizontal resolution of 0.25∘ × 0.25∘ in China was employed, created using a developed framework integrating OMI Aura Quality Assurance for Essential Climate Variables (QA4ECV) and Global Ozone Monitoring Experiment-2B (GOME-2B) offline tropospheric NO2 retrievals passing quality controls (i.e., cloud fraction < 0.3, surface albedo < 0.3, and solar zenith angle < 85∘; He et al., 2020a). The reconstructed tropospheric NO2 agreed well (R = 0.75–0.85) with multi-axis differential optical absorption spectroscopy (MAX-DOAS) measurements. Through this data fusion, the daily spatial coverage of satellite tropospheric NO2 was significantly improved in China (average = 87 %). Areas with a small number of missing values were imputed via a nonparametric machine-learning model by regressing the conversion relationship with Copernicus Atmosphere Monitoring Service (CAMS) tropospheric NO2 assimilations (0.75∘ × 0.75∘), making sure that the interpolation was consistent with the OMI/Aura overpass time (Inness et al., 2019; Y. Wang et al., 2020). The gap-filled tropospheric NO2 was reliable compared with measurements (R = 0.94–0.98; Wei et al., 2022b). The above two-step gap-filling procedures allowed us to generate a daily seamless tropospheric NO2 dataset that removes the effects of clouds from satellite observations.
Here, the reconstructed daily seamless tropospheric NO2 together with CAMS daily ground-level NO2 assimilations (0.75∘ × 0.75∘) averaged from all 3-hourly data in a day and monthly NOx anthropogenic emissions (0.1∘ × 0.1∘; Inness et al., 2019) were used as the main predictors for estimating surface NO2. Limited by the quality of direct satellite observations, daily model-simulated SO2 and CO surface mass concentrations, averaged from all available data in a day provided by 1-hourly Modern-Era Retrospective Analysis for Research and Applications, version 2 (MERRA-2, 0.625∘ × 0.5∘), 3-hourly CAMS (0.75∘ × 0.75∘), and 3-hourly Goddard Earth Observing System Forward-Processing (GEOS-FP, 0.3125∘ × 0.25∘) global reanalyses were used as the main predictors to retrieve surface SO2 and CO, together with CAMS monthly SO2 and CO anthropogenic emissions.
2.1.3 Auxiliary factors
Meteorological factors have important diverse effects on air pollutants (He et al., 2017; Li et al., 2019), e.g., the boundary layer height reflects their vertical distribution and variations (Z. Li et al., 2017; Seo et al., 2017); temperature, humidity, and pressure can affect their photochemical reactions (Li et al., 2019; Xu et al., 2011; C. Zhang et al., 2019); rainfall and wind can also influence their removal, accumulation, and transport (Dickerson et al., 2007; Li et al., 2019). Eight daily meteorological variables, provided by the ERA5-Land (0.1∘ × 0.1∘; Muñoz-Sabater et al., 2021) and ERA5 global reanalysis (0.25∘ × 0.25∘; Hersbach et al., 2020), were calculated (i.e., accumulated for precipitation and evaporation while averaged for the others) from all hourly data in a day, used as auxiliary variables to improve the modeling of gaseous pollutants. Other auxiliary remote sensing data used to describe land-use cover and/or change (i.e., Moderate-Resolution Imaging Spectroradiometer (MODIS) normalized difference vegetation index (NDVI), 0.05∘ × 0.05∘) and population distribution density (i.e., LandScan™, 1 km) were employed as inputs to the machine-learning model because they are highly related to the type of pollutant emission and amounts of anthropogenic emissions, as well as to the surface terrain (i.e., Shuttle Radar Topography Mission (SRTM) digital elevation model (DEM), 90 m), which can affect the transmission of air pollutants. Table S1 in the Supplement provides detailed information about all the data used in this study. All variables were aggregated or resampled into a 0.1∘ × 0.1∘ resolution for consistency.
2.2 Pollutant gas modeling
Here, the developed Space–Time Extra-Trees (STET) model (Wei et al., 2022a), integrating spatiotemporal autocorrelations of and differences in air pollutants to the extremely randomized trees (ERT; Geurts et al., 2006), was extended to estimate surface gaseous pollutants, i.e., NO2, SO2, and CO. ERT is an ensemble machine-learning model based on the decision tree, capable of solving the nonparametric, multivariable, nonlinear regression problem. Ensemble learning can avoid the lack of learning ability of a single learner, greatly improving accuracy. The introduced randomness enhances the model's anti-noise ability and minimizes the sensitivity to outliers and multicollinearity issues. It can handle high-latitude, discrete, or continuous data without data normalization and is easy to implement and parallel. However, several limitations exist, e.g., it is difficult to make predictions beyond the range of training data, and there will be an over-fitting issue on some regression problems with high noise. The training efficiency diminishes with increasing memory occupation when the number of decision trees is large.
Compared with traditional tree-based models (e.g., random forest), ERT has a stronger randomness which randomly selects a feature subset at each node split and randomly obtains the optimal branch attributes and thresholds. This helps to create more independent decision trees, further reducing model variance and improving training accuracy (Geurts et al., 2006). The STET model has been successfully applied in estimating high-quality surface O3 in our previous study (Wei et al., 2022a). It is thus extended here to regress the nonlinear conversion relationships between ground-based measurements and the main predictors and auxiliary factors for other species of gaseous pollutants. For surface NO2, the STET model was applied to the main variables of the satellite tropospheric NO2 column, modeled surface NO2 mass, and NOx emissions, together with ancillary variables of the previously mentioned meteorological, surface, and population variables (Eq. 1). For surface SO2 (Eq. 2) and CO (Eq. 3), modeled surface SO2 and CO concentrations and SO2 and CO emissions were used as main predictors along with the same auxiliary variables as NO2 to construct the STET models separately.
where NO2(ijt), SO2(ijt), and COijt indicate daily ground-based NO2, SO2, and CO measurements at one grid (i,j) on the tth day of a year; SNO2(ijt) indicates the daily satellite tropospheric NO2 column at one grid (i,j) on the tth day of a year; MNO2(ijt), MSO2(ijt), and MCOijt indicate daily model-simulated surface NO2, SO2, and CO concentrations at one grid (i,j) on the tth day of a year; ENOxijm, ESO2(ijm), and ECOijm indicate monthly anthropogenic NOx, SO2, and CO emissions at one grid (i,j) in the mth month of a year; Meteorologyijt represents each meteorological variable at one grid (i,j) on the tth day of a year; DEMijy and POPijy indicate the elevation and population at one grid (i,j) of a year; and Ps and Pt indicate the space and time terms (Wei et al., 2022a).
3.1 Seamless mapping of surface gaseous pollutants
Using the constructed STET model, we generated daily 10 km datasets with complete coverage (spatial coverage = 100 %) for three ground-level gaseous pollutants from 2013 to 2020 in China, called ChinaHighNO2, ChinaHighSO2, and ChinaHighCO. Monthly and annual maps were generated by directly averaging daily data at each grid. They belong to a series of public long-term, full-coverage, high-resolution, and high-quality datasets of a variety of ground-level air pollutants for China (ChinaHighAirPollutants, CHAP) developed by our team. Figure 2 shows spatial distributions of the three pollutant gases across China on a typical day (1 January 2018). The spatial patterns of these gaseous pollutants were consistent with those observed on the ground, especially in highly polluted areas, e.g., severe surface NO2 pollution in the North China Plain (NCP) and high surface SO2 emissions in Shanxi Province. The unique advantage of our dataset is that it can provide valuable gaseous pollutant information on a daily basis at locations in China where ground measurements are not available. This addresses the major issues of scanning gaps and numerous missing values in satellite remote sensing retrievals under cloudy conditions, e.g., the average spatial coverage of the official OMI/Aura daily tropospheric NO2 product is only 42 % over the whole of China during the period 2013–2020 (Fig. S1). Our dataset provides spatially complete coverage, significantly increasing daily satellite observations by 58 %. In addition, reanalysis data do not simulate surface masses of gaseous pollutants well, underestimating them compared to our results and ground-based observations in China (Fig. S2). This is especially so for SO2, where high-pollution hotspots are easily misidentified. Validation illustrates that our regressed results for surface NO2, SO2, and CO agree better with ground measurements than modeled results (slopes are close to 1, and correlations > 0.93), being 1.9–6.4 times stronger in slope and 1.3–3.5 times higher in correlation, but 5.9–7.7 times smaller in differences (Fig. S3). This shows that our model can take advantage of big data to significantly correct and reconstruct gaseous simulation results via data mining using machine learning.
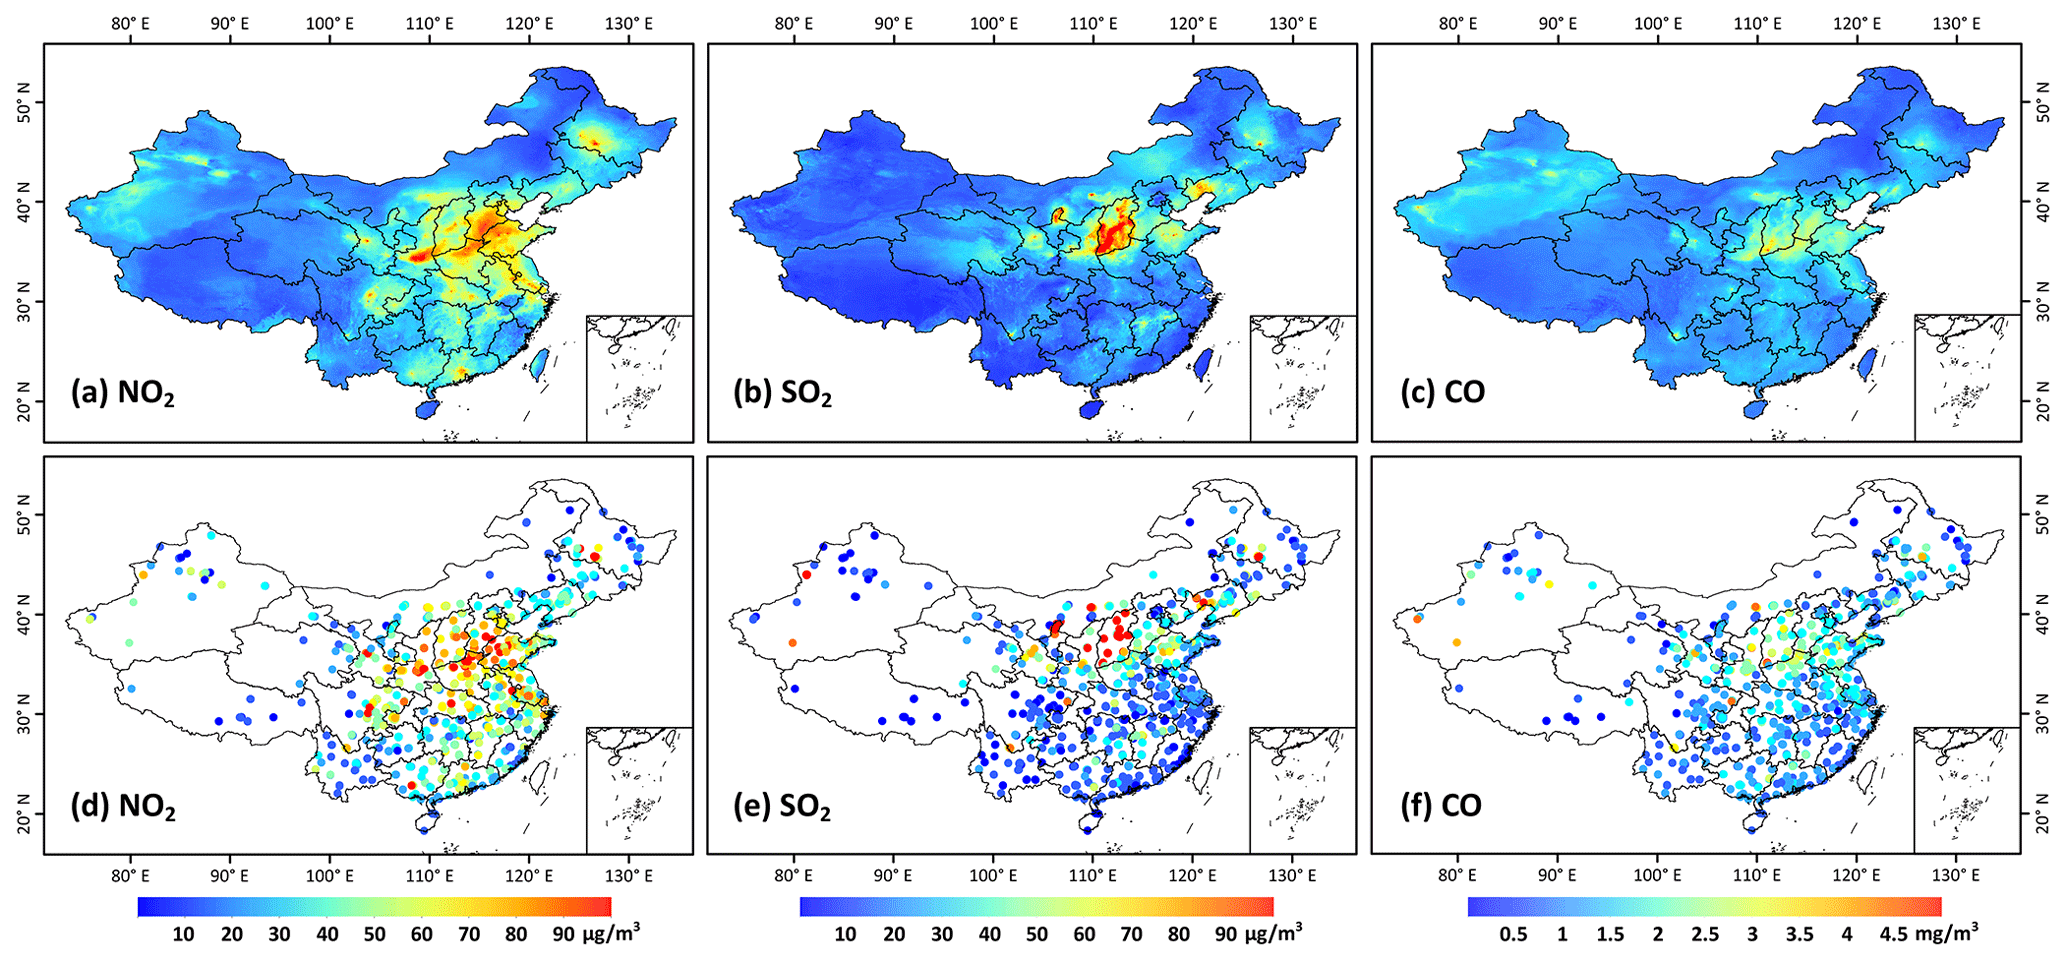
Figure 2A typical example of (a–c) big-data-derived (horizontal resolution = 10 km) seamless surface NO2 (µg m−3), SO2 (µg m−3), and CO (mg m−3) concentrations and (d–f) corresponding ground measurements on 1 January 2018 in China.
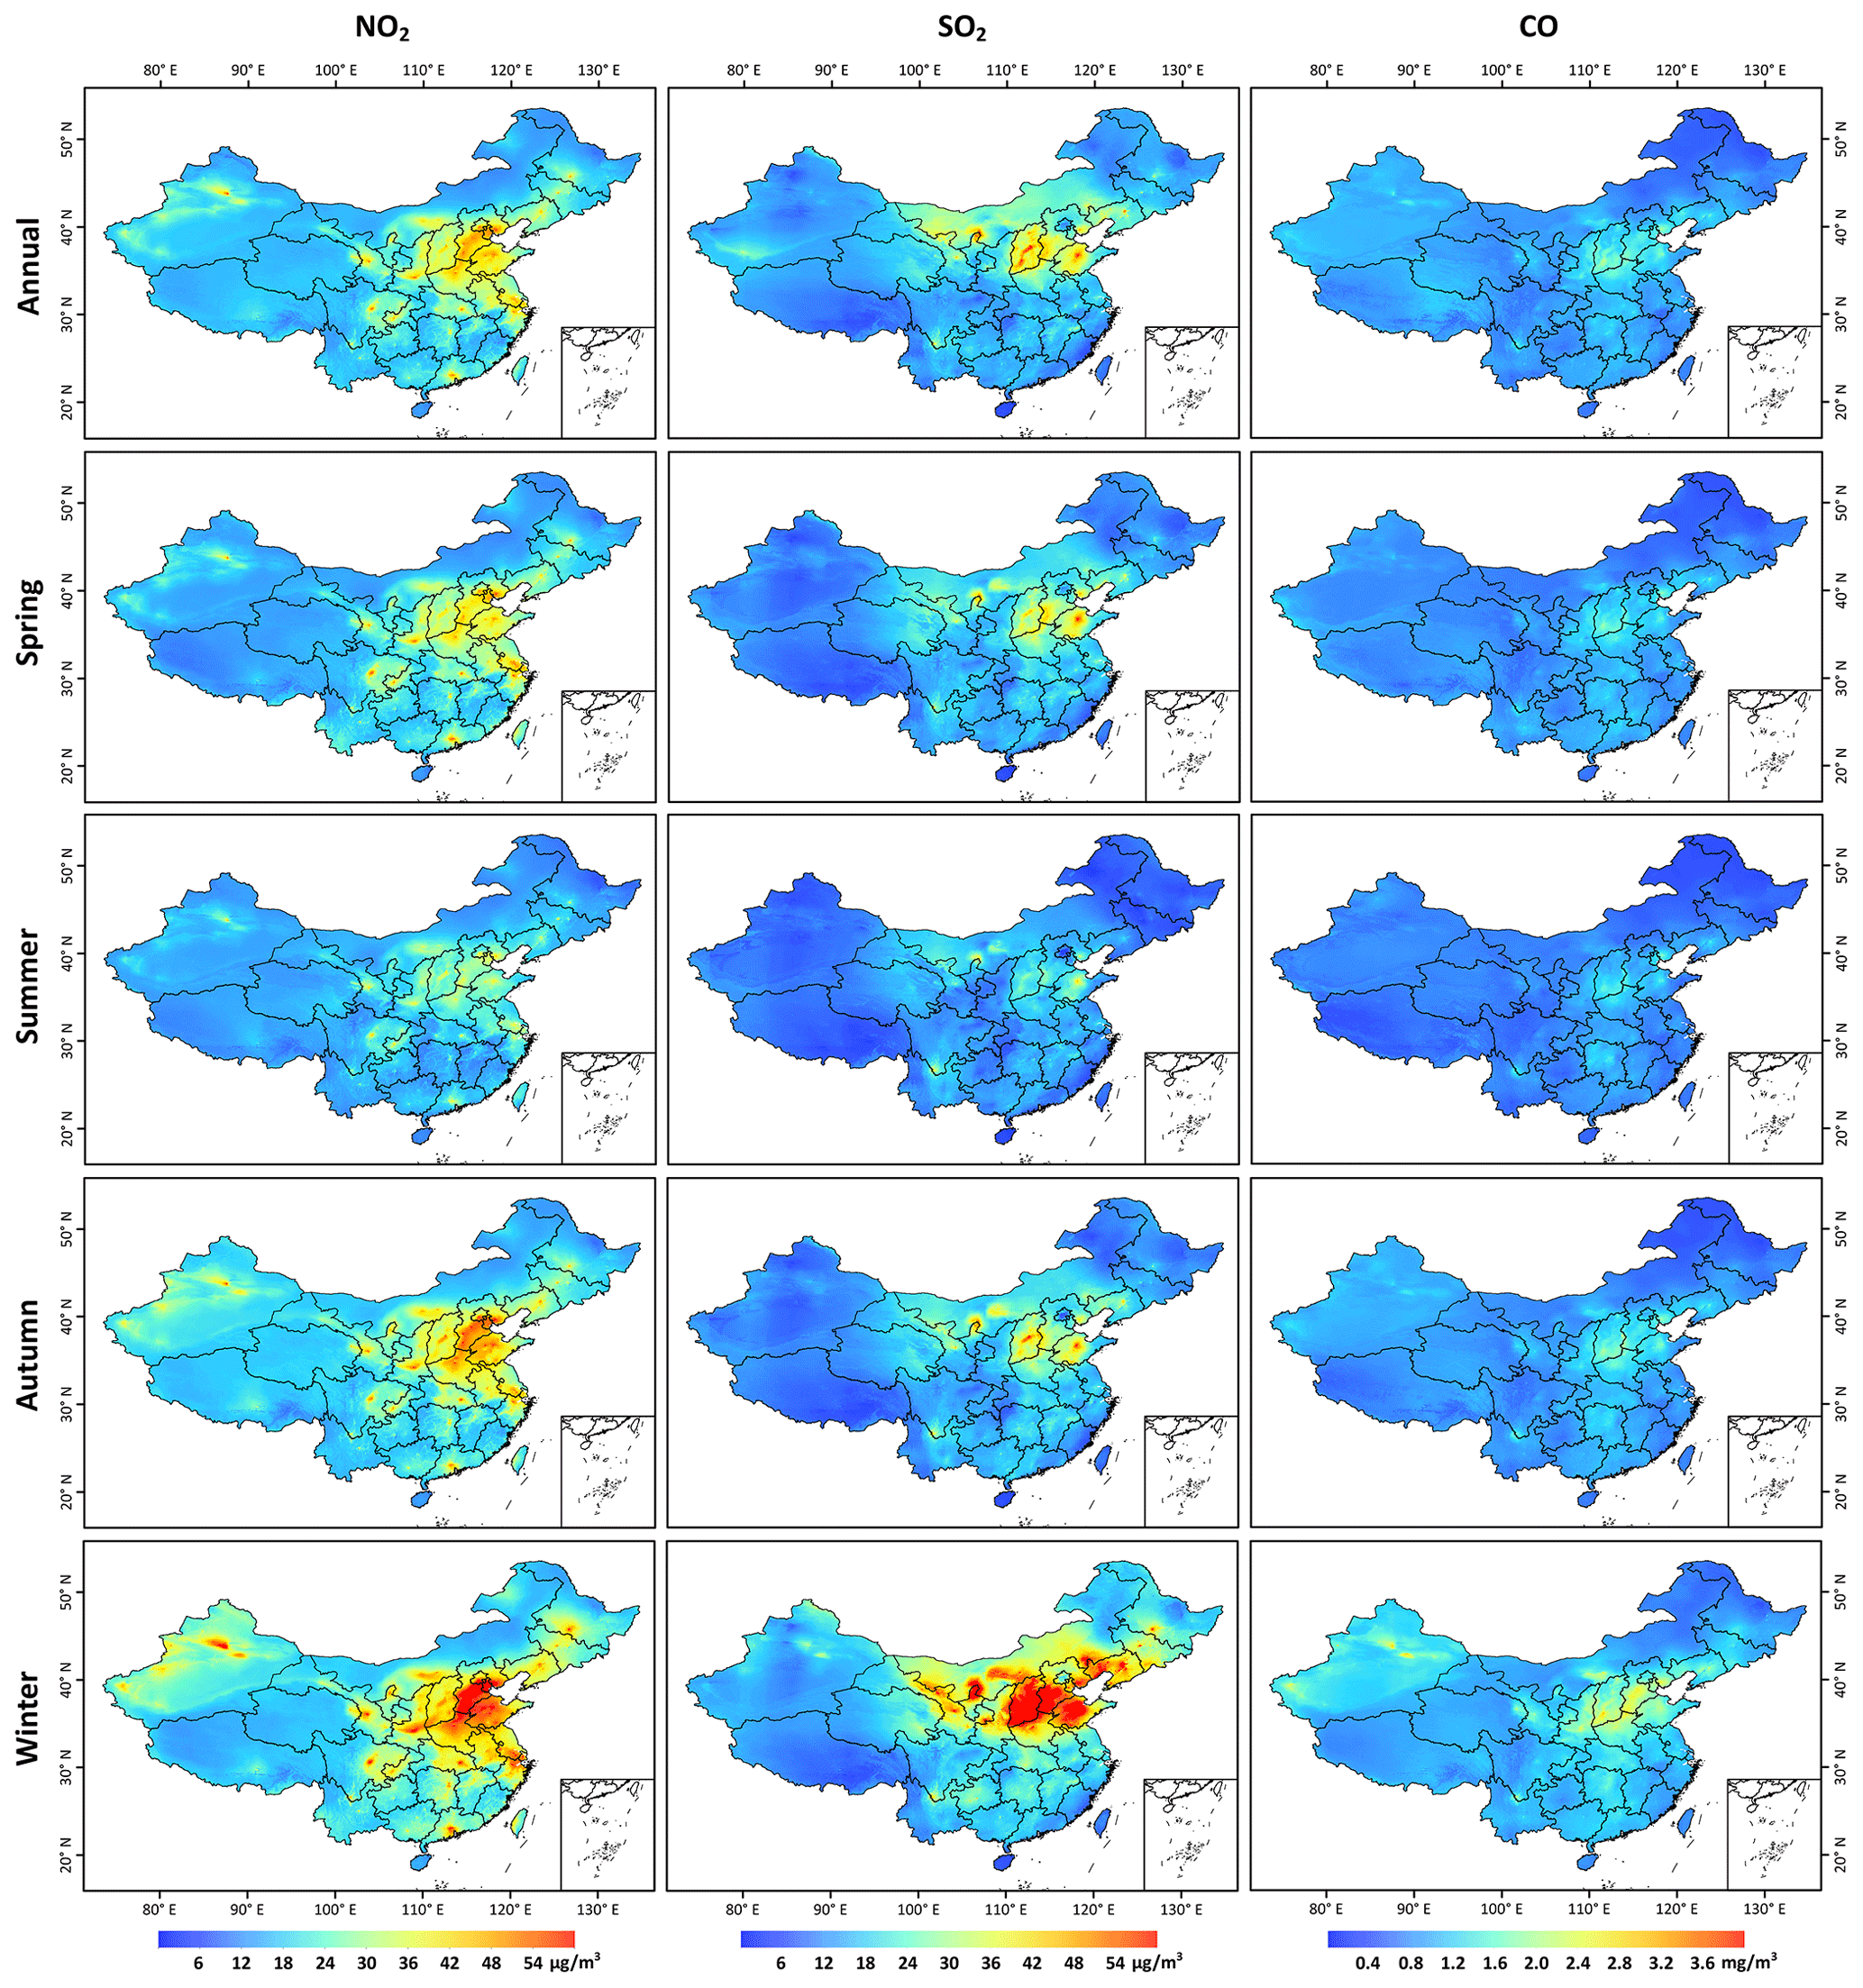
Figure 3Annual- and seasonal-mean maps (horizontal resolution = 10 km) of surface NO2 (µg m−3), SO2 (µg m−3), and CO (mg m−3) averaged over the period 2013–2020 in China.
Figure 3 shows annual and seasonal maps for each gas pollutant during the period 2013–2020 across China. Multi-year mean surface NO2, SO2, and CO concentrations were 20.3 ± 4.7 µg m−3, 16.2 ± 7.7 µg m−3, and 0.86 ± 0.22 mg m−3, respectively. Pollutant gases varied significantly in space across China, where high surface NO2 levels were mainly distributed in typical urban agglomerations, e.g., the Beijing–Tianjin–Hebei (BTH) region, the Yangtze River and Pearl River deltas (YRD and PRD), and scattered large cities with intensive human activities and highly developed transportation systems (e.g., Urumqi, Chengdu, Xi'an, and Wuhan, among others). High surface SO2 concentrations were mainly observed in northern China (e.g., Shanxi, Hebei, and Shandong provinces), associated with combustion emissions from anthropogenic sources, and the Yunnan–Guizhou Plateau in southwest China, likely associated with emissions from volcanic eruptions. By contrast, except in some areas in central China (e.g., Shanxi and Hebei), surface CO concentrations were overall low.
Significant differences in spatial patterns were seen at the seasonal level. Surface NO2, SO2, and CO in summer (average = 15.9 ± 4.7 µg m−3, 22.9 ± 13.4 µg m−3, and 1.1 ± 0.3 mg m−3, respectively) were the lowest, thanks to favorable meteorological conditions, e.g., abundant precipitation and high air humidity conducive to flushing and scavenging of different air pollutants (Yoo et al., 2014). Strong sunlight and high temperature also accelerate the photochemical reactions of NO2 loss (Shah et al., 2020). Pollution levels were highest in winter, with average values increasing by ∼ 1.5–1.9 times those in summer. This difference was much larger in central and eastern China, e.g., 2.3–3.4 times higher in the BTH due to large amounts of direct NOx, SO2, and CO emissions from burning coal for heating in winter in northern China. The spatial patterns of the three gaseous pollutants were similar in spring and autumn.
3.2 Changes in gaseous pollution and exposure risk
3.2.1 Short-term pandemic effects on air quality
Many studies have focused on the effects of the COVID-19 pandemic on air quality (WHO, 2020). Most of them were done using ground-based observations (Huang et al., 2020; Su et al., 2020), tropospheric gas columns (Field et al., 2021; Levelt et al., 2022), or retrieved surface masses (Cooper et al., 2022; Ling and Li, 2021). The resulting conclusions could be affected by insufficient spatial representation due to the uneven distribution of ground monitors or a large number of missing values in space due to the influence of clouds. The unique advantage of our seamless day-to-day gaseous pollutant dataset can make up for these shortcomings, allowing us to assess the changes in gaseous pollutants during the pandemic more accurately and quantitatively.
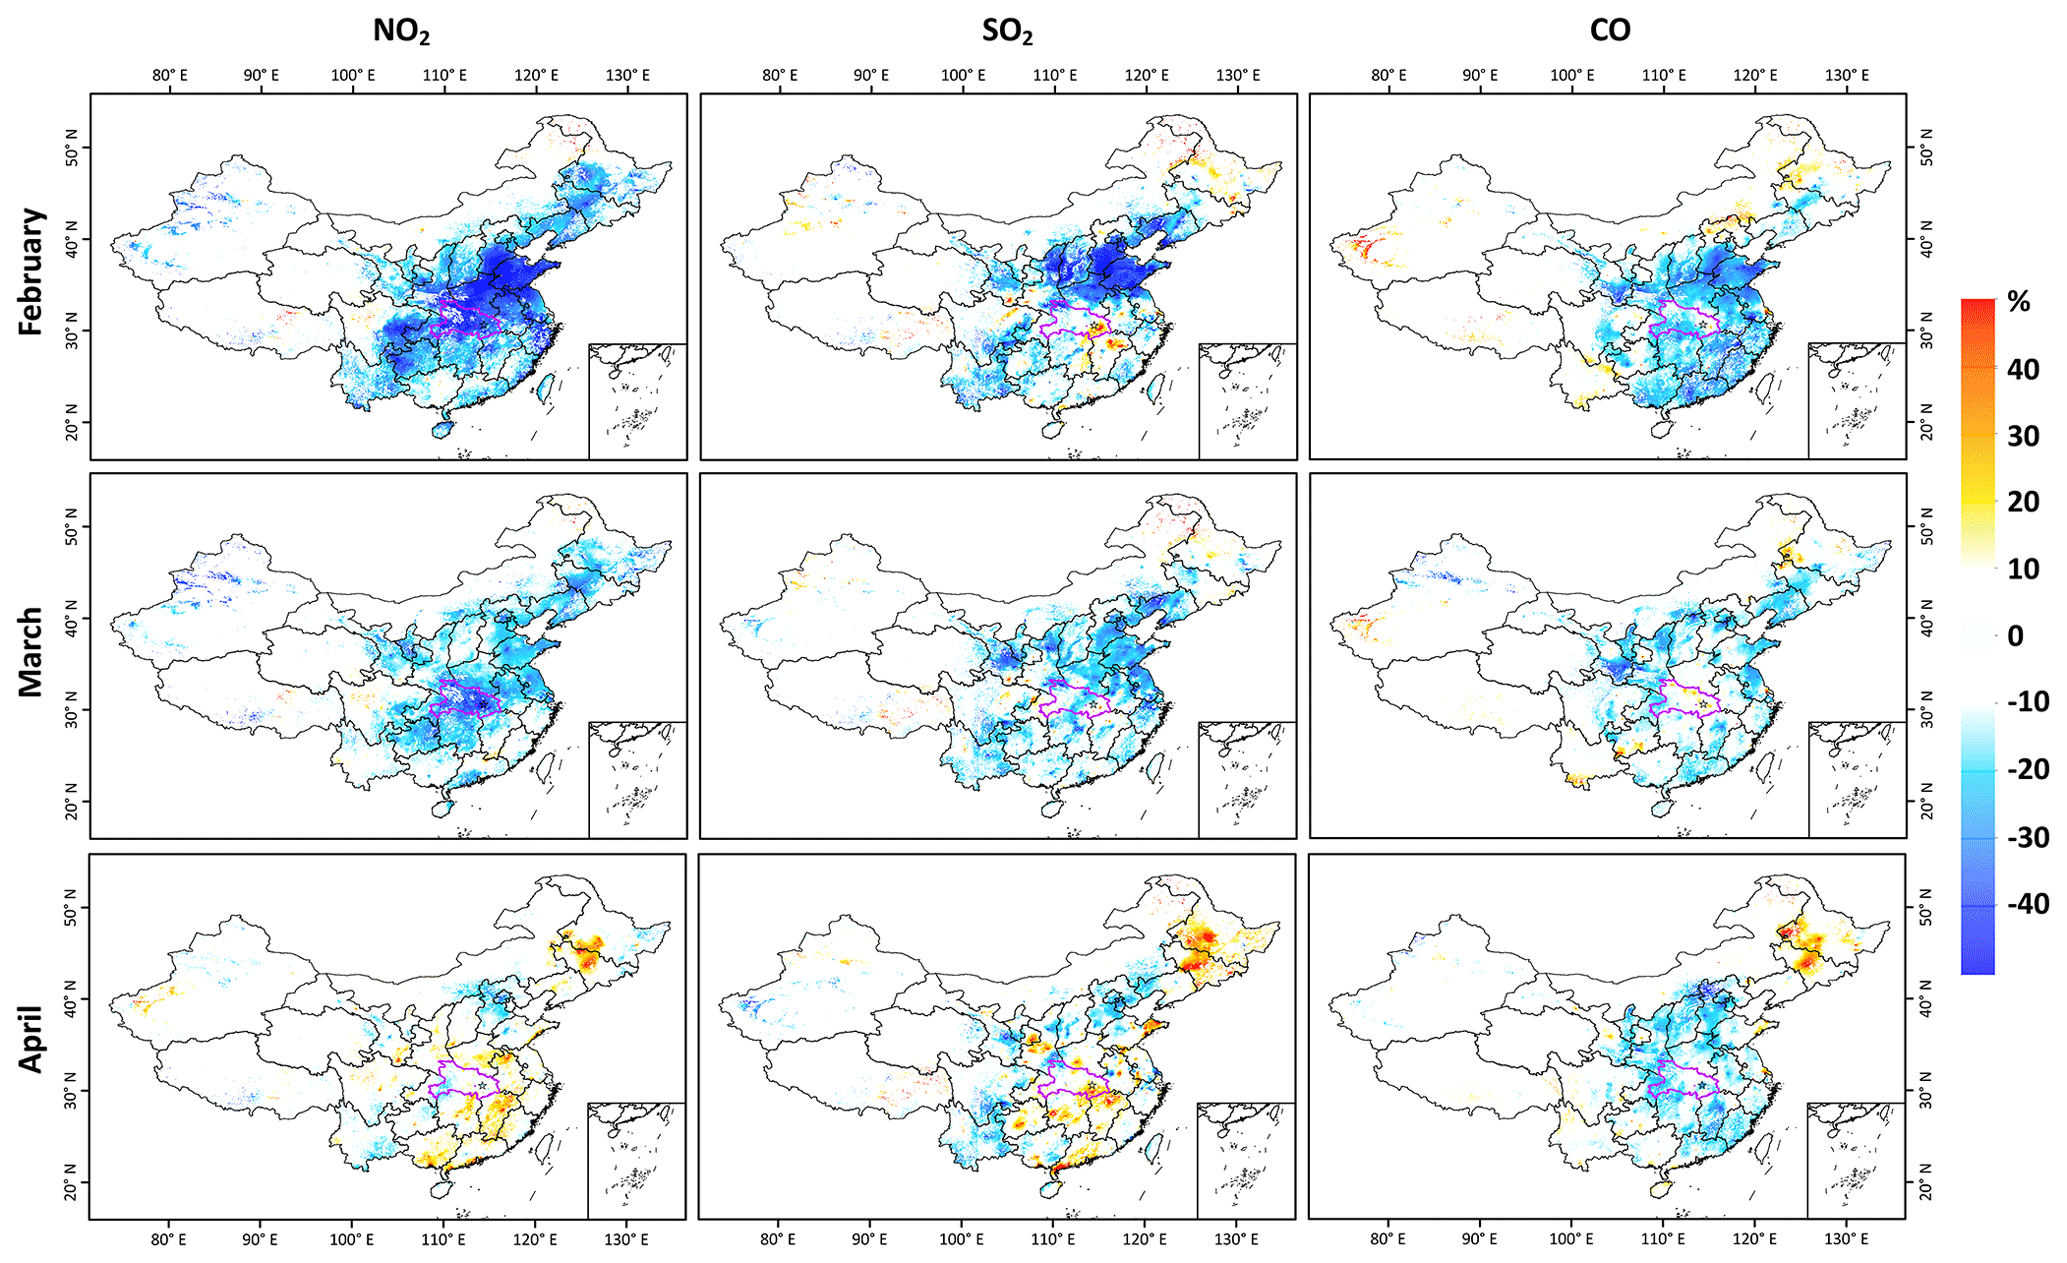
Figure 4Relative changes (%) in surface NO2, SO2, and CO concentrations in February, March, and April between 2019 and 2020 in populated areas of China. The area outlined in magenta and the star in each panel indicate Hubei Province and Wuhan City, respectively.
We first compared the spatial differences in monthly relative differences from February to April between 2020 and 2019 in China (Fig. 4). In February, surface NO2 sharply reduced in China, especially in key urban agglomerations and megacities, showing relative changes of greater than 50 %. A significant decrease in surface SO2 (> 40 %) was observed in northern areas where heavy industry is the mainstay in China (e.g., Tianjin, Hebei, and Shandong), while little change was seen in southern China. Surface CO also showed drastic decreases, but the amplitude was smaller than the other two gaseous pollutants. These were attributed to extensive plant closures and traffic controls due to the lockdown, which started at the end of January 2020, significantly reducing anthropogenic NOx, SO2, and CO emissions (Ding et al., 2020; Yang et al., 2022; Zheng et al., 2021). In March, surface NO2 was still generally lower than the historical level in most eastern areas, especially in areas where the pandemic was severe, i.e., Wuhan, Hubei Province, and its surrounding areas. The decrease in surface SO2 largely slowed by more than 2 times in the NCP and central China, while surface CO almost returned to normal levels in most areas in China. In April, surface NO2 and SO2 were comparable to historical concentrations (within ±10 %), even increasing in some areas of the southern and northeastern areas due to rebounding anthropogenic emissions (Ding et al., 2020), especially in Hubei Province, indicating that their surface levels were almost recovered.
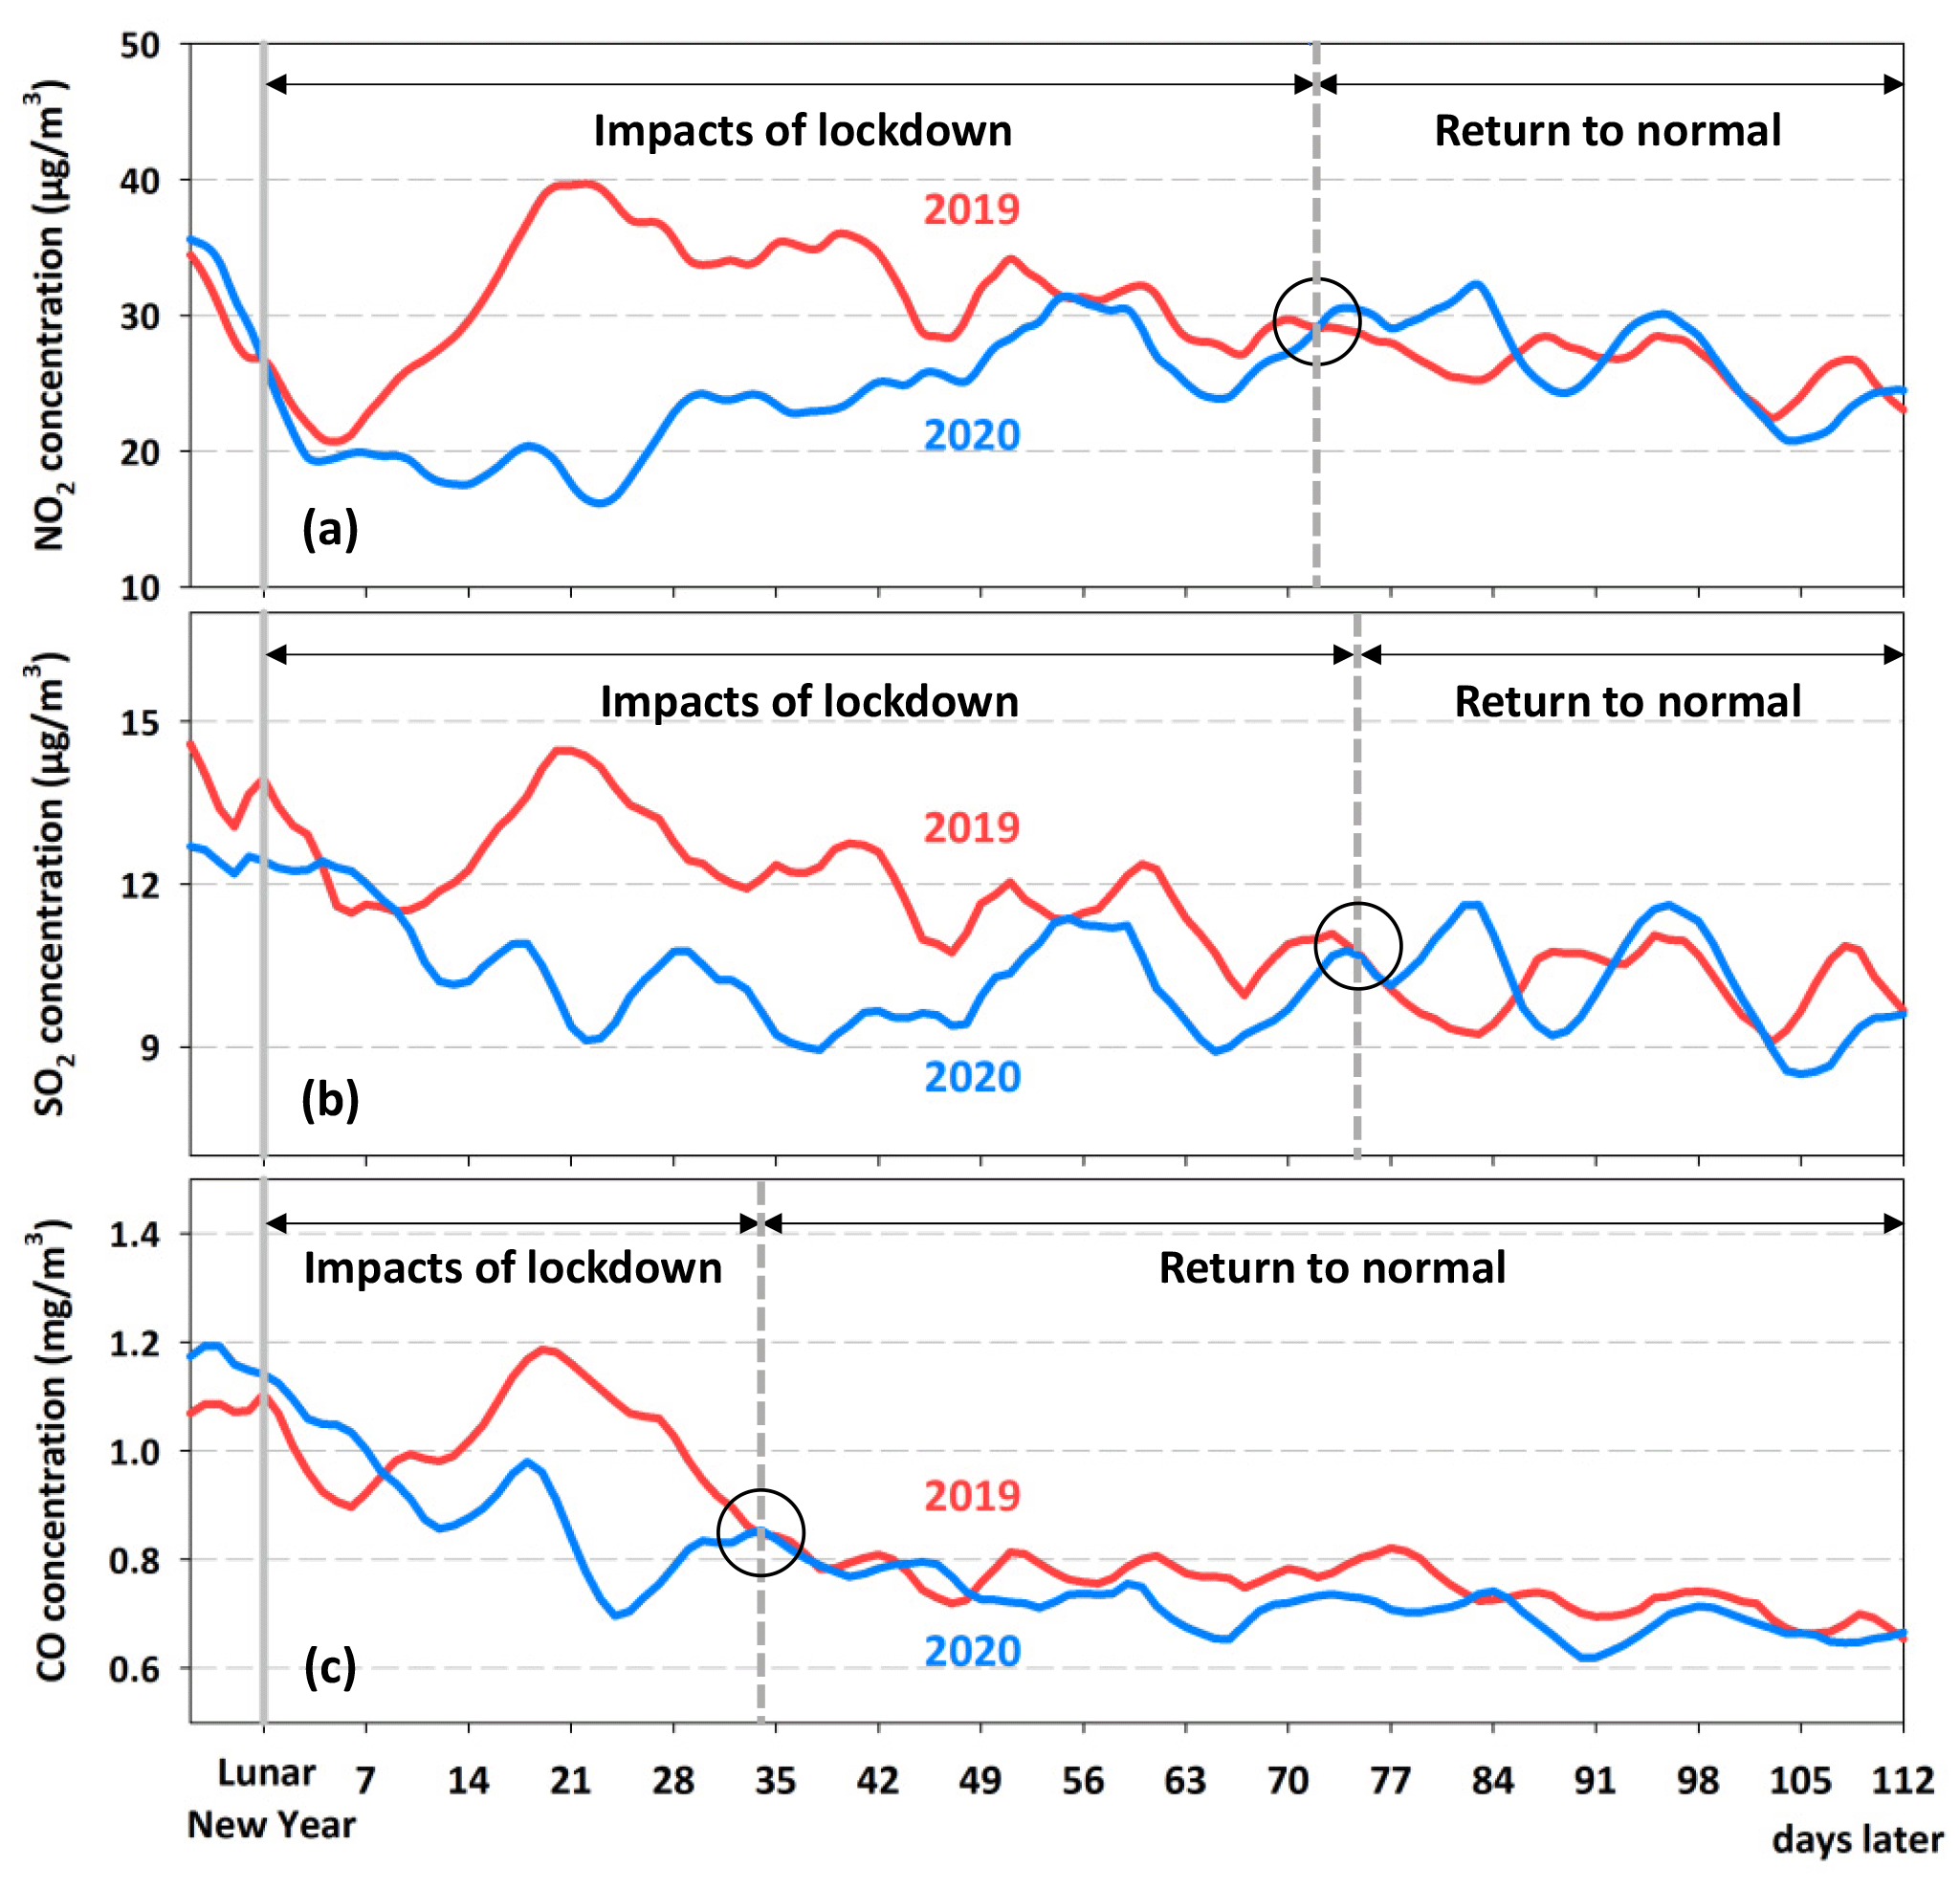
Figure 5Time series of the 7 d moving averages of daily population-weighted surface (a) NO2, (b) SO2, and (c) CO concentrations after the Lunar New Year of 2019 and 2020 in China. The black circle in each panel shows the turning point when the gaseous pollutants began to return to their normal levels.
Most previous studies have focused mainly on changes in air pollutants during the lockdown, with little attention paid to the recovery. We thus compared the time series of daily population-weighted concentrations of the three gaseous pollutants after the Lunar New Year between 2020 and 2019 in China (Fig. 5). After the beginning of New Year's Eve, surface gaseous pollutants showed a significant decrease in both the normal and pandemic years due to the closure of factories, with decreasing anthropogenic emissions during the Spring Festival holiday. However, gaseous pollutants in the normal year rose rapidly after they fell to their lowest levels due to the return to work after the holidays. By contrast, their levels continued to decrease in 2020 and were lower than historical levels due to the sustained impacts of the strict lockdowns. They hit bottom in the 4th week after the Lunar New Year, then they began to increase gradually. Surface NO2 and SO2 recovered in the middle of the 11th week (around the 72nd and 75th days) after the Lunar New Year (i.e., 2020 and 2019 concentrations intersected and then alternately changed). However, surface CO levels recovered at the end of the 5th week (around the 34th day), more than 2 times faster than NO2 and SO2 levels. This is attributed to more CO emissions from increased residents' indoor cooking (Zheng et al., 2018), increased atmospheric oxidation capacity (Huang et al., 2020; Wei et al., 2022a), and a potentially higher sensitivity to temperature rises (Lin et al., 2021).
3.2.2 Temporal variations and policy implications
Figures S4–S6 show annual-mean maps of each gaseous pollutant from 2013 to 2020 in China. Surface NO2, SO2, and CO changed greatly, peaking in 2013, with average values of 21.3 ± 8.8 µg m−3, 23.1 ± 13.3 µg m−3, and 1.01 ± 0.29 mg m−3, respectively. They reached their lowest levels in 2020, particularly due to the noticeable effects of the COVID-19 pandemic. In general, national ambient NO2, SO2, and CO concentrations decreased by approximately 12 %, 55 %, and 17 % from 2013 to 2020, respectively. Large seasonal differences were observed in the amplitude of gaseous pollutants (Fig. 6), e.g., surface NO2 decreased the most in winter, especially in the three urban agglomerations (↓ 24 %–31 %), and changed the least in autumn (especially in the YRD). Surface SO2 showed much larger decreases in all seasons, especially during the cold seasons (↓ 55 %–81 %) due to the implementation of stricter “ultra-low” emission standards (C. Li et al., 2022; Q. Zhang et al., 2019). Surface CO had similar seasonal changes as SO2, but these were 1.5–3.3 times smaller in amplitude.
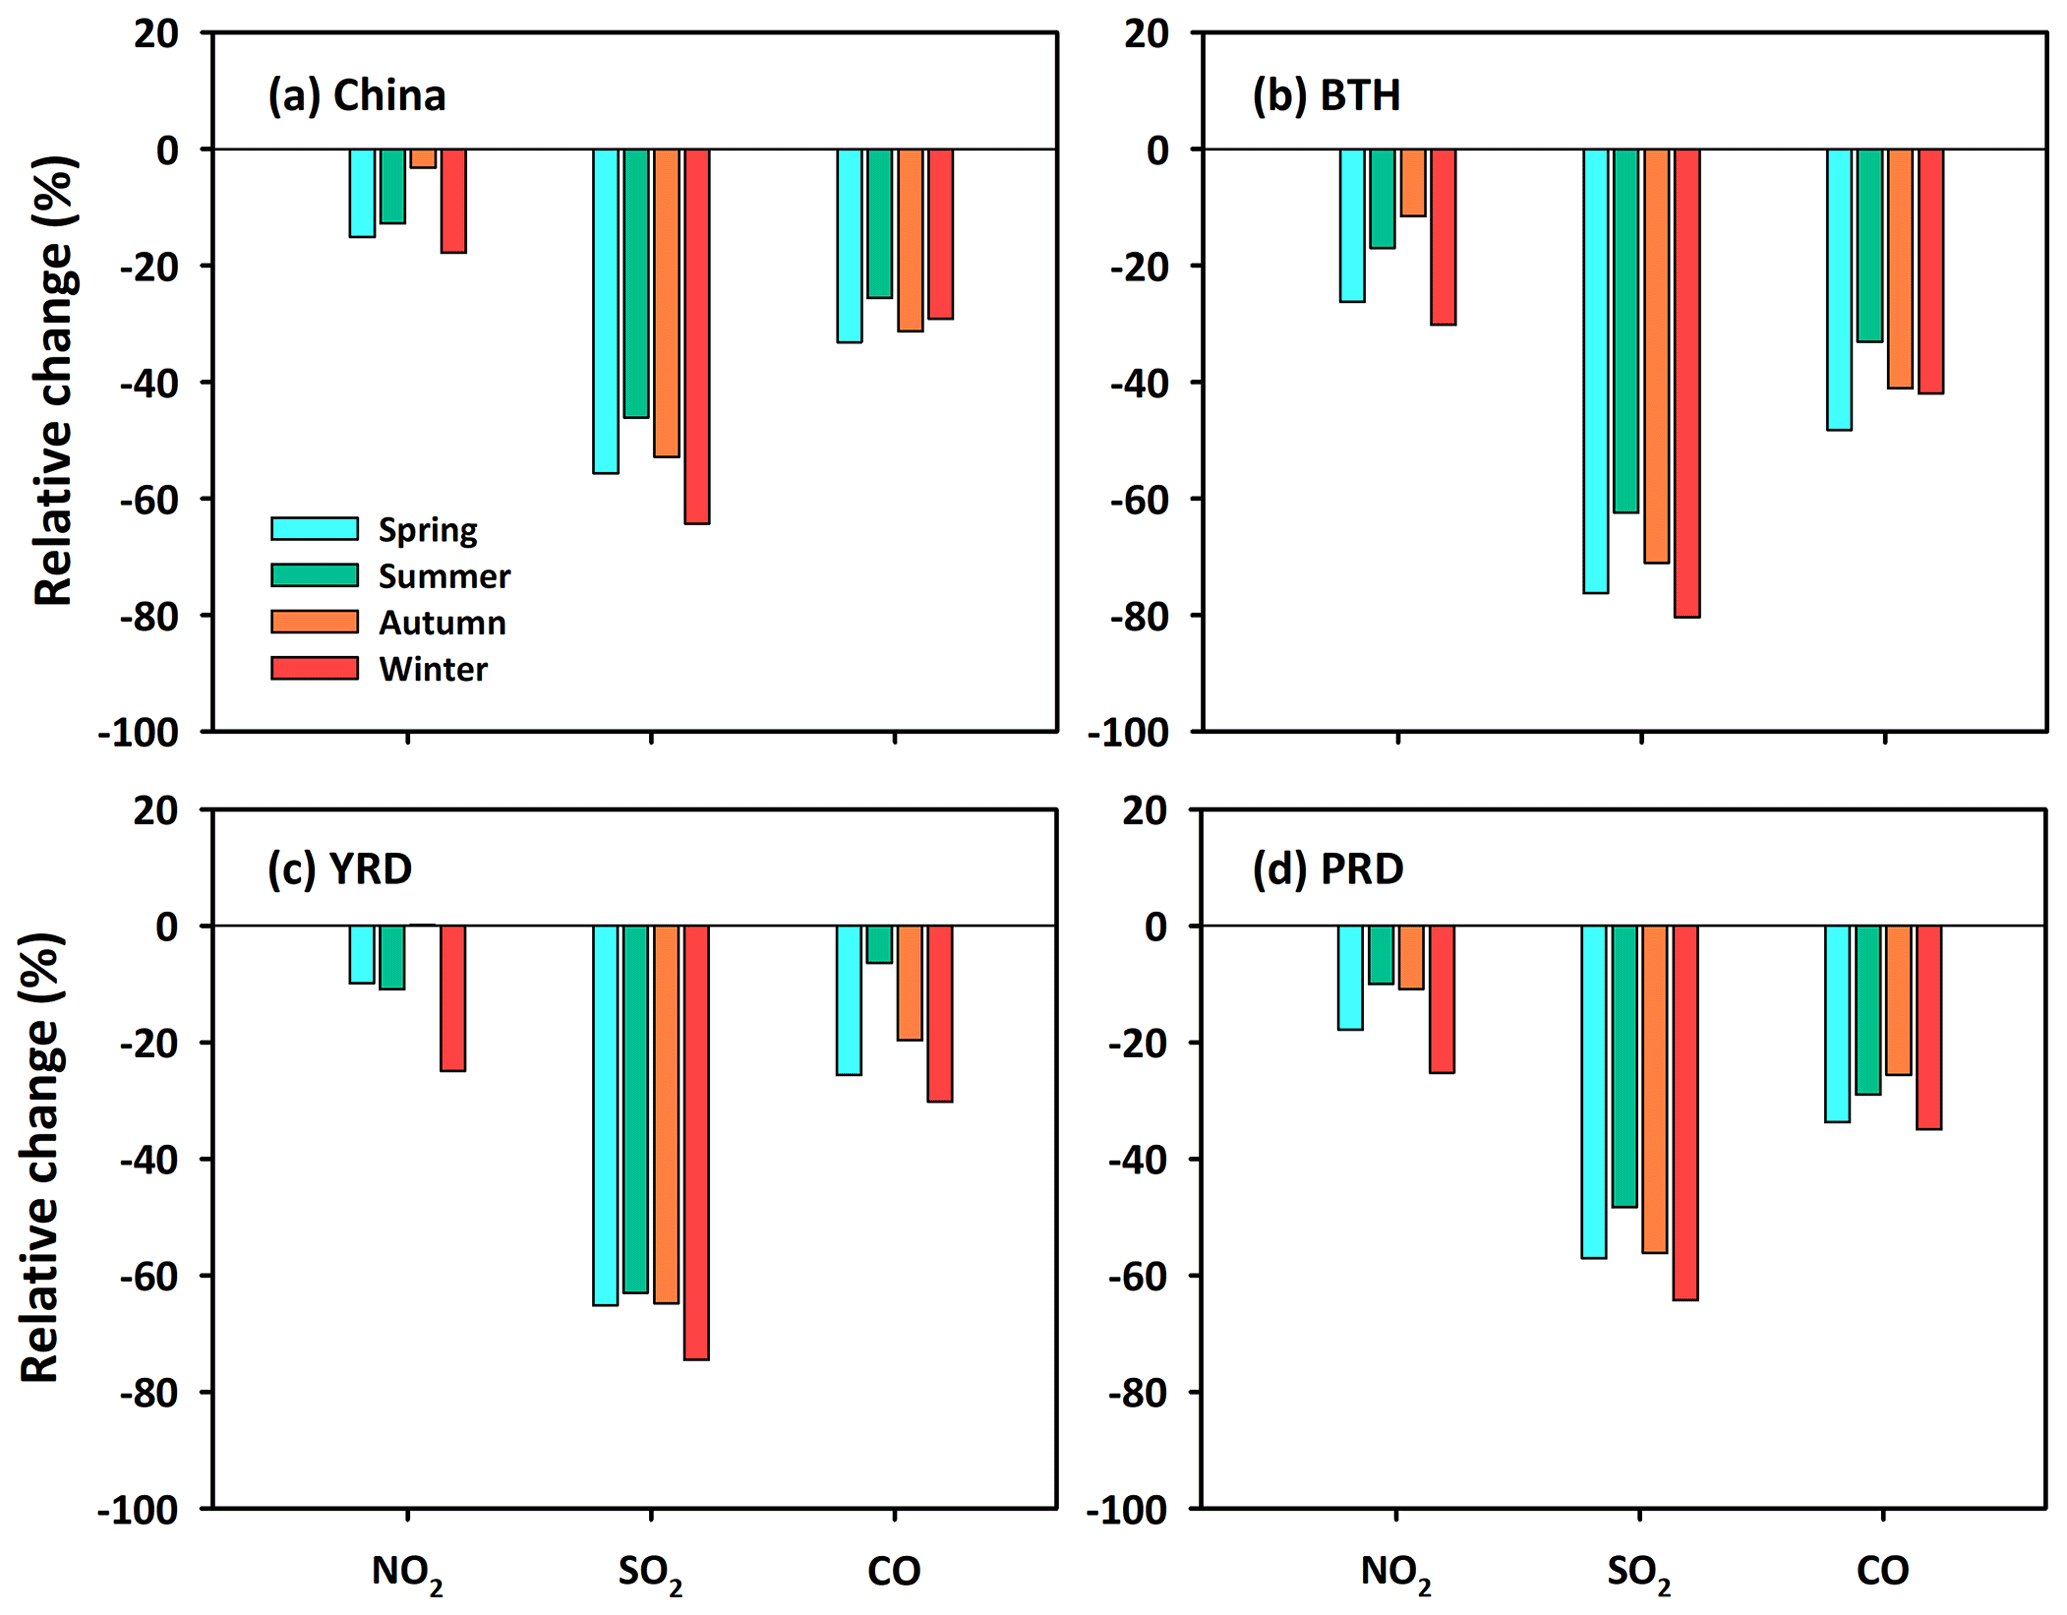
Figure 6Relative changes (%) in seasonal mean surface NO2, SO2, and CO concentrations between 2013 and 2020 over (a) China, (b) the Beijing–Tianjin–Hebei (BTH) region, (c) the Yangtze River Delta (YRD), and (d) the Pearl River Delta (PRD).
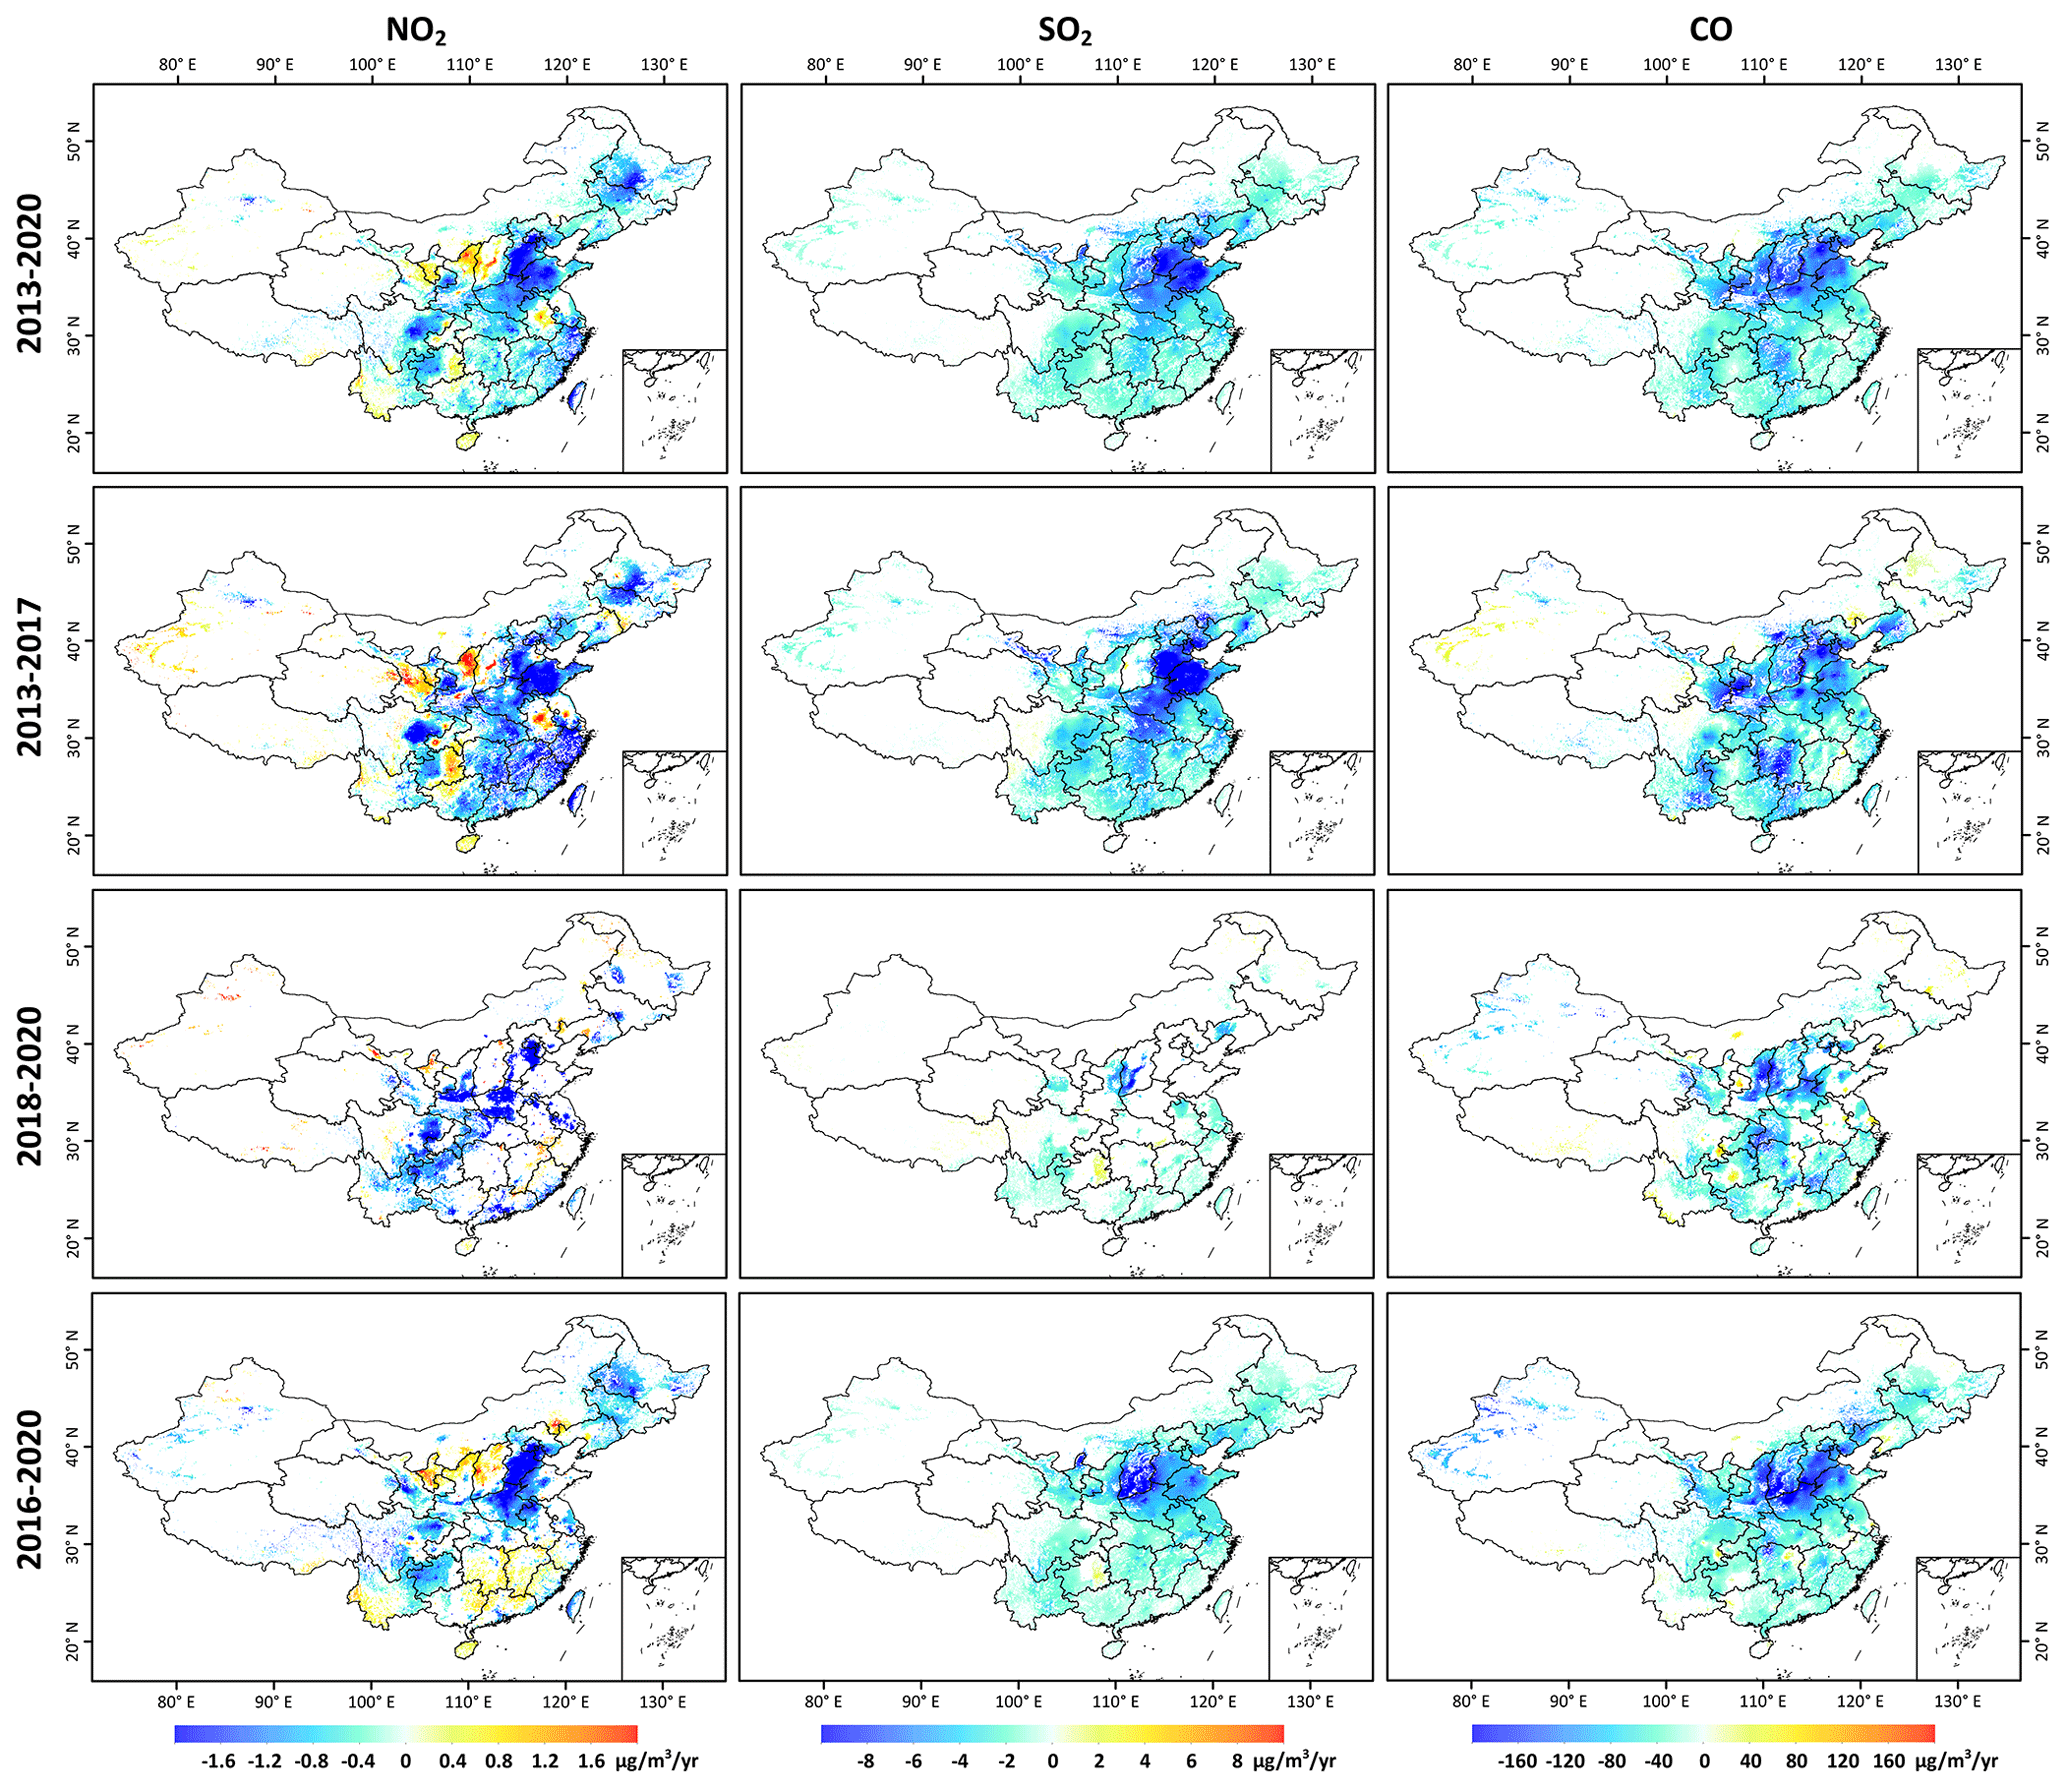
Figure 7Temporal trends of surface NO2, SO2, and CO concentrations during the whole period (2013–2020), the Clean Air Action Plan (2013–2017), the Blue Sky Defense War (2018–2020), and the 13th Five-Year Plan (2016–2020) in populated areas of China. Only regions with trends that are significant at the 95 % (p < 0.05) confidence level are shown.
To better investigate the spatiotemporal variations of ambient gaseous pollution, we calculated linear trends and significance levels using monthly anomalies by removing seasonal cycles. Most of China showed significant decreasing trends, with average annual rates of 0.23 µg m−3, 2.01 µg m−3, and 0.05 mg m−3 for surface NO2, SO2, and CO (p < 0.001), respectively (Fig. 7), especially in three urban agglomerations and large cities (e.g., Wuhan and Chengdu). The largest downward trends mainly occurred in northern and central China, especially in the BTH (Table S2). This is mainly due to the change in fuel for heating from coal to gas widespread across China in winter (S. Wang et al., 2020), greatly reducing emissions of precursor gases (Koukouli et al., 2018). Increasing trends of surface NO2 were, however, found in Ningxia and Shanxi provinces in central China due to increased traffic emissions and new coal-burning power plants in underdeveloped areas without strict regulations on NOx emissions (C. Li et al., 2022; Maji and Sarkar, 2020; Van Der A et al., 2017).
We then divided the study period into three periods to investigate the impact of major environmental protection policies on air quality implemented in China (Fig. 7). During the Clear Air Action Plan (CAAP, 2013–2017), the rates of decrease for surface NO2, SO2, and CO accelerated in most populated areas in China, especially urban areas. This was due to dramatic reductions in main pollutant emissions like SO2 and NOx (by 59 % and 21 %, respectively) through the upgrading of key industries, industrial structure adjustments, and coal-fired boiler remediation (Q. Zhang et al., 2019). In addition, the majority of gaseous pollutants had dropped continuously during the Blue Sky Defense War (BSDW, 2018–2020), benefiting from continuous reductions in total air pollutant emissions and the impacts of COVID-19 (Jiang et al., 2021; Zheng et al., 2021). However, areas with trends passing the significance level sharply shrank, especially for SO2.
During the 13th Five-Year Plan (FYP, 2016–2020), the decreasing trends of the three gaseous pollutants across China slowed down compared to those during CAAP. Large decreases in surface NO2 were mainly found in the BTH region and Henan Province, while slightly increasing trends occurred in southern China. Surface SO2 significantly decreased in most areas, where a greater downward trend was observed in Shanxi Province, mainly due to the reduction in coal consumption thanks to a strengthened clean-heating policy (Lee et al., 2021). Surface CO also continuously decreased, more rapidly in central China but less rapidly elsewhere. The continuous decline in gaseous pollutants is due to the binding reductions in total emissions of major pollutants like NOx (↓ 71 %) and SO2 (↓ 48 %) in China (Wan et al., 2022; X. Wu et al., 2022).
3.2.3 Population-risk exposure to gaseous pollution
With the daily seamless datasets, we can evaluate the spatial and temporal variations of short-term population-risk exposure to the three gaseous pollutants by calculating the number of days in a given year exceeding the new recommended short-term minimum interim target (IT1) and desired air quality guidelines (AQG) level defined by the World Health Organization (WHO) in 2021 (WHO, 2021). The area exceeding the recommended levels (i.e., daily NO2 > 120 µg m−3, SO2 > 125 µg m−3, and CO > 7 mg m−3) was generally small in eastern China (Fig. S7). High NO2-exposure risks were mainly found in Beijing and Hebei Province and in a handful of big cities (e.g., Jinan, Wuhan, Shanghai, and Guangzhou), while high SO2-exposure risks were mainly observed in Hebei, Shandong, and Shanxi Provinces. The risk of high CO pollution was small, only found in some scattered areas in the NCP. In general, both the area and the possibility of occurrence exposure to high pollution has gradually decreased over time, almost disappearing since 2018.
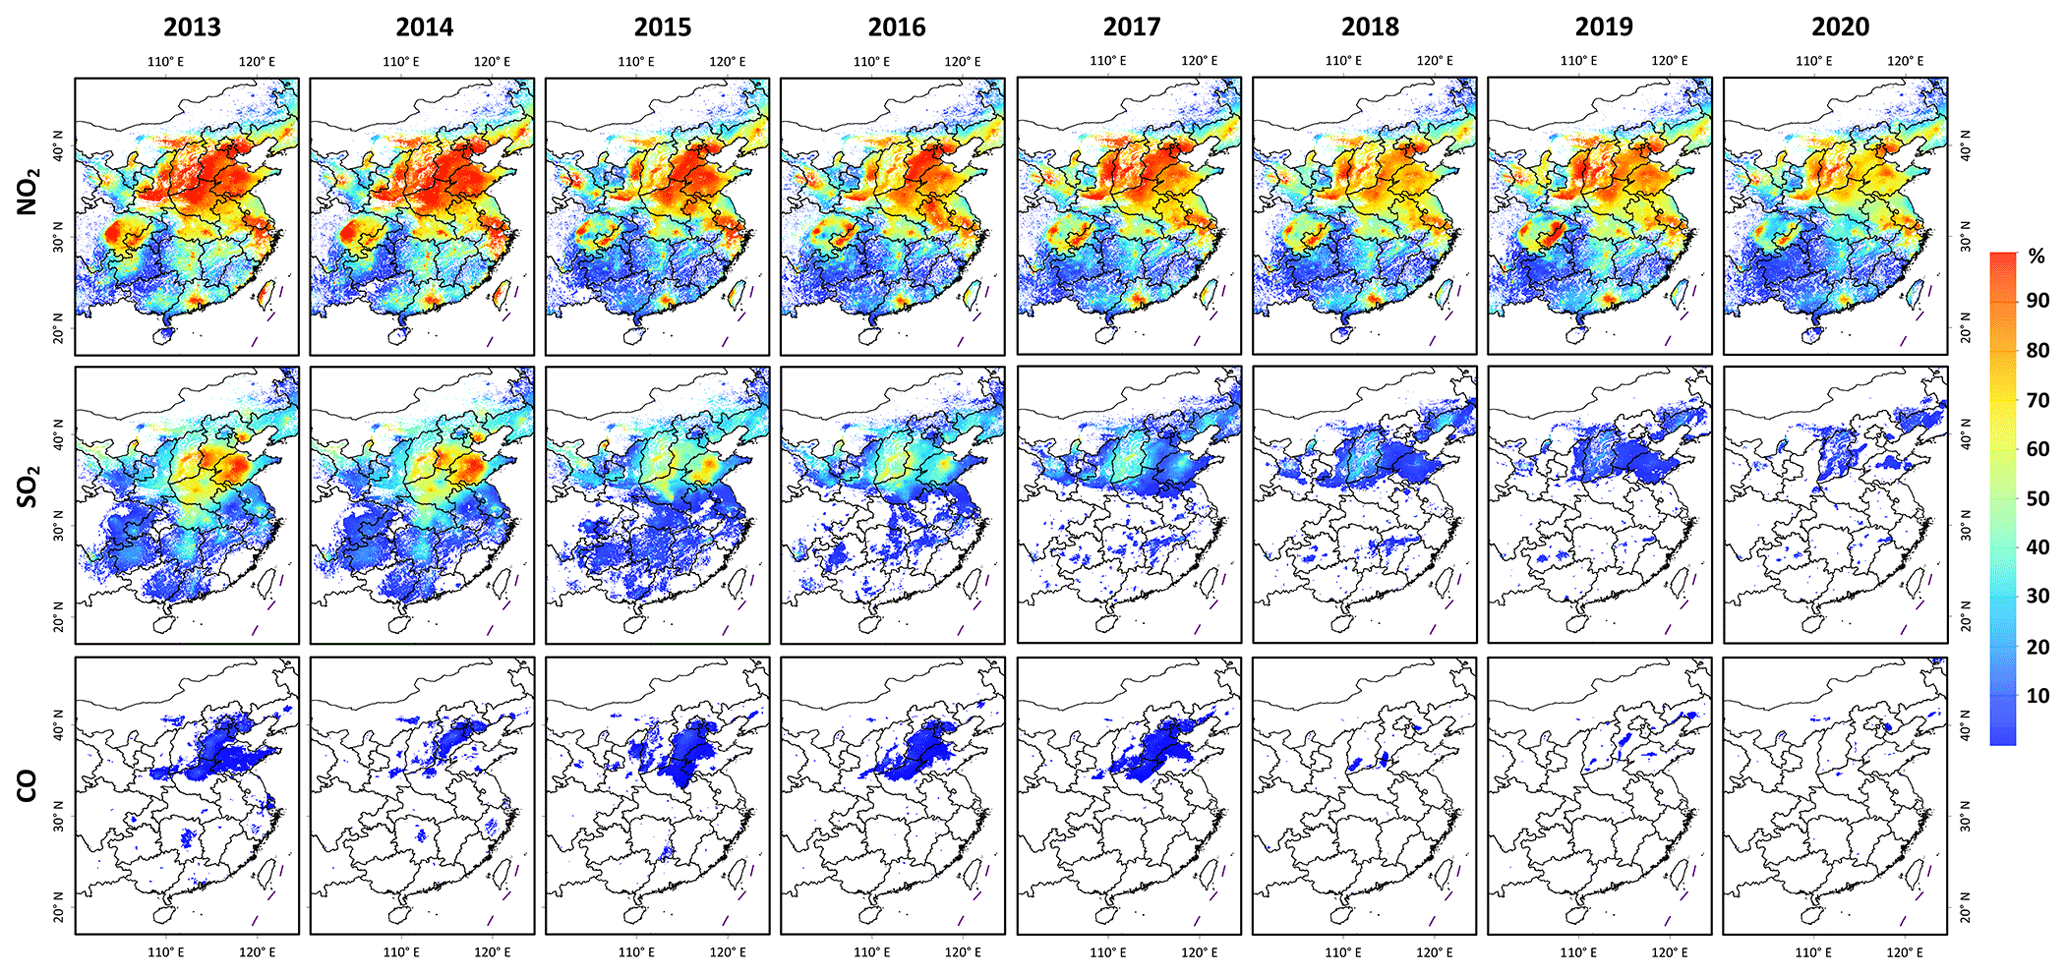
Figure 8Spatial distributions of the percentage of days exceeding the WHO-recommended short-term desired air quality guidelines (AQG) level for surface NO2 (daily mean > 25 µg m−3), SO2 (daily mean > 40 µg m−3), and CO (daily mean > 4 mg m−3) for each year from 2013 to 2020 in populated areas of eastern China.
By contrast, most areas of eastern China had a surface NO2 exposure exceeding the AQG level (Fig. 8), especially in the north and economically developed areas in the south (proportion > 80 %). Both the extent and intensity are decreasing over time, but it is still a problem, suggesting that stronger NOx controls are needed in the future. Most of the main air pollution transmission belt in China (i.e., the “2 + 26” cities, Fig. 1) had surface SO2 levels exceeding the AQG level at the beginning of the study period. Thanks to strict control measures, these polluted areas sharply decreased after 2015, almost disappearing in 2020. Controlling CO was much more successful in China, with less than 10 % of the days in the BTH exceeding the desired standard in the early part of the study period. Most areas have reached the CO AQG level since 2018.
Figure 9 shows the percentage of days with pollution levels exceeding WHO air quality standards in three key regions. BTH was the only region experiencing high NO2 and SO2 exposure risks (i.e., daily mean > IT1), dropping to zero since 2017 and 2016, while YRD and PRD had no high risks of exposure to the three gaseous pollutants (Fig. 9a–b). There was also no regional high CO-pollution risk (Fig. 9c). However, although declining continuously, regional surface NO2 levels failed to meet the short-term AQG level in 2020, with 61 %–73 % of the days exceeding this standard. More efforts toward mitigating NO2 levels in these key regions are thus needed. Continual decreases in the number of days above the AQG level were also observed in surface SO2, reducing to nearly zero in 2014, 2016, and 2018 in the PRD, YRD, and BTH, respectively. Less than 3 % of the days in the BTH and YRD had surface CO levels exceeding the AQG level. Surface CO levels were always below the AQG level in the PRD.
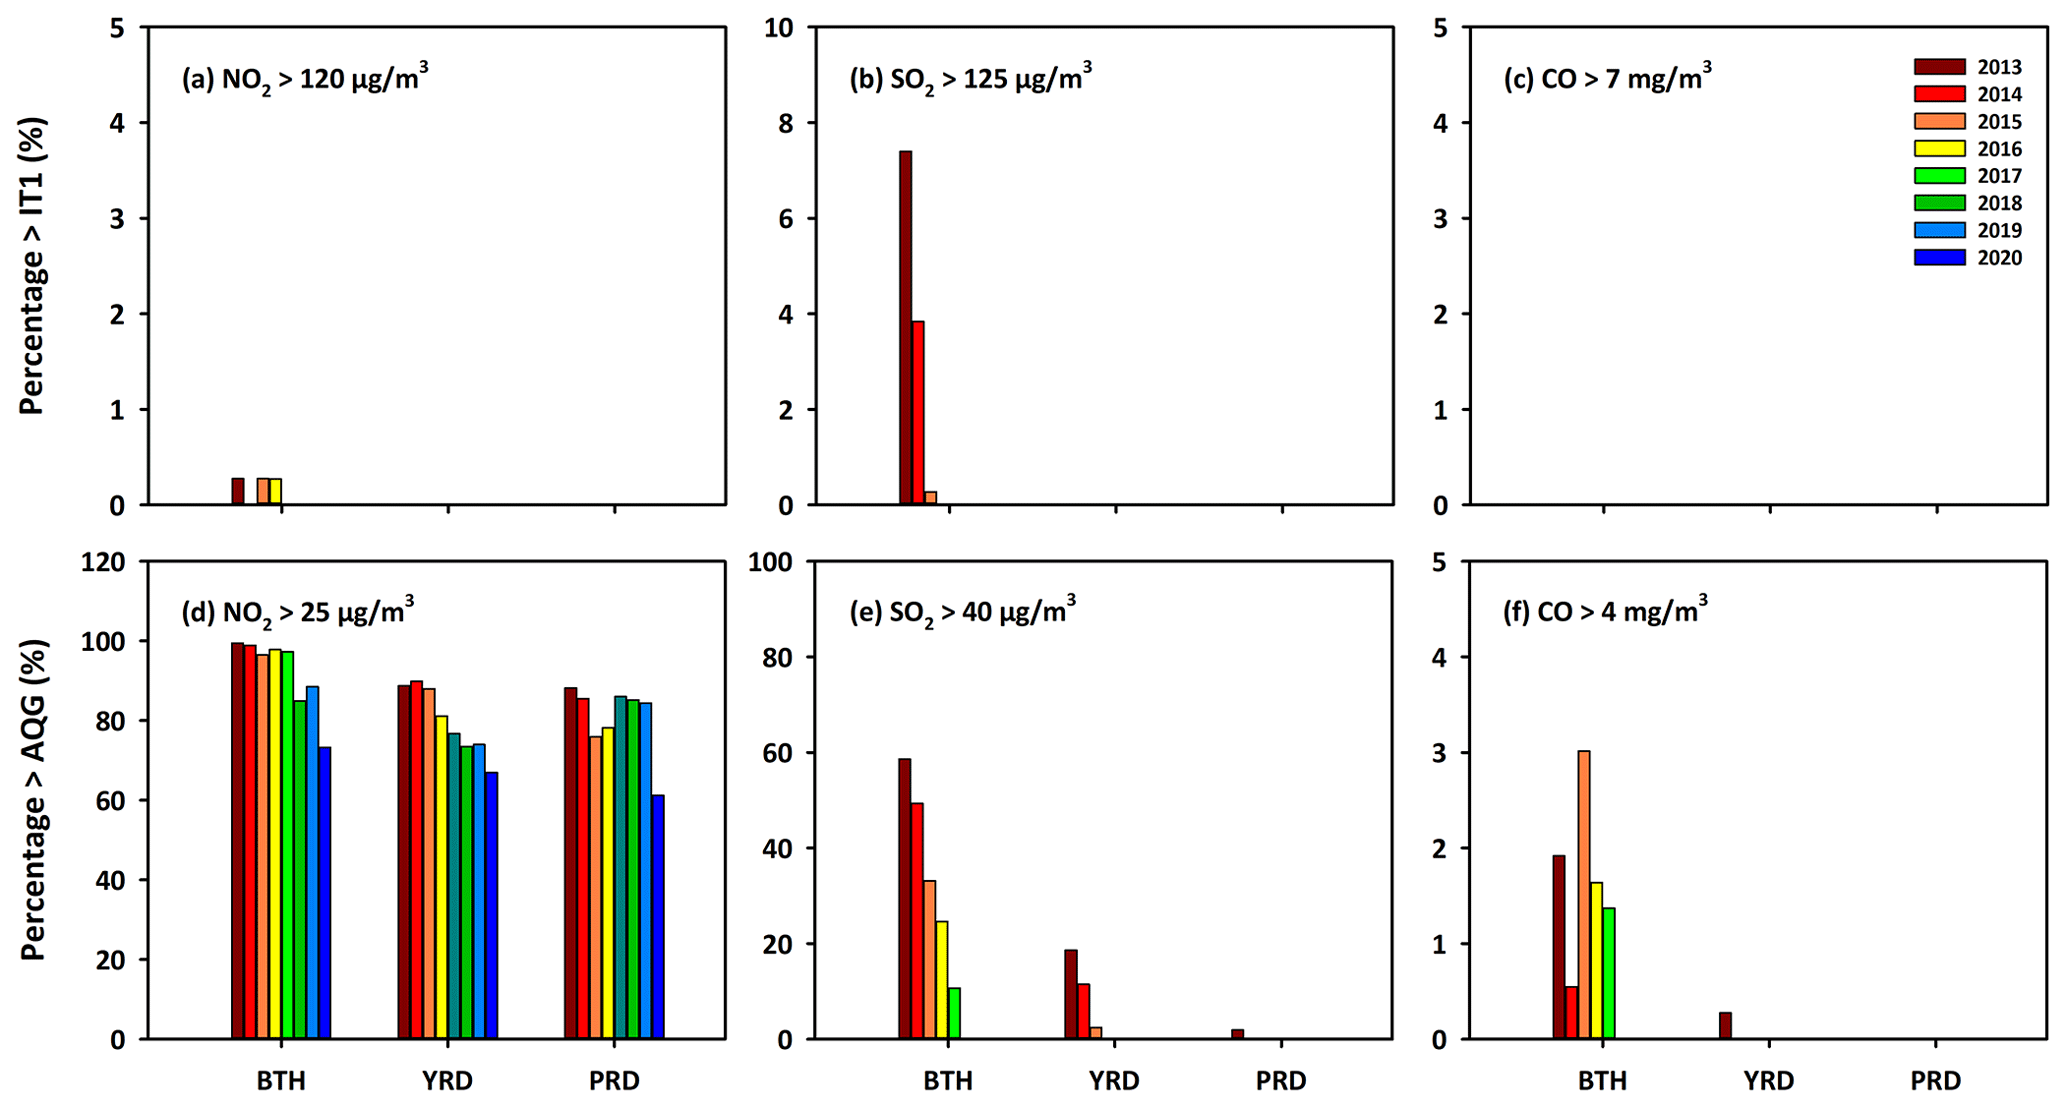
Figure 9Percentage of days (%) exceeding the WHO-recommended short-term (a–c) minimum interim target (IT1) and (d–f) desired air quality guidelines (AQG) level for surface NO2, SO2, and CO for each year from 2013 to 2020 in three typical urban agglomerations: the Beijing–Tianjin–Hebei (BTH) region, the Yangtze River Delta (YRD), and the Pearl River Delta (PRD).
3.3 Data quality assessment
Here, the widely used out-of-sample 10-fold cross-validation (10-CV) method was adopted to evaluate the overall estimation accuracy of gaseous pollutants (Rodriguez et al., 2010; Wei et al., 2022a). An additional out-of-station 10-CV approach was used to validate the prediction accuracy of gaseous pollutants, performed based on measurements from ground-monitoring stations. These measurements were randomly divided into 10 subsets, of which data samples from 9 subsets were used for model training and the remaining subset for model validation. This was done 10 times, in turn, to ensure that data from all stations were tested. This procedure generates independent training samples and test samples made in different locations, used to indicate the spatial prediction ability of the model in areas where ground-based measurements are unavailable (Wei et al., 2022a; Wu et al., 2021).
3.3.1 Estimate and prediction accuracy
Figure 10 shows the CV results of all daily estimates and predictions for ground-level NO2, SO2, and CO concentrations from 2013 to 2020 in China (sample size: N ≈ 3.6 million). Surface NO2 and SO2 concentrations mainly fell in the range of 200 to 500 µg m−3. Daily estimates were highly correlated to observations, with the same coefficients of determination (R2 = 0.84) and slopes close to 1 (0.86 and 0.84, respectively). Average root-mean-square error (RMSE; mean absolute error, MAE) values of surface NO2 and SO2 estimates were 7.99 (5.34) and 10.07 (4.68) µg m−3, and normalized RMSE (NRMSE) values were 0.25 and 0.51, respectively. Most daily CO observations were less than 10 mg m−3, agreeing well with our daily estimates (R2 = 0.80, slope = 0.79), and the average RMSE (MAE) and NRMSE values were 0.29 (0.16) mg m−3 and 0.3. Compared to estimation accuracies (Fig. 10a–c), prediction accuracies slightly decreased, which is acceptable considering the weak signals of trace gases. Daily surface SO2, NO2, and CO predictions (Fig. 10d–f) agree well with ground measurements, with spatial R2 values of 0.70, 0.68, and 0.61, respectively. Their respective RMSE (MAE) values were 14.28 (8.1) µg m−3, 11.57 (7.06) µg m−3, and 0.42 (0.24) mg m−3, and NRMSE values were 0.35, 0.71, and 0.42, respectively, representing the accuracy for areas without ground-monitoring stations.
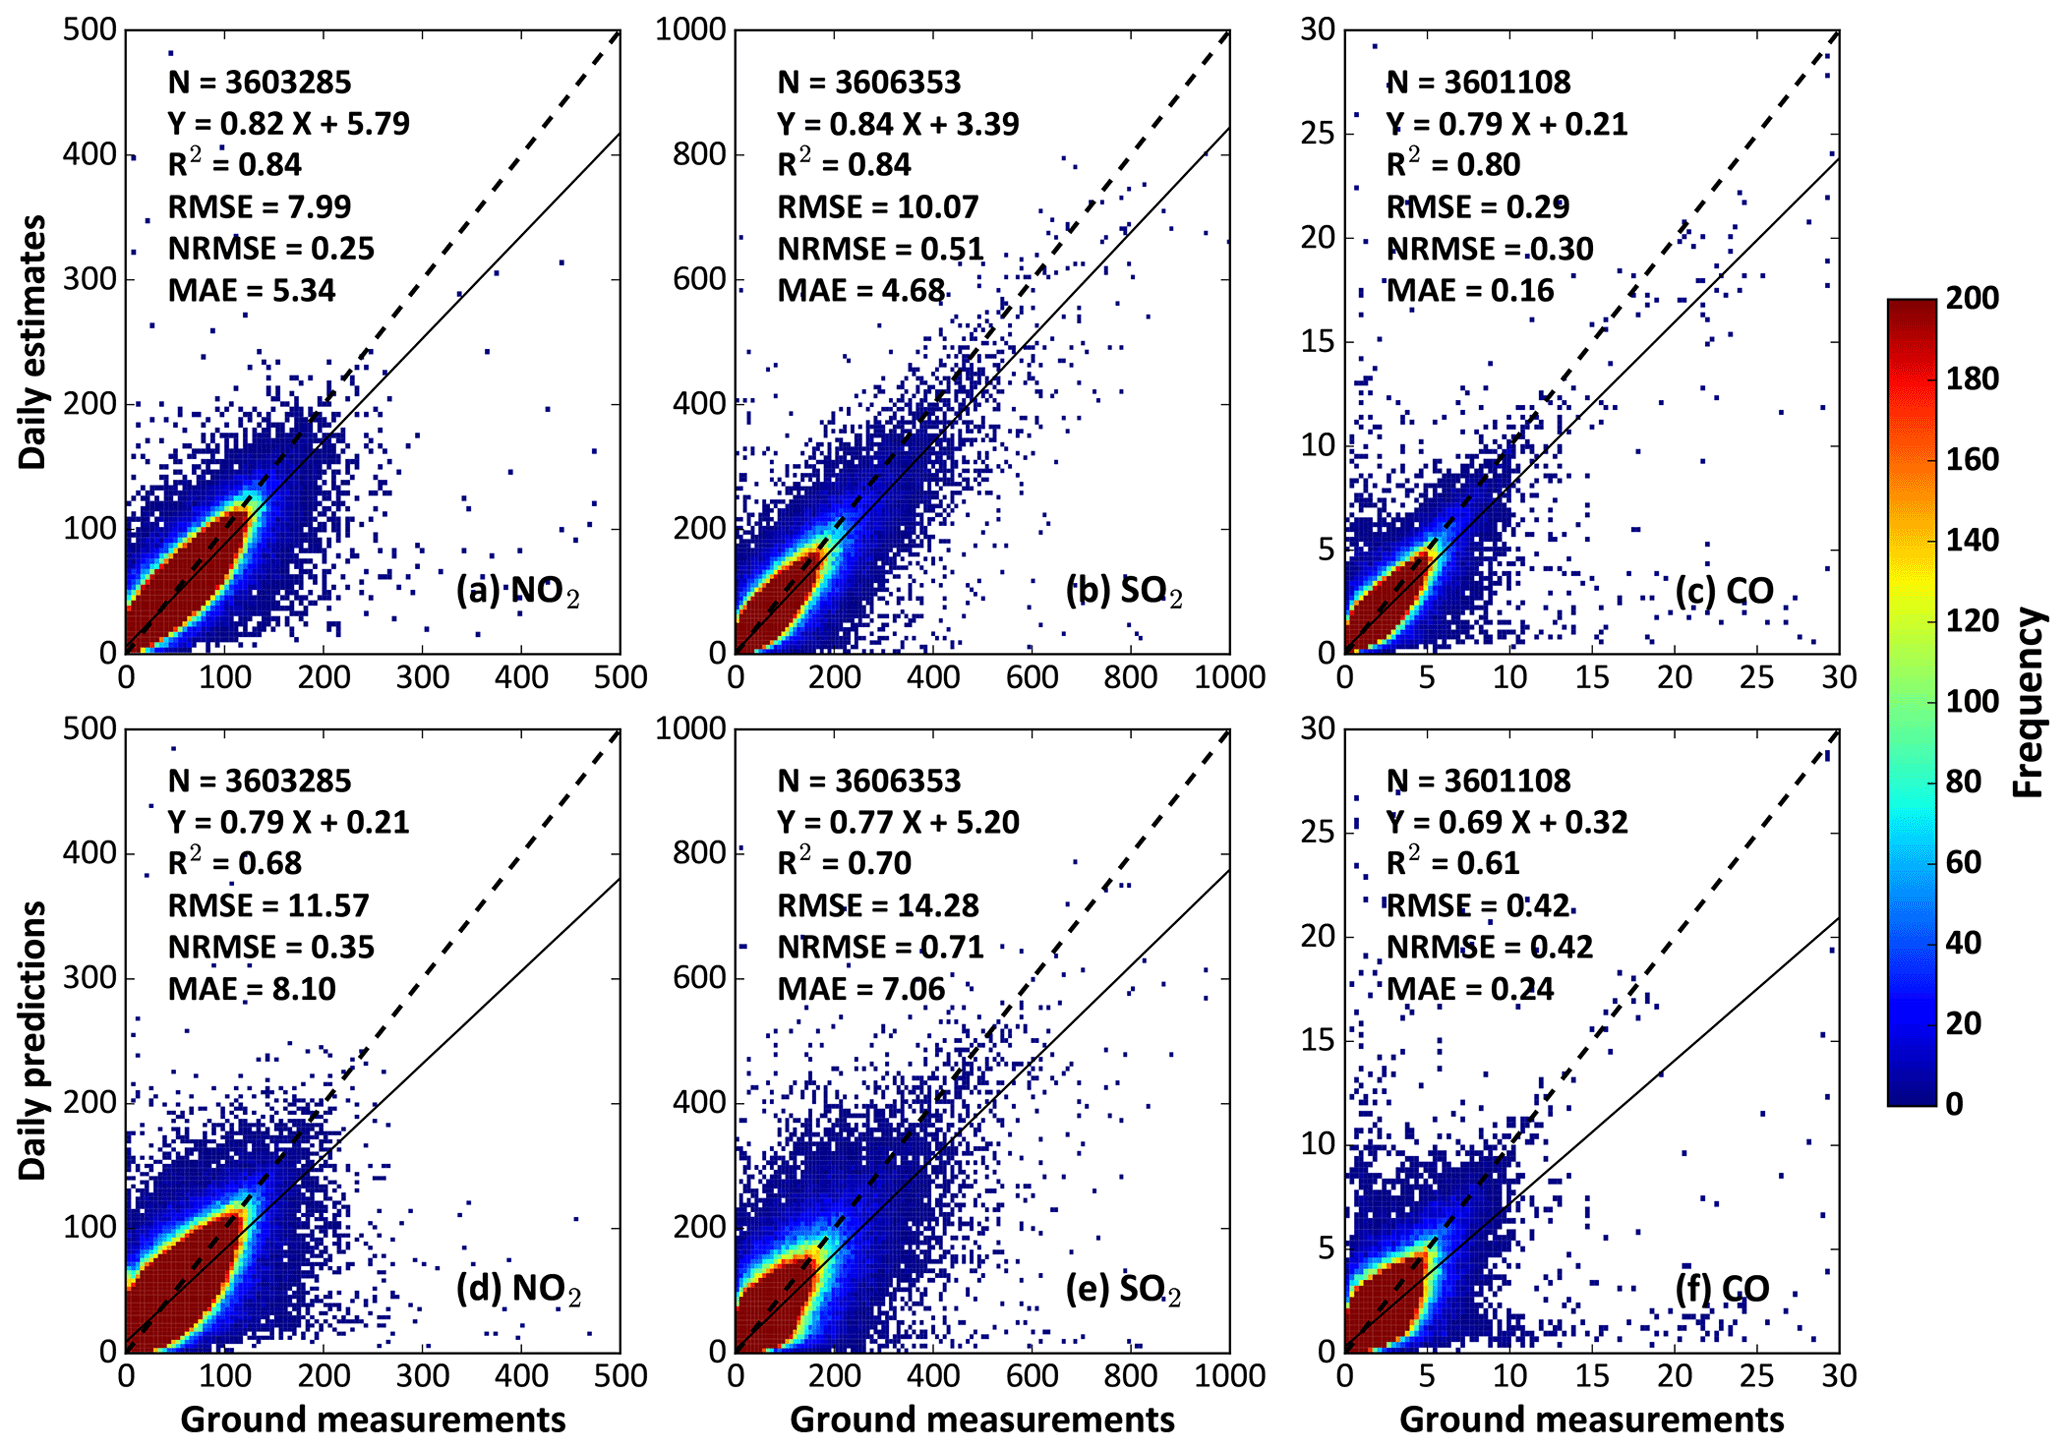
Figure 10Density plots of daily (a–c) estimates and (d–f) predictions of ground-level NO2 (µg m−3), SO2 (µg m−3), and CO (mg m−3) concentrations as a function of ground measurements in China from 2013 to 2020 using the out-of-sample (a–c) and out-of-station (d–f) cross-validation methods.
Table 1Statistics of the overall accuracies and predictive abilities of ambient gaseous pollutants for each year in China from 2013 to 2020.
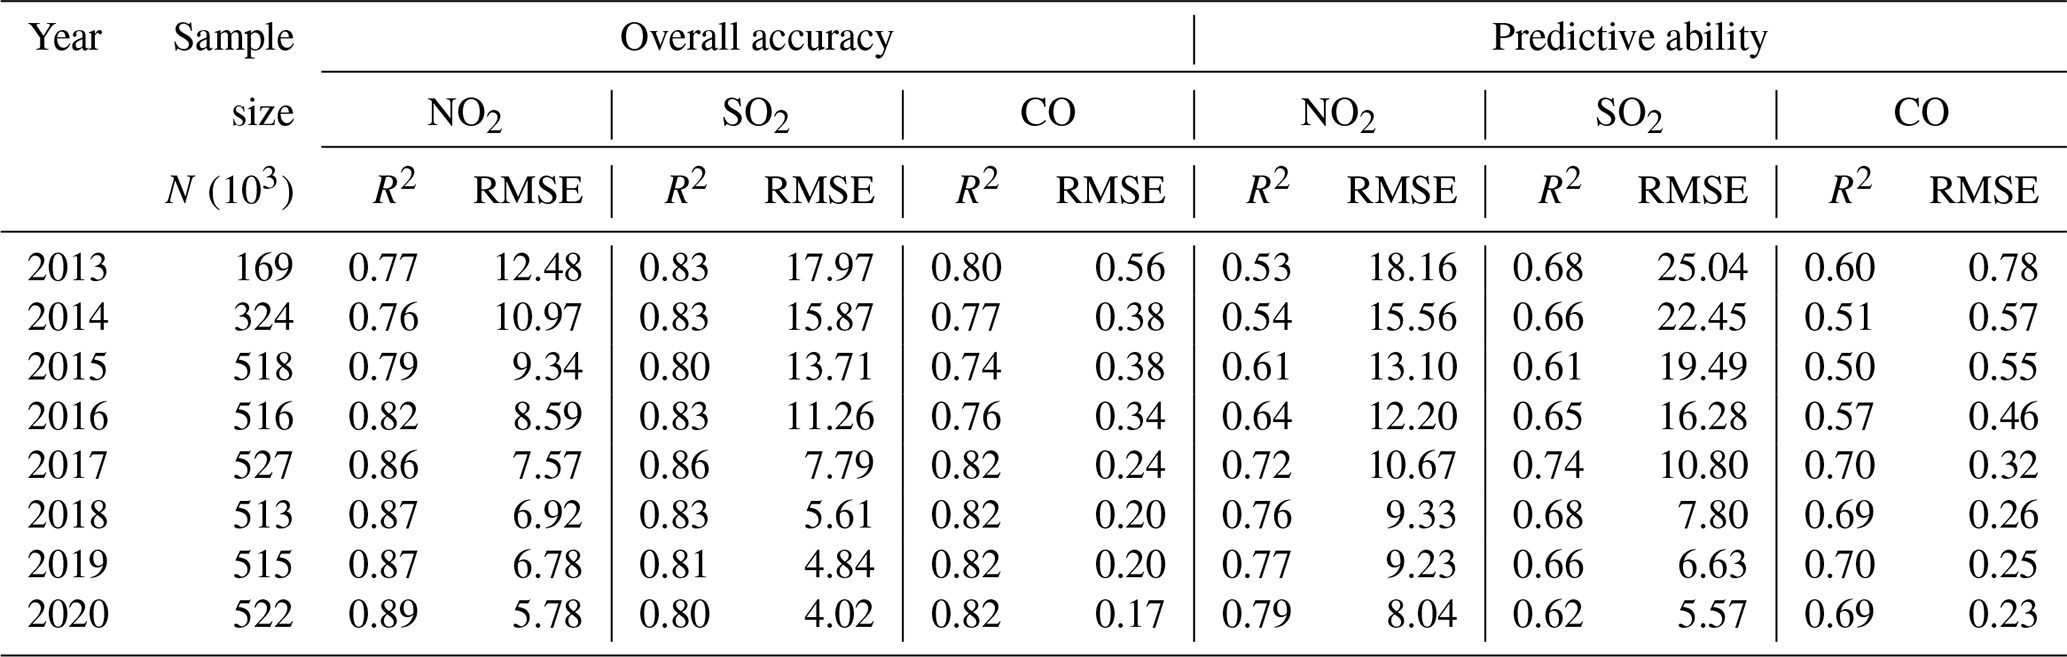
The performance of our air pollution modeling was also evaluated on an annual basis, showing that our model works well in estimating and predicting the concentrations of different surface gaseous pollutants in different years (Table 1). The model performance has continuously improved over time, as indicated by increasing correlations and decreasing uncertainties. This is because of the increasing density of ground stations (especially in the suburban areas of cities) and updated quality control of measurements, e.g., improving the sampling flow calibration of monitoring instruments, flow calibration of dynamic calibrators, revision of precision, accuracy review, and data validity judgment (HJ 818-2018; MEE, 2018b). This has led to an increase in the number of data samples (e.g., from 169 000 in 2013 to more than 522 000 in 2020) and improvement in their quality.
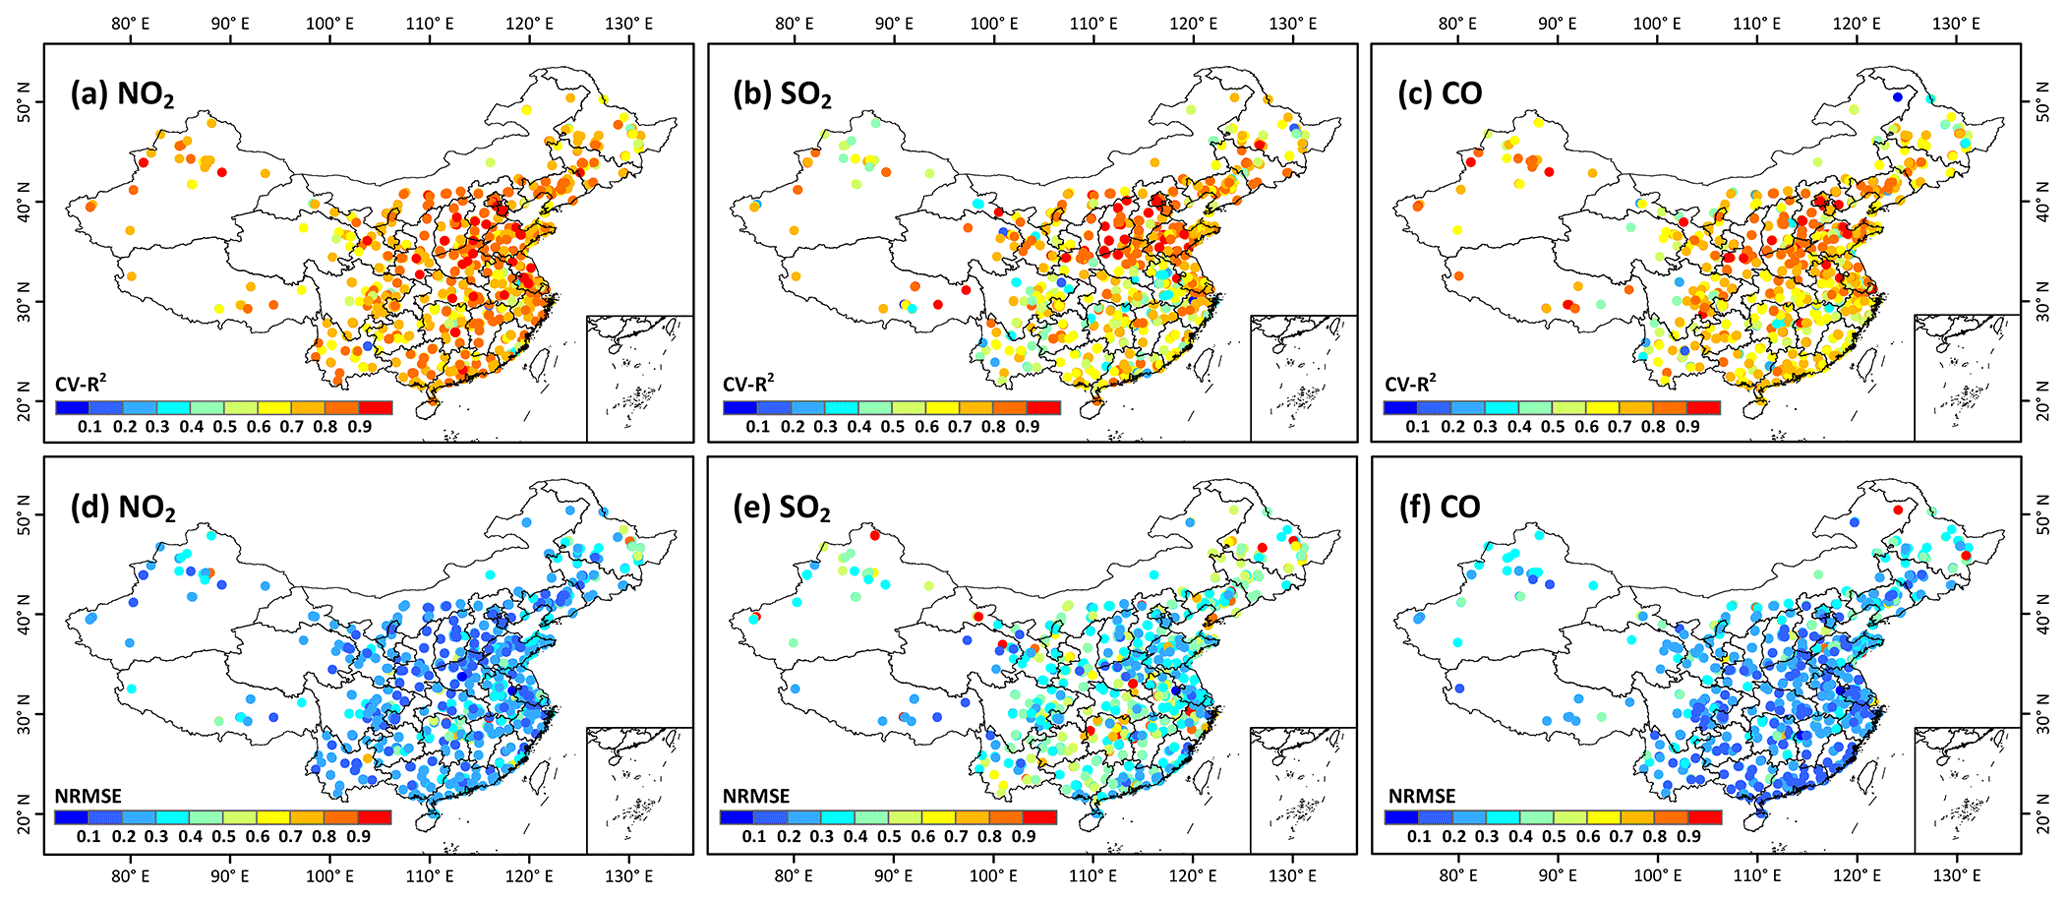
Figure 11Sample-based spatial validation of daily ground-level NO2 (µg m−3), SO2 (µg m−3), and CO (mg m−3) estimates at each individual monitoring station in China from 2013 to 2020: (a–c) accuracy (i.e., CV-R2) and (d–f) uncertainty (i.e., NRMSE).
Figure 11 shows the spatial validation of estimated daily pollutant gases across China. In general, our model works well at the site scale, with average CV-R2 values of 0.77, 0.72, and 0.72 and NRMSE values of 0.25, 0.43, and 0.26 for surface NO2, SO2, and CO, respectively. In addition, approximately 93 %, 80 %, and 84 % of the stations had at least moderate agreements (CV-R2 > 0.6) between our estimates and ground measurements. Except for some scattered sites, the estimation uncertainties were generally less than 0.3, 0.5, and 0.3 in more than 80 %, 77 %, and 76 % of the stations for the above three gaseous pollutant species, respectively.
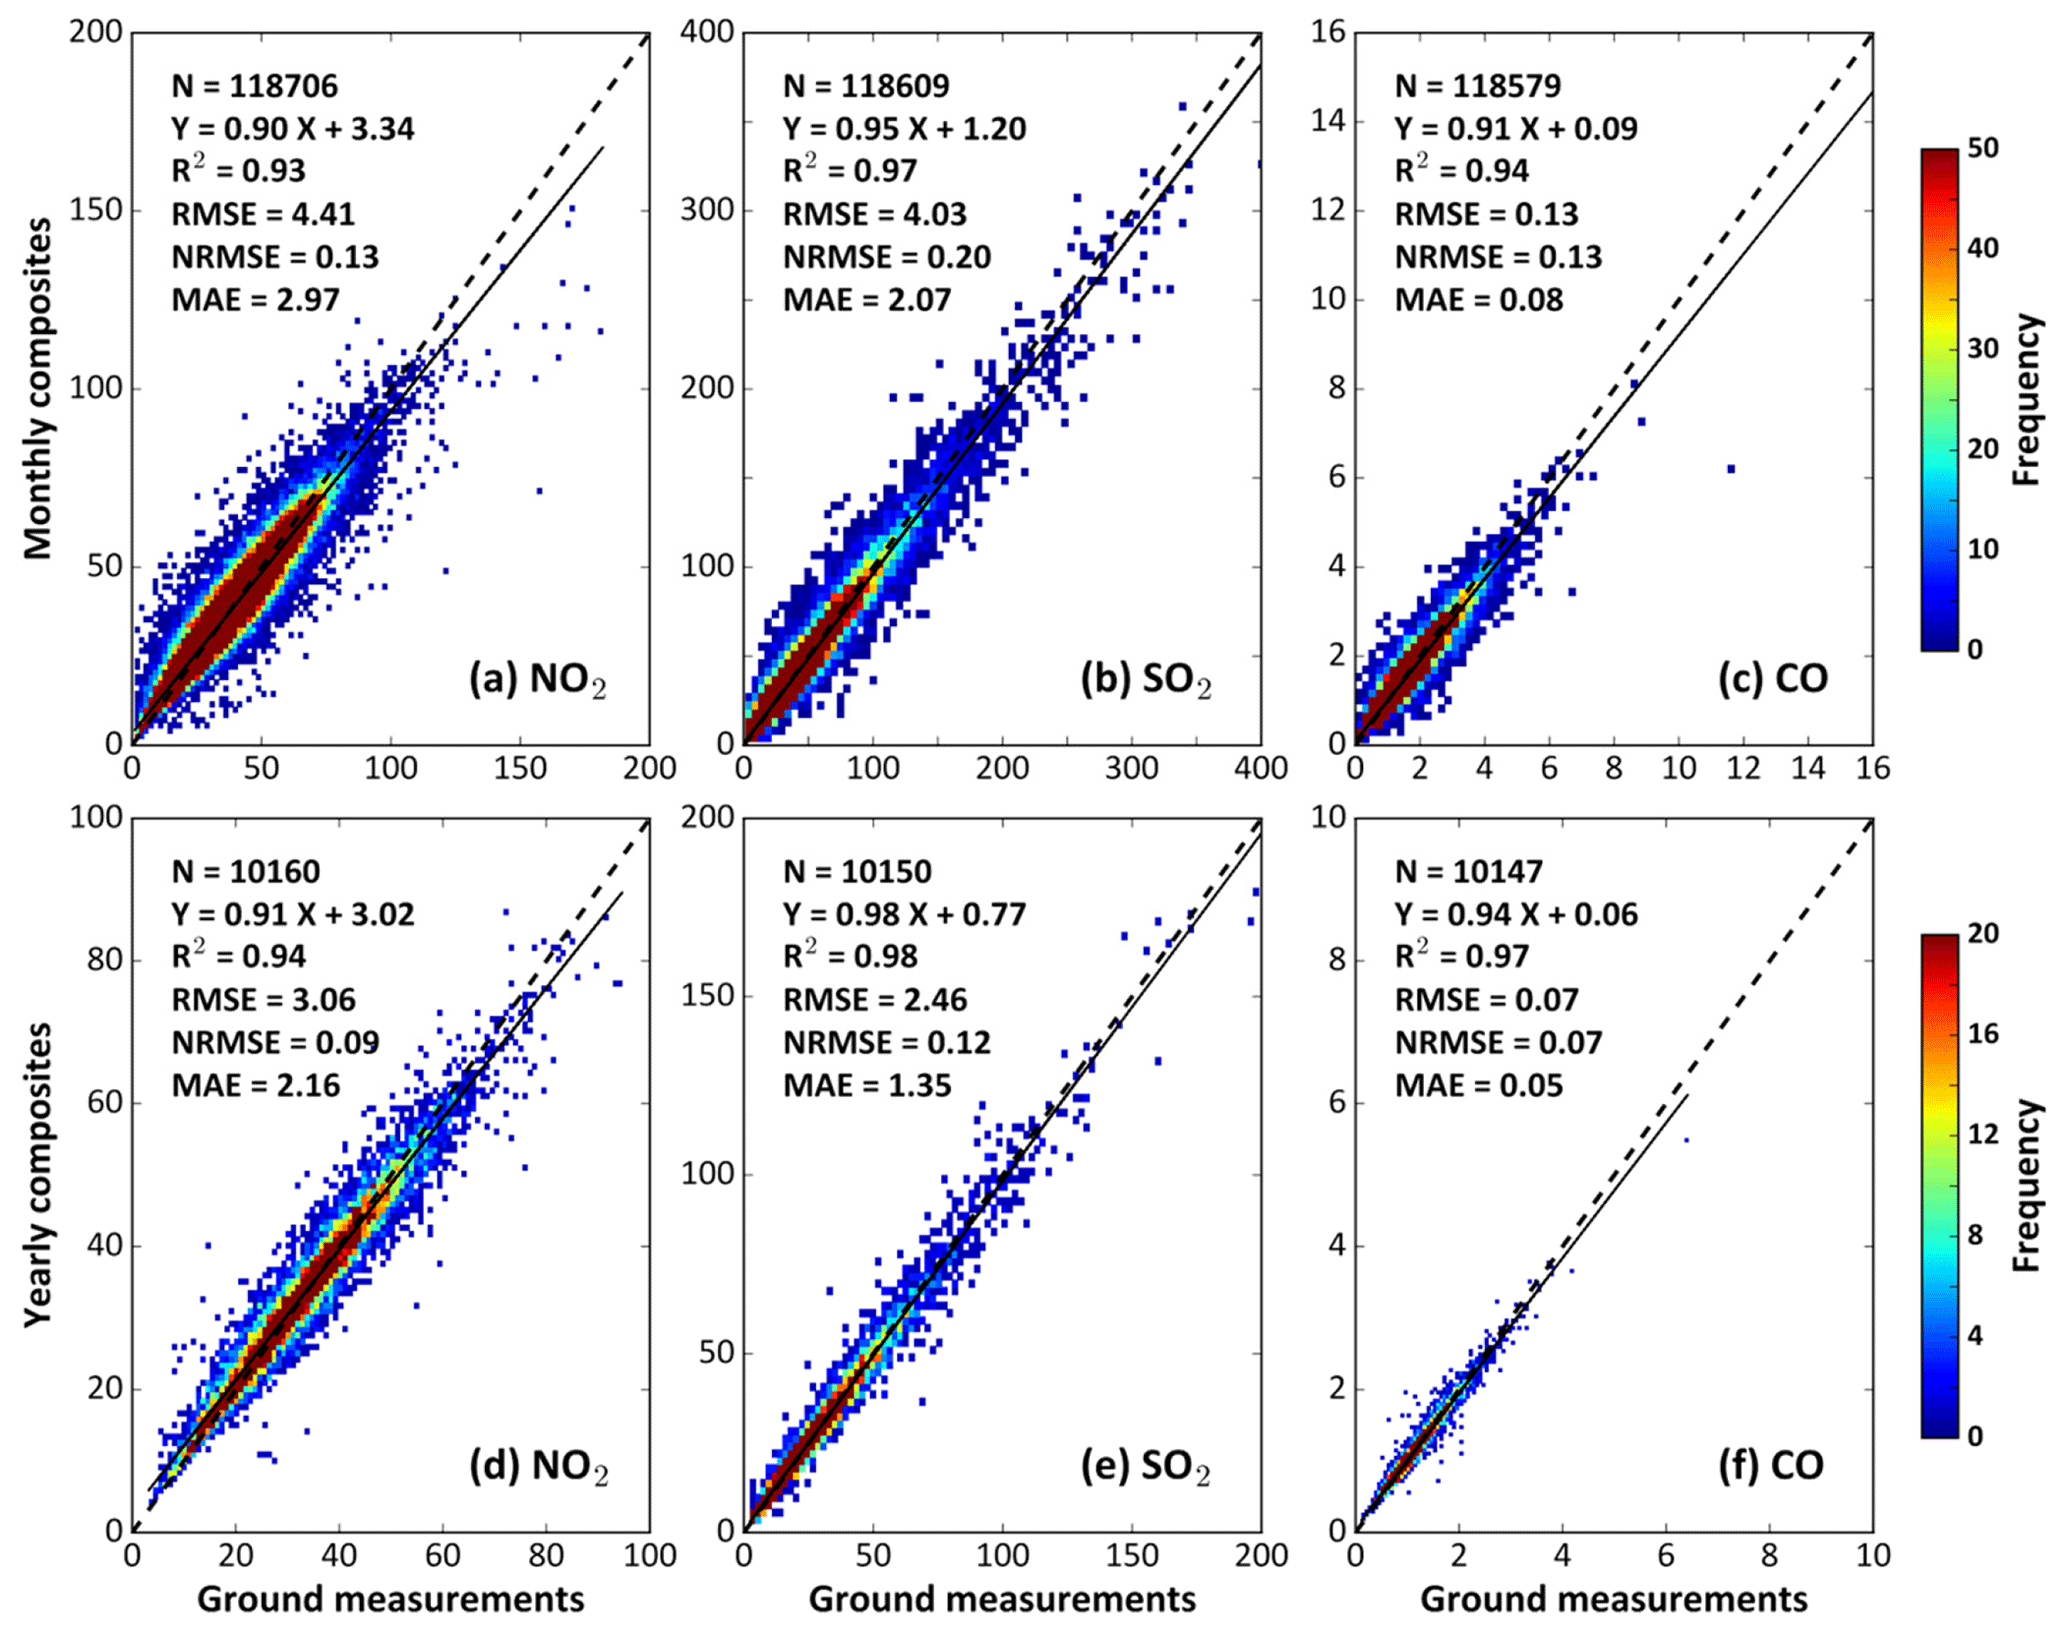
Figure 12Sample-based temporal validation of (a–c) monthly and (d–f) yearly composites of ground-level NO2 (µg m−3), SO2 (µg m−3), and CO (mg m−3) as a function of ground measurements from 2013 to 2020 in China.
Figure 12 shows the temporal validation of ground-level gaseous pollutants as a function of ground measurements in China. On the monthly scale (Fig. 12a–c), we collected a total of ∼ 119 000 matched samples of the three gaseous pollutants. Accuracies significantly improved, with increasing R2 (decreasing RMSE) values of 0.93 (4.41 µg m−3), 0.97 (4.03 µg m−3), and 0.94 (0.13 mg m−3) for surface NO2, SO2, and CO, respectively. On the annual scale (Fig. 12d–f), more than ∼ 10 000 matched samples were collected, showing better agreement with observations (e.g., R2 = 0.94, 0.98, and 0.97) and lower uncertainties (e.g., RMSE = 3.06 µg m−3, 2.46 µg m−3, and 0.07 mg m−3) for the above three gaseous pollutants, respectively.
3.3.2 Comparison with previous studies
We compared our results with those from previous studies on the estimation of the three gaseous pollutants using different developed models focusing on the whole of China. Here, only those studies applying the same out-of-sample cross-validation approach against ground-based measurements collected from the same CNEMC network were selected (Table 2). The statistics shown in the table come from the publications themselves because their generated datasets are not publicly available. We have applied the same validation method and ground measurements as those used in the previous studies. Most generated surface NO2 datasets had numerous missing values in space, limited by direct OMI/Aura satellite observations at spatial resolutions from 0.125∘ × 0.125∘ to 0.25∘ × 0.25∘ (Chen et al., 2019; Chi et al., 2021; Dou et al., 2021; Xu et al., 2019; Zhan et al., 2018). Some studies improved the spatial resolution by introducing NO2 data from the recently launched Sentinel-5 TROPOMI satellite, but data are only available from October 2018 onward (Chi et al., 2022; Liu, 2021; Wang et al., 2021; Wei et al., 2022b). Surface SO2 estimated from an SO2 emission inventory and surface CO from Measurement of Pollution in the Troposphere (MOPITT) and TROPOMI retrievals have a much lower data quality, with R2 values that are smaller by 12 %–57 % and RMSE values that are larger by 41 %–47 % against ground measurements compared to ours (Li et al., 2020; Liu et al., 2019; Wang et al., 2021). Overall, our gaseous pollutant datasets are superior to those from previous studies in terms of overall accuracy, spatial coverage, and length of data records.
Table 2Comparison of long-term datasets of different gaseous pollutants in China.
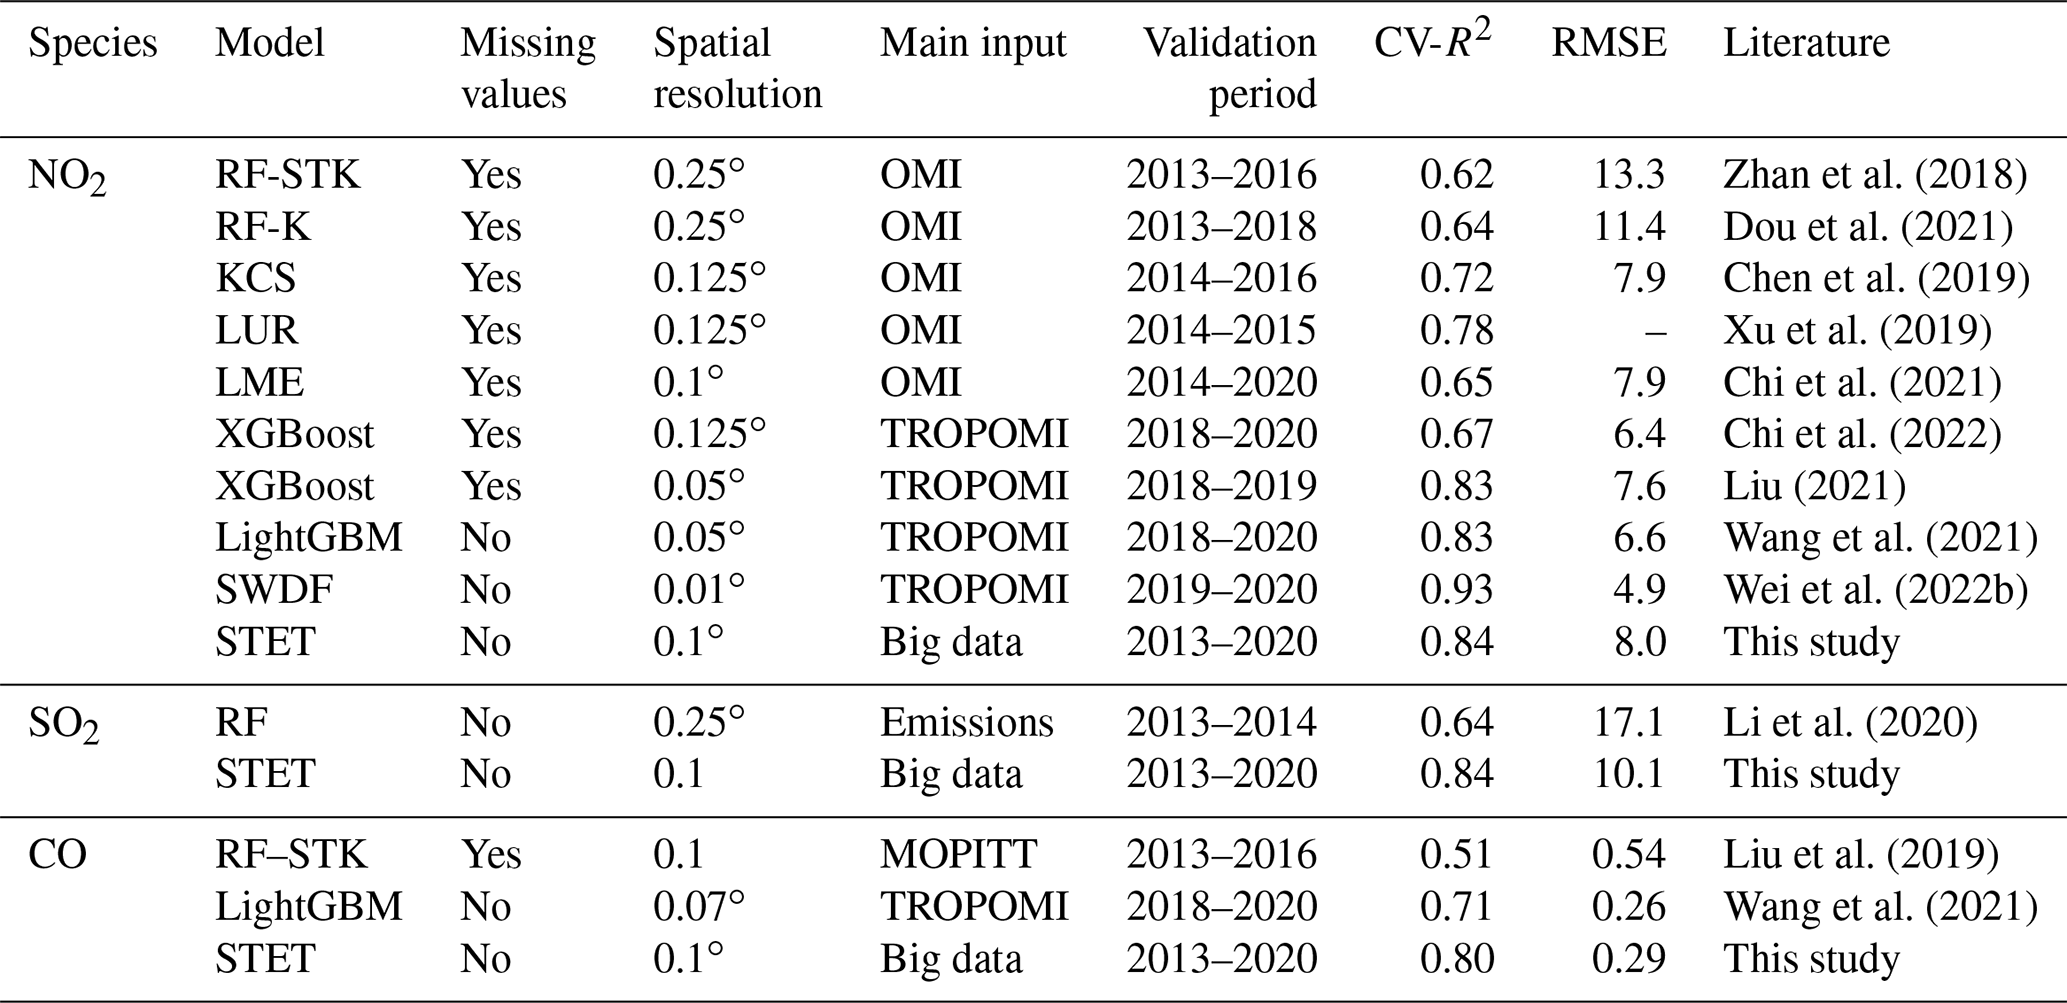
KCS: kriging-calibrated satellite method; LightGBM: light gradient boosted model; LME: linear mixed-effect model; LUR: land use regression; MOPITT: Measurements of Pollution in the Troposphere; OMI: Ozone Monitoring Instrument; RF: random forest; RF-K: random forest integrated with K-means; RF-STK: random-forest-spatiotemporal-kriging model; STET: space–time extremely randomized tree; SWDF: spatiotemporally weighted deep forest; TROPOMI: TROPOspheric Monitoring Instrument; XGBoost: extreme gradient boosting.
3.4 Successful applications
Our surface gaseous pollutant datasets have been freely available to the public online since March 2021 (see “Data availability” section). A large number of studies have used the three gaseous pollutant datasets generated in this study to study their single or joint impacts on environmental health from both long-term and short-term perspectives, benefiting from the unique daily, spatially seamless coverage. For example, a nearly linear relationship between long-term ambient NO2 and adult mortality in China was observed (Y. Zhang et al., 2022); ambient NO2 hindered the survival of middle-aged and elderly people (Wang et al., 2023), while acute exposure to ambient SO2 increased the risk of asthma mortality in China (S. Li et al., 2023; W. Liu et al., 2022, 2023). Long-term SO2 and CO exposure can increase the incidence rate of visual impairment in children in China (Chen et al., 2022a), and short-term exposure to ambient CO can significantly increase the probability of hospitalization for stroke sequelae (R. Wang et al., 2022). Regional and national cohort studies have shown that exposure, especially short-term exposure, to multiple ambient gaseous (NO2, SO2, and CO) and particulate pollutants have negative effects of varying degrees on a variety of diseases, like all-cause mortality (Feng et al., 2023), dementia mortality (T. Liu et al., 2022), myocardial infarction mortality (Ma et al., 2023), cause-specific cardiovascular disease (Xu et al., 2022a, b), respiratory diseases (H. Li et al., 2023), ischemic and hemorrhagic strokes (Cai et al., 2022; F. He et al., 2022; H. Wu et al., 2022b; Xu et al., 2022c), metabolic syndrome (Guo et al., 2022; S. Han et al., 2022), influenza-like illness (Lu et al., 2023), incident dyslipidemia (Hu et al., 2023), diabetes (Mei et al., 2023), blood pressure (Song et al., 2022; H. Wu et al., 2022a), renal and/or kidney function (S. Li et al., 2022; Y. Li et al., 2023), neurodevelopmental delays (Su et al., 2022), serum liver enzymes (Y. Li et al., 2022), overweight and obesity (Chen et al., 2022b), insomnia (Xu et al., 2021), and sleep quality (L. Wang et al., 2022). These studies attest well to the value of the CHAP dataset regarding current and future public health issues, among others.
Exposure to gaseous pollution is detrimental to human health, a major public concern in heavily polluted regions like China, where ground-based observations are not as rich as in major developed countries. Moreover, pollutants travel long distances, affecting large downstream regions. To remedy such limitations, this study applied the machine-learning model called Space–Time Extra-Trees to estimate ambient gaseous pollutants across China, with extensive input variables measured by monitors and satellites and by models. Daily 10 km resolution (approximately 0.1∘ × 0.1∘), seamless (spatial coverage = 100 %) datasets for ground-level NO2, SO2, and CO concentrations in China from 2013 to 2020 were generated. These datasets were cross-evaluated in terms of overall accuracy and predictive ability at different spatiotemporal levels. National daily estimates (predictions) of surface NO2, SO2, and CO were highly consistent with ground measurements, with average out-of-sample (out-of-station) CV-R2 values of 0.84 (0.68), 0.84 (0.7), and 0.8 (0.61) and RMSEs of 7.99 (11.57) µg m−3, 10.7 (14.28) µg m−3, and 0.29 (0.42) mg m−3, respectively.
Ambient pollutant gases varied significantly in space and time, with high levels mainly found in the North China Plain, especially in winter, due to more anthropogenic emissions, such as coal burning for heating. All gaseous pollutants sharply declined in China during the COVID-19 outbreak, while large differences were observed during their recovery times. For example, surface CO was the first to return to its historical level within the fifth week after the Lunar New Year in 2020, about 2 times faster than surface NO2 and SO2 levels. This is attributed to more home cooking and enhanced atmospheric oxidation. Temporally, surface NO2, SO2, and CO levels in China gradually decreased from peaks in 2013 (average = 21.3 ± 8.8 µg m−3, 23.1 ± 13.3 µg m−3, and 1.01 ± 0.29 mg m−3, respectively), with annual rates of decrease of 0.23 µg m−3, 2.01 µg m−3, and 0.05 mg m−3, respectively (p < 0.001), until 2020. Improvements in air quality have been made in the last 8 years thanks to the implementation of a series of environmental protection policies, greatly reducing pollutant emissions. In addition, both the areal extents of regions experiencing gaseous pollution and the probability of gaseous pollution occurring have gradually decreased over time, especially for surface CO and SO2, which have almost reached the short-term air quality guidelines level recommended by the WHO in most areas in China in 2020. This high-quality daily seamless dataset of gaseous pollutants will benefit future environmental and health-related studies focused on China, especially studies investigating short-term air pollution exposure.
Although a lot of new and/or useful data and analyses are presented in this study, they still suffer from some limitations. For example, our estimated surface SO2 and CO concentrations should have larger uncertainties than those of NO2, since model simulations, instead of satellite retrievals, are supplemented during modeling to compensate for the lack of data in China. However, these data often have large biases in remote regions with few observations, such as western China (H. Li et al., 2022), as the surface measurements from MEE are mainly over eastern China. More influential factors stemming from regional economic and development differences and more parameters describing the complex meteorological system (e.g., winds at 850 hPa and the pressure system in the mid-troposphere) need to be considered in developing more powerful artificial intelligence models, which could be helpful in improving the accuracy of air pollutant retrievals. The spatiotemporal resolutions of gaseous pollutants will be further improved by integrating information from polar-orbiting and geostationary satellites to investigate diurnal variations. In a future study, we will also reconstruct data records over the last two decades and investigate their long-term spatiotemporal variations, filling the gap of missing observations. This will help us understand their formation mechanisms and impacts on fine particulate matter and ozone pollution in China.
CNEMC measurements of gaseous pollutants are available at http://www.cnemc.cn (last access: 1 January 2023; CNEMC, 2023). The reconstructed OMI/Aura tropospheric NO2 product is available at https://doi.org/10.6084/m9.figshare.13126847.v1 (He et al., 2020b). MODIS series products and the MERRA-2 reanalysis are available at https://search.earthdata.nasa.gov/ (last access: 1 January 2023; NASA, 2023a). The SRTM DEM is available at https://www2.jpl.nasa.gov/srtm/ (last access: 1 January 2023; NASA, 2023b), and LandScan™ population information is available at https://landscan.ornl.gov/ (last access: 1 January 2023; ORNL, 2023). The ERA5 reanalysis is available at https://cds.climate.copernicus.eu/ (last access: 1 January 2023; CDS, 2023), GEOS CF data are available at https://portal.nccs.nasa.gov/datashare/gmao/geos-cf/ (last access: 1 January 2023; NASA, 2023c), and the CAMS reanalysis and emission inventory are available at https://ads.atmosphere.copernicus.eu/ (last access: 1 January 2023; ADS, 2023).
The ChinaHighAirPollutants (CHAP) dataset is open access and freely available at https://weijing-rs.github.io/product.html (last access: 1 January 2023; Wei, 2023). The ChinaHighNO2 dataset is available at https://doi.org/10.5281/zenodo.4641542 (Wei and Li, 2021a), the ChinaHighSO2 dataset is available at https://doi.org/10.5281/zenodo.4641538 (Wei and Li, 2021b), and the ChinaHighCO dataset is available at https://doi.org/10.5281/zenodo.4641530 (Wei and Li, 2021c).
The supplement related to this article is available online at: https://doi.org/10.5194/acp-23-1511-2023-supplement.
JiW and ZL designed the study. JiW performed the research and wrote the initial draft of this paper. ZL, JuW, CL, and PG reviewed and edited the paper. MC copy-edited the article. All authors made substantial contributions to this work.
At least one of the (co-)authors is a member of the editorial board of Atmospheric Chemistry and Physics. The peer-review process was guided by an independent editor, and the authors also have no other competing interests to declare.
Publisher's note: Copernicus Publications remains neutral with regard to jurisdictional claims in published maps and institutional affiliations.
We would like to thank Kai Qin at the China University of Mining and Technology for providing the satellite tropospheric NO2 dataset. Jun Wang's participation is made possible via in-kind support from the University of Iowa.
This research has been supported by the National Aeronautics and Space Administration (grant nos. 80NSSC21K1980, 80NSSC19K0950, and ROSES-2020).
This paper was edited by Hailong Wang and reviewed by three anonymous referees.
ADS: Atmosphere Data Store, https://ads.atmosphere.copernicus.eu/, last access: 1 January 2023.
Anenberg, S. C., Mohegh, A., Goldberg, D. L., Kerr, G. H., Brauer, M., Burkart, K., Hystad, P., Larkin, A., Wozniak, S., and Lamsal, L.: Long-term trends in urban NO2 concentrations and associated paediatric asthma incidence: estimates from global datasets, Lancet Planetary Health, 6, e49–e58, https://doi.org/10.1016/S2542-5196(21)00255-2, 2022.
Cai, M., Zhang, S., Lin, X., Qian, Z., McMillin, S. E., Yang, Y., Zhang, Z., Pan, J., and Lin, H.: Association of Ambient Particulate Matter Pollution of Different Sizes With In-Hospital Case Fatality Among Stroke Patients in China, Neurology, 98, e2474–e2486, https://doi.org/10.1212/WNL.0000000000200546, 2022.
CDS: Climate Data Store, https://cds.climate.copernicus.eu/, last access: 1 January 2023.
Chen, L., Wei, J., Ma, T., Gao, D., Wang, X., Wen, B., Chen, M., Li, Y., Jiang, J., Wu, L., Li, W., Liu, X., Song, Y., Guo, X., Dong, Y., and Ma, J.: Ambient gaseous pollutant exposure and incidence of visual impairment among children and adolescents: findings from a longitudinal, two-center cohort study in China, Environ. Sci. Pollut. R., 29, 73262–73270, https://doi.org/10.1007/s11356-022-20025-3, 2022a.
Chen, L., Gao, D., Ma, T., Chen, M., Li, Y., Ma, Y., Wen, B., Jiang, J., Wang, X., Zhang, J., Chen, S., Wu, L., Li, W., Liu, X., Guo, X., Huang, S., Wei, J., Song, Y., Ma, J., and Dong, Y.: Could greenness modify the effects of physical activity and air pollutants on overweight and obesity among children and adolescents?, Sci. Total Environ., 832, 155117, https://doi.org/10.1016/j.scitotenv.2022.155117, 2022b.
Chen, Z.-Y., Zhang, R., Zhang, T.-H., Ou, C.-Q., and Guo, Y.: A kriging-calibrated machine learning method for estimating daily ground-level NO2 in mainland China, Sci. Total Environ., 690, 556–564, https://doi.org/10.1016/j.scitotenv.2019.06.349, 2019.
Chi, Y., Fan, M., Zhao, C., Sun, L., Yang, Y., Yang, X., and Tao, J.: Ground-level NO2 concentration estimation based on OMI tropospheric NO2 and its spatiotemporal characteristics in typical regions of China, Atmos. Res., 264, 105821, https://doi.org/10.1016/j.atmosres.2021.105821, 2021.
Chi, Y., Fan, M., Zhao, C., Yang, Y., Fan, H., Yang, X., Yang, J., and Tao, J.: Machine learning-based estimation of ground-level NO2 concentrations over China, Sci. Total Environ., 807, 150721, https://doi.org/10.1016/j.scitotenv.2021.150721, 2022.
CNEMC: China National Environmental Monitoring Centre, http://www.cnemc.cn, last access: 1 January 2023.
Cooper, M. J., Martin, R. V., Hammer, M. S., Levelt, P. F., Veefkind, P., Lamsal, L. N., Krotkov, N. A., Brook, J. R., and McLinden, C. A.: Global fine-scale changes in ambient NO2 during COVID-19 lockdowns, Nature, 601, 380–387, 10.1038/s41586-021-04229-0, 2022.
Dickerson, R. R., Li, C., Li, Z., Marufu, L. T., Stehr, J. W., McClure, B., Krotkov, N., Chen, H., Wang, P., Xia, X., Ban, X., Gong, F., Yuan, J., and Yang, J.: Aircraft observations of dust and pollutants over northeast China: Insight into the meteorological mechanisms of transport, J. Geophys. Res.-Atmos., 112, D24S9, https://doi.org/10.1029/2007JD008999, 2007.
Ding, J., van der A, R. J., Eskes, H. J., Mijling, B., Stavrakou, T., van Geffen, J. H. G. M., and Veefkind, J. P.: NOx Emissions Reduction and Rebound in China Due to the COVID-19 Crisis, Geophys. Res. Lett., 47, e2020GL089912, https://doi.org/10.1029/2020GL089912, 2020.
Dou, X., Liao, C., Wang, H., Huang, Y., Tu, Y., Huang, X., Peng, Y., Zhu, B., Tan, J., Deng, Z., Wu, N., Sun, T., Ke, P., and Liu, Z.: Estimates of daily ground-level NO2 concentrations in China based on Random Forest model integrated K-means, Advances in Applied Energy, 2, 100017, https://doi.org/10.1016/j.adapen.2021.100017, 2021.
Feng, C., Yu, B., Fei, T., Jia, P., Dou, Q., and Yang, S.: Association between residential greenness and all-cause mortality and the joint mediation effect of air pollutants among old people with disability: A prospective cohort study, Sci. Total Environ., 858, 159604, https://doi.org/10.1016/j.scitotenv.2022.159604, 2023.
Field, R. D., Hickman, J. E., Geogdzhayev, I. V., Tsigaridis, K., and Bauer, S. E.: Changes in satellite retrievals of atmospheric composition over eastern China during the 2020 COVID-19 lockdowns, Atmos. Chem. Phys., 21, 18333–18350, https://doi.org/10.5194/acp-21-18333-2021, 2021.
Gao, J., Yang, Y., Wang, H., Wang, P., Li, H., Li, M., Ren, L., Yue, X., and Liao, H.: Fast climate responses to emission reductions in aerosol and ozone precursors in China during 2013–2017, Atmos. Chem. Phys., 22, 7131–7142, https://doi.org/10.5194/acp-22-7131-2022, 2022.
GBD 2019 Risk Factors Collaborators: Global burden of 87 risk factors in 204 countries and territories, 1990–2019: a systematic analysis for the Global Burden of Disease Study 2019, Lancet, 396, 1223–1249, https://doi.org/10.1016/S0140-6736(20)30752-2, 2020.
Geurts, P., Ernst, D., and Wehenkel, L.: Extremely Randomized Trees, Mach. Learn., 36, 3–42, https://doi.org/10.1007/s10994-006-6226-1, 2006.
Guo, Q., Zhao, Y., Zhao, J., Bian, M., Qian, L., Xue, T., Zhang, J., and Duan, X.: Physical activity attenuated the associations between ambient air pollutants and metabolic syndrome (MetS): A nationwide study across 28 provinces, Environ. Pollut., 315, 120348, https://doi.org/10.1016/j.envpol.2022.120348, 2022.
Han, S., Zhang, F., Yu, H., Wei, J., Xue, L., Duan, Z., and Niu, Z.: Systemic inflammation accelerates the adverse effects of air pollution on metabolic syndrome: Findings from the China health and Retirement Longitudinal Study (CHARLS), Environ. Res., 215, 114340, https://doi.org/10.1016/j.envres.2022.114340, 2022.
Han, W., He, T.-L., Tang, Z., Wang, M., Jones, D., and Jiang, Z.: A comparative analysis for a deep learning model (hyDL-CO v1.0) and Kalman filter to predict CO concentrations in China, Geosci. Model Dev., 15, 4225–4237, https://doi.org/10.5194/gmd-15-4225-2022, 2022.
He, F., Wei, J., Dong, Y., Liu, C., Zhao, K., Peng, W., Lu, Z., Zhang, B., Xue, F., Guo, X., and Jia, X.: Associations of ambient temperature with mortality for ischemic and hemorrhagic stroke and the modification effects of greenness in Shandong Province, China, Sci. Total Environ., 851, 158046, https://doi.org/10.1016/j.scitotenv.2022.158046, 2022.
He, J., Gong, S., Yu, Y., Yu, L., Wu, L., Mao, H., Song, C., Zhao, S., Liu, H., Li, X., and Li, R.: Air pollution characteristics and their relation to meteorological conditions during 2014–2015 in major Chinese cities, Environ. Pollut., 223, 484–496, https://doi.org/10.1016/j.envpol.2017.01.050, 2017.
He, L., Wei, J., Wang, Y., Shang, Q., Liu, J., Yin, Y., Frankenberg, C., Jiang, J. H., Li, Z., and Yung, Y. L.: Marked Impacts of Pollution Mitigation on Crop Yields in China, Earths Future, 10, e2022EF002936, https://doi.org/10.1029/2022EF002936, 2022.
He, Q., Qin, K., Cohen, J. B., Loyola, D., Li, D., Shi, J., and Xue, Y.: Spatially and temporally coherent reconstruction of tropospheric NO2 over China combining OMI and GOME-2B measurements, Environ. Res. Lett., 15, 125011, https://doi.org/10.1088/1748-9326/abc7df, 2020a.
He, Q., Qin, K., Cohen, J. B., Loyola, D., Li, D., Shi, J., and Xue, Y.: Data For “Spatially and Temporally Coherent Reconstruction of Tropospheric NO2 over China combining OMI and GOME-2B measurements”, figshare [data set], https://doi.org/10.6084/m9.figshare.13126847.v1, 2020b.
Hersbach, H., Bell, B., Berrisford, P., Hirahara, S., Horányi, A., Muñoz-Sabater, J., Nicolas, J., Peubey, C., Radu, R., Schepers, D., Simmons, A., Soci, C., Abdalla, S., Abellan, X., Balsamo, G., Bechtold, P., Biavati, G., Bidlot, J., Bonavita, M., De Chiara, G., Dahlgren, P., Dee, D., Diamantakis, M., Dragani, R., Flemming, J., Forbes, R., Fuentes, M., Geer, A., Haimberger, L., Healy, S., Hogan, R. J., Hólm, E., Janisková, M., Keeley, S., Laloyaux, P., Lopez, P., Lupu, C., Radnoti, G., de Rosnay, P., Rozum, I., Vamborg, F., Villaume, S., and Thépaut, J.-N.: The ERA5 global reanalysis, Q. J. Roy. Meteor. Soc., 146, 1999–2049, https://doi.org/10.1002/qj.3803, 2020.
Hu, M., Wei, J., Hu, Y., Guo, X., Li, Z., Liu, Y., Li, S., Xue, Y., Li, Y., Liu, M., Wang, L., and Liu, X.: Long-term effect of submicronic particulate matter (PM1) and intermodal particulate matter (PM1–2.5) on incident dyslipidemia in China: A nationwide 5-year cohort study, Environ. Res., 217, 114860, https://doi.org/10.1016/j.envres.2022.114860, 2023.
Huang, X., Ding, A., Gao, J., Zheng, B., Zhou, D., Qi, X., Tang, R., Wang, J., Ren, C., Nie, W., Chi, X., Xu, Z., Chen, L., Li, Y., Che, F., Pang, N., Wang, H., Tong, D., Qin, W., Cheng, W., Liu, W., Fu, Q., Liu, B., Chai, F., Davis, S. J., Zhang, Q., and He, K.: Enhanced secondary pollution offset reduction of primary emissions during COVID-19 lockdown in China, Natl. Sci. Rev., 8, nwaa137, https://doi.org/10.1093/nsr/nwaa137, 2020.
Inness, A., Ades, M., Agustí-Panareda, A., Barré, J., Benedictow, A., Blechschmidt, A.-M., Dominguez, J. J., Engelen, R., Eskes, H., Flemming, J., Huijnen, V., Jones, L., Kipling, Z., Massart, S., Parrington, M., Peuch, V.-H., Razinger, M., Remy, S., Schulz, M., and Suttie, M.: The CAMS reanalysis of atmospheric composition, Atmos. Chem. Phys., 19, 3515–3556, https://doi.org/10.5194/acp-19-3515-2019, 2019.
Jiang, X., Li, G., and Fu, W.: Government environmental governance, structural adjustment and air quality: A quasi-natural experiment based on the Three-year Action Plan to Win the Blue Sky Defense War, J. Environ. Manage., 277, 111470, https://doi.org/10.1016/j.jenvman.2020.111470, 2021.
Kan, H., Chen, R., and Tong, S.: Ambient air pollution, climate change, and population health in China, Environ. Int., 42, 10–19, https://doi.org/10.1016/j.envint.2011.03.003, 2012.
Koukouli, M. E., Theys, N., Ding, J., Zyrichidou, I., Mijling, B., Balis, D., and van der A, R. J.: Updated SO2 emission estimates over China using OMI/Aura observations, Atmos. Meas. Tech., 11, 1817–1832, https://doi.org/10.5194/amt-11-1817-2018, 2018.
Lee, E. J., Kim, M. J., and Lee, J.-S.: Policy Implications of the Clean Heating Transition: A Case Study of Shanxi, Energies, 14, 8431, https://doi.org/10.3390/en14248431, 2021.
Levelt, P. F., Stein Zweers, D. C., Aben, I., Bauwens, M., Borsdorff, T., De Smedt, I., Eskes, H. J., Lerot, C., Loyola, D. G., Romahn, F., Stavrakou, T., Theys, N., Van Roozendael, M., Veefkind, J. P., and Verhoelst, T.: Air quality impacts of COVID-19 lockdown measures detected from space using high spatial resolution observations of multiple trace gases from Sentinel-5P/TROPOMI, Atmos. Chem. Phys., 22, 10319–10351, https://doi.org/10.5194/acp-22-10319-2022, 2022.
Li, C., Hammer, M. S., Zheng, B., and Cohen, R. C.: Accelerated reduction of air pollutants in China, 2017-2020, Sci. Total Environ., 803, 150011, https://doi.org/10.1016/j.scitotenv.2021.150011, 2022.
Li, H., Yang, Y., Wang, H., Wang, P., Yue, X., and Liao, H.: Projected Aerosol Changes Driven by Emissions and Climate Change Using a Machine Learning Method, Environ. Sci. Technol., 56, 3884–3893, https://doi.org/10.1021/acs.est.1c04380, 2022.
Li, H., Liang, L., Zhang, S., Qian, Z., Cai, M., Wang, X., McMillin, S. E., Keith, A. E., Wei, J., Geng, Y., and Lin, H.: Short-term ambient particulate matter pollution of different sizes and respiratory hospital admission in the Beibu Gulf area of Southern China, Atmos. Environ., 294, 119524, https://doi.org/10.1016/j.atmosenv.2022.119524, 2023.
Li, R., Wang, Z., Cui, L., Fu, H., Zhang, L., Kong, L., Chen, W., and Chen, J.: Air pollution characteristics in China during 2015–2016: Spatiotemporal variations and key meteorological factors, Sci. Total Environ., 648, 902–915, https://doi.org/10.1016/j.scitotenv.2018.08.181, 2019.
Li, R., Cui, L., Liang, J., Zhao, Y., Zhang, Z., and Fu, H.: Estimating historical SO2 level across the whole China during 1973–2014 using random forest model, Chemosphere, 247, 125839, https://doi.org/10.1016/j.chemosphere.2020.125839, 2020.
Li, S., Meng, Q., Laba, C., Guan, H., Wang, Z., Pan, Y., Wei, J., Xu, H., Zeng, C., Wang, X., Jiang, M., Lu, R., Guo, B., and Zhao, X.: Associations between long-term exposure to ambient air pollution and renal function in Southwest China: The China Multi-Ethnic Cohort (CMEC) study, Ecotox. Environ. Safe., 242, 113851, https://doi.org/10.1016/j.ecoenv.2022.113851, 2022.
Li, S., Wei, J., Hu, Y., Liu, Y., Hu, M., Shi, Y., Xue, Y., Liu, M., Xie, W., Guo, X., and Liu, X.: Long-term effect of intermediate particulate matter (PM1–2.5) on incident asthma among middle-aged and elderly adults: A national population-based longitudinal study, Sci. Total Environ., 859, 160204, https://doi.org/10.1016/j.scitotenv.2022.160204, 2023.
Li, T., Shen, H., Yuan, Q., Zhang, X., and Zhang, L.: Estimating Ground-Level PM2.5 by Fusing Satellite and Station Observations: A Geo-Intelligent Deep Learning Approach, Geophys. Res. Lett., 44, 11985–11993, https://doi.org/10.1002/2017GL075710, 2017.
Li, Y., Yuan, X., Wei, J., Sun, Y., Ni, W., Zhang, H., Zhang, Y., Wang, R., Xu, R., Liu, T., Yang, C., Chen, G., Xu, J., and Liu, Y.: Long-term exposure to ambient air pollution and serum liver enzymes in older adults: A population-based longitudinal study, Ann. Epidemiol., 74, 1–7, https://doi.org/10.1016/j.annepidem.2022.05.011, 2022.
Li, Y., Yuan, X., Wei, J., Sun, Y., Ni, W., Zhang, H., Zhang, Y., Wang, R., Xu, R., Chen, G., Liu, Y., and Xu, J.: Long-term exposure to ambient particulate matter and kidney function in older adults, Atmos. Environ., 295, 119535, https://doi.org/10.1016/j.atmosenv.2022.119535, 2023.
Li, Z., Guo, J., Ding, A., Liao, H., Liu, J., Sun, Y., Wang, T., Xue, H., Zhang, H., and Zhu, B.: Aerosol and boundary-layer interactions and impact on air quality, Natl. Sci. Rev., 4, 810–833, https://doi.org/10.1093/nsr/nwx117, 2017.
Lin, J., Lin, C., Tao, M., Ma, J., Fan, L., Xu, R.-A., and Fang, C.: Spatial Disparity of Meteorological Impacts on Carbon Monoxide Pollution in China during the COVID-19 Lockdown Period, ACS Earth and Space Chemistry, 5, 2900–2909, https://doi.org/10.1021/acsearthspacechem.1c00251, 2021.
Ling, C. and Li, Y.: Substantial Changes of Gaseous Pollutants and Health Effects During the COVID-19 Lockdown Period Across China, GeoHealth, 5, e2021GH000408, https://doi.org/10.1029/2021GH000408, 2021.
Liu, D., Di, B., Luo, Y., Deng, X., Zhang, H., Yang, F., Grieneisen, M. L., and Zhan, Y.: Estimating ground-level CO concentrations across China based on the national monitoring network and MOPITT: potentially overlooked CO hotspots in the Tibetan Plateau, Atmos. Chem. Phys., 19, 12413–12430, https://doi.org/10.5194/acp-19-12413-2019, 2019.
Liu, J.: Mapping high resolution national daily NO2 exposure across mainland China using an ensemble algorithm, Environ. Pollut., 279, 116932, https://doi.org/10.1016/j.envpol.2021.116932, 2021.
Liu, T., Zhou, Y., Wei, J., Chen, Q., Xu, R., Pan, J., Lu, W., Wang, Y., Fan, Z., Li, Y., Xu, L., Cui, X., Shi, C., Zhang, L., Chen, X., Bao, W., Sun, H., and Liu, Y.: Association between short-term exposure to ambient air pollution and dementia mortality in Chinese adults, Sci. Total Environ., 849, 157860, https://doi.org/10.1016/j.scitotenv.2022.157860, 2022.
Liu, W., Wei, J., Cai, M., Qian, Z., Long, Z., Wang, L., Vaughn, M. G., Aaron, H. E., Tong, X., Li, Y., Yin, P., Lin, H., and Zhou, M.: Particulate matter pollution and asthma mortality in China: A nationwide time-stratified case-crossover study from 2015 to 2020, Chemosphere, 308, 136316, https://doi.org/10.1016/j.chemosphere.2022.136316, 2022.
Liu, W., Cai, M., Long, Z., Tong, X., Li, Y., Wang, L., Zhou, M., Wei, J., Lin, H., and Yin, P.: Association between ambient sulfur dioxide pollution and asthma mortality: Evidence from a nationwide analysis in China, Ecotox. Environ. Safe., 249, 114442, https://doi.org/10.1016/j.ecoenv.2022.114442, 2023.
Lu, J., Wu, K., Ma, X., Wei, J., Yuan, Z., Huang, Z., Fan, W., Zhong, Q., Huang, Y., and Wu, X.: Short-term effects of ambient particulate matter (PM1, PM2.5 and PM10) on influenza-like illness in Guangzhou, China, Int. J. Hyg. Envir. Heal., 247, 114074, https://doi.org/10.1016/j.ijheh.2022.114074, 2023.
Ma, X., Duan, H., Zhang, H., Liu, X., Sun, X., Wei, J., Zhao, M., and Xi, B.: Short-term effects of PM1, PM2.5, and PM2.5 constituents on myocardial infarction mortality in qingdao, China: A time-stratified case-crossover analysis, Atmos. Environ., 294, 119478, https://doi.org/10.1016/j.atmosenv.2022.119478, 2023.
Ma, Z., Dey, S., Christopher, S., Liu, R., Bi, J., Balyan, P., and Liu, Y.: A review of statistical methods used for developing large-scale and long-term PM2.5 models from satellite data, Remote Sens. Environ., 269, 112827, https://doi.org/10.1016/j.rse.2021.112827, 2022.
Maji, K. J. and Sarkar, C.: Spatio-temporal variations and trends of major air pollutants in China during 2015–2018, Environ. Sci. Pollut. R., 27, 33792–33808, https://doi.org/10.1007/s11356-020-09646-8, 2020.
MEE: Technical regulation for selection of ambient air quality monitoring stations (on trial), Ministry of Ecology and Environment of the People's Republic of China, https://www.mee.gov.cn/ywgz/fgbz/bz/bzwb/jcffbz/201309/W020131105548727856307.pdf (last access: 1 November 2022), 2013a (in Chinese).
MEE: Specifications and Test Procedures for Ambient Air Quality Continuous Automated Monitoring System for SO2, NO2, O3 and CO (HJ 654-2013), Ministry of Ecology and Environment of the People's Republic of China, https://www.mee.gov.cn/ywgz/fgbz/bz/bzwb/jcffbz/201308/t20130802_20256853.shtml (last access: 1 November 2022), 2013b (in Chinese).
MEE: Technical Specifications for Installation and Acceptance of Ambient Air Quality Continuous Automated Monitoring System for SO2, NO2, O3 and CO (HJ 655-2013), Ministry of Ecology and Environment of the People's Republic of China, https://www.mee.gov.cn/ywgz/fgbz/bz/bzwb/jcffbz/201308/W020130802492823718666.pdf (last acess: 1 November 2022), 2013c (in Chinese).
MEE: Revision of the Ambien air quality standards (GB 3095-2012), Ministry of Ecology and Environment of the People's Republic of China, http://www.mee.gov.cn/xxgk2018/xxgk/xxgk2001/201808/t20180815_20629602.html (last access: 1 November 2022), 2018a (in Chinese).
MEE: Technical specifications for operation and quality control of ambient air quality continuous automated monitoring system for SO2, NO2, O3 and CO (HJ 818-2018), Ministry of Ecology and Environment of the People's Republic of China, https://www.mee.gov.cn/ywgz/fgbz/bz/bzwb/jcffbz/201808/W020180815358674459089.pdf (last access: 1 November 2022), 2018b (in Chinese).
Mei, Y., Li, A., Zhao, J., Zhou, Q., Zhao, M., Xu, J., Li, R., Li, Y., Li, K., Ge, X., Guo, C., Wei, Y., and Xu, Q.: Association of long-term air pollution exposure with the risk of prediabetes and diabetes: Systematic perspective from inflammatory mechanisms, glucose homeostasis pathway to preventive strategies, Environ. Res., 216, 114472, https://doi.org/10.1016/j.envres.2022.114472, 2023.
Muñoz-Sabater, J., Dutra, E., Agustí-Panareda, A., Albergel, C., Arduini, G., Balsamo, G., Boussetta, S., Choulga, M., Harrigan, S., Hersbach, H., Martens, B., Miralles, D. G., Piles, M., Rodríguez-Fernández, N. J., Zsoter, E., Buontempo, C., and Thépaut, J.-N.: ERA5-Land: a state-of-the-art global reanalysis dataset for land applications, Earth Syst. Sci. Data, 13, 4349–4383, https://doi.org/10.5194/essd-13-4349-2021, 2021.
NASA: EARTHDATA, NASA [data set], https://search.earthdata.nasa.gov/, last access: 1 January 2023a.
NASA: Jet Propulsion Laboratory, NASA [data set], https://www2.jpl.nasa.gov/srtm/, last access: 1 January 2023b.
NASA: NCCS, NASA [data set], https://portal.nccs.nasa.gov/datashare/gmao/geos-cf/, last access: 1 January 2023c.
Orellano, P., Reynoso, J., Quaranta, N., Bardach, A., and Ciapponi, A.: Short-term exposure to particulate matter (PM10 and PM2.5), nitrogen dioxide (NO2), and ozone (O3) and all-cause and cause-specific mortality: Systematic review and meta-analysis, Environ. Int., 142, 105876, https://doi.org/10.1016/j.envint.2020.105876, 2020.
ORNL: LandScan, ORNL [data set], https://landscan.ornl.gov/, last access: 1 January 2023.
Qin, K., Rao, L., Xu, J., Bai, Y., Zou, J., Hao, N., Li, S., and Yu, C.: Estimating Ground Level NO2 Concentrations over Central-Eastern China Using a Satellite-Based Geographically and Temporally Weighted Regression Model, Remote Sens., 9, 950, https://doi.org/10.3390/rs9090950, 2017.
Rodriguez, J. D., Perez, A., and Lozano, J. A.: Sensitivity Analysis of k-Fold Cross Validation in Prediction Error Estimation, IEEE T. Pattern Anal., 32, 569–575, https://doi.org/10.1109/TPAMI.2009.187, 2010.
Seo, J., Kim, J. Y., Youn, D., Lee, J. Y., Kim, H., Lim, Y. B., Kim, Y., and Jin, H. C.: On the multiday haze in the Asian continental outflow: the important role of synoptic conditions combined with regional and local sources, Atmos. Chem. Phys., 17, 9311–9332, https://doi.org/10.5194/acp-17-9311-2017, 2017.
Shah, V., Jacob, D. J., Li, K., Silvern, R. F., Zhai, S., Liu, M., Lin, J., and Zhang, Q.: Effect of changing NOx lifetime on the seasonality and long-term trends of satellite-observed tropospheric NO2 columns over China, Atmos. Chem. Phys., 20, 1483–1495, https://doi.org/10.5194/acp-20-1483-2020, 2020.
Song, J., Du, P., Yi, W., Wei, J., Fang, J., Pan, R., Zhao, F., Zhang, Y., Xu, Z., Sun, Q., Liu, Y., Chen, C., Cheng, J., Lu, Y., Li, T., Su, H., and Shi, X.: Using an Exposome-Wide Approach to Explore the Impact of Urban Environments on Blood Pressure among Adults in Beijing–Tianjin–Hebei and Surrounding Areas of China, Environ. Sci. Technol., 56, 8395–8405, https://doi.org/10.1021/acs.est.1c08327, 2022.
Su, T., Li, Z., Zheng, Y., Luan, Q., and Guo, J.: Abnormally Shallow Boundary Layer Associated With Severe Air Pollution During the COVID-19 Lockdown in China, Geophys. Res. Lett., 47, e2020GL090041, https://doi.org/10.1029/2020GL090041, 2020.
Su, X., Zhang, S., Lin, Q., Wu, Y., Yang, Y., Yu, H., Huang, S., Luo, W., Wang, X., Lin, H., Ma, L., and Zhang, Z.: Prenatal exposure to air pollution and neurodevelopmental delay in children: A birth cohort study in Foshan, China, Sci. Total Environ., 816, 151658, https://doi.org/10.1016/j.scitotenv.2021.151658, 2022.
Tian, H., Liu, Y., Li, Y., Wu, C.-H., Chen, B., Kraemer, M. U. G., Li, B., Cai, J., Xu, B., Yang, Q., Wang, B., Yang, P., Cui, Y., Song, Y., Zheng, P., Wang, Q., Bjornstad, O. N., Yang, R., Grenfell, B. T., Pybus, O. G., and Dye, C.: An investigation of transmission control measures during the first 50 days of the COVID-19 epidemic in China, Science, 368, 638–642, https://doi.org/10.1126/science.abb6105, 2020.
van der A, R. J., Mijling, B., Ding, J., Koukouli, M. E., Liu, F., Li, Q., Mao, H., and Theys, N.: Cleaning up the air: effectiveness of air quality policy for SO2 and NOx emissions in China, Atmos. Chem. Phys., 17, 1775–1789, https://doi.org/10.5194/acp-17-1775-2017, 2017.
Wan, J., Qin, C., Wang, Q., Xiao, Y., Niu, R., Li, X., and Su, J.: A Brief Overview of the 13th Five-Year Plan for the Protection of Ecological Environment, in: Environmental Strategy and Planning in China, edited by: Wang, J., Wang, X., and Wan, J., Springer Singapore, Singapore, 57–85, https://doi.org/10.1007/978-981-16-6909-5_3, 2022.
Wang, L., Zhang, J., Wei, J., Zong, J., Lu, C., Du, Y., and Wang, Q.: Association of ambient air pollution exposure and its variability with subjective sleep quality in China: A multilevel modeling analysis, Environ. Pollut., 312, 120020, https://doi.org/10.1016/j.envpol.2022.120020, 2022.
Wang, R., Xu, R., Wei, J., Liu, T., Ye, Y., Li, Y., Lin, Q., Zhou, Y., Huang, S., Lv, Z., Tian, Q., and Liu, Y.: Short-Term Exposure to Ambient Air Pollution and Hospital Admissions for Sequelae of Stroke in Chinese Older Adults, GeoHealth, 6, e2022GH000700, https://doi.org/10.1029/2022GH000700, 2022.
Wang, S., Su, H., Chen, C., Tao, W., Streets, D. G., Lu, Z., Zheng, B., Carmichael, G. R., Lelieveld, J., Pöschl, U., and Cheng, Y.: Natural gas shortages during the “coal-to-gas” transition in China have caused a large redistribution of air pollution in winter 2017, P. Natl. Acad. Sci. USA, 117, 31018–31025, https://doi.org/10.1073/pnas.2007513117, 2020.
Wang, Y., Ma, Y.-F., Eskes, H., Inness, A., Flemming, J., and Brasseur, G. P.: Evaluation of the CAMS global atmospheric trace gas reanalysis 2003–2016 using aircraft campaign observations, Atmos. Chem. Phys., 20, 4493–4521, https://doi.org/10.5194/acp-20-4493-2020, 2020.
Wang, Y., Yuan, Q., Li, T., Zhu, L., and Zhang, L.: Estimating daily full-coverage near surface O3, CO, and NO2 concentrations at a high spatial resolution over China based on S5P-TROPOMI and GEOS-FP, ISPRS J. Photogramm., 175, 311–325, https://doi.org/10.1016/j.isprsjprs.2021.03.018, 2021.
Wang, Y., Luo, S., Wei, J., Yang, Z., Hu, K., Yao, Y., and Zhang, Y.: Ambient NO2 exposure hinders long-term survival of Chinese middle-aged and older adults, Sci. Total Environ., 855, 158784, https://doi.org/10.1016/j.scitotenv.2022.158784, 2023.
Wei, J.: ChinaHighAirPollutants (CHAP), GitHub [data set], https://weijing-rs.github.io/product.html, last access: 1 January 2023.
Wei, J. and Li, Z.: ChinaHighNO2: Big Data Seamless 10 km Ground-level NO2 Dataset for China (Version 1), Zenodo [data set], https://doi.org/10.5281/zenodo.4641542, 2021a.
Wei, J. and Li, Z.: ChinaHighSO2: Big Data Seamless 10 km Ground-level SO2 Dataset for China (Version 1), Zenodo [data set], https://doi.org/10.5281/zenodo.4641538, 2021b.
Wei, J. and Li, Z.: ChinaHighCO: Big Data Seamless 10 km Ground-level CO dataset for China (Version 1), Zenodo [data set], https://doi.org/10.5281/zenodo.4641530, 2021c.
Wei, J., Li, Z., Guo, J., Sun, L., Huang, W., Xue, W., Fan, T., and Cribb, M.: Satellite-Derived 1-km-Resolution PM1 Concentrations from 2014 to 2018 across China, Environ. Sci. Technol., 53, 13265–13274, https://doi.org/10.1021/acs.est.9b03258, 2019.
Wei, J., Li, Z., Cribb, M., Huang, W., Xue, W., Sun, L., Guo, J., Peng, Y., Li, J., Lyapustin, A., Liu, L., Wu, H., and Song, Y.: Improved 1 km resolution PM2.5 estimates across China using enhanced space–time extremely randomized trees, Atmos. Chem. Phys., 20, 3273–3289, https://doi.org/10.5194/acp-20-3273-2020, 2020.
Wei, J., Li, Z., Lyapustin, A., Sun, L., Peng, Y., Xue, W., Su, T., and Cribb, M.: Reconstructing 1-km-resolution high-quality PM2.5 data records from 2000 to 2018 in China: spatiotemporal variations and policy implications, Remote Sens. Environ., 252, 112136, https://doi.org/10.1016/j.rse.2020.112136, 2021a.
Wei, J., Li, Z., Xue, W., Sun, L., Fan, T., Liu, L., Su, T., and Cribb, M.: The ChinaHighPM10 dataset: generation, validation, and spatiotemporal variations from 2015 to 2019 across China, Environ. Int., 146, 106290, https://doi.org/10.1016/j.envint.2020.106290, 2021b.
Wei, J., Li, Z., Li, K., Dickerson, R. R., Pinker, R. T., Wang, J., Liu, X., Sun, L., Xue, W., and Cribb, M.: Full-coverage mapping and spatiotemporal variations of ground-level ozone (O3) pollution from 2013 to 2020 across China, Remote Sens. Environ., 270, 112775, https://doi.org/10.1016/j.rse.2021.112775, 2022a.
Wei, J., Liu, S., Li, Z., Liu, C., Qin, K., Liu, X., Pinker, R. T., Dickerson, R. R., Lin, J., Boersma, K. F., Sun, L., Li, R., Xue, W., Cui, Y., Zhang, C., and Wang, J.: Ground-Level NO2 Surveillance from Space Across China for High Resolution Using Interpretable Spatiotemporally Weighted Artificial Intelligence, Environ. Sci. Technol., 56, 9988–9998, https://doi.org/10.1021/acs.est.2c03834, 2022b.
WHO: Coronavirus Disease (COVID-19) Pandemic, The World Health Organization, https://www.who.int/emergencies/diseases/novel-coronavirus-2019 (last access: 1 January 2023), 2020.
WHO: WHO global air quality guidelines. Particulate matter (PM2.5 and PM10), ozone, nitrogen dioxide, sulfur dioxide and carbon monoxide, World Health Organization, Geneva, ISBN 9789240034228, 2021.
Wu, H., Zhang, Y., Zhao, M., Liu, W., Magnussen, C. G., Wei, J., and Xi, B.: Short-term effects of exposure to ambient PM1 on blood pressure in children and adolescents aged 9 to 18 years in Shandong Province, China, Atmos. Environ., 283, 119180, https://doi.org/10.1016/j.atmosenv.2022.119180, 2022a.
Wu, H., Lu, Z., Wei, J., Zhang, B., Liu, X., Zhao, M., Liu, W., Guo, X., and Xi, B.: Effects of the COVID-19 Lockdown on Air Pollutant Levels and Associated Reductions in Ischemic Stroke Incidence in Shandong Province, China, Frontiers in Public Health, 10, 876615, https://doi.org/10.3389/fpubh.2022.876615, 2022b.
Wu, S., Huang, B., Wang, J., He, L., Wang, Z., Yan, Z., Lao, X., Zhang, F., Liu, R., and Du, Z.: Spatiotemporal mapping and assessment of daily ground NO2 concentrations in China using high-resolution TROPOMI retrievals, Environ. Pollut., 273, 116456, https://doi.org/10.1016/j.envpol.2021.116456, 2021.
Wu, X., Yang, Y., Gong, Y., Deng, Z., Wang, Y., Wu, W., Zheng, C., and Zhang, Y.: Advances in air pollution control for key industries in China during the 13th five-year plan, J. Environ. Sci., 123, 446–459, https://doi.org/10.1016/j.jes.2022.09.008, 2022.
Xu, H., Bechle, M. J., Wang, M., Szpiro, A. A., Vedal, S., Bai, Y., and Marshall, J. D.: National PM2.5 and NO2 exposure models for China based on land use regression, satellite measurements, and universal kriging, Sci. Total Environ., 655, 423–433, https://doi.org/10.1016/j.scitotenv.2018.11.125, 2019.
Xu, J., Zhou, J., Luo, P., Mao, D., Xu, W., Nima, Q., Cui, C., Yang, S., Ao, L., Wu, J., Wei, J., Chen, G., Li, S., Guo, Y., Zhang, J., Liu, Z., and Zhao, X.: Associations of long-term exposure to ambient air pollution and physical activity with insomnia in Chinese adults, Sci. Total Environ., 792, 148197, https://doi.org/10.1016/j.scitotenv.2021.148197, 2021.
Xu, R., Wei, J., Liu, T., Li, Y., Yang, C., Shi, C., Chen, G., Zhou, Y., Sun, H., and Liu, Y.: Association of short-term exposure to ambient PM1 with total and cause-specific cardiovascular disease mortality, Environ. Int., 169, 107519, https://doi.org/10.1016/j.envint.2022.107519, 2022a.
Xu, R., Shi, C., Wei, J., Lu, W., Li, Y., Liu, T., Wang, Y., Zhou, Y., Chen, G., Sun, H., and Liu, Y.: Cause-specific cardiovascular disease mortality attributable to ambient temperature: A time-stratified case-crossover study in Jiangsu province, China, Ecotox. Environ. Safe., 236, 113498, https://doi.org/10.1016/j.ecoenv.2022.113498, 2022b.
Xu, R., Wang, Q., Wei, J., Lu, W., Wang, R., Liu, T., Wang, Y., Fan, Z., Li, Y., Xu, L., Shi, C., Li, G., Chen, G., Zhang, L., Zhou, Y., Liu, Y., and Sun, H.: Association of short-term exposure to ambient air pollution with mortality from ischemic and hemorrhagic stroke, Eur. J. Neurol., 29, 1994–2005, https://doi.org/10.1111/ene.15343, 2022c.
Xu, W. Y., Zhao, C. S., Ran, L., Deng, Z. Z., Liu, P. F., Ma, N., Lin, W. L., Xu, X. B., Yan, P., He, X., Yu, J., Liang, W. D., and Chen, L. L.: Characteristics of pollutants and their correlation to meteorological conditions at a suburban site in the North China Plain, Atmos. Chem. Phys., 11, 4353–4369, https://doi.org/10.5194/acp-11-4353-2011, 2011.
Yang, Y., Ren, L., Wu, M., Wang, H., Song, F., Leung, L. R., Hao, X., Li, J., Chen, L., Li, H., Zeng, L., Zhou, Y., Wang, P., Liao, H., Wang, J., and Zhou, Z.-Q.: Abrupt emissions reductions during COVID-19 contributed to record summer rainfall in China, Nat. Commun., 13, 959, https://doi.org/10.1038/s41467-022-28537-9, 2022.
Yoo, J.-M., Lee, Y.-R., Kim, D., Jeong, M.-J., Stockwell, W. R., Kundu, P. K., Oh, S.-M., Shin, D.-B., and Lee, S.-J.: New indices for wet scavenging of air pollutants (O3, CO, NO2, SO2, and PM10) by summertime rain, Atmos. Environ., 82, 226–237, https://doi.org/10.1016/j.atmosenv.2013.10.022, 2014.
Zhan, Y., Luo, Y., Deng, X., Zhang, K., Zhang, M., Grieneisen, M. L., and Di, B.: Satellite-Based Estimates of Daily NO2 Exposure in China Using Hybrid Random Forest and Spatiotemporal Kriging Model, Environ. Sci. Technol., 52, 4180–4189, 10.1021/acs.est.7b05669, 2018.
Zhang, B., Rong, Y., Yong, R., Qin, D., Li, M., Zou, G., and Pan, J.: Deep learning for air pollutant concentration prediction: A review, Atmos. Environ., 290, 119347, https://doi.org/10.1016/j.atmosenv.2022.119347, 2022.
Zhang, C., Liu, C., Hu, Q., Cai, Z., Su, W., Xia, C., Zhu, Y., Wang, S., and Liu, J.: Satellite UV-Vis spectroscopy: implications for air quality trends and their driving forces in China during 2005–2017, Light-Sci. Appl., 8, 100, https://doi.org/10.1038/s41377-019-0210-6, 2019.
Zhang, Q., Zheng, Y., Tong, D., Shao, M., Wang, S., Zhang, Y., Xu, X., Wang, J., He, H., Liu, W., Ding, Y., Lei, Y., Li, J., Wang, Z., Zhang, X., Wang, Y., Cheng, J., Liu, Y., Shi, Q., Yan, L., Geng, G., Hong, C., Li, M., Liu, F., Zheng, B., Cao, J., Ding, A., Gao, J., Fu, Q., Huo, J., Liu, B., Liu, Z., Yang, F., He, K., and Hao, J.: Drivers of improved PM2.5 air quality in China from 2013 to 2017, P. Natl. Acad. Sci. USA, 116, 24463–24469, https://doi.org/10.1073/pnas.1907956116, 2019.
Zhang, Y., Li, Z., Wei, J., Zhan, Y., Liu, L., Yang, Z., Zhang, Y., Liu, R., and Ma, Z.: Long-term exposure to ambient NO2 and adult mortality: A nationwide cohort study in China, J. Adv. Res., 41, 13–22, https://doi.org/10.1016/j.jare.2022.02.007, 2022.
Zhang, Z., Wang, J., Hart, J. E., Laden, F., Zhao, C., Li, T., Zheng, P., Li, D., Ye, Z., and Chen, K.: National scale spatiotemporal land-use regression model for PM2.5, PM10 and NO2 concentration in China, Atmos. Environ., 192, 48–54, https://doi.org/10.1016/j.atmosenv.2018.08.046, 2018.
Zheng, B., Chevallier, F., Ciais, P., Yin, Y., Deeter, M. N., Worden, H. M., Wang, Y., Zhang, Q., and He, K.: Rapid decline in carbon monoxide emissions and export from East Asia between years 2005 and 2016, Environ. Res. Lett., 13, 044007, https://doi.org/10.1088/1748-9326/aab2b3, 2018.
Zheng, B., Zhang, Q., Geng, G., Chen, C., Shi, Q., Cui, M., Lei, Y., and He, K.: Changes in China's anthropogenic emissions and air quality during the COVID-19 pandemic in 2020, Earth Syst. Sci. Data, 13, 2895–2907, https://doi.org/10.5194/essd-13-2895-2021, 2021.