the Creative Commons Attribution 4.0 License.
the Creative Commons Attribution 4.0 License.
 | 01 Dec 2023
Photochemical ageing of aerosols contributes significantly to the production of atmospheric formic acid
Yifan Jiang
Penggang Zheng
Formic acid (HCOOH) is one of the most abundant organic acids in the atmosphere and affects atmospheric acidity and aqueous chemistry. However, the HCOOH sources are not well understood. In a recent field study, we measured atmospheric HCOOH concentrations at a coastal site in southern China. The average concentrations of HCOOH were 191 ± 167 ppt in marine air masses and 996 ± 433 ppt in coastal air masses. A strong linear correlation between HCOOH concentrations and the surface area densities of submicron particulate matter was observed in coastal air masses. Post-campaign laboratory experiments confirmed that the photochemical ageing of ambient aerosols promoted by heterogeneous reactions with ozone produced a high concentration of HCOOH at a rate of 0.185 ppb h−1 under typical ambient conditions at noon. HCOOH production was strongly affected by nitrate photolysis, as this efficiently produces OH radicals that oxidise organics to form HCOOH. We incorporated this particle-phase source into a photochemical model, and the net HCOOH production rate increased by about 3 times compared with the default Master Chemical Mechanism (MCM). These findings demonstrate that the photochemical ageing of aerosols is an important source of HCOOH that should be included in atmospheric chemistry–transport models.
- Article
(3025 KB) - Full-text XML
-
Supplement
(1549 KB) - BibTeX
- EndNote


Organic acids are ubiquitous in the troposphere and constitute a significant fraction of the total organics in both the gas and particle phase (Chebbi and Carlier, 1996). They also participate in the aqueous-phase chemistry of clouds, contribute to secondary organic aerosol (SOA) formation through reactions within the condensed phase (Carlton et al., 2007; Ervens et al., 2004; Lim et al., 2010), and are proposed to enhance the formation of new particles in the atmosphere (Zhang et al., 2004). Formic acid (HCOOH) is among the most abundant organic acids in the atmosphere (Khare et al., 1999) and accounts for over 60 % of the free acidity in precipitation in remote areas and more than 30 % of that in polluted areas (Andreae et al., 1988; Keene et al., 1983; Keene and Galloway, 1988; Khare et al., 1999; Stavrakou et al., 2012). This contribution is increasingly important due to the decline in the concentrations of anthropogenic nitrogen oxides (NOx) and sulfur dioxide (SO2). HCOOH serves as a significant sink of in-cloud hydroxyl radicals (•OH) and stabilised Criegee intermediates (SCIs) (Jacob, 1986) and thus influences aqueous-phase chemistry by affecting pH-dependent reaction rates, oxidant concentrations, and solubilities (Vet et al., 2014). HCOOH also plays a role in the formation of cloud condensation nuclei (Yu, 2000), due to its comparatively higher hygroscopicity at low critical supersaturations when incorporated into aerosols (Novakov and Penner, 1993). This, in turn, affects total indirect radiative forcing. Additionally, HCOOH may be involved in halogen chemistry through its heterogeneous reaction with solid sodium chloride in sea-salt aerosols (Xia et al., 2018).
Considering the abovementioned roles of HCOOH in atmospheric chemistry, it is essential to understand its sources and sinks. The main sources of HCOOH include direct emissions from terrestrial vegetation (Andreae et al., 1988), biomass and biofuel burning (Akagi et al., 2011; Goode et al., 2000; Yokelson et al., 2009), fossil-fuel combustion (Kawamura et al., 2000; Zervas et al., 2001a, b), and soil emissions (Sanhueza and Andreae, 1991). The secondary gas-phase formation mechanisms of HCOOH are mainly the oxidation of volatile organic compounds (VOCs), including ozonolysis of terminal alkenes (Neeb et al., 1997), alkyne oxidation (Bohn et al., 1996), OH-initiated isoprene oxidation (Paulot et al., 2009), monoterpene oxidation (Larsen et al., 2001), keto-enol tautomerisation (Andrews et al., 2012; Shaw et al., 2018), and •OH oxidation of methyldioxy radicals (CH3O2•) (Bossolasco et al., 2014). HCOOH is primarily removed from the atmosphere through wet and dry deposition, with a minor sink being photo-oxidation by •OH (Atkinson et al., 2006). However, with these mechanisms included, HCOOH concentrations remain significantly underestimated by previous models (Baboukas et al., 2000; Bannan et al., 2017; Chaliyakunnel et al., 2016; Le Breton et al., 2012; Millet et al., 2015; Yuan et al., 2015), indicating a substantial missing source of HCOOH.
In addition to gas-phase production pathways, HCOOH can also be generated through heterogeneous or condensed-phase processes. Aqueous reactions of formaldehyde (HCHO) (Chameides and Davis, 1983; Jacob, 1986), glyoxal (Carlton et al., 2007), and other species with •OH (aq) can produce HCOOH, particularly in moderately acidic environments (Jacob, 1986). A recent chamber experiment has revealed that formaldehyde can be efficiently converted to HCOOH through a multiphase pathway that involves its hydrated form, methanediol. This pathway has been shown to generate up to 4 times more formic acid compared to all other known chemical sources combined in a chemistry–climate model, and the modified model largely reproduced observed ambient concentrations of HCOOH (Franco et al., 2021). Moreover, Gao et al. (2022) proposed a new bidirectional deposition–emission process, in which HCOOH deposits rapidly in night-time dew and is re-emitted subsequently from the dew as it evaporates on the following day.
Many laboratory chamber studies have demonstrated that the photochemical ageing of organic aerosols can also produce HCOOH (Henry and Donahue, 2012; Malecha and Nizkorodov, 2016; Mang et al., 2008; Pan et al., 2009; Walser et al., 2007; Zhang et al., 2021). The photochemical ageing of aerosols occurs through the reactive uptake of oxidants onto particle surfaces, altering their chemical compositions and physical properties (George et al., 2015). In the condensed organic phase, HCOOH can be produced through the photodegradation of SOA (Henry and Donahue, 2012; Malecha and Nizkorodov, 2016). Additionally, oxidants such as •OH, nitrogen dioxide (NO2), and nitrite ions/nitrous acid (HONO) produced from the photolysis of particulate nitrate (NO) can also efficiently oxidise organics to produce HCOOH (Zhang et al., 2021). Apart from laboratory experiments, Paulot et al. (2011) observed a marked positive correlation between HCOOH concentrations and submicron organic aerosol masses in field measurements conducted in three distinct areas – coastal, urban, and polar – and suggested that aerosol ageing produces HCOOH. The aforementioned results show that there is a need for a quantitative assessment of the contribution of the photochemical ageing of aerosols to HCOOH production in the ambient atmosphere.
In this study, we measured HCOOH concentrations at near-ground level at a coastal site in Hong Kong SAR, China, for 2 months during autumn 2021. We examined the characteristics of HCOOH concentrations and their correlation with related species' concentrations or other parameters. We then conducted a chamber study to measure the rate of HCOOH production during the ageing of ambient aerosols and extrapolated the results to the real atmosphere. We incorporated this HCOOH formation mechanism into a model using a parameterisation involving fine particulate matter concentration, surface area density, light intensity, and ozone (O3) concentration and then performed simulations to evaluate the HCOOH production rate from the photochemical ageing of aerosols. Furthermore, we showed that NO photolysis acted as a crucial source of •OH during the ageing process. Our results enhanced the understanding of HCOOH sources and model simulations of ambient HCOOH concentrations.
2.1 Field observations
Ambient measurements of the atmospheric concentrations of HCOOH and related species/parameters were conducted from 13 August to 31 October 2021 at the Hong Kong Environmental Protection Department's Cape D'Aguilar Super Site (CDSS; 22.21∘ N, 114.25∘ E), which is situated a few hundred metres away from the nearest coastline of the South China Sea (Fig. S1). During the study period, the air quality of this coastal site was initially predominantly influenced by marine air masses from the South China Sea and subsequently by the coastal air masses transporting regional anthropogenic pollution from eastern China. The site was also affected by biogenic emissions from local vegetation and ship emissions transported mainly from about 8 km away. There were no other significant anthropogenic sources nearby.
The species quantified were HCOOH, HONO, trace gases (nitric oxide, NO2, carbon monoxide (CO), SO2, and O3), VOCs, oxygenated VOCs (OVOCs), aerosol mass concentrations (1 µm particulate matter (PM1), PM2.5, and PM10 concentrations), aerosol size distributions, aerosol ionic compositions, NO2 photolysis frequency (jNO2), and meteorological parameters (temperature, T, relative humidity, RH, wind direction, and wind speed). A detailed description of the measurement of HCOOH concentration is provided below, and information on other measurements is summarised in Table S1.
The concentration of HCOOH was measured at 172.91 atomic mass units (amu) using an iodide-adduct time-of-flight chemical ionisation mass spectrometer (I−-ToF-CIMS; Aerodyne Research), as we used in our previous study at the same site (Xia et al., 2022). A comprehensive description of the use of the I−-ToF-CIMS can be found in previous studies (Lee et al., 2014; Aljawhary et al., 2013). Briefly, humidified iodomethane-containing N2 air was passed through an inline ioniser (containing polonium-210) to generate iodide ions (I−) and iodide–water ions, which served as the reagent ions, and the HCOOH produced was detected as IHCOOH−. The background concentration of HCOOH was determined every 2 d by injecting zero air and was found to be 60.9 ppt. HCOOH calibration was performed three times on-site and once in the laboratory immediately following the field campaign using diluted gas standards generated by a permeation tube (KIN-TEK) with a permeation rate of 90.87 ng min−1. HCOOH sensitivity varies with RH as water competes with HCOOH for I− (Lee et al., 2014). Thus, the HCOOH sensitivity was measured at various RHs, as shown in Fig. S2. The sensitivity remained stable at a given RH, with a variation of less than 5 % throughout the campaign.
The ToF-CIMS was housed in an air-conditioned shelter at an indoor air T maintained at 25–28 ∘C. The shelter was located approximately 15 m away from the CDSS station. The sampling tube was a 0.5 m long perfluoroalkoxy Teflon tube ( in. outer diameter), the inlet of which was situated on the sidewall of the shelter, 1.5 m above the ground. To achieve laminar flow in the sampling tube, a flow rate of 25 L min−1 was adopted, with a residence time of 0.1 s. The ToF-CIMS drew ∼ 2 L min−1 sample air, and the remaining airflow was discarded. The sampling tube was replaced with a new tube every 2 d to reduce inlet artefacts. We investigated possible inlet artefacts by injecting known concentrations of HCOOH into a used sampling inlet and found that the artefacts had a negligible effect on the measured HCOOH concentration (difference < 3 %). The remaining instruments were housed in the CDSS station, with their sampling inlets located ∼ 1.5 m above the roof.
2.2 Hybrid Single-Particle Lagrangian Integrated Trajectory (HYSPLIT) and Extended Aerosol Inorganic Model IV (E-AIM IV) models
Hourly 24 h backward trajectories were obtained using the HYSPLIT model (https://www.ready.noaa.gov/hypub-bin/trajasrc.pl, last access: 6 September 2023). The input parameters were Global Data Assimilation System 1∘ for the meteorology data, 22.21∘ N and 114.25∘ E for the location, and 60 m for the endpoint height. Air masses were classified as marine or coastal, based on their source regions. A unique period was identified as a haze period, during which there was a transition from marine air masses to coastal air masses under stagnant conditions (wind speed < 3 m s−1). A detailed classification can be found in Fig. S3.
The aerosol water content (AWC) and pH were predicted by the E-AIM IV online in batch mode (http://www.aim.env.uea.ac.uk/aim/model4/model4d.php, last access: 28 August 2022). The thermodynamic model was constrained by hourly field-measured molar concentrations of NH, sodium ions (Na+), sulfate ions (SO), NO, and chloride ions (Cl−) in PM2.5; gas-phase ammonia concentrations; ambient T; and RH. Initial concentrations of protons (H+) and hydroxide ions were estimated based on the ion balance of the major water-soluble ions. The input of Na+ into the model (Na) was calculated as a sum of the equivalent concentrations of Na+, potassium ions, magnesium ions, and calcium ions (Eq. 1). The model also considered water dissociation and allowed all possible solids to form in the system. Parameters p, q, r, and s (options in batch mode) were set to 3, meaning that the input portions of ammonium (NH), NO, SO, and Cl− always remained in the condensed phase and did not produce corresponding gas-phase species, such as nitric acid (HNO3) and hydrochloric acid. The aqueous-phase NO concentration was calculated by dividing the moles of aqueous NO by the AWC. Aerosol pH was calculated as the negative logarithm of the concentration of H+.
2.3 Laboratory experiments
We illuminated ambient aerosols collected on filters or aqueous solutions in a dynamic chamber to mimic HCOOH formation in the atmosphere. The overall experimental setup is illustrated in Fig. S4. The dynamic chamber has a dimension of 25 cm length × 15 cm width × 4 cm height with the top side sealed by a transparent Teflon film. Each aerosol filter or solution sample was placed in a quartz Petri dish (inner diameter: 35 mm, inner height: 7 mm) at the chamber's centre. Aerosol filter sampling details can be found in Text S1. A high-pressure xenon (Xe) lamp was used to simulate sunlight and its spectral irradiance is displayed in Fig. 6d. Compared with standard air mass 1.5 solar irradiation (AM 1.5) corresponding to a solar zenith angle of 48.2∘, the Xe lamp exhibited a smaller flux at 300–326 nm but a larger flux at 326–420 nm. An air stream from a zero-air generator (Environics, model 7000) served as the carrier gas that delivered reaction products to the chamber's outflow. The weather conditions that prevailed during the field campaign were mimicked by maintaining the reactor's T at approximately 28 ∘C and adjusting the RH in the chamber to 70 % by passing the carrier gas through a water bubbler. Prior to the introduction of a sample into the chamber, the background HCOOH concentration was monitored for 10 min with the light on and zero air added. After 1 h of irradiation, 100 ppb of O3 was introduced via a dynamic calibrator (Environics® Series 6100) and monitored using an O3 analyser (Thermo Scientific Model 49i). An AM 1.5 filter (which removes light below 360 nm) and a 300–800 nm filter (which allows the passage of 300–800 nm light) were applied to the Xe lamp to investigate the effect of the irradiation wavelength on the formation of HCOOH.
We conducted an experiment to explore the role of nitrate photolysis in the proposed particle-phase mechanism. A sample solution was prepared by mixing formaldehyde (HCHO, Sigma-Aldrich, 37 wt % in water) and sodium nitrate (NaNO3, Honeywell, 99.5 % purity). The resulting solution contained 0.15 wt % HCHO and 0.2 M NaNO3 and was adjusted to pH 2.7 by the addition of sulfuric acid (H2SO4, Sigma-Aldrich, 98 % purity), as this was the E-AIM model's prediction of the average aerosol acidity during the entire campaign. We assumed that •OH produced by NO photolysis was the rate-limiting species due to its significantly lower abundance relative to organics, and HCHO was taken as a representative example of potential precursors of HCOOH. However, it is important to note that the production rate of HCOOH from the oxidation of organics may be overestimated in the solution experiment because •OH generated by nitrate photolysis can also react with other oxidisable species in the ambient atmosphere.
The average rate of production (ppb s−1) of HCOOH (PHCOOH) during the 1 h irradiation was calculated by the following equation (Eq. 2), derived from Peng et al. (2022):
where Q is the carrier gas flow rate (4 L min−1), V is the reactor chamber volume (1.875 L), and CHCOOH and CHCOOH−bkg (ppb) are the concentrations of HCOOH in the chamber after and before adding the sample, respectively. The photolytic loss of HCOOH was ignored, as the cross-section of HCOOH was beyond the spectral range of the Xe lamp (Burkholder et al., 2019).
We attempted to extrapolate the laboratory results to account for the field-observed concentrations of HCOOH. As photochemical ageing occurs on aerosol surfaces and a strong correlation between the surface area (Sa) and the concentration of HCOOH observed in the field, the extrapolation was conducted based on Sa. The Sa in the chamber was calculated as the Sa of the filter divided by the chamber's volume, assuming that only the first layer of the aerosols was illuminated. Although this might have resulted in an underestimation of the Sa density in the chamber, this assumption was reasonable because particles in the lower layers would receive less light than those in the uppermost layer due to the light-screening effect of the first layer (Ye et al., 2017). The ageing process was also influenced by light intensity. As we discovered that the major oxidant was generated by the photolysis of particulate NO (see Results, Sect. 2), the light intensity was normalised based on the photolytic frequency of aqueous NO () due to the absence of an absorption coefficient for particulate NO. Although there is a redshift of the particulate NO absorption wavelength compared with the aqueous-phase NO absorption wavelength, our results should be reliable because we used as a reference for normalisation rather than for calculating an accurate (Du and Zhu, 2011; Zhu et al., 2008). The under the Xe lamp was 8.85 × 10⁻⁶ s−1, and the daytime average in the ambient air at our site was 1.12 × 10⁻⁵ s−1 (Text S2). Both values were calculated assuming a quantum yield equal to 1. The normalised HCOOH production rate in the ambient air (PHCOOH-nml) was calculated using the following equation (Eq. 3):
where Saamb represents the field-measured Sa density, Sacha denotes the Sa density calculated for the chamber, and 1.266 is the ratio of the ambient to the chamber . For the ageing process involving O3, the photolytic rate constant of O3 generating O1D () in the chamber (1.31 × 10⁻⁵ s−1) was also normalised to the average daytime (1.84 × 10⁻⁵ s−1) under ambient conditions (Text S2). For the results of the aqueous solution, the concentrations of HCHO and NO were also normalised.
2.4 Chemical box model
The Framework for 0-D Atmospheric Modeling (F0AM version 4.2.1) (Wolfe et al., 2016) coupled with the Master Chemical Mechanism (MCM v3.3.1, http://mcm.york.ac.uk, last access: 30 September 2022) (Jenkin et al., 2015) was employed to evaluate the HCOOH production rate from photochemical ageing of aerosols compared with other sources at the field site. The physical loss due to dilution process was treated as a first-order loss with a rate coefficient of s−1, consistent with previous studies (Li et al., 2014; Yuan et al., 2015). The dry-deposition rate was determined based on the deposition velocity and the boundary layer height (BLH). For HCOOH, a deposition velocity of 1 cm s−1 was employed (Müller et al., 2018). A sensitivity analysis of the deposition velocity was also conducted. The diurnal profile of BLH was acquired from a previous study at another coastal site in Hong Kong SAR (Su et al., 2017). Wet deposition was not considered as there was no rainfall except on 3 and 7 October. We simulated the averaged diurnal cycle for the whole campaign, with field-observed relevant species constrained hourly in the model. Simulations were also performed daily for a 2-week period, from 24 September to 7 October. The details of input data are described in Text S3. The model was executed for three replicates to stabilise the intermediate species it generated, and the results from the final run were used for further analysis.
The local sources of HCOOH at this site mainly consist of ship and biogenic emissions. The box model used in this study did not account for the contribution of ship emissions since the modelling period was dominated by continental outflows, which is unfavourable for the transportation of HCOOH from ship emissions to our site as evidenced by the relatively low concentrations of NOx in the modelling period. To estimate the biogenic emissions, we used the algorithm of the Model of Emissions of Gases and Aerosols from Nature version 2.1 (MEGAN v2.1) (Guenther et al., 2012), assuming instantaneous dilution into the whole box. It is worth noting that this approach may introduce some uncertainties in estimating biogenic emission at a specific location. The specific parameters used can be found in Text S3. For secondary formation mechanisms, we followed Yuan et al. (2015) by enhancing the secondary production of HCOOH by modifying the HCOOH yields obtained by the ozonolysis of alkenes and other unsaturated species and by adding chemical processes (vinyl alcohol oxidation, photo-tautomerisation of vinyl alcohol, and the reactions of HCHO + HO2 and CH3O2•+ •OH) to the MCM. However, the model used in this study was unable to account for the downward transport of HCOOH produced in clouds through a newly proposed multiphase pathway (Franco et al., 2021) due to its inability to assess the contribution of vertical mixing and aqueous phase chemistry.
3.1 Field measurements of HCOOH concentrations
The field site was exposed to two distinct types of air masses; initially, it was largely exposed to marine air masses and later to coastal air masses. Marine air masses (T= 29.4 ± 2.0 ∘C, RH = 85.8 ± 7.0 %) were warmer and more humid than coastal air masses (T = 25.7 ± 2.3 ∘C, RH = 77.0 ± 6.0 %) and exhibited low concentrations of O3 (15.0 ± 8.9 ppb) and high concentrations of NOx(6.2 ± 4.5 ppb). Conversely, coastal air masses were characterised by high concentrations of O3 (53.6 ± 14.2 ppb) and low concentrations of NOx (1.9 ± 1.6 ppb). The high concentrations of NOx in the marine air masses are attributable to the emissions from ocean-going container ships that passed the site approximately 8 km to the south. A haze event occurred from 24 September to 2 October, due to a transition from marine to coastal air masses under stagnant conditions. O3 concentrations steadily increased during the first 5 d, peaked on 29 September, and remained high until the end of the haze period (Fig. 1). Therefore, the potential HCOOH formation mechanism was analysed separately for these three distinct periods.
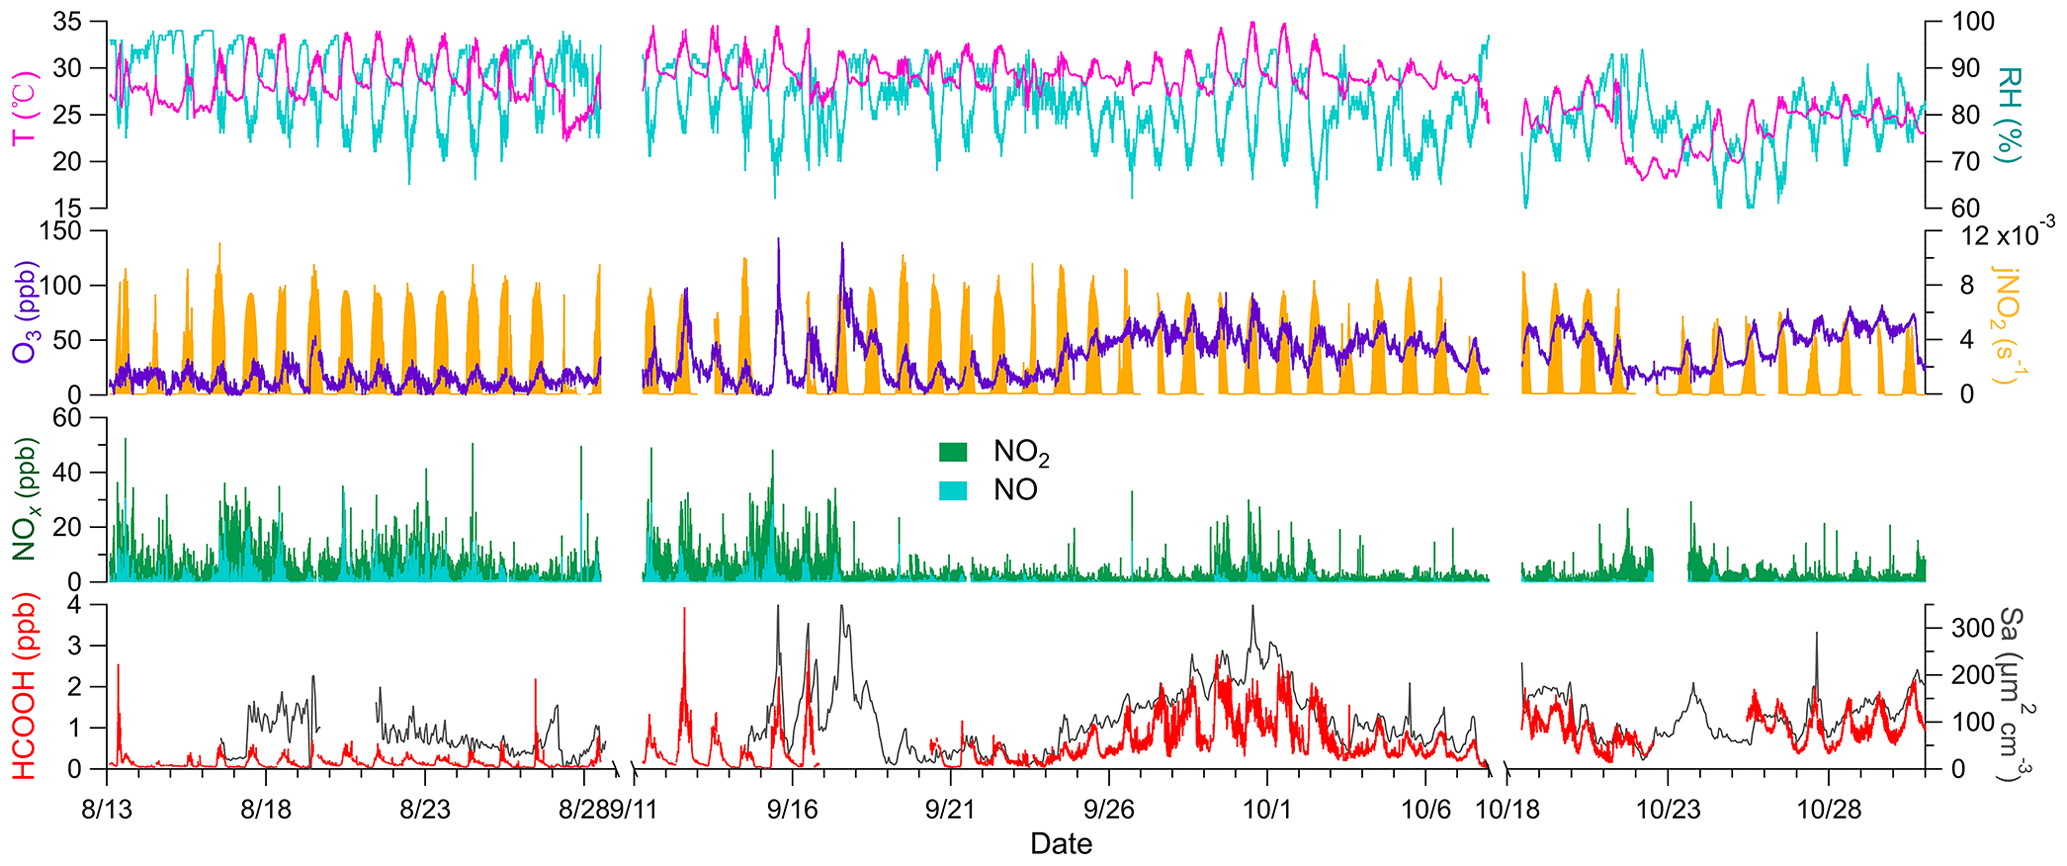
Figure 1Times series of temperature (T); relative humidity (RH); nitrogen dioxide photolysis frequency (jNO2); concentrations of ozone (O3), nitrogen oxides (NOx), and formic acid (HCOOH); and surface area density (Sa) during the field campaign. Data were not collected from 29 August to 10 September due to the persistently clean weather conditions, similar to those during the initial stage of the campaign. The gap in data collection from 8 to 17 October was due to a rainstorm. Any other short gaps were caused by instrument maintenance.
Ambient HCOOH concentrations significantly varied during the three periods. The average HCOOH concentration in marine air masses was 191 ± 167 ppt; this was higher than in those over the remote ocean, due to local emission sources, but significantly lower than those in urban environments (Table 1). In contrast, the ambient HCOOH concentrations in coastal air masses were substantially higher, averaging 996 ± 433 ppt, comparable with other measurements at rural or urban background sites. During the haze period, the concentrations of HCOOH displayed a pattern similar to the concentrations of O3, with the daytime peak concentration increasing from 674 to 2790 ppt. A pronounced diurnal variation in the concentration of HCOOH was observed throughout the entire campaign, as illustrated in Fig. 2, consistent with other studies (Millet et al., 2015; Yuan et al., 2015). HCOOH concentrations rapidly increased after sunrise, peaking at approximately 13:00 local time and then quickly decreasing in the late afternoon, due to the weaker sunlight and lower BLH than earlier in the day.
Table 1Summary of worldwide field-observed formic acid (HCOOH) concentrations.
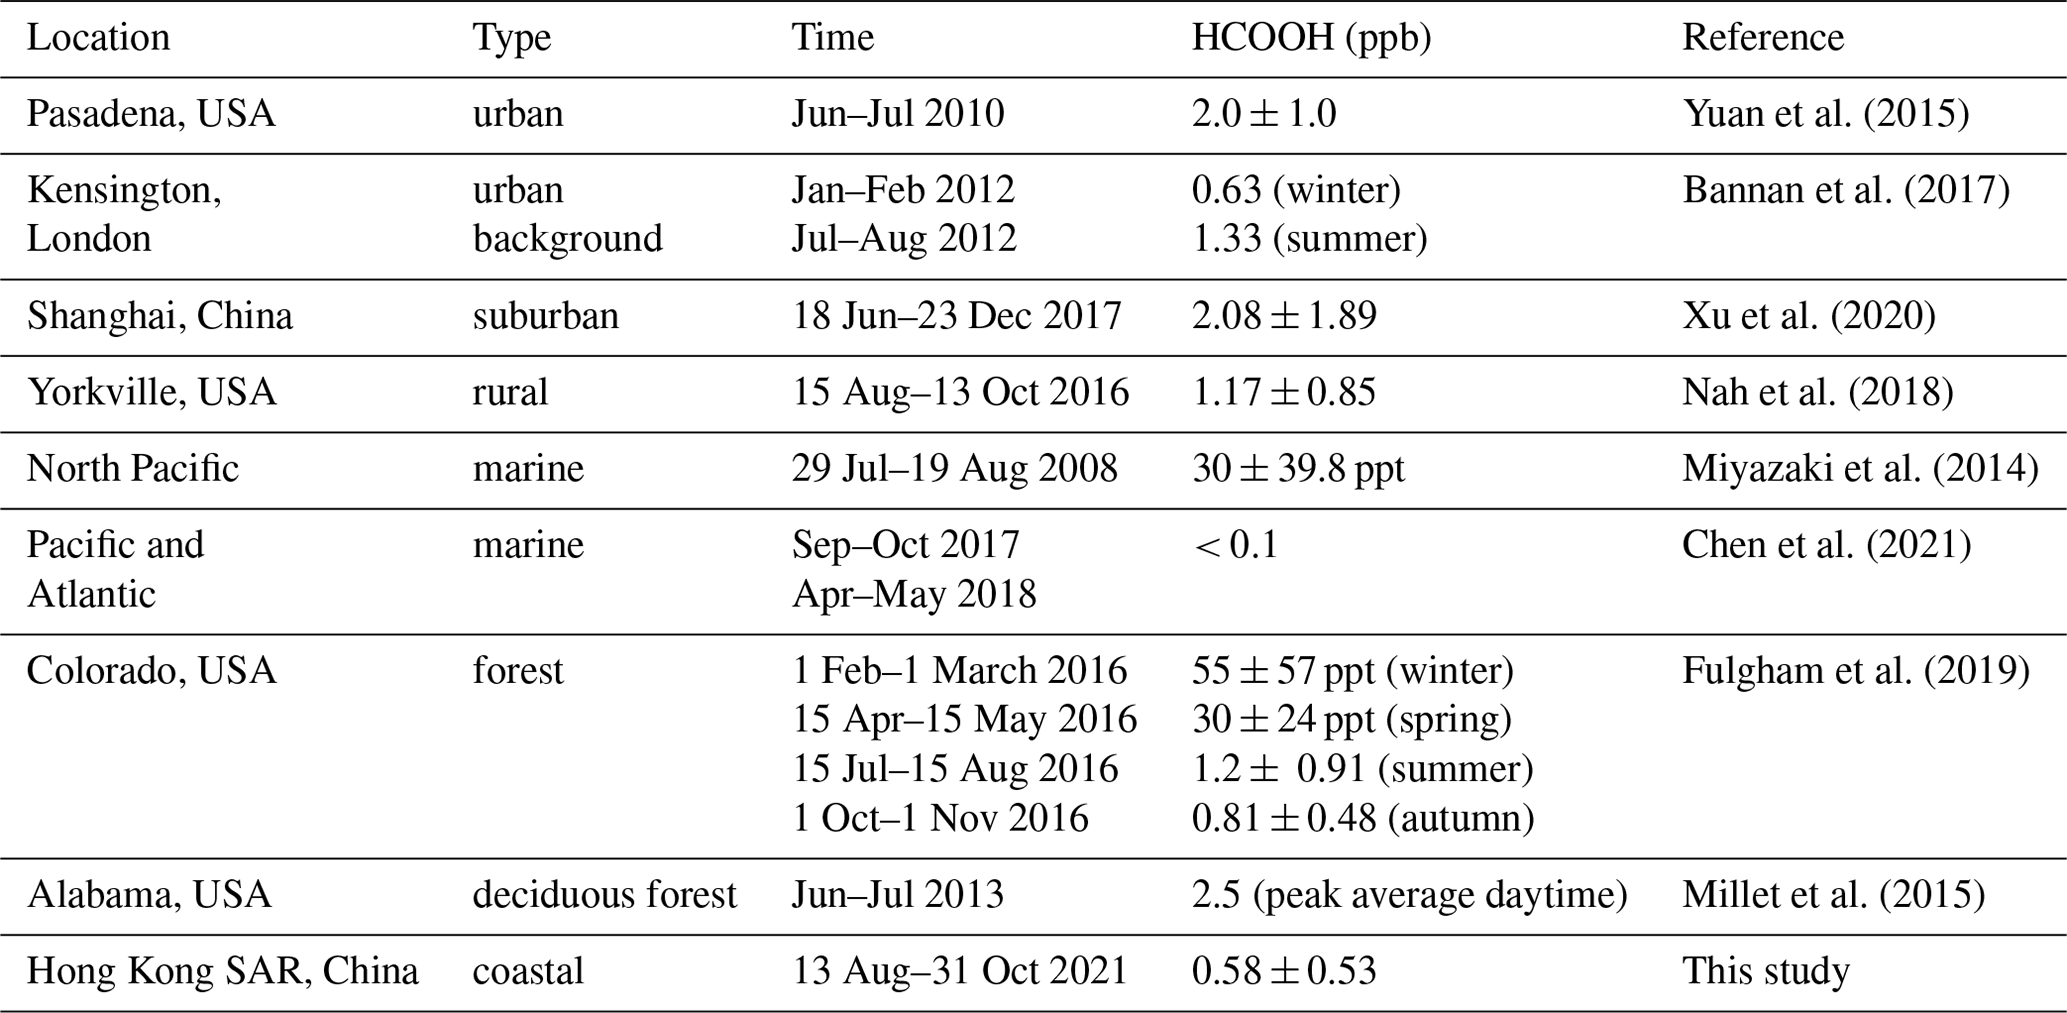
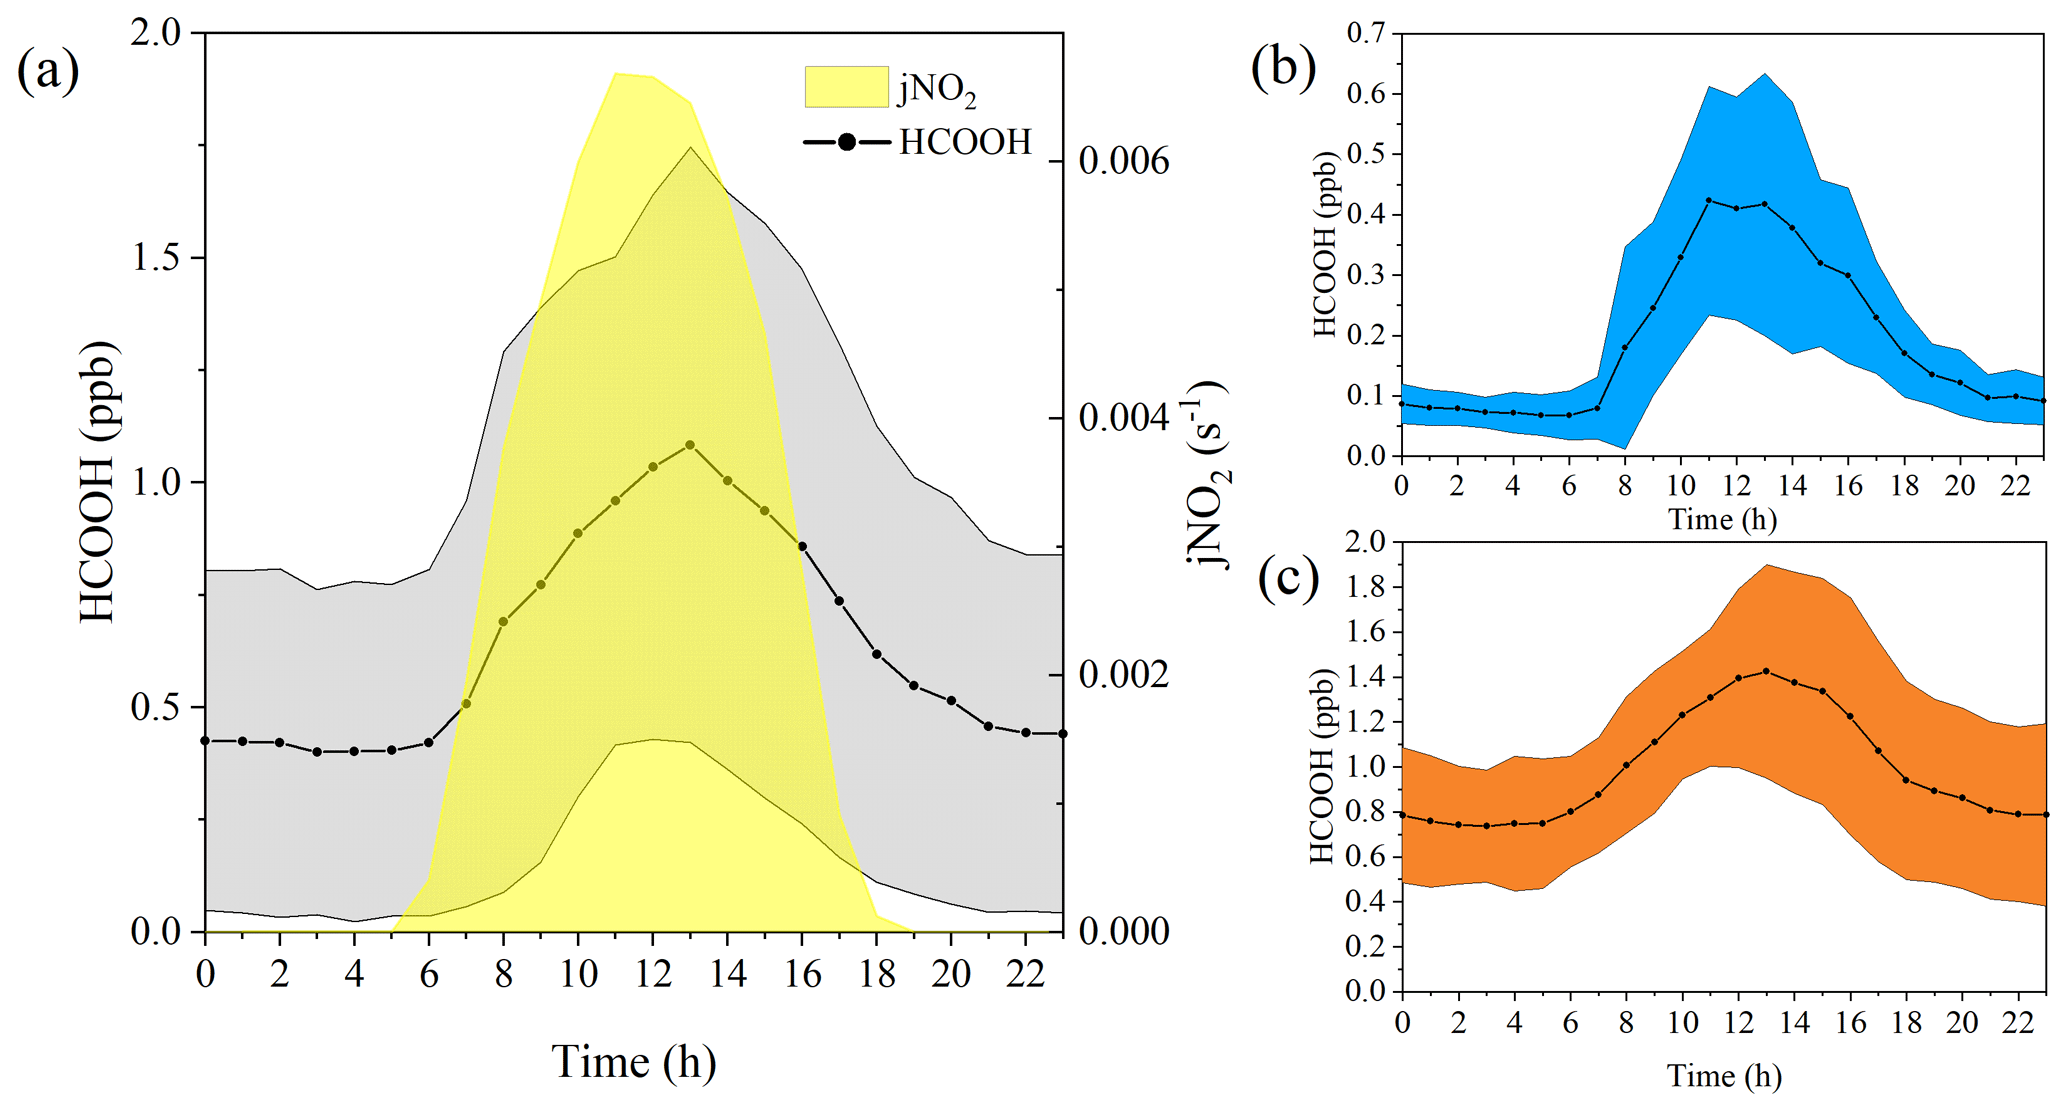
Figure 2Diurnal variation in the concentrations of formic acid (HCOOH) in different periods. (a) Diurnal cycle of HCOOH concentrations and frequency of nitrogen dioxide photolysis (jNO2) for the whole campaign. Panels (b) and (c) show the diurnal cycle of HCOOH concentrations in marine and coastal air masses, respectively. The shading represents the standard deviations of the measurements.
HCOOH is widely recognised as a secondary photochemical product. Table 2 presents the Pearson correlation coefficients (r) between the concentration of HCOOH and those of other air pollutants or other meteorological parameters during the three distinct periods. The concentration of HNO3 was strongly correlated with the concentration of HCOOH throughout the entire field campaign, consistent with other studies (Bannan et al., 2017; Millet et al., 2015). This finding suggests that HCOOH is predominantly generated through secondary photochemical mechanisms at this site, as HNO3 is a secondary photochemical product resulting from the reaction between •OH and NO2. The positive linear relationship between the concentrations of O3 and HCOOH also implies the secondary source of HCOOH.
Table 2Pearson correlation coefficient (r) matrix between the concentration of formic acid and other air pollutants, and related meteorological parameters, during three distinct periods.
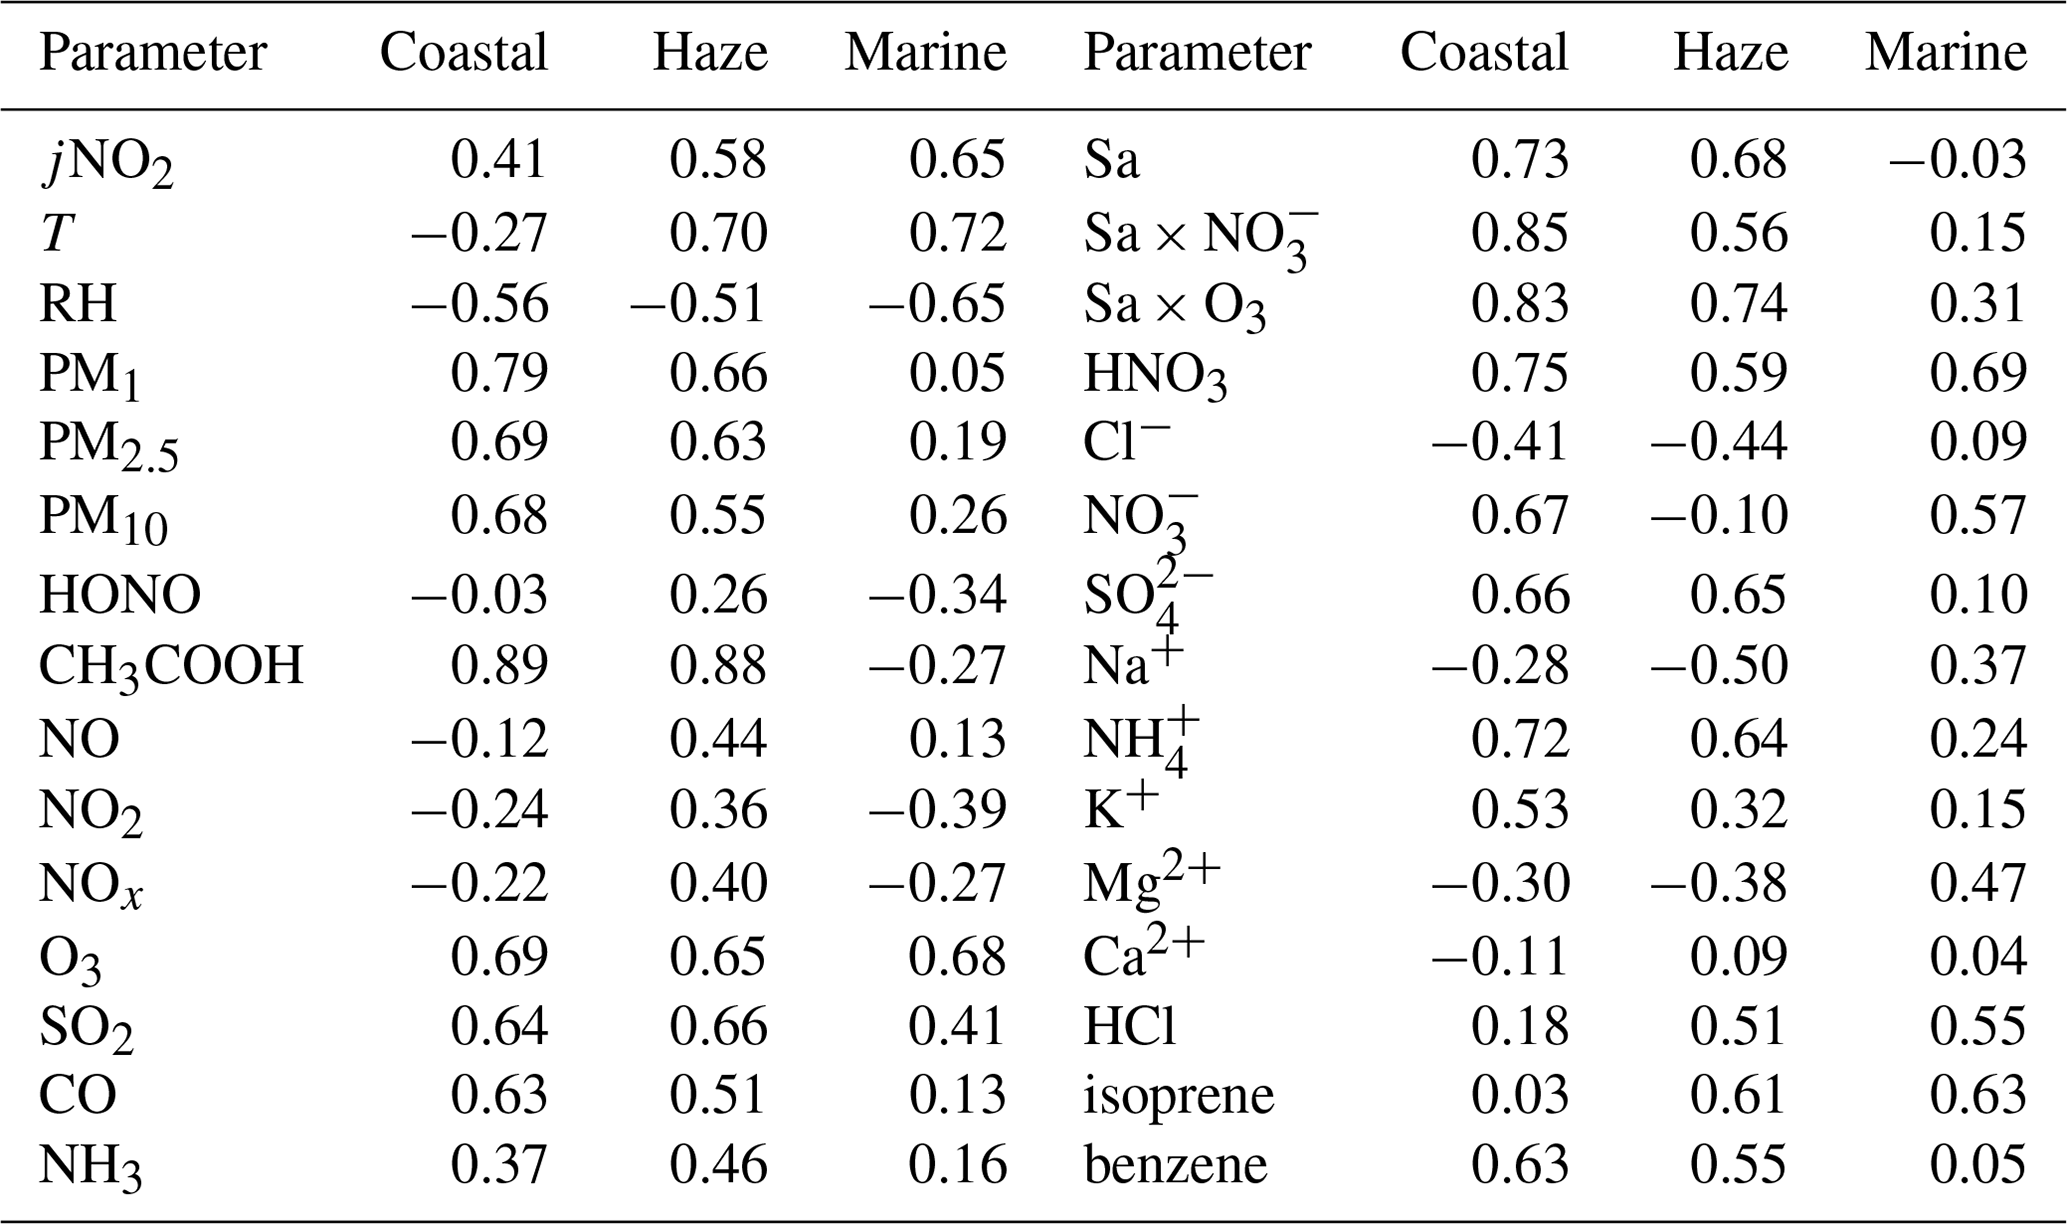
A previous laboratory study revealed that HCOOH can be produced by the photochemical ageing of aerosols (Malecha and Nizkorodov, 2016), which may be an important process in ambient air. In the coastal air masses and haze period, there was a strong correlation between the concentrations of HCOOH and PM, particularly between the concentrations of HCOOH and PM1. This was also observed by Paulot et al. (2011) and suggests that HCOOH may be produced from PM. The Sa of PM1 was also highly correlated with the concentration of HCOOH in both coastal air masses and haze periods, indicating that HCOOH is mainly produced from reactions on aerosol surfaces. However, in the marine air masses, the concentration of HCOOH was not related to aerosols due to the low particle concentrations in such masses. To further explore the potential role of aerosol ageing in HCOOH production, we plotted the correlation of HCOOH concentrations with Sa × O3, Sa × NO, and Sa × O3 × NO for the coastal air masses (Fig. 3). We found that the correlation coefficient significantly increased when Sa was combined with the concentration of O3 or NO or with the concentrations of both species, compared with these three factors being considered separately. This finding suggests that the HCOOH observed in the coastal air masses was not predominantly derived from gas-phase O3 oxidation of VOCs; rather, it was derived from heterogeneous or condensed-phase reactions on aerosol surfaces. The results during the haze period were similar. Therefore, photochemical aerosol ageing may play a key role in HCOOH production as the ageing process involves the reactive uptake of oxidants onto particle surfaces.
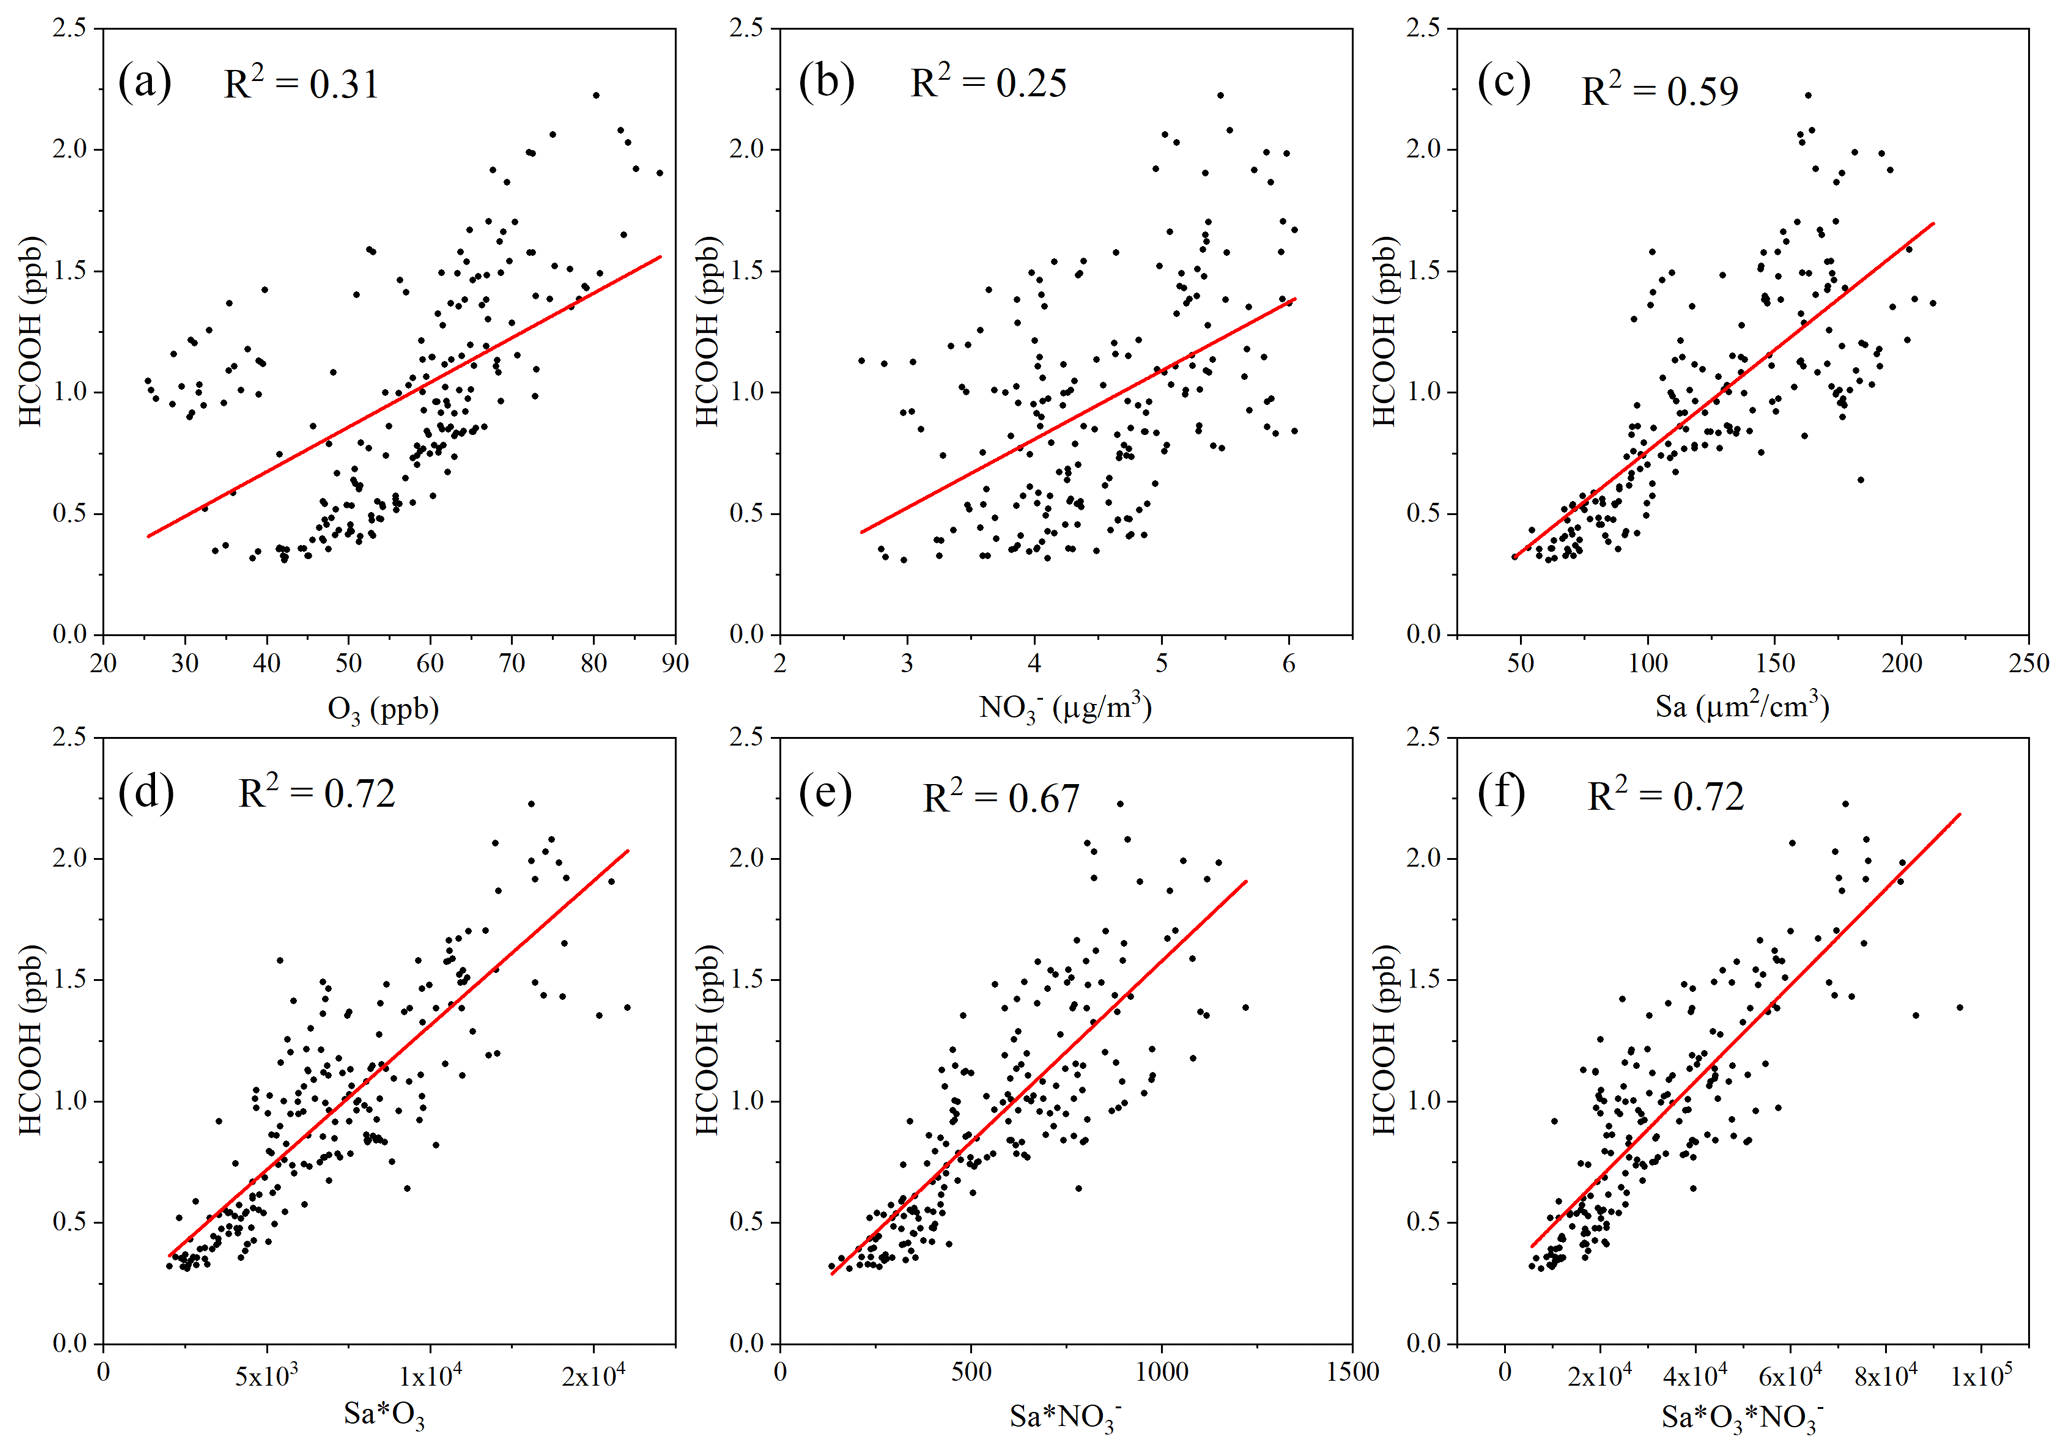
Figure 3Scatter plot of the concentration of formic acid (HCOOH) and (a) the concentration of ozone (O3); (b) the mass concentration of nitrate ions (NO) in PM2.5; (c) the surface area density (Sa) of PM1 (µm2 cm−3); (d) the product of Sa and the concentration of O3; (e) the product of Sa and the concentration of NO; and (f) the product of Sa, the concentration of O3, and the concentration of NO in coastal air masses.
3.2 Laboratory experiments
Figure 4a presents the results of a typical aerosol filter irradiation experiment. Upon turning on the light, HCOOH was instantaneously produced, indicating a rapid transfer from the condensed phase to the gas phase through photochemical reactions. Within 3 min, the HCOOH concentration reached 11.1 ppb, but when the light was turned off, the HCOOH concentration quickly returned to nearly background concentrations. This suggests that HCOOH was produced predominantly via photochemical reactions. The HCOOH concentration exhibited a logarithmic decay after its first peak concentration, and this decay also occurred after its second peak concentration, which may be attributable to either the evaporative loss of HCOOH or the photochemical loss of oxidants (Ye et al., 2017). When the AM 1.5 filter was added, the HCOOH concentration decreased by approximately 48.1 % within 5 min, and after the filter was removed, the HCOOH concentration returned to the logarithmic decay line. This suggests that there was only minor evaporation of HCOOH from the condensed phase due to the increased temperature of aerosol surfaces under light irradiation. However, the addition of the 300–800 nm filter reduced the HCOOH concentration by only 13.2 %, indicating that the photochemical production of HCOOH primarily occurs at wavelengths lower than 360 nm. Given the agreement between the wavelength at which NO absorbs light (290–350 nm) and the wavelength of HCOOH production (< 360 nm), and the high correlation between the ambient HCOOH concentration and the product of Sa density and NO concentration (as shown in Fig. 3), we infer that •OH radicals produced from NO photolysis were the major oxidants in the particle phase and thus drove HCOOH production. The production of HCOOH was also found to be dependent on O3, as the concentration of HCOOH increased by 64.7 % after the addition of 100 ppb of O3.
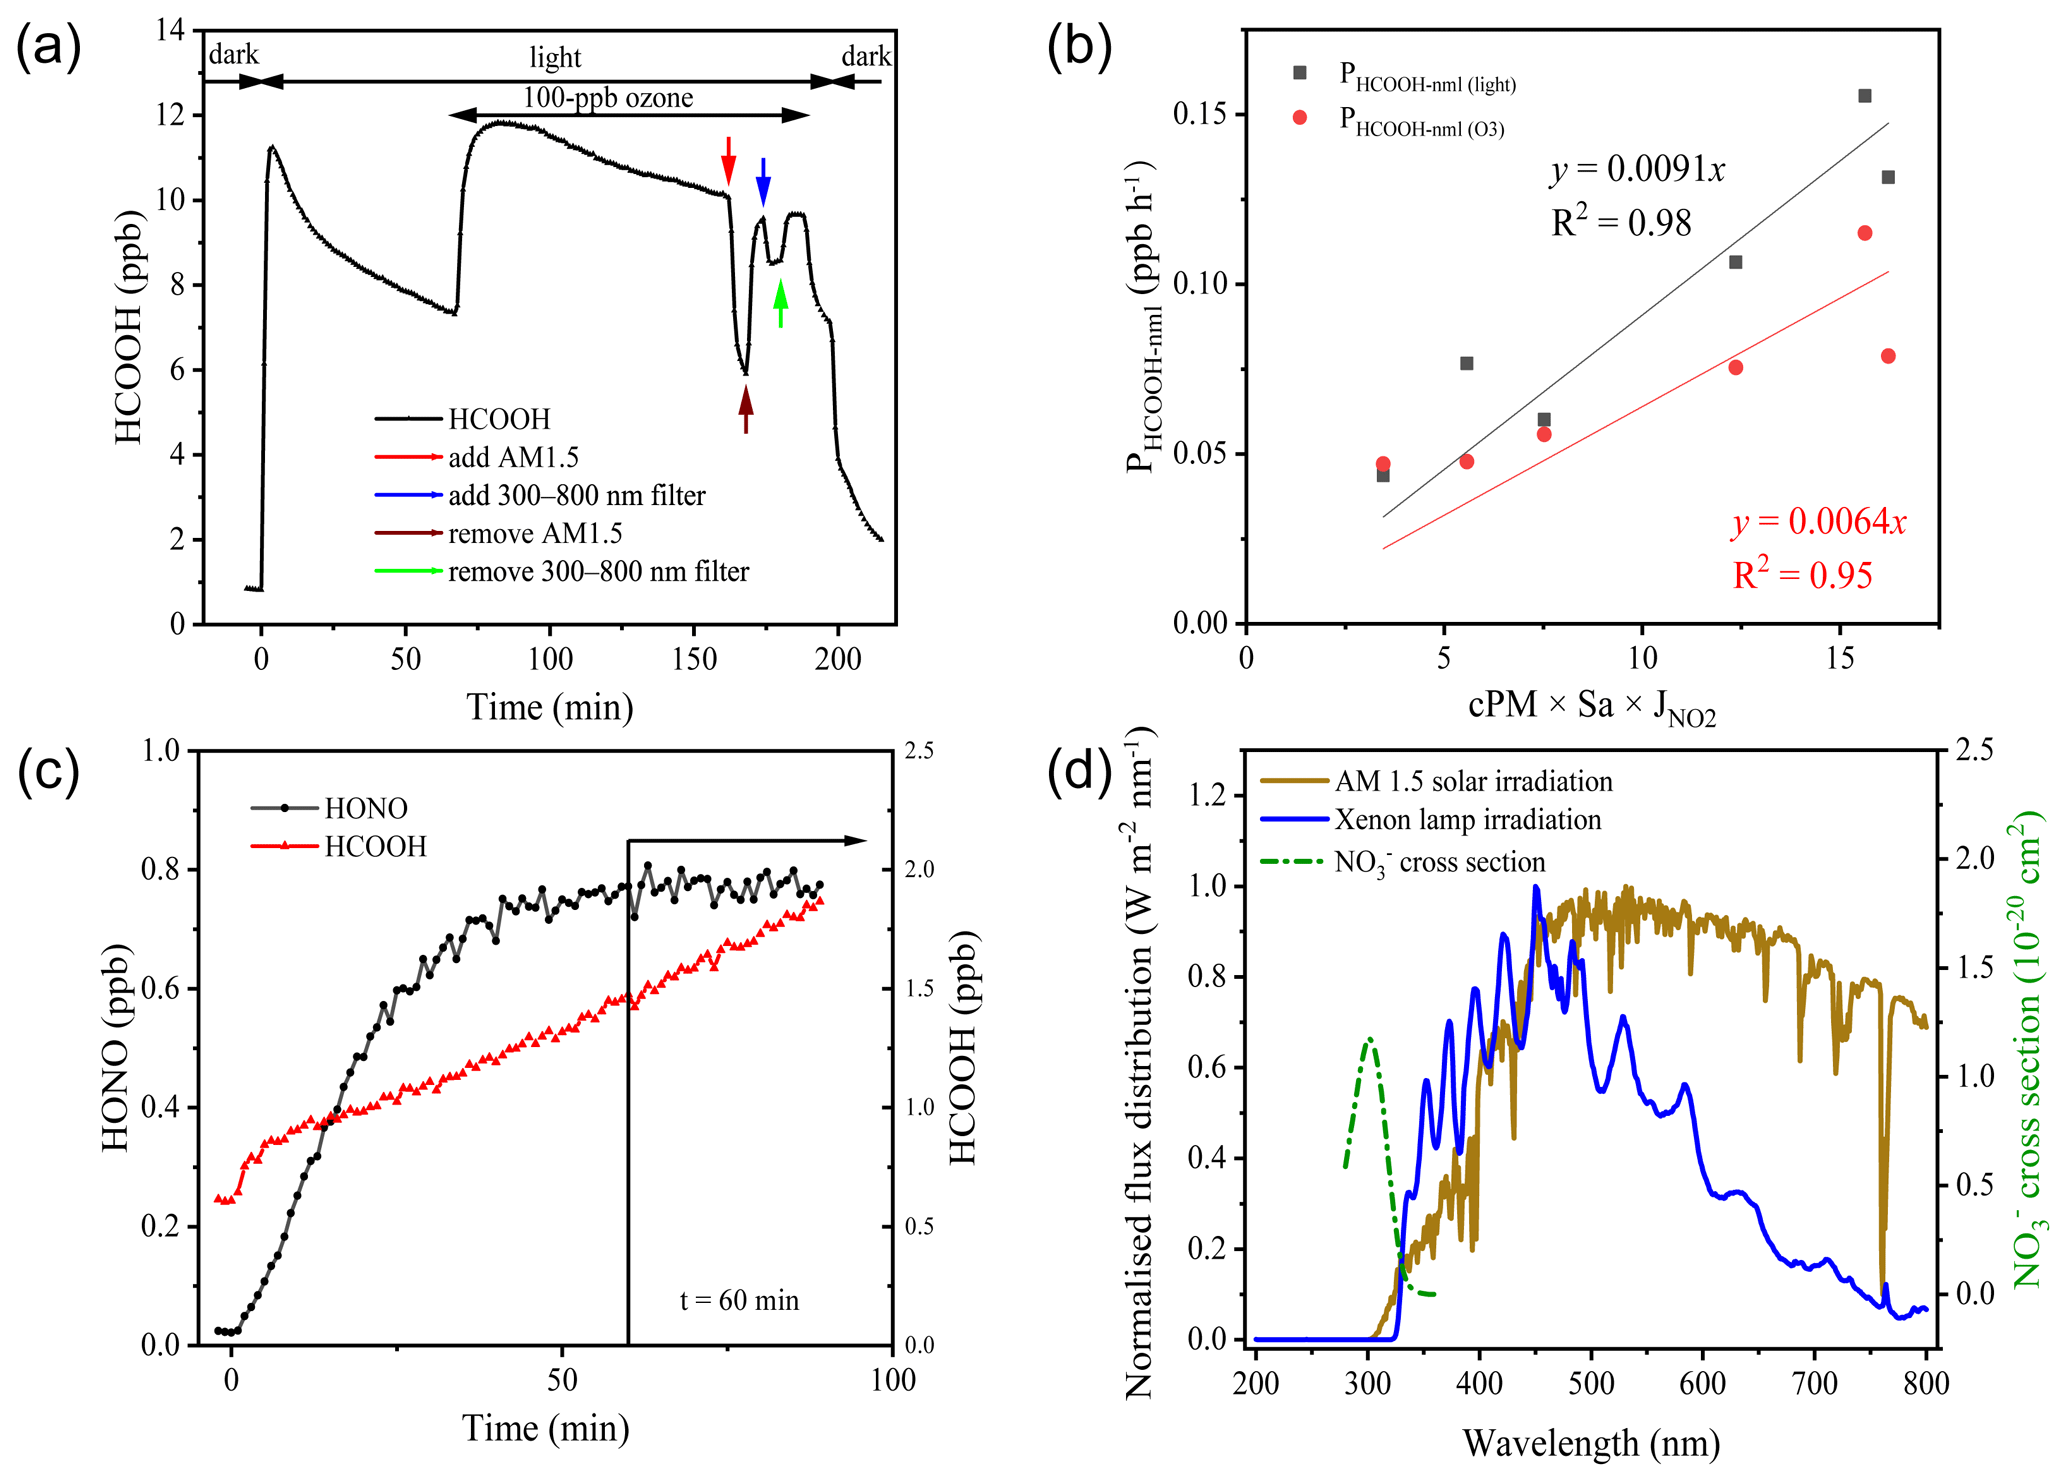
Figure 4Results of the irradiation experiments. (a) Typical variation in formic acid (HCOOH) concentrations during irradiation (in aerosols collected on 2 November 2020). AM 1.5 and 300–800 nm filters were added after the addition of 100 ppb ozone. (b) The correlation between PHCOOH-nml and 2.5 µm particulate matter (PM2.5) concentration (cPM) × surface area density (Sa) × nitrogen dioxide photolytic frequency (jNO2). (c) Variations in the concentrations of HCOOH and nitrous acid (HONO) as a function of time after illumination of an aqueous solution of formaldehyde and sodium nitrate at pH = 2.7. The vertical black line indicates the time at which HONO stabilised. (d) Comparison of the irradiation spectrum of the xenon lamp used in this study and standard air mass 1.5 solar irradiation (AM 1.5).
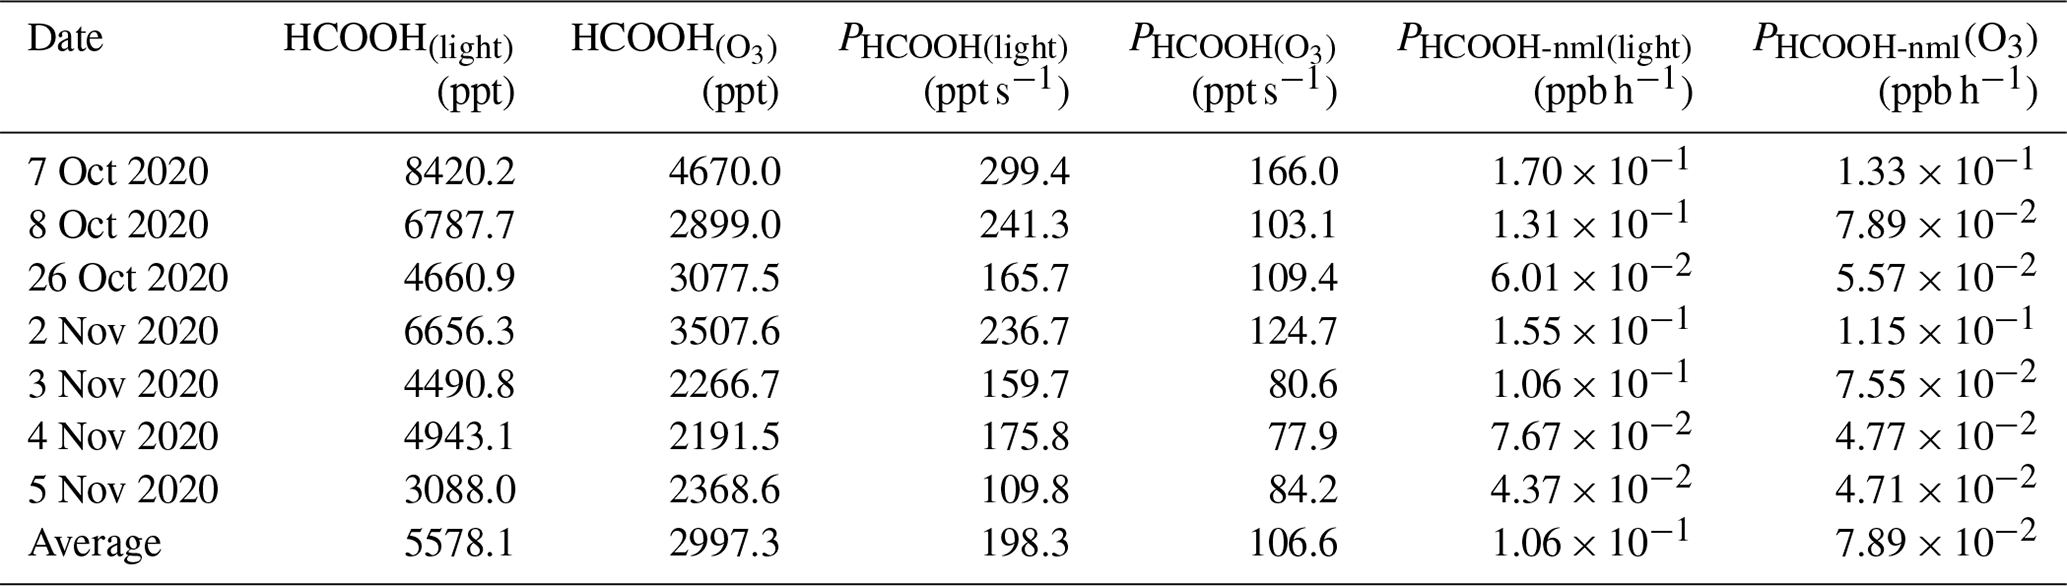
We next extrapolated the production rate of HCOOH observed in the chamber to ambient conditions, using the method described in Sect. 2.3, to assess the role played by the photochemical ageing of aerosols in HCOOH production. Table 3 summarises the HCOOH concentrations and production rates observed in the chamber experiments, along with the normalised HCOOH production rates in ambient air under light and light + O3 conditions, respectively. The average PHCOOH-nml without the addition of O3 was determined to be 0.106 ppb h−1. The addition of 100 ppb of O3 increased PHCOOH-nml by 0.079 ppb h−1, indicating that the heterogenous reaction between O3 and aerosols made a non-negligible contribution to HCOOH production. To quantify the contribution of this particle-phase pathway, we established a relationship between PHCOOH-nml and three parameters: PM2.5 concentration (cPM; µg m −3), which represents the reactant concentration; Sa, which represents the available reaction area; and jNO2, which represents the light intensity. After multiplying these three factors, we discovered a strong linear correlation between PHCOOH-nml and cPM × Sa × jNO2 (Fig. 4b). The intercept was set to zero, as there should be no HCOOH production when cPM × Sa × jNO2 is zero. Based on the correlation, we derived an equation (Eq. 4) for calculating PHCOOH-nml with the assumption that PHCOOH-nml(O3) increased linearly with O3 concentration. This equation was then incorporated into a box model to access the importance of this production pathway compared to other sources (see Sect. 3.3).
Photolysis of particulate NO is an important source of •OH (Zellner et al., 1990; Mack and Bolton, 1999). To investigate the potential production of HCOOH from this source, an irradiation experiment was conducted on a solution (Fig. 4c). The concentration of HCOOH increased linearly with time and did not reach a stable state after 90 min of illumination. This differs from the aerosol experiments and might have been due to the continuous evaporation of water from the solution caused by the heating effect of the light source, which would have concentrated the solution. To determine the appropriate time to calculate PHCOOH, we also plotted the time series of HONO concentrations. This showed that the HONO concentration stabilised after 1 h of irradiation, suggesting that NO photolysis also reached a steady state. As •OH radicals produced from NO photolysis were the only oxidants present in the system, the actual HCOOH production rate at the initial HCHO concentration should have followed the same trend as the HONO concentration. Therefore, we chose 1 h after turning on the light as the appropriate time to quantify PHCOOH, and at this time, PHCOOH in the chamber was 21.9 ppt s−1.
Table 3Summary of formic acid (HCOOH) concentrations and production rates observed in chamber experiments and normalised HCOOH production rates in ambient air under light and light + ozone (O3) conditions, respectively. HCOOH denotes the increased concentration of HCOOH after the addition of 100 ppb O3.
We also attempted to extrapolate the results to ambient air, similar to the aerosol filter experiments. To do so, in addition to normalising Sa and light intensity, we needed to normalise the HCHO and NO concentrations. The average concentration of gas-phase HCHO (HCHO(g)) measured on 28 September was 2.35 µg cm−3. By using a ratio of 0.03 between the concentration of HCHO in the particle phase (HCHO(p)) and the concentration of HCHO in the gas phase (Toda et al., 2014), the concentration of HCHO(p) was calculated to be 0.07 µg cm−3, which is comparable to the concentrations that have been reported in previous studies (Klippel and Warneck, 1980; Toda et al., 2014). Based on the aqueous volume of aerosol calculated by the E-AIM model (0.02 µL m−3), the HCHO mass concentration in the aqueous phase was found to be 3.5 g L−1. The NO concentration on the aerosol surface was determined to be 0.98 mol L−1. Therefore, the PHCOOH in ambient air attributable to the aqueous oxidation of HCHO was estimated to be 0.41 ppb h−1, which is 285 % higher than the PHCOOH attributable to the photochemical ageing of ambient particles. This greater-than-100 % contribution could be attributable to the simplicity of the solution system. In ambient air, other oxidisable species, such as halides (Peng et al., 2022; Xia et al., 2022), could also react with the •OH produced from NO photolysis, which competes with HCHO. In summary, NO photolysis appears to be a critical source of oxidants during the photochemical ageing process of aerosols.
3.3 Box model simulation
We next use a box model (see Sect. 2.4) to evaluate the production and loss of HCOOH in four scenarios (Table 4) which include the default MCM mechanism (S1), modified with gas-phase reactions following Yuan et al. (2015) (S2), further addition of the photochemical ageing source (S3), and further addition of a biogenic source (S4). Figure 5 presents a comprehensive analysis of HCOOH budget of campaign-averaged diurnal profile. In the base case (default MCM), the highest net production rate of HCOOH (PHCOOH-net) is 0.018 ppb h−1, significantly lower than the observed average rate of increase in HCOOH concentrations of 0.095 ppb h−1 from 06:00 to 13:00. Despite an increase of PHCOOH-net to 0.031 ppb h−1 in the modified case, the modelled value is still lower than the observed rate of change. In both cases, the reaction of CH2OO Criegee intermediate biradicals with H2O was identified as the major source of HCOOH, accounting for about 68 % of the currently known sources. CH2OO is formed from seven excited biradicals that originate from the O3 oxidation of various alkenes and unsaturated compounds (Saunders et al., 2003). Among these, CH2OOE is the largest contributor to the production of CH2OO (Fig. S5) and is generated by the ozonolysis of isoprene.
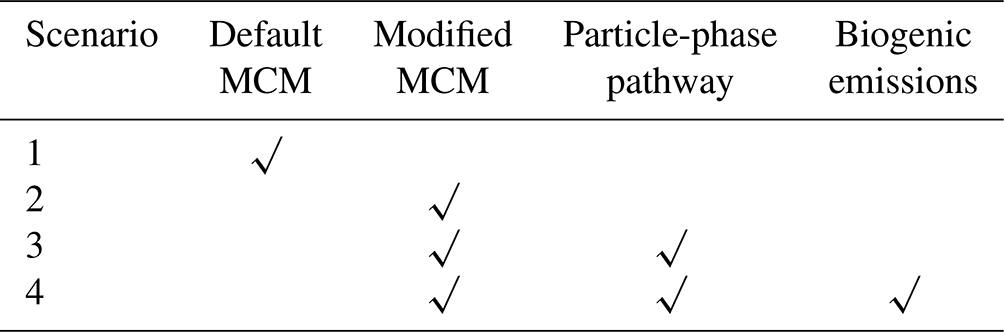
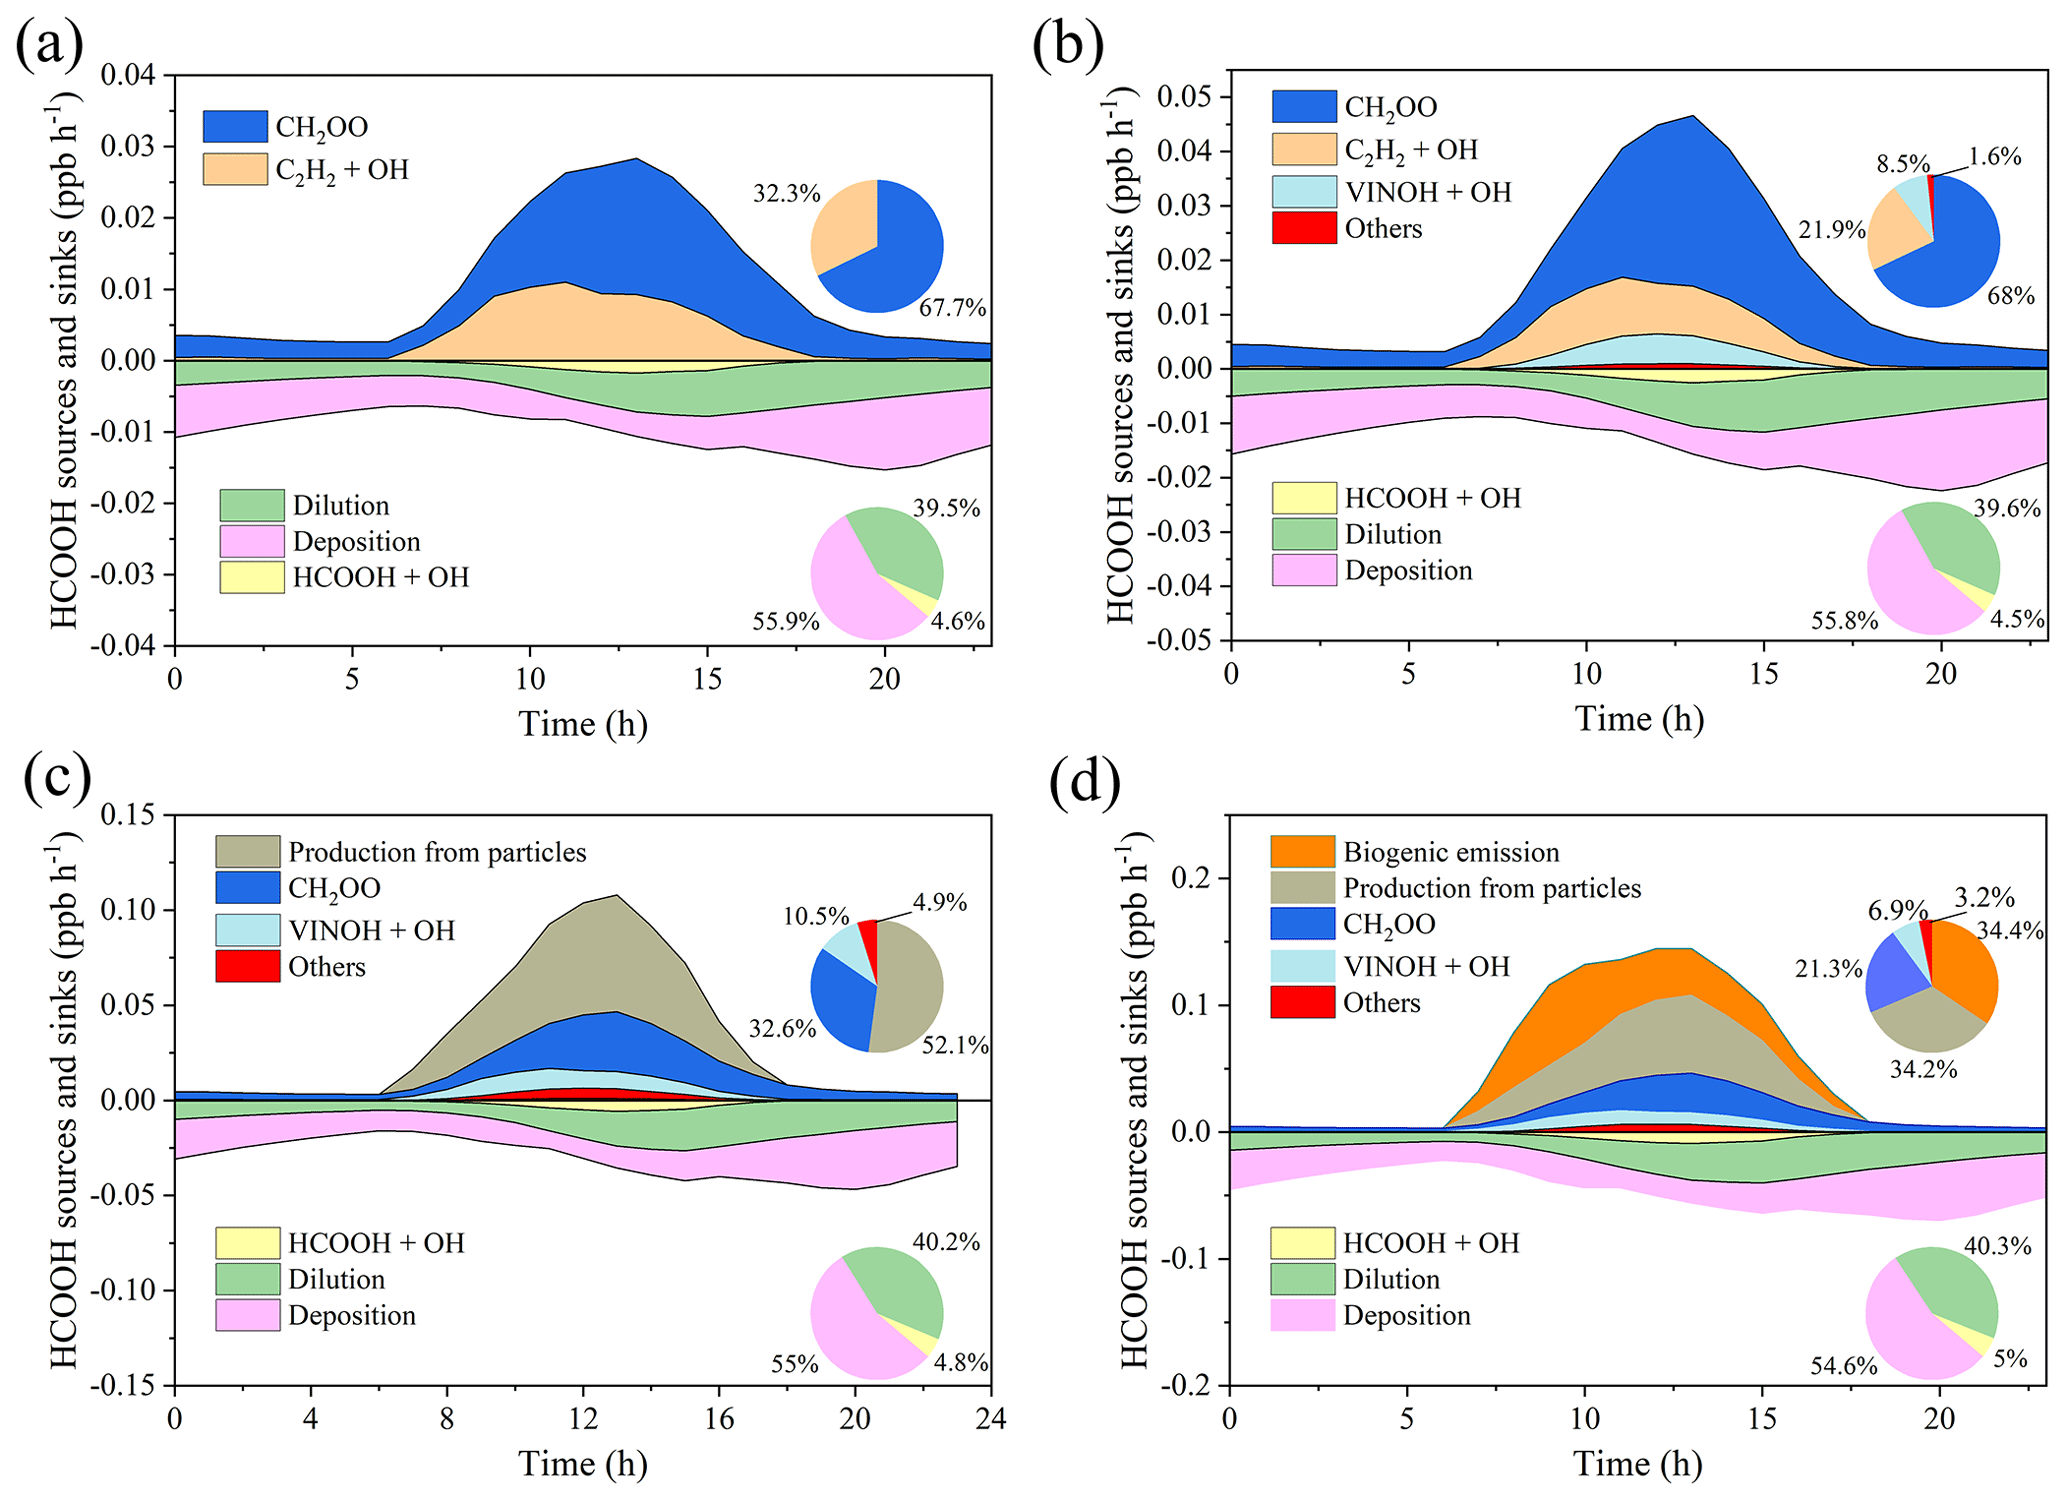
Figure 5Model-calculated profiles of sources and sinks of formic acid (HCOOH) on averaged diurnal profile during the whole campaign in four scenarios described in Table 4. Upper-right inset: the contribution from various sources to HCOOH concentrations. Bottom-right inset: the contribution from different sinks to HCOOH concentrations. CH2OO is formaldehyde oxide, a Criegee intermediate (biradical), and VINOH is vinyl alcohol.
Incorporating the photochemical production of HCOOH from particles into the F0AM model (S3) resulted in substantial improvements in predictions. The peak PHCOOH-net increased to 0.073 ppb h−1, which is more than double that of the modified case. Among the secondary production mechanisms considered, the production of HCOOH from particles was found to be the largest source, accounting for 52.1 % of the secondary production (Fig. 5c). The biogenic emissions (S4) also played an important role, contributing to 34.4 % of the total production (Fig. 5d). After considering all sources, including primary emissions and secondary productions, the modelled PHCOOH-net (0.094 ppb h−1) was much closer to the observed increase rate of HCOOH (0.095 ppb h−1).
Figure 6 presents the observed and modelled concentrations of HCOOH using different mechanisms for the averaged diurnal profile throughout the whole campaign. It is evident that the predicted HCOOH concentration increased substantially after incorporating the productions from the photochemical ageing of aerosols. However, the modelled HCOOH concentration is still lower than the observed value in Scenario 4, where all sources are included. The discrepancy may be explained by the inadequate treatment of physical processes in the box model, such as deposition, convection, and advection. The primary loss of HCOOH is via deposition, owing to its high solubility in water. To account for uncertainty in the deposition velocity (Vd) of HCOOH, we conducted a sensitivity test of HCOOH production to various Vd values in Scenario 4 (Fig. S6). The results revealed that a smaller deposition velocity results in higher modelled HCOOH concentrations. The daytime peak concentration increased by about 20 % when Vd decreased from 1.00 to 0.50 cm s−1. The field-observed Vd of HCOOH ranges from 0.43 to 1.10 cm s−1 (Müller et al., 2018), and thus given the high humidity at the study site, the observed Vd of HCOOH of 0.5 cm s−1 should have been close to the lower limit. Although the modelled concentration with Vd= 0.50 cm s−1 was similar to observed values, the model failed to accurately predict the timing of the initial increase, peak, and sharp decrease in HCOOH concentrations, indicating that other physical process, such as vertical mixing, also influence the HCOOH concentration. Therefore, to account for the complex physical processes, we employed a bimodal physical loss rate due to vertical dilution that varied with time of day ( s−1 in daytime and a much smaller value of s−1 at night), as suggested by Yuan et al. (2015). It is clear that the model performed better in predicting the diurnal pattern using the bimodal physical loss rate compared to a constant value (Fig. 6).
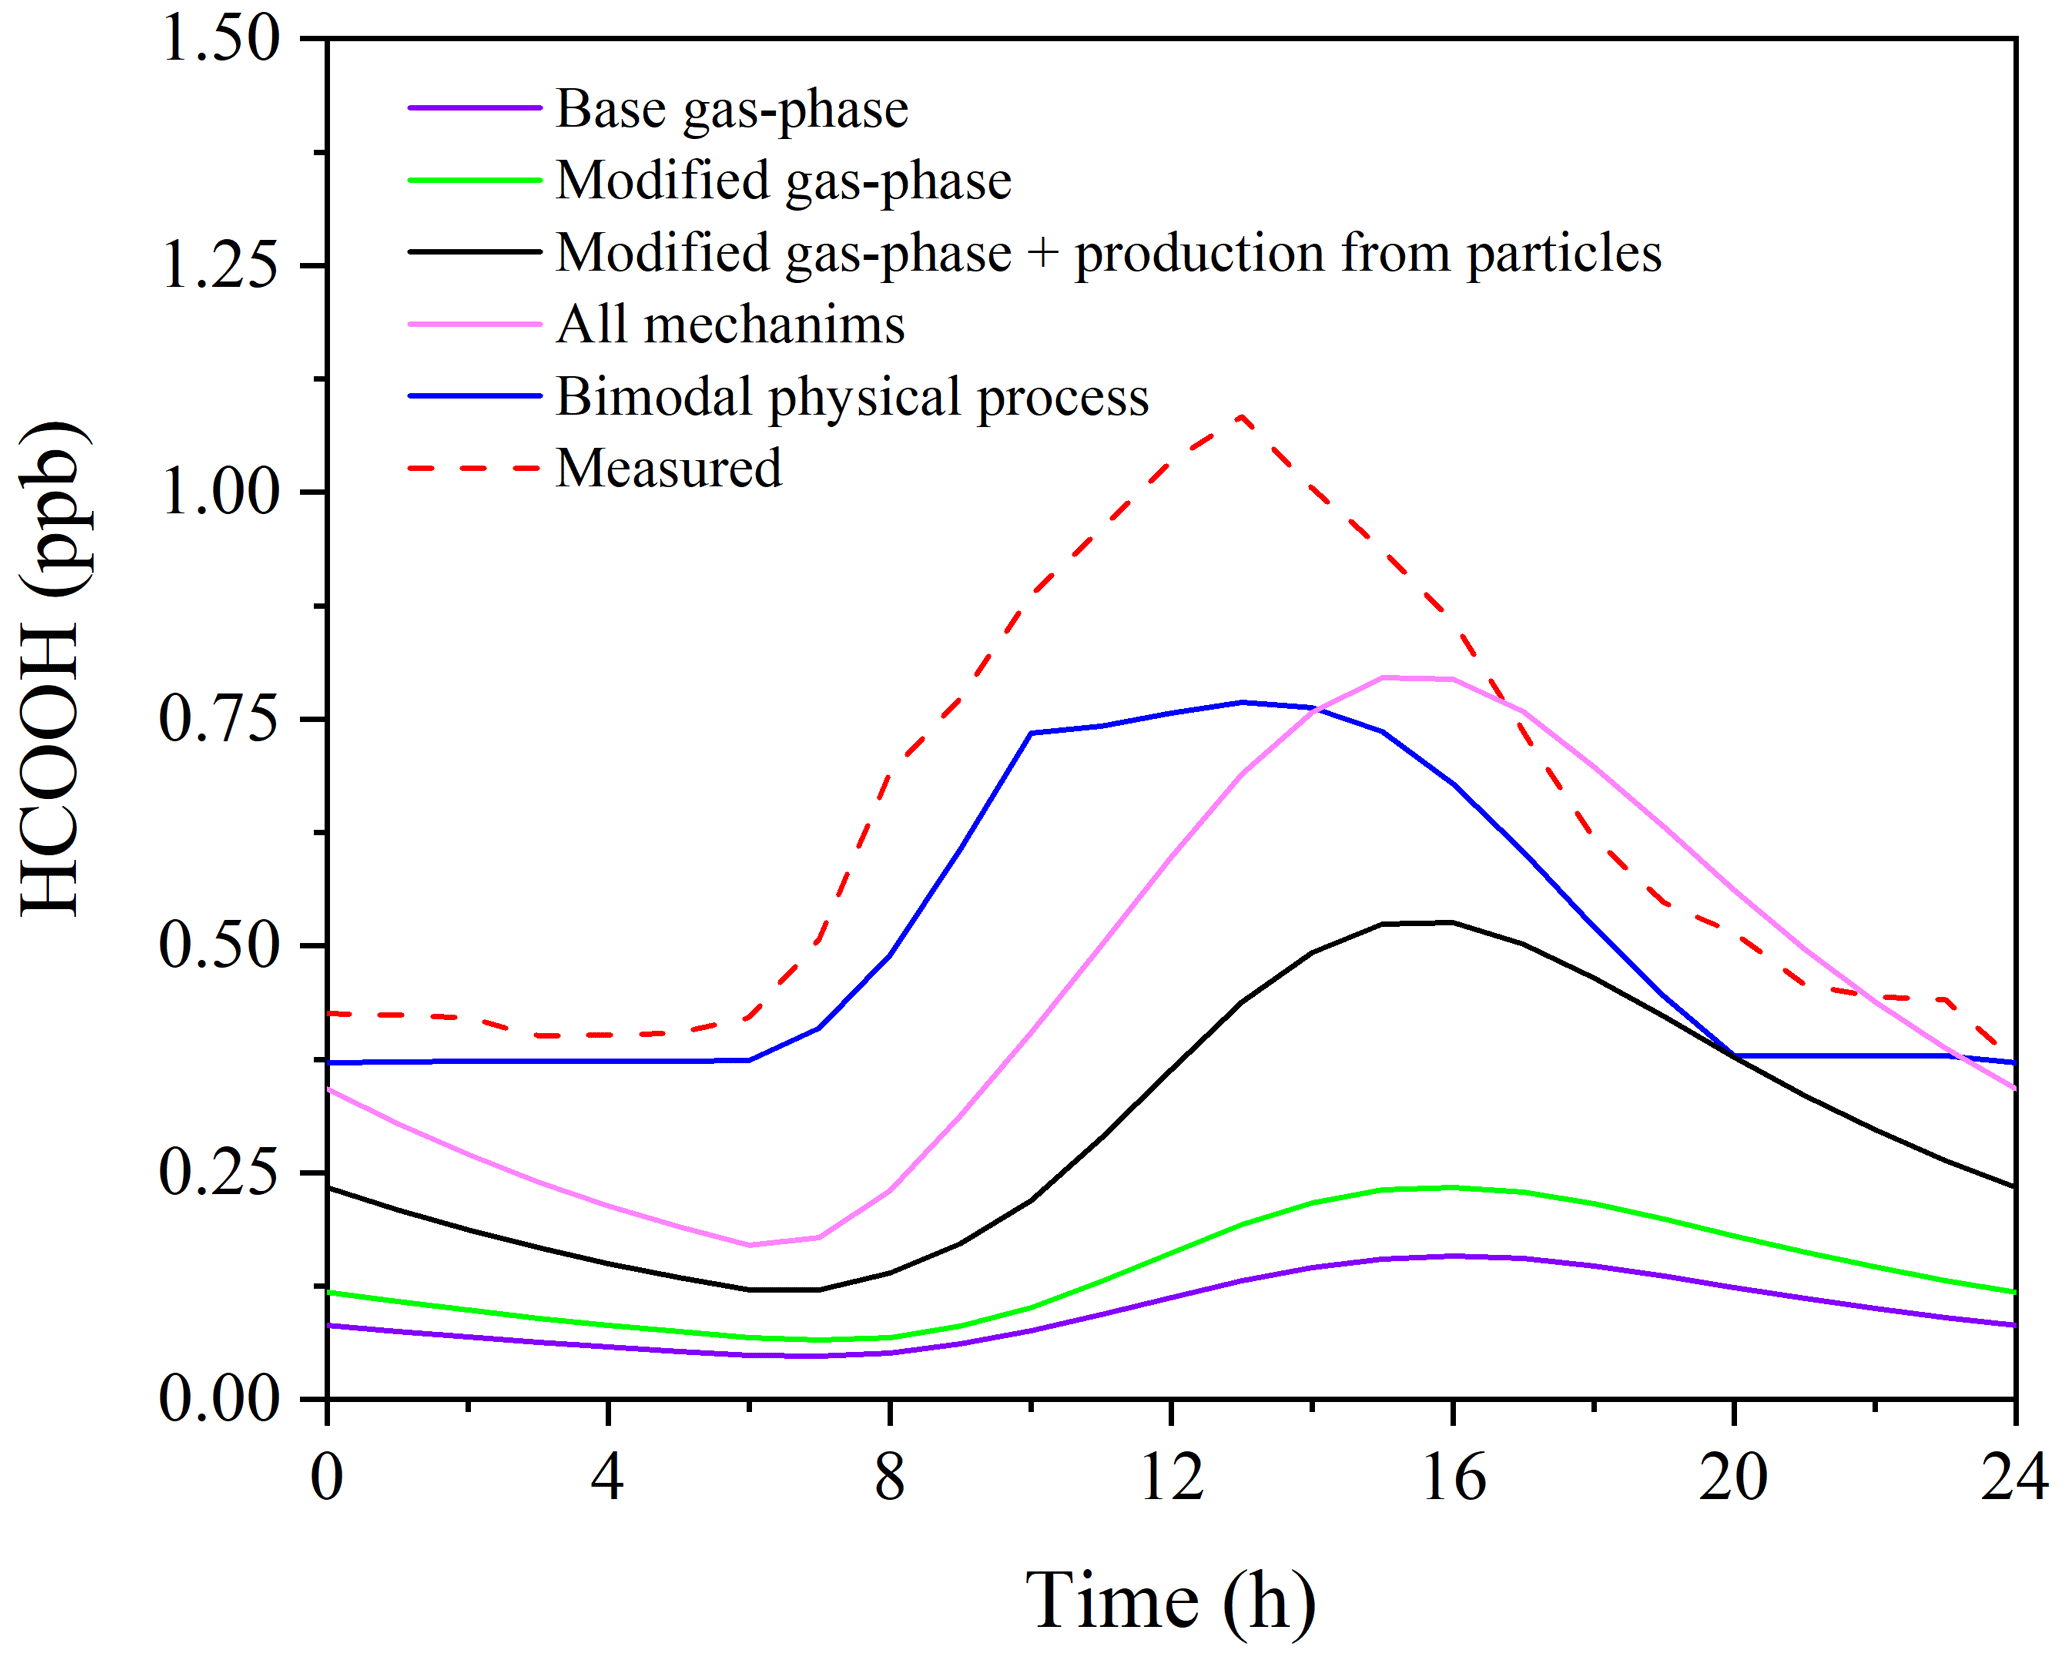
Figure 6Comparison of measured and modelled diurnal profiles of HCOOH during the whole campaign.
After applying a bimodal physical loss rate, the model also predicts better in the continuous simulation of 2 weeks (Fig. S7), except for 30 September and 1 October. The observed HCOOH concentrations on these 2 d were significantly lower than the modelled values due to a lower nitrate proportion (13.5 %) on 30 September compared to other days during the model period (22.2 %). Therefore, the simplified parameterisation using PM2.5 may overestimate the production of HCOOH from photochemical ageing of aerosols in areas with high PM concentrations but a low nitrate proportion. An improved parameterisation using the concentrations of nitrate and organics should be developed in future studies.
To evaluate the role of aerosol photochemical ageing in HCOOH production in a broader context, we also examined the HCOOH data over the remote marine boundary layer obtained from the Atmospheric Tomography Mission (ATom) aircraft campaign, which was conducted around the globe during April–May 2018 (Wofsy et al., 2021) (Text S5). Our results show that the photochemical ageing of aerosols was insignificant in remote ocean areas due to the low PM and nitrate concentrations found there. However, when these regions are affected by aged fire plumes containing higher levels of organics and nitrate, photochemical ageing of aerosols accounts for the substantial sources of HCOOH. These results suggest the photochemical ageing appears to be important in relatively polluted atmospheres.
This study demonstrates high rates of HCOOH production from the photochemical ageing of real ambient particles and the potential importance of this pathway in the formation of HCOOH under ambient conditions at a coastal site in Hong Kong SAR. Incorporating aerosol photochemical ageing significantly improved the performance of a widely used chemical box model, increasing the net HCOOH production rate by approximately 3 times compared to the default MCM. This underscores the significance of condensed-phase photochemistry and the necessity of incorporating its mechanisms into atmospheric models. However, the box model primarily accounts for local chemistry and does not fully capture the complex physical processes, primary emissions, and regional transport. Therefore, future research utilising a chemical transport model that incorporates these factors is required to quantify the contribution of this ageing pathway to the ambient HCOOH over a larger spatial scale.
Our solution irradiation experiments demonstrated the crucial role of NO photolysis in HCOOH production via the production of •OH. This suggests that NO photolysis not only influences the aerosol-based production of inorganic species (such as HONO, Ye et al., 2017, and halogens, Peng et al., 2022; Xia et al., 2022) but also the aerosol-based production of water-soluble organics. Our proposed parameterisation was based on the mass concentration of PM2.5 as one contributing factor, which may lead to bias in the prediction of HCOOH production in other environments with different nitrate proportions. Future investigations are necessary to enhance our understanding of the underlying mechanisms in the photochemical ageing of aerosols and develop an improved parametrisation that considers the proportion of nitrate and organics in PM2.5.
The substantial production of HCOOH from condensed-phase photochemical reactions implies that this pathway may affect the composition and the volatility of SOA. In addition to HCOOH, other low-molecular-weight organic acids, such as acetic acid, may be produced via this mechanism, as observed in our irradiation experiments. Improving the constraints on the photochemical ageing of aerosols will not only aid the understanding of the budget of these organic acids but also affect their SOA chemistry.
The data that support the findings of this study are openly available on Zenodo at https://doi.org/10.5281/zenodo.8415792 (Yifan et al., 2023). Other raw data are also available from the corresponding author upon reasonable request.
The supplement related to this article is available online at: https://doi.org/10.5194/acp-23-14813-2023-supplement.
TW arranged the field campaign and designed the laboratory irradiation experiment. YJ and MX conducted the field campaign and photochemical filter experiments. MX revised the model code. YJ conducted the photochemical solution experiments, analysed the data, ran the model, and wrote the draft manuscript. TW and MX revised the manuscript.
At least one of the (co-)authors is a member of the editorial board of Atmospheric Chemistry and Physics. The peer review process was guided by an independent editor, and the authors also have no other competing interests to declare.
Publisher’s note: Copernicus Publications remains neutral with regard to jurisdictional claims made in the text, published maps, institutional affiliations, or any other geographical representation in this paper. While Copernicus Publications makes every effort to include appropriate place names, the final responsibility lies with the authors.
We thank the Hong Kong Environmental Protection Department for allowing us to use the field study site and for providing data on VOCs, OVOCs, trace gases, PM mass concentrations, and ion compositions; the Hong Kong Observatory for providing the meteorological data; the Hong Kong Polytechnic University Research Facility in Chemical and Environmental Analysis for providing the ToF-CIMS; and Zhao Jue for providing PM2.5 filters, whose work is supported by the PolyU Project of Strategic Importance (no. ZE2K) and RGC-GRF (no. 15203920). We are grateful to Steven Poon for his help with logistics.
This work was supported by the Hong Kong Research Grants Council (grant no. T24-504/17-N).
This paper was edited by Thorsten Bartels-Rausch and reviewed by two anonymous referees.
Akagi, S. K., Yokelson, R. J., Wiedinmyer, C., Alvarado, M. J., Reid, J. S., Karl, T., Crounse, J. D., and Wennberg, P. O.: Emission factors for open and domestic biomass burning for use in atmospheric models, Atmos. Chem. Phys., 11, 4039–4072, https://doi.org/10.5194/acp-11-4039-2011, 2011.
Aljawhary, D., Lee, A. K. Y., and Abbatt, J. P. D.: High-resolution chemical ionization mass spectrometry (ToF-CIMS): application to study SOA composition and processing, Atmos. Meas. Tech., 6, 3211–3224, https://doi.org/10.5194/amt-6-3211-2013, 2013.
Andreae, M. O., Talbot, R. W., Andreae, T. W., and Harriss, R. C.: Formic and acetic acid over the central Amazon region, Brazil: 1. Dry season, J. Geophys. Res.-Atmos., 93, 1616–1624, https://doi.org/10.1029/JD093ID02P01616, 1988.
Andrews, D. U., Heazlewood, B. R., Maccarone, A. T., Conroy, T., Payne, R. J., Jordan, M. J. T., and Kable, S. H.: Photo-tautomerization of acetaldehyde to vinyl alcohol: A potential route to tropospheric acids, Science, 337, 1203–1206, https://doi.org/10.1126/SCIENCE.1220712, 2012.
Atkinson, R., Baulch, D. L., Cox, R. A., Crowley, J. N., Hampson, R. F., Hynes, R. G., Jenkin, M. E., Rossi, M. J., Troe, J., and IUPAC Subcommittee: Evaluated kinetic and photochemical data for atmospheric chemistry: Volume II – gas phase reactions of organic species, Atmos. Chem. Phys., 6, 3625–4055, https://doi.org/10.5194/acp-6-3625-2006, 2006.
Baboukas, E. D., Kanakidou, M., and Mihalopoulos, N.: Carboxylic acids in gas and particulate phase above the Atlantic Ocean, J. Geophys. Res.-Atmos, 105, 14459–14471, https://doi.org/10.1029/1999JD900977, 2000.
Bannan, T. J., Murray Booth, A., le Breton, M., Bacak, A., Muller, J. B. A., Leather, K. E., Khan, M. A. H., Lee, J. D., Dunmore, R. E., Hopkins, J. R., Fleming, Z. L., Sheps, L., Taatjes, C. A., Shallcross, D. E., and Percival, C. J.: Seasonality of Formic Acid (HCOOH) in London during the ClearfLo Campaign, J. Geophys. Res.-Atmos, 122, 12488–12498, https://doi.org/10.1002/2017JD027064, 2017.
Bohn, B., Siese, M., and Zetzschn, C.: Kinetics of the OH + C2H2 reaction in the presence of O2, Journal of the Chemical Society, Faraday Transactions, 92, 1459–1466, https://doi.org/10.1039/FT9969201459, 1996.
Bossolasco, A., Faragó, E. P., Schoemaecker, C., and Fittschen, C.: Rate constant of the reaction between CH3O2 and OH radicals, Chem. Phys. Lett., 593, 7–13, https://doi.org/10.1016/J.CPLETT.2013.12.052, 2014.
Burkholder, J. B., Sander, S. P., Abbatt, J. P. D., Barker, J. R., Cappa, C., Crounse, J. D., Dibble, T. S., Huie, R. E., Kolb, C. E., Kurylo, M. J., Orkin, V. L., Percival, C. J., Wilmouth, D. M., and Wine, P. H.: Chemical kinetics and photochemical data for use in atmospheric studies, Evaluation No. 19, JPL Publication 19-5, http://jpldataeval.jpl.nasa.gov (last access: 18 June 2022), 2019.
Carlton, A. G., Turpin, B. J., Altieri, K. E., Seitzinger, S., Reff, A., Lim, H. J., and Ervens, B.: Atmospheric oxalic acid and SOA production from glyoxal: Results of aqueous photooxidation experiments, Atmos. Environ., 41, 7588–7602, https://doi.org/10.1016/J.ATMOSENV.2007.05.035, 2007.
Chaliyakunnel, S., Millet, D. B., Wells, K. C., Cady-Pereira, K. E., and Shephard, M. W.: A Large Underestimate of Formic Acid from Tropical Fires: Constraints from Space-Borne Measurements, Environ. Sci. Technol., 50, 5631–5640, https://doi.org/10.1021/acs.est.5b06385, 2016.
Chameides, W. L. and Davis, D. D.: Aqueous-phase source of formic acid in clouds, Nature, 304, 427–429, https://doi.org/10.1038/304427a0, 1983.
Chebbi, A. and Carlier, P.: Carboxylic acids in the troposphere, occurrence, sources, and sinks: A review, Atmos. Environ., 30, 4233–4249, https://doi.org/10.1016/1352-2310(96)00102-1, 1996.
Chen, X., Millet, D. B., Neuman, J. A., Veres, P. R., Ray, E. A., Commane, R., Daube, B. C., McKain, K., Schwarz, J. P., Katich, J. M., Froyd, K. D., Schill, G. P., Kim, M. J., Crounse, J. D., Allen, H. M., Apel, E. C., Hornbrook, R. S., Blake, D. R., Nault, B. A., Campuzano-Jost, P., Jimenez, J. L., and Dibb, J. E.: HCOOH in the Remote Atmosphere: Constraints from Atmospheric Tomography (ATom) Airborne Observations, ACS Earth Space Chem., 5, 1436–1454, https://doi.org/10.1021/acsearthspacechem.1c00049, 2021.
Du, J. and Zhu, L.: Quantification of the absorption cross sections of surface-adsorbed nitric acid in the 335–365 nm region by Brewster angle cavity ring-down spectroscopy, Chem. Phys. Lett., 511, 213–218, https://doi.org/10.1016/j.cplett.2011.06.062, 2011.
Ervens, B., Feingold, G., Frost, G. J., and Kreidenweis, S. M.: A modeling study of aqueous production of dicarboxylic acids: 1. Chemical pathways and speciated organic mass production, J. Geophys. Res.-Atmos, 109, D15205, https://doi.org/10.1029/2003JD004387, 2004.
Franco, B., Blumenstock, T., Cho, C., Clarisse, L., Clerbaux, C., Coheur, P. F., De Mazière, M., De Smedt, I., Dorn, H. P., Emmerichs, T., Fuchs, H., Gkatzelis, G., Griffith, D. W. T., Gromov, S., Hannigan, J. W., Hase, F., Hohaus, T., Jones, N., Kerkweg, A., Kiendler-Scharr, A., Lutsch, E., Mahieu, E., Novelli, A., Ortega, I., Paton-Walsh, C., Pommier, M., Pozzer, A., Reimer, D., Rosanka, S., Sander, R., Schneider, M., Strong, K., Tillmann, R., Van Roozendael, M., Vereecken, L., Vigouroux, C., Wahner, A., and Taraborrelli, D.: Ubiquitous atmospheric production of organic acids mediated by cloud droplets, Nature, 593, 233–237, https://doi.org/10.1038/s41586-021-03462-x, 2021.
Fulgham, S. R., Brophy, P., Link, M., Ortega, J., Pollack, I., and Farmer, D. K.: Seasonal Flux Measurements over a Colorado Pine Forest Demonstrate a Persistent Source of Organic Acids, ACS Earth Space Chem., 3, 2017–2032, https://doi.org/10.1021/acsearthspacechem.9b00182, 2019.
Gao, Z., Vasilakos, P., Nah, T., Takeuchi, M., Chen, H., Tanner, D. J., Ng, N. L., Kaiser, J., Huey, L. G., Weber, R. J., and Russell, A. G.: Emissions, chemistry or bidirectional surface transfer? Gas phase formic acid dynamics in the atmosphere, Atmos. Environ., 274, 118995, https://doi.org/10.1016/J.ATMOSENV.2022.118995, 2022.
George, C., Ammann, M., D'Anna, B., Donaldson, D. J., and Nizkorodov, S. A.: Heterogeneous Photochemistry in the Atmosphere, Chem. Rev., 115, 4218–4258, https://doi.org/10.1021/cr500648z, 2015.
Goode, J. G., Yokelson, R. J., Ward, D. E., Susott, R. A., Babbitt, R. E., Davies, M. A., and Hao, W. M.: Measurements of excess O3, CO2, CO, CH4, C2H4, C2H2, HCN, NO, NH3, HCOOH, CH3COOH, HCHO, and CH3OH in 1997 Alaskan biomass burning plumes by airborne Fourier transform infrared spectroscopy (AFTIR), J. Geophys. Res.-Atmos, 105, 22147–22166, https://doi.org/10.1029/2000JD900287, 2000.
Guenther, A. B., Jiang, X., Heald, C. L., Sakulyanontvittaya, T., Duhl, T., Emmons, L. K., and Wang, X.: The Model of Emissions of Gases and Aerosols from Nature version 2.1 (MEGAN2.1): an extended and updated framework for modeling biogenic emissions, Geosci. Model Dev., 5, 1471–1492, https://doi.org/10.5194/gmd-5-1471-2012, 2012.
Henry, K. M. and Donahue, N. M.: Photochemical Aging of α-Pinene Secondary Organic Aerosol: Effects of OH Radical Sources and Photolysis, J. Phys. Chem. A, 116, 5932–5940, https://doi.org/10.1021/jp210288s, 2012.
Jacob, D. J.: Chemistry of OH in remote clouds and its role in the production of formic acid and peroxymonosulfate, J. Geophys. Res., 91, 9807, https://doi.org/10.1029/JD091ID09P09807, 1986.
Jenkin, M. E., Young, J. C., and Rickard, A. R.: The MCM v3.3.1 degradation scheme for isoprene, Atmos. Chem. Phys., 15, 11433–11459, https://doi.org/10.5194/acp-15-11433-2015, 2015.
Kawamura, K., Steinberg, S., and Kaplan, I. R.: Homologous series of C1–C10 monocarboxylic acids and C1–C6 carbonyls in Los Angeles air and motor vehicle exhausts, Atmos. Environ., 34, 4175–4191, https://doi.org/10.1016/S1352-2310(00)00212-0, 2000.
Keene, W. C. and Galloway, J. N.: The biogeochemical cycling of formic and acetic acids through the troposphere: an overview of current understanding, Chem. Phys. Meteorol., 40, 322–334, https://doi.org/10.3402/tellusb.v40i5.15994, 1988.
Keene, W. C., Galloway, J. N., and Holden, J. D.: Measurement of weak organic acidity in precipitation from remote areas of the world, J. Geophys. Res., 88, 5122–5130, https://doi.org/10.1029/JC088IC09P05122, 1983.
Khare, P., Kumar, N., Kumari, K. M., and Srivastava, S. S.: Atmospheric formic and acetic acids: An overview, Rev. Geophys., 37, 227–248, https://doi.org/10.1029/1998RG900005, 1999.
Klippel, W. and Warneck, P.: The formaldehyde content of the atmospheric aerosol, Atmos. Environ., 14, 809–818, https://doi.org/10.1016/0004-6981(80)90137-7, 1980.
Larsen, B. R., di Bella, D., Glasius, M., Winterhalter, R., Jensen, N. R., and Hjorth, J.: Gas-Phase OH Oxidation of Monoterpenes: Gaseous and Particulate Products, J. Atmos. Chem., 38, 231–276, https://doi.org/10.1023/A:1006487530903, 2001.
Le Breton, M., McGillen, M. R., Muller, J. B. A., Bacak, A., Shallcross, D. E., Xiao, P., Huey, L. G., Tanner, D., Coe, H., and Percival, C. J.: Airborne observations of formic acid using a chemical ionization mass spectrometer, Atmos. Meas. Tech., 5, 3029–3039, https://doi.org/10.5194/amt-5-3029-2012, 2012.
Lee, B. H., Lopez-Hilfiker, F. D., Mohr, C., Kurtén, T., Worsnop, D. R., and Thornton, J. A.: An iodide-adduct high-resolution time-of-flight chemical-ionization mass spectrometer: Application to atmospheric inorganic and organic compounds, Environ. Sci. Technol., 48, 6309–6317, https://doi.org/10.1021/es500362a, 2014.
Li, X., Rohrer, F., Brauers, T., Hofzumahaus, A., Lu, K., Shao, M., Zhang, Y. H., and Wahner, A.: Modeling of HCHO and CHOCHO at a semi-rural site in southern China during the PRIDE-PRD2006 campaign, Atmos. Chem. Phys., 14, 12291–12305, https://doi.org/10.5194/acp-14-12291-2014, 2014.
Lim, Y. B., Tan, Y., Perri, M. J., Seitzinger, S. P., and Turpin, B. J.: Aqueous chemistry and its role in secondary organic aerosol (SOA) formation, Atmos. Chem. Phys., 10, 10521–10539, https://doi.org/10.5194/acp-10-10521-2010, 2010.
Mack, J. and Bolton, J. R.: Photochemistry of nitrite and nitrate in aqueous solution: a review, J. Photoch. Photobio. A, 128, 1–13, https://doi.org/10.1016/S1010-6030(99)00155-0, 1999.
Malecha, K. T. and Nizkorodov, S. A.: Photodegradation of Secondary Organic Aerosol Particles as a Source of Small, Oxygenated Volatile Organic Compounds, Environ. Sci. Technol., 50, 9990–9997, https://doi.org/10.1021/acs.est.6b02313, 2016.
Mang, S. A., Henricksen, D. K., Bateman, A. E., Andersen, M. P. S., Blake, D. R., and Nizkorodov, S. A.: Contribution of carbonyl photochemistry to aging of atmospheric secondary organic aerosol, J. Phys. Chem. A, 112, 8337–8344, https://doi.org/10.1021/jp804376c, 2008.
Millet, D. B., Baasandorj, M., Farmer, D. K., Thornton, J. A., Baumann, K., Brophy, P., Chaliyakunnel, S., de Gouw, J. A., Graus, M., Hu, L., Koss, A., Lee, B. H., Lopez-Hilfiker, F. D., Neuman, J. A., Paulot, F., Peischl, J., Pollack, I. B., Ryerson, T. B., Warneke, C., Williams, B. J., and Xu, J.: A large and ubiquitous source of atmospheric formic acid, Atmos. Chem. Phys., 15, 6283–6304, https://doi.org/10.5194/acp-15-6283-2015, 2015.
Miyazaki, Y., Sawano, M., and Kawamura, K.: Low-molecular-weight hydroxyacids in marine atmospheric aerosol: evidence of a marine microbial origin, Biogeosciences, 11, 4407–4414, https://doi.org/10.5194/bg-11-4407-2014, 2014.
Müller, J.-F., Stavrakou, T., Bauwens, M., Compernolle, S., and Peeters, J.: Chemistry and deposition in the Model of Atmospheric composition at Global and Regional scales using Inversion Techniques for Trace gas Emissions (MAGRITTE v1.0). Part B. Dry deposition, Geosci. Model Dev. Discuss. [preprint], https://doi.org/10.5194/gmd-2018-317, 2018.
Nah, T., Guo, H., Sullivan, A. P., Chen, Y., Tanner, D. J., Nenes, A., Russell, A., Ng, N. L., Huey, L. G., and Weber, R. J.: Characterization of aerosol composition, aerosol acidity, and organic acid partitioning at an agriculturally intensive rural southeastern US site, Atmos. Chem. Phys., 18, 11471–11491, https://doi.org/10.5194/acp-18-11471-2018, 2018.
Neeb, P., Sauer, F., Horie, O., and Moortgat, G. K.: Formation of hydroxymethyl hydroperoxide and formic acid in alkene ozonolysis in the presence of water vapour, Atmos. Environ., 31, 1417–1423, https://doi.org/10.1016/S1352-2310(96)00322-6, 1997.
Novakov, T. and Penner, J. E.: Large contribution of organic aerosols to cloud-condensation-nuclei concentrations, Nature, 365, 823–826, https://doi.org/10.1038/365823a0, 1993.
Pan, X., Underwood, J. S., Xing, J.-H., Mang, S. A., and Nizkorodov, S. A.: Photodegradation of secondary organic aerosol generated from limonene oxidation by ozone studied with chemical ionization mass spectrometry, Atmos. Chem. Phys., 9, 3851–3865, https://doi.org/10.5194/acp-9-3851-2009, 2009.
Paulot, F., Crounse, J. D., Kjaergaard, H. G., Kroll, J. H., Seinfeld, J. H., and Wennberg, P. O.: Isoprene photooxidation: new insights into the production of acids and organic nitrates, Atmos. Chem. Phys., 9, 1479–1501, https://doi.org/10.5194/acp-9-1479-2009, 2009.
Paulot, F., Wunch, D., Crounse, J. D., Toon, G. C., Millet, D. B., DeCarlo, P. F., Vigouroux, C., Deutscher, N. M., González Abad, G., Notholt, J., Warneke, T., Hannigan, J. W., Warneke, C., de Gouw, J. A., Dunlea, E. J., De Mazière, M., Griffith, D. W. T., Bernath, P., Jimenez, J. L., and Wennberg, P. O.: Importance of secondary sources in the atmospheric budgets of formic and acetic acids, Atmos. Chem. Phys., 11, 1989–2013, https://doi.org/10.5194/acp-11-1989-2011, 2011.
Peng, X., Wang, T., Wang, W., Ravishankara, A. R., George, C., Xia, M., Cai, M., Li, Q., Salvador, C. M., Lau, C., Lyu, X., Poon, C. N., Mellouki, A., Mu, Y., Hallquist, M., Saiz-Lopez, A., Guo, H., Herrmann, H., Yu, C., Dai, J., Wang, Y., Wang, X., Yu, A., Leung, K., Lee, S., and Chen, J.: Photodissociation of particulate nitrate as a source of daytime tropospheric Cl2, Nat. Commun., 13, 939, https://doi.org/10.1038/s41467-022-28383-9, 2022.
Sanhueza, E. and Andreae, M. O.: Emission of formic and acetic acids from tropical Savanna soils, Geophys. Res. Lett., 18, 1707–1710, https://doi.org/10.1029/91GL01565, 1991.
Saunders, S. M., Jenkin, M. E., Derwent, R. G., and Pilling, M. J.: Protocol for the development of the Master Chemical Mechanism, MCM v3 (Part A): tropospheric degradation of non-aromatic volatile organic compounds, Atmos. Chem. Phys., 3, 161–180, https://doi.org/10.5194/acp-3-161-2003, 2003.
Shaw, M. F., Sztáray, B., Whalley, L. K., Heard, D. E., Millet, D. B., Jordan, M. J. T., Osborn, D. L., and Kable, S. H.: Photo-tautomerization of acetaldehyde as a photochemical source of formic acid in the troposphere, Nat. Commun., 9, 1–7, https://doi.org/10.1038/s41467-018-04824-2, 2018.
Stavrakou, T., Müller, J. F., Peeters, J., Razavi, A., Clarisse, L., Clerbaux, C., Coheur, P. F., Hurtmans, D., De Mazière, M., Vigouroux, C., Deutscher, N. M., Griffith, D. W. T., Jones, N., and Paton-Walsh, C.: Satellite evidence for a large source of formic acid from boreal and tropical forests, Nat. Geosci., 5, 26–30, https://doi.org/10.1038/ngeo1354, 2012.
Su, T., Li, J., Li, C., Xiang, P., Lau, A. K. H., Guo, J., Yang, D., and Miao, Y.: An intercomparison of long-term planetary boundary layer heights retrieved from CALIPSO, ground-based lidar, and radiosonde measurements over Hong Kong, J. Geophys. Res.-Atmos, 122, 3929–3943, https://doi.org/10.1002/2016JD025937, 2017.
Toda, K., Yunoki, S., Yanaga, A., Takeuchi, M., Ohira, S.-I., and Dasgupta, P. K.: Formaldehyde Content of Atmospheric Aerosol, Environ. Sci. Technol., 48, 6636–6643, https://doi.org/10.1021/es500590e, 2014.
Vet, R., Artz, R. S., Carou, S., Shaw, M., Ro, C. U., Aas, W., Baker, A., Bowersox, V. C., Dentener, F., Galy-Lacaux, C., Hou, A., Pienaar, J. J., Gillett, R., Forti, M. C., Gromov, S., Hara, H., Khodzher, T., Mahowald, N. M., Nickovic, S., Rao, P. S. P., and Reid, N. W.: A global assessment of precipitation chemistry and deposition of sulfur, nitrogen, sea salt, base cations, organic acids, acidity and pH, and phosphorus, Atmos. Environ., 93, 3–100, https://doi.org/10.1016/J.ATMOSENV.2013.10.060, 2014.
Walser, M. L., Park, J., Gomez, A. L., Russell, A. R., and Nizkorodov, S. A.: Photochemical Aging of Secondary Organic Aerosol Particles Generated from the Oxidation of d-Limonene, J. Phys. Chem. A., 111, 1907–1913, https://doi.org/10.1021/jp066293l, 2007.
Wofsy, S. C., Afshar, S., Allen, H. M., Apel, E. C., Asher, E. C., Barletta, B., Bent, J., Bian, H., Biggs, B. C., Blake, D. R., Blake, N., Bourgeois, I., Brock, C. A., Brune, W. H., Budney, J. W., Bui, T. P., Butler, A., Campuzano-Jost, P., Chang, C. S., Chin, M., Commane, R., Correa, G., Crounse, J. D., Cullis, P. D., Daube, B. C., Day, D. A., Dean-Day, J. M., Dibb, J. E., DiGangi, J. P., Diskin, G. S., Dollner, M., Elkins, J. W., Erdesz, F., Fiore, A. M., Flynn, C. M., Froyd, K. D., Gesler, D. W., Hall, S. R., Hanisco, T. F., Hannun, R. A., Hills, A. J., Hintsa, E. J., Hoffman, A., Hornbrook, R. S., Huey, L. G., Hughes, S., Jimenez, J. L., Johnson, B. J., Katich, J. M., Keeling, R. F., Kim, M. J., Kupc, A., Lait, L. R., McKain, K., Mclaughlin, R. J., Meinardi, S., Miller, D. O., Montzka, S. A., Moore, F. L., Morgan, E. J., Murphy, D. M., Murray, L. T., Nault, B. A., Neuman, J. A., Newman, P. A., Nicely, J. M., Pan, X., Paplawsky, W., Peischl, J., Prather, M. J., Price, D. J., Ray, E. A., Reeves, J. M., Richardson, M., Rollins, A. W., Rosenlof, K. H., Ryerson, T. B., Scheuer, E., Schill, G. P., Schroder, J. C., Schwarz, J. P., St.Clair, J. M., Steenrod, S. D., Stephens, B. B., Strode, S. A., Sweeney, C., Tanner, D., Teng, A. P., Thames, A. B., Thompson, C. R., Ullmann, K., Veres, P. R., Wagner, N. L., Watt, A., Weber, R., Weinzierl, B. B., Wennberg, P. O., Williamson, C. J., Wilson, J. C., Wolfe, G. M., Woods, C. T., Zeng, L. H., and Vieznor, N.: ATom: Merged Atmospheric Chemistry, Trace Gases, and Aerosols, Version 2 (Version 2.0), ORNL Distributed Active Archive Center, https://doi.org/10.3334/ornldaac/1925, 2021.
Wolfe, G. M., Marvin, M. R., Roberts, S. J., Travis, K. R., and Liao, J.: The Framework for 0-D Atmospheric Modeling (F0AM) v3.1, Geosci. Model Dev., 9, 3309–3319, https://doi.org/10.5194/gmd-9-3309-2016, 2016.
Xia, K., Tong, S., Zhang, Y., Tan, F., Chen, Y., Zhang, W., Guo, Y., Jing, B., Ge, M., Zhao, Y., Alamry, K. A., Marwani, H. M., and Wang, S.: Heterogeneous Reaction of HCOOH on NaCl Particles at Different Relative Humidities, J. Phys. Chem. A, 122, 7218–7226, https://doi.org/10.1021/acs.jpca.8b02790, 2018.
Xia, M., Wang, T., Wang, Z., Chen, Y., Peng, X., Huo, Y., Wang, W., Yuan, Q., Jiang, Y., Guo, H., Lau, C., Leung, K., Yu, A., and Lee, S.: Pollution-Derived Br2 Boosts Oxidation Power of the Coastal Atmosphere, Environ. Sci. Technol., 56, 12055–12065, https://doi.org/10.1021/acs.est.2c02434, 2022.
Xu, J., Chen, J., Shi, Y., Zhao, N., Qin, X., Yu, G., Liu, J., Lin, Y., Fu, Q., Weber, R. J., Lee, S. H., Deng, C., and Huang, K.: First Continuous Measurement of Gaseous and Particulate Formic Acid in a Suburban Area of East China: Seasonality and Gas-Particle Partitioning, ACS Earth Space Chem., 4, 157–167, https://doi.org/10.1021/acsearthspacechem.9b00210, 2020.
Ye, C., Zhang, N., Gao, H., and Zhou, X.: Photolysis of Particulate Nitrate as a Source of HONO and NOx, Environ. Sci. Technol., 51, 6849–6856, https://doi.org/10.1021/acs.est.7b00387, 2017.
Yifan, J., Men, X., Zhe, W., Penggang, Z., Yi, C., and Tao, W.: Photochemical aging of aerosols contributes significantly to the production of atmospheric formic acid, Zenodo [data set], https://doi.org/10.5281/zenodo.8415792, 2023.
Yokelson, R. J., Crounse, J. D., DeCarlo, P. F., Karl, T., Urbanski, S., Atlas, E., Campos, T., Shinozuka, Y., Kapustin, V., Clarke, A. D., Weinheimer, A., Knapp, D. J., Montzka, D. D., Holloway, J., Weibring, P., Flocke, F., Zheng, W., Toohey, D., Wennberg, P. O., Wiedinmyer, C., Mauldin, L., Fried, A., Richter, D., Walega, J., Jimenez, J. L., Adachi, K., Buseck, P. R., Hall, S. R., and Shetter, R.: Emissions from biomass burning in the Yucatan, Atmos. Chem. Phys., 9, 5785–5812, https://doi.org/10.5194/acp-9-5785-2009, 2009.
Yu, S.: Role of organic acids (formic, acetic, pyruvic and oxalic) in the formation of cloud condensation nuclei (CCN): a review, Atmos. Res., 53, 185–217, https://doi.org/10.1016/S0169-8095(00)00037-5, 2000.
Yuan, B., Veres, P. R., Warneke, C., Roberts, J. M., Gilman, J. B., Koss, A., Edwards, P. M., Graus, M., Kuster, W. C., Li, S.-M., Wild, R. J., Brown, S. S., Dubé, W. P., Lerner, B. M., Williams, E. J., Johnson, J. E., Quinn, P. K., Bates, T. S., Lefer, B., Hayes, P. L., Jimenez, J. L., Weber, R. J., Zamora, R., Ervens, B., Millet, D. B., Rappenglück, B., and de Gouw, J. A.: Investigation of secondary formation of formic acid: urban environment vs. oil and gas producing region, Atmos. Chem. Phys., 15, 1975–1993, https://doi.org/10.5194/acp-15-1975-2015, 2015.
Zellner, R., Exner, M., and Herrmann, H.: Absolute OH quantum yields in the laser photolysis of nitrate, nitrite and dissolved H2O2 at 308 and 351 nm in the temperature range 278–353 K, J. Atmos. Chem., 10, 411–425, https://doi.org/10.1007/BF00115783, 1990.
Zervas, E., Montagne, X., and Lahaye, J.: C1-C5 Organic Acid Emissions from an SI Engine: Influence of Fuel and Air/Fuel Equivalence Ratio, Environ. Sci. Technol., 35, 2746–2751, https://doi.org/10.1021/ES000237V, 2001a.
Zervas, E., Montagne, X., and Lahaye, J.: Emission of specific pollutants from a compression ignition engine. Influence of fuel hydrotreatment and fuel/air equivalence ratio, Atmos. Environ., 35, 1301–1306, https://doi.org/10.1016/S1352-2310(00)00390-3, 2001b.
Zhang, R., Suh, I., Zhao, J., Zhang, D., Fortner, E. C., Tie, X., Molina, L. T., and Molina, M. J.: Atmospheric New Particle Formation Enhanced by Organic Acids, Sciences, 304, 1487–1490, https://doi.org/10.1126/science.1095139, 2004.
Zhang, R., Gen, M., Fu, T. M., and Chan, C. K.: Production of Formate via Oxidation of Glyoxal Promoted by Particulate Nitrate Photolysis, Environ. Sci. Technol., 55, 5711–5720, https://doi.org/10.1021/acs.est.0c08199, 2021.
Zhu, C., Xiang, B., Zhu, L., and Cole, R.: Determination of absorption cross sections of surface-adsorbed HNO3 in the 290–330 nm region by Brewster angle cavity ring-down spectroscopy, Chem. Phys. Lett., 458, 373–377, https://doi.org/10.1016/j.cplett.2008.04.125, 2008.