the Creative Commons Attribution 4.0 License.
the Creative Commons Attribution 4.0 License.
 | 01 Dec 2023
Seasonal variations in composition and sources of atmospheric ultrafine particles in urban Beijing based on near-continuous measurements
Xiaoxiao Li
Yijing Chen
Yuyang Li
Runlong Cai
Yiran Li
Chenjuan Deng
Jin Wu
Hairong Cheng
Yongchun Liu
Markku Kulmala
Jiming Hao
Jingkun Jiang
Understanding the composition and sources of atmospheric ultrafine particles (UFPs) is essential in evaluating their exposure risks. It requires long-term measurements with high time resolution, which are scarce to date. We performed near-continuous measurements of UFP composition during four seasons in urban Beijing using a thermal desorption chemical ionization mass spectrometer, accompanied by real-time size distribution measurements. We found that UFPs in urban Beijing are dominated by organic components, varying seasonally from 68 % to 81 %. CHO organics (i.e., molecules containing carbon, hydrogen, and oxygen) are the most abundant in summer, while sulfur-containing organics, some nitrogen-containing organics, nitrate, and chloride are the most abundant in winter. With the increase of particle diameter, the contribution of CHO organics decreases, while that of sulfur-containing and nitrogen-containing organics, nitrate, and chloride increases. Source apportionment analysis of the UFP organics indicates contributions from cooking and vehicle sources, photooxidation sources enriched in CHO organics, and aqueous/heterogeneous sources enriched in nitrogen- and sulfur-containing organics. The increased contributions of cooking, vehicle, and photooxidation components are usually accompanied by simultaneous increases in UFP number concentrations related to cooking emission, vehicle emission, and new particle formation, respectively, while the increased contribution of the aqueous/heterogeneous composition is usually accompanied by the growth of UFP mode diameters. The highest UFP number concentrations in winter are due to the strongest new particle formation, the strongest local primary particle number emissions, and the slowest condensational growth of UFPs to larger sizes. This study provides a comprehensive understanding of urban UFP composition and sources and offers valuable datasets for the evaluation of UFP exposure risks.
- Article
(2084 KB) - Full-text XML
-
Supplement
(2171 KB) - BibTeX
- EndNote


Ultrafine particles (UFPs; particles with diameters smaller than or equal to 100 nm) have significant effects on human health (HEI, 2013; Ohlwein et al., 2019) and global climate (Kulmala et al., 2004; Pierce and Adams, 2007). Their human exposure risks and climate effects are highly related to their composition and size (Oberdorster et al., 2005; Pierce and Adams, 2007). To better evaluate the exposure risks of UFPs and to formulate corresponding air quality guidelines, the World Health Organization made several recommendations to guide measurements and regulations of UFPs in 2021 (WHO, 2021). They emphasized that local understanding of UFP origins and their chemical composition is scarce in most parts of the world.
Current field studies of atmospheric UFP composition and their source apportionment are mostly based on offline sampling. These measurements usually use a size-resolving impactor to collect UFPs on filters for tens of hours to several days (Cabada et al., 2004; Cass et al., 2000; Ham and Kleeman, 2011; Herner et al., 2005; Kleeman et al., 2009; Massling et al., 2009; Xue et al., 2019, 2020a, b; Zhao et al., 2017). They found that organic carbon, sulfate, and nitrate could account for 50 %–90 % of the detected compounds, and the composition could vary greatly with UFP size due to different sources and atmospheric evolutions (Cabada et al., 2004; Herner et al., 2005; Massling et al., 2009). For source apportionment, the chemical mass balance analysis was often used, which relies heavily on the source profiles and the limited numbers of molecular markers (Ham and Kleeman, 2011; Kleeman et al., 2009; Xue et al., 2019). The identified sources include meat cooking, gasoline, diesel, motor oil, and wood burning. However, these offline explorations can not capture the high temporal variability in size-resolved UFP composition and sources, nor can they distinguish primary UFPs from secondary sources, e.g., new particle formation, due to the lack of tracers and composition profiles for secondary sources. Simultaneous real-time measurements of UFP composition and size distributions are needed to accurately identify both primary and secondary sources.
Using a thermal desorption chemical ionization mass spectrometer (TDCIMS), the size-resolved composition of UFPs can be measured with a resolution of tens of minutes (Li et al., 2021; Smith et al., 2004). Previously, it has been used in a number of sites for short-term measurements and found distinct characteristics for UFPs in urban (Li et al., 2021, 2022a; Smith et al., 2005, 2008), rural (Lawler et al., 2020; Smith et al., 2010), and remote areas (Glicker et al., 2019; Lawler et al., 2014, 2018, 2021). For instance, UFPs in urban areas have more nitrogen- and sulfur-containing organics (Smith et al., 2005; Winkler et al., 2012), while those at forest sites have more CHO organics (i.e., molecules containing carbon, hydrogen, and oxygen) (Glicker et al., 2019; Lawler et al., 2018). With these near-continuous measurements, unique sources such as fungal bursts (Lawler et al., 2020) and sea-salt nanoparticles (Lawler et al., 2014) were identified, and the mechanisms of new particle formation were examined (Li et al., 2022a). Source apportionment analysis was performed for the high-time-resolution TDCIMS results in the Amazon Basin to isolate anthropogenic UFPs from background UFPs (Glicker et al., 2019). These analyses mainly focused on short-term analysis covering several weeks. To address the UFP composition and sources from a more comprehensive view, there is an urgent need for long-term and high-time-resolution measurements in diverse environments.
The primary and secondary sources of particles in urban atmospheres usually show significant seasonal characteristics. Thus, addressing the seasonal variations of UFPs, as well as their governing factors, is fundamental to evaluating their long-term impacts. For fine particles in Beijing, coal combustion is more abundant in winter due to domestic heating in the surrounding regions (Sun et al., 2015; Zhang et al., 2013), biomass burning is more abundant in harvest seasons (Zhang et al., 2008), and dust storms are more frequent in spring (Xu et al., 2020; Zhang et al., 2013). Besides these primary sources, previous studies on larger particles showed higher oxidation states of organic aerosols in summer due to stronger photochemical processes (Hu et al., 2017; Ma et al., 2022; Sun et al., 2018). However, considering the short lifetime of UFPs, seasonal variations of the composition and sources of UFPs are likely different. For example, as an important source of UFPs, new particle formation in Beijing was observed to be the weakest in summer and strongest in winter due to temperature variations (Deng et al., 2020; Li et al., 2020; Wu et al., 2007). Similar to Beijing, seasonal variations of UFP composition based on high-time-resolution measurements are also scarce for other atmospheric sites.
Here, we performed near-continuous measurements of UFP composition and size distributions over four seasons in the typical megacity of Beijing with ∼22 million people. The UFP composition, its size dependence, and seasonal variability were analyzed. Several molecular markers from cooking and vehicle emissions were identified. These markers were combined with positive matrix factorization (PMF) analysis to address contributions from primary and secondary sources of UFPs. The aerosol general dynamic equation (GDE) was used to quantify the emission rates of primary UFPs and the formation rates of secondary UFPs. The driving factors for the seasonal variations of UFP composition and number concentrations were identified.
2.1 Field measurements
The sampling site is on the fifth floor of a building on the west campus of Beijing University of Chemical Technology (39∘94′ N, 116∘30′ E) (Liu et al., 2020). The site is a typical urban site, surrounded by residential and commercial buildings. Three trafficked roads are 130–565 m away from the sites. UFP composition, particle number-size distribution, trace gases, and meteorological conditions were measured over four seasons between December 2019 and August 2021. An overall period of 149 d of TDCIMS measurements was used for analysis, with at least 3 weeks' data for each season. Details of the sampling periods are described in Table S1 in the Supplement.
UFP composition was measured by the TDCIMS using the “bulk collection mode” (Li et al., 2021; Smith et al., 2004). The TDCIMS collects pre-charged particles on a high-voltage-biased Pt filament and then vaporizes the particles for analysis by a chemical ionization high-resolution time-of-flight mass spectrometer (CI-HTOF; Aerodyne Research Inc. and Tofwerk AG). The particle electrostatic collection efficiency on the filament decreases rapidly with increasing particle size due to decreased electrical mobility, ensuring that the collected particle mass is mainly from UFPs (Li et al., 2021). During the particle evaporation, an electrical current is applied to the metal filament to an estimated temperature of ∼600 ∘C within a minute. The observed compounds can be desorbed thoroughly within the heating periods as indicated by the desorption profile. Using O as the reagent ion, sulfate, nitrate, chloride, and most of the oxygenated organics can be measured, while black carbon, hydrocarbon compounds, and bases such as ammonium and aminium are less likely to be detected due to lower sensitivity. Every sampling cycle is followed by a background cycle where no voltages are applied to the Pt filament for particle collection. The signals from the background cycle are subtracted from the sampling cycle to exclude minor influences from the gas phase compounds. Each analysis cycle (including a sample and a background cycle) is set to be 10–40 min, depending on the estimated sample mass. The detailed principles, operations, and quantifications of the TDCIMS are the same as the bulk collection mode described in our previous study (Li et al., 2021).
The particle number size distributions from 1 nm to 10 µm were measured using a home-built particle size distribution system (PSD; 3 nm–10 µm) and a diethylene glycol scanning mobility particle spectrometer (DEG-SMPS; 1–7.5 nm). The configuration and operation of the PSD are the same as described in our previous studies (Cai et al., 2017). The time resolution of the measurement is 5 min. The number and mass concentrations of atmospheric UFPs were estimated via the integration of size distribution measurements, assuming spherical particles with a density of 1.4 g cm−3.
Other parameters used in this study include the meteorological conditions measured by the meteorology stations (AWS310, Vaisala Inc., Finland) and trace gases measured by the trace gas analyzers (TGAs; Thermo Fisher). The mixing layer height (MLH) was estimated from the vertical profiles measured by a ceilometer (CL51, Vaisala Inc., Finland), and a three-step idealized-profile method was used to estimate the MLH (Eresmaa et al., 2012).
2.2 Source apportionment of UFP composition
The Igor-based interface SoFi (solution finder, version 6.5) and ME-2 (Canonaco et al., 2013) were used for the PMF analysis to analyze the sources of organics in UFPs. The integrated thermal desorption signals of organic peaks with between 100 and 300 measured by the TDCIMS were used as the input data matrix. The integrated thermal desorption signals from the background samples were used to derive the input error matrix. The best solution in each season was chosen according to and the similarities between profiles, time series, and diurnal variations of the factors. The correlations between each factor and the measured key species, trace gas, and PM2.5 were calculated for better identification of the factors. It should be noted that there were also many peaks with below 100, but a large fraction of them was from thermal decomposition, and their inclusion would add great complexity to the factor assignments. The signal intensity instead of the mass concentration was used because sensitivity quantification of the TDCIMS was based on the calibration of limited numbers of compounds, which may induce unknown uncertainties when quantifying the sources. As a result, the signal intensity measured by the TDCIMS is reported for reference, and the relative variations of detected species are studied rather than their estimated ambient concentrations.
2.3 Quantifying source and loss terms of UFP number concentrations
In the measured size distribution plots, there are usually abrupt increases in UFP number concentration. During new particle formation (NPF) periods, the abrupt increases of UFPs are usually accompanied by a burst of sub-3 nm particles at midday. During non-NPF periods, the abrupt increases of UFPs are usually accompanied by an increase in primary emission tracers (as will be shown in Sect. 3.2). We apply the GDE to quantify the new particle formation rates (J) and primary particle number emission rates (E) at the observation site. The calculation of J follows that described in previous studies (Cai and Jiang, 2017; Cai et al., 2017). The calculation of E[i,j] (m−3 s−1), the particle emission rates in the size range of [di, dj], follows Eq. (1) (Cai et al., 2018; Kontkanen et al., 2020) during non-NPF periods.
where (m−3 s−1) is the variation of the particle number concentration in the size range of [di, dj] during the period of dt (s−1); GR(nj−ni) (m−3 s−1) is the net condensation growth term; GR (m s−1) is the condensational growth rate of particle di; ni (m−4) is the particle number size distribution function for particle di; CoagSrc[i,j] and CoagSnk[i,j] (m−3 s−1) are the coagulation source and sink terms; and TR[i,j] is the transport term. Overall, 33 size bins were included in the size range of 3–50 nm.
The term and CoagSnk[i,j] can be directly calculated from the size distribution data (Cai et al., 2018). GR is calculated by the theoretical condensation of the condensable vapors, that is the sum of H2SO4 and condensable organic vapor concentrations. Here, we regard condensable organic vapors as oxygenated organic molecules (OOMs) with saturation vapor pressure lower than 0.3 µg m−3 as in our previous studies (Li et al., 2022a; Qiao et al., 2021). Since not all the observation days were equipped with the measurements of condensable vapors, we adopted seasonal-dependent GR derived from seasonal average condensable vapor concentrations reported in our previous study, that is 1.2×10⁷, 9.9×10⁷, 1.2×10⁸, and 5.0×107 cm−3 for winter, spring, summer, and autumn (Qiao et al., 2021), respectively. For particles smaller than 50 nm, CoagSrc[i,j] term can be neglected; for particles smaller than 5 nm, the uncertainties will be very large for E. We only calculated E3–50 in this study, and CoagSrc[i,j] was thus neglected. Generally, TR[i,j] term cannot be quantified using the mathematic method. As our previous study has indicated, there was no significant transport term on a long-term timescale (Kontkanen et al., 2020), we initially assumed that TR[i,j] equals 0. Another assumption is that the influences from the variation in MLH are neglected. We briefly explore how the assumptions of TR[i,j] and MLH influence the results in the next paragraph.
On the particle size distribution plots, we notice that the abrupt appearance of particles during non-NPF days usually happens in the early morning (06:00–09:00 LT) and late afternoon (17:00–20:00 LT) (Fig. S1 in the Supplement). The afternoon peak is accompanied by a decrease in MLH and an increase in particle numbers in all sizes within the range of 3–50 nm; thus the abrupt increase in particle number concentration could be due to the combined effects of MLH, transport, and emission. The morning peak is accompanied by the increase in MLH, which should decrease particle number concentrations, and the increase in particle number is only observed for 3–30 nm particles but not for 30–50 nm. Thus, the increasing morning peak could only be caused by the primary emission of 3–30 nm particles. As a result, the 3–30 nm particle emission rate during 06:00–09:00 LT is calculated to represent the average primary particle emission rates for each day. It should be noted that the emission rates during 06:00–09:00 LT may be underestimated due to the increase of MLH, and the emission rates only represent the increasing rates of primary particles at the observational site, not the direct emission rates from the sources.
3.1 UFP concentration, composition, and seasonal variability
The overall concentration of UFPs is the highest in winter and the lowest in summer. The UFP number concentrations expressed in mean ± standard deviation are , , , and cm−3 (Fig. 1a), and the UFP mass concentrations are 1.3±0.9, 1.2±0.9, 1.0±0.6, and 1.2±0.7 µg m−3 (Fig. 1b) for winter, spring, summer, and autumn, respectively. The seasonal variations are partly caused by the variation in MLH (Fig. S2), while the other driving factors are related to the source and loss terms of UFPs and will be further discussed in Sect. 3.3.
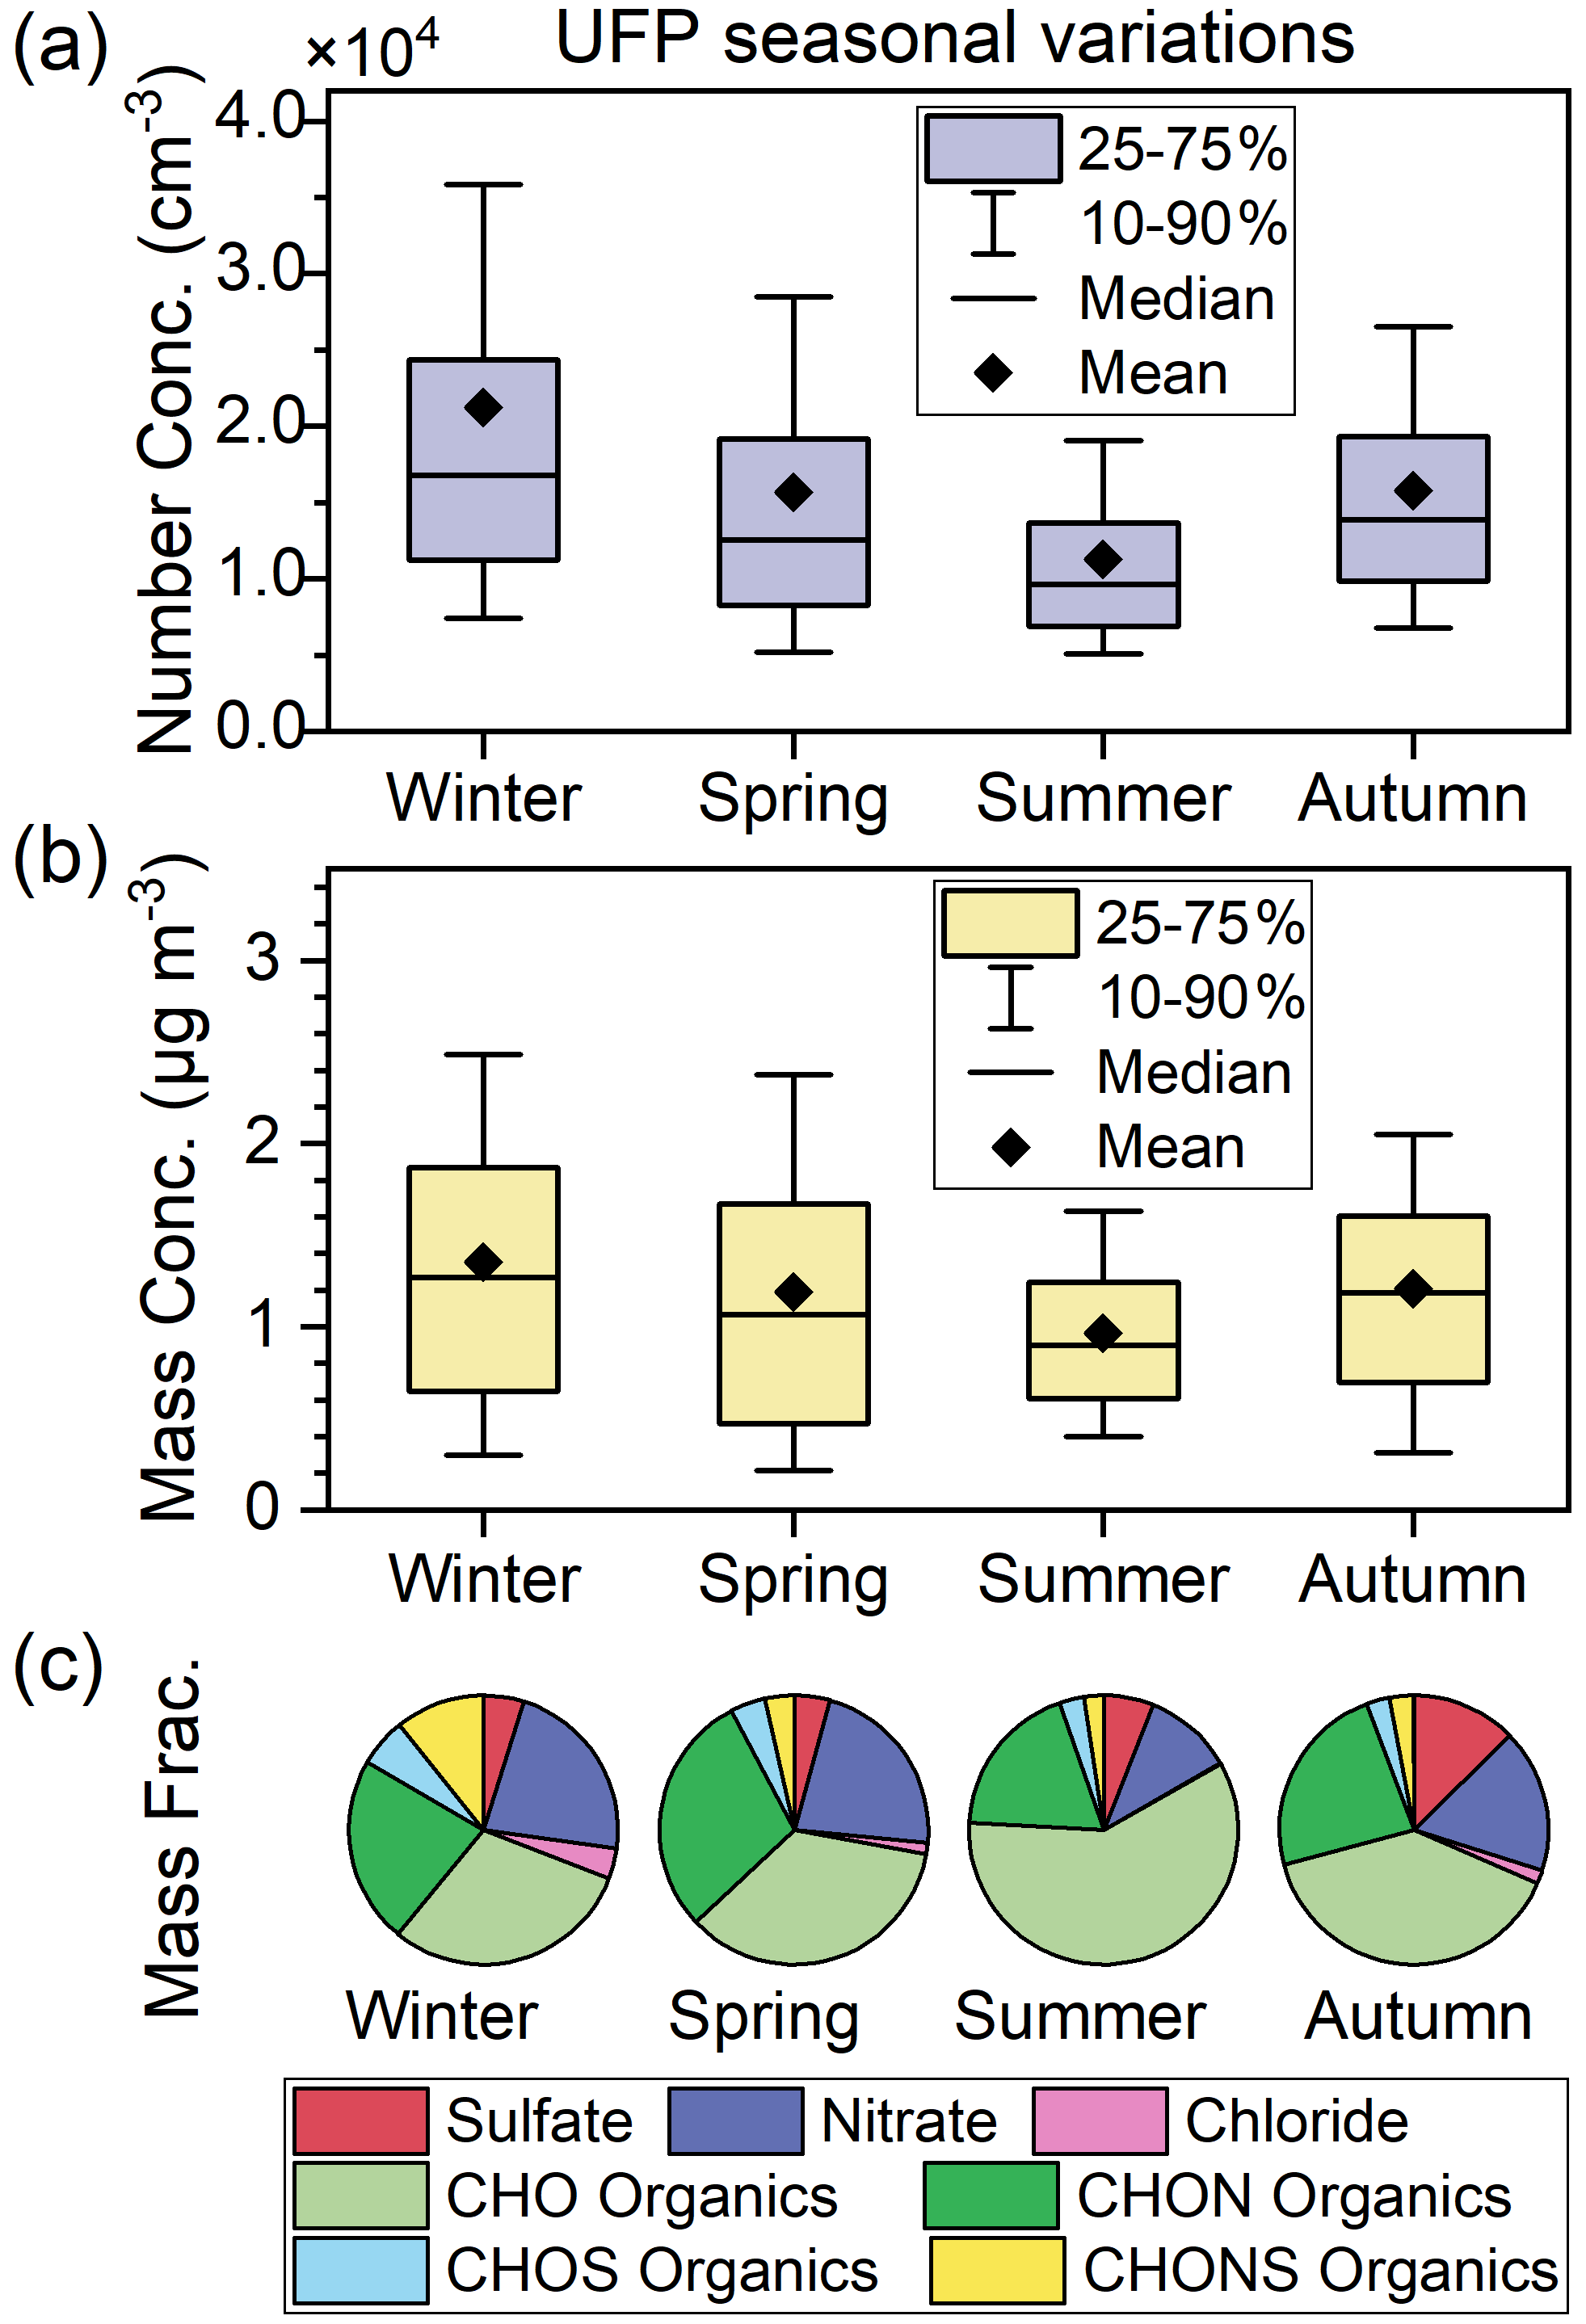
Figure 1Seasonal variations of UFP concentrations and composition in urban Beijing. (a) UFP number concentrations in the size range of 3–100 nm. (b) UFP mass concentrations integrated from size distribution measurements, assuming spherical particles with a density of 1.4 g cm−3. (c) Mass fractions of the components measured by the TDCIMS in negative ion mode.
The detected UFP composition is dominated by organics (68 %–81 % for mass fraction), with minor contributions from nitrate (11 %–22 %), sulfate (4 %–13 %), and chloride (0.1 %–4 %) over all four seasons (Fig. 1c). The organic species include CHO, CHON, CHOS, and CHONS organics, contributing 30 %–59 %, 19 %–29 %, 3 %–6 %, and 2 %–11 % mass concentrations of the detected UFP compounds, respectively. The detected particulate species are similar for all four seasons, as indicated by the similarities in the mass defect plots (Fig. S3). The measured composition is consistent with the offline results from Beijing, which showed that organics were the most abundant in UFPs (Massling et al., 2009; Zhao et al., 2017). It should be noted that the collected mass integrated from the TDCIMS signals is ∼50 % of the total collected mass estimated from the size distributions (Fig. S4). This is possibly due to the uncertainties in the quantification methods or because some UFP compounds (e.g., ammonia, amines, black carbon, and alkanes) cannot be ionized by O in the TDCIMS. However, as the mass estimated from the two methods is in good correlation, we assume that the TDCIMS-measured composition is representative of UFP composition. As some of the particulate CHON, CHOS, and CHONS organics would decompose to CHO fragments in the TDCIMS during the thermal desorption process, there may be some underestimation of CHON and CHOS/CHONS organics and overestimation of CHO organics.
A major seasonal difference in UFP chemical composition is that the highest fractions of slow-desorbed CHO organics are observed in summer (59 %), which may be related to the strongest solar radiation and lowest NOx concentrations. On the one hand, the appearance of most CHO organic ions during temperature ramping of the Pt wire occurs at higher temperatures compared to nitrate and chloride while at slightly lower temperatures compared to sulfate (Fig. S5). The higher temperature desorption, which we refer to as “slowly desorbed,” indicates that these species must be low-volatility compounds or the corresponding thermal decomposition fragments. On the other hand, the overall CHO organic mass has an afternoon peak at ∼ 14:00 LT, and its diurnal variation is consistent with that for O3 in summer (Fig. S6), indicating they might be related to photooxidation chemistry. Based on this, we hypothesize that CHO organics in the UFPs are mostly from the partitioning of low-volatility compounds originating from the gas-phase oxidation. Thus, the higher CHO fractions in summer are due to the strongest solar radiation, which benefits the gaseous photooxidation, and the lowest NOx (Fig. S2), which contributes to the formation of CHO organics over CHON organics (Yan et al., 2020; Ye et al., 2019).
Another seasonal difference is that higher fractions of fast-desorbed species are measured in winter, including nitrate, chloride, and some CHON (e.g., C6H4NO, nitrophenols) organic compounds. These species are mostly desorbed at lower temperatures (Fig. S5), and their concentrations in UFPs are negatively correlated to ambient temperature (Fig. S7), indicating their relatively higher volatility. Thus, the higher fractions in winter are mainly governed by the temperature-dependent partitioning of these compounds. It should be noted that CHONS organic (e.g., deprotonated aminomethanesulfonic acid CH4NSO and deprotonated taurine C2H6NSO) fractions also increase in winter. These species are possibly formed in the gas phase through the reaction between SO3 and amines under dry conditions (Li et al., 2018; Sarkar et al., 2019). Their gaseous formation likely happens in winter Beijing due to the low ambient relative humidity. The seasonal variations of these CHONS species are different from those in larger particles where S-containing organics are more abundant in summer (Ma et al., 2022).
The composition of UFPs also varies greatly with particle size. As shown in Fig. 2, the most significant size-dependent variations were observed for nitrate and CHO organics. The nitrate fraction increases significantly with increasing particle diameter, probably due to the kelvin effects that prevent it from partitioning to small particles or due to an increase in aqueous/heterogeneous processes at larger particle sizes. The CHO organic fraction decreases significantly with increased particle size, possibly due to its low volatility that favors smaller particles compared to the high-volatility compounds. Compared to CHO organics, the relative contributions of N- and S-containing organics increase with particle size, possibly due to higher volatility or the aqueous/heterogeneous formation as particles grow. The sulfate fraction does not change significantly with particle sizes possibly due to the opposite size dependence of condensational growth of H2SO4 and the aqueous/heterogeneous formation of sulfate.
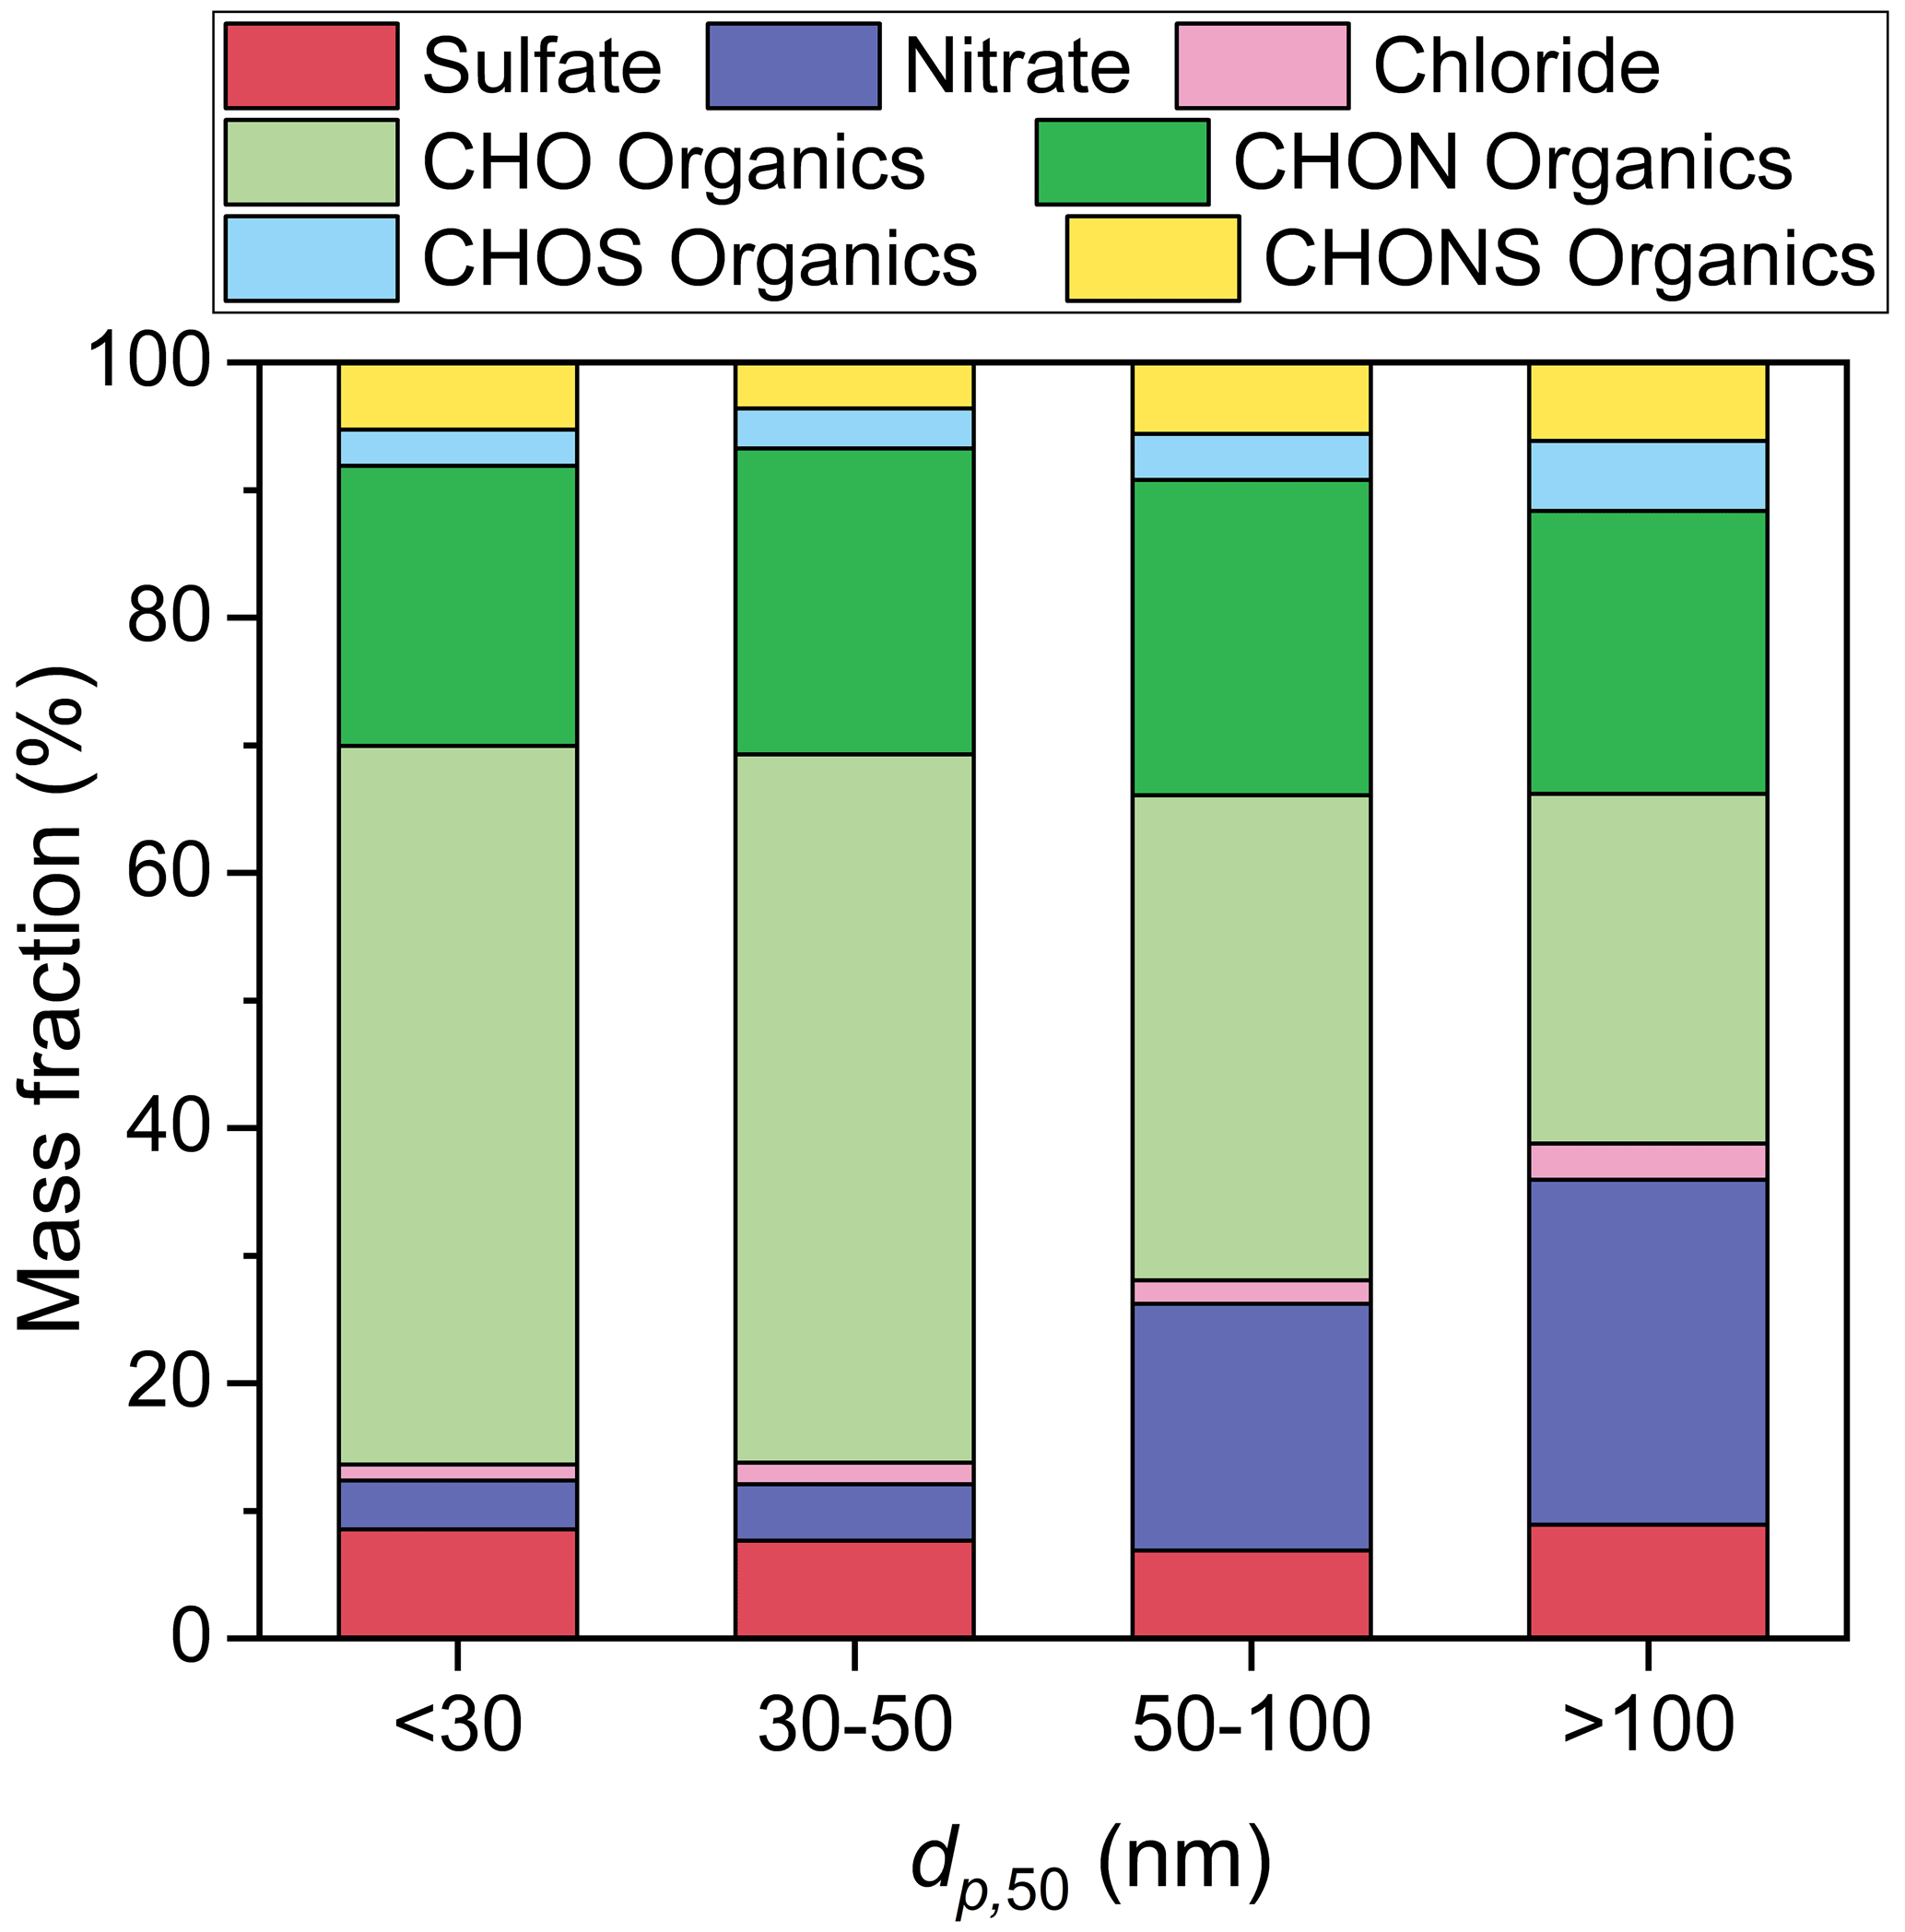
Figure 2Size-dependent composition of UFPs. UFP composition mass fraction variation with the representing particle size dp,50. dp,50 corresponds to 50 % volume mean diameter of particles collected on the TDCIMS filament.
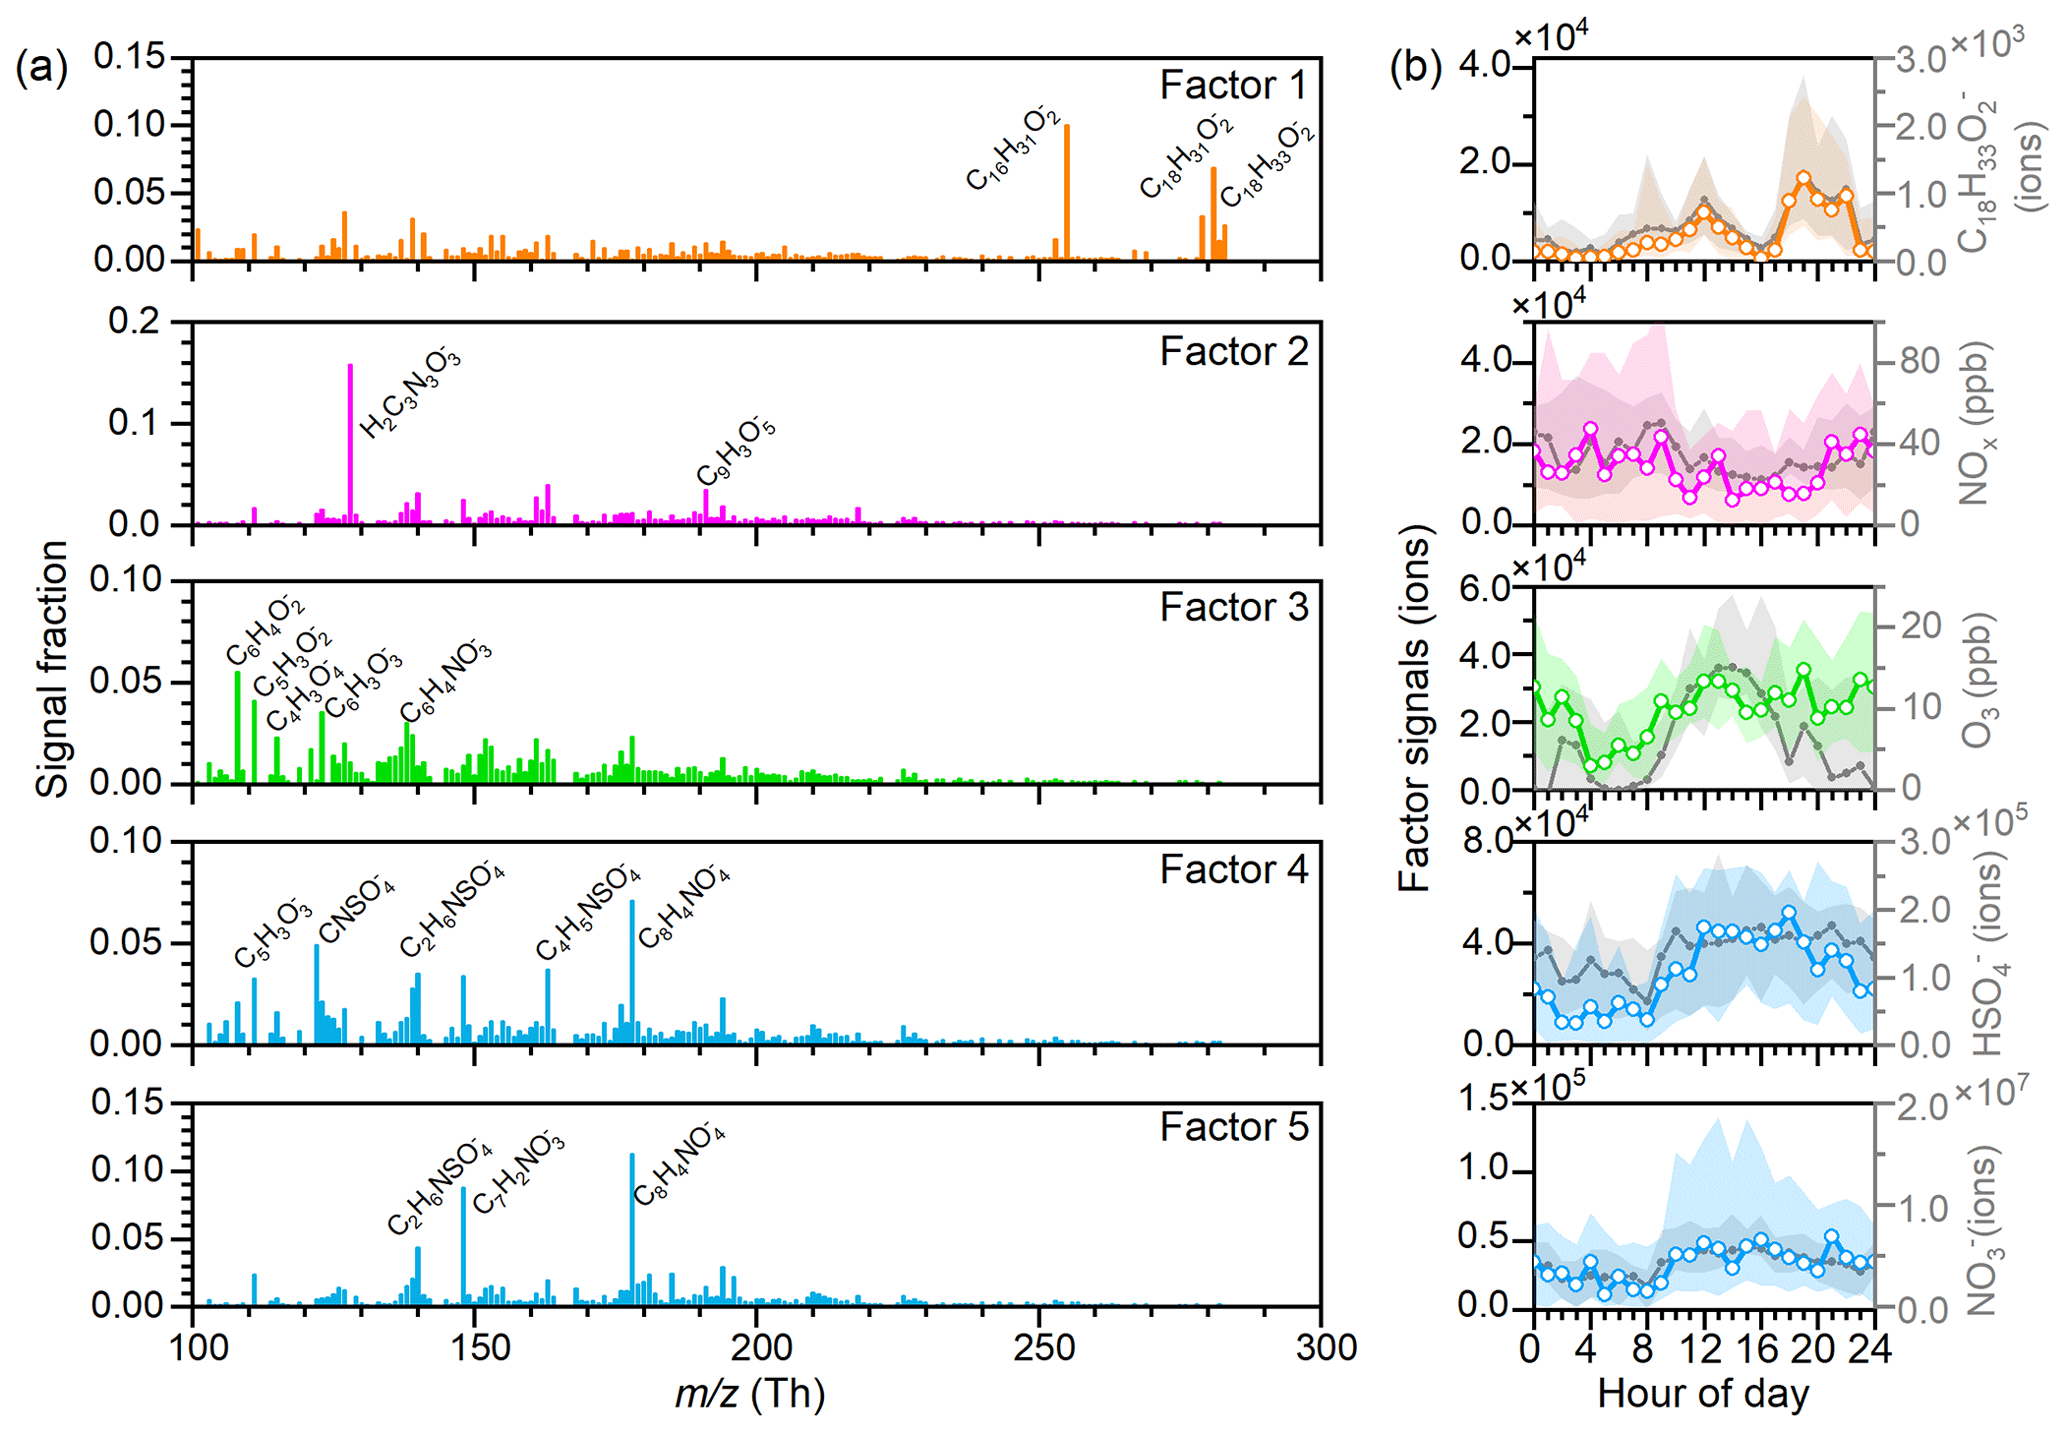
Figure 3Source apportionment of the UFP organic composition ( 100–300) measured by the TDCIMS in winter. (a) profiles of the five PMF factors and (b) diurnal variations of each factor and their related terms.
3.2 Sources of UFP organics and their seasonal variabilities
As organics are the main components of UFPs, PMF source apportionments were performed for the organic compounds. Five factors were identified in each season. The factor profiles and their diurnal variations in winter are shown in Fig. 3, and the results in other seasons are shown in Figs. S8–S10. The correlations between PMF factors and key UFP components, trace gases, meteorology parameters, and PM2.5 for the four seasons are shown in Fig. S11.
Factor 1 and factor 2 are identified as cooking-related and vehicle-related sources, respectively. Factor 1 is enriched in C16H31O, C18H31O, and C18H33O (assigned to deprotonated palmitic acid, linoleic acid, and oleic acids, respectively). Previous studies have revealed that saturated and unsaturated fatty acids are the major constituents in cooking emissions, accounting for 73 %–85 % of the cooking organic matter, among which palmitic acid and oleic acid can be treated as the unique fingerprints of atmospheric cooking particles (Zhao et al., 2007a, b). Factor 1 and the tracers show clear morning, midday, and evening peaks, corresponding to breakfast, lunch, and dinner times. Factor 2 is enriched in C3N3O3H (assigned to deprotonated cyanuric acid). Cyanuric acid was previously found with the biggest emission in the urea-based selective catalytic reduction (SCR) technology for the reduction of NOx from the exhaust of diesel-powered vehicles (Yassine et al., 2012). Factor 2 and the tracer show clear morning peaks, corresponding to the morning rush hour, consistent with the diurnal variation of NOx. These two factors are also identified in the other three seasons (Figs. S8–S10).
Besides these two primary sources, trace amounts of a biomass-burning tracer C6H9O (assigned to deprotonated levoglucosan) were also observed. However, its contribution to the total signal is small and could not be separated into individual factors in the PMF analysis. We thus conclude that the contribution of biomass burning to UFPs might be small in urban Beijing. This is understandable since the burning of high-polluting fuels has been phased out in urban Beijing by the People's Government of Beijing Municipality since 2014 (The People's Government of Beijing Municipality, 2014). Although large particles in urban Beijing could be influenced by biomass burning and coal combustion through transport from surrounding regions (Li et al., 2022b; Sun et al., 2015; Zhang et al., 2008, 2013), UFPs could hardly survive after long-distance transport due to their short lifetime.
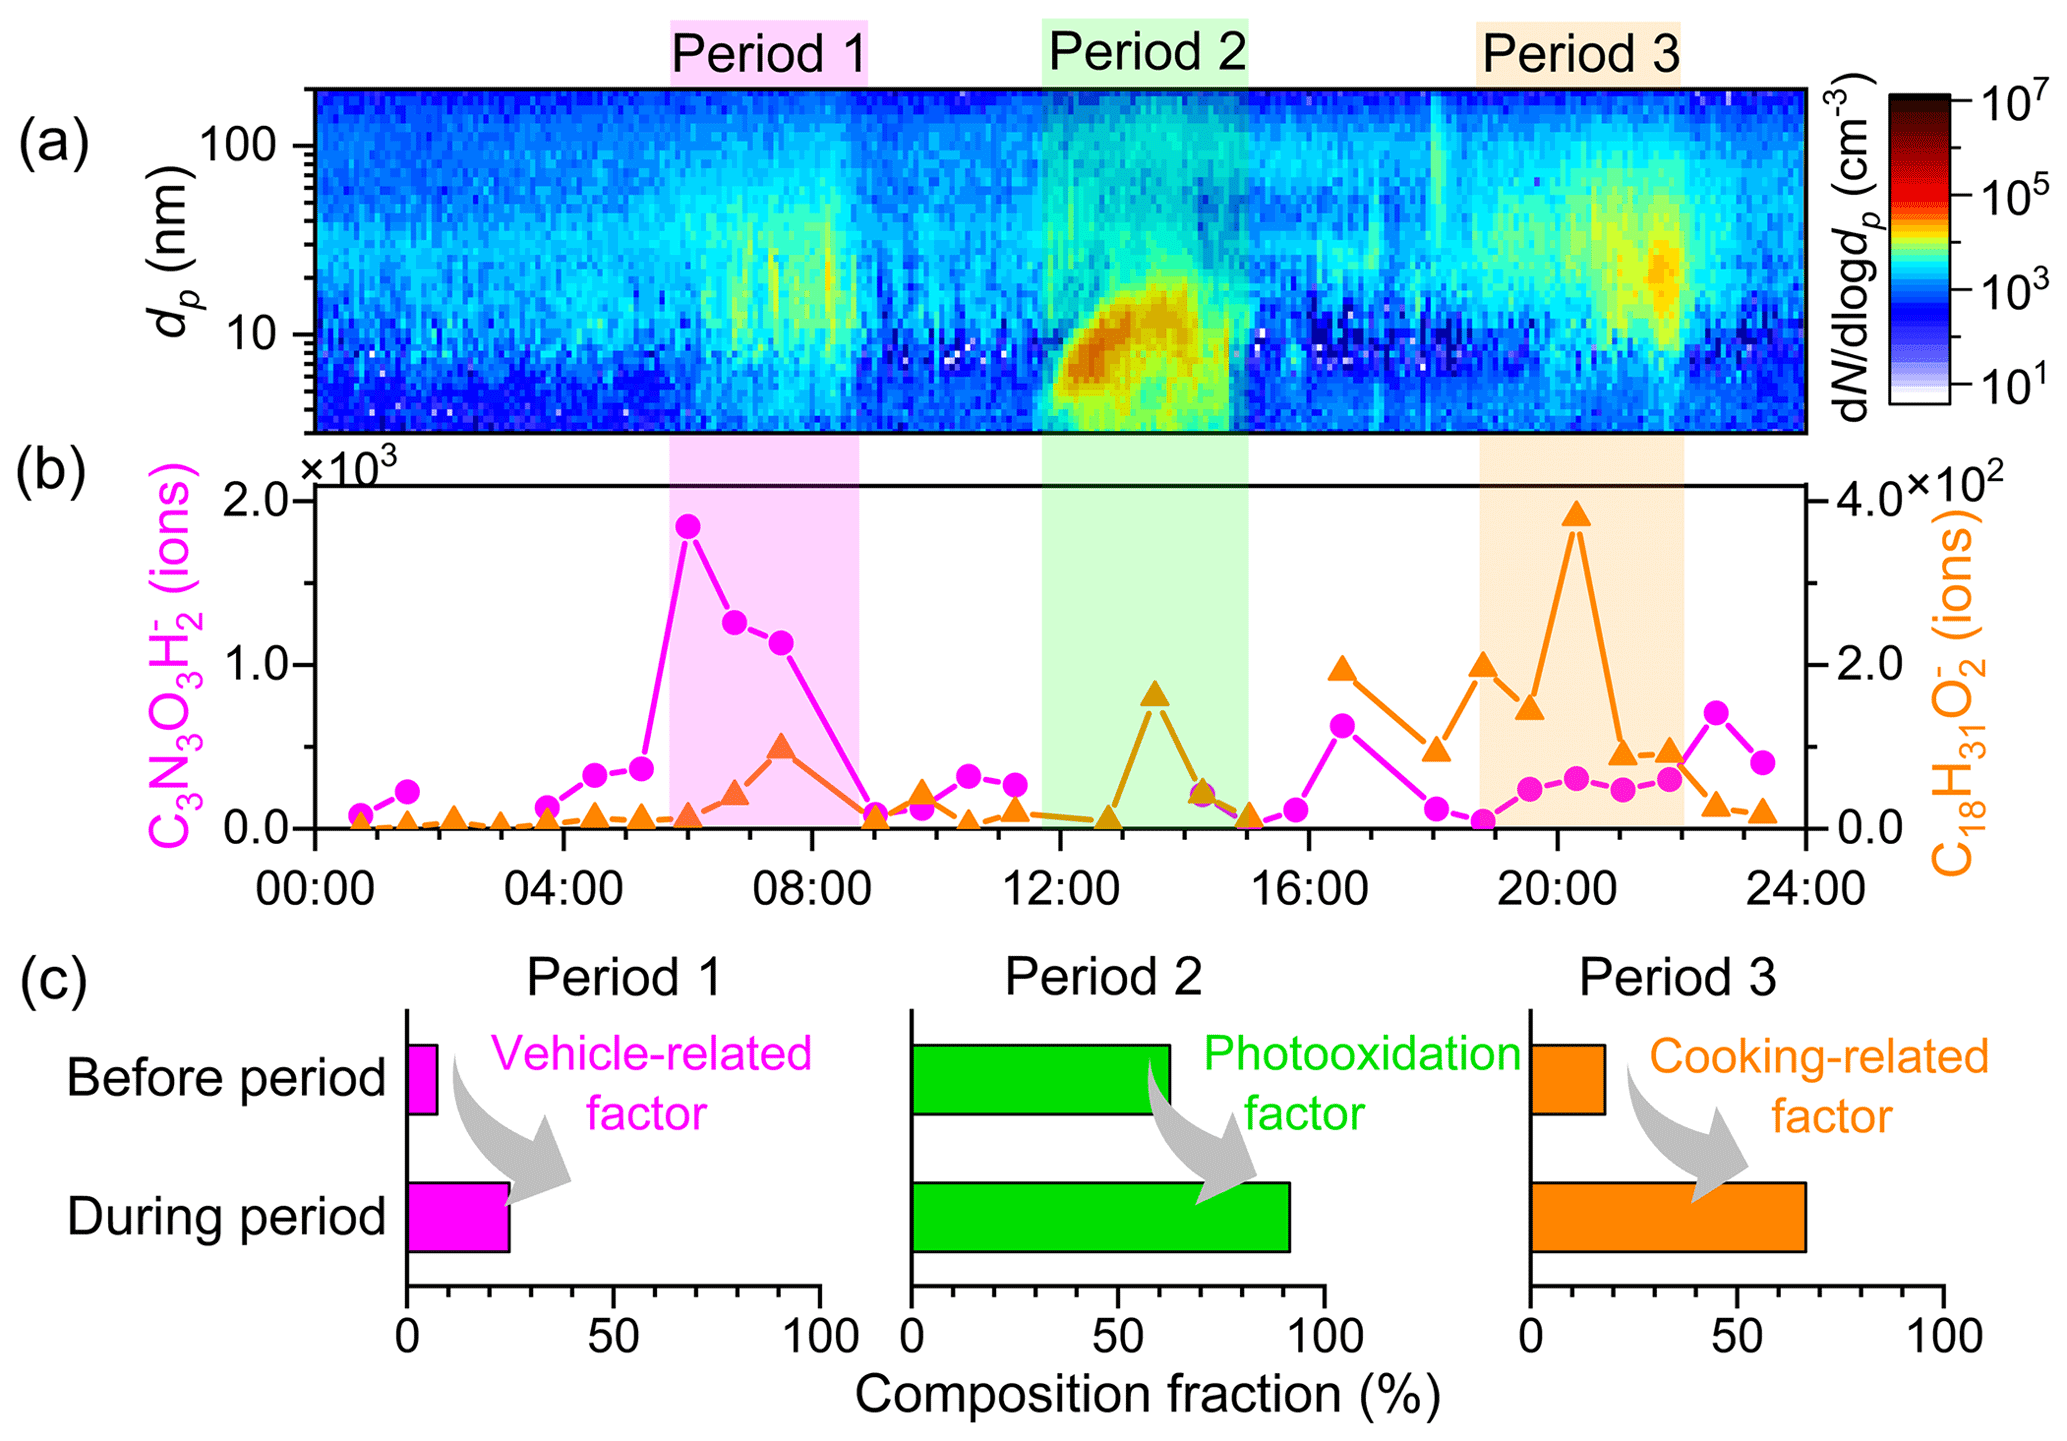
Figure 4The particle number size distributions (a) and UFP composition variability (b, c) on 16 April 2020. The three periods with the abrupt appearance of UFP particles on this day are identified as vehicle-related (period 1), NPF-related (period 2), and cooking-related (period 3) according to TDCIMS composition measurements.
Factors 3–5 are identified as secondary sources related to photooxidation formation or aqueous/heterogeneous formation. In winter (Fig. 3), factor 3 is enriched in slowly desorbed, low-volatility CHO organics and has daytime peaks at ∼ 12:00–18:00 LT, which is consistent with the diurnal variation of O3. They should come from gas-phase photooxidation followed by gas–particle partitioning. Factor 4 and factor 5 are enriched in N- or S-containing organics. Their time series and diurnal variability are highly correlated with sulfate, nitrate, PM2.5, and relative humidity, indicating the aqueous/heterogeneous formation pathway. Similarly, in spring and autumn, factor 3 is identified as a photooxidation factor that is enriched in CHO organics, and factors 4–5 are identified as aqueous/heterogeneous factors that are enriched in N- or S-containing organics (Figs. S8–S10). Differently, in summer, factor 4 is identified as a photooxidation factor.
Clear seasonal variability of the sources was observed, with the contribution of primary emission factors and aqueous/heterogeneous factors higher in winter and autumn and the contribution of photooxidation factors higher in summer (Fig. S11). The sum of cooking and vehicle sources contributed to 10 %–35 % of the total organic signals in the range of 100–300. The fractions of these primary emissions are higher in winter and autumn, possibly indicating higher emissions. Another possibility is that the oxidation degradation of these primary emissions is faster in summer and spring due to higher oxidants and ambient temperature. The contributions of photooxidation factors are 20 %–70 % of the total organic signals in the range of 100–300, with the highest in summer and lowest in winter. This is consistent with the highest CHO organic fractions in UFPs in summer in Fig. 1 and is attributed to the strongest solar radiation. The contributions of aqueous/heterogeneous sources are 15 %–60 % of the total organic signals in the range of 100–300, with the highest in winter and lowest in summer.
To identify the sources for UFP numbers, we further combined the source analysis with variation in particle size distributions. Among the identified four classes of composition sources, some are related to the increase of UFP number concentrations, while others are related to the increase of UFP diameters.
The increase in UFP numbers is usually accompanied by the enhanced contribution of cooking- or vehicle-related components or new particle formation events. An example is shown in Fig. 4, a relatively clean day with little interference from background aerosols. There are three periods where UFP bursts were observed. During period 1, i.e., 06:00–09:00 LT, a mode with a peak diameter at ∼20 nm appeared with a rapid increase in the vehicle tracer, C3N3O3H. Compared to that before period 1, the contribution of the vehicle-related factor increased from 7 % to 25 %. During period 2, i.e., 12:00–15:00 LT, new particle formation happens with a burst of particles at a peak diameter of 5–10 nm. Compared to that before period 2, the contribution of the photooxidation-related factor increased from 64 % to 92 %. This is consistent with our previous studies that slowly desorbed CHO organics were the most abundant compounds during NPF periods (Li et al., 2022a). During period 3, i.e., 18:00–22:00 LT, a mode with peak diameter at ∼30 nm bursts, with a rapid increase in the cooking tracer, C18H31O. C18H31O also has two minor peaks in the morning and midday, consistent with the cooking activities. Compared to that before period 3, the contribution of the cooking-related factor increased from 18 % to 67 %. Thus, we conclude that the increase in UFP numbers in the three periods is mainly attributed to the increase in vehicle emissions, new particle formation, and cooking emissions, respectively.
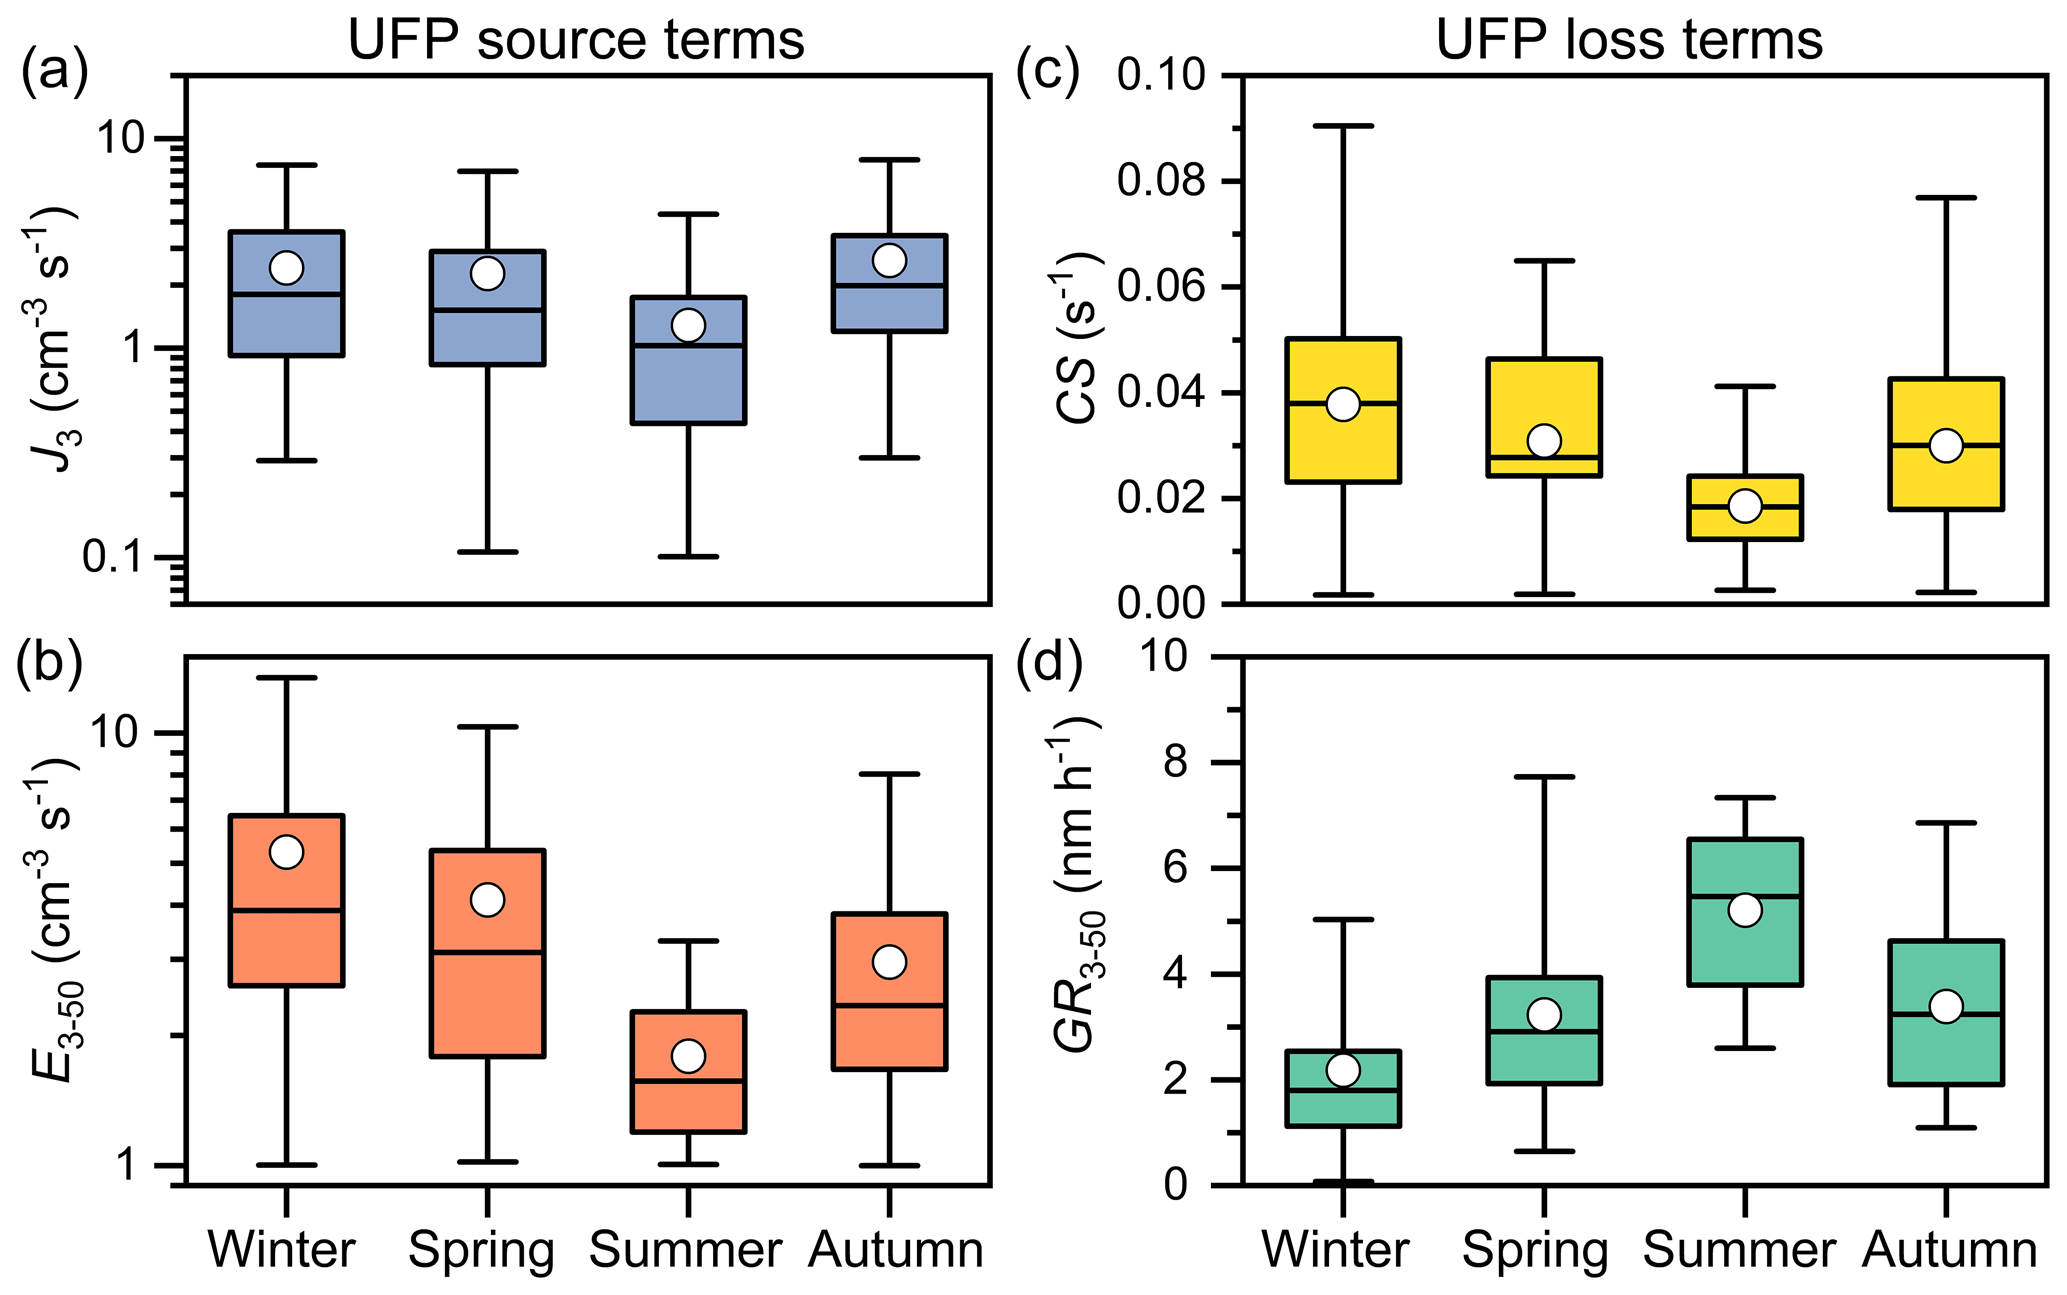
Figure 5Seasonal variations of the main source and loss terms of UFP number concentration. (a) New particle formation rates for 3 nm particles (J3), (b) daily average primary particle emission rates for 3–50 nm particles (E3–50) during 06:00–09:00 LT, (c) condensation sink (CS), and (d) growth rates for 3–50 nm particles (GR3–50) during new particle formation events using the mode fitting method.
The morning, midday, and evening peaks in UFP numbers were widely observed during the observation days in all four seasons. During non-NPF days, the UFP number concentration peak mainly appears in the morning and evening time, corresponding to the primary emissions, and we choose the morning periods to calculate the daily-averaged E. During NPF days, the UFP number peak mainly appears at midday, and the daily-averaged J was calculated during these periods. This further indicates that cooking emissions, vehicle emissions, and new particle formation are the main sources of UFP number concentrations.
Different from these three factors, the increased contribution of the aqueous/heterogeneous factor is not accompanied by the increase of UFP number concentrations but by the increase of UFP mode diameters. The contribution of the aqueous/heterogeneous factor to sub-50 nm particles is only ∼20 %. For example, on the day presented in Fig. 4, the aqueous/heterogeneous factor accounted less than ∼10 % for the three bursts of UFP number concentration. However, it starts to dominate the organic composition when UFP particles grow above 50 nm (Fig. S12), indicating an important role of aqueous/heterogeneous processes in the growth of particles larger than 50 nm in diameter.
3.3 Driving factors for the seasonal variability of UFPs
As we have identified the main sources for UFP number concentrations in Sect. 3.2, we can further address the reasons for the significant seasonal differences in UFP number concentrations as has been shown in Fig. 1, according to the variations in their sources and losses. The source terms mainly include new particle formation rates (here represented by J3) and primary emission rates (here represented by E3–50); the loss terms are presented by condensational growth rates (GR3–50) and coagulation sinks. Here, we apply the condensation sink (CS) to evaluate the strength of coagulation loss.
The main sources of the UFP number concentration, J3 and E3–50, are both higher in winter and lower in summer (Fig. 5a and b), which are presumably caused by temperature effects. The temperature effect on J3 is mainly due to the temperature-dependent cluster evaporation rates as reported in our previous study (Deng et al., 2020). This seasonal dependence of atmospheric UFPs attributed to vehicle emissions and its underlining reasons has not been revealed before. On the one hand, the low ambient temperature will largely increase the vehicle emission factors for particle numbers and gaseous hydrocarbons (Suarez-Bertoa and Astorga, 2018; Wen et al., 2021). On the other hand, a large fraction of the nanoparticles from vehicle emissions has been proposed to be formed by nucleation of the emitted hydrocarbon vapors or their oxidation products (Rönkkö and Timonen, 2019). The high ambient temperatures in summer may suppress the formation of these vehicle-related particles, just like they suppress J3 during ambient NPF.
The lowest GR of UFP occurs in winter (Fig. 5d), which further contributes to high wintertime UFP number concentrations. CS and GR3–50 have opposite trends, with CS being the highest in winter and GR3–50 being the highest in summer (Fig. 5c and d). The highest GR3–50 in summer is due to the highest condensable vapor concentrations in summer caused by strong solar radiation and high temperature, favoring the formation of condensable OOMs (Li et al., 2022a; Qiao et al., 2021). The theoretical condensational GRs by OOMs and H2SO4 for 20 nm particles are 1.1, 3.0, 4.0, and 1.8 nm h−1 in winter, spring, summer, and autumn, respectively, and they are close to GR3–50 derived during NPF events using the mode-fitting method as shown in Fig. 5d. Under the observed average GR3–50, the time needed for sub-3 nm particles to grow above 50 nm is the shortest in summer (∼9 h) and the longest in winter (∼24 h). Thus, the lower GR in winter also contributes to the highest UFP number concentrations in winter.
In this study, we explored the UFP composition and sources in typical polluted urban environments based on near-continuous measurements of UFP composition and size distributions in Beijing over four seasons. We observed that UFP composition varied with seasons and particle diameter, indicating their different sources. Specifically, photooxidation processes generate more CHO organics, leading to higher CHO fractions in summer, while aqueous/heterogeneous processes generate more N- and S-containing organics, leading to higher N- and S-containing organic fractions in above-50 nm particles than sub-50 nm particles. Combining the PMF analysis for UFP organics and the size distribution analysis, we found that vehicle and cooking emissions are two of the most important primary sources of UFP number concentrations in urban Beijing, while new particle formation is the most important secondary source of UFP number concentrations and increases the contribution of CHO organics to UFP composition. The aqueous/heterogeneous sources do not increase UFP number concentration but do increase UFP mode diameters and mass concentrations. For the seasonal variations, we found that UFP number concentrations are the highest in winter. This is mainly due to the highest primary particle emissions, the highest new particle formation rates, and the lowest particle growth rates in winter. Further controlling of UFPs in urban Beijing needs to focus on vehicle emissions and the gas precursors related to secondary sources of UFPs.
The observed distinct seasonal variabilities of UFP composition and their size dependence emphasize the importance of long-term and high-time-resolution measurements of both UFP composition and size distributions. This could provide valuable datasets for the evaluation of UFP's long-term exposure risks. The high-time-resolution measurements combined with PMF analysis can also help identify the secondary UFP sources, which contribute the major fraction of organic signals but could not be identified from previous offline UFP measurements. Further addressing the UFP composition and sources on the regional scale still requires measurements at sites with different distances from the emission sources due to the short lifetime of UFPs.
Data are available upon request from the corresponding authors.
The contents of the Supplement include the diurnal variations of E3–50 during non-NPF days over four seasons (Fig. S1); the diurnal variations of MLH, solar radiation, T, relative humidity (RH), O3, NOx, and PM2.5 in the four seasons (Fig. S2); details of the measured UFP composition during the four seasons (Fig. S3); seasonal variation of the UFP mass estimated from the TDCIMS and PSD (Fig. S4); the averaged thermal desorption profiles of different UFP composition (Fig. S5); the diurnal variation of CHO organics in the four seasons (Fig. S6); temperature dependence of some fast-desorbed UFP composition (Fig. S7); the spectra of five PMF factors during spring, summer, and autumn (Figs. S8–S10); a summary of PMF factors during the four seasons (Fig. S11); the contribution of different factors as a function of particle sizes (Fig. S12); and a summary of the sampling periods (Table S1). The supplement related to this article is available online at: https://doi.org/10.5194/acp-23-14801-2023-supplement.
XL, JJ, and JS designed the study. XL, YC, YYL, RC, YRL, CD, and JW participated in data collection and performed the data analysis. XL prepared the manuscript with contributions from all co-authors. All authors approved the final version of the manuscript.
At least one of the (co-)authors is a member of the editorial board of Atmospheric Chemistry and Physics. The peer-review process was guided by an independent editor, and the authors also have no other competing interests to declare.
Publisher's note: Copernicus Publications remains neutral with regard to jurisdictional claims made in the text, published maps, institutional affiliations, or any other geographical representation in this paper. While Copernicus Publications makes every effort to include appropriate place names, the final responsibility lies with the authors.
The authors gratefully acknowledge the support of the research teams in the AHL/BUCT laboratory.
This research has been supported by the National Natural Science Foundation of China (grant nos. 22188102 and 22106083), the National Science Foundation (grant no. CHE-2004066), and the US Department of Energy (grant no. DE-SC0021208).
This paper was edited by Dara Salcedo and reviewed by two anonymous referees.
Cabada, J. C., Rees, S., Takahama, S., Khlystov, A., Pandis, S. N., Davidson, C. I., and Robinson, A. L.: Mass size distributions and size resolved chemical composition of fine particulate matter at the Pittsburgh supersite, Atmos. Environ., 38, 3127–3141, https://doi.org/10.1016/j.atmosenv.2004.03.004, 2004.
Cai, R. and Jiang, J.: A new balance formula to estimate new particle formation rate: reevaluating the effect of coagulation scavenging, Atmos. Chem. Phys., 17, 12659–12675, https://doi.org/10.5194/acp-17-12659-2017, 2017.
Cai, R., Yang, D., Fu, Y., Wang, X., Li, X., Ma, Y., Hao, J., Zheng, J., and Jiang, J.: Aerosol surface area concentration: a governing factor in new particle formation in Beijing, Atmos. Chem. Phys., 17, 12327–12340, https://doi.org/10.5194/acp-17-12327-2017, 2017.
Cai, R., Chandra, I., Yang, D., Yao, L., Fu, Y., Li, X., Lu, Y., Luo, L., Hao, J., Ma, Y., Wang, L., Zheng, J., Seto, T., and Jiang, J.: Estimating the influence of transport on aerosol size distributions during new particle formation events, Atmos. Chem. Phys., 18, 16587–16599, https://doi.org/10.5194/acp-18-16587-2018, 2018.
Canonaco, F., Crippa, M., Slowik, J. G., Baltensperger, U., and Prévôt, A. S. H.: SoFi, an IGOR-based interface for the efficient use of the generalized multilinear engine (ME-2) for the source apportionment: ME-2 application to aerosol mass spectrometer data, Atmos. Meas. Tech., 6, 3649–3661, https://doi.org/10.5194/amt-6-3649-2013, 2013.
Cass, G. R., Hughes, L. A., Bhave, P., Kleeman, M. J., Allen, J. O., and Salmon, L. G.: The chemical composition of atmospheric ultrafine particles, Philos. T. Roy. Soc.f Lond. A, 358, 2581–2592, https://doi.org/10.1098/rsta.2000.0670, 2000.
Deng, C., Fu, Y., Dada, L., Yan, C., Cai, R., Yang, D., Zhou, Y., Yin, R., Lu, Y., Li, X., Qiao, X., Fan, X., Nie, W., Kontkanen, J., Kangasluoma, J., Chu, B., Ding, A., Kerminen, V.-M., Paasonen, P., Worsnop, D. R., Bianchi, F., Liu, Y., Zheng, J., Wang, L., Kulmala, M., and Jiang, J.: Seasonal Characteristics of New Particle Formation and Growth in Urban Beijing, Environ. Sci. Technol., 54, 8547–8557, https://doi.org/10.1021/acs.est.0c00808, 2020.
Eresmaa, N., Harkonen, J., Joffre, S. M., Schultz, D. M., Karppinen, A., and Kukkonen, J.: A Three-Step Method for Estimating the Mixing Height Using Ceilometer Data from the Helsinki Testbed, J. Appl. Meteorol. Clim., 51, 2172–2187, https://doi.org/10.1175/jamc-d-12-058.1, 2012.
Glicker, H. S., Lawler, M. J., Ortega, J., de Sá, S. S., Martin, S. T., Artaxo, P., Vega Bustillos, O., de Souza, R., Tota, J., Carlton, A., and Smith, J. N.: Chemical composition of ultrafine aerosol particles in central Amazonia during the wet season, Atmos. Chem. Phys., 19, 13053–13066, https://doi.org/10.5194/acp-19-13053-2019, 2019.
Ham, W. A. and Kleeman, M. J.: Size-resolved source apportionment of carbonaceous particulate matter in urban and rural sites in central California, Atmos. Environ., 45, 3988–3995, https://doi.org/10.1016/j.atmosenv.2011.04.063, 2011.
HEI: Understanding the Health Effects of Ambient Ultrafine Particles: https://www.healtheffects.org/publication/understanding-health-effects-ambient-ultrafine-particles (last access: 26 January 2019), 2013.
Herner, J. D., Aw, J., Gao, O., Chang, D. P., and Kleeman, M. J.: Size and composition distribution of airborne particulate matter in northern California: I – particulate mass, carbon, and water-soluble ions, J. Air Waste Manage., 55, 30–51, https://doi.org/10.1080/10473289.2005.10464600, 2005.
Hu, W., Hu, M., Hu, W.-W., Zheng, J., Chen, C., Wu, Y., and Guo, S.: Seasonal variations in high time-resolved chemical compositions, sources, and evolution of atmospheric submicron aerosols in the megacity Beijing, Atmos. Chem. Phys., 17, 9979–10000, https://doi.org/10.5194/acp-17-9979-2017, 2017.
Kleeman, M. J., Riddle, S. G., Robert, M. A., Jakober, C. A., Fine, P. M., Hays, M. D., Schauer, J. J., and Hannigan, M. P.: Source Apportionment of Fine (PM1.8) and Ultrafine (PM0.1) Airborne Particulate Matter during a Severe Winter Pollution Episode, Environ. Sci. Technol., 43, 272–279, https://doi.org/10.1021/es800400m, 2009.
Kontkanen, J., Deng, C., Fu, Y., Dada, L., Zhou, Y., Cai, J., Daellenbach, K. R., Hakala, S., Kokkonen, T. V., Lin, Z., Liu, Y., Wang, Y., Yan, C., Petäjä, T., Jiang, J., Kulmala, M., and Paasonen, P.: Size-resolved particle number emissions in Beijing determined from measured particle size distributions, Atmos. Chem. Phys., 20, 11329–11348, https://doi.org/10.5194/acp-20-11329-2020, 2020.
Kulmala, M., Vehkamäki, H., Petäjä, T., Dal Maso, M., Lauri, A., Kerminen, V. M., Birmili, W., and McMurry, P. H.: Formation and growth rates of ultrafine atmospheric particles: a review of observations, J. Aerosol Sci., 35, 143–176, https://doi.org/10.1016/j.jaerosci.2003.10.003, 2004.
Lawler, M. J., Whitehead, J., O'Dowd, C., Monahan, C., McFiggans, G., and Smith, J. N.: Composition of 15–85 nm particles in marine air, Atmos. Chem. Phys., 14, 11557–11569, https://doi.org/10.5194/acp-14-11557-2014, 2014.
Lawler, M. J., Rissanen, M. P., Ehn, M., Mauldin, R. L., Sarnela, N., Sipilä, M., and Smith, J. N.: Evidence for Diverse Biogeochemical Drivers of Boreal Forest New Particle Formation, Geophys. Res. Lett., 45, 2038–2046, https://doi.org/10.1002/2017GL076394, 2018.
Lawler, M. J., Draper, D. C., and Smith, J. N.: Atmospheric fungal nanoparticle bursts, Sci. Adv., 6, eaax9051, https://doi.org/10.1126/sciadv.aax9051, 2020.
Lawler, M. J., Saltzman, E. S., Karlsson, L., Zieger, P., Salter, M., Baccarini, A., Schmale, J., and Leck, C.: New Insights Into the Composition and Origins of Ultrafine Aerosol in the Summertime High Arctic, Geophys. Res. Lett., 48, e2021GL094395, https://doi.org/10.1029/2021gl094395, 2021.
Li, H., Zhong, J., Vehkamaki, H., Kurten, T., Wang, W., Ge, M., Zhang, S., Li, Z., Zhang, X., Francisco, J. S., and Zeng, X. C.: Self-Catalytic Reaction of SO3 and NH3 To Produce Sulfamic Acid and Its Implication to Atmospheric Particle Formation, J. Am. Chem. Soc., 140, 11020–11028, https://doi.org/10.1021/jacs.8b04928, 2018.
Li, X., Zhao, B., Zhou, W., Shi, H., Yin, R., Cai, R., Yang, D., Dallenbach, K., Deng, C., Fu, Y., Qiao, X., Wang, L., Liu, Y., Yan, C., Kulmala, M., Zheng, J., Hao, J., Wang, S., and Jiang, J.: Responses of gaseous sulfuric acid and particulate sulfate to reduced SO2 concentration: A perspective from long-term measurements in Beijing, Sci. Total Environ., 721, 137700, https://doi.org/10.1016/j.scitotenv.2020.137700, 2020.
Li, X., Li, Y., Lawler, M. J., Hao, J., Smith, J. N., and Jiang, J.: Composition of Ultrafine Particles in Urban Beijing: Measurement Using a Thermal Desorption Chemical Ionization Mass Spectrometer, Environ. Sci. Technol., 55, 2859–2868, https://doi.org/10.1021/acs.est.0c06053, 2021.
Li, X., Li, Y., Cai, R., Yan, C., Qiao, X., Guo, Y., Deng, C., Yin, R., Chen, Y., Li, Y., Yao, L., Sarnela, N., Zhang, Y., Petäjä, T., Bianchi, F., Liu, Y., Kulmala, M., Hao, J., Smith, J. N., and Jiang, J.: Insufficient Condensable Organic Vapors Lead to Slow Growth of New Particles in an Urban Environment, Environ. Sci. Technol., 55, 9936–9946, https://doi.org/10.1021/acs.est.2c01566, 2022a.
Li, X., Sun, N., Jin, Q., Zhao, Z., Wang, L., Wang, Q., Gu, X., Li, Y., and Liu, X.: Light absorption properties of black and brown carbon in winter over the North China Plain: Impacts of regional biomass burning, Atmos. Environ., 278, 119100, https://doi.org/10.1016/j.atmosenv.2022.119100, 2022b.
Liu, Y., Yan, C., Feng, Z., Zheng, F., Fan, X., Zhang, Y., Li, C., Zhou, Y., Lin, Z., Guo, Y., Zhang, Y., Ma, L., Zhou, W., Liu, Z., Dada, L., Daellenbach, K., Kontkanen, J., Cai, R., Chan, T., and Kulmala, M.: Continuous and comprehensive atmospheric observations in Beijing: a station to understand the complex urban atmospheric environment, Big Earth Data, 4, 295–321, https://doi.org/10.1080/20964471.2020.1798707, 2020.
Ma, J., Ungeheuer, F., Zheng, F., Du, W., Wang, Y., Cai, J., Zhou, Y., Yan, C., Liu, Y., Kulmala, M., Daellenbach, K. R., and Vogel, A. L.: Nontarget Screening Exhibits a Seasonal Cycle of PM2.5 Organic Aerosol Composition in Beijing, Environ. Sci. Technol., 56, 7017–7028, https://doi.org/10.1021/acs.est.1c06905, 2022.
Massling, A., Stock, M., Wehner, B., Wu, Z. J., Hu, M., Brueggemann, E., Gnauk, T., Herrmann, H., and Wiedensohler, A.: Size segregated water uptake of the urban submicrometer aerosol in Beijing, Atmos. Environ., 43, 1578–1589, https://doi.org/10.1016/j.atmosenv.2008.06.003, 2009.
Oberdorster, G., Oberdorster, E., and Oberdorster, J.: Nanotoxicology: an emerging discipline evolving from studies of ultrafine particles, Environ. Health Perspect., 113, 823–839, https://doi.org/10.1289/ehp.7339, 2005.
Ohlwein, S., Kappeler, R., Kutlar Joss, M., Kunzli, N., and Hoffmann, B.: Health effects of ultrafine particles: a systematic literature review update of epidemiological evidence, Int. J. Publ. Health, 64, 547–559, https://doi.org/10.1007/s00038-019-01202-7, 2019.
Pierce, J. R. and Adams, P. J.: Efficiency of cloud condensation nuclei formation from ultrafine particles, Atmos. Chem. Phys., 7, 1367–1379, https://doi.org/10.5194/acp-7-1367-2007, 2007.
Qiao, X., Yan, C., Li, X., Guo, Y., Yin, R., Deng, C., Li, C., Nie, W., Wang, M., Cai, R., Huang, D., Wang, Z., Yao, L., Worsnop, D. R., Bianchi, F., Liu, Y., Donahue, N. M., Kulmala, M., and Jiang, J.: Contribution of Atmospheric Oxygenated Organic Compounds to Particle Growth in an Urban Environment, Environ. Sci. Technol., 55, 13646–13656, https://doi.org/10.1021/acs.est.1c02095, 2021.
Rönkkö, T., and Timonen, H.: Overview of Sources and Characteristics of Nanoparticles i Urban Traffic-Influenced Areas, J. Alzheim. Dis., 72, 1–14, https://doi.org/10.3233/JAD-190170, 2019.
Sarkar, S., Oram, B. K., and Bandyopadhyay, B.: Influence of Ammonia and Water on the Fate of Sulfur Trioxide in the Troposphere: Theoretical Investigation of Sulfamic Acid and Sulfuric Acid Formation Pathways, J. Phys. Chem. A, 123, 3131–3141, https://doi.org/10.1021/acs.jpca.8b09306, 2019.
Smith, J. N., Moore, K. F., McMurry, P. H., and Eisele, F. L.: Atmospheric measurements of sub-20 nm diameter particle chemical composition by thermal desorption chemical ionization mass spectrometry, Aerosol Sci. Tech., 38, 100–110, https://doi.org/10.1080/02786820490249036, 2004.
Smith, J. N., Moore, K. F., Eisele, F. L., Voisin, D., Ghimire, A. K., Sakurai, H., and McMurry, P. H.: Chemical composition of atmospheric nanoparticles during nucleation events in Atlanta, J. Geophys. Res.-Atmos., 110, D22S03, https://doi.org/10.1029/2005jd005912, 2005.
Smith, J. N., Dunn, M. J., VanReken, T. M., Iida, K., Stolzenburg, M. R., McMurry, P. H., and Huey, L. G.: Chemical composition of atmospheric nanoparticles formed from nucleation in Tecamac, Mexico: Evidence for an important role for organic species in nanoparticle growth, Geophys. Res. Lett., 35, L4808, https://doi.org/10.1029/2007gl032523, 2008.
Smith, J. N., Barsanti, K. C., Friedli, H. R., Ehn, M., Kulmala, M., Collins, D. R., Scheckman, J. H., Williams, B. J., and McMurry, P. H.: Observations of aminium salts in atmospheric nanoparticles and possible climatic implications, P. Natl. Acad. Sci. USA, 107, 6634–6639, https://doi.org/10.1073/pnas.0912127107, 2010.
Suarez-Bertoa, R. and Astorga, C.: Impact of cold temperature on Euro 6 passenger car emissions, Environ. Pollut., 234, 318–329, https://doi.org/10.1016/j.envpol.2017.10.096, 2018.
Sun, Y., Xu, W., Zhang, Q., Jiang, Q., Canonaco, F., Prévôt, A. S. H., Fu, P., Li, J., Jayne, J., Worsnop, D. R., and Wang, Z.: Source apportionment of organic aerosol from 2-year highly time-resolved measurements by an aerosol chemical speciation monitor in Beijing, China, Atmos. Chem. Phys., 18, 8469–8489, https://doi.org/10.5194/acp-18-8469-2018, 2018.
Sun, Y. L., Wang, Z. F., Du, W., Zhang, Q., Wang, Q. Q., Fu, P. Q., Pan, X. L., Li, J., Jayne, J., and Worsnop, D. R.: Long-term real-time measurements of aerosol particle composition in Beijing, China: seasonal variations, meteorological effects, and source analysis, Atmos. Chem. Phys., 15, 10149–10165, https://doi.org/10.5194/acp-15-10149-2015, 2015.
The People's Government of Beijing Municipality: The implementation of forbidden area for high-polluting fuels in Beijing, http://www.beijing.gov.cn/zhengce/zfwj/zfwj/szfwj/201905/t20190523_72669.html (last access: 23 November 2023), 2014.
Wen, Y., Zhang, S., He, L., Yang, S., Wu, X., and Wu, Y.: Characterizing start emissions of gasoline vehicles and the seasonal, diurnal and spatial variabilities in China, Atmos. Environ., 245, 118040, https://doi.org/10.1016/j.atmosenv.2020.118040, 2021.
WHO – World Health Organisation: WHO global air quality guidelines: particulate matter (PM2.5 and PM10), ozone, nitrogen dioxide, sulfur dioxide and carbon monoxide, https://apps.who.int/iris/bitstream/handle/10665/345329/9789240034228-eng.pdf (last access: 23 November 2023), 2021.
Winkler, P. M., Ortega, J., Karl, T., Cappellin, L., Friedli, H. R., Barsanti, K., McMurry, P. H., and Smith, J. N.: Identification of the biogenic compounds responsible for size-dependent nanoparticle growth, Geophys. Res. Lett., 39, L20815, https://doi.org/10.1029/2012gl053253, 2012.
Wu, Z., Hu, M., Liu, S., Wehner, B., Bauer, S., Ma ßling, A., Wiedensohler, A., Petäjä, T., Dal Maso, M., and Kulmala, M.: New particle formation in Beijing, China: Statistical analysis of a 1-year data set, J. Geophys. Res., 112, D09209, https://doi.org/10.1029/2006jd007406, 2007.
Xu, S., Ren, L., Lang, Y., Hou, S., Ren, H., Wei, L., Wu, L., Deng, J., Hu, W., Pan, X., Sun, Y., Wang, Z., Su, H., Cheng, Y., and Fu, P.: Molecular markers of biomass burning and primary biological aerosols in urban Beijing: size distribution and seasonal variation, Atmos. Chem. Phys., 20, 3623–3644, https://doi.org/10.5194/acp-20-3623-2020, 2020.
Xue, J., Xue, W., Sowlat, M. H., Sioutas, C., Lolinco, A., Hasson, A., and Kleeman, M. J.: Seasonal and Annual Source Appointment of Carbonaceous Ultrafine Particulate Matter (PM0.1) in Polluted California Cities, Environ. Sci. Technol., 53, 39–49, https://doi.org/10.1021/acs.est.8b04404, 2019.
Xue, W., Xue, J., Mousavi, A., Sioutas, C., and Kleeman, M. J.: Positive matrix factorization of ultrafine particle mass (PM0.1) at three sites in California, Sci. Total Environ., 715, 136902, https://doi.org/10.1016/j.scitotenv.2020.136902, 2020a.
Xue, W., Xue, J., Shirmohammadi, F., Sioutas, C., Lolinco, A., Hasson, A., and Kleeman, M. J.: Day-of-week patterns for ultrafine particulate matter components at four sites in California, Atmos. Environ., 222, 117088, https://doi.org/10.1016/j.atmosenv.2019.117088, 2020b.
Yan, C., Nie, W., Vogel, A. L., Dada, L., Lehtipalo, K., Stolzenburg, D., Wagner, R., Rissanen, M. P., Xiao, M., Ahonen, L., Fischer, L., Rose, C., Bianchi, F., Gordon, H., Simon, M., Heinritzi, M., Garmash, O., Roldin, P., Dias, A., Ye, P., Hofbauer, V., Amorim, A., Bauer, P. S., Bergen, A., Bernhammer, A. K., Breitenlechner, M., Brilke, S., Buchholz, A., Mazon, S. B., Canagaratna, M. R., Chen, X., Ding, A., Dommen, J., Draper, D. C., Duplissy, J., Frege, C., Heyn, C., Guida, R., Hakala, J., Heikkinen, L., Hoyle, C. R., Jokinen, T., Kangasluoma, J., Kirkby, J., Kontkanen, J., Kuerten, A., Lawler, M. J., Mai, H., Mathot, S., Mauldin III, R. L., Molteni, U., Nichman, L., Nieminen, T., Nowak, J., Ojdanic, A., Onnela, A., Pajunoja, A., Petaja, T., Piel, F., Quelever, L. L. J., Sarnela, N., Schallhart, S., Sengupta, K., Sipila, M., Tome, A., Troestl, J., Vaisanen, O., Wagner, A. C., Ylisirnio, A., Zha, Q., Baltensperger, U., Carslaw, K. S., Curtius, J., Flagan, R. C., Hansel, A., Riipinen, I., Smith, J. N., Virtanen, A., Winkler, P. M., Donahue, N. M., Kerminen, V. M., Kulmala, M., Ehn, M., and Worsnop, D. R.: Size-dependent influence of NOx on the growth rates of organic aerosol particles, Sci. Adv., 6, eaay4945, https://doi.org/10.1126/sciadv.aay4945, 2020.
Yassine, M. M., Dabek-Zlotorzynska, E., and Celo, V.: Development of a hydrophilic interaction liquid chromatography-mass spectrometry method for detection and quantification of urea thermal decomposition by-products in emission from diesel engine employing selective catalytic reduction technology, J. Chromatogr A, 1229, 208–215, https://doi.org/10.1016/j.chroma.2012.01.046, 2012.
Ye, Q., Wang, M., Hofbauer, V., Stolzenburg, D., Chen, D., Schervish, M., Vogel, A., Mauldin, R. L., Baalbaki, R., Brilke, S., Dada, L., Dias, A., Duplissy, J., El Haddad, I., Finkenzeller, H., Fischer, L., He, X., Kim, C., Kuerten, A., Lamkaddam, H., Lee, C. P., Lehtipalo, K., Leiminger, M., Manninen, H. E., Marten, R., Mentler, B., Partoll, E., Petaja, T., Rissanen, M., Schobesberger, S., Schuchmann, S., Simon, M., Tham, Y. J., Vazquez-Pufleau, M., Wagner, A. C., Wang, Y., Wu, Y., Xiao, M., Baltensperger, U., Curtius, J., Flagan, R., Kirkby, J., Kulmala, M., Volkamer, R., Winkler, P. M., Worsnop, D., and Donahue, N. M.: Molecular Composition and Volatility of Nucleated Particles from alpha-Pinene Oxidation between −50 degrees C and +25 degrees C, Environ. Sci. Technol., 53, 12357–12365, https://doi.org/10.1021/acs.est.9b03265, 2019.
Zhang, R., Jing, J., Tao, J., Hsu, S. C., Wang, G., Cao, J., Lee, C. S. L., Zhu, L., Chen, Z., Zhao, Y., and Shen, Z.: Chemical characterization and source apportionment of PM2.5 in Beijing: seasonal perspective, Atmos. Chem. Phys., 13, 7053–7074, https://doi.org/10.5194/acp-13-7053-2013, 2013.
Zhang, T., Claeys, M., Cachier, H., Dong, S., Wang, W., Maenhaut, W., and Liu, X.: Identification and estimation of the biomass burning contribution to Beijing aerosol using levoglucosan as a molecular marker, Atmos. Environ., 42, 7013–7021, https://doi.org/10.1016/j.atmosenv.2008.04.050, 2008.
Zhao, P., Chen, Y., and Su, J.: Size-resolved carbonaceous components and water-soluble ions measurements of ambient aerosol in Beijing, J. Environ. Sci., 54, 298–313, https://doi.org/10.1016/j.jes.2016.08.027, 2017.
Zhao, Y., Hu, M., Slanina, S., and Zhang, Y.: The molecular distribution of fine particulate organic matter emitted from Western-style fast food cooking, Atmos. Environ., 41, 8163–8171, https://doi.org/10.1016/j.atmosenv.2007.06.029, 2007a.
Zhao, Y., Hu, M., Slanina, S., and Zhang, Y.: Chemical compositions of fine particulate organic matter emitted from Chinese cooking, Environ. Sci. Technol., 41, 99–105, https://doi.org/10.1021/es0614518, 2007b.