the Creative Commons Attribution 4.0 License.
the Creative Commons Attribution 4.0 License.
 | 20 Nov 2023
Increased importance of aerosol–cloud interactions for surface PM2.5 pollution relative to aerosol–radiation interactions in China with the anthropogenic emission reductions
Da Gao
Shuxiao Wang
Yuan Wang
Brian Gaudet
Yun Zhu
Xiaochun Wang
Jiewen Shen
Shengyue Li
Yicong He
Dejia Yin
Zhaoxin Dong
Surface fine particulate matter (PM2.5) pollution can be enhanced by feedback processes induced by aerosol–radiation interactions (ARIs) and aerosol–cloud interactions (ACIs). Many previous studies have reported enhanced PM2.5 concentrations induced by ARIs and ACIs for episodic events in China. However, few studies have examined the changes in the ARI- and ACI-induced PM2.5 enhancements over a long period, though the anthropogenic emissions have changed substantially in the last decade. In this study, we quantify the ARI- and ACI-induced PM2.5 changes for 2013–2021 under different meteorology and emission scenarios using the Weather Research and Forecasting model with Chemistry (WRF-Chem), and we investigate the driving factors behind the changes. Our results show that, in January 2013, when China suffered from the worst PM2.5 pollution, the PM2.5 enhancement induced by ARIs in eastern China (5.59 µg m−3) was larger than that induced by ACIs (3.96 µg m−3). However, the ACI-induced PM2.5 enhancement showed a significantly smaller decrease ratio (51 %) than the ARI-induced enhancement (75 %) for 2013–2021, making ACIs more important for enhancing PM2.5 concentrations in January 2021. Our analyses suggest that the anthropogenic emission reductions played a key role in this shift. Owing to only anthropogenic emission reductions, the ACI-induced PM2.5 enhancement decreased by 43 % in January, which was lower than the decrease ratio of the ARI-induced enhancement (57 %). The relative change in ARI- and ACI-induced PM2.5 enhancement in July was similar to the pattern observed in January, caused by anthropogenic emission reductions. The primary reason for this phenomenon is that the decrease in ambient PM2.5 for 2013–2021 caused a disproportionately small decrease in the liquid water path (LWP) and an increase in the cloud effective radius (Re) under the condition of high PM2.5 concentrations. Therefore, the surface solar radiation attenuation (and, hence, the boundary layer height reduction) caused by ACIs decreased slower than that caused by ARIs. Moreover, the lower decrease ratio of the ACI-induced PM2.5 enhancement was dominated by the lower decrease ratio of ACI-induced secondary PM2.5 component enhancement, which was additionally caused by the smaller decrease ratio of the air temperature reduction and the relative humidity (RH) increase. Our findings indicate that, with the decrease in ambient PM2.5, the ACI-induced PM2.5 enhancement inevitably becomes more important. This needs to be considered in the formulation of control policies to meet the national PM2.5 air quality standard.
- Article
(5306 KB) - Full-text XML
-
Supplement
(1757 KB) - BibTeX
- EndNote


Aerosol–radiation interactions (ARIs) and aerosol–cloud interactions (ACIs) are important ways for aerosols to influence the climate (Rosenfeld et al., 2014; Seinfeld et al., 2016; Liu et al., 2018; Bellouin et al., 2020; Forster et al., 2021). The ARI represents the direct scattering and absorption of solar and infrared radiation by atmospheric aerosols; the ACI denotes the modification effects of atmospheric aerosols on the lifetime and the physical and optical properties of clouds.
Previous studies have documented that both ARIs and ACIs make important contributions to inhibiting the planetary boundary layer height (PBLH), cooling the near-surface air temperature, and increasing the relative humidity (RH) (Wang et al., 2014; Ding et al., 2016; Liu et al., 2018). Moreover, ACIs make contributions to changing precipitation and cloud chemistry (Zhao et al., 2017; Zhang et al., 2018). These feedbacks and changes are mostly conducive to increasing the haze severity (Wang et al., 2015; Zhang et al., 2018; Liu et al., 2018; Zhou et al., 2019; Zhang et al., 2020; Xiong et al., 2022; Lin, 2022). So far, numerous studies have evaluated the fine particulate matter (PM2.5) enhancements caused by the decreases in downward shortwave radiation at the surface (SWDOWN), the PBLH, near-surface air temperature, precipitation, and increases in RH, especially during severe PM2.5 pollution in China (Le et al., 2020). B. Zhang et al. (2015) and X. Zhang et al. (2018) quantified that the ARIs caused the PM2.5 increases of 8.3 µg m−3 in 2013 and 4.0 µg m−3 in 2014. However, both positive and negative contributions of ACIs to PM2.5 have been revealed (Forkel et al., 2012, 2015; Kong et al., 2015; B. Zhang et al., 2015; X. Zhang et al., 2018). Zhao et al. (2017) pointed out that the negative contribution of ACIs shown in some studies (Gustafson et al., 2007; Gong et al., 2015) is due to the relatively high prescribed values of cloud droplet number concentration (CDNC) or cloud condensation nuclei (CCN), which could not represent a rather clean condition. Besides, there might be a discrepancy between the enhancements induced by ARIs and ACIs for primary and secondary PM2.5 components. The primary PM2.5 components are mainly influenced by physical transport, while the secondary PM2.5 components are also affected by chemical formation and decomposition. The lower air temperature and higher RH can help to condense gas precursors into secondary aerosol particles (Donahue et al., 2012) and to strengthen aqueous and heterogeneous reactions (Liu et al., 2018). On the contrary, Wu et al. (2020) pointed out that the ARIs may also suppress the formation of secondary aerosol because the atmospheric oxidizing capacity and photolysis rate can be changed during the scattering and absorption of solar radiation. Therefore, not all changes in terms of meteorological factors are conducive to the increase of secondary PM2.5, and these positive and negative contributions would influence the variations in primary and secondary PM2.5 components. In a word, although the ARI and ACI processes mostly lead to a net PM2.5 increase, the relative increasing rates of different aerosol components are fairly complex due to various physical and chemical processes.
In recent years, the Chinese government has successively proclaimed the policies of the Air Pollution Prevention And Control Action Plan and the Three-Year Action Plan To Win The Blue Sky Defense War, including the promotion of ultra-low emission technologies in industrial sectors, the implementation of traffic restriction policies, and the transition from coal to gas in residential cooking. As a result, the annually averaged PM2.5 concentrations in the Beijing–Tianjin–Hebei region, the Yangtze River Delta (YRD), and the Pearl River Delta have been reduced by 39.6 %, 34.2 %, and 27.7 % from 2013 to 2017, respectively (Wang et al., 2017; Ding et al., 2019). Meanwhile, sulfate and organic components have respectively decreased by 76 % and 70 % in the North China Plain (NCP) (Wang et al., 2019). Considering the sharp anthropogenic emission reduction and PM2.5 concentration decrease, Moch et al. (2022) found that the decrease in mean PM2.5 concentration from the winter months of 2012–2013 to the winter months of 2016–2017 in China weakened the cloud–snowfall–albedo feedback induced by the aerosol semi-direct effect. For air quality, Zhang et al. (2022) found that the decrease in black carbon from 2013 to 2017 in China reduced the enhanced PM2.5 concentration induced by the ARIs by 1.8 µg m−3 in January and 0.3 µg m−3 in July.
However, none of the previous studies have systematically evaluated the changes in enhanced PM2.5 concentrations in relation ARIs and ACIs in China over a long-term scale. Besides, the driving force and physical mechanisms for the changes are also yet to be explored. In this study, we try to investigate the enhanced PM2.5 concentrations induced by ARIs and ACIs in 2013 over China and the impact of the changes to the meteorological background and anthropogenic emissions from 2013 to 2021 on ARI- and ACI-induced PM2.5 enhancements and its components. Furthermore, the causes of PM2.5 enhancement changes are analyzed.
2.1 Model configuration
The Weather Research and Forecasting model with Chemistry (WRF-Chem) version 4.2 has been used in this study. The model domain covers the whole land area of China with a horizontal resolution of 27 km × 27 km. There are 24 vertical layers from the surface to 50 hPa, with denser layers in the planetary boundary layer (PBL). Major physical options used in the model include the Morrison double-moment scheme (Morrison et al., 2009), the rapid radiative transfer model for GCMs (RRTMG) shortwave and longwave radiative transfer schemes (Iacono et al., 2008), the Eta similarity surface layer scheme (Janjic et al., 1994), the Noah land surface model with multiple parameterization options (Niu et al., 2011), the Bougeault and Lacarrere PBL scheme (Bougeault et al., 1989), and the Grell–Freitas ensemble cumulus scheme (Grell et al., 2014). For chemistry, we employ the SAPRC-99 (Statewide Air Pollution Research Center mechanism, version 1999) as the gas-phase chemistry mechanism (Carter, 2000). The aerosol module used in the study is the Model for Simulating Aerosol Interactions and Chemistry (MOSAIC) (Zaveri et al., 2008), which includes all major aerosol processes and represents the aerosol size distribution with eight size bins. The MOSAIC also incorporates the one-dimensional volatility basis set (VBS) framework that improves the simulation of secondary organic aerosol (Shrivastava et al., 2011). Rates for photolytic reactions are calculated using the Fast-J photolysis rate scheme (Wild et al., 2000). Additionally, we noted the poor ability of nitrate simulation in the WRF-Chem model. We improved the nitrate simulation by addressing the HONO underestimation in the model (Wang et al., 2015; Xue et al., 2020). More detailed information can be found in Sect. S1 in the Supplement. The meteorological initial and boundary conditions are derived from the National Centers for Environmental Prediction Final Analysis reanalysis data with resolutions of 1.0∘ × 1.0∘ and 6 h (http://rda.ucar.edu/datasets/ds083.2/, last access: 9 March 2023). The chemical initial and boundary conditions are acquired from the simulation results of the National Center for Atmospheric Research's Community Atmosphere Model with Chemistry (CAM-Chem, before 2020, https://www.acom.ucar.edu/cam-chem/cam-chem.shtml, last access: 10 March 2023) and the Whole Atmosphere Community Climate Model (WACCM, after 2020, https://www.acom.ucar.edu/waccm/download.shtml, last access: 10 March 2023) with resolutions of 0.94∘ × 1.25∘ and 6 h.
The anthropogenic emission data in China for 2013–2021 are obtained from the ABaCAS-EI (Air Benefit and Cost and Attainment Assessment System-Emission Inventory) developed by Tsinghua University (Li et al., 2023). Specific emissions of SO2, NOx (NO and NO2), NH3, PM2.5, and VOCs (volatile organic compounds) in 2013 and 2021 are presented in Table S2. The emission data in other countries are obtained from the IIASA emission inventory for 2015 (Zheng et al., 2019; Gao et al., 2020). The biogenic emission is calculated online by the Model of Emissions of Gases and Aerosols from Nature (MEGAN) v2.04 (Guenther et al., 2006). The dust emission is calculated online by the Goddard Chemistry Aerosol Radiation and Transport (GOCART) model coupled with the MOSAIC aerosol schemes (Zhao et al., 2010, 2013).
To account for the physical processes of aerosol–radiation–cloud feedbacks on meteorological factors and PM2.5, the four-dimensional data assimilation (FDDA) is not utilized in our simulations. Aerosol optical depth, single scattering albedo, and asymmetry factors are calculated based on the Lorenz–Mie theory as a function of wavelength and three-dimensional location (Fast et al., 2006). Then, the aerosol optical properties are transferred to the RRTMG radiation scheme to calculate the impact of aerosol on the radiation balance (Iacono et al., 2008). As for the ACIs, activated aerosols are calculated by the Abdul-Razzak and Ghan scheme (Abdul-Razzak and Ghan, 2002) and are then coupled with the Morrison two-moment cloud microphysics scheme (Morrison et al., 2009). The prognostic cloud water content calculated by the Morrison scheme is input into the RRTMG scheme for the radiative transfer calculation. It should be noted that the prognostic aerosol does not influence cumulus clouds and ice nucleation in the model. The prognostic aerosol can only be activated as CCN. It does not directly contribute to ice nucleation, which is only influenced by air temperature and supersaturation (Kanji et al., 2017). Furthermore, CCN would influence grid-scale clouds. However, limited by the horizontal resolution of 27 km × 27 km, cumulus clouds could not be resolved in this grid.
2.2 Experimental design
As described in the introduction, the purpose of this study is to quantify the contributions of ARIs and ACIs to PM2.5 concentrations under different emission scenarios. The simulation periods are January and July 2013 and 2021, representing winter and summer, respectively.
As shown in Table 1, the enhanced PM2.5 concentration induced by ARIs and ACIs could be obtained via comparing the simulation results with ARIs or ACIs turned on or off. By setting the aer_ra_feedback to 0 in the model, the ARIs could be turned off, which means that the interaction between aerosol and radiation is prevented. The ACIs could be turned off through prescribing a CDNC of 25 cm−3 in the microphysical scheme, which represents the average level in the pristine air (Bennartz, 2007). For example, the 13M13E_B, 13M13E_NR, and 13M13E_NRC shown in Table 1 represent the cases with ARI and ACI effects, without ARI effect, and without ARI and ACI effects in 2013, respectively. The ARI-induced PM2.5 enhancement could be acquired by comparing the results of 13M13E_B and 13M13E_NR; the ACI-induced PM2.5 enhancement could be obtained by comparing the results of 13M13E_NR and 13M13E_NRC.
Table 1Case definition under different meteorological backgrounds and anthropogenic emissions with ARIs or ACIs turned on or off.
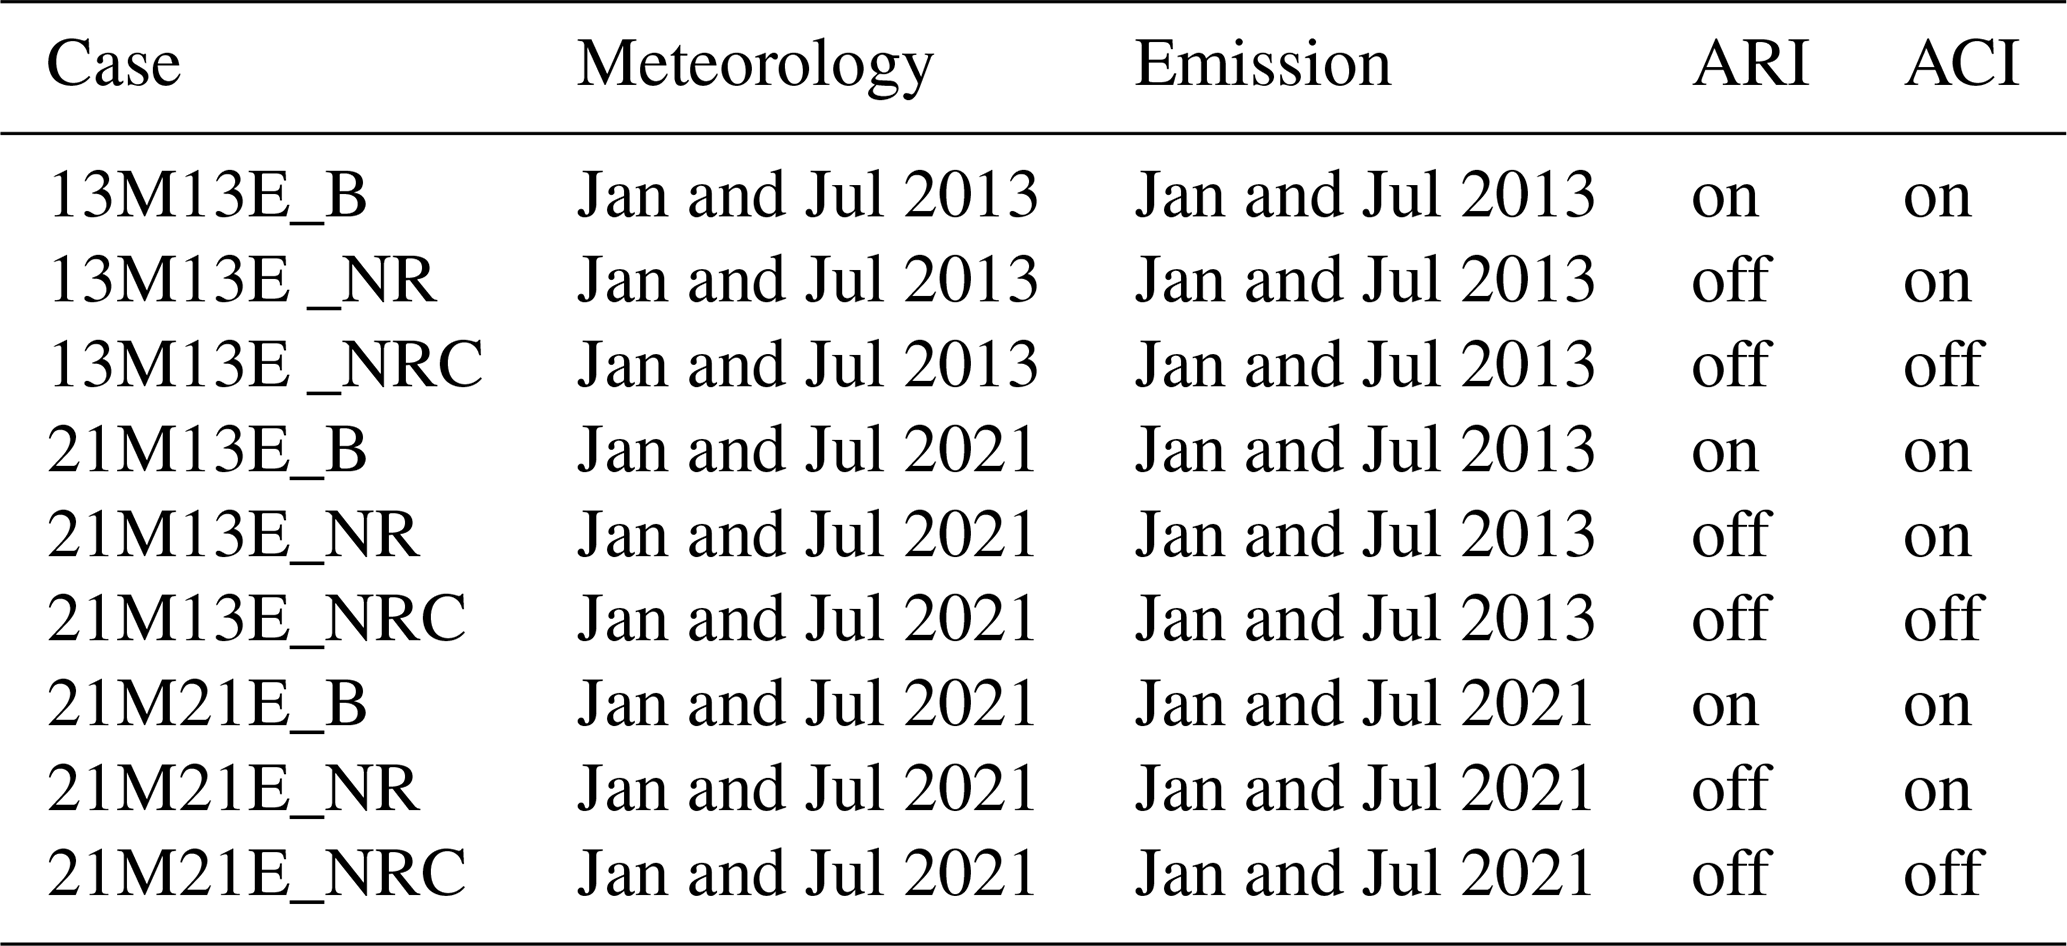
In order to obtain the changes in the ARI- and ACI-induced PM2.5 enhancements from 2013 to 2021 caused by the variation in meteorological background and by the reduction in anthropogenic emissions, the control experiments (21M13E; three experiments: with ARI and ACI turned on, with ARI turned off and ACI turned on, and with ARI and ACI turned off) are designed with the meteorological background in 2021 and the anthropogenic emission in 2013. In the following, the 13M13E, 21M13E, and 21M21E represent the cases with meteorological background and anthropogenic emissions in 2013, meteorological background in 2021 and anthropogenic emissions in 2013, and meteorological background and anthropogenic emissions in 2021, respectively. Taking the ARI, for example, the change in the ARI-induced PM2.5 enhancement from the variation in the meteorological background is obtained by subtracting the ARI-induced PM2.5 enhancement in the 13M13E from that in the 21M13E (Eq. 1); the change in the ARI-induced PM2.5 enhancement from the reduction in anthropogenic emissions is obtained by subtracting the ARI-induced PM2.5 enhancement in the 21M13E from that in the 21M21E (Eq. 2). The calculations for the ACI-induced PM2.5 enhancement are similar, as shown in Eqs. (3) and (4):
where the ARImet (ACImet) and ARIemi (ACIemi) represent the changes in the enhanced PM2.5 concentration induced by the ARI (ACI) from 2013 to 2021 caused by the variation in the meteorological background and the reduction in anthropogenic emissions, respectively.
2.3 Model evaluation
To determine the accuracy and reliability of simulation results, the 13M13E_B and 21M21E_B simulations (Table 1) are verified using the observations. The variables checked in the evaluation contain the concentration and components of surface PM2.5 and the meteorological factors, including air temperature (T2) and water vapor mixing ratio (Q2) at 2 m, wind speed (WS10) and wind direction (WD10) at 10 m, and cloud fraction (CF) and liquid water path (LWP).
Simulated temperature, wind, and water vapor are compared with the observations from the National Climate Data Center (NCDC, http://www.ncdc.noaa.gov/, last access: 12 February 2023). The evaluation shows that the absolute errors for T2, WS10, and Q2 are, respectively, less than 1∘, 1 m s−1, and 0.1 g kg−1 (Table S3), and those for WD10 are near to or less than 10∘. For the simulation utilizing the FDDA, the benchmarks of biases proposed by Emery et al. (2001) are 0.7∘, 0.6 m s−1, 1.0 g kg−1, and 20∘ for the T2, WS10, Q2, and WD10, respectively. The biases of the T2 and WS10 in our simulations have exceeded the benchmarks, while they are still similar to or smaller than those in most previous WRF-Chem applications without FDDA over east Asia (Zhang et al., 2015; Zhao et al., 2017).
Simulated CF and LWP are compared with the data from the Moderate-resolution Imaging Spectroradiometer (MODIS) aboard the Terra satellite (http://ladsweb.nascom.nasa.gov/data/search.html, last access: 12 February 2023). Overall, the CF and LWP simulations are in good agreement with the observations (Figs. S1 and S2). The high values of observed CF and LWP primarily appear in the south of China in January 2013 and 2021, and the high value of CF also occurs in the NCP region. The high values of CF and LWP in the south of China could be reproduced in the simulation, while the CF in the NCP region is slightly underestimated, which could be due to the imperfect cloud parameterization scheme in the model or the uncertainties in the retrieval of MODIS datasets. In July 2013 and 2021, part of the high-value area of the observed LWP and the most high-value area of the observed CF appear in the southwest of China and the east coast of China, which also could be captured by the simulation. In addition, high LWP also appears in Gansu and Sichuan provinces in July 2013 and in the YRD and Sichuan–Chongqing in July 2021, which are both well reproduced. The distributions of low values of observed CF and LWP in January and July of 2013 and 2021 are also well simulated.
The simulation of surface PM2.5 concentration is compared with the data from the China National Environmental Monitoring Center (https://quotsoft.net/air/, last access: 12 February 2023). The evaluation shows that both the regional average value and spatial distribution of the simulated PM2.5 concentration are in good agreement with the observational data. As shown in Fig. S3, the biases of the regional average PM2.5 concentration in January and July of 2013 and 2021 are below 5 µg m−3 in eastern China. In this study, eastern China includes most of the Chinese provinces except Xinjiang, Xizang, Ningxia, Qinghai, Gansu, inner-Mongolia, and Heilongjiang provinces, which contain the most polluted regions in China. In addition, the distributions of high simulated PM2.5 concentrations are also consistent with the observations, such as the NCP region, the YRD region, and the Sichuan–Chongqing area.
The simulated PM2.5 components are also reasonable compared with the observation data. Given that the PM2.5 component data in 2013 are very rare, we sourced three sets of data in January 2013 in Beijing (Matthias et al., 2017), Handan (Zhang et al., 2015), and Shanghai (Li et al., 2015). The results show that the simulated PM2.5 components are reproduced well generally. Specifically, the simulated PM2.5 components are larger than half of the observational PM2.5 components and less than double the observational PM2.5 components (Fig. S4). Observed PM2.5 component data in 2021 are from a data-sharing platform for the NCP region and its surrounding areas (Wang et al., 2019). Figure S5 shows the ratios of observations to simulations of ammonium, sulfate, BC, and organic carbon (OC) in January and July 2021. The results exhibit that almost all the ratios of PM2.5 components are located between 0.5 and 2.0, while some ratios of sulfate in January, some ratios of the OC in January, and most ratios of the BC in January and July are beyond this range. However, these discrepancies will not cause obvious uncertainties in this research. Specifically, considering the low hygroscopicity of BC, BC overestimations in January and July 2021 probably bring about low uncertainties in ACI-induced PM2.5 enhancement. To test the impact of simulated BC overestimation in January 2021 on ARI-induced PM2.5 enhancement, we utilize another set of particulate matter (PM) source profiles (Liu et al., 2018) and conduct the simulations for January 2021. The results indicate that the ratios of simulated BC concentration to observational BC concentration are within 2.0. The ARI-induced PM2.5 enhancement is 1.33 µg m−3, which shows a negligible difference from the result (1.37 µg m−3) obtained using the original PM source profiles (Fig. S6). In view of the results in January 2021, the BC overestimation in July 2021 also probably brings about low uncertainties in ARI-induced PM2.5 enhancement. However, the reduction in the simulated BC concentration in January 2021 does not necessarily mean that this set of PM source profiles is better than the original PM source profiles because this might be an accidental result caused by other uncertainties. For example, the current model underestimates the wet deposition of BC due to neglecting the increase in BC hygroscopicity brought about by BC aging. If this process is considered in the model, simulated BC concentrations might be better reproduced using original PM source profiles. Therefore, in this study, we still use the original results for our analysis. The model also underestimates the sulfate concentration and overestimates part of the OC concentration in January 2021. We think that neither of these discrepancies will cause significant uncertainties in ARI- and ACI-induced PM2.5 enhancement. Specifically, the majority of aerosols are scattering aerosols, and the PM2.5 concentration in January 2021 is reproduced well. Therefore, we think that the impact of the sulfate underestimation on the ARI-induced PM2.5 enhancement would be largely offset by the overestimation of other scattering-aerosol components, such as OC. In addition, the OC overestimation should not bring about significant uncertainty in ACI-induced PM2.5 enhancement either because of the relatively lower hygroscopicity of OC compared to secondary inorganic aerosol. The underestimation of sulfate simulations in January 2021 also minimally affects ACI-induced PM2.5 enhancement because the sulfate underestimation mainly occurs in the North China Plain, where cloud cover is low. In contrast, in southern cities such as Mianyang City in Sichuang Province, where there is plenty of cloud cover, the sulfate simulation was 4.19 µg m−3 in January 2021, which is very close to the observed value of 4.25 µg m−3 (Lin et al., 2022).
In summary, the performances of the WRF-Chem model in terms of the simulations of air quality and meteorological factors over China are fairly good, and the differences between simulations and observations are reasonable and acceptable.
3.1 The impacts of ARI and ACI feedbacks on the meteorological factors and PM2.5 concentrations in 2013
We comprehensively discuss the effects of ARIs and ACIs on the regional meteorological factors and PM2.5 concentrations in January and July 2013. Figure 1 shows the impacts of ARI and ACI feedbacks on the SWDOWN, PBLH, T2, RH, and PM2.5 concentration in January and July 2013. For the ARI, the SWDOWN decreases by 18.37 and 7.71 W m−2 in January and July 2013, respectively, in eastern China. Since the incoming solar radiation reaching the ground is reduced by PM, the T2 and PBLH in eastern China further decrease by 0.30 and 0.03∘ and 28.34 and 8.75 m in January and July 2013, respectively. Meanwhile, the RH increases by 0.46 % and 0.08 % due to the water vapor accumulation in the suppressed planetary boundary layer (Liu et al., 2018). Ultimately, the PM2.5 concentration increases by 5.59 and 0.13 µg m−3 in eastern China (Fig. 1d). For the ACIs, affected by the cloud modified by the aerosol, the SWDOWN, T2, and PBLH decrease by 7.54 and 14.03 W m−2, 0.18 and 0.17∘, and 10.89 and 24.31 m, and the RH increases by 0.34 % and 0.37 % in January and July 2013 in eastern China, respectively. As a result, the PM2.5 concentration increases by 3.96 and 2.20 µg m−3 in eastern China. Figure 2 shows that the regionally averaged values and spatial distributions of PM2.5 enhancements induced by ARIs and ACIs in 2013 are in line with the results of previous studies (Zhao et al., 2017; Zhang et al., 2018).
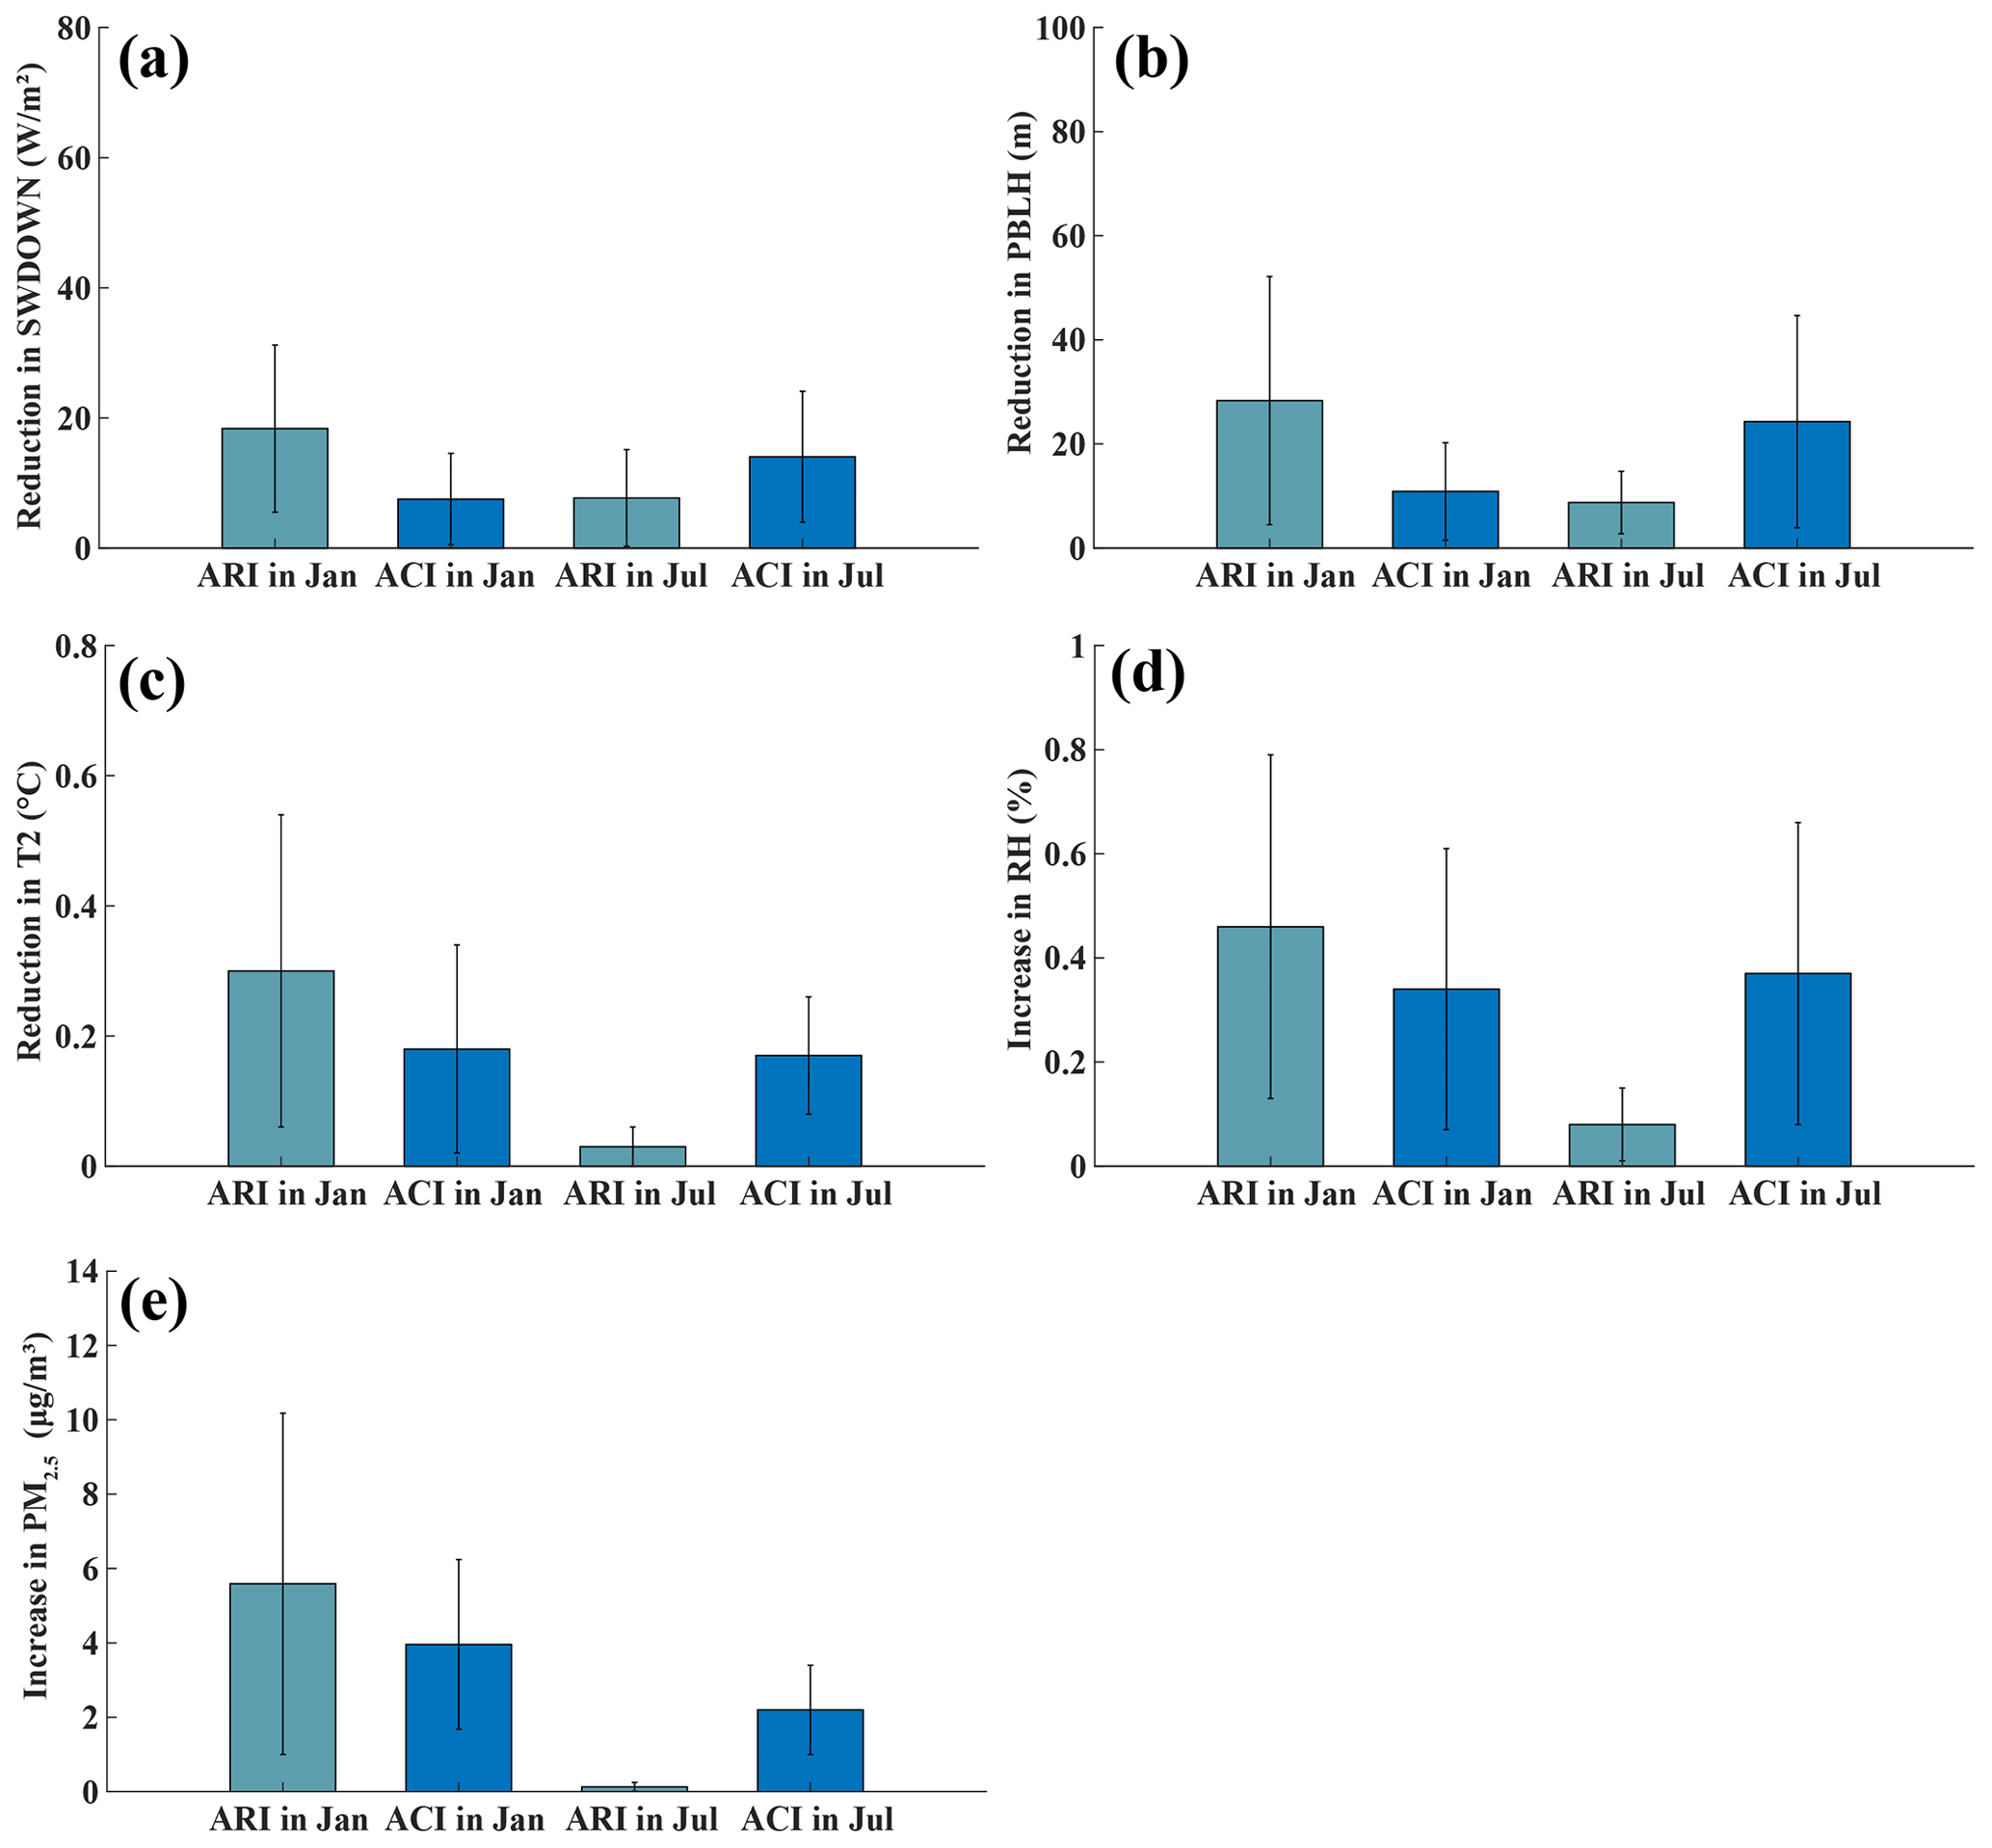
Figure 1The regionally averaged reductions of (a) downward shortwave radiation at the surface (SWDOWN), (b) planetary boundary layer height (PBLH), (c) 2 m air temperature (T2), and increments of (d) relative humidity (RH) and (e) fine particulate matter (PM2.5) concentration induced by the aerosol–radiative interaction (ARI) and aerosol–cloud interaction (ACI) in January and July 2013 in eastern China. The error bars represent the standard deviations for different meteorological factors and PM2.5 concentrations induced by ARIs and ACIs in January and July 2013 in eastern China.
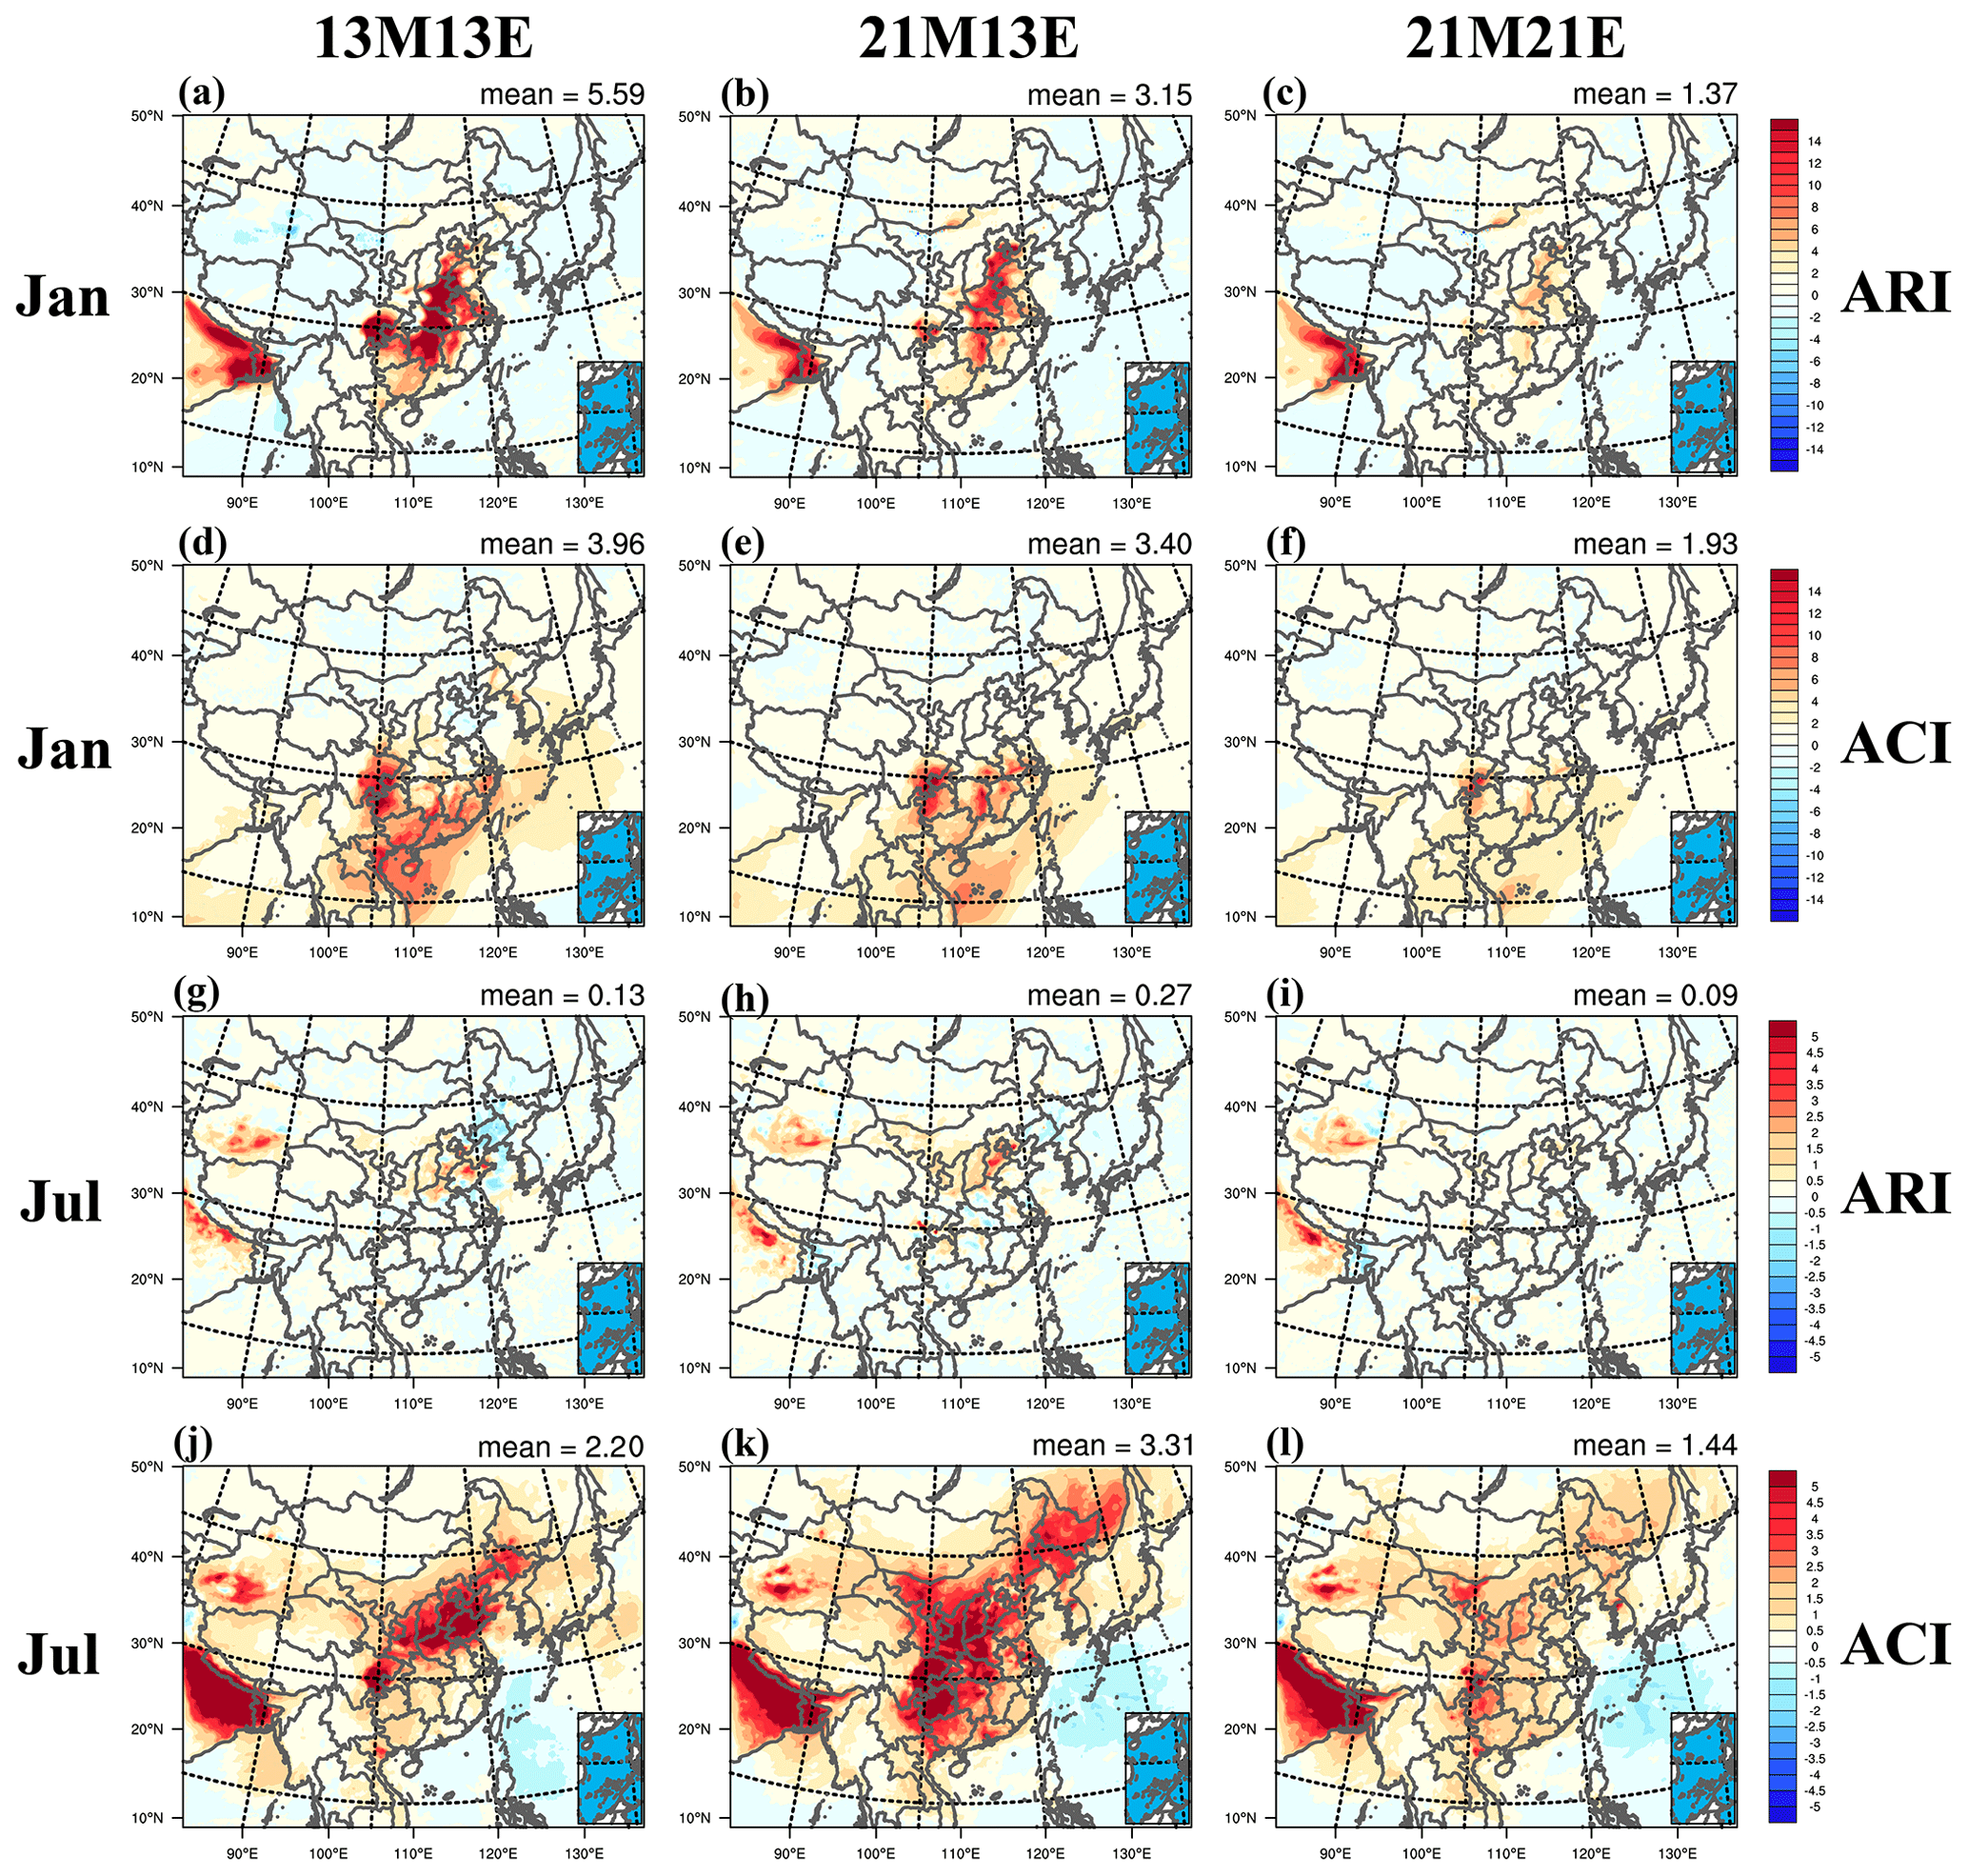
Figure 2The distributions of enhanced PM2.5 concentrations (unit: µg m−3) induced by the ARIs (first and third rows) and the ACIs (second and fourth rows) in January (first and second rows) and July (third and fourth rows) in the experiments of 13M13E (left column), 21M13E (middle column), and 21M21E (right column).
Overall, the enhanced PM2.5 concentration induced by ARIs is greater than that induced by ACIs in January 2013, which is due to the relatively low LWP in the high-PM2.5-concentration area. However, it shows the opposite situation in July 2013 owing to the plentiful cloud cover in warm July (Zhang et al., 2018).
3.2 The shift in the PM2.5 enhancements induced by ARIs and ACIs
As discussed in Sect. 3.1, the enhanced PM2.5 concentrations induced by ARIs and ACIs exhibit obvious spatial and seasonal variations in 2013. However, due to the variations in meteorological background and the reduction in anthropogenic emissions from 2013 to 2021, their joint and individual impacts on the ARI- and ACI-induced PM2.5 enhancements are still unclear. Figure 2 shows the ARI- and ACI-induced PM2.5 enhancements in the experiments of 13M13E, 21M13E, and 21M21E in January and July.
As shown in Fig. 2, from 2013 to 2021, the PM2.5 concentration enhancement induced by the ARIs in January decreases by 75 % (from 5.59 to 1.37 µg m−3). Zhang et al. (2022) also found that the ARI effect over China weakens during 2013–2017, and the ratio of PM2.5 enhancement to the ambient PM2.5 concentration decreases from 5.40 % to 3.30 %. The decline of the PM2.5 enhancement ratio (2.10 %) is lower than that in this study (3.26 %) due to the continuous emission reductions after 2017. On the other hand, the ACI-induced PM2.5 enhancement decreases by 51 %, from 3.96 to 1.93 µg m−3. With lower percentage decreases in the PM2.5 enhancement, the ACI-induced PM2.5 enhancement exceeds the ARI-induced PM2.5 enhancement in January 2021. In July, both the ARI- and ACI-induced PM2.5 enhancements show decreasing trends; the percentage decreases of the ARI-induced (31 %) and ACI-induced (34 %) PM2.5 enhancements are very close.
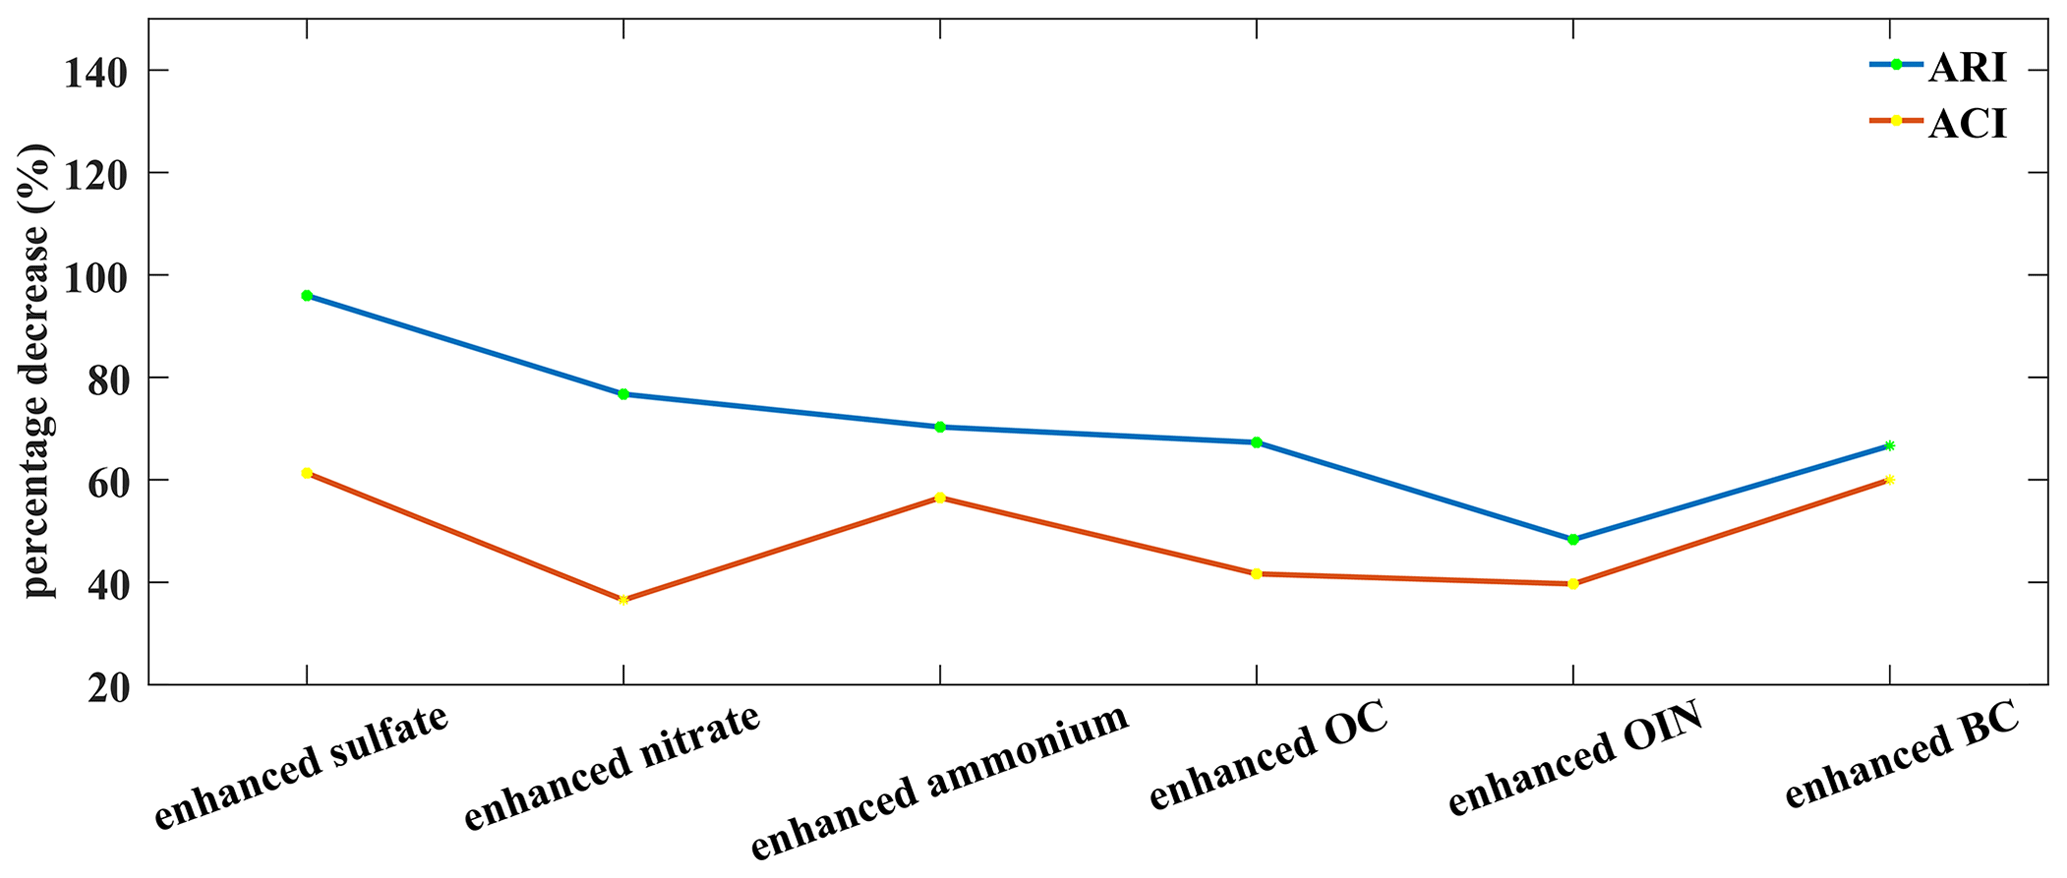
Figure 3Percentage decreases (21M13E−21M21E)/21M13E) of the spatially and temporally averaged ARI- and ACI-induced PM2.5 component enhancements in eastern China in January and July caused by the anthropogenic emission reductions from 2013 to 2021.
The contributions of the meteorological background variation and anthropogenic emission reductions to the changes in the ARI- and ACI-induced PM2.5 enhancements are different. Due to the meteorological background changes from 2013 to 2021, the ARI- and ACI-induced PM2.5 enhancements show different characteristics in January and July. It can be seen that the ARI-induced PM2.5 enhancement decreases from 5.59 to 3.15 µg m−3 with the variation in the meteorological background in January, while it increases from 0.13 to 0.27 µg m−3 in July. The primary reason for the difference is that the ambient PM2.5 concentration decreases in January but increases in July due to different meteorological backgrounds. The ACI-induced PM2.5 enhancement changes slightly from 3.96 to 3.40 µg m−3 in January due to the variation in the meteorological background. However, it increases from 2.20 to 3.31 µg m−3 in July because of a large aerosol-induced LWP increase in July 2021.
Considering the reduction in anthropogenic emissions, the ARI- and ACI-induced PM2.5 enhancements both show declining trends (middle and right columns in Fig. 2). The ARI-induced PM2.5 enhancement decreases by 56.51 % in January, from 3.15 to 1.37 µg m−3. The ACI-induced PM2.5 enhancement decreases by 43.24 %, from 3.40 to 1.93 µg m−3. The percentage decrease in the ACI-induced PM2.5 enhancement is lower than that of the ARI-induced in January, which also occurs in July, when the ARI-induced PM2.5 enhancement decreases by 66.67 % (from 0.27 to 0.09 µg m−3) and the ACI-induced PM2.5 enhancement decreases by 56.50 % (from 3.31 to 1.44 µg m−3).
In summary, both the variation in the meteorological background and the reduction in anthropogenic emissions play important roles in changing the ARI- and ACI-induced PM2.5 enhancements. However, the decreases in ARI- and ACI-induced PM2.5 enhancements from 2013 to 2021 are primarily attributed to the reduction in anthropogenic emissions. In addition, the percentage decrease in the ACI-induced PM2.5 enhancements is lower than that induced by the ARIs in both January and July. Therefore, the ACI-induced PM2.5 enhancement has become increasingly important in both January and July from 2013 to 2021.
3.3 The changes in the enhanced PM2.5 components induced by the ARIs and the ACIs
In terms of the anthropogenic emission reductions, the percentage decrease in the ACI-induced PM2.5 enhancement is lower than that induced by the ARIs in both January and July. We find that the difference is primarily from the different percentage decreases in the secondary PM2.5 component enhancements induced by ARIs and ACIs.
Figure 3 shows the percentage decreases in ARI- and ACI-induced PM2.5 component enhancements caused by the anthropogenic emission reductions in January and July. It can be seen that the differences between the percentage decreases in the ARI- and ACI-induced enhancements of sulfate, nitrate, ammonium, and OC are larger than those of BC and other inorganic aerosol (OIN). OIN refers to inorganic compositions other than sulfate, nitrate, ammonium, and BC. These compositions include sea salt and mineral elements. Specifically, the differences between the percentage decreases for sulfate, nitrate, ammonium, and OC enhancements are 34.66 %, 40.20 %, 13.80 %, and 25.65 % respectively, and the values for OIN and BC are 8.67 % and 6.67 %. This result indicates that the lower decrease in the ACI-induced PM2.5 concentration enhancement is mainly due to the small decrease in the ACI-induced enhancements of secondary PM2.5 components. The main causes will be illustrated in Sect. 3.4.
3.4 Causes for the increased importance of ACIs
3.4.1 Explanation from the perspective of meteorological changes
As discussed in previous studies, the decrease in PBLH and T2 and the increase in RH are tightly related to the ARI- and ACI-induced PM2.5 enhancements (Donahue et al., 2012; Ding et al., 2016; Moch et al., 2022; Liu et al., 2018). From the perspective of the ARI- and ACI-induced changes in meteorological factors, we investigate the primary reasons for the increasing importance of the ACI-induced PM2.5 enhancement under the reduction of anthropogenic emissions.
Figure 4 shows the percentage decreases in ARI- and ACI-induced decreases of SWDOWN, PBLH, and T2 and the increases in RH due to the reduction of anthropogenic emissions from 2013 to 2021. In January, in order to illustrate the reasons for the lower percentage decrease in the ACI-induced PM2.5 enhancement clearly, we take the highly polluted NCP region as an example. As shown in Fig. 4c, the percentage decreases in the ACI-induced declines in SWDOWN (19 %), PBLH (27 %), and T2 (20 %) and the increase in RH (24 %) are lower than those of the ARI-induced declines in SWDOWN (29 %), PBLH (39 %), and T2 (32 %) and the increase in RH (36 %). The phenomenon in July is similar to that in January (Fig. 4a and b). To our knowledge, the PBLH and T2 are determined by the incoming solar radiation at the surface, and they can strongly influence the RH. So the lower percentage decrease in the ACI-induced reductions of PBLH and T2 and the increase in RH could be explained by the lower percentage decrease in the ACI-induced SWDOWN reduction.
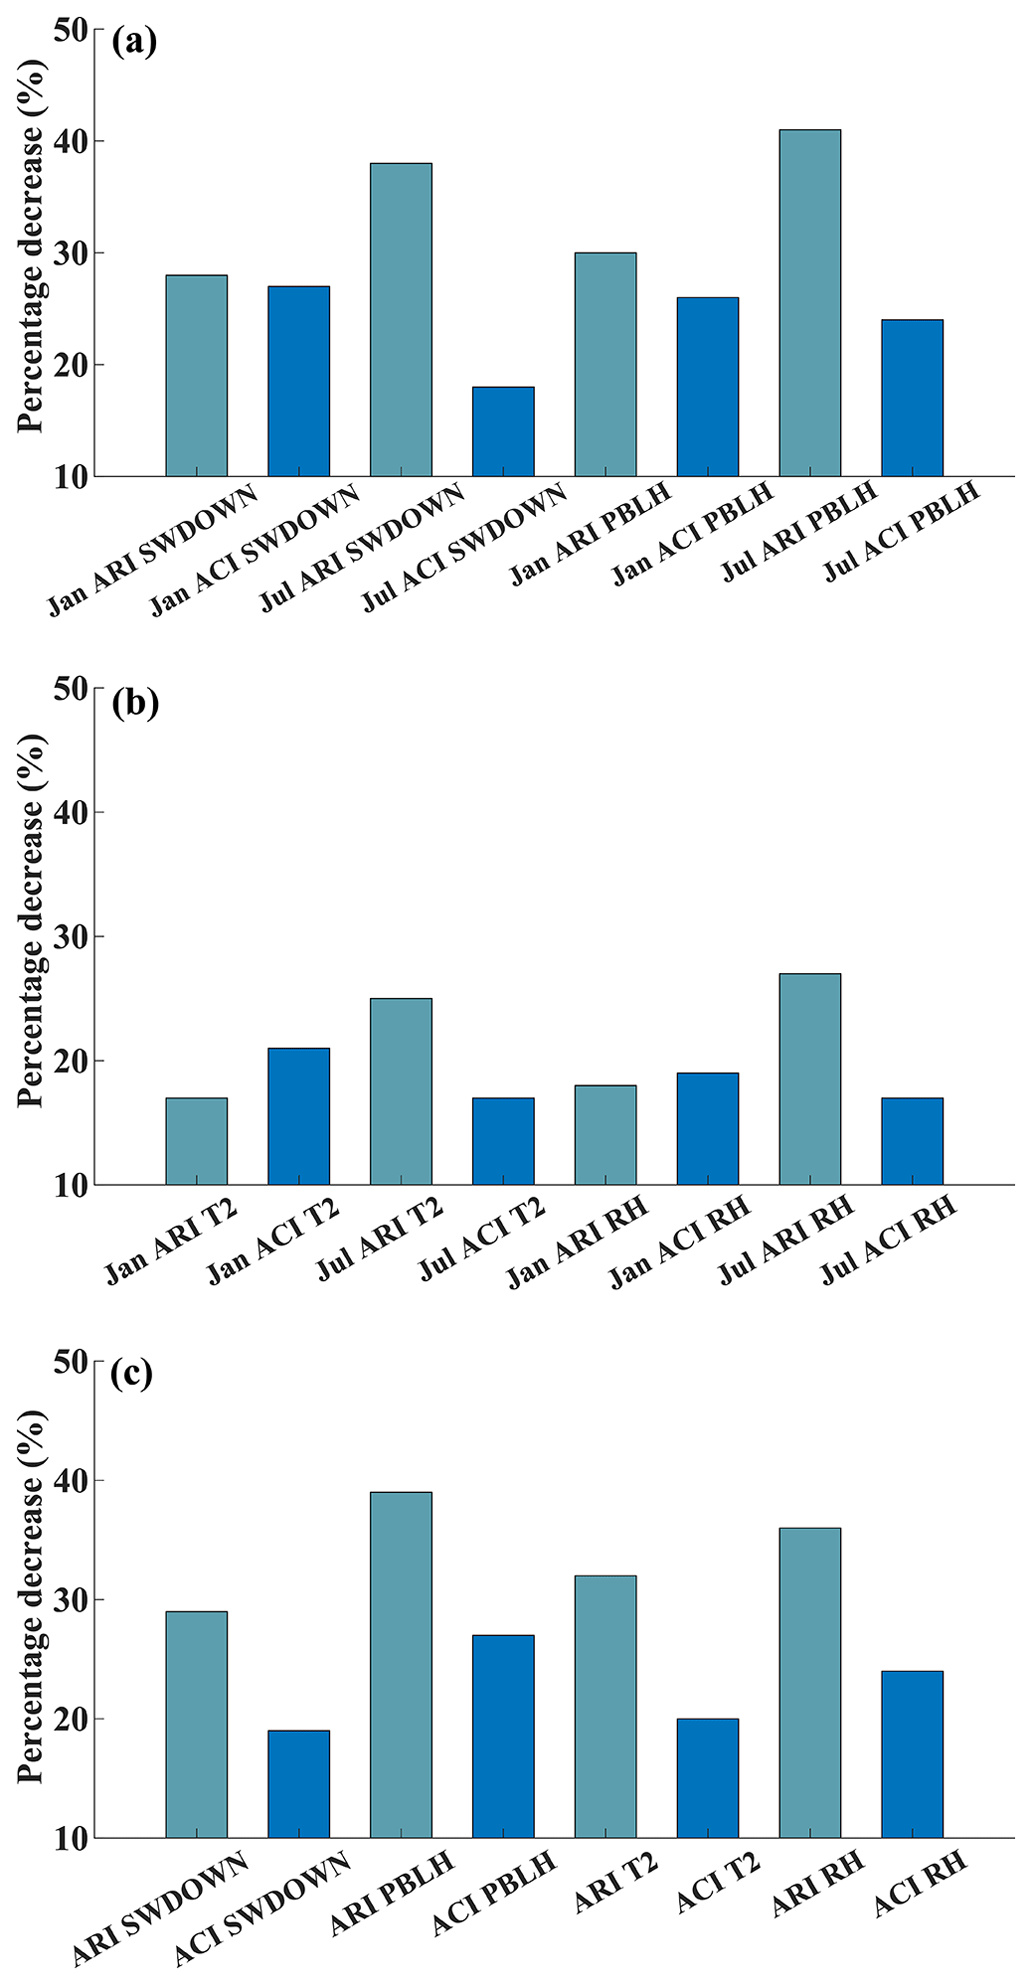
Figure 4The percentage decreases in the regional averages of (a) the decrease in SWDOWN and PBLH and (b) the T2 reduction and RH increase induced by ARIs and ACIs in eastern China caused by the anthropogenic emission reductions in January and July from 2013 to 2021; (c) is the same as (a) and (b) but in the NCP region in January.
We believe that the relatively lower decrease in the ACI-induced SWDOWN reduction is inevitable under high ambient PM2.5 concentrations. As shown in Fig. S8b, the SWDOWN reduction induced by the ARI shows a linear relationship with the decline in ambient PM2.5 concentration, which is similar to the findings of Zhou et al. (2018). In contrast, the decrease in the SWDOWN reduction induced by the ACI is lower than that induced by the ARI due to the ambient PM2.5 decrease in the highly PM2.5-polluted regime. The reason is that the decrease in ambient PM2.5 concentration directly weakens the ARI-induced SWDOWN reduction, but it has only a minor impact on the ACI-induced SWDOWN reduction because the change in LWP and cloud effective radius (Re) induced by ACI is not sensitive to the PM2.5 reduction in the PM2.5-polluted regime. In our simulations, the influence of the ACI-induced Re change is relatively smaller than that of the ACI-induced LWP change with a large decrease in PM2.5 concentration (Fig. S7). Therefore, we are only concerned with the change in ACI-induced LWP with a reduction in PM2.5. As shown in Fig. S8a, when the ambient PM2.5 concentration exceeded 15 µg m−3, the decrease in ACI-induced LWP increase was relatively low, with a PM2.5 reduction from 120 to 15 µg m−3, indicating that aerosols are not a key limiting factor to cloud formation in this range. Note that when the ambient PM2.5 concentration decreases to 15 µg m−3, the weakening of the SWDOWN reduction induced by the ACI might be larger than that induced by the ARI. This is because the decrease in the ACI-induced LWP increase is relatively fast, with a PM2.5 reduction from 15 to 0 µg m−3. Previous studies have demonstrated that the decrease in ACI-induced LWP increase is relatively fast or slow with the ambient PM2.5 reduction in the PM2.5-clean or PM2.5-polluted conditions, respectively (Myhre et al., 2007; Savane et al., 2015). The regional and temporal average PM2.5 concentration in eastern China in January and July, simulated using background meteorology in 2021 and emissions in 2013, is 63 and 25 µg m−3, which is much higher than 15 µg m−3. Therefore, the decrease in the ACI-induced SWDOWN reduction in both months is weak.
In particular, the lower PBLH caused by ARIs and ACIs will enhance the accumulation of all the PM2.5 components, but the higher RH and lower T2 induced by the ARIs and ACIs could promote the production of extra secondary PM2.5 components through strengthening aqueous and heterogeneous reactions, causing gas precursors to condense into particle matter (Donahue et al., 2012; Liu et al., 2018). Therefore, a lower percentage decrease in the T2 reduction and RH increase induced by the ACI is more likely to weaken the decrease in the enhancements of secondary PM2.5 components. This explains well the lower percentage decreases in the enhancements of secondary PM2.5 components induced by the ACIs compared to those induced by the ARIs, as shown in Fig. 3.
3.4.2 Explanation from the perspective of PM2.5 concentration distribution changes
Ambient PM2.5 concentration is the fundamental factor in triggering the ARI and the ACI. In order to further explore the reasons for the increasing importance of enhanced PM2.5 concentrations induced by ACIs, we discuss the characteristics of enhanced PM2.5 concentrations induced by ARIs and ACIs under different PM2.5 pollution levels. Given that this study mainly focuses on the change in ARI- and ACI-induced PM2.5 enhancement in the PM2.5-polluted regime, we only discuss these changes within the PM2.5 concentration range of 15–180 µg m−3.
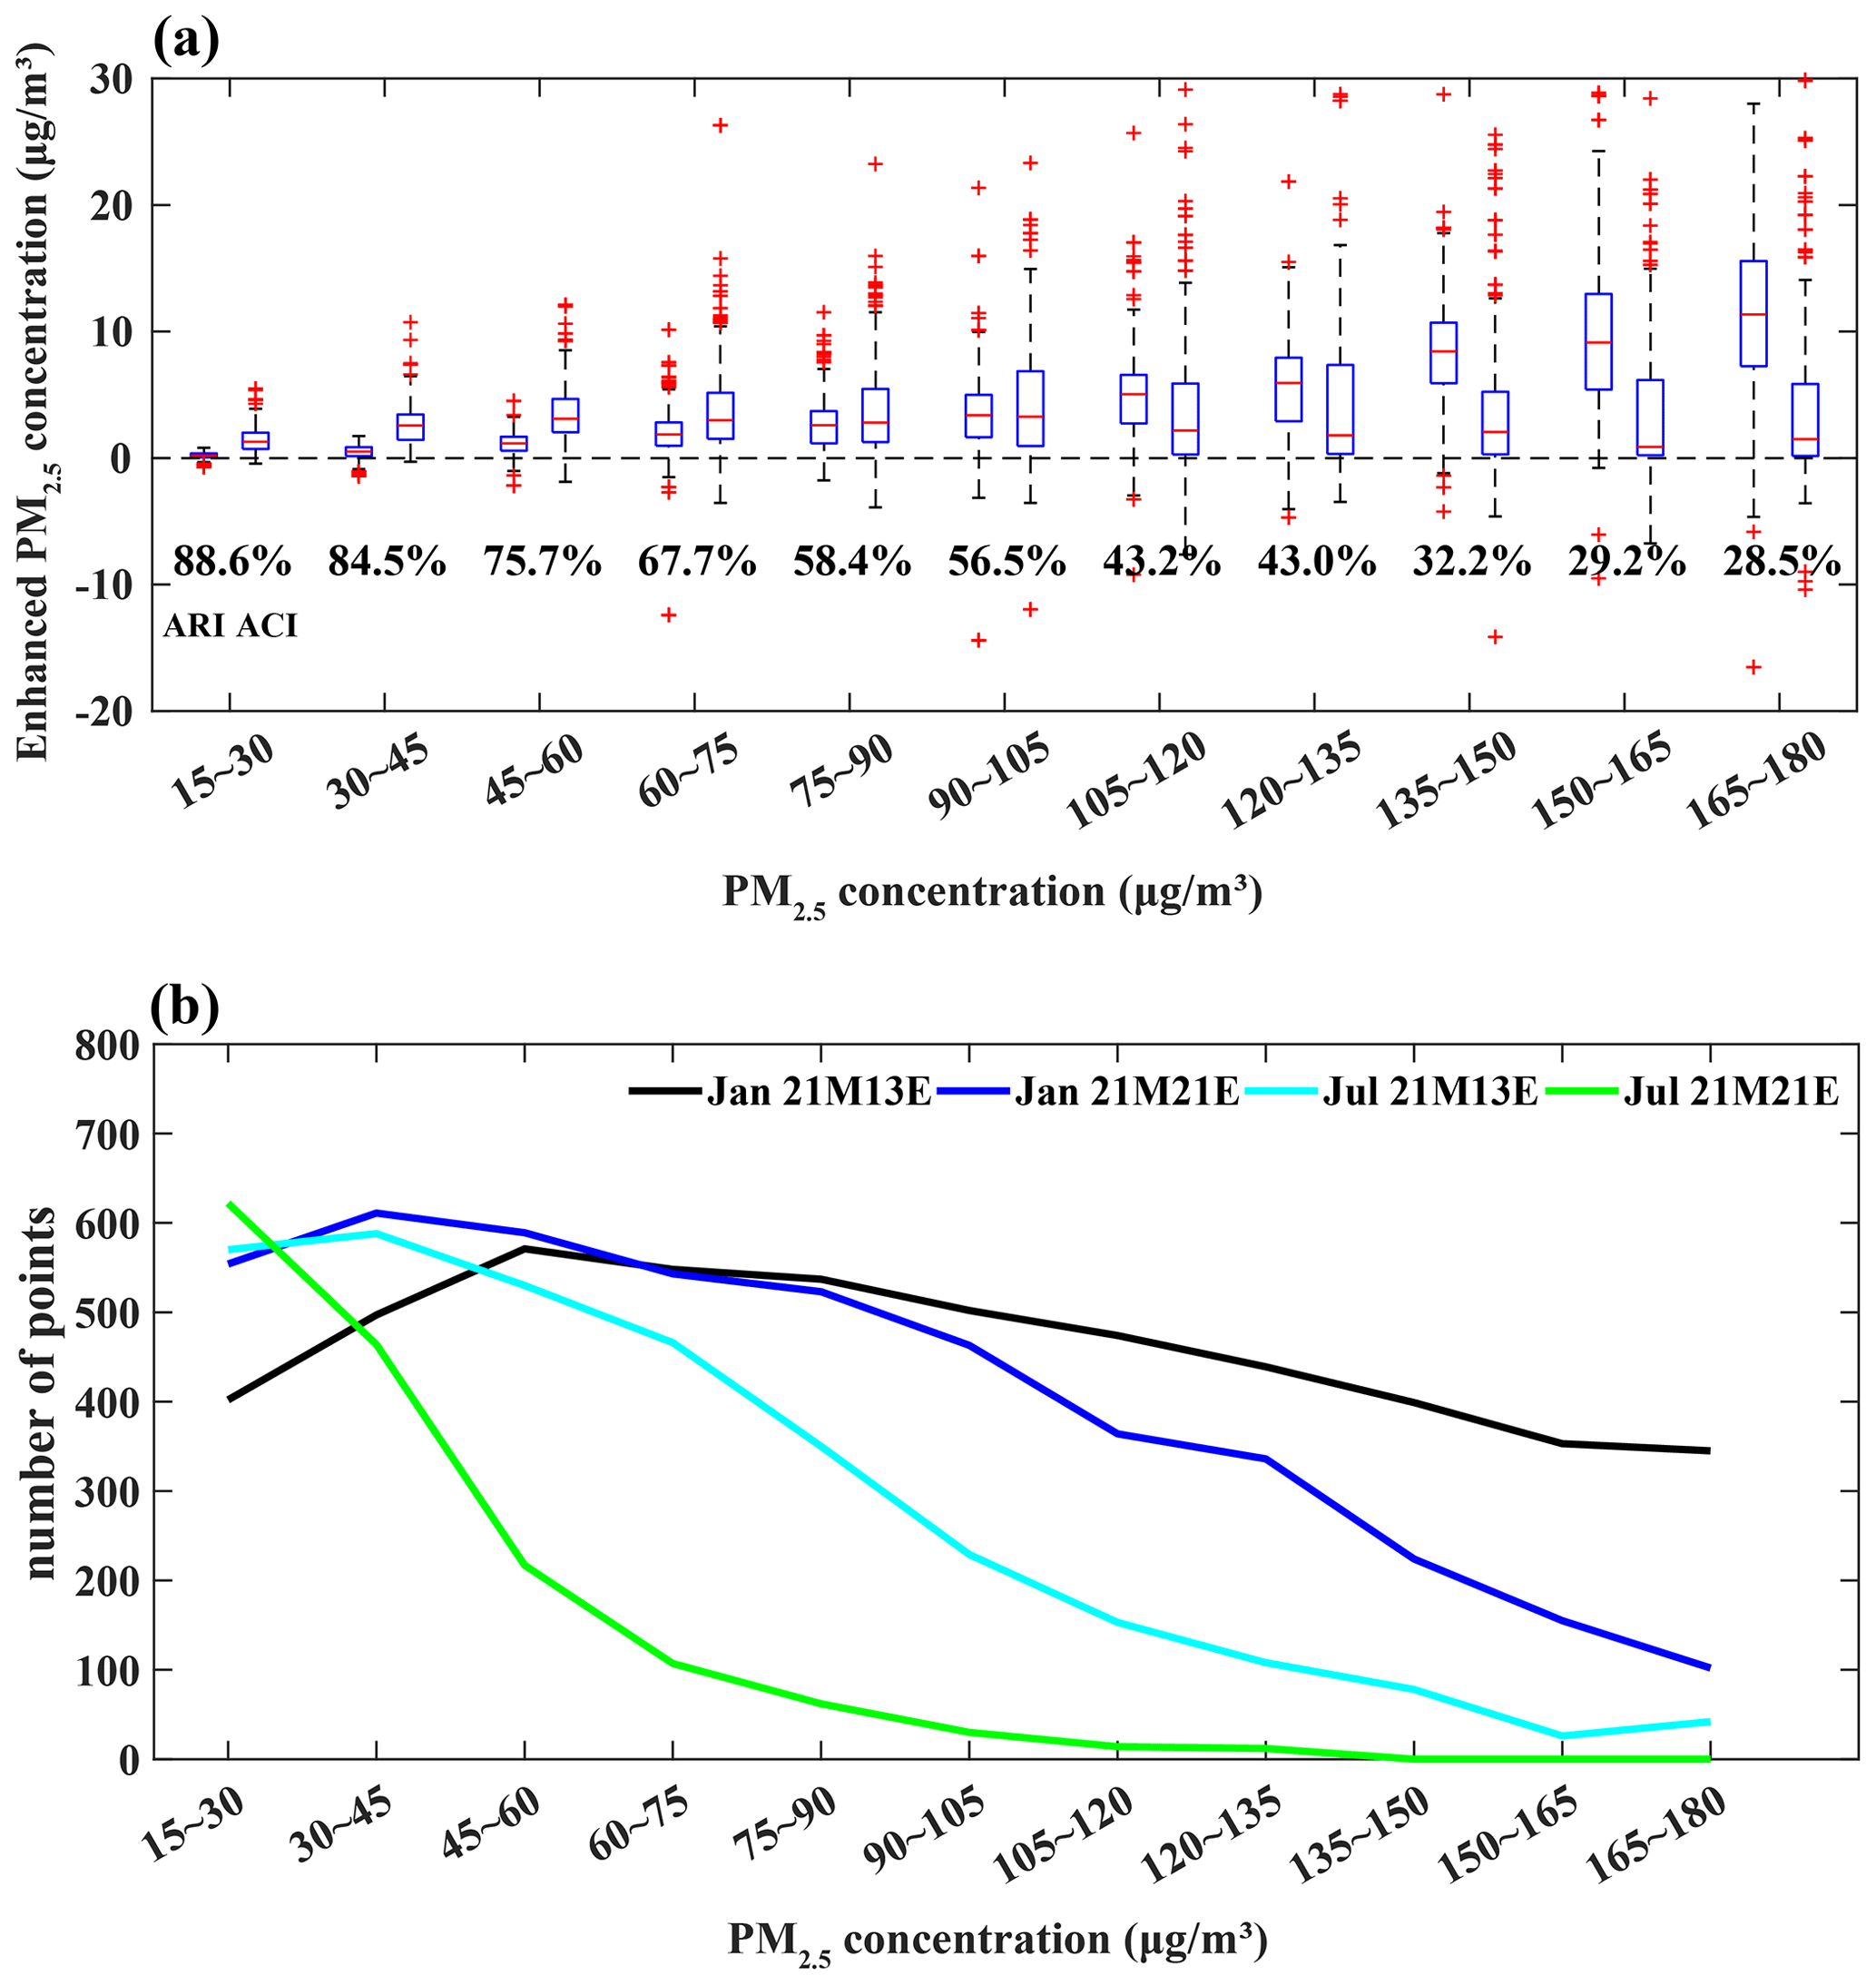
Figure 5(a) The enhanced PM2.5 concentrations induced by ARIs and ACIs at different ambient PM2.5 levels. These data are from the simulations for January and July in the experiments of 21M13E and 21M21E. The percentage represents the ratio of the ACI-induced PM2.5 enhancement to the sum of ARI- and ACI-induced PM2.5 enhancements. (b) The distributions of ambient PM2.5 levels in January and July in the experiments of 21M13E and 21M21E.
The PM2.5 concentration is divided into 11 levels from 15 to 180 µg m−3. As shown in Fig. 5a, in the heavily PM2.5-polluted regime (135–180 µg m−3), the decrease in SWDOWN induced by ARIs is much larger than that induced by ACIs (Fig. S9a). Then, the decrease in PBLH and T2 and the increase in RH induced by ARIs are also larger than those induced by ACIs (Fig. S9b–d). Thus, the enhanced PM2.5 induced by the ARIs is much larger than that induced by the ACIs (Fig. 5a). However, when the PM2.5 concentration decreases to the range of 15–45 µg m−3, the decreases in SWDOWN, PBLH, and T2 and the increase in RH induced by ACIs significantly exceed those induced by ARIs. Thus, the ACI-induced PM2.5 enhancement significantly exceeds the ARI-induced PM2.5 enhancement and becomes more important. This indicates the fast decrease in the ARI-induced PM2.5 enhancement and the increasing contribution of the ACI-induced PM2.5 enhancement with the decrease in the PM2.5 concentration. In summary, the percentage decrease in the PM2.5 enhancement induced by ACIs is weaker than that induced by ARIs with the decrease in PM2.5 concentration because of the lower percentage decrease in the ACI-induced SWDOWN, which causes the lower percentage decrease in the ACI-induced PBLH and T2 reduction and the RH increase. Furthermore, as shown in Fig. S8a, the low percentage decrease in the ACI-induced SWDOWN reduction is due to a low decrease in the ACI-induced LWP in the PM2.5-polluted regime. Considering the decrease in the ambient PM2.5 concentration due to the anthropogenic emission reductions from 2013 to 2021 (Fig. 5b), the ACI-induced PM2.5 enhancement certainly contributes more to the total PM2.5 concentration in 2021.
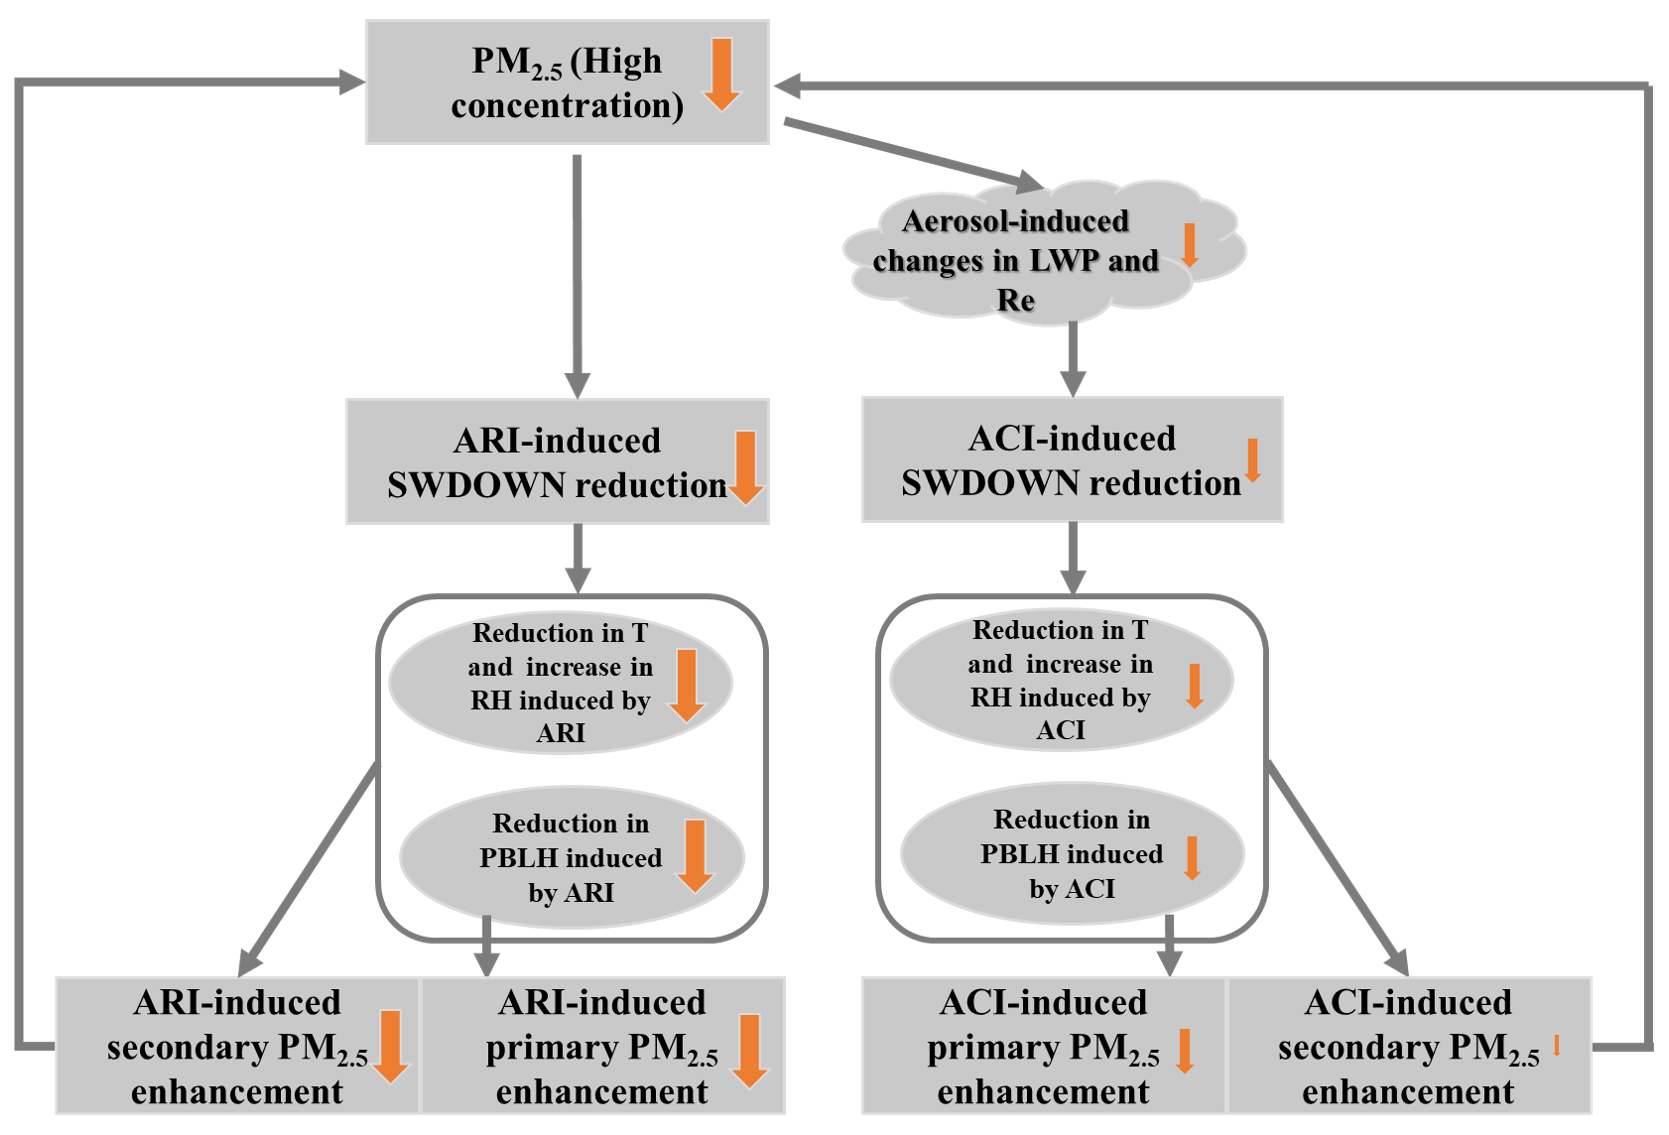
Figure 6Schematic diagram for the decrease in ARI- and ACI-induced primary and secondary PM2.5 enhancement due to the reduction in ambient PM2.5 concentrations. The size of the arrows represents the magnitude of the changes due to the reduction in ambient PM2.5 concentration.
Under the background of sharped anthropogenic emission reductions, this study investigates changes in the ARI- and ACI-induced PM2.5 enhancements for 2013–2021 and explores the causes for these changes from the perspectives of meteorological factors and PM2.5 concentration distributions.
The results show that the enhanced PM2.5 induced by the ARI (5.59 µg m−3) is greater than that induced by the ACI (3.96 µg m−3) in January 2013. However, the ARI- and ACI-induced PM2.5 enhancements decrease from 5.59 and 3.96 µg m−3 to 1.37 and 1.93 µg m−3 in January, and they decrease by 75 % and 51 % for 2013–2021. The smaller decrease ratio (51 %) for ACI-induced PM2.5 enhancements implies that ACIs become more important for enhancing PM2.5 concentrations in January 2021. Furthermore, we separated the contributions of meteorological background variations and anthropogenic emission reductions. Compared with the meteorological background variation, anthropogenic emission reductions play a more important role in causing the decrease in ARI- and ACI-induced PM2.5 enhancements. Owing to only emission reductions, the enhanced PM2.5 concentrations induced by the ARI and ACI decrease by 56 % and 43% in January and 66 % and 56 % in July, respectively. The ACI-induced PM2.5 enhancement becomes increasingly important in both January and July for 2013–2021. More specifically, the lower percentage decrease in the ACI-induced PM2.5 enhancement is dominated by the lower decrease in the enhancements of secondary PM2.5 components.
The lower percentage decrease in the enhanced PM2.5 induced by the ACIs is due to the lower percentage decrease in the ACI-induced SWDOWN reduction, which is because of the lower decrease in the LWP and the increase in the Re caused by the ambient PM2.5 decrease in the highly PM2.5-polluted regime (Fig. 6). At the same time, the lower percentage decreases in the T2 reduction and the RH increase induced by the ACIs further lead to the lower percentage decrease in the enhancements of the ACI-induced secondary PM2.5 components (Fig. 6). Notably, due to relative lower percentage decrease in the ACI-induced SWDOWN reduction in the highly PM2.5-polluted regime, the increasing importance of ACI-induced PM2.5 enhancement is a matter of course with the ambient PM2.5 decrease.
This study has important implication for the PM2.5 control. As we know, ARI- and ACI-induced PM2.5 enhancements make a non-negligible contribution to the deterioration of PM2.5 air quality. Previous research has investigated the impact of anthropogenic emission reductions on the ARI-induced PM2.5 enhancement (Zhou et al., 2019). But compared with PM2.5 enhancement induced by ARIs, that induced by ACIs is more complicated and harder to be alleviated. Our findings have further revealed that the ACI-induced PM2.5 enhancement is getting more important relative to that induced by ARIs. This is especially true in cloud-prone areas, like the Sichuan–Chongqing area, which have witnessed rather weak decreases in ACI-induced PM2.5 concentrations in the past decade due to weak decreases in the aerosol-induced LWP under the condition of high ambient PM2.5 level (Fig. 2). The ACI-induced PM2.5 enhancement needs to be considered more seriously in the formulation of control polices to meet national PM2.5 air quality standards, especially in cloud-prone areas with high ambient PM2.5 concentrations. To control ACI-induced PM2.5 enhancement, first, a larger emission reduction is necessary in cloudy areas compared to in less cloudy areas to bring about a noticeable decrease in ACI-induced LWP in response to PM2.5 reduction. Second, secondary inorganic aerosol (SNA), which is an important component of total aerosol, has a large influence on the ACI-induced PM2.5 enhancement because of its high hygroscopicity. This makes it easy for SNA to be activated as CCN and influence LWP. We think that it is crucial to make substantial decreases in the precursors of SNA, such as SO2, NOx, and NH3 species. These decreases could substantially decrease SNA. A large decrease in SNA would enhance the ACI-induced LWP response to PM2.5 reduction and cause a large decrease in ACI-induced PM2.5 enhancement. In addition, relative to ARI-induced PM2.5 enhancement, the lower decrease in ACI-induced PM2.5 enhancement is mainly because of the small decrease in ACI-induced enhancements of secondary PM2.5 components. A substantial decrease in SNA would make the decrease ratio of ACI-induced PM2.5 enhancement approach the more rapid decrease ratio of ARI-induced PM2.5 enhancement.
The data and code used in this study are available upon request from the corresponding author.
The supplement related to this article is available online at: https://doi.org/10.5194/acp-23-14359-2023-supplement.
DG, BZ, and SW designed the research; DG, BZ, JS, and BG improved the WRF-Chem performance; DG and BZ performed the WRF-Chem simulations; XW, SL, and ZD processed the anthropogenic emissions; DG analyzed the data with help from BZ, SW, and YW; DY and JS helped to design some figures; SW, YW, YZ, and YH presented important suggestions for the analysis and writings; DG and BZ wrote the paper with input from all the co-authors.
The contact author has declared that none of the authors has any competing interests.
Publisher’s note: Copernicus Publications remains neutral with regard to jurisdictional claims made in the text, published maps, institutional affiliations, or any other geographical representation in this paper. While Copernicus Publications makes every effort to include appropriate place names, the final responsibility lies with the authors.
This research is supported by the National Key Research and Development Program of China (grant no. 2022YFC3701000, Task 5), the National Natural Science Foundation of China (grant no. 22188102). We would like to thank Fenfen Zhang for providing the PM2.5 component data for Handan City in January 2013.
This research has been supported by the National Key Research and Development Program of China (grant no. 2022YFC3701000, Task 5) and the National Natural Science Foundation of China (grant no. 22188102).
This paper was edited by Corinna Hoose and reviewed by two anonymous referees.
Abdul-Razzak, H. and Ghan, S. J.: A parameterization of aerosol activation – 3. Sectional representation, J. Geophys. Res.-Atmos., 107, 4026, https://doi.org/10.1029/2001jd000483, 2002.
Bellouin, N., Quaas, J., Gryspeerdt, E., Kinne, S., Stier, P., Watson-Parris, D., Boucher, O., Carslaw, K. S., Christensen, M., Daniau, A. L., Dufresne, J. L., Feingold, G., Fiedler, S., Forster, P., Gettelman, A., Haywood, J. M., Lohmann, U., Malavelle, F., Mauritsen, T., McCoy, D. T., Myhre, G., Mulmenstadt, J., Neubauer, D., Possner, A., Rugenstein, M., Sato, Y., Schulz, M., Schwartz, S. E., Sourdeval, O., Storelvmo, T., Toll, V., Winker, D., and Stevens, B.: Bounding Global Aerosol Radiative Forcing of Climate Change, Rev. Geophys., 58, e2019RG000660, https://doi.org/10.1029/2019RG000660, 2020.
Bennartz, R.: Global assessment of marine boundary layer cloud droplet number concentration from satellite, J. Geophys. Res.-Atmos., 112, D02201, https://doi.org/10.1029/2006jd007547, 2007.
Bougeault, P. and Lacarrere, P.: Parameterization Of Orography-Induced Turbulence In a Mesobeta-Scale Model, Mon. Weather Rev., 117, 1872–1890, https://doi.org/10.1175/1520-0493(1989)117<1872:Pooiti>2.0.Co;2, 1989.
Carter, W. P. L.: Documentation of the SAPRC-99 Chemical Mechanism for VOC Reactivity Assessment, Contract No. 92-329 and 95-308, California Air Resources Board, 2000.
Ding, A. J., Huang, X., Nie, W., Sun, J. N., Kerminen, V. M., Petaja, T., Su, H., Cheng, Y. F., Yang, X. Q., Wang, M. H., Chi, X. G., Wang, J. P., Virkkula, A., Guo, W. D., Yuan, J., Wang, S. Y., Zhang, R. J., Wu, Y. F., Song, Y., Zhu, T., Zilitinkevich, S., Kulmala, M., and Fu, C. B.: Enhanced haze pollution by black carbon in megacities in China, Geophys. Res. Lett., 43, 2873–2879, https://doi.org/10.1002/2016GL067745, 2016.
Ding, D., Xing, J., Wang, S. X., Liu, K. Y., and Hao, J. M.: Estimated Contributions of Emissions Controls, Meteorological Factors, Population Growth, and Changes in Baseline Mortality to Reductions in Ambient PM2.5 and PM2.5-Related Mortality in China, 2013–2017, Environ. Health Persp., 127, 067009, https://doi.org/10.1289/Ehp4157, 2019.
Donahue, N. M., Henry, K. M., Mentel, T. F., Kiendler-Scharr, A., Spindler, C., Bohn, B., Brauers, T., Dorn, H. P., Fuchs, H., Tillmann, R., Wahner, A., Saathoff, H., Naumann, K. H., Mohler, O., Leisner, T., Muller, L., Reinnig, M. C., Hoffmann, T., Salo, K., Hallquist, M., Frosch, M., Bilde, M., Tritscher, T., Barmet, P., Praplan, A. P., DeCarlo, P. F., Dommen, J., Prevot, A. S. H., and Baltensperger, U.: Aging of biogenic secondary organic aerosol via gas-phase OH radical reactions, P. Natl. Acad. Sci. USA, 109, 13503–13508, https://doi.org/10.1073/pnas.1115186109, 2012.
Emery, C. A., Tai, E., and Yarwood, G.: Enhanced meteorological modeling and performance evaluation for two Texas ozone episodes, Project Report prepared for the Texas Natural Resource Conservation Commissions, ENVIRON International Corporation, Novato, CA, 2001.
Fast, J. D., Gustafson, W. I., Easter, R. C., Zaveri, R. A., Barnard, J. C., Chapman, E. G., Grell, G. A., and Peckham, S. E.: Evolution of ozone, particulates, and aerosol direct radiative forcing in the vicinity of Houston using a fully coupled meteorology-chemistry-aerosol model, J. Geophys. Res.-Atmos., 111, D21305, https://doi.org/10.1029/2005jd006721, 2006.
Forkel, R., Werhahn, J., Hansen, A. B., McKeen, S., Peckham, S., Grell, G., and Suppan, P.: Effect of aerosol-radiation feedback on regional air quality – A case study with WRF/Chem, Atmos. Environ., 53, 202–211, https://doi.org/10.1016/j.atmosenv.2011.10.009, 2012.
Forkel, R., Balzarini, A., Baro, R., Bianconi, R., Curci, G., Jimenez-Guerrero, P., Hirtl, M., Honzak, L., Lorenz, C., Im, U., Perez, J. L., Pirovano, G., San Jose, R., Tuccella, P., Werhahn, J., and Zabkar, R.: Analysis of the WRF-Chem contributions to AQMEII phase2 with respect to aerosol radiative feedbacks on meteorology and pollutant distributions, Atmos. Environ., 115, 630–645, https://doi.org/10.1016/j.atmosenv.2014.10.056, 2015.
Forster, P., Storelvmo, T., Armour, K., Collins, W., Dufresne, J.-L., Frame, D., Lunt, D. J., Mauritsen, T., Palmer, M. D., Watanabe, M., Wild, M., and Zhang, H.: The Earth's Energy Budget, Climate Feedbacks, and Climate Sensitivity. In Climate Change 2021: The Physical Science Basis. Contribution of Working Group I to the Sixth Assessment Report of the Intergovernmental Panel on Climate Change, edited by: Masson-Delmotte, V., Zhai, P., Pirani, A., Connors, S. L., Péan, C., Berger, S., Caud, N., Chen, Y., Goldfarb, L., Gomis, M. I., Huang, M., Leitzell, K., Lonnoy, E., Matthews, J. B. R., Maycock, T. K., Waterfield, T., Yelekçi, O., Yu, R., and Zhou, B., Cambridge, United Kingdom and New York, NY, USA, Cambridge University Press, 923–1054, https://www.ipcc.ch/report/ar6/wg1/chapter/chapter-7/ (last access: 12 November 2023), 2021.
Gao, M., Han, Z., Tao, Z., Li, J., Kang, J.-E., Huang, K., Dong, X., Zhuang, B., Li, S., Ge, B., Wu, Q., Lee, H.-J., Kim, C.-H., Fu, J. S., Wang, T., Chin, M., Li, M., Woo, J.-H., Zhang, Q., Cheng, Y., Wang, Z., and Carmichael, G. R.: Air quality and climate change, Topic 3 of the Model Inter-Comparison Study for Asia Phase III (MICS-Asia III) – Part 2: aerosol radiative effects and aerosol feedbacks, Atmos. Chem. Phys., 20, 1147–1161, https://doi.org/10.5194/acp-20-1147-2020, 2020.
Gong, W., Makar, P. A., Zhang, J., Milbrandt, J., Gravel, S., Hayden, K. L., Macdonald, A. M., and Leaitch, W. R.: Modelling aerosol-cloud-meteorology interaction: A case study with a fully coupled air quality model (GEM-MACH), Atmos. Environ., 115, 695–715, https://doi.org/10.1016/j.atmosenv.2015.05.062, 2015.
Grell, G. A. and Freitas, S. R.: A scale and aerosol aware stochastic convective parameterization for weather and air quality modeling, Atmos. Chem. Phys., 14, 5233–5250, https://doi.org/10.5194/acp-14-5233-2014, 2014.
Guenther, A., Karl, T., Harley, P., Wiedinmyer, C., Palmer, P. I., and Geron, C.: Estimates of global terrestrial isoprene emissions using MEGAN (Model of Emissions of Gases and Aerosols from Nature), Atmos. Chem. Phys., 6, 3181–3210, https://doi.org/10.5194/acp-6-3181-2006, 2006.
Gustafson, W. I., Chapman, E. G., Ghan, S. J., Easter, R. C., and Fast, J. D.: Impact on modeled cloud characteristics due to simplified treatment of uniform cloud condensation nuclei during NEAQS 2004, Geophys. Res. Lett., 34, L19809, https://doi.org/10.1029/2007gl030021, 2007.
Iacono, M. J., Delamere, J. S., Mlawer, E. J., Shephard, M. W., Clough, S. A., and Collins, W. D.: Radiative forcing by long-lived greenhouse gases: Calculations with the AER radiative transfer models, J. Geophys. Res.-Atmos., 113, D13103, https://doi.org/10.1029/2008jd009944, 2008.
Janjic, Z. I.: The Step-Mountain Eta Coordinate Model – Further Developments Of the Convection, Viscous Sublayer, And Turbulence Closure Schemes, Mon. Weather Rev., 122, 927–945, https://doi.org/10.1175/1520-0493(1994)122<0927:Tsmecm>2.0.Co;2, 1994.
Kanji, Z. A., Ladino, L. A., Wex, H., Boose, Y., BurkertKohn, M., Cziczo, D. J., and Krämer, M.: Chapter 1: overview of ice nucleating particles, Meteor. Mon., 58, 1.1–1.33, https://doi.org/10.1175/amsmonographs-d-16-0006.1, 2017.
Kong, X., Forkel, R., Sokhi, R. S., Suppan, P., Baklanov, A., Gauss, M., Brunner, D., Baro, R., Balzarini, A., Chemel, C., Curci, G., Jimenez-Guerrero, P., Hirtl, M., Honzak, L., Im, U., Perez, J. L., Pirovano, G., San Jose, R., Schlunzen, K. H., Tsegas, G., Tuccella, P., Werhahn, J., Zabkar, R., and Galmarini, S.: Analysis of meteorology-chemistry interactions during air pollution episodes using online coupled models within AQMEII phase-2, Atmos. Environ., 115, 527–540, https://doi.org/10.1016/j.atmosenv.2014.09.020, 2015.
Le, T., Wang, Y., Liu, L., Yang, J., Yung, Y. L., Li, G., and Seinfeld, J. H.: Unexpected air pollution with marked emission reductions during the COVID-19 outbreak in China, Science, 369, 702–706, https://doi.org/10.1126/science.abb7431, 2020.
Li, L., An, J. Y., Zhou, M., Yan, R. S., Huang, C., Lu, Q., Lin, L., Wang, Y. J., Tao, S. K., Qiao, L. P., Zhu, S. H., and Chen, C. H.: Source apportionment of fine particles and its chemical components over the Yangtze River Delta, China during a heavy haze pollution episode, Atmos. Environ., 123, 415–429, https://doi.org/10.1016/j.atmosenv.2015.06.051, 2015.
Li, S., Wang, S., Wu, Q., Zhang, Y., Ouyang, D., Zheng, H., Han, L., Qiu, X., Wen, Y., Liu, M., Jiang, Y., Yin, D., Liu, K., Zhao, B., Zhang, S., Wu, Y., and Hao, J.: Emission trends of air pollutants and CO2 in China from 2005 to 2021, Earth Syst. Sci. Data, 15, 2279–2294, https://doi.org/10.5194/essd-15-2279-2023, 2023.
Lin, C. J.: Characteristics and Sources of Water-soluble Inorganic Ions in Atmospheric Particulate Matter and Rainfall in the suburb of Mianyang, Master, Southwest University of Science and Technology, https://doi.org/10.27415/d.cnki.gxngc.2022.000923, 2022.
Liu, Q., Jia, X. C., Quan, J. N., Li, J. Y., Li, X., Wu, Y. X., Chen, D., Wang, Z. F., and Liu, Y. G.: New positive feedback mechanism between boundary layer meteorology and secondary aerosol formation during severe haze events, Sci. Rep.-UK, 8, 6095, https://doi.org/10.1038/S41598-018-24366-3, 2018.
Liu, Y. Y., Xing, J., Wang, S. X., Fu, X., and Zheng, H. T.: Source-specific speciation profiles of PM2.5 for heavy metals and their anthropogenic emissions in China, Environ. Pollut., 239, 544–553, https://doi.org/10.1016/j.envpol.2018.04.047, 2018.
Matthias, V., Aulinger, A., Bieser, J., Chen, Y. J., Geyer, B., Gao, J., Quante, M., and Zhang, F.: Modeling high aerosol loads in China in January 2013, Urban Clim., 22, 35–50, https://doi.org/10.1016/j.uclim.2016.04.005, 2017.
Moch, J. M., Mickley, L. J., Keller, C. A., Bian, H. S., Lundgren, E. W., Zhai, S. X., and Jacob, D. J.: Aerosol-Radiation Interactions in China in Winter: Competing Effects of Reduced Shortwave Radiation and Cloud-Snowfall-Albedo Feedbacks Under Rapidly Changing Emissions, J. Geophys. Res.-Atmos., 127, e2021JD035442, https://doi.org/10.1029/2021JD035442, 2022.
Morrison, H., Thompson, G., and Tatarskii, V.: Impact of Cloud Microphysics on the Development of Trailing Stratiform Precipitation in a Simulated Squall Line: Comparison of One- and Two-Moment Schemes, Mon. Weather Rev., 137, 991–1007, https://doi.org/10.1175/2008MWR2556.1, 2009.
Myhre, G., Stordal, F., Johnsrud, M., Kaufman, Y. J., Rosenfeld, D., Storelvmo, T., Kristjansson, J. E., Berntsen, T. K., Myhre, A., and Isaksen, I. S. A.: Aerosol-cloud interaction inferred from MODIS satellite data and global aerosol models, Atmos. Chem. Phys., 7, 3081–3101, https://doi.org/10.5194/acp-7-3081-2007, 2007.
Niu, G. Y., Yang, Z. L., Mitchell, K. E., Chen, F., Ek, M. B., Barlage, M., Kumar, A., Manning, K., Niyogi, D., Rosero, E., Tewari, M., and Xia, Y. L.: The community Noah land surface model with multiparameterization options (Noah-MP): 1. Model description and evaluation with local-scale measurements, J. Geophys. Res.-Atmos., 116, D12109, https://doi.org/10.1029/2010jd015139, 2011.
Rosenfeld, D., Sherwood, S., Wood, R., and Donner, L.: Climate Effects of Aerosol-Cloud Interactions, Science, 343, 379–380, https://doi.org/10.1126/science.1247490, 2014.
Savane, O. S., Vant-Hull, B., Mahani, S., and Khanbilvardi, R.: Effects of Aerosol on Cloud Liquid Water Path: Statistical Method a Potential Source for Divergence in Past Observation Based Correlative Studies, Atmosphere-Basel, 6, 273–298, https://doi.org/10.3390/atmos6030273, 2015.
Seinfeld, J. H., Bretherton, C., Carslaw, K. S., Coe, H., DeMott, P. J., Dunlea, E. J., Feingold, G., Ghan, S., Guenther, A. B., Kahn, R., Kraucunas, I., Kreidenweis, S. M., Molina, M. J., Nenes, A., Penner, J. E., Prather, K. A., Ramanathan, V., Ramaswamy, V., Rasch, P. J., Ravishankara, A. R., Rosenfeld, D., Stephens, G., and Wood, R.: Improving our fundamental understanding of the role of aerosol-cloud interactions in the climate system, P. Natl. Acad. Sci. USA, 113, 5781–5790, https://doi.org/10.1073/pnas.1514043113, 2016.
Shrivastava, M., Fast, J., Easter, R., Gustafson Jr., W. I., Zaveri, R. A., Jimenez, J. L., Saide, P., and Hodzic, A.: Modeling organic aerosols in a megacity: comparison of simple and complex representations of the volatility basis set approach, Atmos. Chem. Phys., 11, 6639–6662, https://doi.org/10.5194/acp-11-6639-2011, 2011.
Wang, H., Shi, G. Y., Zhang, X. Y., Gong, S. L., Tan, S. C., Chen, B., Che, H. Z., and Li, T.: Mesoscale modelling study of the interactions between aerosols and PBL meteorology during a haze episode in China Jing–Jin–Ji and its near surrounding region – Part 2: Aerosols' radiative feedback effects, Atmos. Chem. Phys., 15, 3277–3287, https://doi.org/10.5194/acp-15-3277-2015, 2015.
Wang, J. D., Wang, S. X., Jiang, J. K., Ding, A. J., Zheng, M., Zhao, B., Wong, D. C., Zhou, W., Zheng, G. J., Wang, L., Pleim, J. E., and Hao, J. M.: Impact of aerosol-meteorology interactions on fine particle pollution during China's severe haze episode in January 2013, Environ. Res. Lett., 9, 094002, https://doi.org/10.1088/1748-9326/9/9/094002, 2014.
Wang, J. D., Zhao, B., Wang, S. X., Yang, F. M., Xing, J., Morawska, L., Ding, A. J., Kulmala, M., Kerminen, V. M., Kujansuu, J., Wang, Z. F., Ding, D. A., Zhang, X. Y., Wang, H. B., Tian, M., Petaja, T., Jiang, J. K., and Hao, J. M.: Particulate matter pollution over China and the effects of control policies, Sci. Total Environ., 584, 426–447, https://doi.org/10.1016/j.scitotenv.2017.01.027, 2017.
Wang, L. W., Wen, L., Xu, C. H., Chen, J. M., Wang, X. F., Yang, L. X., Wang, W. X., Yang, X., Sui, X., Yao, L., and Zhang, Q. Z.: HONO and its potential source particulate nitrite at an urban site in North China during the cold season, Sci. Total Environ., 538, 93–101, https://doi.org/10.1016/j.scitotenv.2015.08.032, 2015.
Wang, Y. S., Li, W. J., Gao, W. K., Liu, Z. R., Tian, S. L., Shen, R. R., Ji, D. S., Wang, S., Wang, L. L., Tang, G. Q., Song, T., Cheng, M. T., Wang, G. H., Gong, Z. Y., Hao, J. M., and Zhang, Y. H.: Trends in particulate matter and its chemical compositions in China from 2013–2017, Sci. China Earth Sci., 62, 1857–1871, https://doi.org/10.1007/s11430-018-9373-1, 2019.
Wang, Z. F., Li, J., Wang, Z., Yang, W., Tang, X., Ge, B., Yan,P., Zhu, L., Chen, X., and Chen, H.: Modeling study of regional severe hazes over mid-eastern China in January 2013 and its implications on pollution prevention and control, Sci. China Earth Sci., 57, 3–13, https://doi.org/10.1007/s11430-013-4793-0, 2014.
Wild, O., Zhu, X., and Prather, M. J.: Fast-j: Accurate simulation of in- and below-cloud photolysis in tropospheric chemical models, J. Atmos. Chem., 37, 245–282, https://doi.org/10.1023/A:1006415919030, 2000.
Wu, J. R., Bei, N. F., Hu, B., Liu, S. X., Wang, Y., Shen, Z. X., Li, X., Liu, L., Wang, R. N., Liu, Z. R., Cao, J. J., Tie, X. X., Molina, L. T., and Li, G. H.: Aerosol-photolysis interaction reduces particulate matter during wintertime haze events, P. Natl. Acad. Sci. USA, 117, 9755–9761, https://doi.org/10.1073/pnas.1916775117, 2020.
Xiong, C. R., Li, J., Liu, Z. X., and Zhang, Z. Y.: The dominant role of aerosol-cloud interactions in aerosol-boundary layer feedback: Case studies in three megacities in China, Front. Env. Sci.-Switz, 10, 1002412, https://doi.org/10.3389/Fenvs.2022.1002412, 2022.
Xue, C. Y., Zhang, C. L., Ye, C., Liu, P. F., Catoire, V., Krysztofiak, G., Chen, H., Ren, Y. G., Zhao, X. X., Wang, J. H., Zhang, F., Zhang, C. X., Zhang, J. W., An, J. L., Wang, T., Chen, J. M., Kleffmann, J., Mellouki, A., and Mu, Y. J.: HONO Budget and Its Role in Nitrate Formation in the Rural North China Plain, Environ. Sci. Technol., 54, 11048–11057, https://doi.org/10.1021/acs.est.0c01832, 2020.
Zaveri, R. A., Easter, R. C., Fast, J. D., and Peters, L. K.: Model for Simulating Aerosol Interactions and Chemistry (MOSAIC), J. Geophys. Res.-Atmos., 113, D13204, https://doi.org/10.1029/2007jd008782, 2008.
Zhang, B., Wang, Y., and Hao, J.: Simulating aerosol–radiation–cloud feedbacks on meteorology and air quality over eastern China under severe haze conditionsin winter, Atmos. Chem. Phys., 15, 2387–2404, https://doi.org/10.5194/acp-15-2387-2015, 2015.
Zhang, F. F.: Characteristics of Air Pollution and Chemical Composition of PM2.5 in Handan Master, College of Urban Construction, Hebei University of Engineering, https://www.cnki.net/KCMS/detail/detail.aspx?dbcode=CMFD& dbname=CMFD201601&filename=1015375754.nh&uniplatform =OVERSEA&v=2wa2h1BY1IjK8oKoBzUjfC3NyHI9ey1UGVZ YwOQ2-Q4PP76c8MmlzWxRmVRvrv7 (last access: 12 November 2023), 2015.
Zhang, F., Wang, Y., Peng, J. F., Chen, L., Sun, Y. L., Duan, L., Ge, X. L., Li, Y. X., Zhao, J. Y., Liu, C., Zhang, X. C., Zhang, G., Pan, Y. P., Wang, Y. S., Zhang, A. L., Ji, Y. M., Wang, G. H., Hu, M., Molina, M. J., and Zhang, R. Y.: An unexpected catalyst dominates formation and radiative forcing of regional haze, P. Natl. Acad. Sci. USA, 117, 3960–3966, https://doi.org/10.1073/pnas.1919343117, 2020.
Zhang, F. F., Xing, J., Ding, D. A., Wang, J. D., Zheng, H. T., Zhao, B., Qi, L., and Wang, S. X.: Role of black carbon in modulating aerosol direct effects driven by air pollution controls during 2013–2017 in China, Sci. Total Environ., 832, 154928, https://doi.org/10.1016/j.scitotenv.2022.154928, 2022.
Zhang, X., Zhang, Q., Hong, C. P., Zheng, Y. X., Geng, G. N., Tong, D., Zhang, Y. X., and Zhang, X. Y.: Enhancement of PM2.5 Concentrations by Aerosol-Meteorology Interactions Over China, J. Geophys. Res.-Atmos., 123, 1179–1194, https://doi.org/10.1002/2017JD027524, 2018.
Zhao, B., Liou, K. N., Gu, Y., Li, Q. B., Jiang, J. H., Su, H., He, C. L., Tseng, H. L. R., Wang, S. X., Liu, R., Qi, L., Lee, W. L., and Hao, J. M.: Enhanced PM2.5 pollution in China due to aerosol-cloud interactions, Sci. Rep.-UK, 7, 4453, https://doi.org/10.1038/S41598-017-04096-8, 2017.
Zhao, C., Liu, X., Leung, L. R., Johnson, B., McFarlane, S. A., Gustafson Jr., W. I., Fast, J. D., and Easter, R.: The spatial distribution of mineral dust and its shortwave radiative forcing over North Africa: modeling sensitivities to dust emissions and aerosol size treatments, Atmos. Chem. Phys., 10, 8821–8838, https://doi.org/10.5194/acp-10-8821-2010, 2010.
Zhao, C., Chen, S., Leung, L. R., Qian, Y., Kok, J. F., Zaveri, R. A., and Huang, J.: Uncertainty in modeling dust mass balance and radiative forcing from size parameterization, Atmos. Chem. Phys., 13, 10733–10753, https://doi.org/10.5194/acp-13-10733-2013, 2013.
Zheng, H., Cai, S., Wang, S., Zhao, B., Chang, X., and Hao, J.: Development of a unit-based industrial emission inventory in the Beijing–Tianjin–Hebei region and resulting improvement in air quality modeling, Atmos. Chem. Phys., 19, 3447–3462, https://doi.org/10.5194/acp-19-3447-2019, 2019.
Zhou, M., Zhang, L., Chen, D., Gu, Y., Fu, T. M., Gao, M., Zhao, Y. H., Lu, X., and Zhao, B.: The impact of aerosol-radiation interactions on the effectiveness of emission control measures, Environ. Res. Lett., 14, 024002, https://doi.org/10.1088/1748-9326/Aaf27d, 2019.