the Creative Commons Attribution 4.0 License.
the Creative Commons Attribution 4.0 License.
 | 20 Nov 2023
Sources and long-term variability of carbon monoxide at Mount Kenya and in Nairobi
Leonard Kirago
Örjan Gustafsson
Samuel Mwaniki Gaita
Sophie L. Haslett
Michael J. Gatari
Maria Elena Popa
Thomas Röckmann
Christoph Zellweger
Martin Steinbacher
Jörg Klausen
Christian Félix
David Njiru
August Andersson
Carbon monoxide (CO) concentrations in the troposphere are decreasing globally, with Africa as an exception. Yet, the region is understudied, with a deficit of ground-based observations and highly uncertain CO emission inventories. This paper reports multiyear observational CO data from the Mt. Kenya Global Atmosphere Watch (GAW) station, as well as summertime CO isotope observations from both Mt. Kenya and Nairobi, Kenya. The CO variability at Mt. Kenya is characterized by slightly increased concentrations during dry periods and a strong influence of short-term pollution events. While some data gaps and differences in instrumentation complicate decadal-scale trend analysis, a small long-term increase is resolved. High-pollution events are consistent with isotopic signal from downwind savanna fires. The isotope fingerprint of CO in Nairobi indicates an overwhelming dominance (near 100 %) of primary emissions from fossil fuel combustion with implications for air pollution policy. In contrast, the isotope signature of CO intercepted at the large-footprint Mt. Kenya region suggests that at least 70 % is primary sourced, with a predominance likely from savanna fires in Africa. Taken together, this study provides quantitative constraints of primary vs. secondary CO in the eastern Africa region and in urban Nairobi, with implications for satellite-based emission inventories as well as for chemical transport and climate modeling.
- Article
(3422 KB) - Full-text XML
-
Supplement
(874 KB) - BibTeX
- EndNote


Carbon monoxide (CO) is the dominant sink for the hydroxyl radical (OH), accounting for over 50 % of the consumption of OH in the atmosphere (Lelieveld et al., 2016). It therefore influences the atmosphere's oxidation and cleansing capacity and, by extension, chemically regulates the atmospheric lifetime and abundance of other reactive gases such as methane and halocarbons (Lelieveld et al., 2016; Zheng et al., 2019). As such, CO is an indirect greenhouse gas with a net positive warming effect on climate (Szopa et al., 2021). In addition to climate effects, CO is a precursor to the formation of ground-level ozone, with implications for human health (Chen et al., 2021; WHO, 2016; Zhang et al., 2019). Anthropogenic activities such as biomass burning and fossil fuel combustion are important contributors to the global CO budget, in addition to atmospheric reactions, e.g., oxidation of hydrocarbons (Duncan et al., 2007; Zheng et al., 2019). However, the CO source contributions, mole fractions, and atmospheric residence time are spatially variable, complicating the source–sink assessment.
Global CO levels have been declining over the past 2 decades but Africa is an exception. The key source of information on CO trends in the African region is satellite-based observations that show an increase in CO mole fractions (Buchholz et al., 2021; Hedelius et al., 2021; Zheng et al., 2019). However, the ground truthing of the satellite observations is challenged by a deficit of atmospheric observatories and scant continuous long-term observations in the region (DeWitt et al., 2019; Henne et al., 2008b; Kulmala, 2018). Exacerbating this observational deficit, regional CO emission inventories are not well-defined as the continent possesses a unique CO emission profile, different from other regions such as Europe and South Asia (Crippa et al., 2018; Dasari et al., 2021; Hedelius et al., 2021). To advance our understanding of trends in CO over Africa and its source contributions, long-term CO measurements and isotope-based source apportionment studies are required but data availability is scarce.
The isotopic composition of CO provides insights into the relative strengths of regional CO sources and atmospheric processing (Brenninkmeijer, 1993; Dasari et al., 2021; Henne et al., 2008b; Röckmann et al., 2002). A particular source of CO possesses a characteristic isotopic signature, with the isotopic composition of the ambient CO reflecting that of the combined sources, sinks, and atmospheric aging (Brenninkmeijer and Röckmann, 1997; Dasari et al., 2021; Popa et al., 2014; Röckmann et al., 1998, 2002). For example, CO from primary sources (fossil combustion and biomass burning) has a more enriched δ18O signature (above +12 ‰) compared to that of secondary formed CO, e.g., from oxidation of CH4 (at ∼ 0 ‰) and non-methane hydrocarbons (NMHC) at ∼ 2.4 ± 2.4 ‰ (Brenninkmeijer and Röckmann, 1997).
Additional source information can be obtained from the δ13C signatures. CO formed from methane oxidation is strongly depleted in 13C (δ13C = −51.9 ± 1.6 ‰) in contrast to, for example, CO emitted from burning of C4 plants (δ13C = −14.0 ± 3.8 ‰), C3 plants (δ13C = −26.9 ± 4.9 ‰), or fossil combustion at −27.8 ± 1.5 ‰ (Brenninkmeijer et al., 1999). However, the kinetic isotope effect (KIE) during the CO–OH reaction (the main atmospheric CO removal mechanism) results in the enrichment of δ13C by 4 ‰–5 ‰ and more depleted δ18O signatures (by ∼ 10 ‰) in the lower troposphere (Brenninkmeijer et al., 1999; Röckmann et al., 1998). Overall, isotope forensics can provide valuable data on CO emissions in remote and urban locations in Africa, especially considering that the region is largely understudied, with very few ground-based CO observations and highly uncertain emission inventories.
This study investigates the long-term trends in CO mole fractions at Mt. Kenya GAW station, a high-altitude monitoring site in equatorial East Africa well suited to intercept the regional emission footprint. Online CO mole fraction measurements have been conducted at the observatory since 2002, albeit with large data gaps due to technical challenges. Flask-based measurements carried out at Mt. Kenya at different periods by NOAA (2003–2011) were used for gap filling. The online and NOAA flask-measured CO data were obtained from the World Meteorological Organization's (WMO's) World Data Centre for Greenhouse Gases (WDCGG) database. After the CO measurements from Cape Point, South Africa, these are likely the longest-running data available in sub-Saharan Africa and provide observational constraints of the region's long-term trend in CO. The present study additionally provides stable isotope composition data of CO to resolve source attribution of the observed higher summertime CO mole fraction. Furthermore, the data are compared to previously obtained and unpublished isotope data from Mt. Kenya (1996–1997; earlier unpublished work by Röckmann and Brenninkmeijer) and those of an urban site in Nairobi in summer 2021 to provide further insights into regional CO sources. This dataset is unprecedented in the region and facilitates improved understanding of the regional CO emission trends and source attribution.
2.1 Measurement sites
Ambient air sampling was conducted at a remote mountain site, the Mt. Kenya Global Atmospheric Watch (GAW) station, and in Nairobi. The Mt. Kenya GAW station is located on the northwestern slope of Mt. Kenya (0.062∘ S, 37.297∘ E; at 3678 m m.s.l.) in eastern equatorial Africa. The station description, site selection and representativeness, and meteorological characterization are detailed by Henne et al. (2008a, b). In brief, the station lies within a nature conservancy, the Mount Kenya National Park, and contributes to the World Meteorological Organization GAW program. The closest human settlements and roadways are over 17 km away and the nearest town (Nanyuki) is at 1900 m m.s.l. A small touristic infrastructure, the Old Moses Mountain Camp, is situated 300 m below and ca. 1.9 km to the NNW of the station. The second site, in the megacity of Nairobi, Kenya, was a rooftop measurement site (∼ 17 m above ground level (a.g.l.); 1690 m above seal level (a.s.l.); 1.279∘ S, 36.817∘ E). As described previously, the Nairobi site is representative of the city's ambient conditions (Kirago et al., 2022b).
2.2 Ambient air sampling
Glass flask sampling was conducted in August 2021 at the Mt. Kenya GAW station and in Nairobi with an in-house assembled portable sampler consisting of a diaphragm pump (KNF Neuberger N86E) connected with 1/4 in. Dekabon tubing. The sampler design, glass flask pre-conditioning protocol, and sampling procedure have been previously described (Dasari et al., 2021). Briefly, the sampler was designed to fill two pre-conditioned glass flasks (Normag, 1 L) simultaneously – that is, each sample was collected in duplicate. Ambient air was drawn at a flow rate of 2 L min−1 and dried through a magnesium perchlorate trap. First, the glass flasks were flushed for 20 min before compressing the dried air to an absolute pressure of ∼ 1.7 bar (170 kPa). At Mt. Kenya GAW station, 21 nighttime (02:00 local time) and 6 daytime (14:00 local time) air sample sets were collected. Nine sample pairs were collected in Nairobi (every second day; daytime only; 14:00 local time). The filled glass flasks were sent to the Institute for Marine and Atmospheric Research Utrecht (IMAU), Utrecht University, for processing and stable isotope analysis of CO.
2.3 Measurements of CO mole fractions and stable isotopes (δ18O and δ13C) composition of CO
The CO mole fraction and stable isotopic composition measurements of the collected glass flask samples were performed at IMAU, Utrecht University. A continuous-flow isotope ratio mass spectrometry (CF-IRMS, Thermo Scientific Delta V Advantage) system was used, applying a previously described measurement protocol (Pathirana et al., 2015). In brief, the sample gas was introduced into the analytical system using an automated multi-port unit, via a mass flow controller and under ultra-high-purity helium flow. Here, the air sample was directed through a trap with Ascarite (8–20 mesh, Thermo Scientific™) followed by magnesium perchlorate (Sigma-Aldrich) to remove CO2 and water. A subsequent cryogenic trap (liquid N2, −196 ∘C) was used to remove the remaining traces of CO2, N2O, and hydrocarbons. The CO in the clean air matrix was then oxidized to CO2 using Schütze reagent ( mixture on granular silica gel) synthesized in-house. Subsequently, the CO-derived CO2 was cryo-trapped in liquid N2, while other residual gases (e.g., O2 and N2) were pumped out. The sample was further purified on a gas chromatography (GC) column, dried via a Nafion dryer, and subsequently transferred to the CF-IRMS via an open split inlet for stable isotope (δ18O and δ13C) analysis (Pathirana et al., 2015). The original CO mole fraction was deduced from the quantity of the derived CO2.
The isotopic composition is expressed as per mil (‰) enrichment or depletion of the isotope ratio in the sample relative to that of international standard materials, which in these cases are the Vienna Pee Dee Belemnite (VPDB) standard for δ13C-CO and the Vienna Standard Mean Ocean Water (VSMOW) for δ18O-CO measurements (Brenninkmeijer et al., 1999; Pathirana et al., 2015). A reference cylinder with atmospheric air with known isotopic composition and mole fraction (δ13C = −30.25 ‰; δ18O 7.10 ‰; CO = 180 ppb) was used for calibration. Periodical measurements of “target” gases were used to monitor the precision and accuracy of the measurements, as well as the long-term stability of the analytical system (Pathirana et al., 2015). In addition, blank runs (without injecting the sample or reference gas) were performed to assess the background CO2, mainly from the Schütze reagent. The typical 1-sigma measurement reproducibility during the time of these analyses is estimated at 0.12 ‰ for δ13C and 0.16 ‰ for δ18O.
2.4 Sampling and isotopic characterization of CO for the 1996/97 campaign
High-volume air samples were collected between July and September 1996 on an exploratory mission around Mount Kenya following the ring road A2/B6 and branching off towards the mountain to locations where sufficient power was available for sample collection. During this campaign and later incidental samplings in 1997 air samples of approximately 500 L volume were compressed into 5 L aluminum cylinders using a modified RIX compressor (Mak and Brenninkmeijer, 1994). Unfortunately, records of precise locations have been lost. The filled cylinders were sent to the Max Planck Institute for Chemistry in Mainz, Germany, for CO isotope analysis on a high-volume extraction unit (Brenninkmeijer et al., 1999; Röckmann et al., 2002). A high-CO-concentration calibration gas (269 ppm) that was used during the 1996/97 measurements has been preserved and is regularly measured in the lab of Utrecht University to ensure scale compatibility.
2.5 Long-term CO mole fractions at the Mt. Kenya GAW station
High-resolution CO data from Mt. Kenya GAW station are available from the WMO's World Data Centre for Greenhouse Gases (WDCGG; https://gaw.kishou.go.jp/, last access: 2 July 2023). A continuous time series is available for the 2002–2006 and 2020–2021 periods, with some large gaps attributable mainly to power outages and data quality issues. Between 2010 and 2015, the station was disconnected from the power grid following a bush fire, while performance audits revealed the CO analyzer to be in poor working condition between 2015–2019 (decommissioned in 2020), compromising the data quality (Zellweger et al., 2020). Over time, the CO measurements were made using different CO analyzers (Thermo Electron Corporation TEI 48C-TL in 2002–2006, Horiba APMA360 in 2010–2019, and Picarro G2401 in 2020–2021).
The instrument calibration, quality control protocols, and data treatment procedures are discussed elsewhere (Henne et al., 2008b; Zellweger et al., 2009, 2020). In brief, ambient air was drawn into the CO instrument using 1/4 in. Teflon (till 2019) and 1/4 in. Synflex 1300 (after 2019) tubing at a flow rate of 4 L min−1 via a Nafion drier to remove moisture and a particle filter. The air inlet was about 7 m above ground and protected against rain, snow, and direct wind. These instruments were installed and calibrated by the Swiss Federal Institute for Materials Science and Technology (Empa) in collaboration with the Federal Office of Meteorology and Climatology MeteoSwiss and operated by the Kenya Meteorological Department (KMD). The instrument calibration and performance audits are conducted regularly by the GAW World Calibration Center hosted at Empa (Zellweger et al., 2020). In addition, flask-based CO data from Mt. Kenya GAW station by the NOAA Global Monitoring Laboratory published in the WDCGG database were used in this study (Petron, 2023).
2.6 Trajectory and statistical modeling
The air mass back trajectories (10 d; arrival height of 100 m a.g.l.) were calculated to identify the air mass source region. The NOAA Hybrid Single-Particle Lagrangian Integrated Trajectory model (HYSPLIT, version 4) and Global Data Assimilation System (GDAS) (1∘ × 1∘) archived meteorological datasets were used (Stein et al., 2015). The Bayesian Markov chain Monte Carlo (MCMC) model was used to quantitatively constrain CO fractional contributions and account for source end member variability and measurement uncertainties (Dasari et al., 2021). The MCMC simulations were carried out with MATLAB R2020 with 1 000 000 runs and 10 000 runs for sample burn-in and a data thinning of 100.
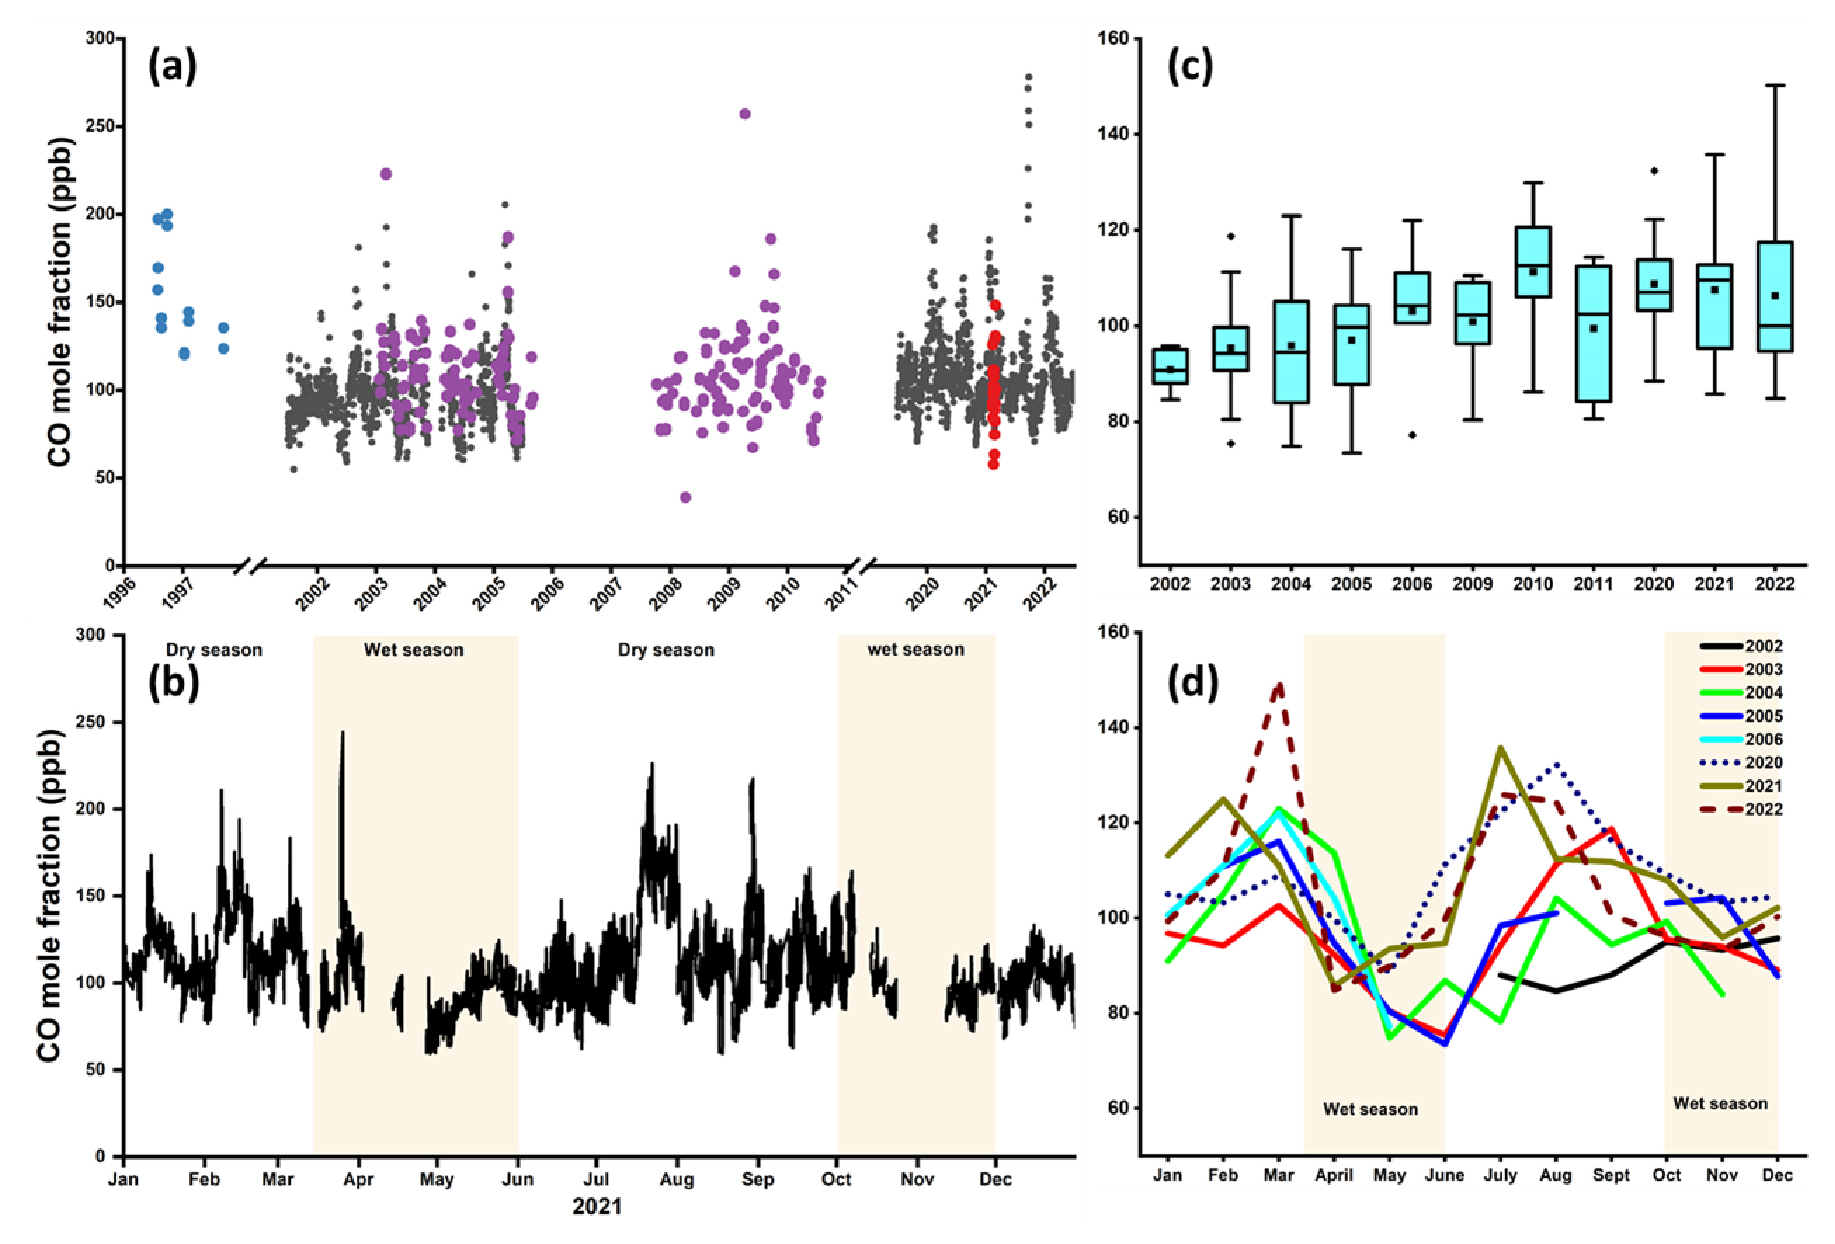
Figure 1Time series of CO mole fractions at Mt. Kenya GAW station. (a) Daily resolution continuously measured CO mole fraction (Picarro) at Mt. Kenya GAW is represented by black dots. The CO data were retrieved from the WMO's WDCGG database covering 2002–2021. Different instrumentations were used over time, but similar instrumental calibration, quality control, and assurance protocols were applied. Flask-based measurements by NOAA at the station are presented in purple symbols, while flask samples during 1996/97 campaigns are shown as blue dots and flask samples from the 2021 campaign are shown in red symbols, in good agreement with the online measurements, as shown in Fig. S4. (b) Variations of CO mole fractions for the year 2021. The prevailing typical weather conditions are indicated. (c) Annual averaged CO mixing ratios. The boxes represent the 25th and 75th quantiles, and the black line represents the median value. The bottom and top whiskers are the minimum and maximum values, respectively, while diamonds represent the outliers. (d) Interannual cycles of monthly averaged CO mole fractions (colored lines represent individual years).
3.1 CO mole fractions at Mt. Kenya GAW station and Nairobi
The results of the CO observations at Mt. Kenya GAW station, both online and flask measurements, are presented in Fig. 1. Some of the data (2002–2006) have been comprehensively discussed previously (Henne et al., 2008b). Overall, peak CO mole fractions were observed during the dry periods (Fig. S1 in the Supplement). Assessment of the long-term CO trend, following the approach by Thoning and Tans (1989), reveals a small but statistically significant positive decadal trend of 6.7 ± 0.4 ppb per 10 years. This statistical model is based on a fit function that includes a linear term, a quadratic term, and first and second harmonics. For comparison, simple linear regression gives a similar decadal rate of 6.2 ± 0.6 ppb per 10 years (for uncertainty estimation, see Kirago et al., 2022a). Like many types of environmental data, the present CO data display a lognormal-like concentration distribution, suggesting influence by exponential processes such as sink kinetics (Andersson, 2021). This may influence trend analysis. Similarly to linear regression, regression of log-transformed data also gives a significant positive rate, which suggests that the skewed concentration profile has little influence on trend estimation. However, given the large data gaps and different measurement techniques, such interpretations should not be overemphasized. Nevertheless, the increasing trend here constrained for ground observations of CO is qualitatively consistent with satellite retrievals and model estimates for sub-Saharan Africa (Buchholz et al., 2021; Hedelius et al., 2021; Zheng et al., 2019).
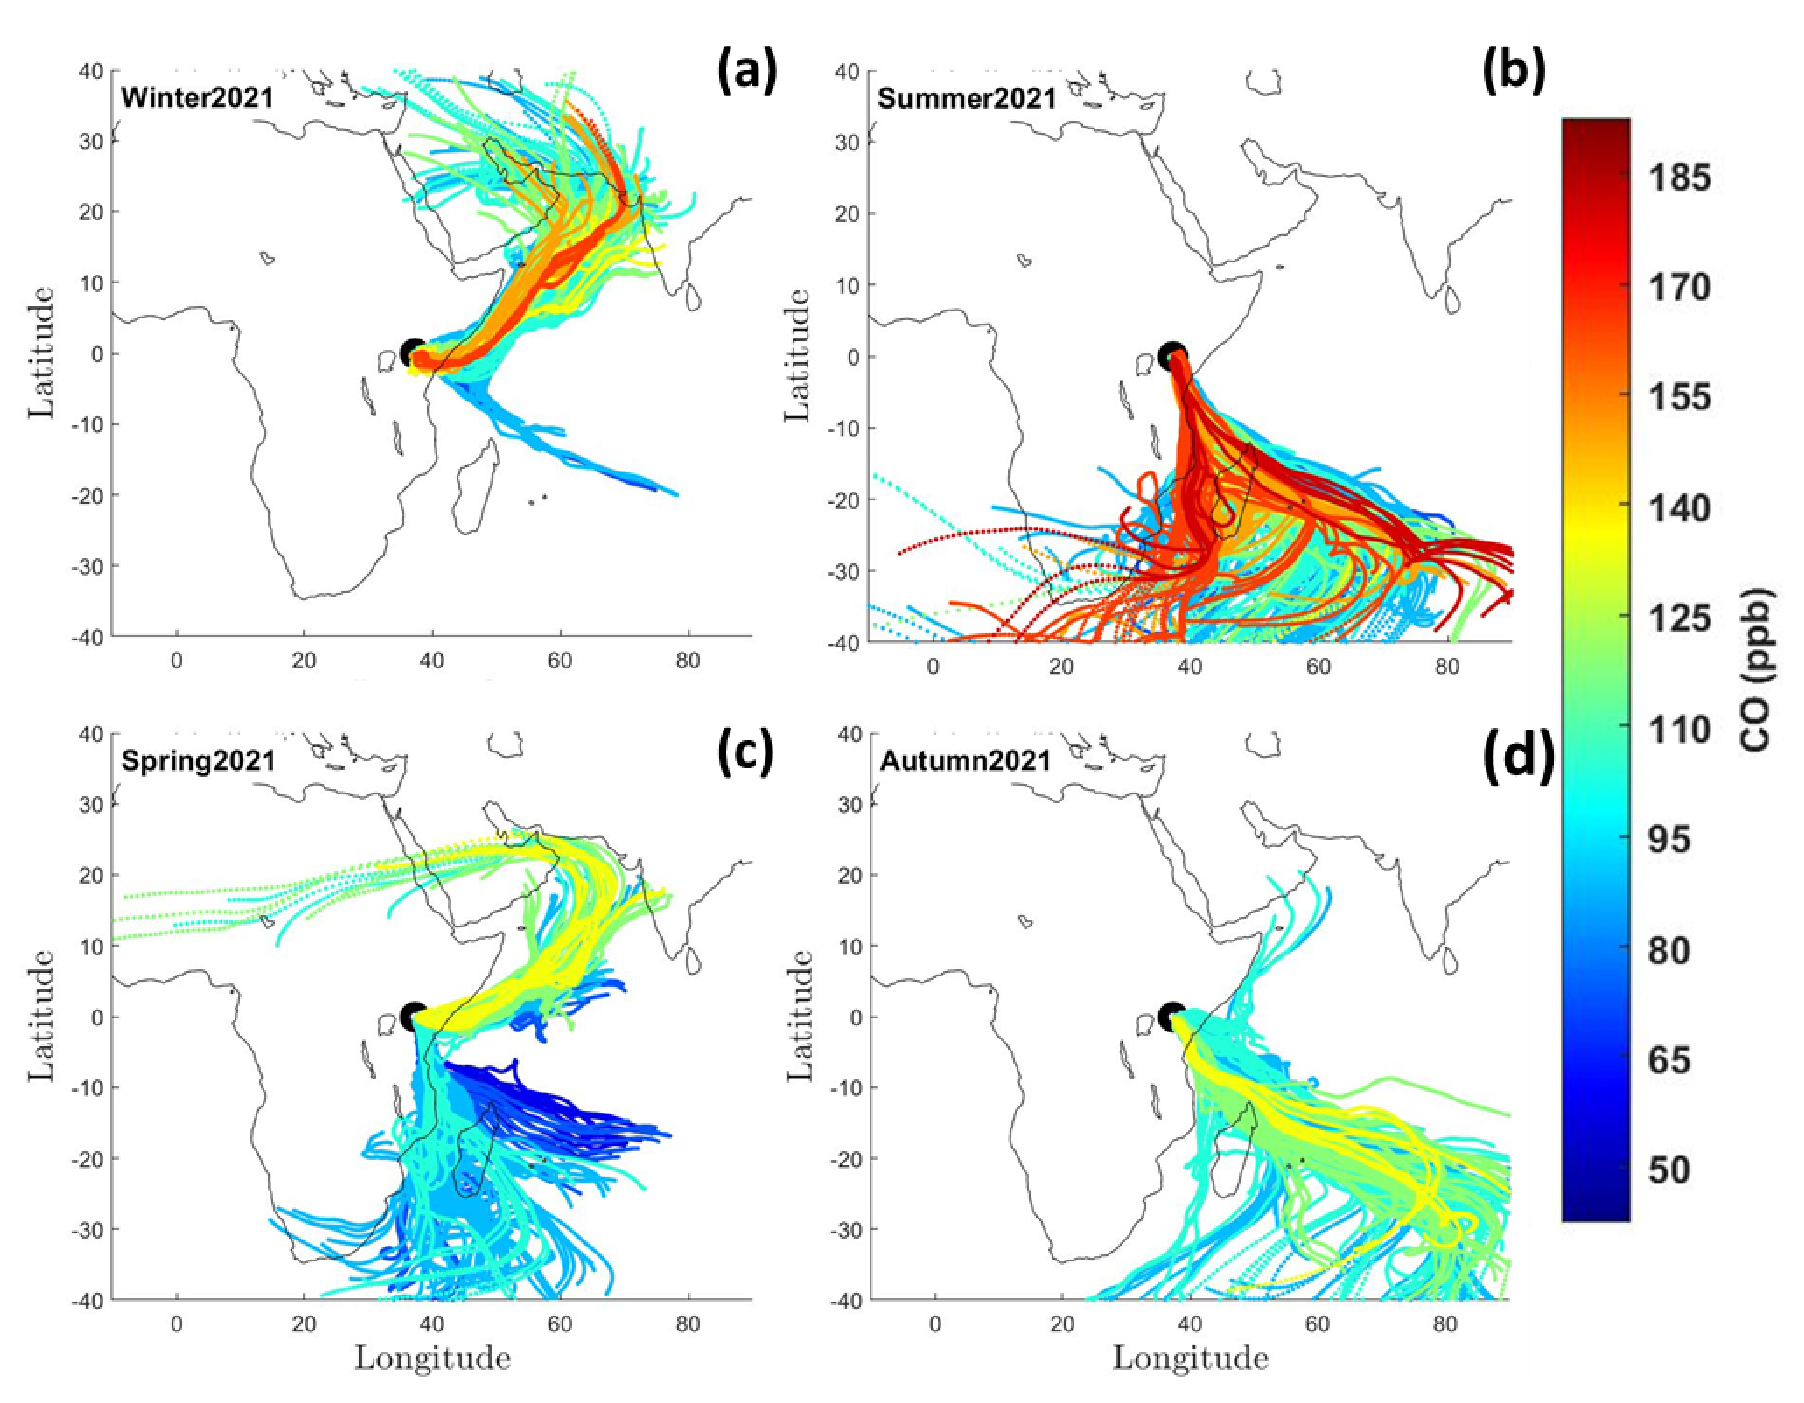
Figure 2Seasonal changes in CO-concentration-coded back trajectories intercepted at Mt. Kenya: (a) December–February 2021, (b) June–August 2021, (c) March–May 2021, and (d) September–November 2021. The 10 d air masses back trajectories are calculated at an arrival height of 100 m a.g.l.
The observed CO levels, ranging between 55–250 ppb, are comparable to those previously recorded at Mt. Kenya station (Henne et al., 2008b) but lower than CO concentrations reported at the Rwanda Climate Observatory – another remote site also in eastern Africa – possibly with a stronger and more direct influence of savanna burning episodes (DeWitt et al., 2019). The daytime and nighttime ambient flask CO concentrations were comparable, similar to observations from Picarro-measured CO measurements though with a slight daytime elevation (Fig. S1). During the nighttime, the station stands above the atmospheric boundary layer; hence, there is a reduced influence from local sources. Overall, changes in source strength, air mass transport pathways, and meteorological parameters such as planetary boundary layer thickness are likely to be key drivers of the observed temporal variations. In Nairobi, the CO concentrations during August 2021 range between 200–700 ppb (∼ 0.2–0.8 mg m−3, assuming average weather conditions), well within the WHO recommended short-term (24 h average) air quality guideline level of 4 mg m−3 (WHO, 2021). While CO is not a major direct health concern in Nairobi or in other urban settings (Chen et al., 2021), it affects the presence of health-detrimental components such as ground-level ozone and secondary aerosols.
Back trajectories calculated with the HYSPLIT model were combined with the CO data to learn more about source regions incident with elevated CO mole fractions. Air masses originating from different geographical areas, such as from eastern Africa, the Arabian Peninsula, northern Africa, South Asia, and southeastern Africa, as well as cleaner air masses from the Indian Ocean, are intercepted at Mt. Kenya GAW station (Fig. 2). This underlines the suitability of Mt. Kenya GAW station to capture both the regional and intercontinental footprints. The elevated summertime (June–August) CO mole fractions are linked to the arrival of southeasterly air masses, coinciding with large-scale savanna fires in southern Africa and Madagascar. The air masses shift northeasterly during winter (December–March) and coincide with savanna fires in northern Africa (Andersson et al., 2020; Kirago et al., 2022a). Although the intercepted air masses do not directly flow over west-central sub-Saharan Africa, where most fires occur, the atmospheric residence time of CO is sufficient for regional and intercontinental mixing. Air masses with elevated CO loadings from South Asia and the Arabian Peninsula are also intercepted during winter. High wintertime CO mole fractions have been reported from a South Asian receptor site in the northern Indian Ocean (Dasari et al., 2021). Taken together, the seasonal variability in CO mole fraction can partly be explained by regional emission events, combined with a contribution from other geographical source regions such as South Asia.
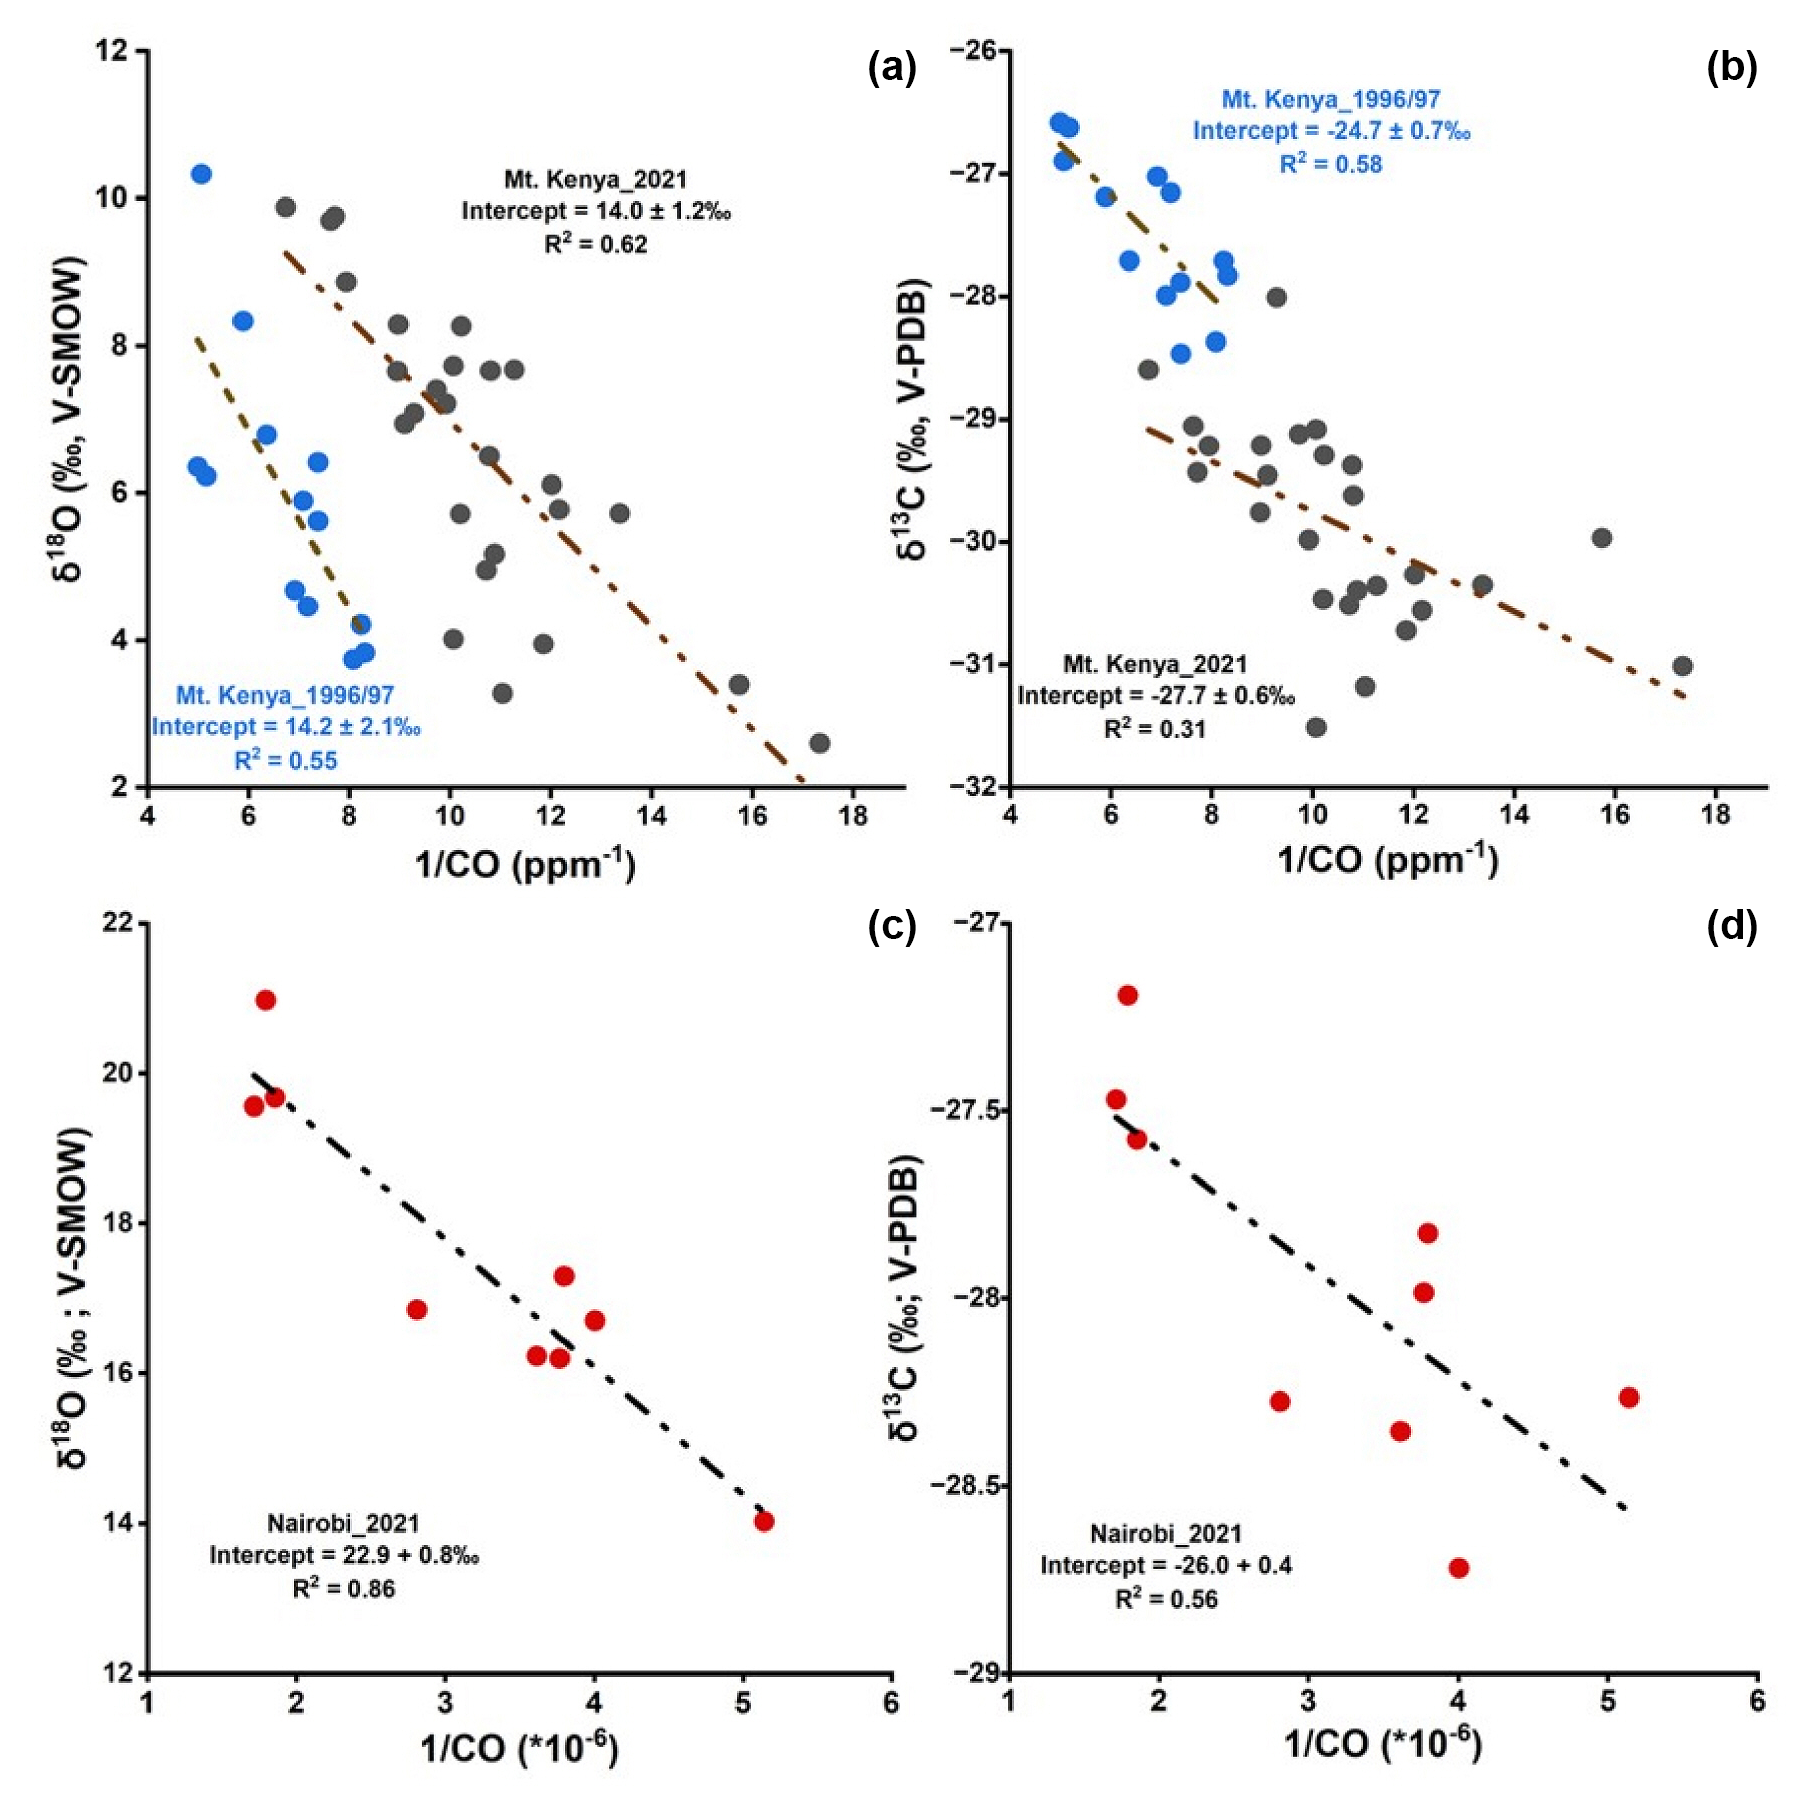
Figure 3The Keeling relation plots (i.e., signatures of the two isotopic systems vs. the inverse of the measured CO mole fraction) for Mt. Kenya (a, b) and Nairobi (c, d). The y intercept in the Keeling relationship represents the source signature.
3.2 Isotopic constraints of sources to CO from Mount Kenya and Nairobi
The stable isotope composition of CO (δ13C and δ18O) for ambient samples from Mt. Kenya GAW station during August 2021 varied temporally with the CO mole fractions (Fig. S2). The δ13C ranged between −31.5 ‰ and −28.0 ‰, while δ18O ranged between 2.5 ‰ and 10.0 ‰ (Fig. S2). However, there were no distinct temporal or diurnal trends in the recorded isotopic values (both daytime and nighttime samples were measured). The air masses were consistently southeasterly during the 3-week study period (Fig. S3). Comparable δ18O composition was observed in 1996/97 samples (ranged between 3.7 ‰ to 10.4 ‰) but was more enriched in δ13C (−28.4 ‰ to −26.6 ‰). The isotopic composition in the Mt. Kenya background region was distinct from that of the urban Nairobi location that recorded highly enriched δ18O values (17.5 ± 2.2 ‰; Fig. S2).
The Keeling plot approach provides insights into the regional CO sources. Here, a linear relationship is observed between the isotope signatures and the inverse of the CO mole fraction (δ13C vs. 1/[CO] and δ18O vs. 1/[CO]) both at Mt. Kenya and in Nairobi (Fig. 3). This implies that the CO dynamics in this system can be described by a two-component mixture: a relatively stable background fraction and a regional varying source (Dasari et al., 2021; Keeling, 1958). The y-axis intercept in this relation represents the source signature. At Mt. Kenya, analysis of the recently obtained dataset (2021) reveals the stable isotopes signature of the source of δ18O = 14.0 ± 1.2 ‰ and δ13C = ‰. For the samples collected during the 1996/97 campaign, the δ18O signature is very similar and indistinguishable (δ18O = 14.2 ± 2.1 ‰), while the source is more enriched in 13C (δ13C = −24.7 ± 0.7 ‰; Fig. 4). The latter suggests differences in the relative strengths of the contributing sources, possibly a relatively higher contribution from C4 plant burning or a relatively smaller influence of secondary CO from atmospheric reactions during the 1996/97 campaign. It should be kept in mind that the 1990s samples were obtained at a lower-altitude location on the slopes of Mt. Kenya. C4 plants like maize and sugarcane are commonly grown in Kenya, while also biomass usage (including crop residuals for household energy) and agricultural burning are prevalent in the region (World Bank, 2011). In Nairobi, a clearly distinct source signature is noted, especially for δ18O (δ13C = −26.0 ± 0.4 ‰ and δ18O = 22.9 ± 0.8 ‰; Fig. 4). The highly enriched δ18O source signature in Nairobi indicates almost exclusively high-temperature combustion sources, while a mixed source regime (both combustion sources and CO emanating from atmospheric reactions) is observed at Mt. Kenya; these can be quantitatively resolved using an isotopic mass balance approach.
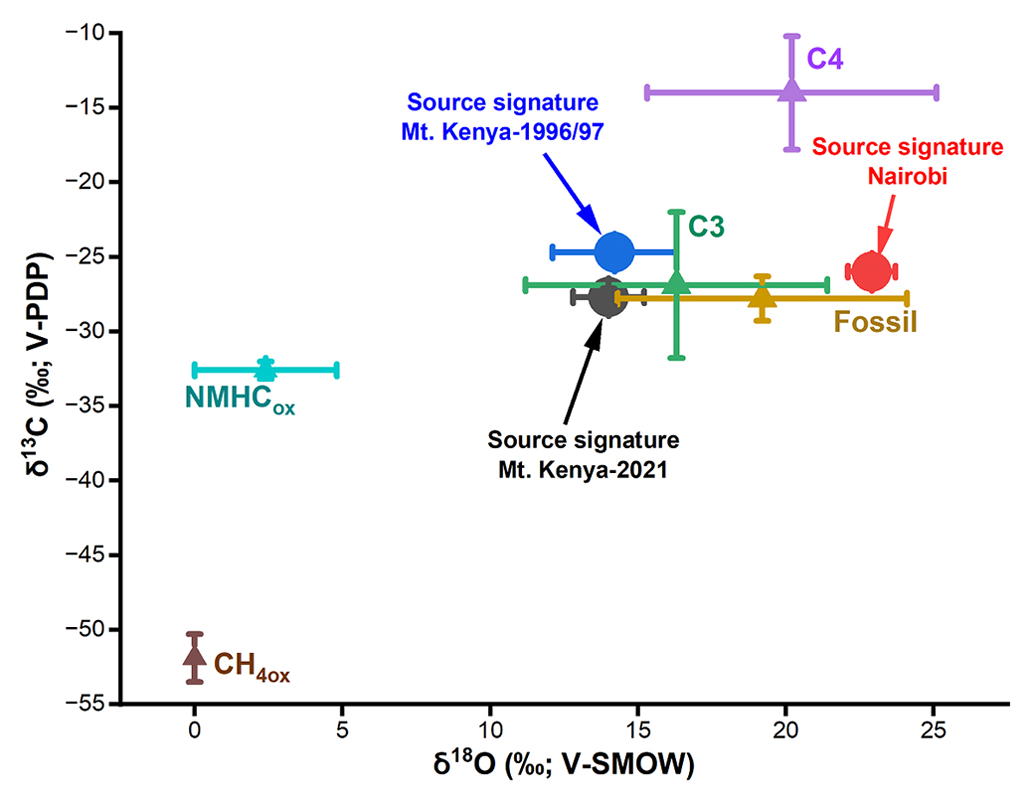
Figure 4Stable isotope (δ13C and δ18O) source signatures of CO for Nairobi and Mt. Kenya (2021 and 1996/97) and the source end members. The source end members are adopted from Brenninkmeijer et al. (1999).
The source signatures can be used to quantitatively constrain the fractional contributions of CO in the regional background and urban atmosphere (Dasari et al., 2021). However, information was available for only two isotopes, δ13C and δ18O, against five potential sources that can contribute to the overall CO isotopic signature (C3 plants, fossil, C4 plants, CH4 oxidation, and NMHC oxidation), yielding a mathematically under-determined scenario. Furthermore, the weak linear correlation for δ13C in the Keeling plot (δ13C vs. 1/[CO]; R2=0.34 for Mt. Kenya) limits its application in the statistical model. Therefore, only δ18O signatures were modeled here (R2=0.64 for both Mt. Kenya; R2=0.89 for Nairobi; P<0.05). Hence, the CO sources were partitioned into two major classes: primary/combustion (fossil, C3, and C4 biomass) and secondary (i.e., oxidation of methane and NMHC).
A Bayesian statistical model, drawing upon the model described in Dasari et al. (2022), was used to estimate the contribution of secondary (fsecondary) vs. primary (fprimary) CO sources. In this model the relative contributions of primary vs. secondary CO for the temporally varying source are computed, corresponding to the δ18O values at the limit where 1/CO approaches zero (the δ18O intercept in the Keeling plot). First, the source end members for the two fractions were established. Unlike the oxidation of NMHC, the CH4-oxidized CO fluxes have little variability (CH4 has a long atmospheric lifetime) and largely contribute to the background signal (Dasari et al., 2021; Worden et al., 2019; Zheng et al., 2019). Therefore, the temporally varying secondary CO end member was assigned to the NMHC oxidation source (δ18Osecondary=2.4 ± 2.4 ‰).
The primary CO end member is a composite of the three combustion sources: C4 biomass (+20.2 ± 4.9 ‰), C3 biomass (+16.3 ± 5.1 ‰), and fossil fuel combustion at +19.2 ± 4.9 ‰ (Dasari et al., 2021). Although the relative contributions are uncertain, the δ18O end members largely overlap. Model estimates show biomass burning in Africa accounts for 80 %–90 % of the surface CO emissions (Zheng et al., 2018). Similar contributions to black carbon (different but co-emitted incomplete combustion product) were observed using isotopic constraints with near-equal contributions from C3 and C4 biomass in the eastern Africa background atmosphere (Kirago et al., 2022a). Therefore, the relative source contributions were estimated at 50 % from C3 biomass and 50 % from C4 and fossil sources at Mt. Kenya. Hence, a primary CO end member was established at δ18Oprimary= 18.4 ± 3.5 ‰. In Nairobi, fossil fuel combustion was estimated to contribute to 85% of the CO emissions in the city (δ18O19.2 ± 4.9 ‰). Since primary source end members largely overlap, the model simulations were generally insensitive to chosen priors, as investigated by sensitivity analysis.
A similar δ18O source signature (∼ 14.0 ± 2.1 ‰) was observed at the two Mt. Kenya campaigns (1996/97 and 2021). Applying the established end members, we estimate the contribution of CO from primary/combustion sources at the regional background site to be at least 70 %. In contrast, we found an almost exclusively primary CO component for the urban Nairobi case. Nairobi is a strong air pollution source region, and the CO loadings largely reflect the city's CO emissions. CO is, e.g., a precursor to low-level ozone, and thus emissions deteriorate air quality. Present findings show that air quality policy should target primary emissions, especially from traffic (Kirago et al., 2022b). In contrast, Mt. Kenya GAW station captures a more regional footprint with a dominant contribution from savanna fires.
This study provides ground-observational constraints that broadly support earlier suggestions that savanna fires are the main emitters and modulators of CO loadings over sub-Saharan Africa. Although the data gaps in CO mixing ratios and mixed instrumentation complicate detailed analysis, a small decadal increase of 6.7 ± 0.4 ppb per 10 years was resolved for the Mt. Kenya GAW station, in agreement with satellite observations and emission inventories for the sub-Saharan region (Buchholz et al., 2021; Hedelius et al., 2021; Zheng et al., 2019). Isotope-based source apportionment shows that at least two-thirds of the CO emitted from East African savanna fires is of primary origin, while for Nairobi primary sources approach 100 %. The latter has implications for air quality policy, suggesting primary emissions such as traffic should be targeted, in line with previous findings for black carbon aerosols (Kirago et al., 2022b). These findings put constraints on satellite-based emission inventories and chemical transport and climate modeling. Overall, this study corroborates earlier findings that in order to reduce the secondary climate warming effect from CO over sub-Saharan Africa, human-caused savanna fires should be reduced (Andersson et al., 2020).
Data from this study will be available in the Bolin Centre Database (https://doi.org/10.17043/andersson-2022-nairobi-1, Andersson, 2023).
The Supplement contains the flask-based CO measurement data for the 1996/97 and 2021 sampling campaigns and the respective stable isotopes of CO (Tables S1–S3). The supplement related to this article is available online at: https://doi.org/10.5194/acp-23-14349-2023-supplement.
Conceptualization of the study by AA. Design and execution of field campaigns by LK, AA, SMG, and MJG. Management of Mt. Kenya GAW station and instrument calibration by DN, JK, CZ, CF, and MS. Isotope analysis by MEP. The 1996/97 sampling campaign and sample analysis by TR. Data analysis by LK with support from AA, ÖG, SLH, and SMG; paper written by LK with support from co-authors.
The contact author has declared that none of the authors has any competing interests.
Publisher’s note: Copernicus Publications remains neutral with regard to jurisdictional claims made in the text, published maps, institutional affiliations, or any other geographical representation in this paper. While Copernicus Publications makes every effort to include appropriate place names, the final responsibility lies with the authors.
This work was supported by research grants from the Swedish Research Council (VR contracts nos. 2013-114, 2017-05687, and 2020-05384), the Swedish Research Council for Sustainable Development (FORMAS contract no. 2020-01951), and the Swedish Research Council Distinguished Professor Grant (VR contract no. 2017-01601). Sample analysis was supported by the research grants from European Commission under the Horizon 2020 – Research and Innovation Framework Programme – H2020-INFRAIA-2020-1 (grant agreement no. 101008004).
We commend the efforts of the Kenya Meteorological Department (KMD), the Swiss Federal Institute for Materials Science and Technology (Empa), and the Federal Office of Meteorology and Climatology MeteoSwiss for Mt. Kenya GAW station operations. We appreciate the field and technical support from the staff at the Institute of Nuclear Science & Technology, University of Nairobi, and KMD. We commend Carl Brenninkmeijer and Sergey Gromov for their contribution to science, as well as their contribution to the 1996/97 campaign and the data used in this paper.
We acknowledge the use of data from the World Data Centre for Greenhouse Gases (WDCGG) database (https://gaw.kishou.go.jp/, last access: 2 July 2023), hosted by the World Meteorological Organization. The authors gratefully acknowledge the NOAA Air Resources Laboratory (ARL) for the provision of the HYSPLIT transport and dispersion model as well as the READY website (https://www.ready.noaa.gov, last access: 16 February 2023) used in this publication.
This research has been supported by the Vetenskapsrådet (grant nos. 2013-114, 2017-05687, 2020-05384, and 2017-01601), the Svenska Forskningsrådet Formas (grant no. 2020-01951), and Horizon 2020 (grant no. 101008004).
The article processing charges for this open-access publication were covered by Stockholm University.
This paper was edited by Katye Altieri and reviewed by two anonymous referees.
Andersson, A.: Mechanisms for log normal concentration distributions in the environment, Sci. Rep., 11, 1–7, https://doi.org/10.1038/s41598-021-96010-6, 2021.
Andersson, A.: Air pollution status and sources of black carbon aerosols in Nairobi, Kenya, Bolin Centre database [data set], https://doi.org/10.17043/andersson-2022-nairobi-1, 2023.
Andersson, A., Kirillova, E. N., Decesari, S., DeWitt, L., Gasore, J., Potter, K. E., Prinn, R. G., Rupakheti, M., de Dieu Ndikubwimana, J., Nkusi, J., and Safari, B.: Seasonal source variability of carbonaceous aerosols at the Rwanda Climate Observatory, Atmos. Chem. Phys., 20, 4561–4573, https://doi.org/10.5194/acp-20-4561-2020, 2020.
Brenninkmeijer, C. A. M.: Measurement of the abundance of 14CO in the atmosphere and the 13C/12C and 18O/16O ratio of atmospheric CO with applications in New Zealand and Antarctica, J. Geophys. Res., 98, 10595–10614, https://doi.org/10.1029/93jd00587, 1993.
Brenninkmeijer, C. A. M. and Röckmann, T.: Principal factors determining the 18O/16O ratio of atmospheric CO as derived from observations in the southern hemispheric troposphere and lowermost stratosphere, J. Geophys. Res.-Atmos., 102, 25477–25485, https://doi.org/10.1029/97jd02291, 1997.
Brenninkmeijer, C. A. M., Röckmann, T., Bräunlich, M., Jöckei, P., and Bergamaschi, P.: Review of progress in isotope studies of atmospheric carbon monoxide, Chemosph. Glob. Chang. Sci., 1, 33–52, https://doi.org/10.1016/S1465-9972(99)00018-5, 1999.
Buchholz, R. R., Worden, H. M., Park, M., Francis, G., Deeter, M. N., Edwards, D. P., Emmons, L. K., Gaubert, B., Gille, J., Martínez-Alonso, S., Tang, W., Kumar, R., Drummond, J. R., Clerbaux, C., George, M., Coheur, P. F., Hurtmans, D., Bowman, K. W., Luo, M., Payne, V. H., Worden, J. R., Chin, M., Levy, R. C., Warner, J., Wei, Z., and Kulawik, S. S.: Air pollution trends measured from Terra: CO and AOD over industrial, fire-prone, and background regions, Remote Sens. Environ., 256, 112275, https://doi.org/10.1016/j.rse.2020.112275, 2021.
Chen, K., Breitner, S., Wolf, K., Stafoggia, M., Sera, F., Vicedo-Cabrera, A. M., Guo, Y., Tong, S., Lavigne, E., Matus, P., Valdés, N., Kan, H., Jaakkola, J. J. K., Ryti, N. R. I., Huber, V., Scortichini, M., Hashizume, M., Honda, Y., Nunes, B., Madureira, J., Holobâcă, I. H., Fratianni, S., Kim, H., Lee, W., Tobias, A., Íñiguez, C., Forsberg, B., Åström, C., Ragettli, M. S., Guo, Y. L. L., Chen, B. Y., Li, S., Milojevic, A., Zanobetti, A., Schwartz, J., Bell, M. L., Gasparrini, A., and Schneider, A.: Ambient carbon monoxide and daily mortality: a global time-series study in 337 cities, Lancet Planet. Heal., 5, e191–e199, https://doi.org/10.1016/S2542-5196(21)00026-7, 2021.
Crippa, M., Guizzardi, D., Muntean, M., Schaaf, E., Dentener, F., van Aardenne, J. A., Monni, S., Doering, U., Olivier, J. G. J., Pagliari, V., and Janssens-Maenhout, G.: Gridded emissions of air pollutants for the period 1970–2012 within EDGAR v4.3.2, Earth Syst. Sci. Data, 10, 1987–2013, https://doi.org/10.5194/essd-10-1987-2018, 2018.
Dasari, S., Andersson, A., Popa, M. E., Röckmann, T., Holmstrand, H., Budhavant, K., and Gustafsson, Ö.: Observational Evidence of Large Contribution from Primary Sources for Carbon Monoxide in the South Asian Outflow, Environ. Sci. Technol., 56, 165–174, https://doi.org/10.1021/acs.est.1c05486, 2021.
DeWitt, H. L., Gasore, J., Rupakheti, M., Potter, K. E., Prinn, R. G., Ndikubwimana, J. D. D., Nkusi, J., and Safari, B.: Seasonal and diurnal variability in O3, black carbon, and CO measured at the Rwanda Climate Observatory , Atmos. Chem. Phys., 19, 2063–2078, https://doi.org/10.5194/acp-19-2063-2019, 2019.
Duncan, B. N., Logan, J. A., Bey, I., Megretskaia, I. A., Yantosca, R. M., Novelli, P. C., Jones, N. B., and Rinsland, C. P.: Global budget of CO, 1988–1997: Source estimates and validation with a global model, J. Geophys. Res.-Atmos., 112, 1988–1997, https://doi.org/10.1029/2007JD008459, 2007.
Hedelius, J. K., Toon, G. C., Buchholz, R. R., Iraci, L. T., Podolske, J. R., Roehl, C. M., Wennberg, P. O., Worden, H. M., and Wunch, D.: Regional and Urban Column CO Trends and Anomalies as Observed by MOPITT Over 16 Years, J. Geophys. Res.-Atmos., 126, 1–18, https://doi.org/10.1029/2020JD033967, 2021.
Henne, S., Junkermann, W., Kariuki, J. M., Aseyo, J., and Klausen, J.: Mount Kenya global atmosphere watch station (MKN): Installation and meteorological characterization, J. Appl. Meteorol. Climatol., 47, 2946–2962, https://doi.org/10.1175/2008JAMC1834.1, 2008a.
Henne, S., Klausen, J., Junkermann, W., Kariuki, J. M., Aseyo, J. O., and Buchmann, B.: Representativeness and climatology of carbon monoxide and ozone at the global GAW station Mt. Kenya in equatorial Africa, Atmos. Chem. Phys., 8, 3119–3139, https://doi.org/10.5194/acp-8-3119-2008, 2008b.
Keeling, C. D.: The concentration and isotopic abundances of atmospheric carbon dioxide in rural areas, Geochim. Cosmochim. Acta, 13, 322–334, https://doi.org/10.1016/0016-7037(58)90033-4, 1958.
Kirago, L., Gustafsson, Ö., Gaita, S. M., Haslett, S. L., deWitt, H. L., Gasore, J., Potter, K. E., Prinn, R. G., Rupakheti, M., de Ndikubwimana, J. D., Safari, B., and Andersson, A.: Atmospheric Black Carbon Loadings and Sources over Eastern Sub-Saharan Africa Are Governed by the Regional Savanna Fires, Environ. Sci. Technol., 56, 15460–15469, https://doi.org/10.1021/acs.est.2c05837, 2022a.
Kirago, L., Gatari, M. J., Gustafsson, Ö., and Andersson, A.: Black carbon emissions from traffic contribute substantially to air pollution in Nairobi, Kenya, Commun. Earth Environ., 3, 1–8, https://doi.org/10.1038/s43247-022-00400-1, 2022b.
Kulmala, M.: Build a global Earth observatory, Nature, 553, 21–23, https://doi.org/10.1038/d41586-017-08967-y, 2018.
Lelieveld, J., Gromov, S., Pozzer, A., and Taraborrelli, D.: Global tropospheric hydroxyl distribution, budget and reactivity, Atmos. Chem. Phys., 16, 12477–12493, https://doi.org/10.5194/acp-16-12477-2016, 2016.
Mak, J. E. and Brenninkmeijer, C. A. M.: Compressed air sample technology for isotopic analysis of atmospheric carbon monoxide, J. Atmos. Ocean. Technol., 11, 425–431, https://doi.org/10.1175/1520-0426(1994)011<0425:CASTFI>2.0.CO;2, 1994.
Pathirana, S. L., van der Veen, C., Popa, M. E., and Röckmann, T.: An analytical system for stable isotope analysis on carbon monoxide using continuous-flow isotope-ratio mass spectrometry, Atmos. Meas. Tech., 8, 5315–5324, https://doi.org/10.5194/amt-8-5315-2015, 2015.
Petron, G.: Atmospheric CO at Mt. Kenya by Global Monitoring Laboratory, NOAA , dataset published as CO_MKN_surface-flask_NOAA_ccgg at WDCGG ver. 2023-08-29-1326, https://gaw.kishou.go.jp/search/file/0002-1005-3001-01-02-3001 (last access: 2 July 2023), 2023.
Popa, M. E., Vollmer, M. K., Jordan, A., Brand, W. A., Pathirana, S. L., Rothe, M., and Röckmann, T.: Vehicle emissions of greenhouse gases and related tracers from a tunnel study: CO : CO2, N2O : CO2, CH4 : CO2, O2 : CO2 ratios, and the stable isotopes 13C and 18O in CO2 and CO, Atmos. Chem. Phys., 14, 2105–2123, https://doi.org/10.5194/acp-14-2105-2014, 2014.
Röckmann, T., Brenninkmeijer, C. A. M., Saueressig, G., Bergamaschi, P., Crowley, J. N., Fischer, H., and Crutzen, P. J.: Mass-independent oxygen isotope fractionation in atmospheric CO as a result of the reaction CO + OH, Science, 80, 544–546, https://doi.org/10.1126/science.281.5376.544, 1998.
Röckmann, T., Jöckel, P., Gros, V., Bräunlich, M., Possnert, G., and Brenninkmeijer, C. A. M.: Using 14C, 13C, 18O and 17O isotopic variations to provide insights into the high northern latitude surface CO inventory, Atmos. Chem. Phys., 2, 147–159, https://doi.org/10.5194/acp-2-147-2002, 2002.
Stein, A. F., Draxler, R. R., Rolph, G. D., Stunder, B. J. B., Cohen, M. D., and Ngan, F.: Noaa's hysplit atmospheric transport and dispersion modeling system, Bull. Am. Meteorol. Soc., 96, 2059–2077, https://doi.org/10.1175/BAMS-D-14-00110.1, 2015.
Szopa, S., Naik, V., Adhikary, B., Artaxo, P., Berntsen, T., Collins, W. D., Fuzzi, S., Gallardo, L., Kiendler, A., Scharr, Z., Klimont, Liao, H., Unger, N., and Zanis, P.: Short-Lived Climate Forcers. In Climate Change 2021: The Physical Science Basis. Contribution of Working Group I to the Sixth Assessment Report of the Intergovernmental Panel on Climate Change, https://www.ipcc.ch/ (last access: 28 September 2022), 2021.
Thoning, K. W. and Tans, P. P.: Atmospheric carbon dioxide at Mauna Loa Observatory: Analysis of the NOAA GMCC data, 1974–1985, J. Geophys. Res., 94, 8549–8565, 1989.
WHO: WHO Expert Consultation: Available evidence for the future update of the WHO Global Air Quality Guidelines, Copenhagen, Denmark, http://www.euro.who.int/pubrequest (last access: 13 March 2022), 2016.
WHO: WHO global air quality guidelines: particulate matter (PM2.5 and PM10), ozone, nitrogen dioxide, sulfur dioxide and carbon monoxide. World Health Organization, GEneva, Switzerland, https://iris.who.int/handle/10665/345329 (last access: 7 Decmeber 2022), 2021.
Worden, H. M., Bloom, A. A., Worden, J. R., Jiang, Z., Marais, E. A., Stavrakou, T., Gaubert, B., and Lacey, F.: New constraints on biogenic emissions using satellite-based estimates of carbon monoxide fluxes, Atmos. Chem. Phys., 19, 13569–13579, https://doi.org/10.5194/acp-19-13569-2019, 2019.
World Bank: Wood-Based Biomass Energy Development for Sub-Saharan Africa: Issues and Approaches. Energy Sector Management Assistance Program (ESMAP), Washington, DC, http://hdl.handle.net/10986/26149 (last access: 5 May 2023), 2011.
Zellweger, C., Hüglin, C., Klausen, J., Steinbacher, M., Vollmer, M., and Buchmann, B.: Inter-comparison of four different carbon monoxide measurement techniques and evaluation of the long-term carbon monoxide time series of Jungfraujoch, Atmos. Chem. Phys., 9, 3491–3503, https://doi.org/10.5194/acp-9-3491-2009, 2009.
Zellweger, C., Steinbacher, M., and Buchmann, B.: GAW Report No. 256/WCC-Empa Report No. 19/4, System and Performance Audit of Surface Ozone, Carbon Monoxide, Methane, and Carbon Dioxide at the Global GAW Station Mt. Kenya, Kenya, Geneva, https://library.wmo.int/index.php?lvl=notice_display&id=21780 (last access: 20 September 2022), 2020.
Zhang, J. J., Wei, Y., and Fang, Z.: Ozone pollution: A major health hazard worldwide, Front. Immunol., 10, 1–10, https://doi.org/10.3389/fimmu.2019.02518, 2019.
Zheng, B., Chevallier, F., Ciais, P., Yin, Y., and Wang, Y.: On the Role of the Flaming to Smoldering Transition in the Seasonal Cycle of African Fire Emissions, Geophys. Res. Lett., 45, 11998–12007, https://doi.org/10.1029/2018GL079092, 2018.
Zheng, B., Chevallier, F., Yin, Y., Ciais, P., Fortems-Cheiney, A., Deeter, M. N., Parker, R. J., Wang, Y., Worden, H. M., and Zhao, Y.: Global atmospheric carbon monoxide budget 2000–2017 inferred from multi-species atmospheric inversions, Earth Syst. Sci. Data, 11, 1411–1436, https://doi.org/10.5194/essd-11-1411-2019, 2019.