the Creative Commons Attribution 4.0 License.
the Creative Commons Attribution 4.0 License.
 | 16 Nov 2023
Oxidative potential in rural, suburban and city centre atmospheric environments in central Europe
Máté Vörösmarty
Gaëlle Uzu
Jean-Luc Jaffrezo
Pamela Dominutti
Zsófia Kertész
Enikő Papp
Oxidative potential (OP) is an emerging health-related metric which integrates several physicochemical properties of particulate matter (PM) that are involved in the pathogenesis of the diseases resulting from exposure to PM. Daily PM2.5-fraction aerosol samples collected in the rural background of the Carpathian Basin and in the suburban area and centre of its largest city of Budapest in each season over 1 year were utilised to study the OP at the related locations for the first time. The samples were analysed for particulate matter mass, main carbonaceous species, levoglucosan and 20 chemical elements. The resulting data sets were subjected to positive matrix factorisation to derive the main aerosol sources. Biomass burning (BB), suspended dust, road traffic, oil combustion mixed with coal combustion and long-range transport, vehicle metal wear, and mixed industrial sources were identified. The OP of the sample extracts in simulated lung fluid was determined by ascorbic acid (AA) and dithiothreitol (DTT) assays. The comparison of the OP data sets revealed some differences in the sensitivities of the assays. In the heating period, both the OP and PM mass levels were higher than in spring and summer, but there was a clear misalignment between them. In addition, the heating period : non-heating period OP ratios in the urban locations were larger than for the rural background by factors of 2–4. The OP data sets were attributed to the main aerosol sources using multiple linear regression with the weighted least squares approach. The OP was unambiguously dominated by BB at all sampling locations in winter and autumn. The joint effects of motor vehicles involving the road traffic and vehicle metal wear played the most important role in summer and spring, with considerable contributions from oil combustion and resuspended dust. In winter, there is temporal coincidence between the most severe daily PM health limit exceedances in the whole Carpathian Basin and the chemical PM composition causing larger OP. Similarly, in spring and summer, there is a spatial coincidence in Budapest between the urban hotspots of OP-active aerosol constituents from traffic and the high population density in central quarters. These features offer possibilities for more efficient season-specific air quality regulations focusing on well-selected aerosol sources or experimentally determined OP, rather than on PM mass in general.
- Article
(1571 KB) - Full-text XML
-
Supplement
(1463 KB) - BibTeX
- EndNote


Poor air quality caused by high concentrations of particulate matter (PM) is one of the most severe public health concerns for humans worldwide (e.g. Lelieveld et al., 2015, 2020; Bondy, 2016; Cohen et al., 2017). Its acute and chronic effects, such as lung, cardiovascular and cerebrovascular diseases, have been documented in both epidemiological and toxicological studies (e.g. Donaldson et al., 2005; Valavanidis et al., 2008; Apte et al., 2015; Riediker et al., 2019; Kelly and Fussell, 2020).
Due to the chemical, physical and biological complexity of ambient aerosol particles, their dynamic character, and possible synergism among air pollutants, a sophisticated interplay of multiple factors is involved in the pathogenesis of the diseases resulting from the exposure to PM. The main factors can involve the following: (1) mass concentrations of PM2.5 or PM10 size fractions; (2) amounts of potentially toxic chemical components, such as transition and heavy metals, polycyclic aromatic hydrocarbons (PAHs), soot, and specific organics; (3) certain chemical speciation forms, such as Cr(VI) versus Cr(III); (4) lung bioaccessibility of critical constituents; (5) surface reactivity of particles; (6) number concentrations of very small particles, such as ultrafine particles or engineered nanomaterials; (7) shape and morphology of particles, such as for asbestos or silica; and (8) active components of biogenic origin, such as bacteria, viruses, pollens and moulds, or with radioactivity, such as radon progeny (Riediker et al., 2019). Therefore, it cannot be expected that a single or a few aerosol metrics broadly express the induced biological responses. In the first approximation, PM mass is often selected from these factors as a simplistic metric, and it can be refined by further particle properties.
One of the most important biological mechanisms by which PM induces adverse health effects is causing an oxidant–antioxidant imbalance in the respiratory system at the cellular level (Kelly and Mudway, 2003; Borm et al., 2007; Kelly and Fussell, 2012, 2015; Cassee et al., 2013; Valavanidis et al., 2013; Janssen et al., 2014). This is called oxidative stress. It is related to (1) the stimulation of cells to begin the uncontrolled production of excess reactive oxygen species (ROS) endogenously, such as directly by Fenton-type reactions of redox-active aerosol components in the human body or indirectly through biotransformation (e.g. of PAHs), or (2) the inefficient elimination of ROS by the antioxidant defence system of the body. These can lead to inflammatory processes that increase the risk of various diseases and can result in biological ageing and apoptosis (Ayres et al., 2008; Verma et al., 2012; Gao et al., 2020). The capacity of PM to invoke oxidative stress is quantified by its oxidative potential (OP). This integrates several factors of the particle properties 1–8 listed above. Numerous epidemiological studies suggest that the OP can be one of the central quantities that is responsible for several health end points, including specific acute effects such as emergency treatment of asthma and congestive heart failure, and that largely explains the underlying biological bases of toxicity (e.g. Bates et al., 2015; Kelly and Fussell, 2015; Abrams et al., 2017; Yue et al., 2018; Weichenthal et al., 2019; Daellenbach et al., 2020; Dhalla et al., 2000; Zhang et al., 2022; Baumann et al., 2023).
As a result, there has been a substantial and increasing scientific interest in the measurement improvements of the OP using (biological) in vivo, in vitro cellular and in vitro acellular assays as well as in the identification of the aerosol components and sources closely related to the OP (e.g. Cho et al., 2005; Künzli et al., 2006; Boogaard et al., 2012; Verma et al., 2014, 2015; Kelly and Fussell, 2015; Fang et al., 2016; Calas et al., 2017; Weber et al., 2018; Shahpoury et al., 2021; Borlaza et al., 2021a, 2022; Lionetto et al., 2021; Zhang et al., 2022). The OP is frequently measured by acellular assays for exogenous ROS, in which the PM extract or the particles directly cause a consumption rate of some antioxidants such as ascorbic acid (AA) or of some chemical surrogates to cellular reducing agents, e.g. dithiothreitol (DTT). The quantifications are generally based on spectrophotometry. More sophisticated detection methods that directly determine the production of ROS are also available (Katerji et al., 2019).
The most frequently used assays were compared for PM10-fraction aerosol samples, considering the chemical composition of particles as well (Calas et al., 2018; Lionetto et al., 2021; Shahpoury et al., 2022). It was concluded that the assays correlated with each other but were not equivalent. All assays were somewhat specific, and no consensus has been reached on the “best assay” nor on a standardised methodology for each assay (Weber et al., 2021; Zhang et al., 2022). At the same time, it seems sensible to compare the results obtained by an identical sample preparation and OP measurement method for different environmental types. Likewise, comparing the data derived by different experimental methods applied to similar sample types can contribute to revealing and understanding the different properties or characteristics of these methods for various chemical components and sources. Both approaches can also yield considerable methodological development.
The main common features of the assays are as follows: (1) they exhibit different responses to various groups of ROS-generating compounds and their bioavailability, (2) their sensitivity depends on the partner reaction compound to ROS, and (3) they show a nonlinear response to PM mass concentration (Charrier et al., 2016; Fang et al., 2016; Calas et al., 2017; Shahpoury et al., 2021). A large number of PM constituents were identified that influence the OP. The DTT assay responds sensitively to ROS produced by organic compounds and indirectly by soluble transition metals, mainly Cu(II), Mn(II) and Fe(II), and can be also influenced by synergetic or antagonistic effects between some chemical components (Charrier and Anastasio, 2012; Bates et al., 2019; Shahpoury et al., 2021; Borlaza et al., 2022). The AA assay was shown to express high sensitivity to transition metals and some specific organics, such as quinones (Künzli et al., 2006; Godri et al., 2011; Visentin et al., 2016).
It is important to extend the studies on this emerging health-related metric to cities and regions in the world. Knowledge on the OP for a large part of central Europe, namely the Carpathian Basin, is deficient or missing (Szigeti et al., 2015). The major objective of this study was to present, discuss and interpreted the OP data determined by AA and DTT assays in PM2.5-fraction aerosol samples collected in parallel in central Budapest, its suburban area and a rural background area within the Carpathian Basin in each season over 1 year. We also investigated the spatiotemporal dependencies and identified the main aerosol sources of OP. The study can contribute to our general knowledge on the OP as well.
2.1 Sample collections
The rural background sampling campaign was performed at the K-puszta station ( N, E; 125 m a.s.l., above sea level), which represents the main plain part of the basin (Salma et al., 2020a). Budapest, with ca. 2.2 million inhabitants in the metropolitan area, is the largest city in the region. Its suburban environment was characterised by collections at the Marczell György Main Observatory ( N, E; 138 m a.s.l.) of the Hungarian Meteorological Service (Salma et al., 2022). This is in the southeastern residential part of the city. The samples from the city centre were accomplished at the Budapest platform for Aerosol Research and Training (BpART) Laboratory ( N, E; 115 m a.s.l.), which represents an average atmosphere for the city centre (Salma et al., 2016).
Three identical high-volume sampling devices equipped with PM2.5 inlets (DHA-80, Digitel, Switzerland) were deployed at the sites (Salma et al., 2020a). The collection substrates were prebaked quartz fibre filters with a diameter of 150 mm (QR-100, Advantec, Japan). Daily aerosol samples were taken starting at midnight (local time). The samples, corresponding to air volumes of 720 m3, were collected in parallel with each other over semi-consecutive days in October 2017 (autumn), January 2018 (winter), April 2018 (spring) and July 2018 (summer). The total number of filters was 56 in the rural background, 59 in the suburban area and 28 in the city centre. The samples were evenly spread among the four seasons. In addition, one field blank was taken at each location and in each season. The filters were wrapped in preheated Al foils, sealed in plastic bags and stored at a temperature of ∘C until the analyses. The samples represent a gradual transition from the central part of a large continental European city through its suburban area to its regional background in all seasons.
2.2 Analyses and data treatment
Particulate matter mass was determined by gravimetry (Cubis MSA225S-000-DA, Sartorius, Germany, sensitivity of 10 µg). The blank-corrected PM mass data were above the limit of quantitation (LOQ), which was 1 µg m−3 (Salma et al., 2020a).
Filter punches were analysed with a thermal–optical transmission method using a laboratory organic carbon/elemental carbon (OC/EC) analyser (Sunset Laboratory, USA) adopting the EUSAAR-2 (European Supersites for Atmospheric Aerosol Research) thermal protocol (Cavalli et al., 2010). All blank-corrected OC and EC data were above their respective LOQ values, which were 0.38 and 0.04 µg m−3. Filter pieces were analysed for levoglucosan (LVG) by gas chromatography–mass spectrometry (Varian 4000, USA) after trimethylsilylation (Blumberger et al., 2019). All blank-corrected LVG data were above the LOQ, which was 1.2 ng m−3.
Parts of the filters were analysed by particle-induced X-ray emission (PIXE) spectrometry for S, Cl, K, Ca, Ti, V, Cr, Mn, Fe, Co, Ni, Cu, Zn, As, Br, Rb, Sr, Zr, Ba and Pb using an external beam of protons with an energy of 2.35 MeV and a current of 20 nA (Aljboor et al., 2023). The obtained spectra were evaluated using the GUPIXWIN program. The filters were treated as thin-layer samples. For S, Cl, K and Ca, a correction was applied for the self-absorption effects of quartz filters (Chiari et al., 2018). The lung bioaccessibility was assessed in the present work by the total amounts of the chemical species present as a first approximation.
Concentrations of EC and OC from fossil fuel combustion and from biomass burning (BB), namely ECFF and OCFF and ECBB and OCBB, respectively, and of OC from biogenic sources (OCBIO) were previously estimated by a coupled radiocarbon–LVG marker method (Salma et al., 2020a). Secondary organic carbon (SOC) was also assessed previously using the EC tracer method for primary OC (Salma et al., 2022). These results were used as supplementary data in interpretations.
2.3 Determination of oxidative potential
Specified filter areas were extracted in a simulated human respiratory tract lining fluid solution composed of Gamble's solution with dipalmitoylphosphatidylcholine (DPPC; the major phospholipid of lung surfactant; Calas et al., 2017, 2018). The extractions were carried out by vortex agitation at 37 ∘C for 1 h. The overall procedure represents conditions that are close to those of the respiratory system. Isoconcentration extracts with 10 µg mL−1 of PM mass were obtained for all samples to overcome the possible nonlinear OP response of PM concentrations (Charrier and Anastasio, 2012; Calas et al., 2017).
The sample extracts were not filtered, so they contained insoluble chemical species including those with active surface area (Baumann et al., 2023). The OP was measured by two single-compound in vitro acellular assays, i.e. AA and DTT assays. These two methods are widely used for OP determination (e.g. Calas et al., 2018; Daellenbach et al., 2020; Lionetto et al., 2021; Shahpoury et al., 2021, 2022). However, there is a fundamental difference between them with respect to their underlying chemical mechanisms (Charrier and Anastasio, 2012). The quantifications were based on plate-reader spectrophotometry (Tecan Infinite M200 Pro, Switzerland) in Milli-Q water for AA and in a phosphate buffer with a physiological pH value of 7.4 after adding 5,5'-dithiobis(2-nitrobenzoic acid), with readings taken at different specified reaction times (Calas et al., 2018; Borlaza et al., 2021a, 2022). Possible transition metal contamination of the buffer was removed by Chelex 100 resin to reduce the background oxidation. The consumption rates of the AA or DTT were obtained from the simple linear regression of the absorbance values in time at 265 and 412 nm, respectively. The coefficients of determination (R2 values) for the regression were >0.90 when <70 % of the initial amount of the reagent was oxidised. Matrix absorbance was considered, and the quality assurance of the determinations was performed by positive control tests (Borlaza et al., 2021a). The limits of detection (LODs) for the AA and DTT assays were set at 3 times the standard deviation (SD) for the blank extracts and were typically 0.008 and 0.0014 nmol min−1, respectively. The experimental protocols have been described in more detail elsewhere (Calas et al., 2017, 2018).
The OP data measured by the AA and DTT assays were normalised to PM2.5 mass (m) or sampled air volume (V) and are denoted as OPAA,m, OPDTT,m, OPAA,V and OPDTT,V. The consumption rates normalised to V are often considered to have a closer relationship to human exposure, while those normalised by m are regarded as a measure of the inherent OP of PM (Weber et al., 2018; Yu et al., 2019).
2.4 Mathematical models
Source apportionment modelling was accomplished to identify and quantify the main aerosol sources using positive matrix factorisation (PMF, US Environmental Protection Agency, version 5.0; EPA, 2017). It decomposes the sample data matrix into a linear combination of two matrices, a daily factor contribution varying in time and factor profiles, by minimising the critical compound parameter Q (Paatero and Tapper, 1994; Hopke, 2016, 2000). The input data set contained the concentrations and uncertainties of PM2.5 mass, S, Cl, K, Ca, Ti, V, Cr, Mn, Fe, Ni, Cu, Zn, Br, Rb, Ba, Pb, EC, OC and LVG for all sampling sites and seasons. A multisite PMF modelling with 143 samples was performed (Dai et al., 2020). For most chemical species, all concentrations were higher than the LODs. For some trace elements, the concentrations were larger than the LODs in >60 % of the samples. The missing data were replaced by the related median with an uncertainty of five-sixths of the LOD value. The concentrations above the LODs were associated with an equation-based extra standard deviation in accordance with the guidelines of the PMF manual, which involved the measurement uncertainty, the concentration and the LOD values (EPA, 2017). The elements Cl, Cr, Ni and Rb were specified as weak variables due to their relatively large SD values.
Several test runs were performed with a total number of factors ranging from 3 to 9 to define the base runs. To explore the goodness of the individual results and to derive robust source apportionment, additional mathematical tools such as bootstrapping and displacement methods were adopted (Norris et al., 2014). In bootstrapping, the compliance between the base factors and bootstrapped factors (which were later selected as the final solution) was >80 %. In addition, the displacement for these solutions did not show larger changes in the parameter Q, and no swap counts of factors occurred.
Multiple linear regression (MLR) modelling was performed to deconvolute the measured OPAA,V and OPDTT,V data sets as the dependent variables among the main aerosol sources identified by the PMF as the independent variables (Weber et al., 2021). A linear predictor function was fitted through the dependent variable points using the weighted least squares (WLS) method. The weights were chosen as the inverse of the square of the SD for each measured OP. Goodness of the fit was checked by residual analysis. The significant predictor variables were selected using an F test. The calculations were performed in the advanced analytics software package Statistica (version 7.1, StatSoft, Germany).
3.1 Ranges, averages and tendencies
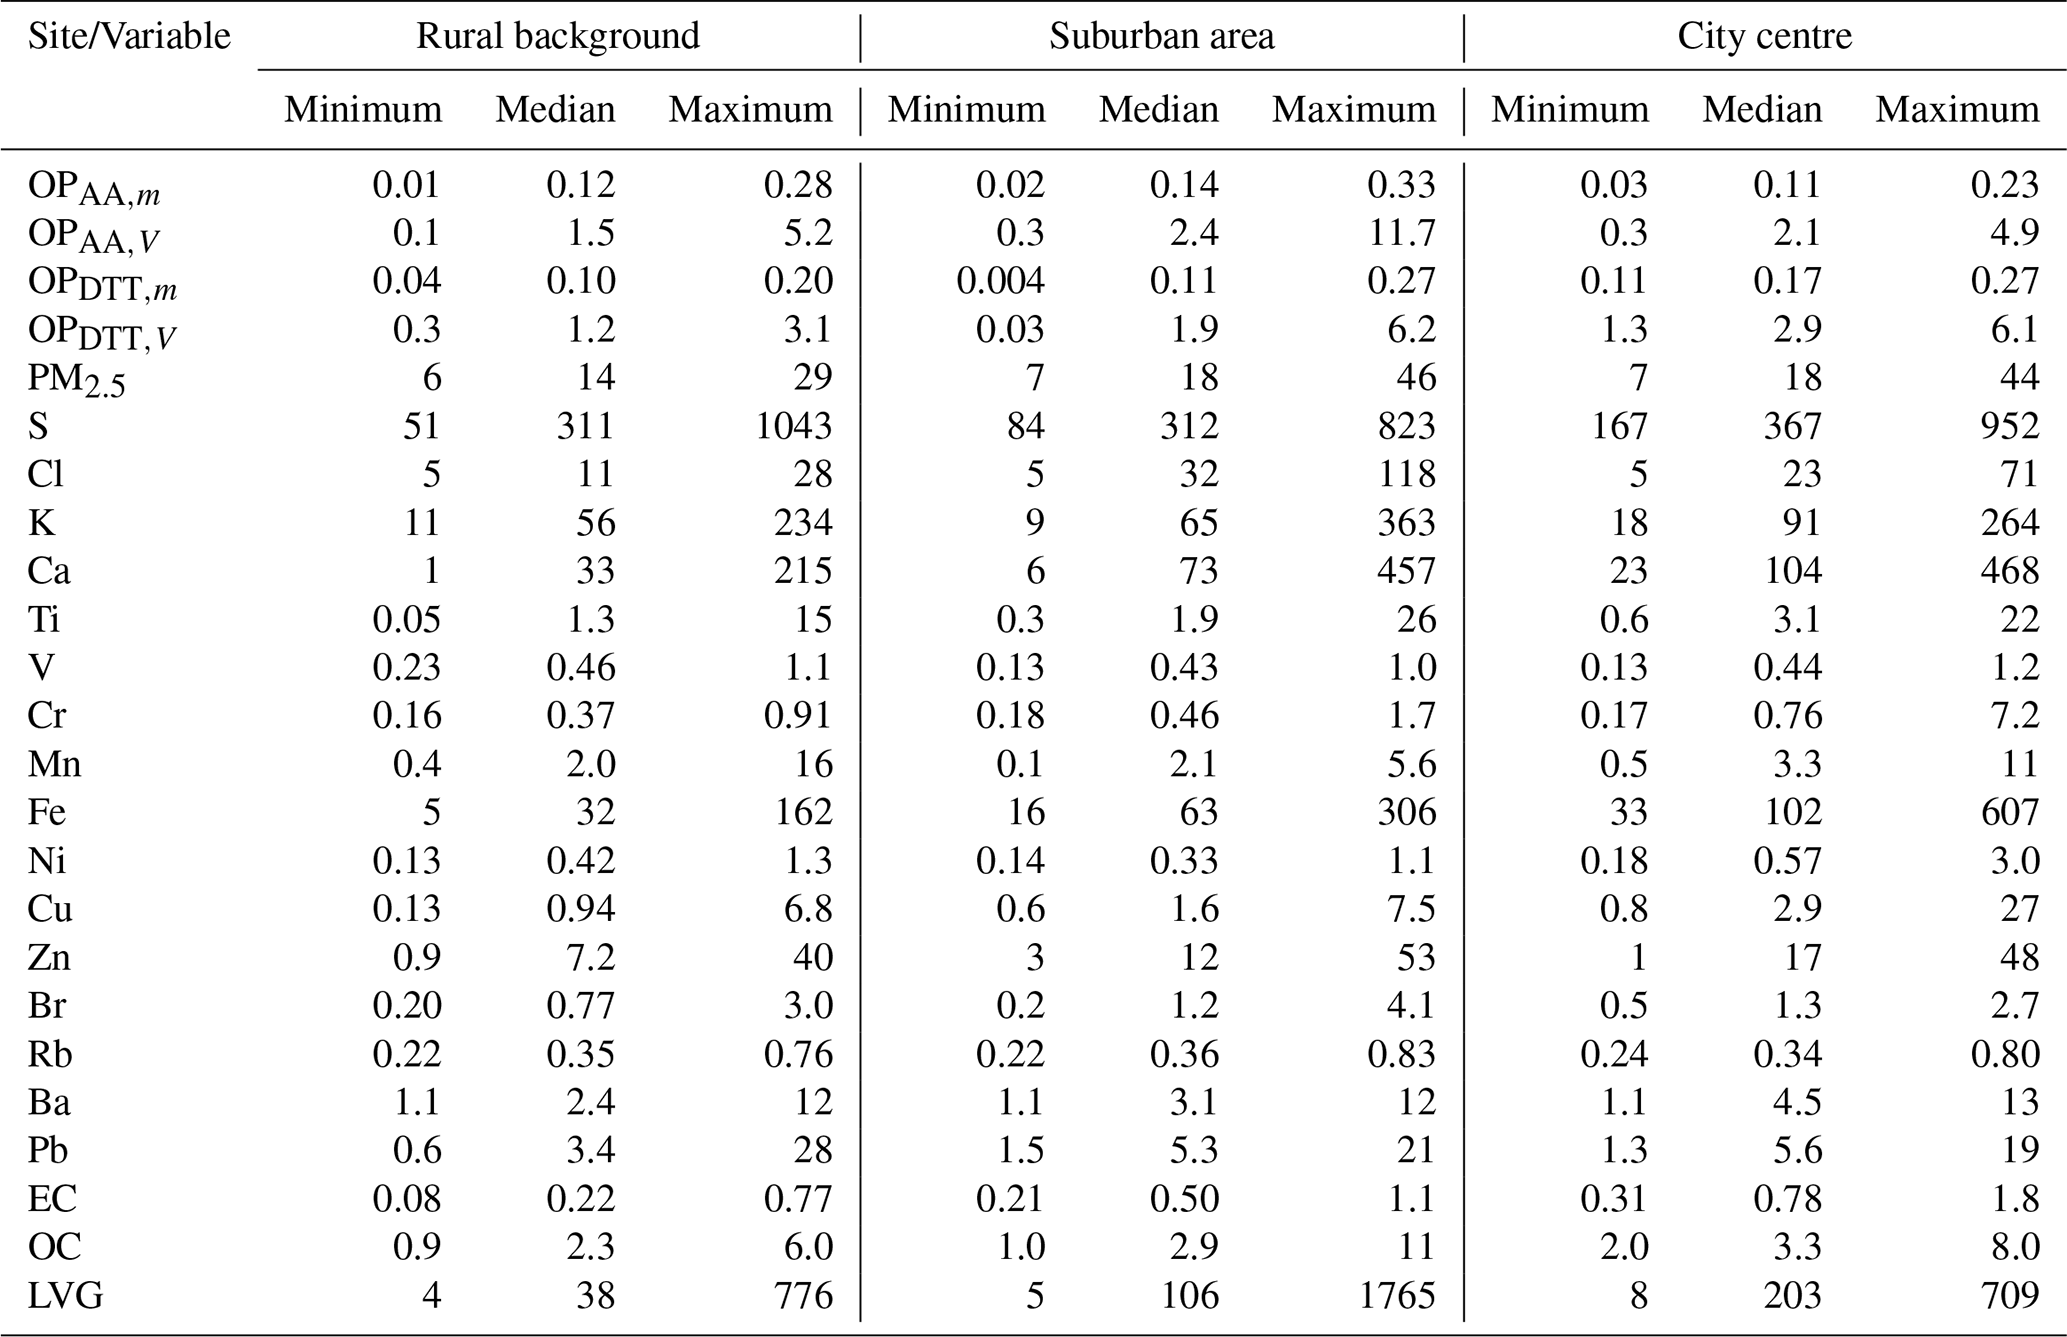
Basic statistics of the daily OP data and atmospheric concentrations obtained from the filters for the whole sampling interval in the three environments are summarised in Table 1. Some further atmospheric concentrations measured online and the local meteorological data and their measurement methods are given in Sect. S1 in the Supplement. The concentrations of ECFF, OCFF, ECBB, OCBB, OCBIO and SOC derived earlier can be found in previous publications (Salma et al., 2020a, 2022). The present average concentrations and meteorological data are in line with the results of earlier studies (Salma et al., 2004, 2005, 2020a; Szigeti et al., 2015), suggesting that the overall data set represents typical atmospheric conditions at the locations. However, several Saharan dust intrusions into the Carpathian Basin happened in April 2018 (Varga, 2020); the most intensive event reached the region via southern Italy and the Balkans on 15 April and affected the study region for a few days.
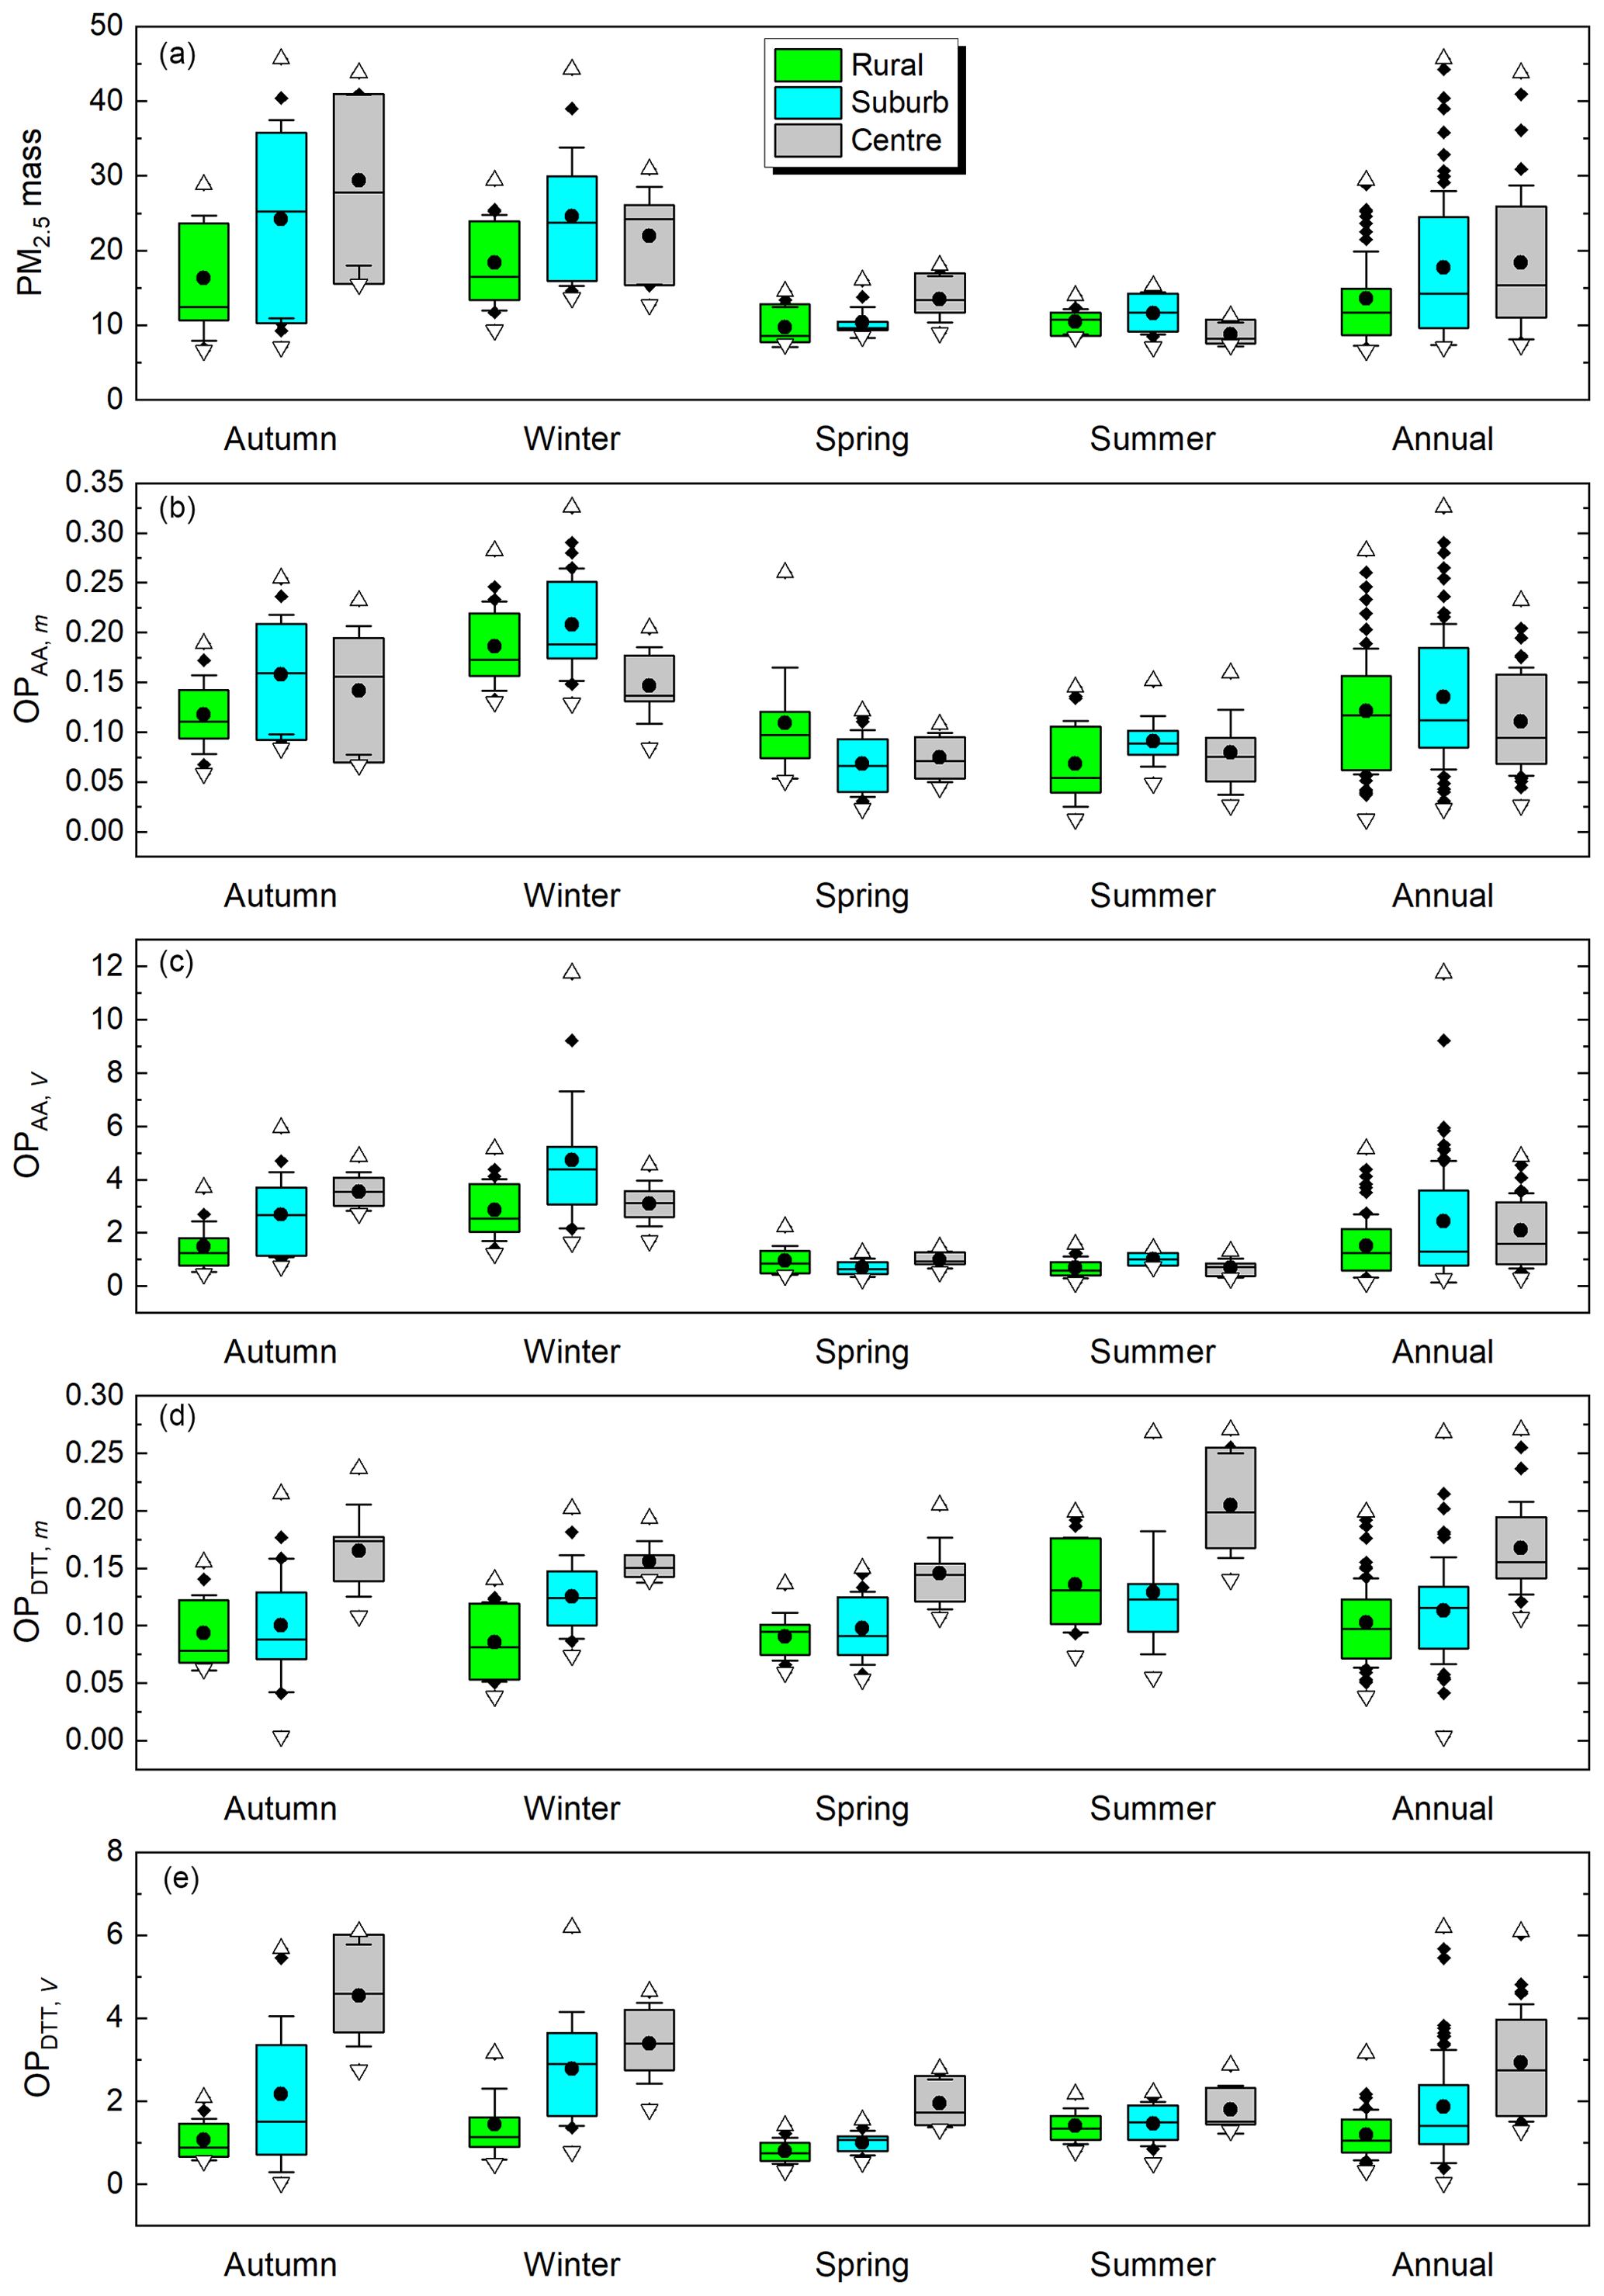
Figure 1Box-and-whisker plots of PM2.5 mass concentration (µg m−3; panel a), oxidative potential (OP) determined by AA and DTT assays and normalised to PM mass (m; OPAA,m and OPDTT,m, respectively, in ; panels b and d) or to sampled air volume (V; OPAA,V and OPDTT,V, respectively, in ; panels c and e) in the rural background, suburban area and city centre separately for each season and over 1 year. Maximum and minimum values (triangles pointing upward and downward, respectively), further extreme values (diamonds), the first and third quartiles (lower and upper horizontal borders of the boxes, respectively), medians (horizontal line inside the boxes), means (bullets), and ±1 SD (whiskers) of the data sets are shown.
Table 1Ranges and medians of oxidative potential (OP), determined by AA and DTT assays and normalised to PM mass (m; OPAA,m and OPDTT,m, respectively, in ) or to sampled air volume (V; OPAA,V and OPDTT,V, respectively, in ), of concentrations of PM2.5 mass (in µg m−3), chemical elements (all in ng m−3), elemental carbon (EC, in µg m−3), organic carbon (OC, in µg m−3) and levoglucosan (LVG, in ng m−3) in the rural background, suburban area and city centre.
The average PM2.5 mass, OPAA and OPDTT data sets showed three different tendencies with respect to the locations. This is better visualised with their annual mean and median data in Fig. 1. The averages (i.e. the medians and means) of the PM2.5 mass exhibited a rising trend, levelling off from the rural background through the suburban area to the city centre. The means of both the OPAA,m and OPAA,V data sets indicated a maximum in the suburban background, whereas the tendencies of their medians were not fully conclusive. The differences in the tendencies already suggest that there is a misalignment between the PM mass and the OP data and that the two assays used show different sensitivity to source types active at the locations.
Basic statistics of PM2.5 mass and OP data separately for each season and the whole year are shown in Fig. 1. In winter and autumn (the heating period), the OP and PM mass levels were higher than in spring and summer. This is consistent with the other continental European sites (e.g. Calas et al., 2019; Borlaza et al., 2022). The heating period : non-heating period OP ratios in the urban locations were larger than for the rural background by factors of ca. 4 for OPAA,V and 1–2 for OPDTT,V. There were similar tendencies in the OP values derived by both the AA and DTT assays over the seasons, except for the OPDTT,m data, which showed a fairly constant level over the seasons with some higher values in summer – particularly in the city centre. This can be again linked to the altered chemical composition of PM mass in time and to the different responses of the two assays to this change.
There are only a few other OP data sets for the PM2.5 size fraction derived by AA and DTT assays. Their comparison to our OP data is hindered by important experimental details, such as the extracted amount of PM from filters. It can be identified that our median OP values are larger than those at other European sites (Daellenbach et al., 2020; Grange et al., 2022; In `t Veld et al., 2023), whereas they belong to the middle range of the available results for Japan and China (Kurihara et al., 2022; Yu et al., 2019). The differences can be also influenced by the exact location type, as higher OP data were observed near traffic sources (Boogaard et al., 2012; Fang et al., 2016; Daellenbach et al., 2020).
3.2 Consistency between the assays
The dependencies between the OP data derived by the AA assay and normalised to either m or V on the corresponding DTT data are displayed in Fig. 2. Pearson's coefficients of correlation (R values) between the data sets normalised to m (Fig. 2a) were not significant (p=0.05) at the locations. This suggests that the OPm was controlled by chemical species that invoked different responses in the assays. However, all correlations between the two OP data sets normalised to V (Fig. 2b) were significant. The slopes with SDs of the regression lines were smaller than unity (0.25 ± 0.06, 0.34 ± 0.07 and 0.78 ± 0.13, respectively) and increased monotonically from the rural background through the suburban area to the city centre.
The results suggested that the OPDTT and OPAA values normalised to sampled air volume were consistent and in line with each other. The slopes of their regression lines (Fig. 2b) were <1, which is interpreted as the AA assay reacting more sensitively to the changes in the chemical composition of PM than the DTT assay at our locations. More importantly, the conclusions underline the need to deploy multiple (at least two) OP assays, particularly in cleaner atmospheric environments, to achieve a more holistic and consistent picture (Calas et al., 2017; Bates et al., 2019; Borlaza et al., 2022; Shahpoury et al., 2022).
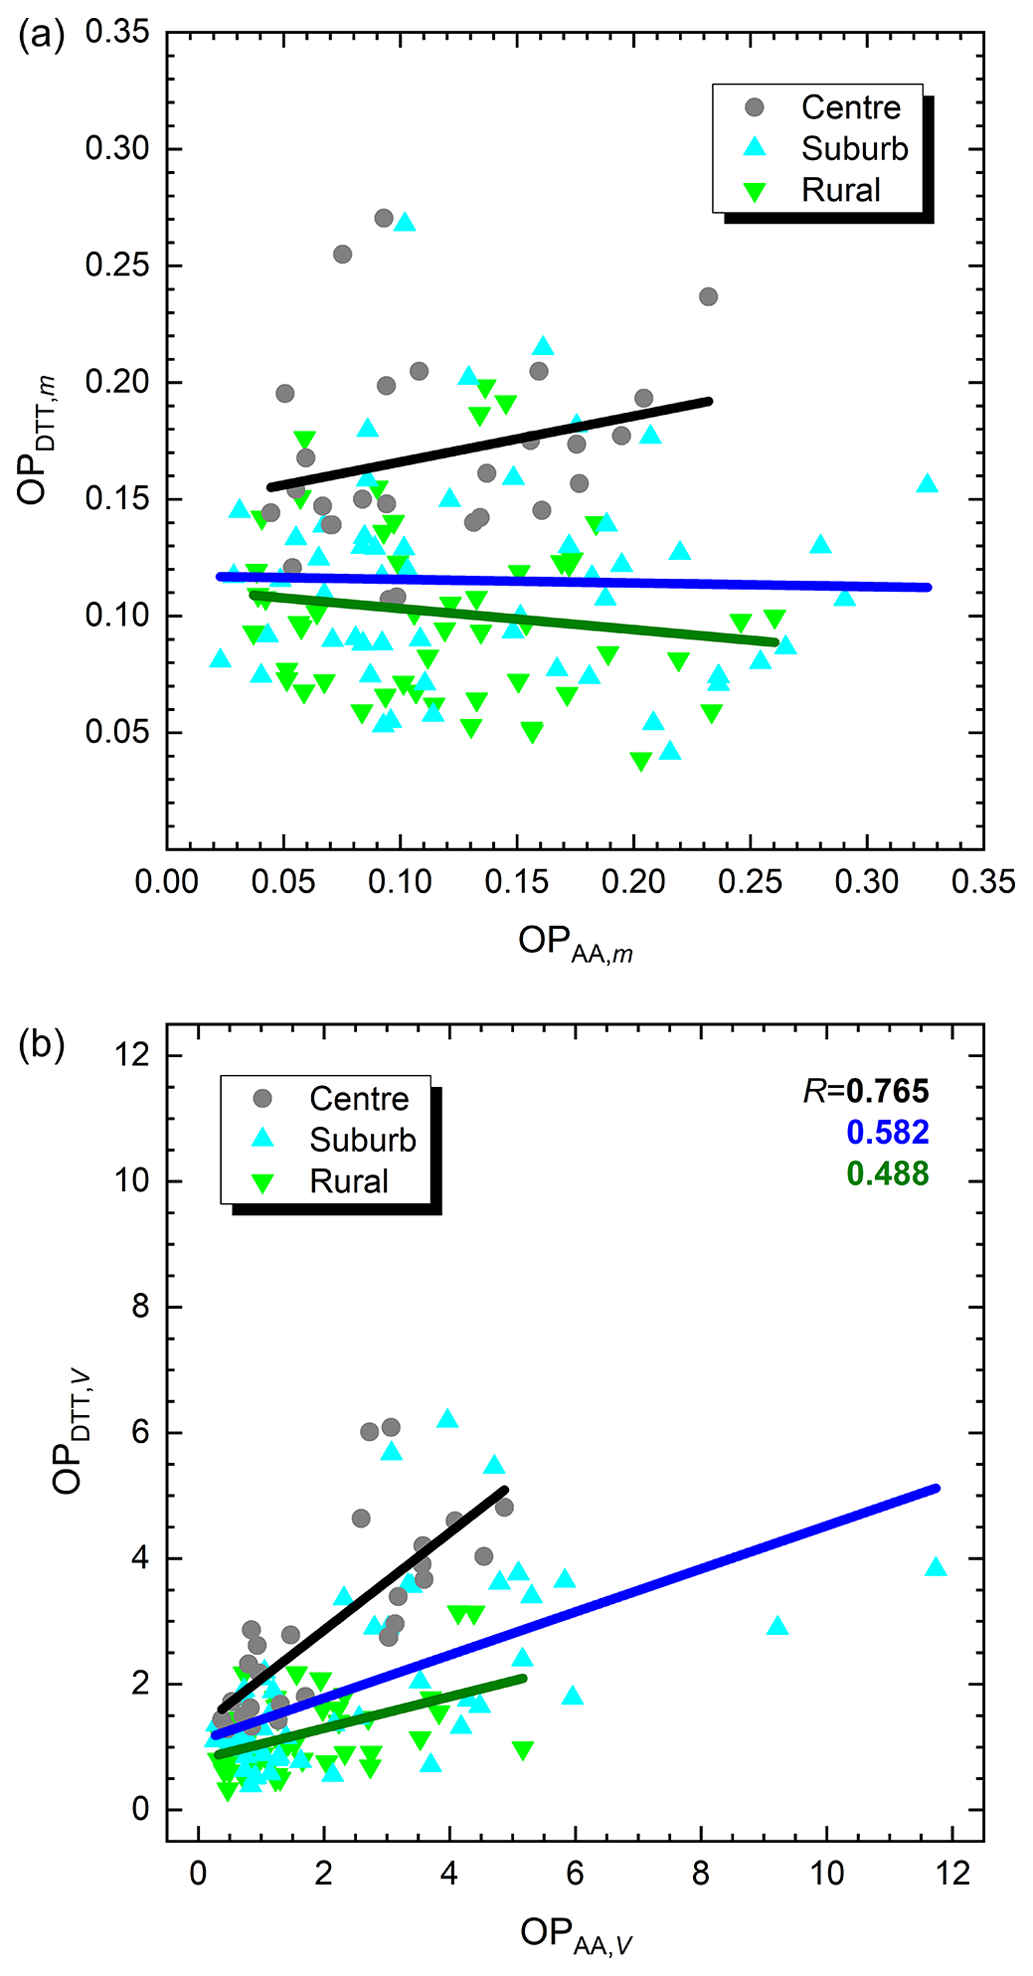
Figure 2Scatter plots of the oxidative potential (OP) values determined by the AA and DTT assays and normalised to PM mass (m; OPAA,m and OPDTT,m, respectively, in ; panel a) or to sampled air volume (V; OPAA,V and OPDTT,V, respectively, in ; panel b) separately in the rural background, suburban area and city centre. The coefficients of correlation (R values) for the significant cases are also given.
3.3 Main aerosol sources
Six factors resolved by PMF modelling were further evaluated, as described in Sect. S2. The following aerosol sources were identified: biomass burning; suspended dust; road traffic; oil combustion mixed with coal combustion and, particularly, with long-range transport in the rural background during the non-heating period (Sect. S2); vehicle metal wear; and a mixed industrial source. A similar set of source types was also identified earlier for Budapest in larger number of samples in winter (Furu et al., 2022).
The apportionments of the PM2.5 mass among the main sources are summarised in Fig. 3 separately for each location and season. The plots reveal that the source contributions changed very substantially over the year.
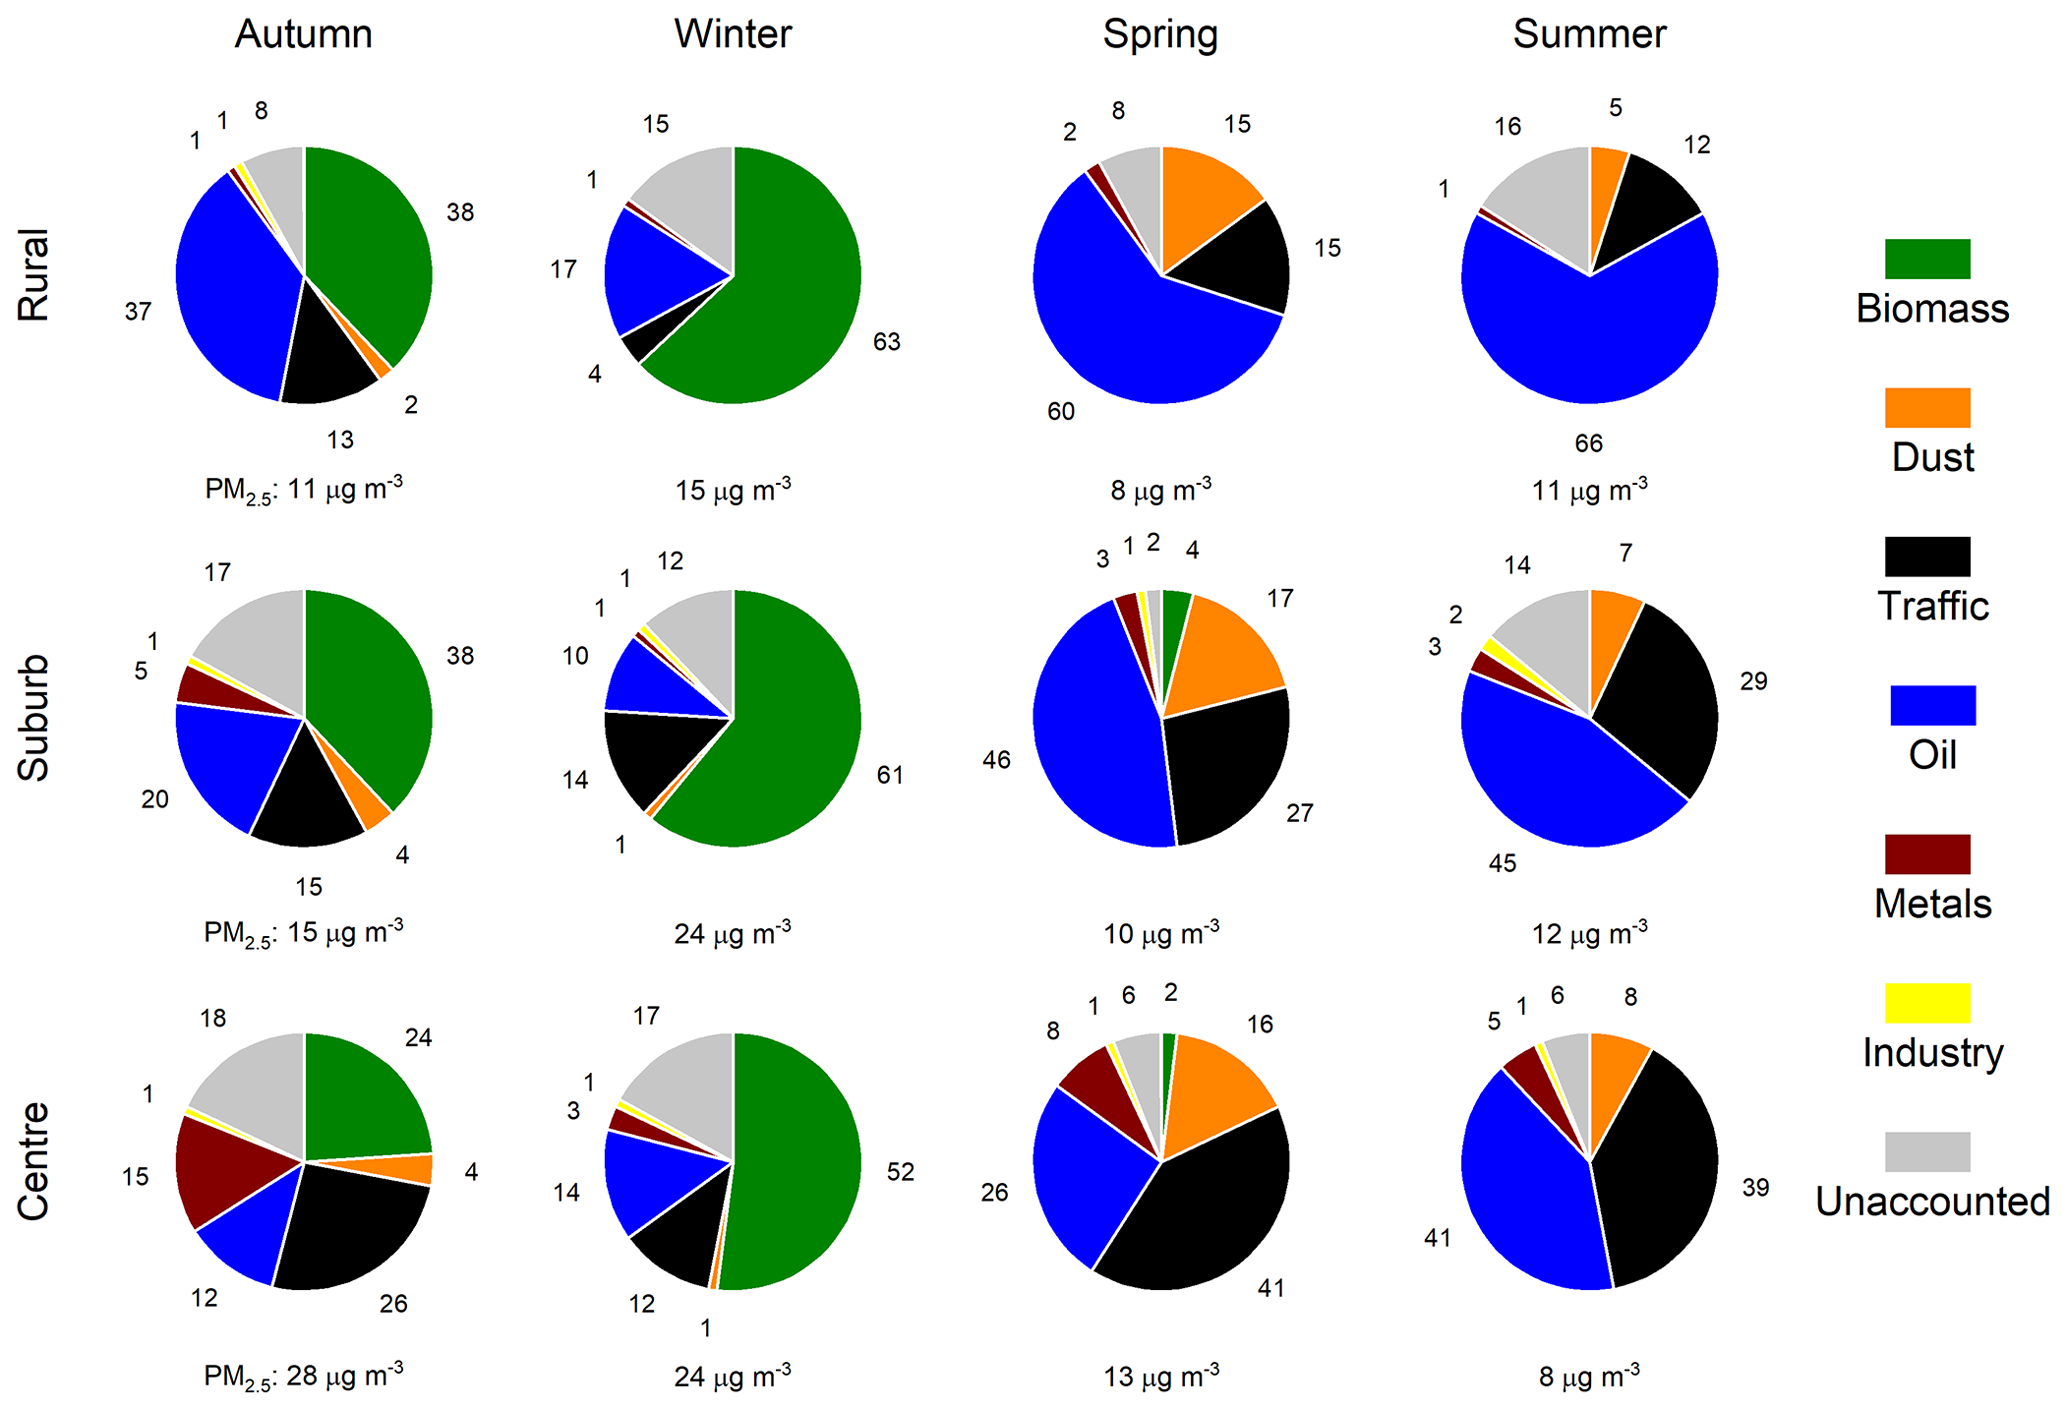
Figure 3Mean contributions of biomass burning, suspended dust, road traffic, oil combustion mixed with coal combustion and long-range transport, vehicle metal wear, a mixed industrial source, and unaccounted for sources to the atmospheric concentration of PM2.5 mass (in %) as derived by PMF modelling in the rural background, suburban area and city centre in different seasons. The median atmospheric concentrations are shown under the pie charts.
In winter, BB was the dominant source (with mean contributions of 50 %–60 %) at all sites. In autumn, BB and oil combustion mixed with coal combustion and long-range transport were the two most important sources in the rural background with similar shares (38 %). In the suburban area, BB exhibited a very similar (38 %) contribution to the rural background, whereas oil combustion and the joint importance of road traffic and vehicle metal wear showed the second largest and similar contributions (20 %). In the city centre, traffic-related sources were the most important contributors (40 %). In spring, oil combustion prevailed (60 %) in the rural background. Its contribution monotonically decreased through the suburban area (46 %) to the city centre (26 %). In parallel with this tendency, the joint share from road traffic and vehicle metal wear increased monotonically (from 17 % through 30 % to 49 %) in the same order with respect to location. The contributions from suspended dust in spring were also significant at all locations, accounting for approximately 15 %. They were influenced by the Saharan dust intrusion episodes extending over the whole Carpathian Basin in this season. In summer, oil combustion was again the dominant source (66 %) in the rural background and showed a decreasing share for the suburban area (45 %) to the city centre (41 %). In contrast, the effects of road traffic monotonically rose (from 13 % through 31 % to 44 %). This increasing tendency was preserved in the other seasons as well. The unaccounted for sources and their possible effects on the final results are discussed in Sect. 3.6.
The apportionments of Cu and Fe, which are of special interest for OP, among the main aerosol sources, as derived by the PMF modelling, are shown in Figs. S7 and S8. Copper mainly or dominantly originated from motor vehicles, i.e. vehicle metal wear and road traffic sources, except for the rural background location in winter and autumn. The outstanding role of road vehicles is confirmed by our earlier results for a street canyon in central Budapest (Salma and Maenhaut, 2006). The smallest shares from vehicles occurred in winter (22 %, 39 % and 65 %, respectively in the rural background, suburban area and city centre), whereas the maximum contributions happened in summer (51 %, 65 % and 87 %, respectively). The contribution of unaccounted for sources in the rural background in winter was large (33 %), which could modify the apportionments. The role of BB in Cu emissions could possibly be explained by illegal industrial and household waste burning as well as biomass burning (Sect. S2; Hoffer et al., 2021).
In the city centre, the vehicle sources showed the largest contributions to Fe (53 %–74 %) in all seasons, and dust was its second most intensive source (30 %–36 %) in spring and summer. At the other two locations, Fe in spring was unambiguously dominated by dust (ca. 55 %), which was influenced by the Saharan dust intrusion. Suspended dust remained the most important source in the rural background in summer, whereas it became comparable to the traffic-related sources in the suburban area. Vehicles tended to be the second largest Fe source (26 %–45 %) in the rural background and suburban areas. Their contributions could also be partly associated with the resuspended road dust generated by moving vehicles. In autumn, the shares in the rural background were more or less balanced among the main sources, while the vehicle contributions were increased in the suburban area.
The examples of Cu and Fe demonstrated broadly varying spatial and temporal tendencies in the source contributions of OP-active chemical species and point to the potential of regulatory measures based on specifically selected source types.
3.4 Oxidative potential and aerosol sources
The OP data normalised to sampled air volume were apportioned to the main aerosol sources, i.e. BB, suspended dust, road traffic, oil combustion mixed with coal combustion and long-range transport, vehicle metal wear, and mixed industrial sources, using the MLR method with the WLS approach. The slopes and intercepts of the regression lines calculated for the whole data set at each sampling location are summarised in Table S4. In a few cases, negative slopes were obtained. This is commonly found with this approach, but the absolute values of the negative slopes should be relatively small. This was not the case for the vehicle metal wear and OPDTT,V pair in the rural background, for the road traffic and OPAA,V pair in the suburban area, and for the oil combustion and OPAA,V pair in the city centre. The intercepts of the OPDTT,V in the suburban area and city centre also resulted in statistically nonzero values. These cases jointly indicate that there could be some aerosol sources missing in the PMF modelling, probably due to the unavailability of some important marker variables and to the limited number of samples. This shortcoming is further discussed in Sect. 3.6. It cannot be excluded that this imperfection influences the order and, mainly, the contributions of the OP sources. To improve the attribution of the OP to the identified aerosol sources, the MLR model with the WLS approach was also performed with a forced positive slopes option. Its constrained results are summarised in Table 2.
Table 2Slopes and intercepts of the multiple linear regression with the weighted least squares approach and forced positive slopes option between oxidative potential (OP) determined by the AA and DTT assays and normalised to sampled air volume (OPAA,V and OPDTT,V, respectively, in ) and the main aerosol sources of biomass burning, suspended dust, road traffic, oil combustion mixed with coal combustion and long-range transport, vehicle metal wear, and a mixed industrial source derived by PMF modelling in the rural background, suburban area and city centre. The number of samples available (n) and the adjusted coefficients of determination (R2) are also shown. Nonsignificant values are shown using italic font.
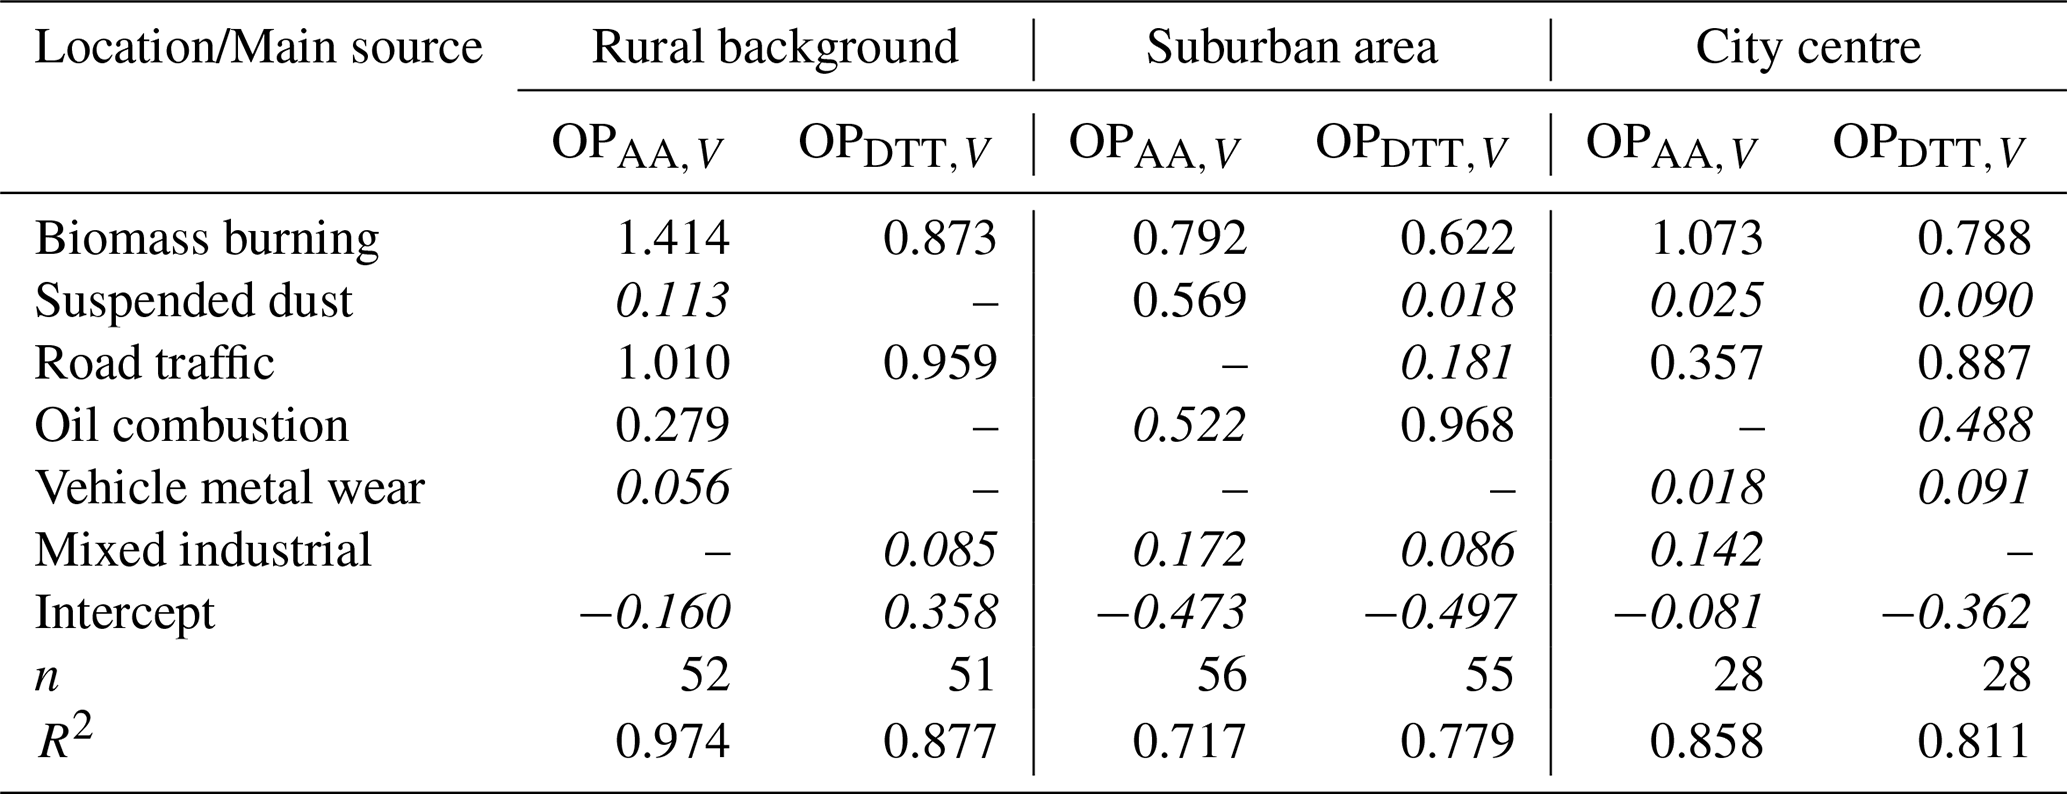
With this latter option, all intercepts became statistically insignificant (p<0.05) from zero. The AA assay yielded significant slopes with BB, road traffic and oil combustion in the rural background; with BB and suspended dust in the suburban area; and with BB and road traffic in the city centre. The DTT assay resulted in significant slopes with BB and road traffic, with BB and oil combustions, and with BB and road traffic in the three environments. Comparing the fitted MLR parameters obtained by the constrained and non-constrained WLS approaches (Tables 2, S4) shows that the orders of the sources did not change substantially and that the positive slopes obtained by the two models are comparable. At the same time, the importance of oil combustion decreased on some occasions. This likely indicates that the derived ranks of the OP sources are sensible approximations of reality with some larger uncertainties in their contributions.
The driving effect of BB on OP has been highlighted in other studies (e.g. Verma et al., 2015; Lionetto et al., 2021; Borlaza et al., 2022). The intensity of BB in the Carpathian Basin is, however, only high in the heating period (autumn and winter), while it is much lower outside of this interval. To refine the apportionment of the OP data to aerosol sources active in the non-heating seasons, the MLR modelling was repeated with the joint data set of all sites split into heating and non-heating periods. These results confirmed that BB shows overwhelming contributions to the OP values in the heating period, regardless of the intensity of the vehicle road traffic. The latter changed substantially among the rural background and urban sites. More importantly, the obtained results also imply that the shares from vehicles (i.e. joint sources of road traffic and vehicle metal wear) to OP prevailed in the non-heating period. This is in line with the attributions of some transition metals, such as Cu and Fe, to these aerosol sources (Figs. S7, S8; Salma and Maenhaut, 2006) and also points to the remarkable role of primary traffic emissions in causing oxidative stress in spring and summer.
Secondary organic aerosol under anthropogenically influenced conditions was proven to be one of the top factors impacting the OP (Srivastava et al., 2018; Wong et al., 2019; Daellenbach et al., 2020; Borlaza et al., 2021a, b; Pye et al., 2021; Zhang et al., 2022). The involvement of the SOC concentrations in the PMF was hampered by their smaller count and larger relative uncertainty (up to 30 %–50 %; Salma et al., 2022). Instead, we investigated the correlations between the OP data sets and SOC concentrations or SOC : OC ratios. The dependencies of the OPDTT,V on the SOC are shown in Fig. S9. The OP values at the urban locations tended to increase with the SOC in parallel with each other, while the OP rose at a slower rate at the regional background location. The reasons behind these observations likely include the distinct effects of biogenic and anthropogenic secondary organic aerosols, which typically present in different portions at the sampling locations. The results may indirectly indicate that photochemical ageing processes and SOC formation over seasons impact the OP of PM as well (Wong et al., 2019; Kodros et al., 2020; Zhang et al., 2022). The increasing slope of the regression lines from the rural background to the city centre (shown in Fig. 2b) may also imply that organics of biogenic origin exhibit smaller responses in the DTT assays than those of BB (Verma et al., 2015) or of urban sources in general. There were no significant correlations obtained for the other data pairs.
3.5 Oxidative potential and air quality
Particulate matter mass has been proven to be the most important component from the criteria air pollutants in the Carpathian Basin (Salma et al., 2020a, b). Generally, this measure expresses the air quality in the basin. Therefore, the relationships between the PM2.5 mass and OP data sets normalised to sampled air volume were separately investigated. Their correlation dependencies were all significant (Fig. 4). Low to moderate spatial and temporal correlations between these variables have also been observed in earlier studies under broadly varying conditions (Künzli et al., 2006; Boogaard et al., 2012; Yang et al., 2015; Fang et al., 2016; Chirizzi et al., 2017).
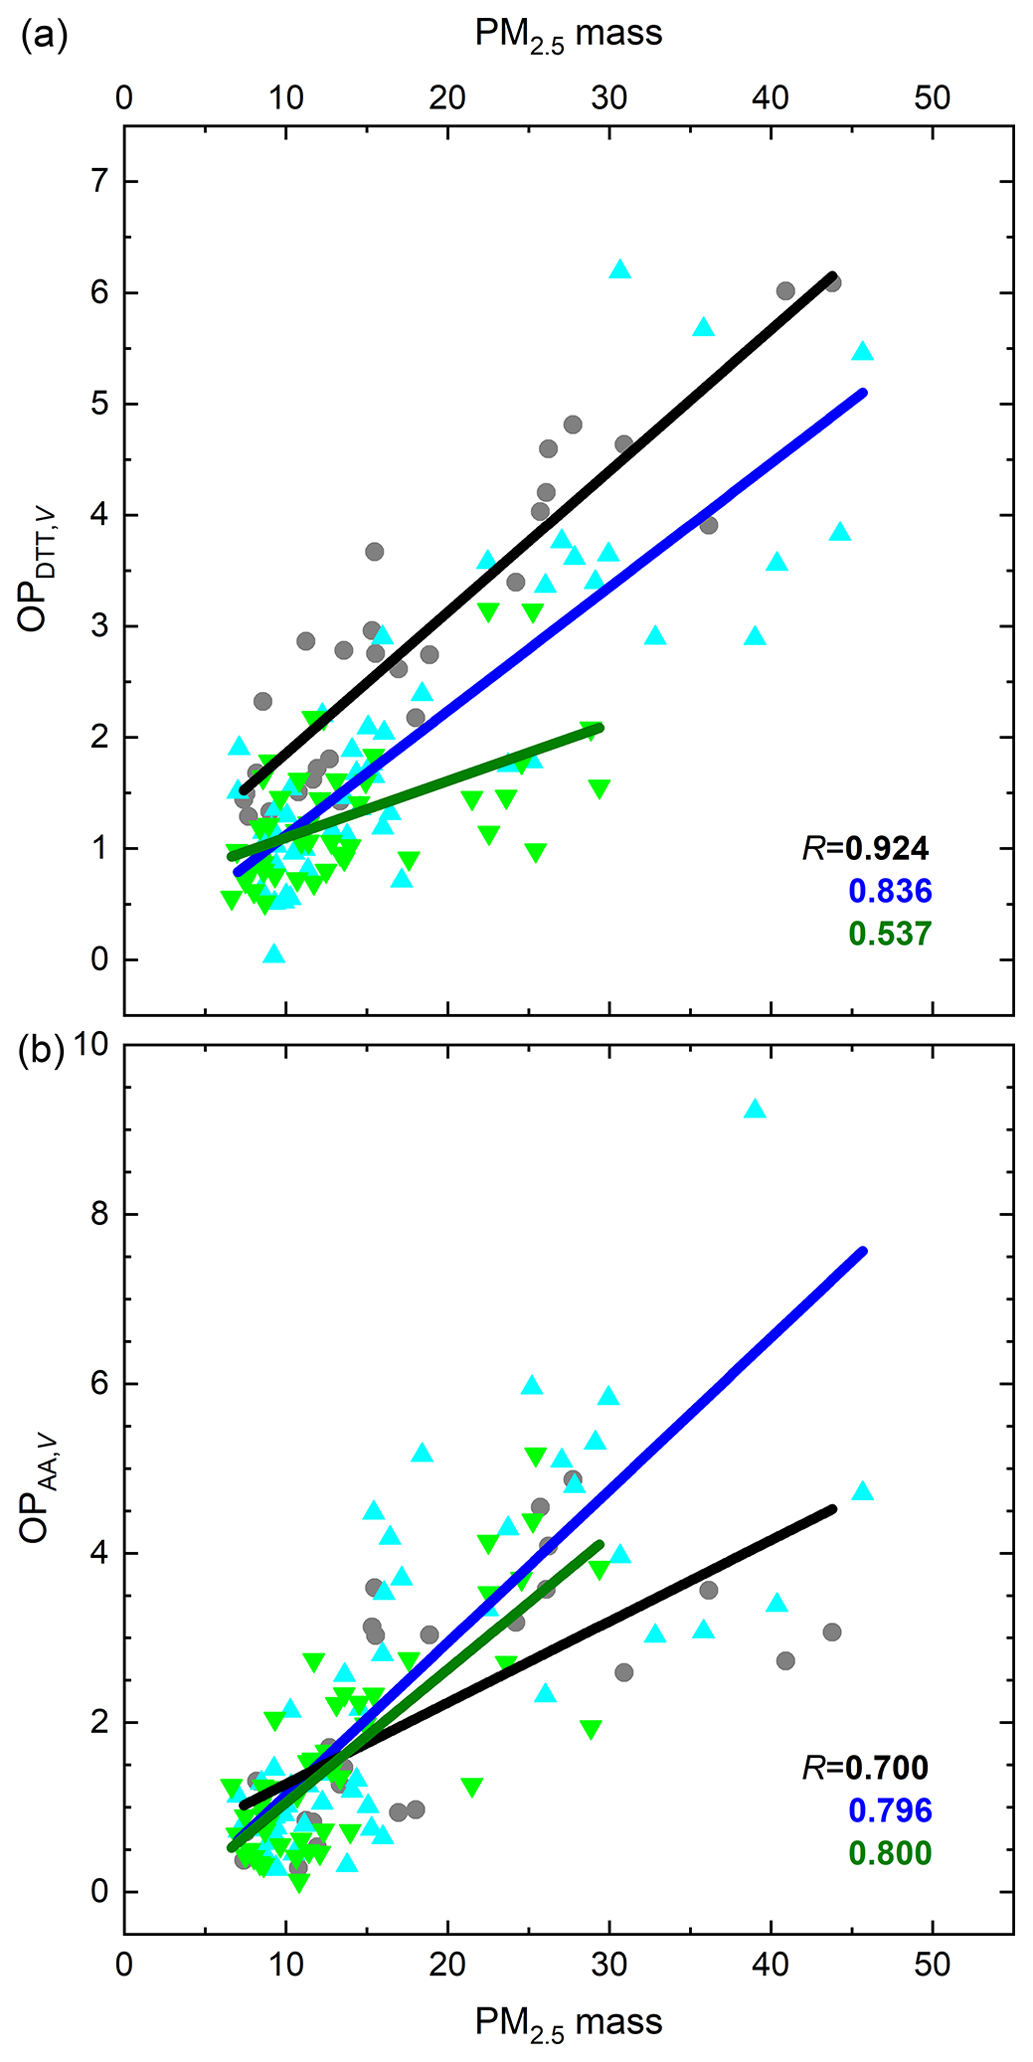
Figure 4Scatter plots of the oxidative potential (OP) determined by the DTT (a) and AA (b) assays and normalised to sampled air volume (V; OPDTT,V and OPAA,V, respectively, in ) and PM2.5 mass concentrations (in µg m−3) for the rural background, suburban area and city centre. The lines represent linear regressions of the data sets. The coefficients of correlation (R values) are also indicated.
The dependencies of the OPDTT,V (Fig. 4a) resulted in two almost parallel lines (with slopes and SDs of 0.11 ± 0.01 and 0.13 ± 0.01 , respectively) for the city centre and suburban area, while a smaller slope (0.051 ± 0.012 ) was observed for the rural background. The situation for the OPAA,V (Fig. 4b) was less obvious but somewhat similar to OPDTT,V. The regression lines for the rural background and suburban area tended to be fairly parallel with each other (with slopes and SDs of 0.16 ± 0.02 and 0.18 ± 0.02 , respectively), whereas the slope for the city centre was smaller (0.096 ± 0.019 ). The intercepts could be typically regarded to be zero within the uncertainty interval.
The parallel tendencies may indicate that the effects of the PM chemical compositions on the given assay were close to each other at the sampling locations with the parallel lines. This was likely caused by spatial and temporal similarities in the main sources, such as road traffic and resuspended dust, particularly for the DTT assay, and biomass burning, especially for the AA assay (Salma et al., 2020a). Particles in the third environment (with the smaller slope) likely contained less OP-active components from the point of the given assay and, therefore, the increase in the OP was more modest. This interpretation is confirmed by earlier similar conclusions (Daellenbach et al., 2020). Nevertheless, it should be stressed that all slopes were substantially smaller than unity. This implies that the air quality regulatory measures based on the PM2.5 mass are expected to result in smaller improvements in oxidative stress compared with dedicated measures that specifically target (appropriately selected) aerosol sources.
3.6 Limitations and later possibilities
The total number of samples collected at each location represents a limitation, mainly for PMF modelling. To overcome this problem, we applied multisite PMF. It was implicitly assumed in this approach that the main sources active at the locations can be characterised by similar chemical profiles. This is not completely fulfilled for all seasons. An example is the suspended dust, which is comprised of fugitive mineral and soil dust made of geogenic elements in the rural backgrounds. At the urban sites, it contains further constituents originally generated by anthropogenic activities; these constituents settled onto surfaces and later entered into the air again via resuspension. It is mentioned that the PMF modelling for the separate locations yielded fairly similar results to the multisite approach, although the statistical uncertainties of these latter calculations were favourable.
The unavailability of some secondary inorganics, mainly nitrate and ammonium ions, in the present analytical data sets introduced another limitation. Their contributions were likely contained in the unaccounted for sources in the PMF modelling. They ranged up to 18 % and showed contributions mainly in colder (heating) seasons or in summer for the rural background and suburban areas. Fortunately, pure secondary inorganic constituents are associated with a lower contribution to the OP of PM (Cassee et al., 2013; Daellenbach et al., 2020), although they can influence the OP via the acid-mediated dissolution of transition metals (Fang et al., 2017). However, the robustness of the PMF modelling can influence the final apportion of the OP among the resolved sources.
A larger number of samples and an extended list of variables are required because of the basin characteristics of the region of interest. The poorest air quality in the whole Carpathian Basin generally occurs in winter (Salma et al., 2022), when persistent anticyclonic weather situations and lasting temperature inversions happen for longer periods of time. During these intervals, the time series of aerosol constituents, even of different origins, change coherently at many locations due to the common effects of regional meteorology. This dependency can further encumber the separation of the aerosol sources in PMF modelling (Salma et al., 2004).
The present results and conclusions for the OP are strictly valid for the concrete sample preparation and selected assays used. A more holistic picture can be achieved by deploying additional and extended experimental methods, including those for sample extraction treatment and OP measurement, that advantageously comprise both cellular and, possibly, further acellular assays. The present outcomes can also be improved by involving additional important chemical species and markers, mainly water-soluble metal ions, water-soluble OC, primary biogenic OC and PAHs. Extended research is required to address some additional relevant sources, such as coal combustion, biogenic emissions and illegal waste burning. Investigations of size-fractionated aerosol samples with several toxicity indicators and possible synergism or antagonism among chemical species could offer further insights into oxidative stress research. The experience gained in the present work, which was conducted in a systematic manner for the first time in this region, can provide valuable knowledge with respect to planning further related studies.
We showed that the OP induced by PM2.5 and determined by the AA and DTT assays in the rural (regional) background of the Carpathian Basin and in the suburban area and centre of its largest city of Budapest differed substantially and in a complex manner with location and changed considerably and consistently with season. The alterations were mainly caused by varying intensities of the main aerosol sources and possibly by other specific seasonal features. Biomass burning clearly exhibited the dominant influence at all locations in the heating period. Several pieces of indirect evidence suggest that the joint effects of motor vehicles involving road traffic and vehicle metal wear played the most important role in summer and spring, with considerable contributions from oil combustion and resuspended dust.
The most severe daily PM health limit exceedances in Budapest (and several other European cities) occur in winter due to both residential heating and meteorological effects. The contributions of BB to OP are the largest during this season. Thus, human exposure to high pollution levels are further exacerbated by the chemical composition of the PM, which causes increased oxidative stress. As far as the sources related to motor vehicles are concerned, high traffic intensities frequently occur in city centres, thereby generating dangerous hotspots of particularly OP-active species. At these sites, an enhanced exposure of the public in summer and spring often coincides with high population densities.
Our conclusions imply that targeting the PM mass in general does not efficiently reduce the oxidative burden from PM exposure. Instead, substantial health improvements could be achieved by focusing on some specific source types, such as BB in winter and vehicle traffic in non-heating period. The former source may have timely consequences, as it is expected to increase in the near future. The non-exhaust emissions from vehicle traffic are anticipated to gain in relevance as well, as high-efficiency exhaust gas aftertreatment devices have already been adopted for internal combustion engines and electric vehicles are becoming more common. The advantages of BB and electric cars are often emphasised, whereas their potential drawbacks are less disseminated. Further investigation of their distinctive health effects is needed in order to set up effective mitigation policies and season-specific regulations.
The observational data are available from the corresponding author upon request.
The supplement related to this article is available online at: https://doi.org/10.5194/acp-23-14255-2023-supplement.
MV evaluated the data, performed the modelling calculations, prepared figures, participated in interpreting the results and contributed to writing the manuscript; GU and JLJ managed the OP measurements; GU, JLJ and PD participated in interpreting the results and revising the manuscript; ZK and EP managed the PIXE measurements and participated in interpreting the PMF results; IS conceived the research, arranged the sample collection, evaluated and interpreted the results, prepared figures, and wrote the manuscript. All co-authors reviewed and commented on the manuscript.
The contact author has declared that none of the authors has any competing interests.
Publisher's note: Copernicus Publications remains neutral with regard to jurisdictional claims made in the text, published maps, institutional affiliations, or any other geographical representation in this paper. While Copernicus Publications makes every effort to include appropriate place names, the final responsibility lies with the authors.
The authors are grateful to Anikó Angyal of the Institute for Nuclear Research for the PIXE measurements, to Attila Machon of the Hungarian Meteorological Service for assistance with sample collection and OC/EC measurements, and to Anikó Vasanits of the Eötvös Loránd University for the LVG measurements.
This research has been supported by the Hungarian Research, Development and Innovation Office (grant nos. K132254 and K146915); the European Regional Development Fund and the Hungarian Government (grant no. GINOP-2.3.3-15-2016-00005); and the New National Excellence Program of the Ministry for Innovation and Technology from the source of the Hungarian Research, Development and Innovation Fund (grant no. ÚNKP-21-3). The OP analysis was supported by the air quality and climate at urban scale (ACME) programme (grant no. ANR-15-IDEX-02) and the French National Research Agency (ANR) Get OP Stand OP programme (grant no. ANR-19-CE34-0002-01) and was carried out at the Air-O-Sol facility at the Institute of Environmental Geosciences (IGE), made possible by laboratory equipment funding from Labex OSUG@2020 (grant no. ANR10 LABX56).
This paper was edited by Markku Kulmala and reviewed by two anonymous referees.
Abrams, J. Y., Weber, R. J., Klein, M., Samat, S. E., Chang, H. H., Strickland, M. J., Verma, V., Fang, T., Bates, J. T., Mulholland, J. A., Russell, A. G., and Tolbert, P. E.: Associations between ambient fine particulate oxidative potential and cardiorespiratory emergency department visits, Environ. Health Persp., 125, 107008, https://doi.org/10.1289/EHP1545, 2017.
Aljboor, S., Angyal, A., Baranyai, D., Papp, E., Szarka, M., Szikszai, Z., Rajta, I., Vajda, I., and Kertész, Z.: Light-element sensitive in-air millibeam PIXE setup for fast measurement of atmospheric aerosol samples, J. Anal. At. Spectrom., 38, 57–65, https://doi.org/10.1039/D2JA00291D, 2023.
Apte, J. S., Marshall, J. D., Cohen, A. J., and Brauer, M.: Addressing global mortality from ambient PM2.5, Environ. Sci. Technol., 49, 8057–8066, https://doi.org/10.1021/acs.est.5b01236, 2015.
Ayres, J. G., Borm, P., Cassee, F. R., Castranova, V., Donaldson, K., Ghio, A., Harrison, R. M., Hider, R., Kelly, F., Kooter, I. M., Marano, F., Maynard, R. L., Mudway, I., Nel, A., Sioutas, C., Smith, S., Baeza-Squiban, A., Cho, A., Duggan, S., and Froines, J.: Evaluating the toxicity of airborne particulate matter and nanoparticles by measuring oxidative stress potential – a workshop report and consensus statement, Inhal. Toxicol., 20, 75–99, https://doi.org/10.1080/08958370701665517, 2008.
Bates, J. T., Weber, R. J., Abrams, J., Verma, V., Fang, T., Klein, M., Strickland, M. J., Sarnat, S. E., Chang, H. H., Mulholland, J. A., Tolbert, P. E., and Russell, A. G.: Reactive oxygen species generation linked to sources of atmospheric particulate matter and cardiorespiratory effects, Environ. Sci. Technol., 49, 13605–13612, https://doi.org/10.1021/acs.est.5b02967, 2015.
Bates, J. T., Fang, T., Verma, V., Zeng, L., Weber, R. J., Tolbert, P. E., Abrams, J. Y., Sarnat, S. E., Klein, M., Mulholland, J. A., and Russell, A. G.: Review of acellular assays of ambient particulate matter oxidative potential: methods and relationships with composition, sources, and health effects, Environ. Sci. Technol., 53, 4003–4019, https://doi.org/10.1021/acs.est.8b03430, 2019.
Baumann, K., Wietzoreck, M., Shahpoury, P., Filippi, A., Hildmann, S., Lelieveld, S., Berkemeier, T., Tong, H., and Lammel, G.: Is the oxidative potential of components of fine particulate matter surface-mediated?, Environ. Sci. Pollut. R., 30, 16749–16755, https://doi.org/10.1007/s11356-022-24897-3, 2023.
Blumberger, Z. I., Vasanits-Zsigrai, A., Farkas, G., and Salma, I.: Mass size distribution of major monosaccharide anhydrides and mass contribution of biomass burning, Atmos. Res., 220, 1–9, https://doi.org/10.1016/j.atmosres.2019.01.001, 2019.
Bondy, S. C.: Anthropogenic pollutants may increase the incidence of neurodegenerative disease in an aging population, Toxicology, 341–343, 41–46, https://doi.org/10.1016/j.tox.2016.01.007, 2016.
Boogaard, H., Janssen, N. A. H., Fischer, P. H., Kos, G. P. A., Weijers, E. P., Cassee, F. R., van der Zee, S. C., de Hartog, J. J., Brunekreef, B., and Hoek G.: Contrasts in oxidative potential and other particulate matter characteristics collected near major streets and background locations, Environ. Health Persp., 120, 2, https://doi.org/10.1289/ehp.1103667, 2012.
Borlaza, L. J. S., Weber, S., Jaffrezo, J.-L., Houdier, S., Slama, R., Rieux, C., Albinet, A., Micallef, S., Trébluchon, C., and Uzu, G.: Disparities in particulate matter (PM10) origins and oxidative potential at a city scale (Grenoble, France) – Part 2: Sources of PM10 oxidative potential using multiple linear regression analysis and the predictive applicability of multilayer perceptron neural network analysis, Atmos. Chem. Phys., 21, 9719–9739, https://doi.org/10.5194/acp-21-9719-2021, 2021a.
Borlaza, L. J. S., Weber, S., Uzu, G., Jacob, V., Cañete, T., Micallef, S., Trébuchon, C., Slama, R., Favez, O., and Jaffrezo, J.-L.: Disparities in particulate matter (PM10) origins and oxidative potential at a city scale (Grenoble, France) – Part 1: Source apportionment at three neighbouring sites, Atmos. Chem. Phys., 21, 5415–5437, https://doi.org/10.5194/acp-21-5415-2021, 2021b.
Borlaza, L. J., Weber, S., Marsal, A., Uzu, G., Jacob, V., Besombes, J.-L., Chatain, M., Conil, S., and Jaffrezo, J.-L.: Nine-year trends of PM10 sources and oxidative potential in a rural background site in France, Atmos. Chem. Phys., 22, 8701–8723, https://doi.org/10.5194/acp-22-8701-2022, 2022.
Borm, P. J. A., Kelly, F., Künzli, N., Schins, R. P. F., and Donaldson, K.: Oxidant generation by particulate matter: from biologically effective dose to a promising, novel metric, Occup. Environ. Med., 64, 73–74, https://doi.org/10.1136/oem.2006.029090, 2007.
Calas, A., Uzu, G., Martins, J. M. F., Voisin, D., Spadini, L., Lacroix, T., and Jaffrezo, J.-L.: The importance of simulated lung fluid (SLF) extractions for a more relevant evaluation of the oxidative potential of particulate matter, Sci. Rep.-UK, 7, 11617, https://doi.org/10.1038/s41598-017-11979-3, 2017.
Calas, A., Uzu, G., Kelly, F. J., Houdier, S., Martins, J. M. F., Thomas, F., Molton, F., Charron, A., Dunster, C., Oliete, A., Jacob, V., Besombes, J.-L., Chevrier, F., and Jaffrezo, J.-L.: Comparison between five acellular oxidative potential measurement assays performed with detailed chemistry on PM10 samples from the city of Chamonix (France), Atmos. Chem. Phys., 18, 7863–7875, https://doi.org/10.5194/acp-18-7863-2018, 2018.
Calas, A., Uzu, G., Besombes, J.-L., Martins, J. M. F., Redaelli, M., Weber, S., Charron, A., Albinet, A., Chevrier, F., Brulfert, G., Mesbah, B., Favez, O., and Jaffrezo, J.-L.: Seasonal variations and chemical predictors of oxidative potential (OP) of particulate matter (PM), for seven urban French sites, Atmosphere, 10, 698, https://doi.org/10.3390/atmos10110698, 2019.
Cassee, F. R., Héroux, M.-E., Gerlofs-Nijland, M. E., and Kelly, F. J.: Particulate matter beyond mass: recent health evidence on the role of fractions, chemical constituents and sources of emission, Inhal. Toxicol., 25, 802–812, https://doi.org/10.3109/08958378.2013.850127, 2013.
Cavalli, F., Viana, M., Yttri, K. E., Genberg, J., and Putaud, J.-P.: Toward a standardised thermal-optical protocol for measuring atmospheric organic and elemental carbon: the EUSAAR protocol, Atmos. Meas. Tech., 3, 79–89, https://doi.org/10.5194/amt-3-79-2010, 2010.
Charrier, J. G. and Anastasio, C.: On dithiothreitol (DTT) as a measure of oxidative potential for ambient particles: evidence for the importance of soluble transition metals, Atmos. Chem. Phys., 12, 9321–9333, https://doi.org/10.5194/acp-12-9321-2012, 2012.
Charrier, J. G., McFall, A. S., Vu, K. K.-T., Baroi, J., Olea, C., Hasson, A., and Anastasio, C.: A Bias in the “Mass-Normalized” DTT Response – An Effect of Non-Linear Concentration-Response Curves for Copper and Manganese, Atmos. Environ., 144, 325–334, https://doi.org/10.1016/j.atmosenv.2016.08.071, 2016.
Chiari, M., Yubero, E., Calzolai, G., Lucarelli, F., Crespo, J., Galindo, N., Nicolás, J. F., Giannoni, M., and Nava, S.: Comparison of PIXE and XRF analysis of airborne particulate matter samples collected on Teflon and quartz fibre filters, Nucl. Instrum. Meth. B, 417, 128–132, https://doi.org/10.1016/j.nimb.2017.07.031, 2018.
Chirizzi, D., Cesari, D., Guascito, M. R., Dinoi, A., Giotta, L., Donateo, A., and Contini, D.: Influence of Saharan dust outbreaks and carbon content on oxidative potential of water-soluble fractions of PM2.5 and PM10, Atmos. Environ., 163, 1–8, https://doi.org/10.1016/j.atmosenv.2017.05.021, 2017.
Cho, A. K., Sioutas, C., Miguel, A. H., Kumagai, Y., Schmitz, D. A., Singh, M., Eiguren-Fernandez, A., and Froines, J. R.: Redox activity of airborne particulate matter at different sites in the Los Angeles Basin, Environ. Res., 99, 40–47, https://doi.org/10.1016/j.envres.2005.01.003, 2005.
Cohen, A., Brauer, M., Burnett, R., Anderson, H., Frostad, J., Estep, K., Balakrishnan, K., Brunekreef, B., Dandona, L., Dandona, R., Feigin, V., Freedman, G., Hubbell, B., Jobling, A., Kan, H., Knibbs, L., Liu, Y., Martin, R., Morawska, L., and Forouzanfar, M.: Estimates and 25 year trends of the global burden of disease attributable to ambient air pollution: An analysis of data from the Global Burden of Diseases Study 2015, Lancet, 389, 1907–1918, https://doi.org/10.1016/S0140-6736(17)30505-6, 2017.
Daellenbach, K. R., Uzu, G., Jiang, J., Cassagnes, L.-E., Leni, Z., Vlachou, A., Stefenelli, G., Canonaco, F., Weber, S., Segers, A., Kuenen, J. J. P., Schaap, M., Favez, O., Albinet, A., Aksoyoglu, S., Dommen, J., Baltensperger, U., Geiser, M., El Haddad, I., Jaffrezo, J.-L., and Prévôt, A. S. H.: Sources of particulate-matter air pollution and its oxidative potential in Europe, Nature, 587, 414–419, https://doi.org/10.1038/s41586-020-2902-8, 2020.
Dai, Q., Hopke, P. K., Bi, X., and Feng, Y.: Improving apportionment of PM2.5 using multisite PMF by constraining G-values with a prioriinformation, Sci. Total Environ., 736, 139657, https://doi.org/10.1016/j.scitotenv.2020.139657, 2020.
Dhalla, N., Temsah, R. M., and Netticadan, T.: Role of oxidative stress in cardiovascular diseases, J. Hypertens., 18, 655–673, https://doi.org/10.1097/00004872-200018060-00002, 2000.
Donaldson, K., Tran, L., Jimenez, L., Duffin, R., Newby, D., Mills, N., MacNee, W., and Stone, V.: Combustion-derived nanoparticles: a review of their toxicology following inhalation exposure, Part. Fibre Toxicol., 2, 10, https://doi.org/10.1186/1743-8977-2-10, 2005.
EPA: Positive matrix factorization model for environmental data analyses, https://www.epa.gov/air-research/positive-matrix-factorization-model-environmental-data-analyses (last access: 20 June 2022), 2017.
Fang, T., Verma, V., Bates, J. T., Abrams, J., Klein, M., Strickland, M. J., Sarnat, S. E., Chang, H. H., Mulholland, J. A., Tolbert, P. E., Russell, A. G., and Weber, R. J.: Oxidative potential of ambient water-soluble PM2.5 in the southeastern United States: contrasts in sources and health associations between ascorbic acid (AA) and dithiothreitol (DTT) assays, Atmos. Chem. Phys., 16, 3865–3879, https://doi.org/10.5194/acp-16-3865-2016, 2016.
Fang, T., Guo, H., Zeng, L., Verma, V., Nenes, A., and Weber, R. J.: Highly acidic ambient particles, soluble metals, and oxidative potential: a link between sulfate and aerosol toxicity, Environ. Sci. Technol., 51, 2611–2620, https://doi.org/10.1021/acs.est.6b06151, 2017.
Furu, E., Angyal, A., Szoboszlai, Z., Papp, E., Török, Z., and Kertész, Z.: Characterization of aerosol pollution in two Hungarian cities in winter 2009–2010, Atmosphere, 13, 554, https://doi.org/10.3390/atmos13040554, 2022.
Gao, D., Ripley, S., Weichenthal, S., and Godri Pollitt, K. J.: Ambient particulate matter oxidative potential: chemical determinants, associated health effects, and strategies for risk management, Free Radical Bio. Med., 151, 7–25, https://doi.org/10.1016/j.freeradbiomed.2020.04.028, 2020.
Godri, K. J., Harrison, R. M., Evans, T., Baker, T., Dunster, C., Mudway, I. S., and Kelly, F. J.: Increased oxidative burden associated with traffic component of ambient particulate matter at roadside and urban background schools sites in London, PLoS One, 6, 1–11, https://doi.org/10.1371/journal.pone.0021961, 2011.
Grange, S. K., Uzu, G., Weber, S., Jaffrezo, J.-L., and Hueglin, C.: Linking Switzerland's PM10 and PM2.5 oxidative potential (OP) with emission sources, Atmos. Chem. Phys., 22, 7029–7050, https://doi.org/10.5194/acp-22-7029-2022, 2022.
Hoffer, A., Tóth, Á., Jancsek-Turóczi, B., Machon, A., Meiramova, A., Nagy, A., Marmureanu, L., and Gelencsér, A.: Potential new tracers and their mass fraction in the emitted PM10 from the burning of household waste in stoves, Atmos. Chem. Phys., 21, 17855–17864, https://doi.org/10.5194/acp-21-17855-2021, 2021.
Hopke, P. K.: A guide to positive matrix factorization, Clarkson University, Potsdam, USA, https://www3.epa.gov/ttnamti1/files/ambient/pm25/workshop/laymen.pdf (last access: 20 June 2022), 2000.
Hopke, P. K.: Review of receptor modeling methods for source apportionment, J. Air Waste Manage., 66, 237–259, https://doi.org/10.1080/10962247.2016.1140693, 2016.
In 't Veld, M., Pandolfi, M., Amato, F., Pérez, N., Reche, C., Dominutti, P., Jaffrezo, J.-L., Alastuey, A., Querol, X., and Uzu, G.: Discovering oxidative potential (OP) drivers of atmospheric PM10, PM2.5, and PM1 simultaneously in North-Eastern Spain, Sci. Total Environ., 857, 159386, https://doi.org/10.1016/j.scitotenv.2022.159386, 2023.
Janssen, N. A. H., Yang, A., Strak, M., Steenhof, M., Hellack, B., Gerlofs-Nijland, M. E., Kuhlbusch, T., Kelly, F., Harrison, R., Brunekreef, B., Hoek, G., and Cassee, F.: Oxidative potential of particulate matter collected at sites with different source characteristics, Sci. Total Environ., 472, 572–581, https://doi.org/10.1016/j.scitotenv.2013.11.099, 2014.
Katerji, M., Filippova, M., and Duerksen-Hughes, P.: Approaches and methods to measure oxidative stress in clinical samples: research applications in the cancer field, Oxid. Med. Cell. Longev., 12, 1279250, https://doi.org/10.1155/2019/1279250, 2019.
Kelly, F. J. and Fussell, J. C.: Size, source and chemical composition as determinants of toxicity attributable to ambient particulate matter, Atmos. Environ., 60, 504–526, https://doi.org/10.1016/j.atmosenv.2012.06.039, 2012.
Kelly, F. J. and Fussell, J. C.: Air pollution and public health: emerging hazards and improved understanding of risk, Environ. Geochem. Hlth., 37, 631–649, https://doi.org/10.1007/s10653-015-9720-1, 2015.
Kelly, F. J. and Fussell, J. C.: Toxicity of airborne particles-established evidence, knowledge gaps and emerging areas of importance, Philos. T. Roy. Soc. A, 378, 2019.0322, https://doi.org/10.1098/rsta.2019.0322, 2020.
Kelly, F. J. and Mudway, I. S.: Protein oxidation at the air-lung interface, Amino Acids, 25, 375–396, https://doi.org/10.1007/s00726-003-0024-x, 2003.
Kodros, J. K., Papanastasiou, D. K., Paglione, M., Masiol, M., Squizzato, S., Florou, K., Skyllakou, K., Kaltsonoudis, C., Nenes, A., and Pandis, S. N.: Rapid dark aging of biomass burning as an overlooked source of oxidized organic aerosol, P. Natl. Acad. Sci. USA, 117, 33028–33033, https://doi.org/10.1073/pnas.2010365117, 2020.
Künzli, N., Mudway, I. S., Gotschi, T., Shi, T. M., Kelly, F. J., Cook, S., Burney, P., Forsberg, B., Gauderman, J. W., Hazenkamp, M. E., Heinrich, J., Jarvis, D., Norback, D., Payo-Losa, F., Poli, A., Sunyer, J., and Borm, P. J. A.: Comparison of oxidative properties, light absorbance, and total and elemental mass concentration of ambient PM2.5 collected at 20 European sites, Environ. Health Persp., 114, 684–690, https://doi.org/10.1289/ehp.8584, 2006.
Kurihara, K., Iwata, A., Murray Horwitz, S. G., Ogane, K., Sugioka, T., Matsuki, A., and Okuda, T.: Contribution of physical and chemical properties to dithiothreitol-measured oxidative potentials of atmospheric aerosol particles at urban and rural sites in Japan, Atmosphere, 13, 319, https://doi.org/10.3390/atmos13020319, 2022.
Lelieveld, J., Evans, J. S., Fnais, M., Giannadaki, D., and Pozzer, A.: The contribution of outdoor air pollution sources to premature mortality on a global scale, Nature, 525, 367–371, https://doi.org/10.1038/nature15371, 2015.
Lelieveld, J., Pozzer, A., Pöschl, U., Fnais, M., Haines, A., and Münzel, T.: Loss of life expectancy from air pollution compared to other risk factors: a worldwide perspective, Cardiovasc. Res., 116, 1910–1917, https://doi.org/10.1093/cvr/cvaa073, 2020.
Lionetto, M. G., Guascito, M. R., Giordano, M. E., Caricato, R., De Bartolomeo, A. R., Romano, M. P., Conte, M., Dinoi, A., and Contini, D.: Oxidative potential, cytotoxicity, and intracellular oxidative stress generating capacity of PM10: a case study in south of Italy, Atmosphere, 12, 464, https://doi.org/10.3390/atmos12040464, 2021.
Norris, G., Duvall, R., Brown, S., and Bai, S.: EPA Positive Matrix Factorization (PMF) 5.0 fundamentals and user guide, Technical Report, US Environmental Protection Agency, National Exposure Research Laboratory, Washington, USA, https://www.epa.gov/sites/default/files/2015-02/documents/pmf_5.0_user_guide.pdf (last access: 20 June 2022), 2014.
Paatero, P. and Tapper, U.: Positive matrix factorization: A non-negative factor model with optimal utilization of error estimates of data values, Environmetrics, 5, 111–126, https://doi.org/10.1002/env.3170050203, 1994.
Pye, H. O. T., Ward-Caviness, C. K., Murphy, B. N., Appel, K. W., and Seltzer, K. M.: Secondary organic aerosol association with cardiorespiratory disease mortality in the United States, Nat. Commun., 12, 7215, https://doi.org/10.1038/s41467-021-27484-1, 2021.
Riediker, M., Zink, D., Kreyling, W., Oberdörster, G., Elder, A., Graham, U., Lynch, I., Duschl, A., Ichihara, G., Ichihara, S., Kobayashi, T., Hisanaga, N., Umezawa, M., Cheng, T. J., Handy, R., Gulumian, M., Tinkle, S., and Cassee, F.: Particle toxicology and health – where are we?, Part. Fibre Toxicol., 16, 19, https://doi.org/10.1186/s12989-019-0302-8, 2019.
Salma, I. and Maenhaut, W.: Changes in chemical composition and mass of atmospheric aerosol pollution between 1996 and 2002 in a Central European city, Environ. Pollut., 143, 479–488, https://doi.org/10.1016/j.envpol.2005.11.042, 2006.
Salma, I., Chi, X., and Maenhaut, W.: Elemental and organic carbon in urban canyon and background environments in Budapest, Hungary, Atmos. Environ., 38, 27–36, https://doi.org/10.1016/j.atmosenv.2003.09.047, 2004.
Salma, I., Ocskay, R., Raes, N., and Maenhaut, W.: Fine structure of mass size distributions in urban environment, Atmos. Environ., 39, 5363–5374, https://doi.org/10.1016/j.atmosenv.2005.05.021, 2005.
Salma, I., Németh, Z., Weidinger, T., Kovács, B., and Kristóf, G.: Measurement, growth types and shrinkage of newly formed aerosol particles at an urban research platform, Atmos. Chem. Phys., 16, 7837–7851, https://doi.org/10.5194/acp-16-7837-2016, 2016.
Salma, I., Vasanits-Zsigrai, A., Machon, A., Varga, T., Major, I., Gergely, V., and Molnár, M.: Fossil fuel combustion, biomass burning and biogenic sources of fine carbonaceous aerosol in the Carpathian Basin, Atmos. Chem. Phys., 20, 4295–4312, https://doi.org/10.5194/acp-20-4295-2020, 2020a.
Salma, I., Vörösmarty, M., Gyöngyösi, A. Z., Thén, W., and Weidinger, T.: What can we learn about urban air quality with regard to the first outbreak of the COVID-19 pandemic? A case study from central Europe, Atmos. Chem. Phys., 20, 15725–15742, https://doi.org/10.5194/acp-20-15725-2020, 2020b.
Salma, I., Varga, P. T., Vasanits, A., and Machon, A.: Secondary organic carbon and its contributions in different atmospheric environments of a continental region and seasons, Atmos. Res., 278, 106360, https://doi.org/10.1016/j.atmosres.2022.106360, 2022.
Shahpoury, P., Zhang, Z. W., Arangio, A., Celo, V., Dabek-Zlotorzynska, E., Harner, T., and Nenes, A.: The influence of chemical composition, aerosol acidity, and metal dissolution on the oxidative potential of fine particulate matter and redox potential of the lung lining fluid, Environ. Int., 148, 106343, https://doi.org/10.1016/j.envint.2020.106343, 2021.
Shahpoury, P., Zhang, Z. W., Filippi, A., Hildmann, S., Lelieveld, S., Mashtakov, B., Patel, B. R., Traub, A., Umbrio, D., Wietzoreck, M., Wilson, J., Berkemeier, T., Celo, V., Dabek-Zlotorzynska, E., Evans, G., Harner, T., Kerman, K., Lammel, G., Noorozifar, M., Pöschl, U., and Tong, H.: Inter-comparison of oxidative potential metrics for airborne particles identifies differences between acellular chemical assays, Atmos. Pollut. Res., 13, 101596, https://doi.org/10.1016/j.apr.2022.101596, 2022.
Srivastava, D., Tomaz, S., Favez, O., Lanzafame, G. M., Golly, B., Besombes, J.-L., Alleman, L. Y., Jaffrezo, J.-L., Jacob, V., Perraudin, E., Villenave, E., and Albinet, A.: Speciation of organic fraction does matter for source apportionment. Part 1: A one-year campaign in Grenoble (France), Sci. Total Environ., 624, 1598–1611, https://doi.org/10.1016/j.scitotenv.2017.12.135, 2018.
Szigeti, T., Óvári, M., Dunster, C., Kelly, F. J., Lucarelli, F., and Záray, G.: Changes in chemical composition and oxidative potential of urban PM(2.5) between 2010 and 2013 in Hungary, Sci. Total Environ., 518–519, 534–544, https://doi.org/10.1016/j.scitotenv.2015.03.025, 2015.
Valavanidis, A., Fiotakis, K., and Vlachogianni, T.: Airborne particulate matter and human health: toxicological assessment and importance of size and composition of particles for oxidative damage and carcinogenic mechanisms, J. Environ. Sci. Heal. C, 26, 339–362, https://doi.org/10.1080/10590500802494538, 2008.
Valavanidis, A., Vlachogianni, T., Fiotakis, K., and Loridas, S.: Pulmonary oxidative stress, inflammation and cancer: respirable particulate matter, fibrous dusts and ozone as major causes of lung carcinogenesis through reactive oxygen species mechanisms, Int. J. Env. Res. Pub. He., 10, 3886–3907, https://doi.org/10.3390/ijerph10093886, 2013.
Varga, G.: Changing nature of Saharan dust deposition in the Carpathian Basin (Central Europe): 40 years of identified North African dust events (1979–2018), Environ. Int., 139, 105712, https://doi.org/10.1016/j.envint.2020.105712, 2020.
Verma, V., Rico-Martinez, R., Kotra, N., King, L., Liu, J., Snell, T. W., and Weber, R. J.: Contribution of water-soluble and insoluble components and their hydrophobic/hydrophilic subfractions to the reactive oxygen species-generating potential of fine ambient aerosols, Environ. Sci. Technol., 46, 11384–11392, https://doi.org/10.1021/es302484r, 2012.
Verma, V., Fang, T., Guo, H., King, L., Bates, J. T., Peltier, R. E., Edgerton, E., Russell, A. G., and Weber, R. J.: Reactive oxygen species associated with water-soluble PM2.5 in the southeastern United States: spatiotemporal trends and source apportionment, Atmos. Chem. Phys., 14, 12915–12930, https://doi.org/10.5194/acp-14-12915-2014, 2014.
Verma, V., Fang, T., Xu, L., Peltier, R. E., Russell, A. G., Ng, N. L., and Weber, R. J.: Organic aerosols associated with the generation of reactive oxygen species (ROS) by water-soluble PM2.5, Environ. Sci. Technol., 49, 4646–4656, https://doi.org/10.1021/es505577w, 2015.
Visentin, M., Pagnoni, A., Sarti, E., and Pietrogrande, M. C.: Urban PM2.5 oxidative potential: Importance of chemical species and comparison of two spectrophotometric cell-free assays, Environ. Pollut., 219, 72–79, https://doi.org/10.1016/j.envpol.2016.09.047, 2016.
Weber, S., Uzu, G., Calas, A., Chevrier, F., Besombes, J.-L., Charron, A., Salameh, D., Ježek, I., Močnik, G., and Jaffrezo, J.-L.: An apportionment method for the oxidative potential of atmospheric particulate matter sources: application to a one-year study in Chamonix, France, Atmos. Chem. Phys., 18, 9617–9629, https://doi.org/10.5194/acp-18-9617-2018, 2018.
Weber, S., Uzu, G., Favez, O., Borlaza, L. J. S., Calas, A., Salameh, D., Chevrier, F., Allard, J., Besombes, J.-L., Albinet, A., Pontet, S., Mesbah, B., Gille, G., Zhang, S., Pallares, C., Leoz-Garziandia, E., and Jaffrezo, J.-L.: Source apportionment of atmospheric PM10 oxidative potential: synthesis of 15 year-round urban datasets in France, Atmos. Chem. Phys., 21, 11353–11378, https://doi.org/10.5194/acp-21-11353-2021, 2021.
Weichenthal, S., Shekarrizfard, M., Traub, A., Kulka, R., Al-Rijleh, K., Anowar, S., Evans, G., and Hatzopoulou, M.: Within-city spatial variations in multiple measures of PM2.5 oxidative potential in Toronto, Canada, Environ. Sci. Technol., 53, 2799–2810, https://doi.org/10.1021/acs.est.8b05543, 2019.
Wong, J. P. S., Tsagkaraki, M., Tsiodra, I., Mihalopoulos, N., Violaki, K., Kanakidou, M., Sciare, J., Nenes, A., and Weber, R. J.: Effects of atmospheric processing on the oxidative potential of biomass burning organic aerosols, Environ. Sci. Technol., 53, 6747–6756, https://doi.org/10.1021/acs.est.9b01034, 2019.
Yang, A., Hellack, B., Leseman, D., Brunekreef, B., Kuhlbusch, T. A., Cassee, F. R., Hoek, G., and Janssen, N. A.: Temporal and spatial variation of the metal-related oxidative potential of PM2.5 and its relation to PM2.5 mass and elemental composition, Atmos. Environ., 102, 62–69, https://doi.org/10.1016/j.atmosenv.2014.11.053, 2015.
Yu, S., Liu, W., Xu, Y., Yi, K., Zhou, M., Tao, S., and Liu, W.: Characteristics and oxidative potential of atmospheric PM2.5 in Beijing: Source apportionment and seasonal variation, Sci. Total Environ., 650, 277–287, https://doi.org/10.1016/j.scitotenv.2018.09.021, 2019.
Yue, Y., Chen, H., Setyan, A., Elser, M., Dietrich, M., Li, J., Zhang, T., Zhang, X., Zheng, Y., Wang, J., and Yao, M.: Size-resolved endotoxin and oxidative potential of ambient particles in Beijing and Zürich, Environ. Sci. Technol., 52, 6816–6824, https://doi.org/10.1021/acs.est.8b01167, 2018.
Zhang, Z.-H., Hartner, E., Utinger, B., Gfeller, B., Paul, A., Sklorz, M., Czech, H., Yang, B. X., Su, X. Y., Jakobi, G., Orasche, J., Schnelle-Kreis, J., Jeong, S., Gröger, T., Pardo, M., Hohaus, T., Adam, T., Kiendler-Scharr, A., Rudich, Y., Zimmermann, R., and Kalberer, M.: Are reactive oxygen species (ROS) a suitable metric to predict toxicity of carbonaceous aerosol particles?, Atmos. Chem. Phys., 22, 1793–1809, https://doi.org/10.5194/acp-22-1793-2022, 2022.