the Creative Commons Attribution 4.0 License.
the Creative Commons Attribution 4.0 License.
 | 14 Nov 2023
Wildfire smoke triggers cirrus formation: lidar observations over the eastern Mediterranean
Rodanthi-Elisavet Mamouri
Kevin Ohneiser
Daniel A. Knopf
Argyro Nisantzi
Johannes Bühl
Ronny Engelmann
Annett Skupin
Patric Seifert
Holger Baars
Dragos Ene
Ulla Wandinger
Diofantos Hadjimitsis
The number of intense wildfires may increase further in upcoming years as a consequence of climate change. It is therefore necessary to improve our knowledge about the role of smoke in the climate system, with emphasis on the impact of smoke particles on the evolution of clouds, precipitation, and cloud radiative properties. Presently, one key aspect of research is whether or not wildfire smoke particles can initiate cirrus formation. In this study, we present lidar observations over Limassol, Cyprus, from 27 October to 3 November 2020, when extended wildfire smoke fields crossed the Mediterranean Basin from Portugal to Cyprus. We found strong evidence that aged smoke (organic aerosol particles) originating from wildfires in North America triggered significant ice nucleation at temperatures from −47 to −53 ∘C and caused the formation of extended cirrus layers. The observations suggest that the ice crystals were nucleated just below the tropopause in the presence of smoke particles serving as ice-nucleating particles (INPs). The main part of the 2–3 km thick smoke layer was, however, in the lower stratosphere just above the tropopause. With actual radiosonde observations of temperature and relative humidity and lidar-derived smoke particle surface area concentrations used as starting values, gravity wave simulations show that the lofting of air by 100–200 m is sufficient to initiate significant ice nucleation on the smoke particles, leading to ice crystal number concentrations of 1–100 L−1.
- Article
(11992 KB) - Full-text XML
- BibTeX
- EndNote


Record-breaking wildfires in western Canada (2017), southeastern Australia (2019–2020), and central Siberia (2019) caused strong perturbations of the aerosol conditions in the upper troposphere and lower stratosphere (UTLS) (Baars et al., 2019; Kloss et al., 2019; Ohneiser et al., 2021, 2022; Rieger et al., 2021). Smoke was lofted by pyrocumulonimbus (pyroCb) convection (Peterson et al., 2018, 2021) or self-lofting processes (Ohneiser et al., 2021, 2023) into the UTLS height range and transported around the globe, polluting large parts of the Northern and Southern hemispheres from the subtropics to the poles over months. Recent studies suggest that major fire-related hemispheric perturbations may become more frequent in the future in a changing global climate with more hot and dry weather periods (Jolly et al., 2015; Abatzoglou et al., 2019; Kirchmeier-Young et al., 2019). Besides extraordinarily intense fire storms, numerous small to moderate wildfires and biomass burning events all over the world serve as a persistent source of smoke particles in the free troposphere (Mattis et al., 2008; Dahlkötter et al., 2014; Burton et al., 2015; Vaughan et al., 2018; Foth et al., 2019; Floutsi et al., 2021; Veselovskii et al., 2022). Based on airborne pole-to-pole in situ aerosol observations during the Atmospheric Tomography (ATom) mission, Schill et al. (2020) found that biomass burning particles are diluted but ubiquitous, accounting for one-quarter of the accumulation-mode number in the remote free troposphere up to tropopause heights.
To be able to adequately consider fresh and aged wildfire smoke in global chemistry and climate models (Hodzic et al., 2020), the role of smoke particles in the atmospheric system needs to be explored in more detail by means of satellite remote sensing, field observations (in situ, remote sensing), laboratory experiments, and cloud-resolving atmospheric modeling on regional to global scales. An open question is to what extent wildfire smoke particles are able to serve as ice-nucleating particles (INPs) in heterogeneous ice formation processes, thus influencing the occurrence frequency and development of mixed-phase and cirrus clouds and, in this way, the hydrological cycle and radiative transfer in the atmosphere. The few available observations so far show that wildfire smoke particles seem to be inefficient INPs in mixed-phase cloud processes with temperatures of > −35 ∘C (see, e.g., Barry et al., 2021). Similarly, Froyd et al. (2010) found no indication that wildfire smoke particles influence cirrus formation.
In this article, we show the opposite. We found clear evidence for an impact of aged wildfire smoke on cirrus formation in lidar observations over the eastern Mediterranean in October–November 2020. The smoke originated from record-breaking Californian wildfires (Safford et al., 2022). Almost 10 000 fires burned more than 4 % of California's roughly 425000 km−2 of land in 2020. The 2020 fire period was the largest and strongest recorded fire season in the history of California. Lofted layers of aged smoke from these fires were observed over the North Pole (Ansmann et al., 2023), central Europe (Baars et al., 2021; Hu et al., 2022), and over the Mediterranean Basin (Michailidis et al., 2023) from September to November 2020. Continuous ice nucleation just below the tropopause at temperatures from −46 to −52 ∘C was monitored at Limassol, Cyprus, in smoke-burdened air from 27 October to 3 November 2020. It should be emphasized here that aerosol–cirrus interaction events like that presented in this article probably remain undetected if a continuously running lidar is not available. Only lidar (comparable with a running camera) allows us to monitor aerosol conditions and cirrus evolution at the same time with the required high temporal and vertical resolution. The Limassol observations corroborate our opinion.
This was not the first time that we found a strong link between smoke occurrence and cirrus formation. During the MOSAiC (Multidisciplinary drifting Observatory for the Study of Arctic Climate) expedition (Engelmann et al., 2021; Ohneiser et al., 2021; Ansmann et al., 2023), we detected Siberian smoke in the UTLS height range for more than 7 months (October 2019 to May 2020). Numerous cirrus fields developed via heterogeneous ice nucleation on the smoke particles over the high Arctic (85–88∘ N), as the combined lidar–radar data analysis revealed. Furthermore, the preliminary analysis of our smoke observations at Punta Arenas, in southern Chile, also point to a strong impact of wildfire smoke on cirrus formation in January–April 2020. The smoke over the southernmost tip of South America originated from the record-breaking Australian bushfires around New Year 2020 (Ohneiser et al., 2020, 2022).
The impact of biomass burning aerosol on ice nucleation is complex, and this fact makes the implementation of a smoke parameterization in cloud-resolving simulation models rather difficult. Ansmann et al. (2021) and Hu et al. (2022) provide brief overviews of smoke properties and smoke aging processes during long-range transport with a focus on aged free tropospheric and UTLS smoke layers observable with lidar. It seems that aged smoke particles in the UTLS height range typically show a compact core–shell structure with a black-carbon-containing core and an organic-material-rich shell (Dahlkötter et al., 2014). With increasing compactness of the smoke particles (i.e., the closer they are to a spherical shape), the linear depolarization ratio, measured with lidar, decreases with time – sometimes within hours to days; sometimes rather slowly, over weeks to months (Baars et al., 2019; Ohneiser et al., 2022).
Smoke particles can occur as glassy, semi-solid, and liquid aerosol particles. As a consequence of the complex chemical and morphological properties, the development of smoke INP parameterization schemes is a crucial task (Knopf et al., 2018; Knopf and Alpert, 2023). The ability to serve as an INP mainly depends on the material in the particle's shell (Charnawskas et al., 2017). Several studies indicate that aged smoke particles from forest fires contain only 2 %–3 % black carbon (BC) (Dahlkötter et al., 2014; Mardi et al., 2018; Yu et al., 2019; Torres et al., 2020; Ohneiser et al., 2023), so the organic substances (organic carbon, OC) are responsible for the ice nucleation activity. Biomass burning particles also contain humic-like substances (HULIS), which are large macromolecules that may serve as INPs at low temperatures of −50 to −70 ∘C (Wang and Knopf, 2011; Knopf et al., 2018). If the particles are in a glassy state, they can serve as deposition ice nucleation (DIN) particles (Zobrist et al., 2008; Murray et al., 2010; Wang et al., 2012a; Berkemeier et al., 2014; Knopf et al., 2018). DIN is defined as ice formation occurring on an INP surface by water vapor deposition from the supersaturated gas phase. DIN could be the result of pore condensation freezing (Marcolli, 2014; Knopf and Alpert, 2023). When the smoke particles take up supercooled water and their shell deliquesces, immersion freezing can proceed, with the remaining solid part of the particle (immersed in the liquid shell) serving as an INP. If the smoke particles completely dissolve and become liquid (and no insoluble material within the particles is left), homogeneous freezing of the resulting aqueous solutions will take place at temperatures below −38 ∘C (Knopf and Alpert, 2023).
Besides the emission of gases and smoke particles, bottom ash and soil dust is injected into the atmosphere during fires (Nisantzi et al., 2014; Wagner et al., 2018) and may reach the upper troposphere. Dust and ash particles are known to be efficient INPs at cirrus temperatures (Seifert et al., 2010, 2011; DeMott et al., 2015; Kilchhofer et al., 2021; Froyd et al., 2022). Based on laboratory studies, Jahn et al. (2020) also show that the combustion process transforms inorganic elements that are naturally present in the biomass into potentially ice-active minerals in both the bottom ash and emitted aerosol particles. These particles possess ice-nucleation activities high enough to be relevant to mixed-phase clouds, and they are active over a wide temperature range, nucleating ice at up to −13 ∘C. Jahn et al. (2020) and Jahl et al. (2021) hypothesized that these mineral components are mainly responsible for the ice nucleation efficiency of wildfire smoke particles. We will include these aspects in the discussion of our observations in Sect. 4. We begin with information about the lidar station at Limassol and the lidar data analysis in Sects. 2 and 3. The observations are presented and discussed in Sect. 4.
2.1 Cyprus Atmospheric Remote Sensing Observatory (CARO)
A multiwavelength polarization Raman lidar, Polly (POrtabLe Lidar sYstem) (Engelmann et al., 2016), was used to monitor smoke layers and cirrus clouds. It is operated at the Cyprus Atmospheric Remote Sensing Observatory (CARO) of the Eratosthenes Centre of Excellence at Limassol (34.677∘ N, 33.0375∘ E, 2.8 m above sea level, a.s.l.). A sunphotometer has also been operated at Limassol since 2010 in the framework of AERONET (Aerosol Robotic Network, CUT-TEPAK station) (Holben et al., 1998; AERONET, 2023). One of the main research topics is the vertically resolved characterization of aerosols and the interaction between aerosols, clouds, precipitation, and the atmospheric dynamics in the highly polluted eastern Mediterranean, where complex mixtures of desert and agricultural dust, biogenic particle components, and anthropogenic haze regularly occur (Mamouri et al., 2013, 2016; Nisantzi et al., 2014, 2015; Ansmann et al., 2019a; Radenz et al., 2021). CARO is part of the ACTRIS (Aerosols, Clouds and Trace gases Research InfraStructure) National Facility of the Republic of Cyprus for the remote sensing of aerosols and clouds (ACTRIS, 2023).
2.2 Polly instrument and primary lidar data analysis
The setup and basic technical details of the Polly instrument are given in Engelmann et al. (2016), Hofer et al. (2017), and Jimenez et al. (2020). The diode-pumped laser transmits linearly polarized laser pulses at 355, 532, and 1064 nm with a pulse repetition rate of 100 Hz. All laser beams are tilted to an off-zenith angle of 5∘ to avoid ambiguous values of the measured optical properties of mixed-phase and cirrus clouds caused by specular reflection of falling, horizontally aligned hexagonal plates and columns (Thomas et al., 1990). When pointing to the zenith, specular reflection from, in particular, the surfaces of horizontally oriented ice crystals (acting as mirrors) leads to very low – close to zero – particle linear depolarization because this reflection does not change the laser light polarization. As a consequence, ice depolarization ratios from horizontally oriented ice crystals cannot be distinguished from the low depolarization ratios resulting from backscattering by spherical liquid-water droplets. Thus, to unambiguously identify the ice phase of a cloud layer, off-zenith observations are a basic requirement in cloud lidar research. Randomly oriented ice particles lead to linear depolarization ratios of typically 40 %–50 % (produced by scattering and reflection processes at many non-180∘ scattering and reflection angles within the ice crystals), whereas liquid-water droplets cause values close to 0 % and usually < 20 % in the case of multiple scattering in dense water cloud layers.
A detailed description of the Polly data analysis regarding particle optical properties can be found in Baars et al. (2016), Hofer et al. (2017), Jimenez et al. (2020), and Ohneiser et al. (2020, 2021, 2022). The polarization Raman lidar permits us to measure height profiles of the particle backscatter coefficient β at laser wavelengths of 355, 532, and 1064 nm, the particle extinction coefficient α at 355 and 532 nm, the corresponding lidar ratios , and the volume and particle linear depolarization ratios at 355 and 532 nm. Uncertainties in the lidar products are about 5 %–15 % (particle backscatter coefficient, linear depolarization ratio), and 5 %–30 % (particle extinction coefficient, extinction-to-backscatter ratio).
We will especially make use of the height profiles of the 532 nm particle backscatter coefficients at smoke and cirrus height level. The so-called Klett–Fernald method (Klett, 1981; Fernald, 1984) allows us to determine profiles of the backscatter coefficient from strong elastic-backscatter signal profiles with high vertical and temporal resolution. However, the lidar ratio must be given as input, which may cause large uncertainties (20 %–40 % relative uncertainty). In contrast, the Raman lidar method (Ansmann et al., 1992) does not need critical input parameters and thus is more accurate. However, this method is based on the analysis of height profiles of the ratio of the elastic-backscatter signal to the respective Raman signal. To keep the influence of the enhanced signal-to-noise ratio low, longer vertical smoothing and longer signal averaging times are required when using this method.
2.3 Nicosia radiosonde station
Athalassa Radiosonde Station 17607 (35.14∘ N, 33.39∘ E, 160 m a.s.l.), Nicosia, Cyprus launches two Vaisala RS41-SGP radiosondes daily, at 05:00 and 11:00 UTC. The sonde measures pressure, temperature, relative humidity, horizontal wind velocity, and direction (Nicosia-Athalassa-RS, 2023). The Nicosia radiosonde station is 61.4 km northeast of the Limassol CARO site.
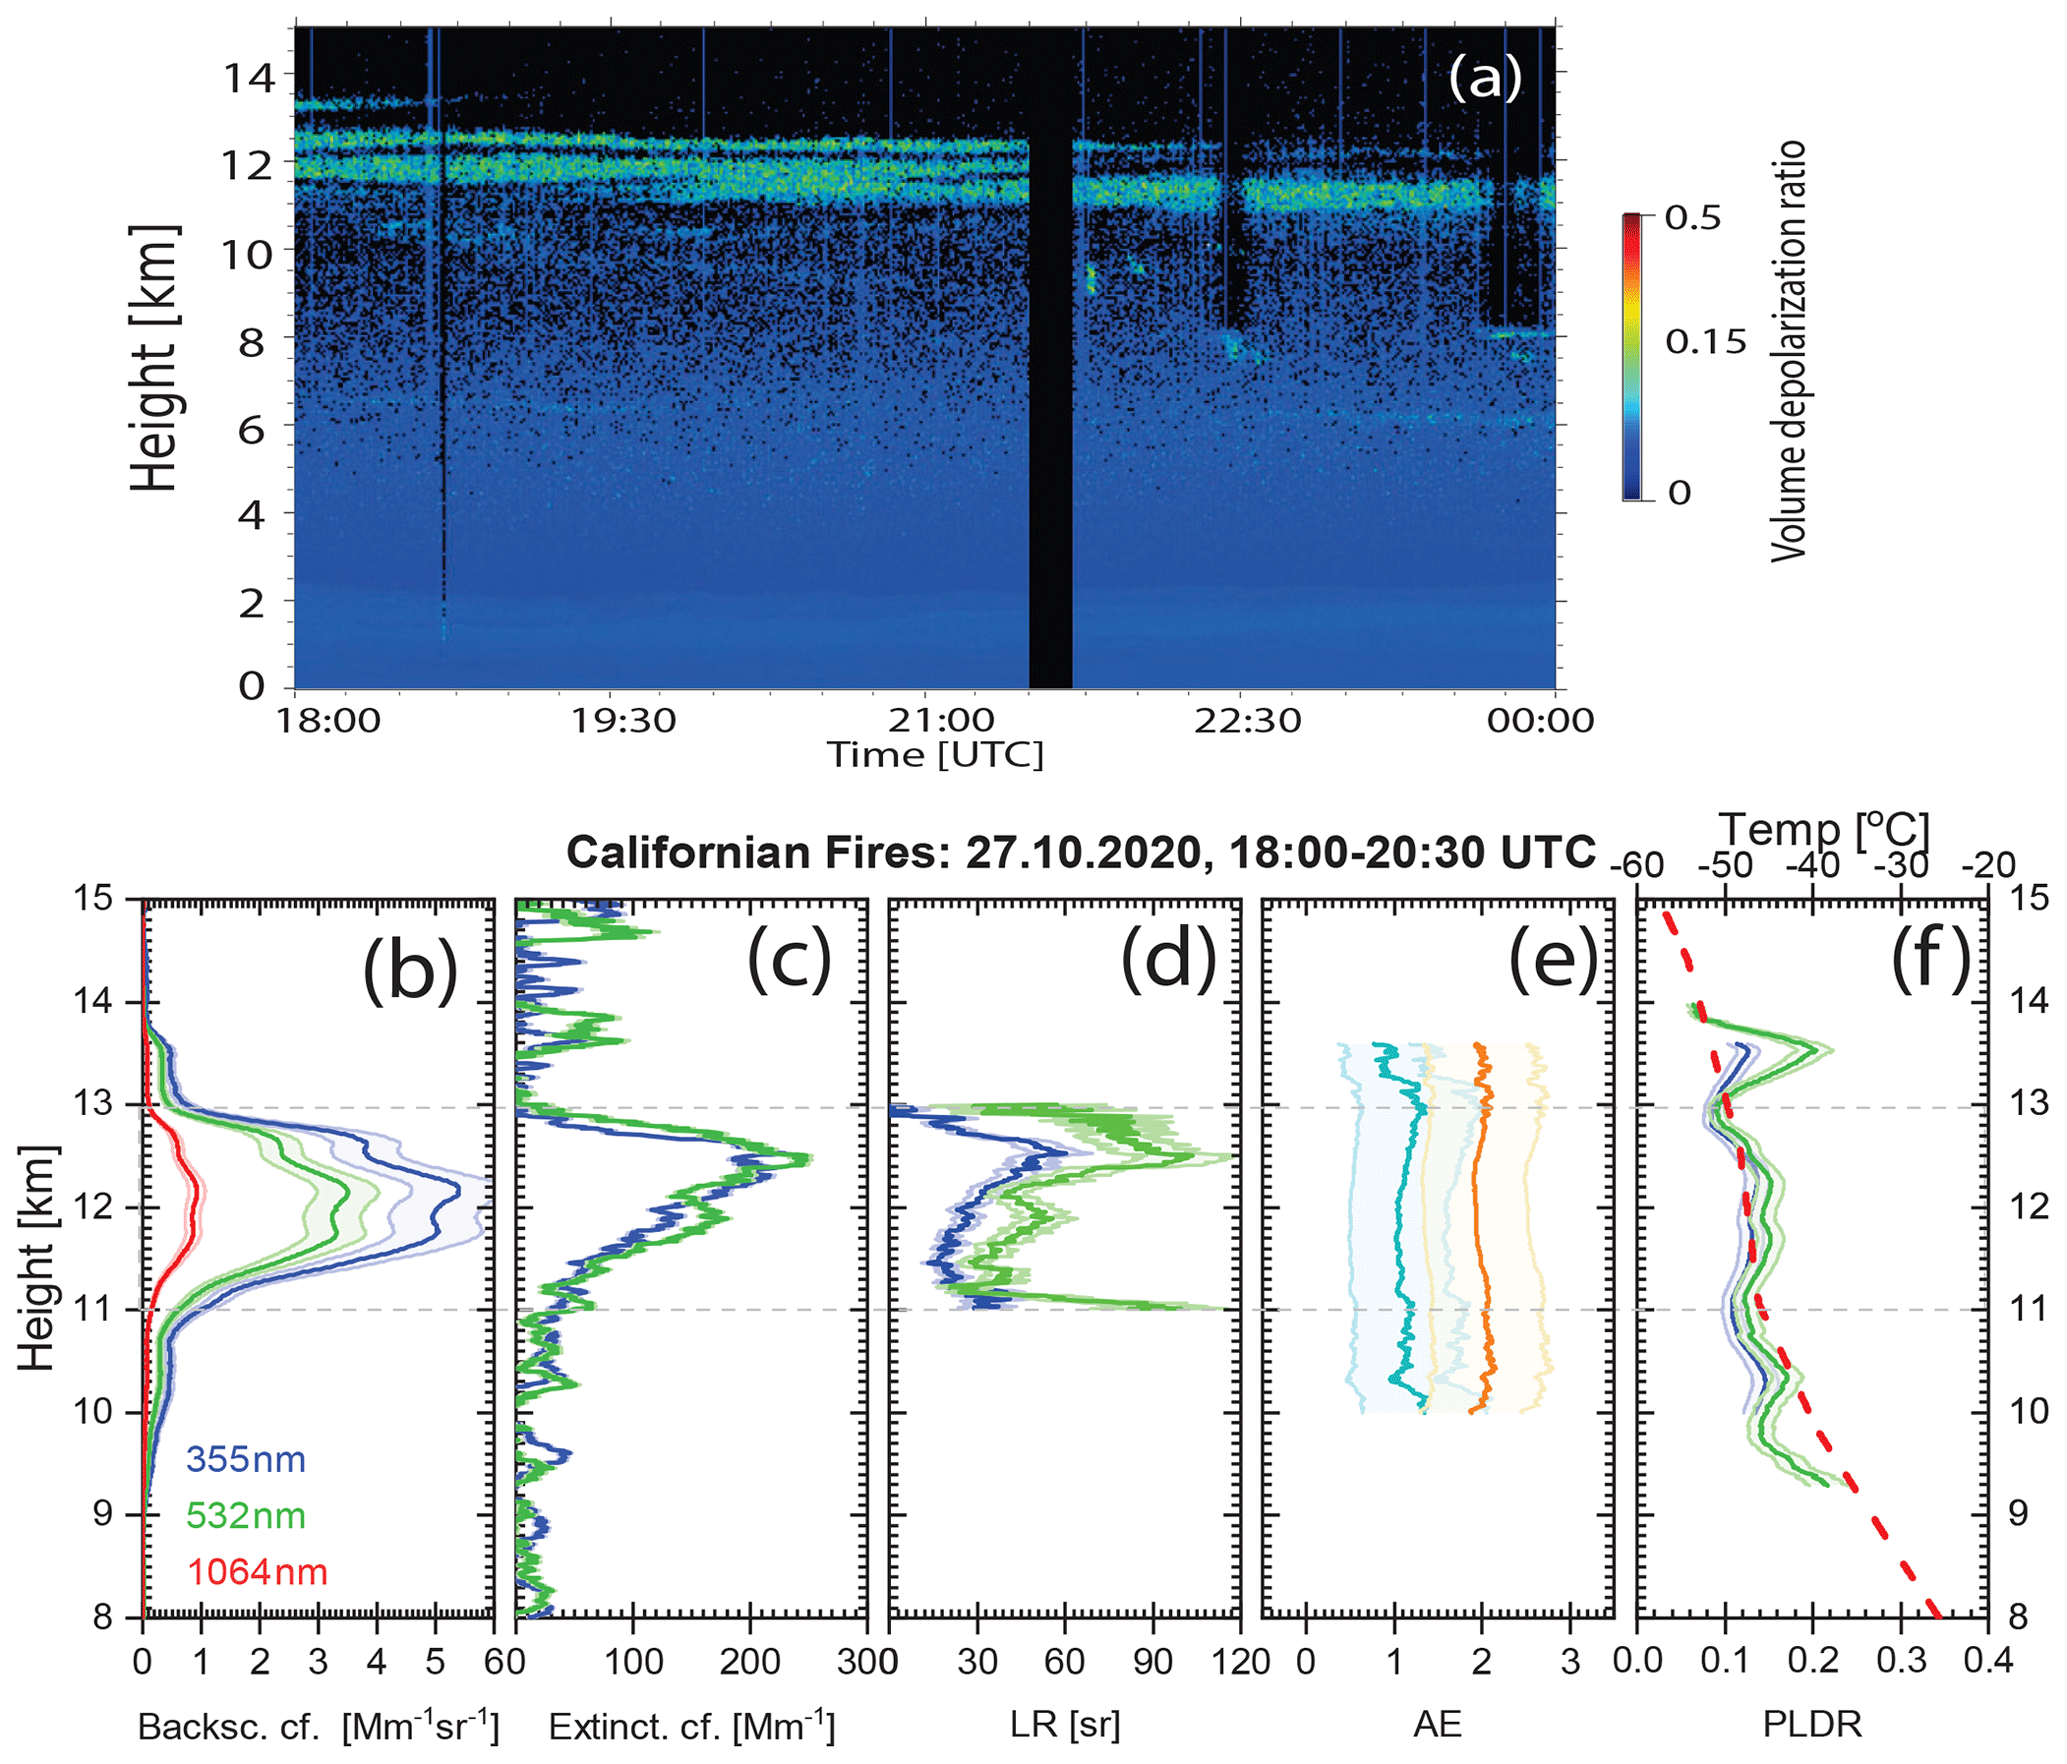
Figure 1(a) Wildfire smoke layer between 11 and 13.5 km height over Limassol, Cyprus, on 27 October 2020; (b) particle backscatter coefficients at 355, 532, and 1064 nm; (c) extinction coefficients and (d) extinction-to-backscatter ratios (lidar ratios, LRs) at 355 and 532 nm; (e) backscatter Ångström exponents (AEs, blue for the 355–532 nm spectrum, orange for the 532–1064 nm spectrum); and (f) particle linear depolarization ratios (PLDRs) at 355 and 532 nm and the temperature profile with the tropopause at 11 km (dashed red line). 2.5 h mean profiles (18:00–20:30 UTC) are shown in (b)–(f). Uncertainty margins have been added. The uncertainties are about 15 % (backscatter), 5 %–30 % (extinction, lidar ratio), 50 % (AE), and 10 % (PLDR). Vertical black columns in (a) indicate periods with no measurements.
The POLIPHON (POlarization LIdar PHOtometer Networking) method (Mamouri and Ansmann, 2016, 2017) enables us to retrieve aerosol-type-dependent microphysical products from the measured height profiles of the particle backscatter coefficient and to estimate cloud-process-relevant properties such as cloud condensation nuclei and INP number concentrations. A detailed view of the potential of POLIPHON regarding dust and wildfire smoke retrievals is given by Ansmann et al. (2019b, 2021).
In this study, we make use of the conversion of the 532 nm backscatter coefficient into the particle surface area concentration s and particle number concentration n250 (number concentration of particles with radii > 250 nm). s is the smoke input parameter in the INP parameterization described in the next section, and n250 indicates the number of particles that could potentially be activated as INPs. In the case of mineral dust, n250 was used as the aerosol input in INP estimations by DeMott et al. (2015).
The following relationships are used to calculate s and n250 (Mamouri and Ansmann, 2016; Ansmann et al., 2021):
with the 532 nm particle backscatter coefficient β(z) at height z and the extinction-to-backscatter or lidar ratio L. For the wildfire smoke episode in October 2020, we measured smoke lidar ratios of around 75 sr, as shown in Sect. 4.1. Lidar ratios of > 70 sr are indicative of strongly light-absorbing smoke particles (Haarig et al., 2018; Ohneiser et al., 2020, 2022). The extinction-to-surface-area conversion factor cs and the extinction-to-number conversion factor c250 for 532 nm are 1.75 Mm µm2 cm−3 and 0.35 Mm cm−3, respectively (Ansmann et al., 2021). Considering an uncertainty of 25 % in the conversion factors and a lidar ratio uncertainty of about 15 %–20 %, we can obtain the microphysical properties with a relative uncertainty of about 30 %.
These conversion factors for aged wildfire smoke are determined at dry aerosol conditions (Ansmann et al., 2021) and thus hold for dry aerosol particles. Since the s and n250 retrievals are based on lidar observations performed during cirrus-free conditions, a potential bias (an overestimation of the dry particle backscatter and thus of s and n250) caused by water uptake by the smoke particles in the upper, usually dry, troposphere is neglected here. The Nicosia radiosonde observations made during our measurement period support this assumption. The relative humidity over water was < 25 % during cirrus-free conditions and less than 60 % during cirrus events when the radiosondes ascended in obviously cirrus-free air. In these conditions, water uptake by smoke particles is of minor importance and the bias in the conversion is < 10 %.
3.1 INP parameterization
The estimation of INP number concentrations is challenging due to the chemical complexity of smoke aerosol (Kanji et al., 2017; Knopf et al., 2018; Jahn et al., 2020). We assume that the ability of aged smoke particles to serve as INPs mainly depends on the organic material of the particles and on the thermodynamic state (glassy, semi-solid, liquid) (Knopf et al., 2018). According to the simulations performed by Berkemeier et al. (2014), glassy states and solid/liquid core–shell morphologies can persist for long enough in typical atmospheric updrafts to allow heterogeneous ice nucleation in the deposition and immersion mode and thereby to dominate in this way over homogeneous ice nucleation. Such competition depends strongly on the ambient temperature and relative humidity as well as the humidification rate and particle size.
In the following, we briefly outline procedures to compute INP concentrations for immersion freezing and deposition ice nucleation. Knopf and Alpert (2013) introduced the water-activity-based immersion freezing model (ABIFM) and presented the respective parameterization for two types of humic compounds based on experimental data (Rigg et al., 2013). We chose to apply the ABIFM for leonardite (a standard humic acid surrogate material) to represent the amorphous organic coating of smoke particles. The ABIFM allows the prediction of the ice particle production rate as a function of ambient air temperature T (freezing temperature) and ice supersaturation SICE (Knopf and Alpert, 2023). In the first step, the so-called water activity criterion is computed (Koop et al., 2000):
where aw is the condensed-phase water activity, which equals the relative humidity RH over water as a decimal (e.g., 0.7 for RH = 70 % humidity), when the particle RH and ambient RH are in equilibrium. aw,i denotes the water activity at the ice melting point for a given aqueous solution and is expressed as the ratio of the ice saturation pressure pi to the water saturation pressure pw as a function of the temperature T in the air parcel in which ice nucleation takes place. RH and temperature values may be available from radiosonde ascents or taken from databases with reanalyzed global atmospheric data. In the next step, the ice crystal nucleation rate coefficient (in cm−2 s−1) is calculated:
The particle parameters b and k are determined from laboratory studies. For leonardite, b is −13.4 and k is 66.9 (Knopf and Alpert, 2013). In the final step, we obtain the number concentration of smoke INPs for the immersion freezing mode,
with the particle surface area concentration s and the time period Δt (in seconds) during which T and SICE are constant. In our gravity wave simulation in Sect. 4.3, the time step is Δt = 10 s (in simulations of waves with periods of 1200–1600 s).
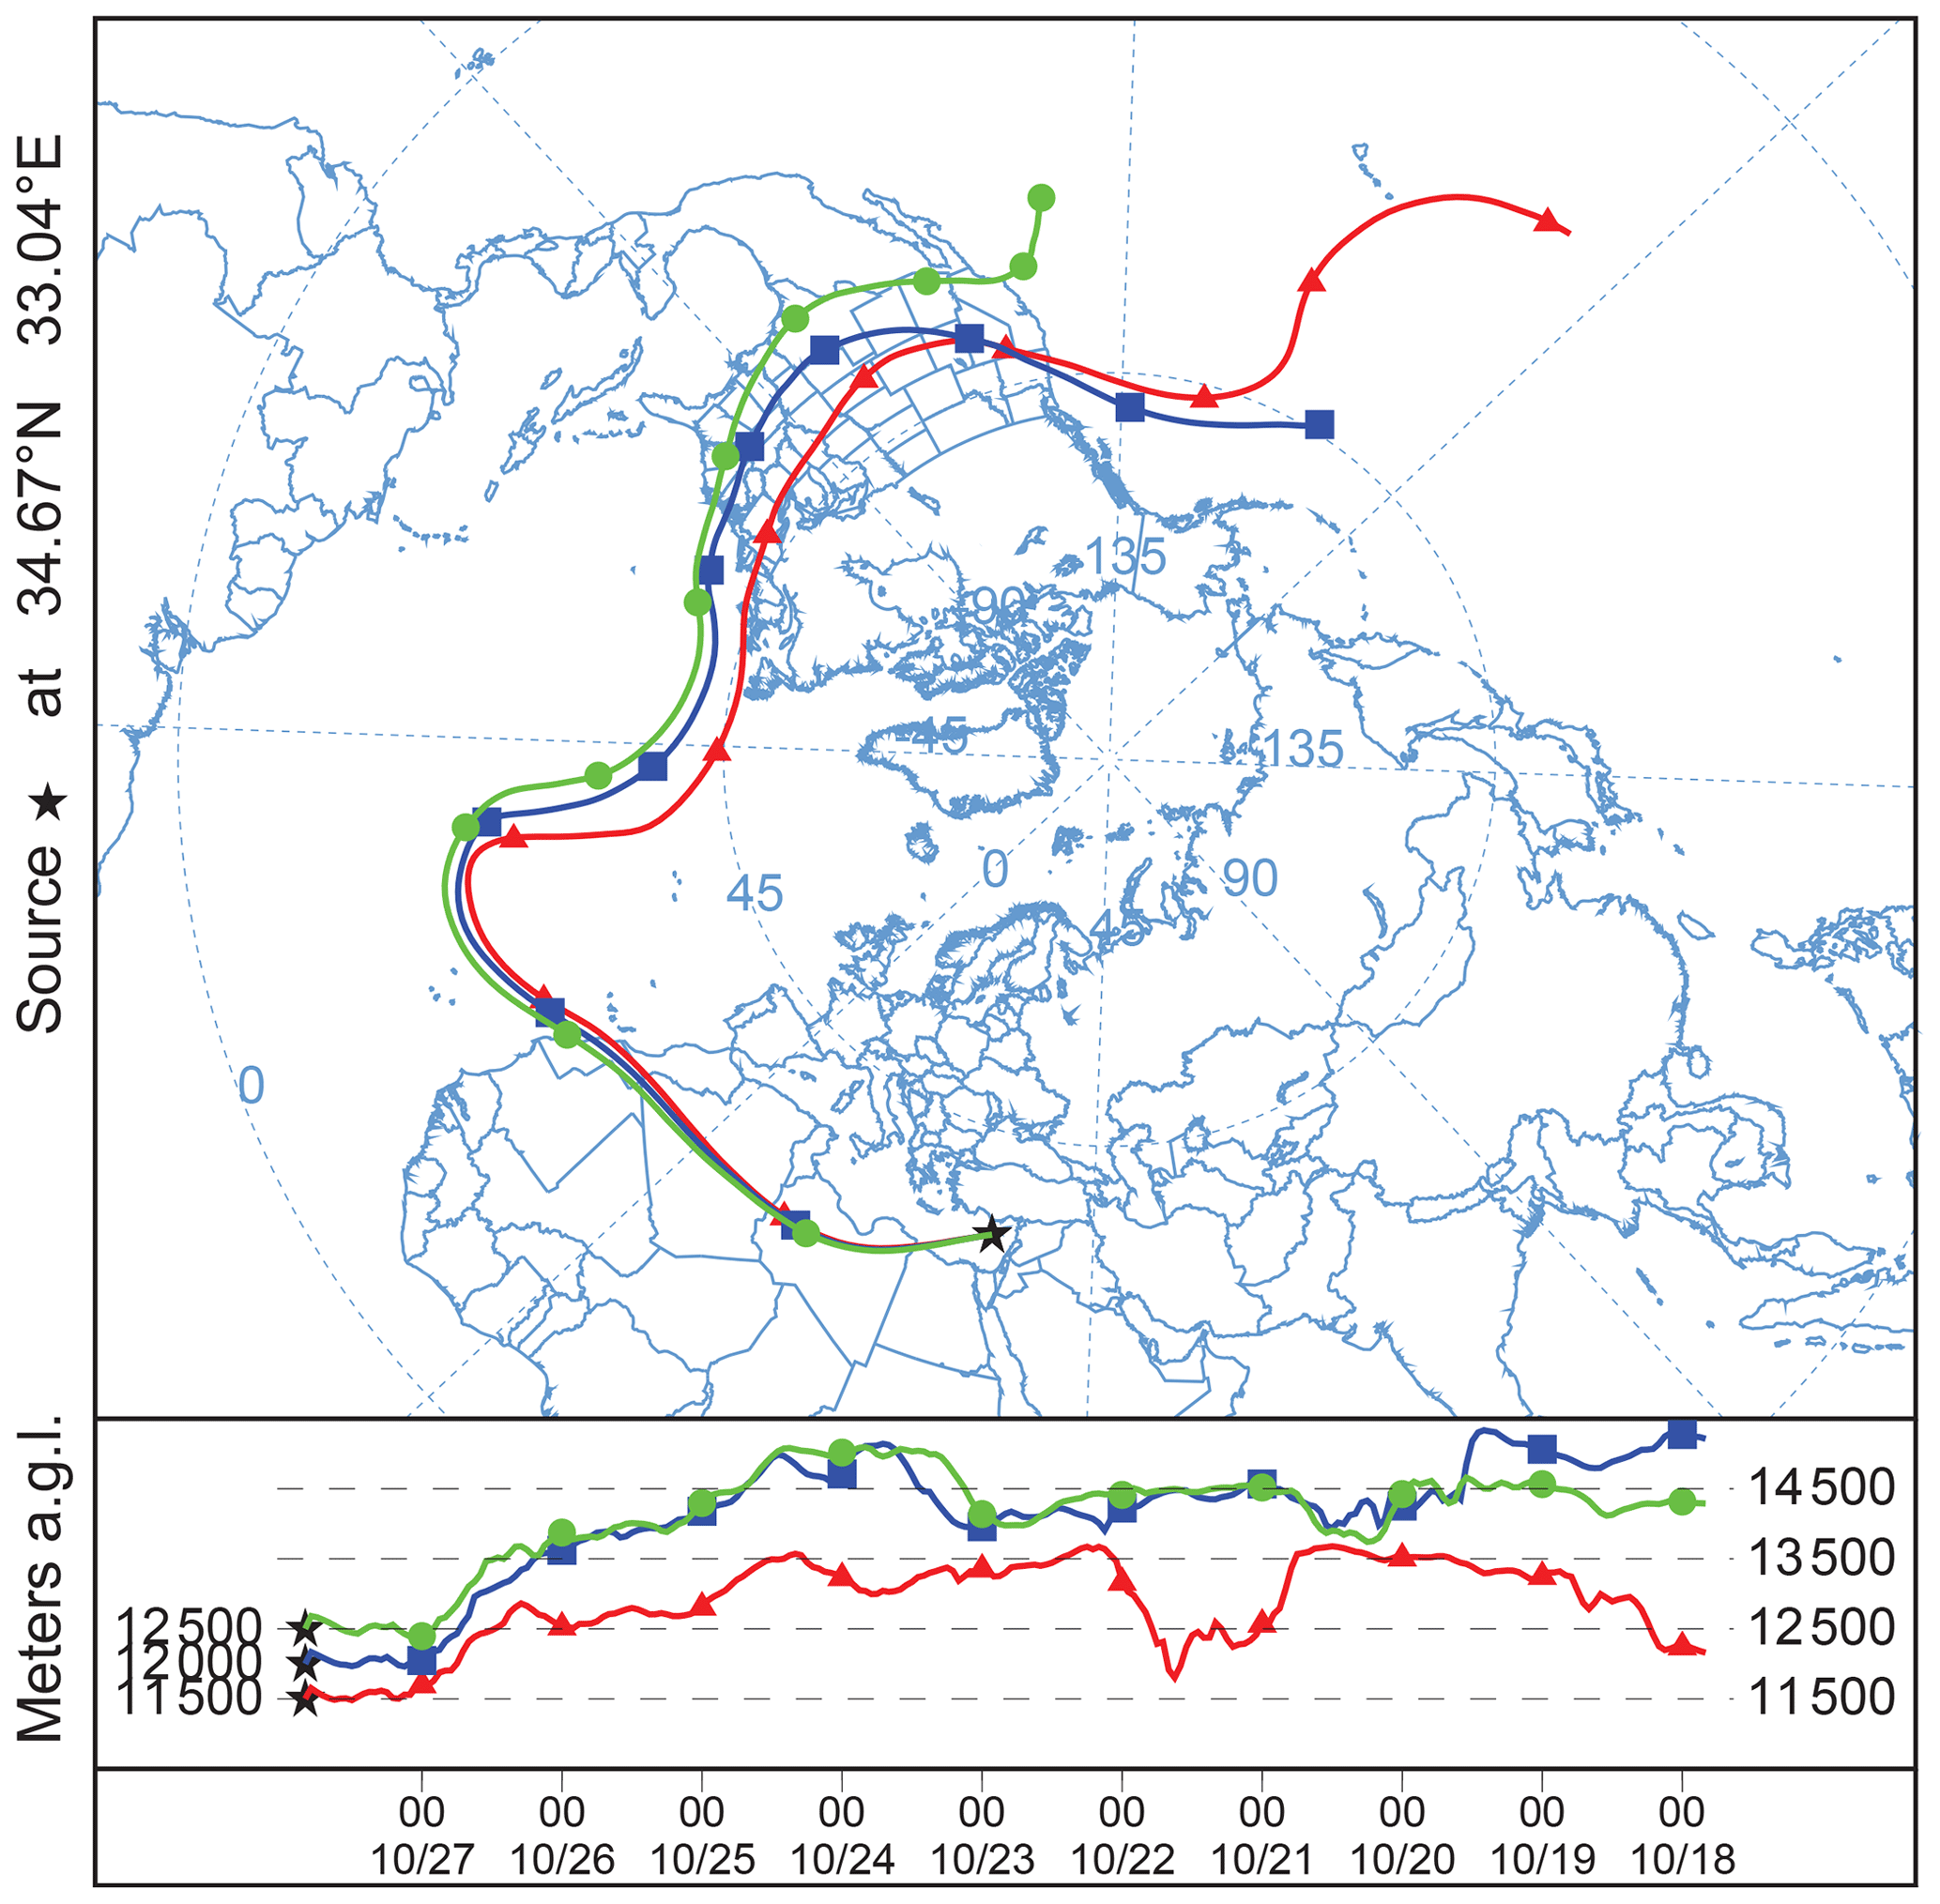
Figure 2HYSPLIT 10 d backward trajectories arriving over Limassol, Cyprus (indicated by a star), on 27 October 2020, 20:00 UTC (HYSPLIT, 2023). Arrival heights are 11 500 m (red), 12 000 m (blue), and 12 500 m (green). The main smoke source region was California. The wildfire smoke was probably lofted by pyroCb convection into the upper troposphere (12–14.5 km height range).
We consider DIN as the main heterogeneous ice nucleation mode at typical cirrus temperatures < 230 K (Murray et al., 2010; Chou et al., 2013; Kilchhofer et al., 2021). Wang and Knopf (2011) and Wang et al. (2012b) provide a simplified parameterization of DIN, based on classical nucleation theory, that describes the DIN efficiency and the ice crystal nucleation rate coefficient as a function of T, SICE, and the ice-nucleation-relevant aerosol composition, e.g., humic and fulvic acid compounds. The procedure (for lidar applications) is outlined in Ansmann et al. (2021). The INP number concentration (or predicted ice crystal number concentration) is given by
The ice nucleation rate coefficient is a function of the contact angle cangle. The selected contact angle is 26.5∘ in the wildfire smoke INP computation (Wang and Knopf, 2011). However, for each species, cangle can vary by about 7–10∘. For the contact angle of 26.5∘, the ice nucleation onset RHICE (the relative humidity over ice) is around 140 %.
The uncertainties in the computed INP number concentrations are large (1–2 orders of magnitude). In view of these large uncertainties, it is necessary to perform closure studies, as presented by Ansmann et al. (2019a) and Marinou et al. (2019), in the analysis of field observations. By combining observations, parameterization results, and simulations, the uncertainties in the individual results and in the overall product data set can be significantly reduced.
4.1 Smoke identification and optical characterization
Figure 1 contains a smoke measurement obtained with the Polly instrument in Cyprus on 27 October 2020 (PollyNET, 2023). From 21 October to 3 November 2020, extended North American wildfire smoke layers crossed the Mediterranean Basin from Portugal to Cyprus at between 6 and 14 km height (Michailidis et al., 2023). Lidar measurements at Evora, Portugal, and Potenza, Italy, documented this event on 24 and 26 October 2020, respectively. The smoke originated from large wildfires in California, USA, and traveled for 8 days before reaching Europe. Weak aerosol structures are visible at 6–11 km height in Fig. 1, and pronounced layers were detected at 11–14 km height. In Fig. 2, backward trajectories confirm the 8–9 d long-range transport of smoke from the western United States to the eastern Mediterranean.
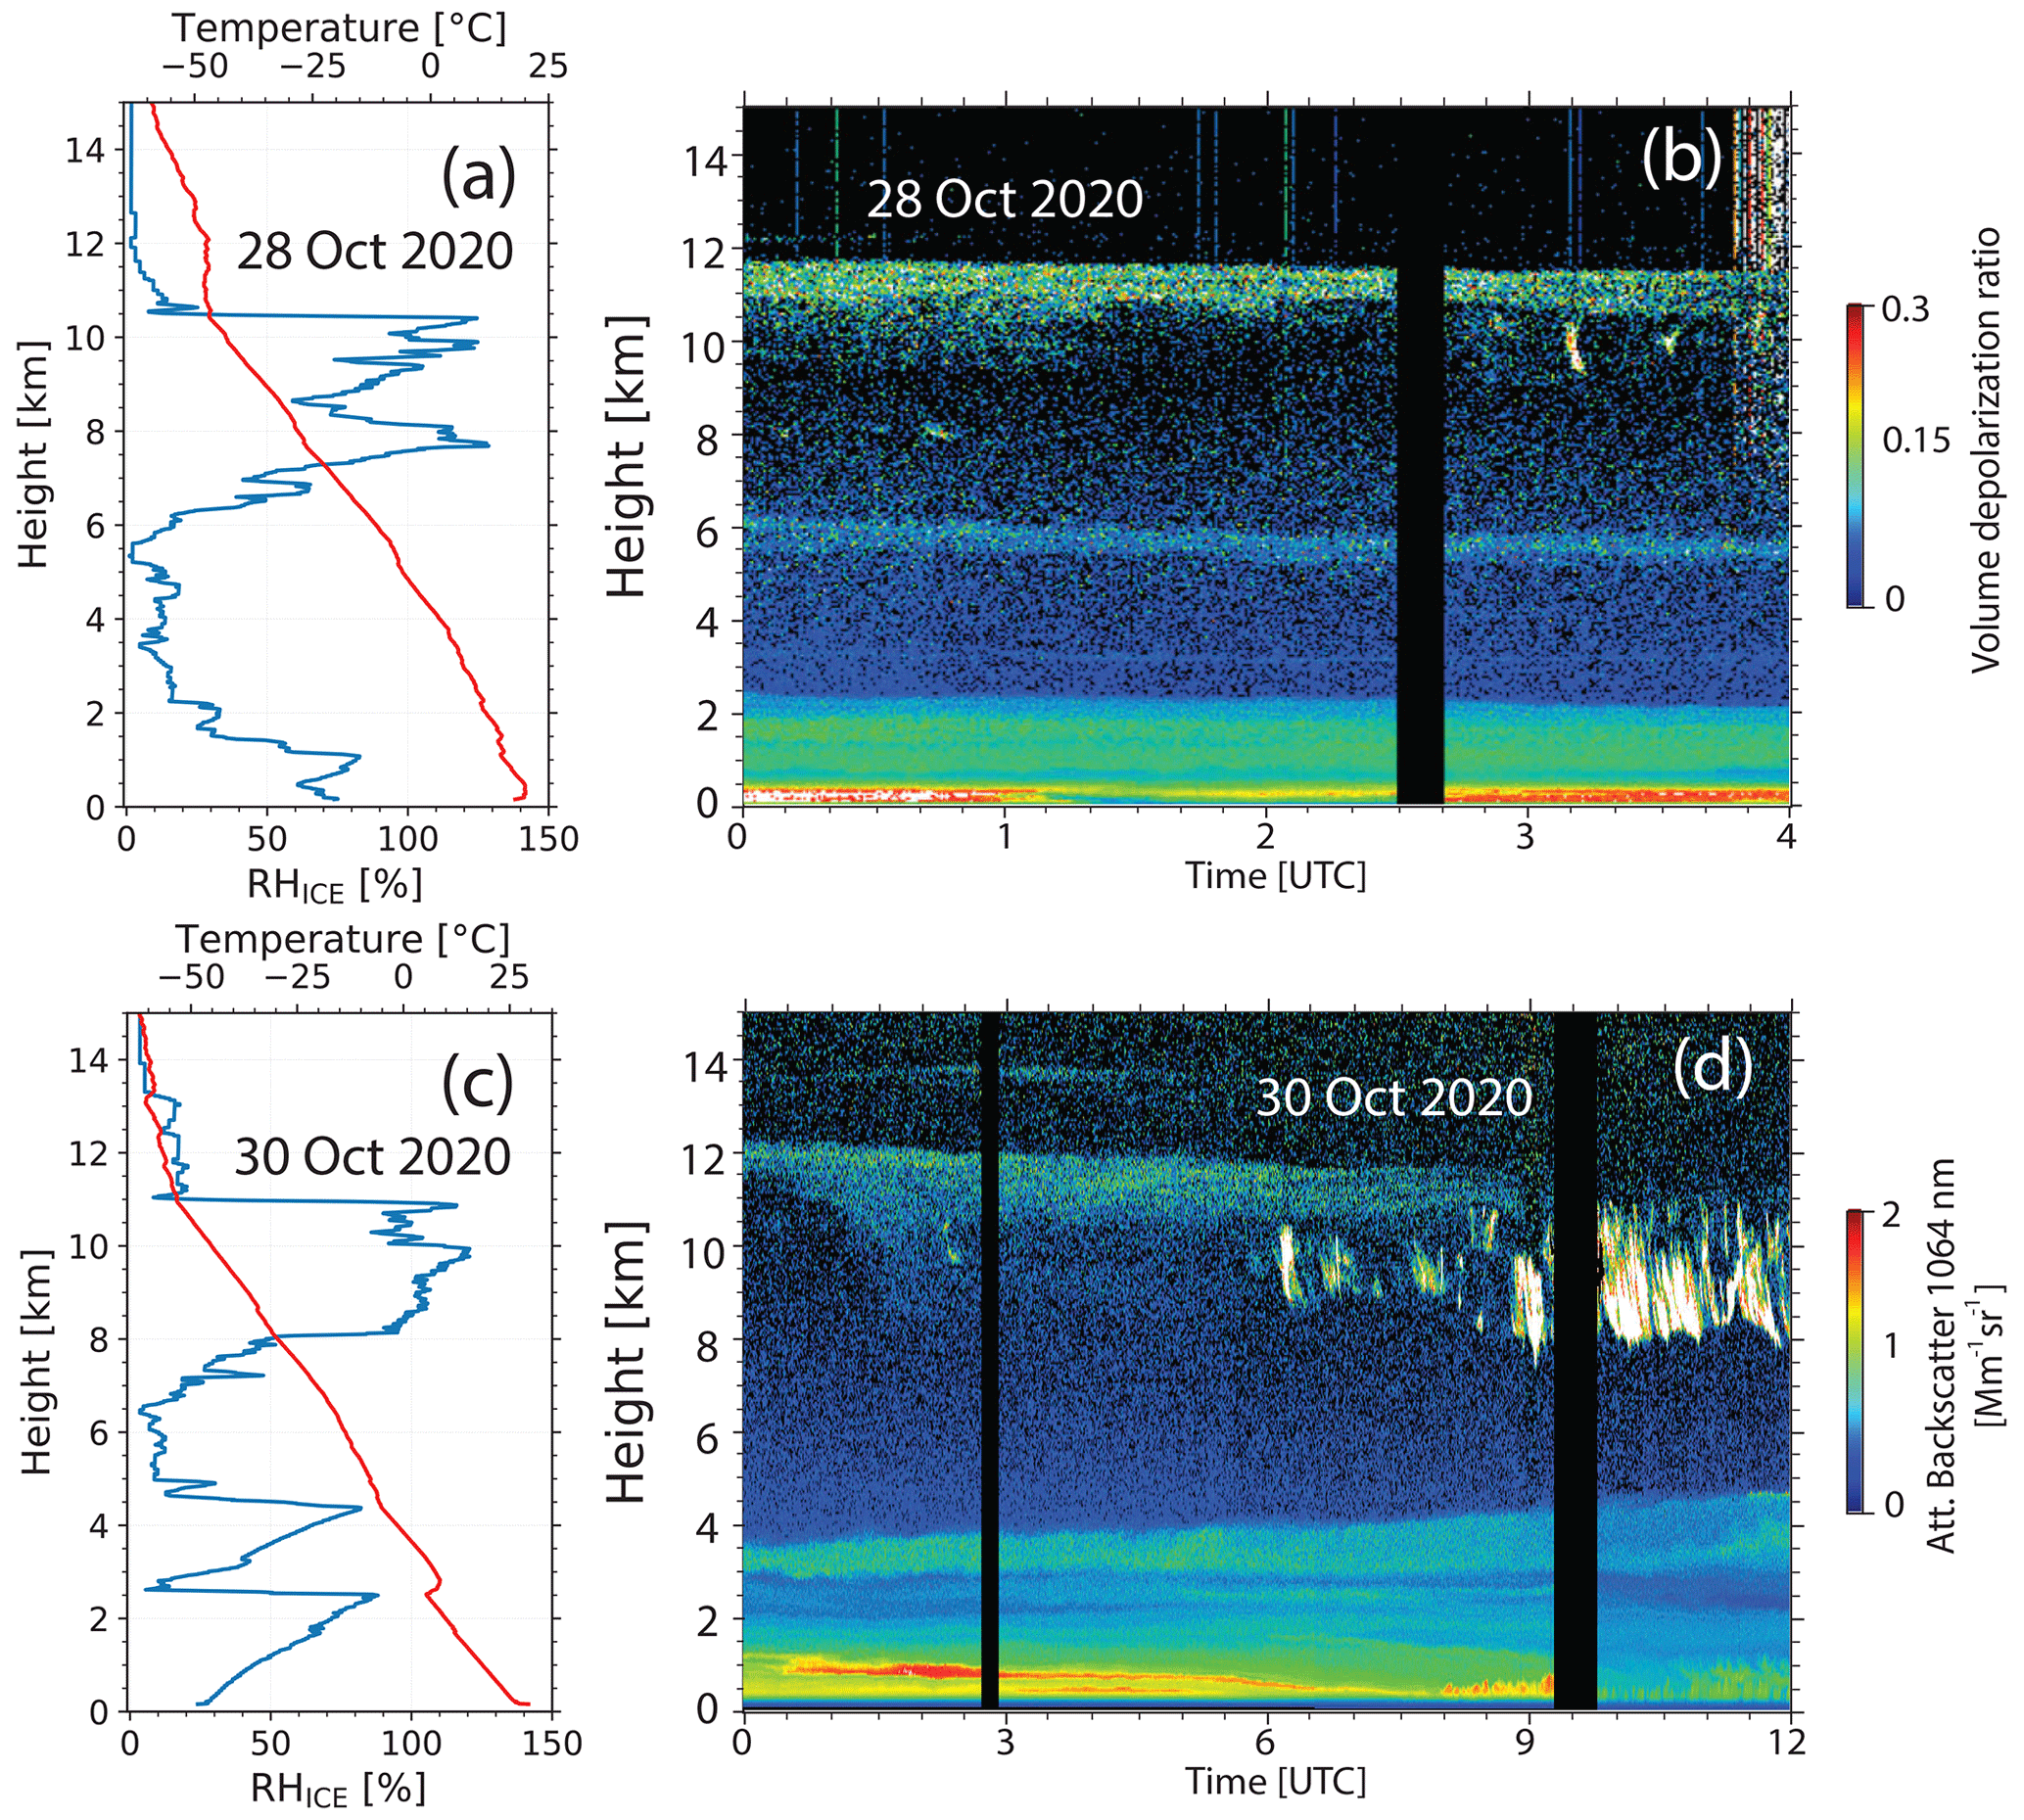
Figure 3Formation of cirrus (white virga-like structures in panels (a) and (b)) in the lower part of an aged wildfire smoke layer (at 10–12.5 km height) on 28 October 2020 (a, b) and 30 October 2020 (c, d). In (a) and (c), radiosonde profiles of temperature (red) and relative humidity over ice (RHICE, blue) are shown (the radiosondes were launched at (a) 05:00 UTC and (c) 11:00 UTC). The sharp drop in the RHICE profile at 10.5 km (a) and 11 km (c) indicates the tropopause. The time–height displays of the volume depolarization ratio (in (b)) and the range-corrected 1064 nm backscatter signal (in (d), equivalent to the 1064 nm attenuated backscatter coefficient) show smoke layers at 10–12 km and around 6 km height in (b) and at 10–12.5 km and 14 km height in (d). Ice nucleation was most probably initiated at the top of the humid layer (close to the tropopause) at −47 to −53 ∘C. Vertical black columns (in (b) and (d), 0–15 km) indicate periods with no measurements.
The strong wavelength dependence of the backscatter coefficient, the high backscatter Ångström exponents of 1–2, and the weak wavelength dependence of the extinction coefficient are typical for aged, strongly light-absorbing wildfire smoke particles. In the optically thickest part with the highest particle extinction coefficients at 12–13 km height, the lidar ratio was about 70–90 sr at 532 nm and 50–60 sr at 355 nm. This inverse spectral dependence of the lidar ratio is characteristic of aged wildfire smoke (Haarig et al., 2018; Ohneiser et al., 2020, 2021). The main smoke layer was above the tropopause.
As mentioned in the “Introduction”, bottom ash and soil dust may be components of the wildfire aerosol mixtures and thus may reach the upper troposphere as well. Dust and ash particles are known to be efficient INPs at cirrus temperatures (Seifert et al., 2010, 2011; DeMott et al., 2015; Kilchhofer et al., 2021; Froyd et al., 2022). However, the observed spectral dependence of the particle backscatter coefficient in Fig. 1b is typical for aged wildfire smoke particles. These particles form a pronounced accumulation mode (Haarig et al., 2018; Ansmann et al., 2021). In particular, the strong decrease in the backscatter coefficient from 532 to 1064 nm indicates that coarse-mode dust and ash particles were most probably absent.
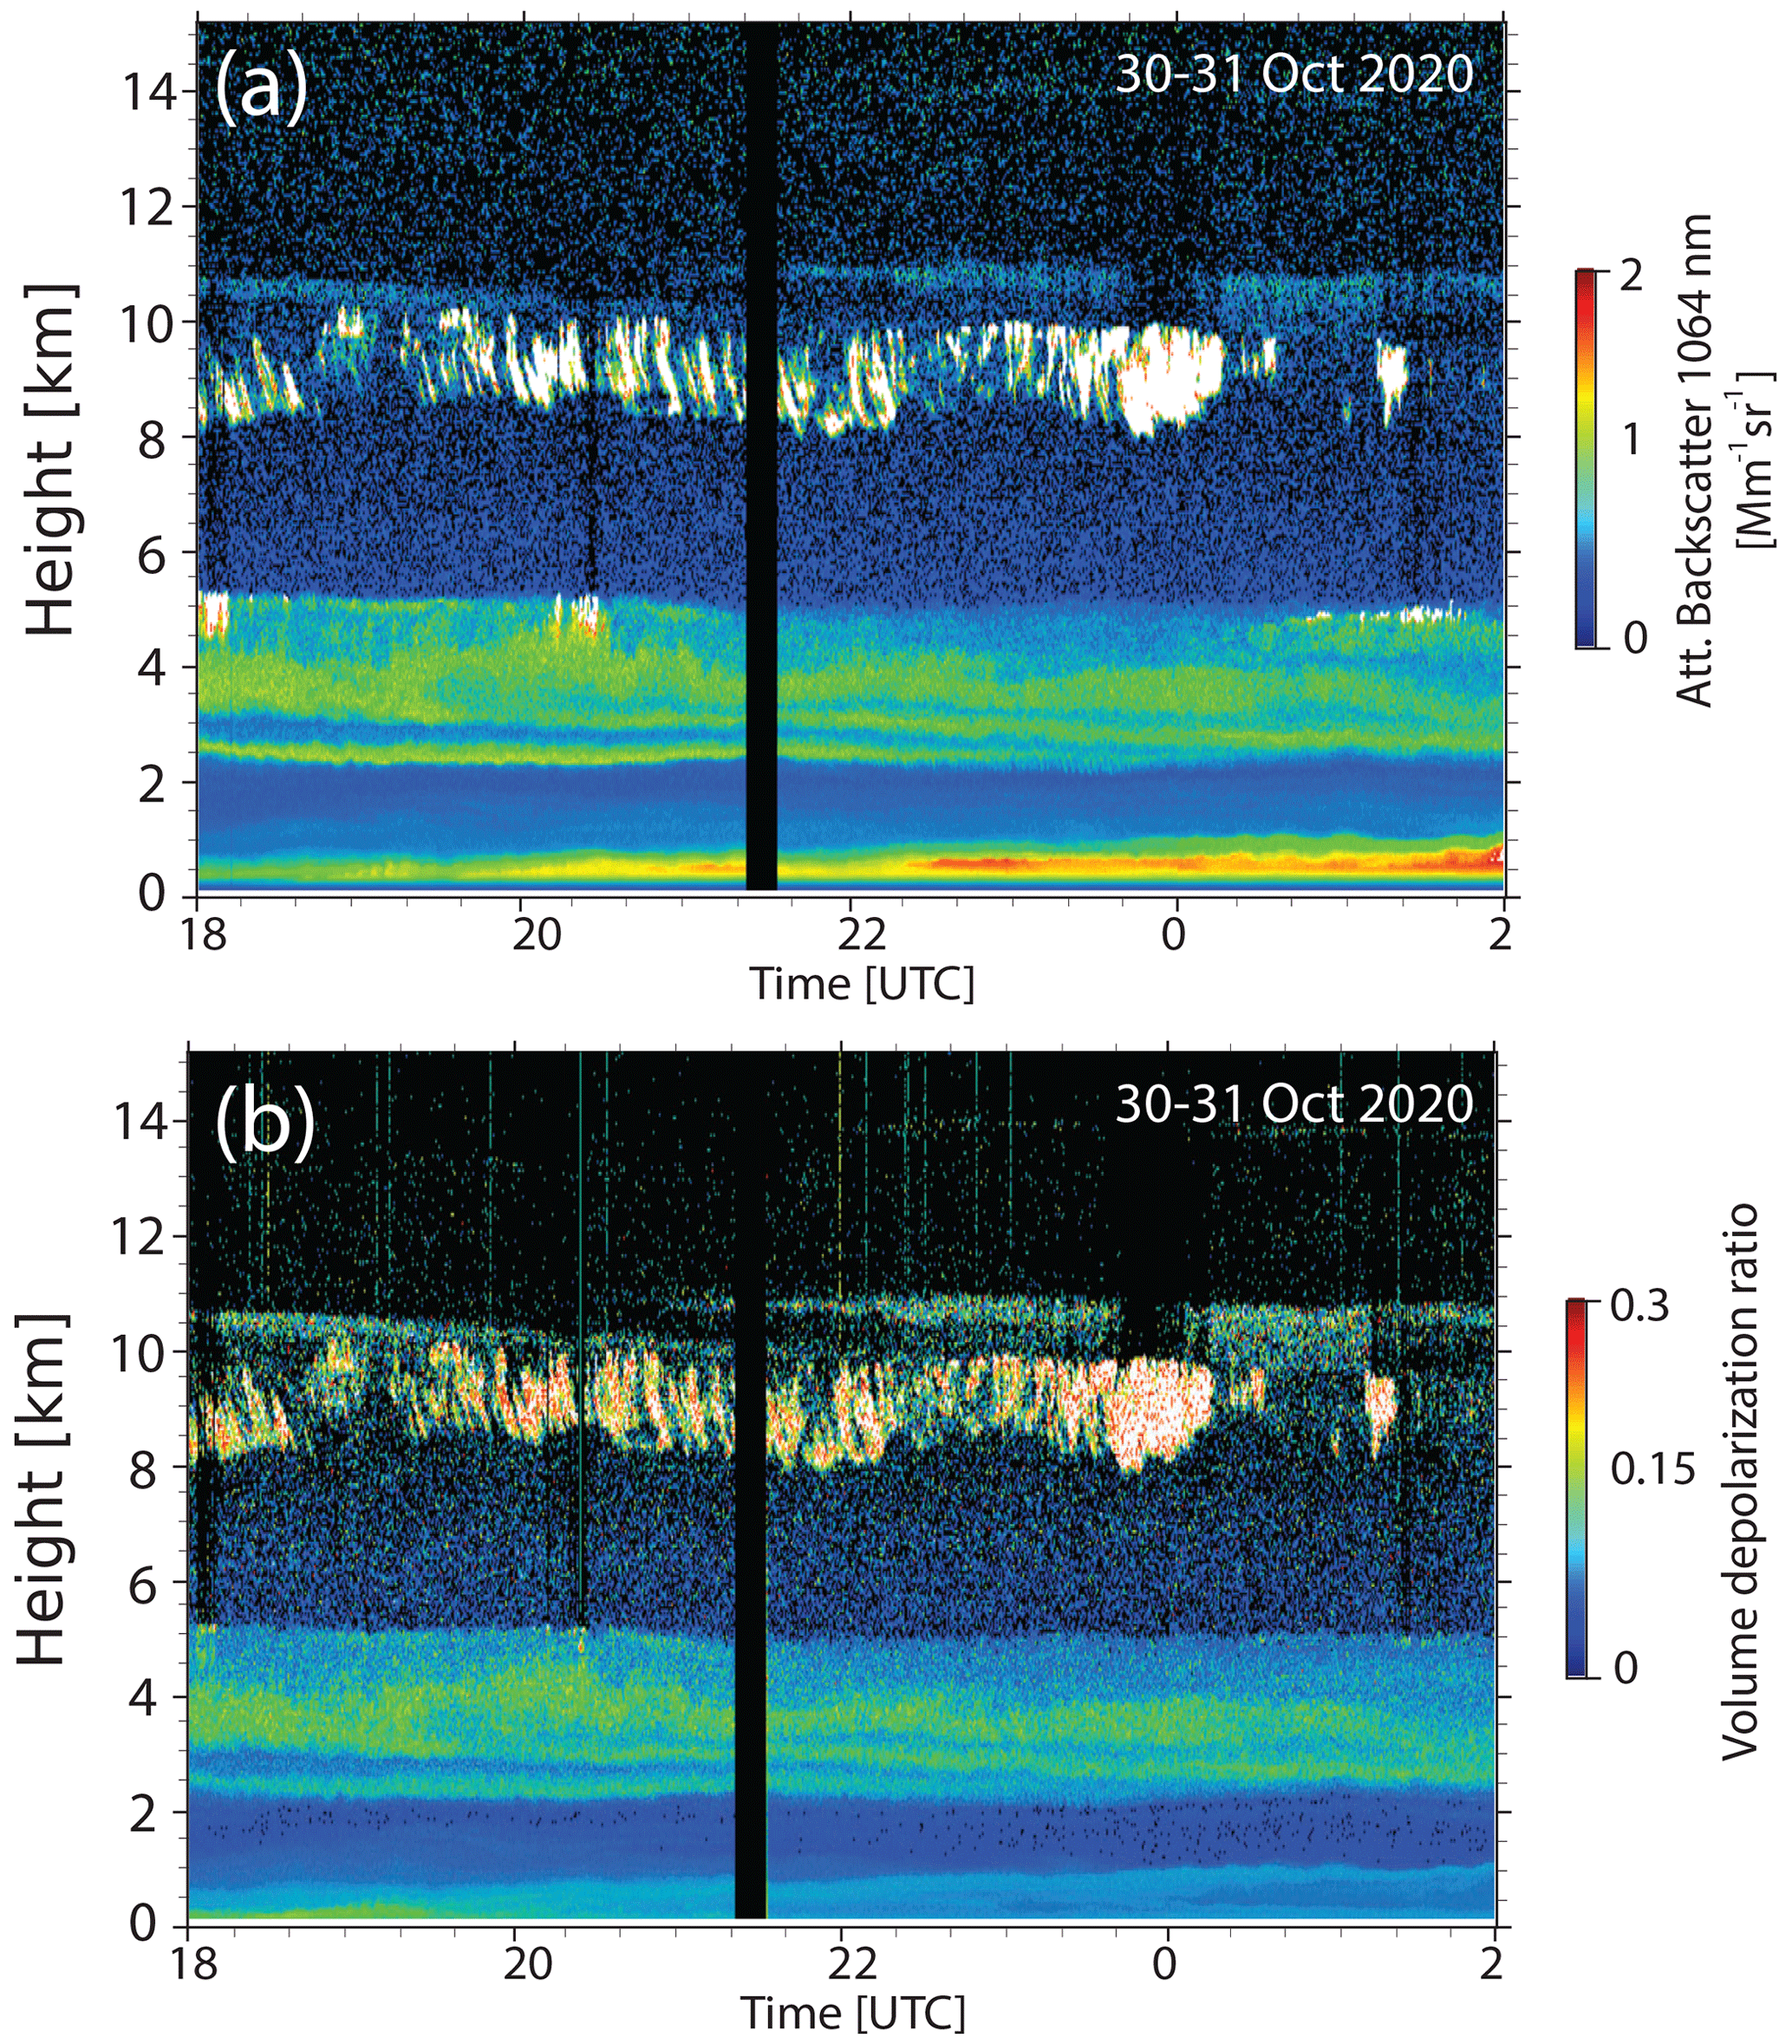
Figure 4Same as Fig. 3b and d except that it is for 30–31 October 2020, 18:00–02:00 UTC. Ice nucleation is expected at the top of the ice virga zone (white features) and thus in the lower parts of the main smoke layers.
The enhanced particle depolarization ratios of 0.1–0.15 at both wavelengths indicate nonspherical particles. The particles were probably lofted by pyrocumulonimbus (pyroCb) convection to the tropopause region. The fast lofting into the dry upper troposphere is assumed to prohibit fast aging of the particles, i.e., the condensation of gases emitted over the sites of the fires as well as of water vapor on the freshly emitted irregularly shaped particles, and thus the development of a perfect spherical core–shell structure (causing low depolarization ratios of close to zero) (Haarig et al., 2018; Baars et al., 2019; Ohneiser et al., 2020; Ansmann et al., 2021). Lofting of smoke by pyroCbs up to the tropopause (at 13–14 km over California in October 2020) is, however, not considered in the HYSPLIT (Hybrid Single-Particle Lagrangian Integrated Trajectory model) simulations (Stein et al., 2015; Rolph et al., 2017). Thus, the trajectories in Fig. 2 can only be used to follow the smoke-polluted airmasses on their way toward Europe. Our analyses are in good agreement with the lidar measurements at Evora, Portugal, and Potenza, Italy, and the HYSPLIT backward trajectory analysis presented by Michailidis et al. (2023).
The particles were probably in a glassy state and showed an almost spherical solid/liquid core–shell morphology (Gialitaki et al., 2020). In the case of perfect spheres, the particle linear depolarization ratio (PLDR) would be 0.01–0.03. PDLR values above 13 km in Fig. 1 result from the smoothing of very noisy data and should be ignored.
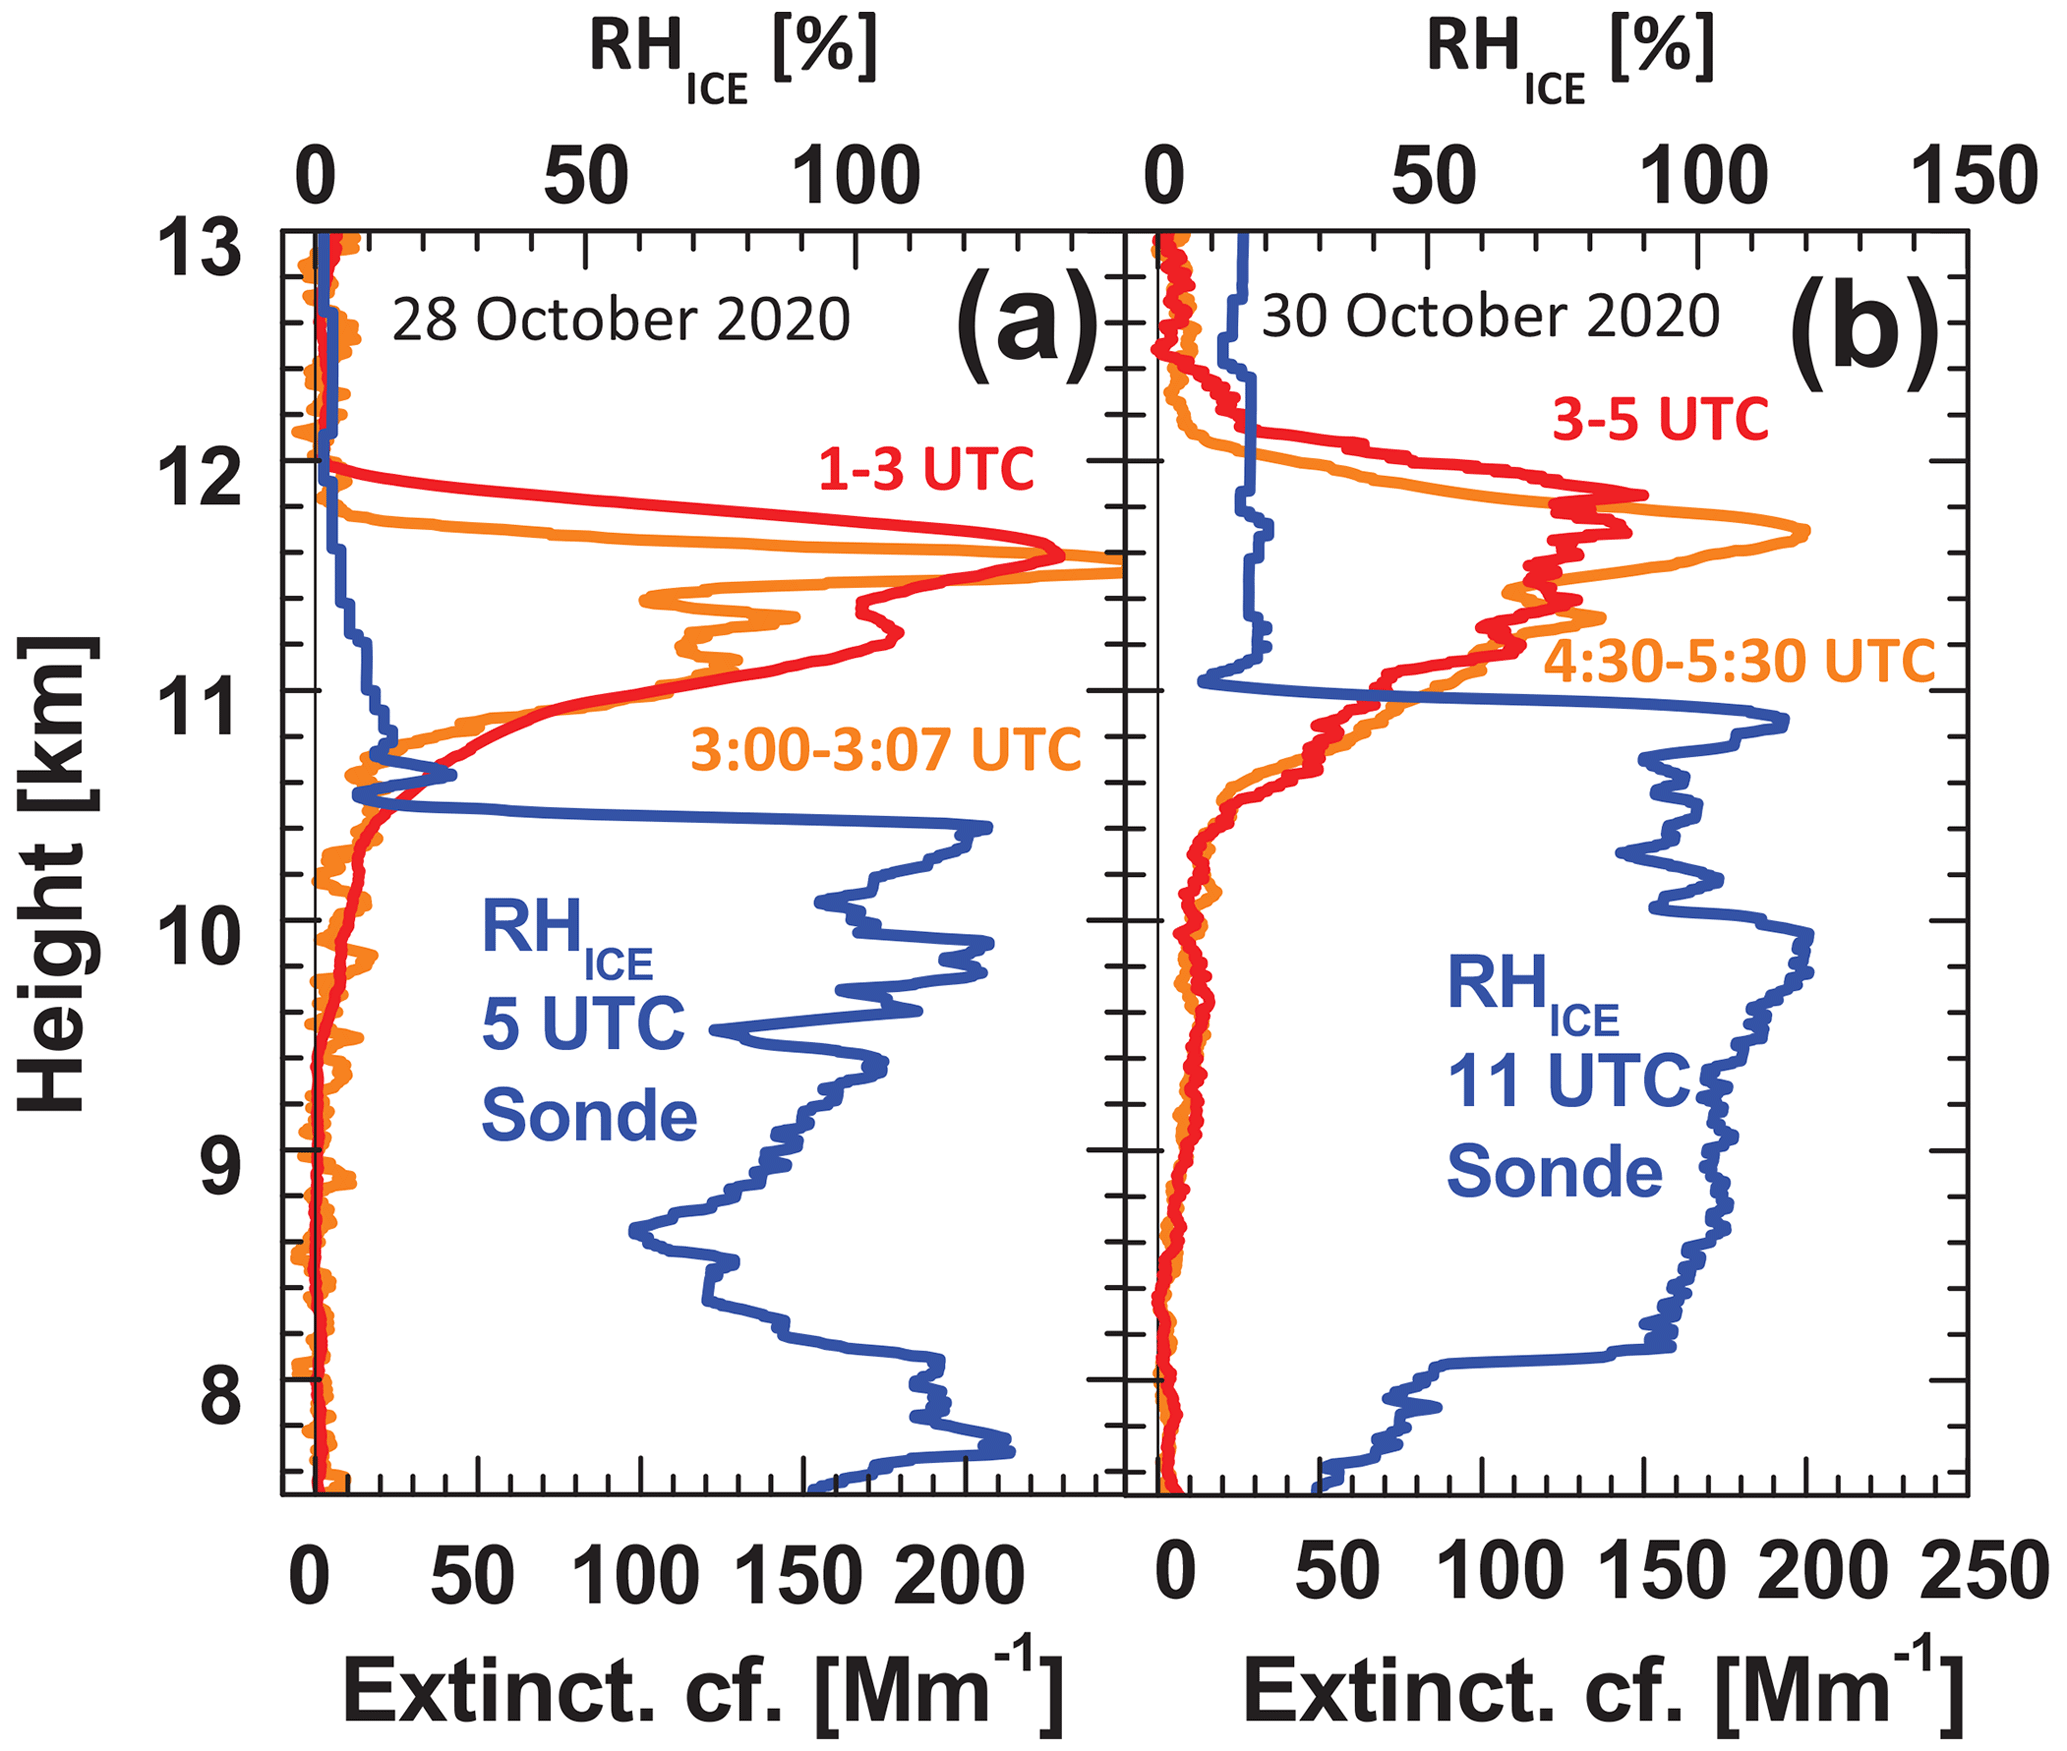
Figure 5Wildfire smoke layers (orange and red particle extinction profiles) in the UTLS (orange: Klett solutions, 70 m vertical smoothing; red: Raman lidar solutions, 300 m signal smoothing) on (a) 28 and (b) 30 October 2020. The signal averaging periods are given in the panels. The 532 nm extinction coefficients are computed from the respective backscatter coefficients by multiplication with the smoke lidar ratio of 75 sr. The orange and red smoke layers partly overlap with the blue humid layers (RHICE profiles from radiosondes launched on 28 October, 05:00 UTC, and 30 October, 11:00 UTC). The top height of the humid layer at 10.5 km (a) and 11 km (b) indicates the tropopause. The most favorable ice nucleation conditions are given just below the tropopause, i.e., in the coldest region of the troposphere.
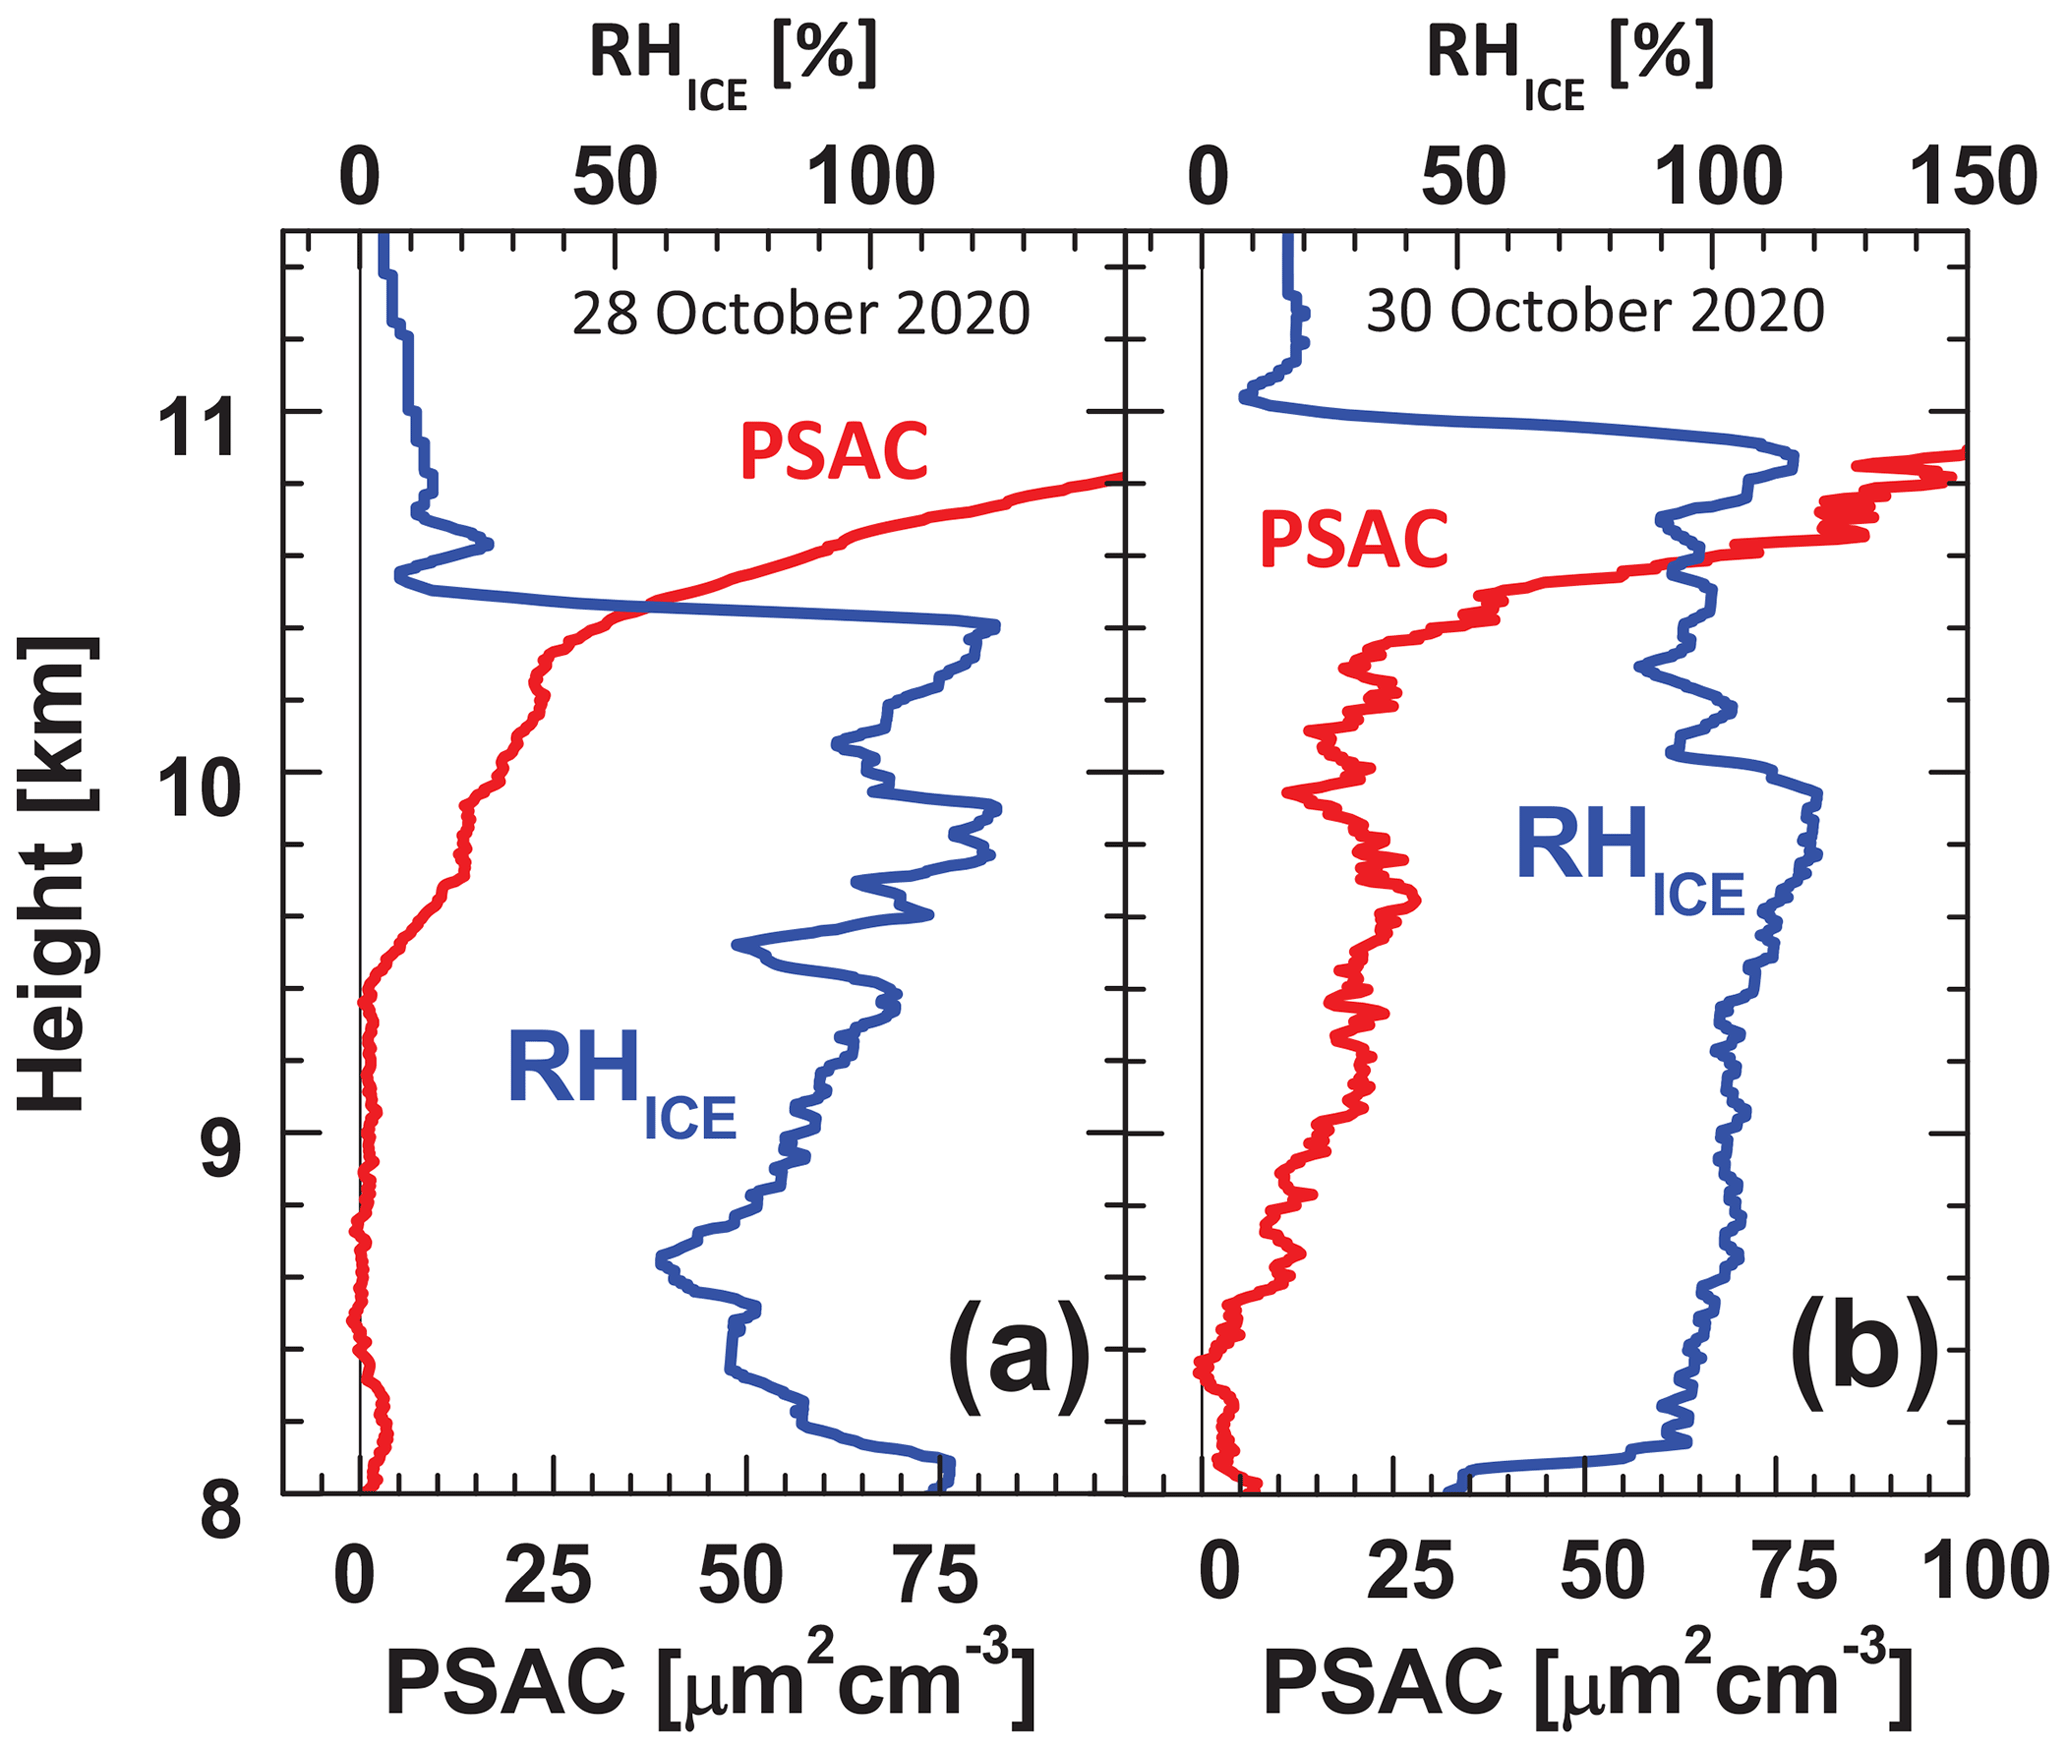
Figure 6Same as Fig. 5 except for the particle surface area concentration (PSAC, red profiles). The extinction coefficients (red Raman lidar profiles) in Fig. 5 were converted into PSAC profiles by using Eq. (1) in Sect. 3. A clear overlap of the red smoke layers with the blue cirrus generation zone (RHICE profile) from 9.5 km (a) and 8.5 km (b) up to the tropopause (top of the humid layer) is visible.
4.2 Ice nucleation in wildfire smoke
On 28 and 30 October 2020, ice clouds developed at the tropopause over Cyprus. According to Fig. 3b and d, the main smoke layer was located between the tropopause and 12–12.5 km height on these 2 d. The sharp drop in the RHICE (relative humidity over ice) profiles in Fig. 3a and c at 10.5 km (28 October) and 11 km (30 October) indicates the tropopause. We show the volume depolarization ratio in Fig. 3b to better identify the smoke layers at 10–12 km and at 6 km height on 28 October. The white, tilted column-like features in Fig. 3b and d are ice virga consisting of falling ice crystals. The nucleation of ice crystals on smoke particles most probably started at the top of the humid layer in the coldest part of the troposphere (at temperatures from −47 to −53 ∘C). These ice crystals grew fast in the supersaturated air and immediately started to fall. Well-structured coherent virga are formed by these crystals. The hexagonal ice crystals cause strong depolarization ratios of around 40 %. The virga are visible as long as the RHICE is high so the sublimation of ice crystals, even in subsaturated air, is slow or prohibited.
Cirrus formation intensified on 30 October from 06:00 UTC to 12:00 UTC, and the optical depth of the virga increased such that the smoke layer above the virga was no longer visible in Fig. 3d (after 09:45 UTC). The color plot is based on lidar profiles measured with 7.5 m vertical and 30 s temporal resolution. Averaging of the signal profiles over, e.g., 15–20 min and vertical smoothing with window lengths of 150–750 m are required to resolve the full cirrus and smoke layer structures up to the smoke layer top.
An intensification of ice virga backscattering was then observed over many hours in the evening of 30 October 2020, implying that strong ice nucleation by the smoke particles occurred at temperatures around −50 ∘C (Fig. 4). The top height of the virga zone always coincided with the lower part of the smoke layer. By using the classical Raman lidar technique (Ansmann et al., 1992; Wandinger, 1998), we analyzed the cirrus virga on 30 October 2020 in detail. The multiple-scattering-corrected 532 nm extinction coefficient σ532 of the ice crystals reached values as high as 400 Mm−1 (mean value for 10:00–10:30 UTC in the 8–11 km height range in Fig. 3d), 180 Mm−1 (19:40–21:20 UTC, 8–10 km height range in Fig. 4), and 1000 Mm−1 (23:40–24:00 UTC, 8–10 km height range in Fig. 4). The respective cirrus optical depths were 0.8 (10:00–10:30 UTC), 0.25–0.3 (19:40–21.20 UTC), and 1.8–2.0 (23:40–24:00 UTC).
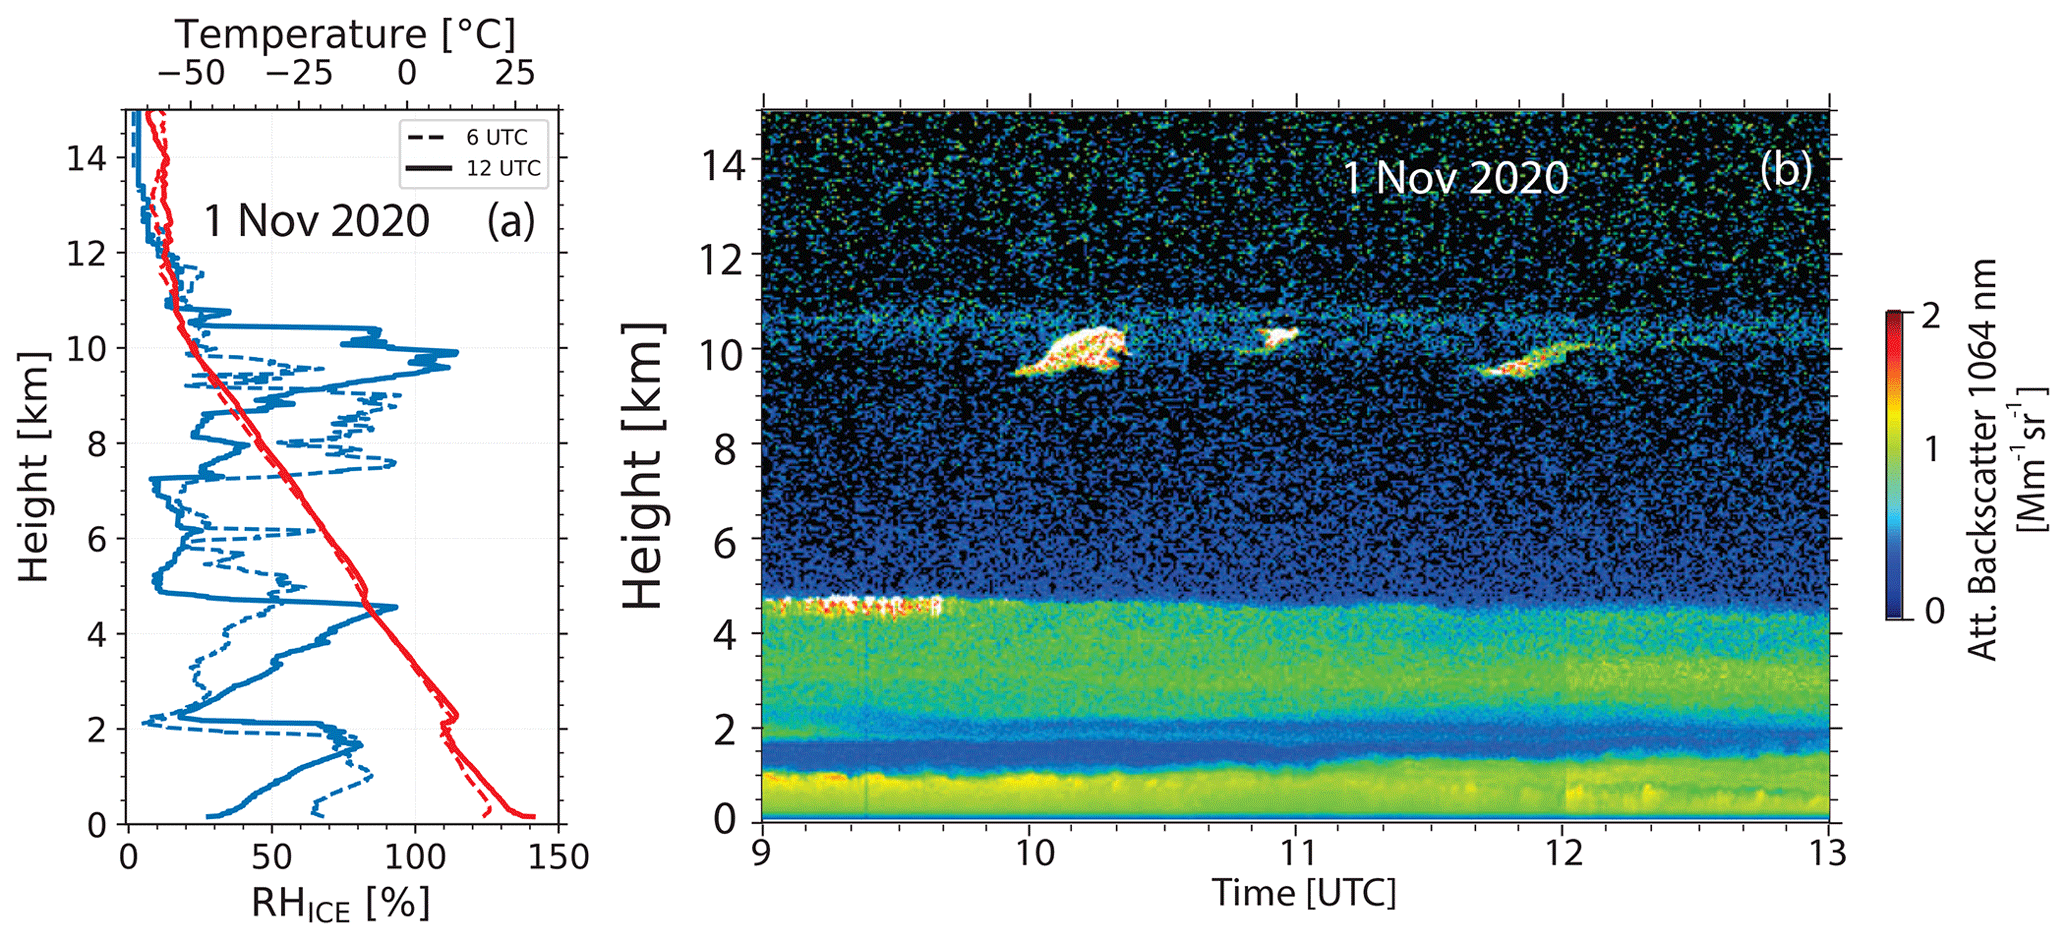
Figure 7Observation of gravity-wave-induced cirrus formation in wildfire smoke on 1 November 2020. (a) Radiosonde profiles (launches at 05:00 and 11:00 UTC) of temperature (red) and relative humidity over ice (RHICE, blue). (b) Time–height display of lidar observations of the ice clouds (wave-like white features at around 10 km and 12:00 UTC) and the smoke layer at 10–11 km height. The sharp drop in the RHICE profile at 10.5 km ((a), 12:00 UTC) indicates the tropopause. The time–height display of the range-corrected 1064 nm backscatter signal (denoted the attenuated backscatter) shows the smoke layer, the ice clouds, as well as a pronounced Saharan dust layer (2–5 km height) and the local boundary layer (up to about 1–1.5 km height).
The pronounced virga structures point to a relatively small number of comparably large ice crystals that grew fast and formed these well-organized virga signatures. A broad crystal size spectrum (causing a broad spectrum of sedimentation velocities) would probably not be able to produce such coherent virga structures over many hours. Patchy and incoherent cirrus structures would be more likely. We estimated the ice crystal number concentration nICE by using the relationship (Schumann et al., 2011) with the measured 532 nm extinction coefficient σ532 and values for the assumed effective crystal radius reff. For σ532=400 Mm−1 (as observed on 30 October, 10:00–10:30 UTC), we yield nICE=100 L−1 (reff=25 µm), 50 L−1 (reff=35 µm), 25 L−1 (reff=50 µm), and 6 L−1 (reff=100 µm). According to satellite observations over East Asia (15–55∘ N, 70–135∘ E, 2007–2015) analyzed by Zhao et al. (2018), typical values of the ice crystal reff are 25–35 µm. For typical cirrus extinction coefficients of 100–200 Mm−1, nICE values are thus in the range of 10–50 L−1 according to our rough estimations here.
Figures 5 and 6 provide a more detailed, quantitative insight into the impact of the Californian wildfire smoke on ice nucleation over the eastern Mediterranean. The lidar observations in Figs. 5 and 6 show the aerosol conditions before the first ice clouds and virga developed on these 2 d. As can be seen, the smoke layer sufficiently overlapped with the humid region in the uppermost troposphere and thus was able to influence the development of cirrus clouds and virga significantly. For Fig. 5, we used both methods (the Klett–Fernald approach and the Raman lidar approach, see Sect. 2.2) to compute smoke backscatter profiles. Then, we multiplied the backscatter coefficients with the smoke lidar ratio of 75 sr to obtain the respective particle extinction coefficients for several cirrus-free time periods on 28 and 30 October 2020. Very polluted conditions prevailed. High particle extinction coefficients of up to 250 Mm−1 (28 October) and 150 Mm−1 (30 October) were observed. The aerosol optical thickness (AOT, 532 nm) of the smoke layer (8–12.5 km height range) was close to 0.2 on 28 October and about 0.16 on 30 October (9.5–12.5 km height range). Good agreement with the early morning AERONET photometer observations at Limassol, Cyprus, of the total 500 nm AOT was found (AERONET, 2023). Besides the smoke, dust and urban haze (below 5 km height in Fig. 3) contributed about 0.05–0.1 to the overall 500 nm AOT of 0.25–0.3 (shortly after sunset on 28 October 2020) and 0.22–0.25 (shortly after sunset on 30 October 2020).
In Fig. 6, particle surface area concentrations (PSACs) are presented that were obtained by the conversion of the extinction coefficients in Fig. 5 into surface area values by means of Eq. (1) in Sect. 3. In terms of PSACs, we see a clear overlap between the height range with smoke traces and the ice nucleation height region. The smoke PSAC values (required in the INP estimation with Eqs. 5 and 6, Sect. 3.1) were enhanced in the humid layer down to about 9.4 km on 28 October and 8.5 km on 30 October. The smoke PSAC values were around 25 µm2 cm−3 at 10.4 km height on the 2 d (28 and 30 October) and even close to 100 µm2 cm−3 at the tropopause at 11 km height on 30 October 2020. The pronounced RHICE variability in the uppermost part of the humid layer in Fig. 6 may indicate water vapor consumption during the ice nucleation and subsequent crystal growth processes.
Regarding the ice nucleation mode, we hypothesize that the smoke particles were glassy so that DIN dominated ice formation (Murray et al., 2010). As shown in Figs. 5 and 6, the maximum particle concentration was found above the tropopause. Below the tropopause, the aerosol reservoir was obviously already strongly depleted as a result of ice nucleation, the scavenging of aerosol particles by ice crystals, especially during the phase of the fast diffusional growth of small ice crystals (Oraltay and Hallett, 1990; Santachiara et al., 2018), and crystal sedimentation processes.
The radiosonde observations frequently showed RHICE values of > 110 % over extended vertical ranges in the upper part of the cirrus layers. RHICE reached values of 115 %–120 % (partly 125 %) in the height range from 9.75–10 km on 28 and 30 October 2020. In the case of ice-active dust and ash particles that are already able to initiate ice nucleation at ice supersaturations SICE<1.1, one would expect ice saturation (SICE of around 1.0) in the presence of growing ice crystals and virga. Equilibrium at ice supersaturation conditions is a sign of a low crystal number concentration (< 35 L−1) (Murray et al., 2010). Such a low amount of ice crystals is not able to quench the supersaturation, which is, in turn, indicative of heterogeneous ice nucleation. Homogeneous freezing (of liquid aerosol particles) would produce crystal concentrations of > 500 L−1, so equilibrium at an SICE of around 1.0 would occur within a short time period.
4.3 Ice nucleation triggered by gravity wave activity: observation and simulation
On 1 November 2020, several pronounced gravity waves (GWs) produced wave-like cirrus features in the smoke-polluted air (9.5–11 km height). This measurement is shown in Fig. 7. It is well known that, besides the aerosol and humidity conditions, the occurrence of GWs in the upper troposphere plays a crucial role in cirrus formation processes (Kim et al., 2016; Kärcher and Podglajen, 2019; Kärcher et al., 2022). During the updraft phase, the temperature T decreases and SICE increases in the lofted air parcels, and ice nucleation starts when RHICE exceeds a certain threshold. Ubiquitous mesoscale GWs generate the high cooling rates and ice supersaturation conditions required to initiate ice nucleation.
The GWs on 1 November 2020 did not cross the lidar station directly. We only saw the impact of the GWs propagating from east to west across the Mediterranean Sea south of Limassol on cirrus formation. GWs propagate with typical horizontal (travel) velocities of 15–20 m s−1 and show temporal lengths of 15–25 min (Kalesse and Kollias, 2013). The waves on 1 November traveled almost against the southwesterly air flow (wind direction of 230∘, wind velocity of 13 m s−1) according to the Nicosia radiosonde observations. The wave-induced cirrus patterns drifted with the southwesterly winds across the lidar station. We saw the end of the two wave-like cirrus features first (at around 09:50 and around 11:30 UTC), and the front part of the wave-induced cirrus, i.e., the ice nucleation region, much later (at around 10:30 and 12:20 UTC). Strong cooling occurs during lofting and generates high ice supersaturations, so heterogeneous ice nucleation can start on the available INPs. The apparent amplitude (measured with lidar when the cirrus features crossed the field site) was roughly 300–400 m on 1 November 2020 (see Fig. 7). If we take ice virga development into account, the true amplitude of the gravity wave may have been between 200–250 m. Ice crystals falling out of a cirrus layer may reach heights of 100–200 m below the main cirrus deck within 5–20 min, which may not allow us to detect the true wave amplitude and the height range influenced by the gravity wave motions.
In support of the lidar observations on 1 November, we performed simulations of gravity-wave-induced lofting of air parcels, the related temperature decrease and respective RH increase, and the impact of this lofting on ice nucleation via DIN. The goal of the simplified simulations was just to show that 200–250 m of lofting is sufficient to activate 10–50 INPs L−1, and thus to produce INP number concentrations high enough to prevent homogeneous freezing. The atmospheric meteorological and aerosol conditions measured with lidar and Nicosia radiosondes on 1 November 2020 in the upper troposphere were used as input. A height of 9920 m (in the center of the humid layer in Fig. 7a) was selected as the starting height of the lofting process. Different wave amplitudes (or air parcel ascents) from 200–250 m were simulated. The calculation step width was Δt=10 s in Eq. (6) in Sect. 3.1. The water vapor mixing ratio in the air parcels remained constant during the lofting process, i.e., no turbulent mixing and exchange process between air parcels occurred.
The results are shown in Fig. 8. They suggest that the gravity wave amplitude was probably around 220–225 m. As shown in Fig. 8, the accumulated INP number concentrations increased to values of about 30 to 550 L−1 after an ascent of 220–230 m (from 9920 to 10 140–10 150 m). For larger wave amplitudes (240 and 250 m), the INP number concentrations reached unrealistically high values of about 800 to almost 10 000 L−1. We assume that the ice nucleation process stops before the INP number concentration exceeds 50–100 L−1 because of water vapor deposition on the freshly formed ice crystals and the corresponding significant reduction in SICE (Murray et al., 2010; Kärcher et al., 2022), so that further ice nucleation is suppressed.
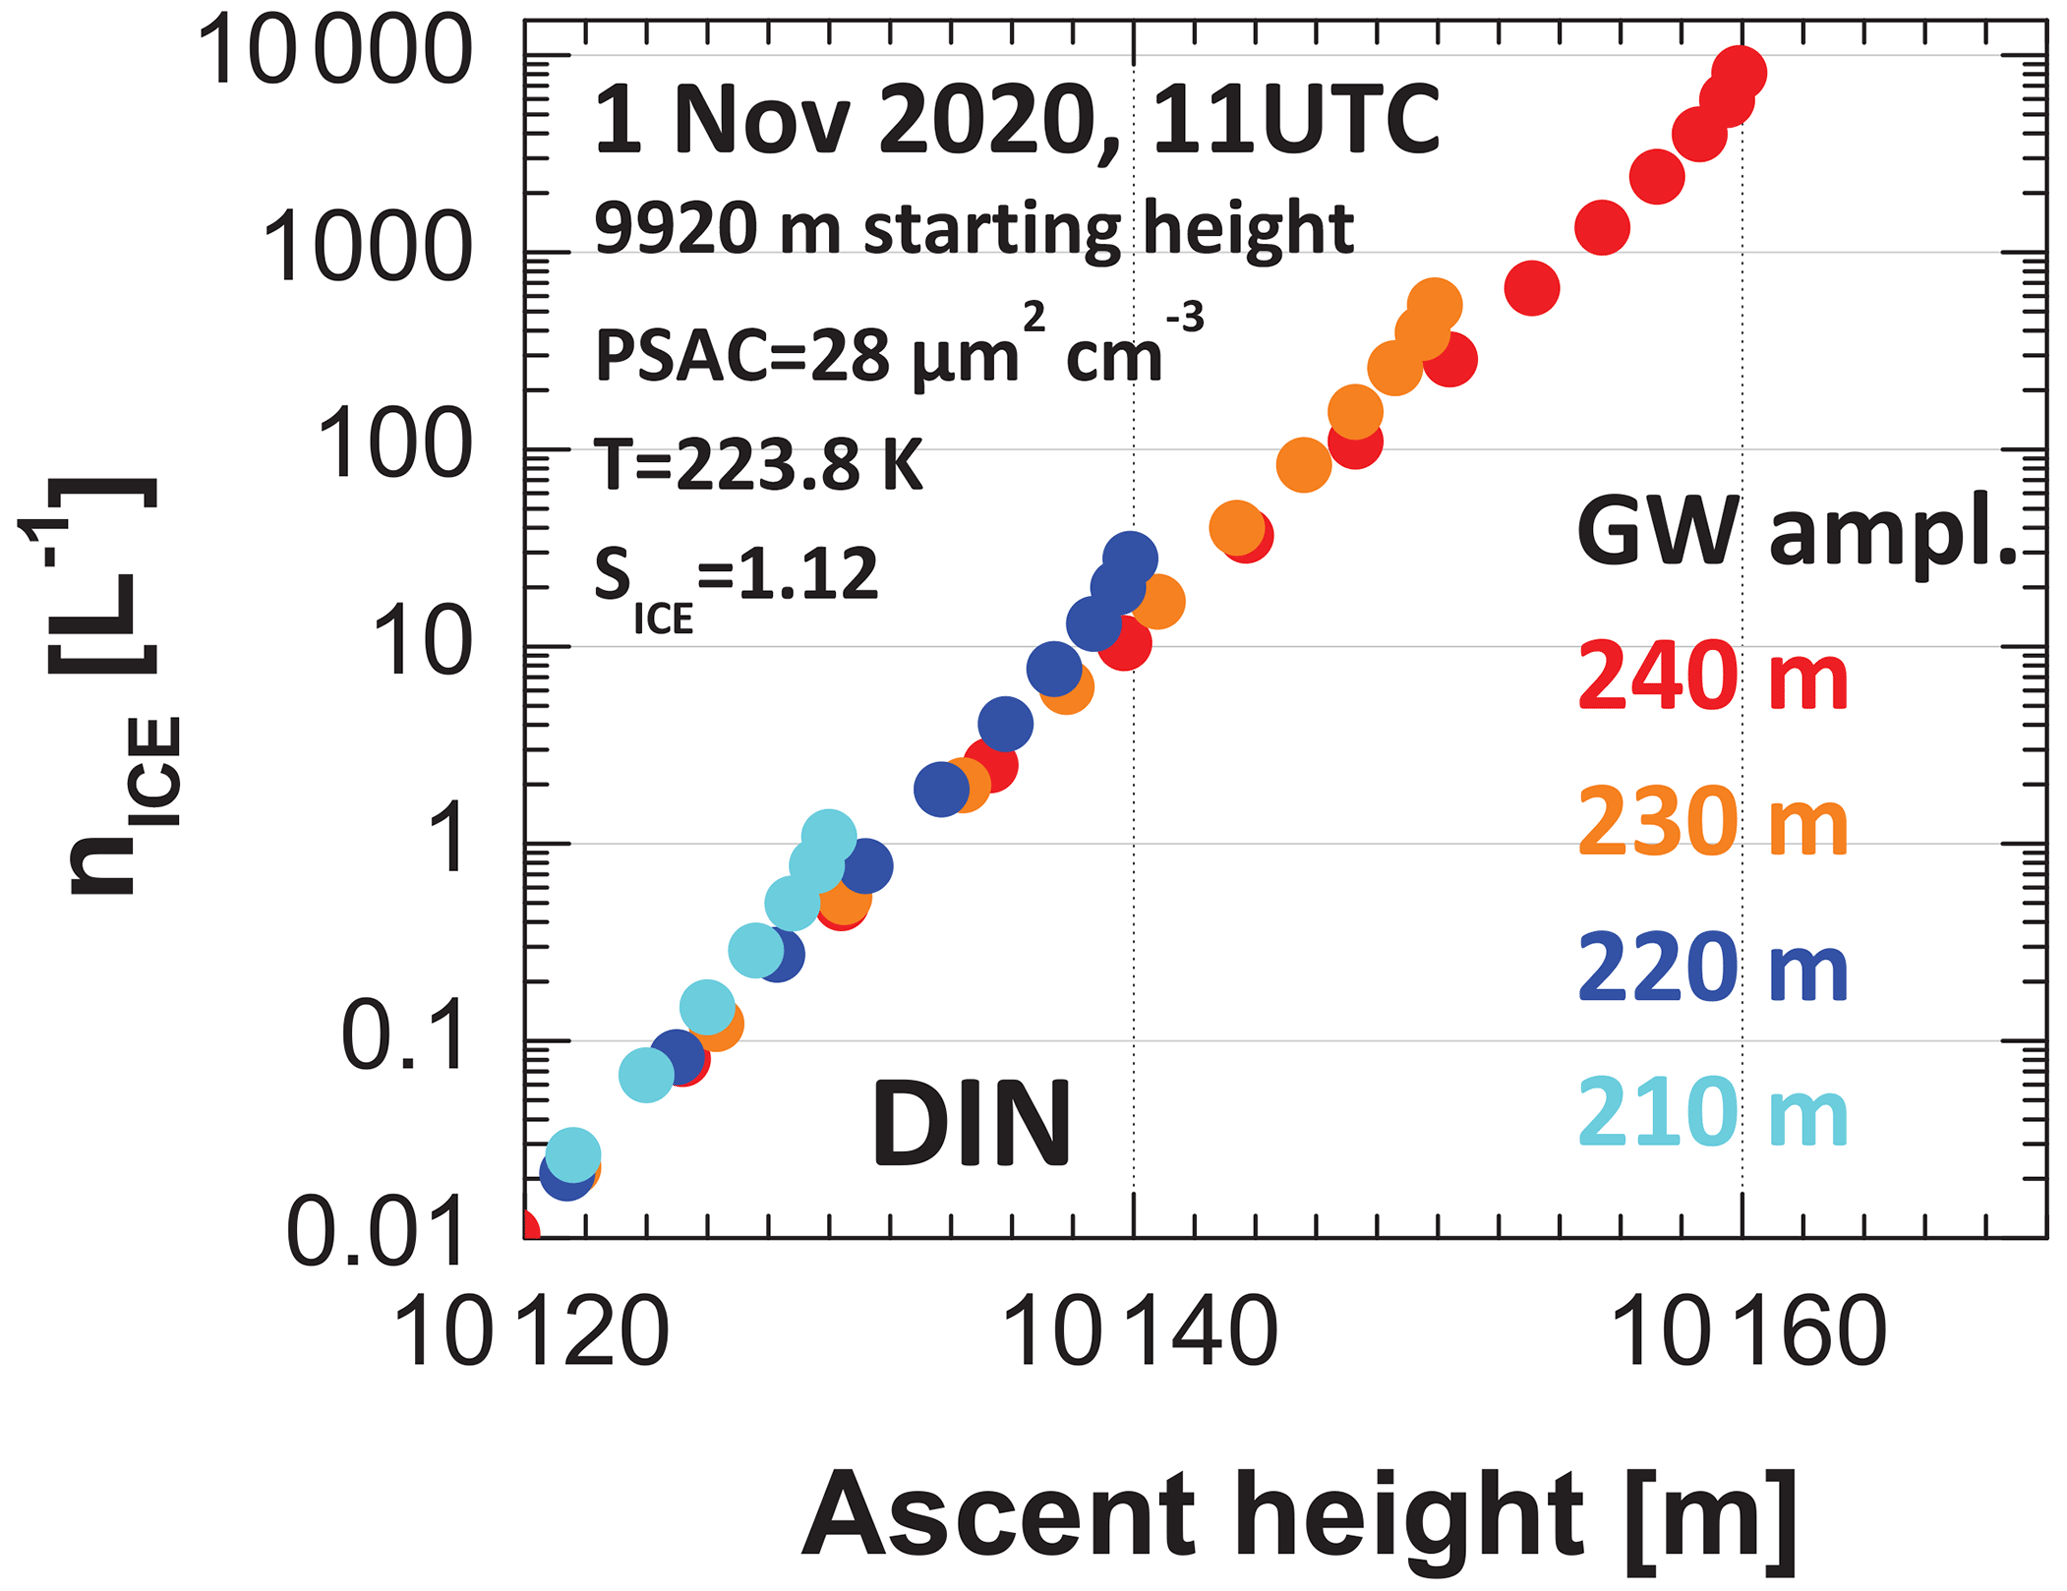
Figure 8Accumulated ice crystal number concentration, nICE, as a function of ascent height above the starting height of 9920 m. The gravity-wave-induced lofting of an air parcel is simulated. The initial T and SICE values (at 9920 m height according to the radiosonde launched on 1 November 2020, 11:00 UTC) are given in the panel. The simulation resolution is Δt=10 s. Four simulations with different lofting amplitudes of 210 m (maximum height, reached after 295 s, SICE=1.40 at this height), 220 m (reached after 310 s, SICE=1.41), 230 m (reached after 324 s, SICE=1.43), and 240 m (reached after 338 s, SICE=1.44) are shown. The updraft speed was around 0.7 m s−1. Lofting by about 220 m is obviously sufficient to activate around 20–50 INPs L−1. Lofting by 230–240 m leads to unrealistically high ice crystal number concentrations of about 800 to 9000 L−1 in the simulations.
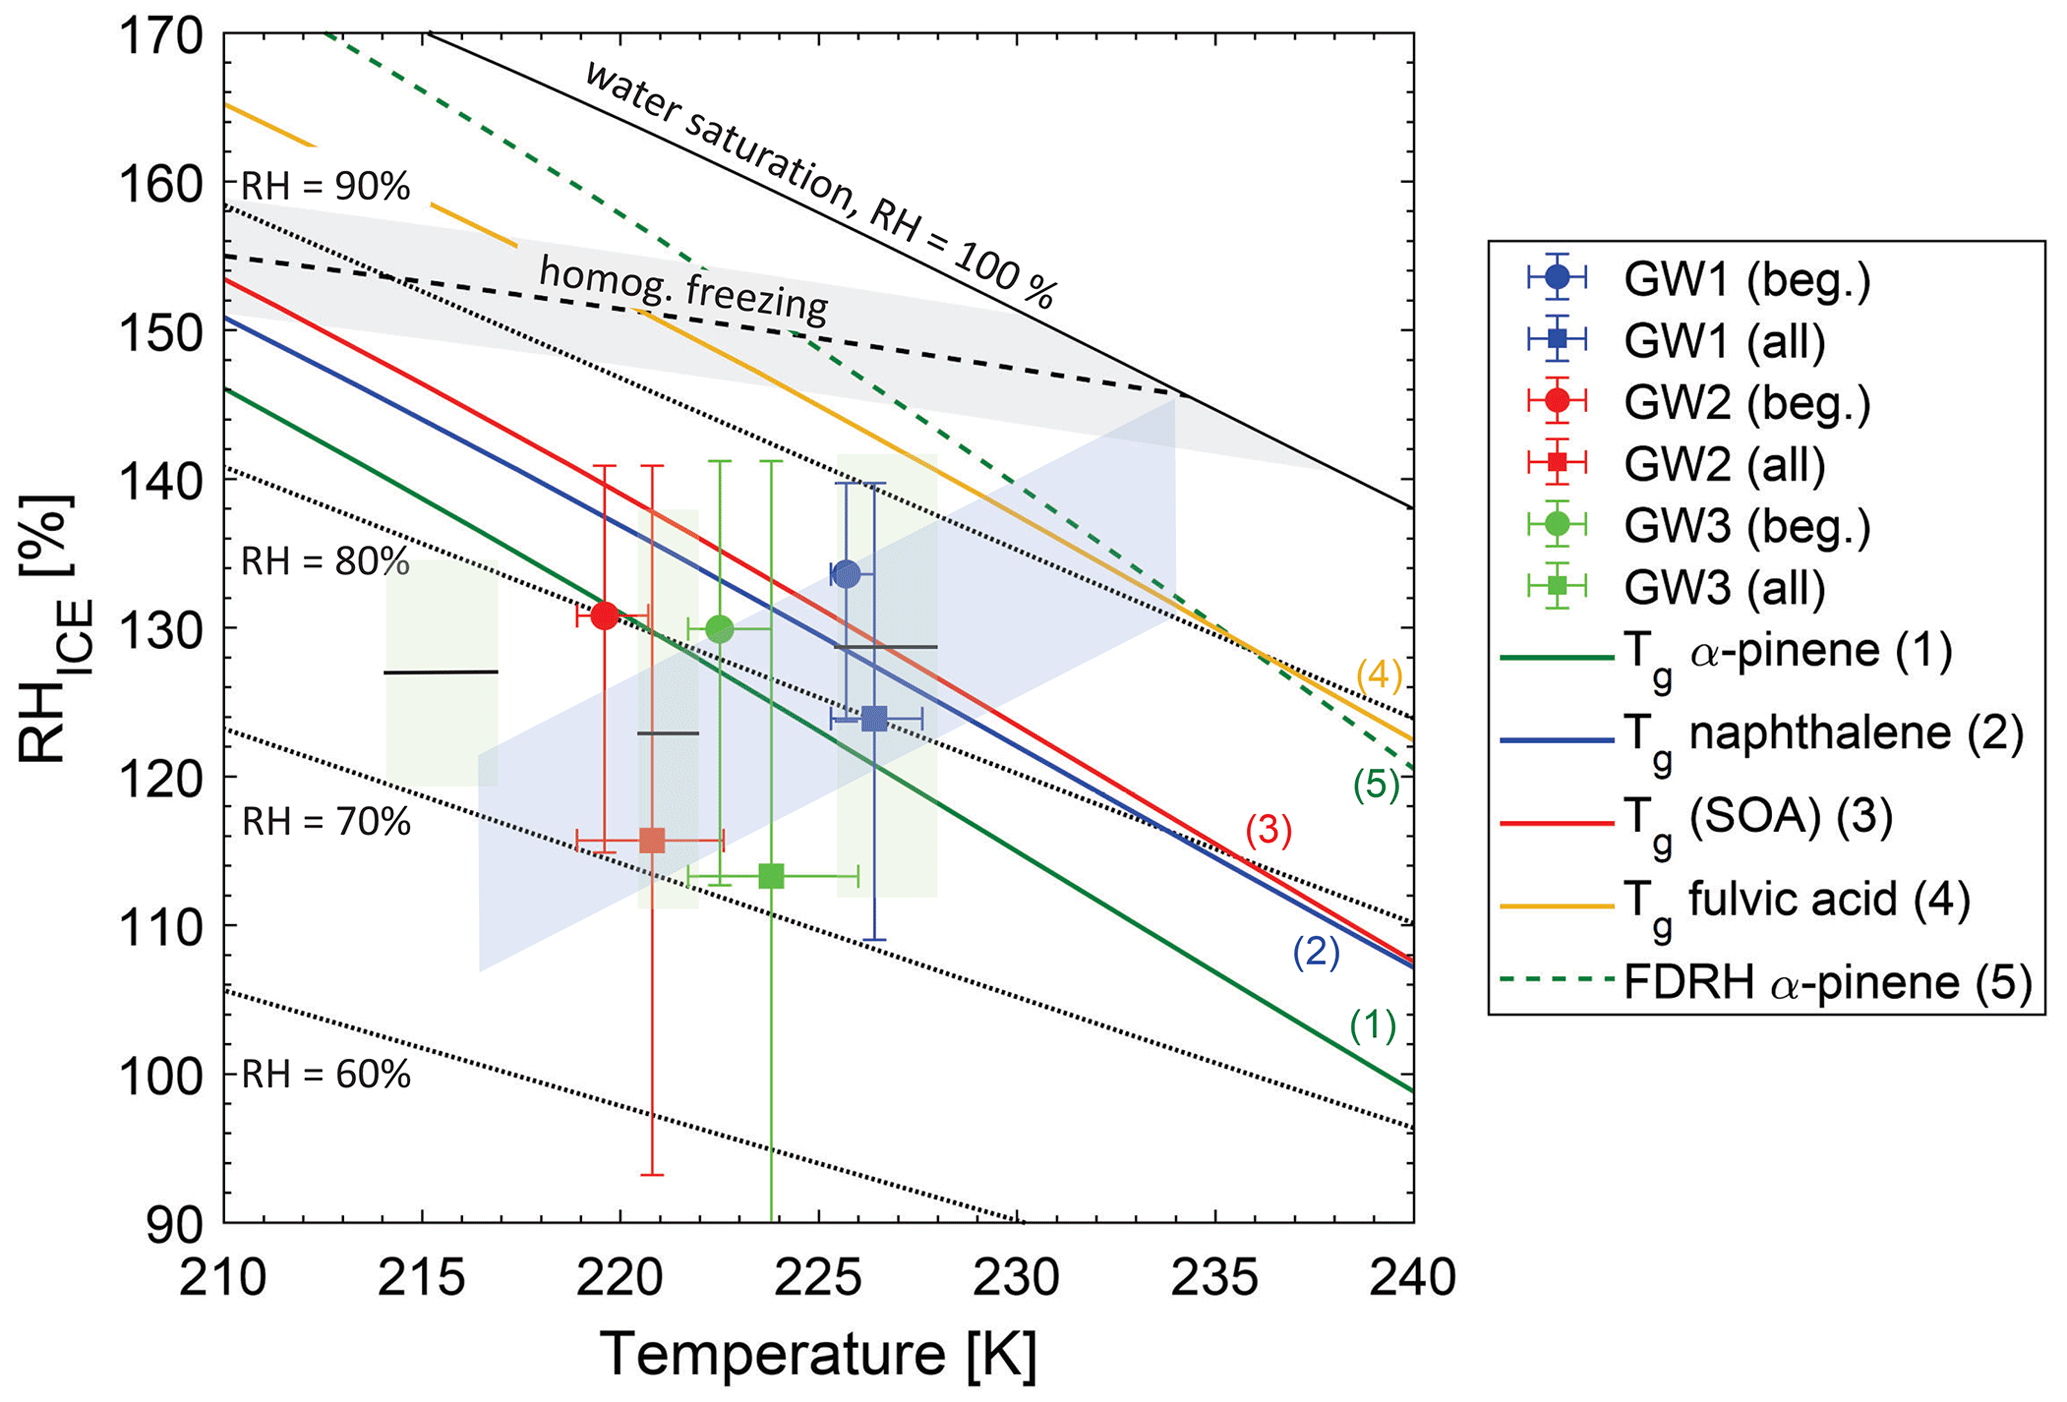
Figure 9Thermodynamic conditions for the simulated gravity-wave (GW)-induced cirrus cloud formation (blue, red, and green symbols and bars represent events on 28 October (GW1), 30 October (GW2), and 1 November (GW3), respectively) in comparison to homogeneous (gray area with a dashed black line) and heterogeneous (three greenish areas, each with a horizontal bar) ice nucleation, phase transitions of organic particles (colored and numbered lines), and continental cirrus conditions (bluish area). Circles (mean values) and bars (ranges of values) represent the initial loft phase of 300-400 s (beg.), and squares and bars represent the entire GW period (all). The solid black line represents the conditions for water saturation (100 % RH). Dotted lines indicate constant relative humidity over water (90 % to 60 % RH from top to bottom, respectively). The dashed line and gray shading represent the homogeneous freezing limit for droplets 10 µm in size and the corresponding uncertainty (Koop et al., 2000; Koop, 2004). Greenish areas and horizontal lines represent the range and mean conditions of observed deposition ice nucleation by leonardite particles (Wang and Knopf, 2011) serving as a surrogate for organic ice-nucleating particles. The glass transition temperature Tg (molecular mobility is frozen for T < Tg) of laboratory-generated α-pinene SOA (green line or (1); Charnawskas et al., 2017), naphthalene SOA (blue line or (2); Charnawskas et al., 2017), field-derived SOA (red line or (3); Wang et al., 2012b), and Suwannee River fulvic acid particles (orange or (4); Wang et al., 2012b) are plotted. The dashed green line (or (5)) displays the full deliquescence RH (FDRH) for α-pinene SOA particles, 500 nm in diameter, for a humidification rate simulating an updraft of 1 m s−1 (Charnawskas et al., 2017). The light blue area indicates the range of observed conditions of continental orographic wave clouds and cirrus (Heymsfield and Miloshevich, 1995).
We expanded the gravity-wave simulations and included the 28 and 30 October observations. An overview of the simulated atmospheric conditions during the gravity wave events on 28 October (GW1), 30 October (GW2), and 1 November 2020 (GW3) according to the Nicosia radiosonde observations is depicted in Fig. 9. In addition, the specific ice nucleation conditions in the case of organic aerosol particles are highlighted. The GW temperature and RHICE ranges for the initial and full GW periods indicate that heterogeneous ice nucleation dominated. The RHICE values required for homogeneous ice nucleation were never reached in the simulations, so heterogeneous ice nucleation proceeded without competition from homogeneous freezing processes. The environmental and ice nucleation conditions of the GW events mostly represent conditions where organic aerosol (OA) particles are solid in phase when compared with the glass transition temperatures (Tg) of secondary organic aerosol (SOA) particles derived from α-pinene and naphthalene precursor gases (Charnawskas et al., 2017), ambient SOA particles (Wang et al., 2012b), and fulvic acid particles (Wang et al., 2012b). It should be noted that even the α-pinene-derived SOA with the lowest Tg does not fully deliquesce, assuming an updraft of 1 m s−1 (Charnawskas et al., 2017), until RHICE values close to and above the homogeneous freezing limit are reached. OA particles that contain molecular species with higher molecular weights, such as fulvic acid compounds, are expected to retain the solid phase until even greater RHICE values are reached (Koop et al., 2011). This supports the notion that smoke particles were likely solid and acted as heterogeneous INPs in the deposition ice nucleation processes.
The GW simulation results for 28 October are shown in Fig. 10. For comparison, we included the immersion freezing (ABIFM) simulations. The predicted ice crystal number concentration ICNC (open symbols, ICNC=INP number concentration) for each calculation Δt = 10 s as well as the integral or sum of the formed ice crystals (or INP number concentration, solid symbols) are plotted in Fig. 10a. The respective changes in ice supersaturation SICE and Δaw (Eq. 3) are shown in Fig. 10b. The starting height of the simulation was 10 400 m, in the uppermost part of the humid layer (Fig. 6). Updraft velocities were 0.3–0.4 m s−1. The required smoke PSAC input values were taken from the lidar observations (from Fig. 6).
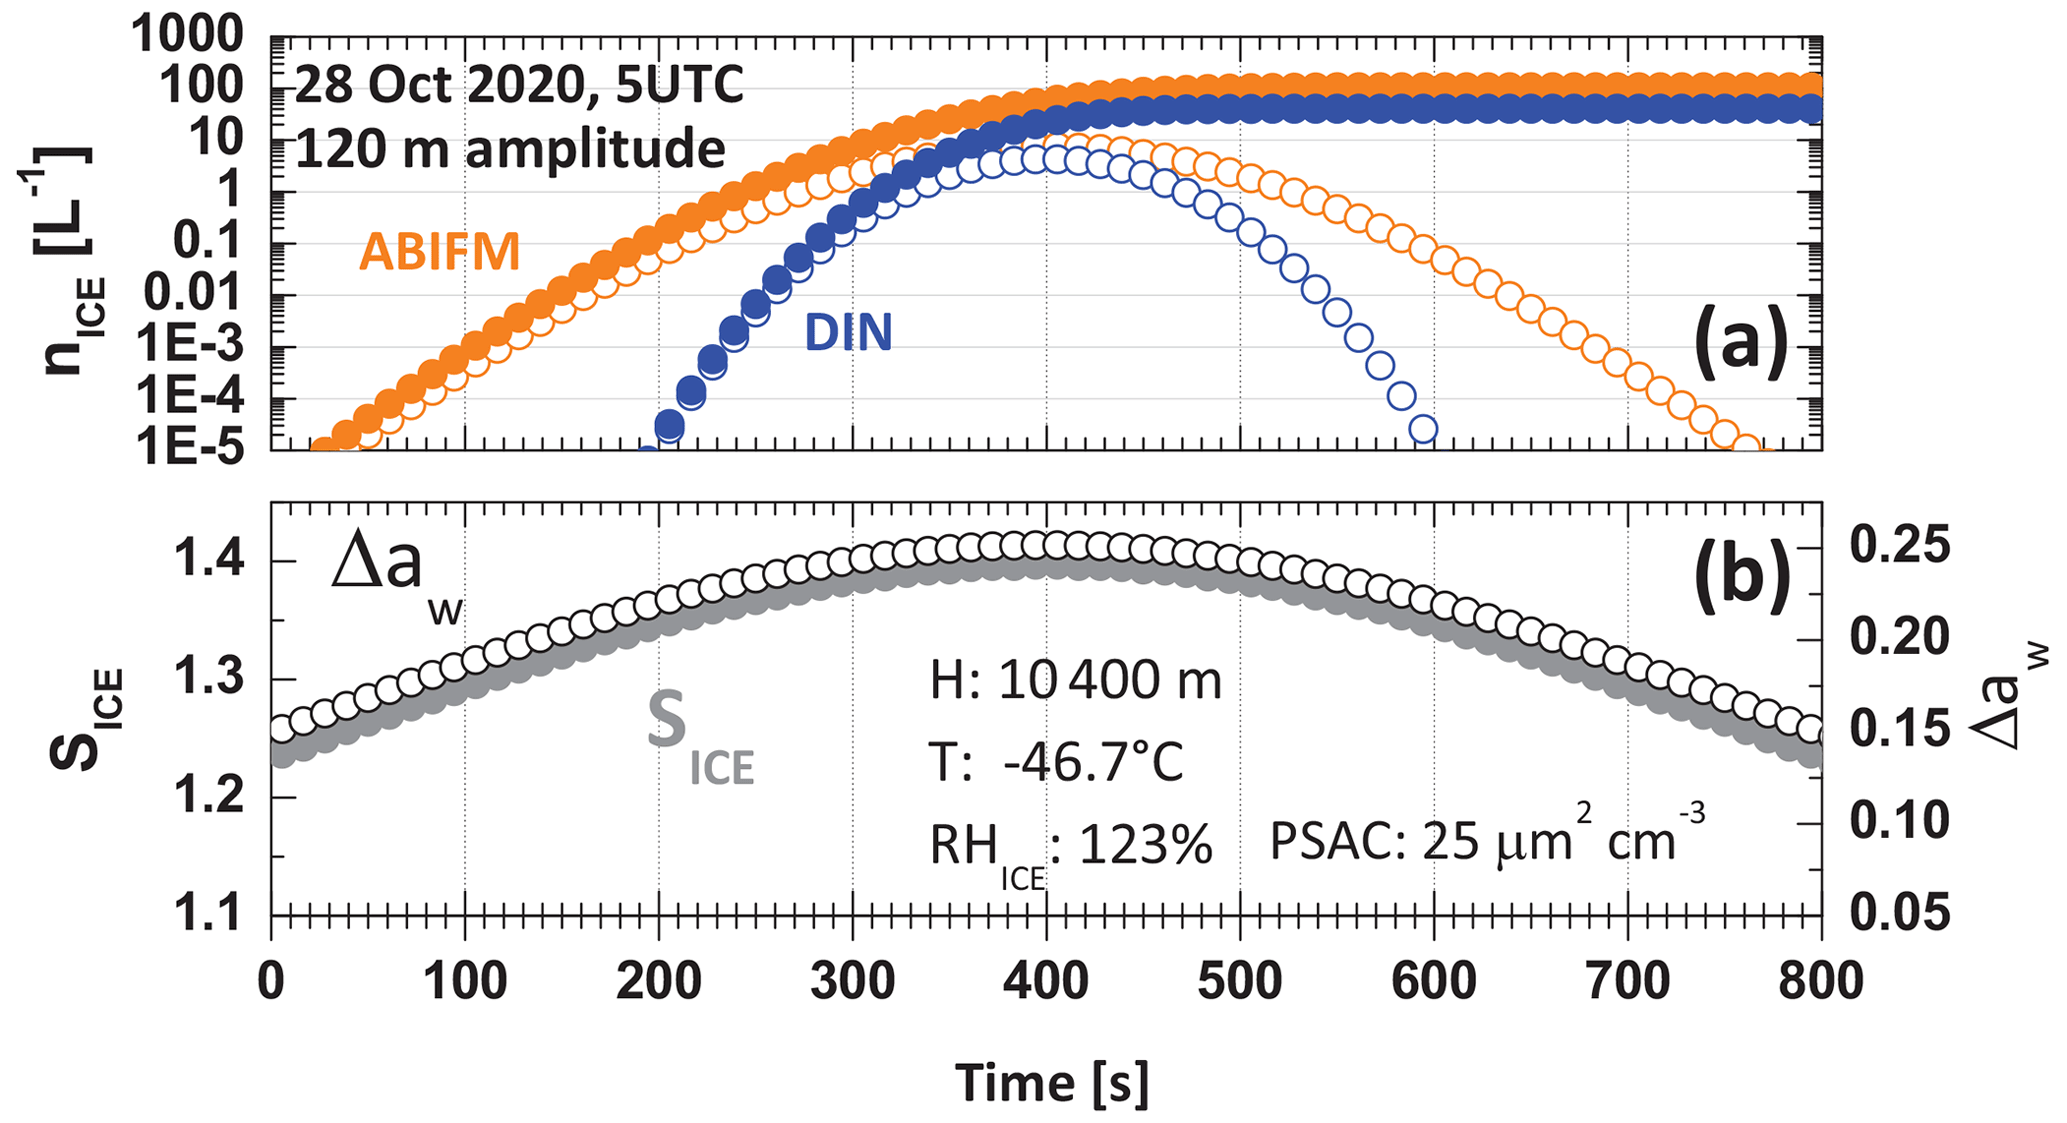
Figure 10(a) Simulation of the nucleation of ice crystals (nICE) during the ascent phase (first 800 s; from a starting height of 10 400 m to the maximum amplitude and back to the starting height level) of a gravity wave with an amplitude of 120 m. The temperature (T) and RHICE conditions as observed with the Nicosia radiosonde on 28 October 2020 (launched at 05:00 UTC) at the GW's starting height H are given in panel (b) together with the simulated PSAC values (from the lidar observations). Immersion freezing (ABIFM) as well as deposition ice nucleation (DIN) parameterizations are applied to compute nINP=nICE as described in Sect. 3.1. The simulation resolution is 10 s. Open circles (in (a)) show nucleated ice crystals within each simulation step width of Δt = 10 s, and closed circles show the accumulated number concentration of all freshly nucleated ice crystals. (b) Evolution of the ice supersaturation SICE (closed gray circles) and the water activity criterion Δaw (open circles, Eq. 3) during the lofting period. The simulation used the observations shown in Figs. 3a and b and 6a.
As can be seen, 120 m lofting is sufficient to obtain ice crystal number concentrations of the order of 100 L−1 via immersion freezing (ABIFM) and close to 50 L−1 via DIN at temperatures around −50 ∘C and for the simulated PSAC values (Fig. 10a). SICE and Δaw increase during lofting, and threshold values of 1.35–1.36 and 0.22–0.24 must be exceeded before efficient ice nucleation is initiated by the smoke particles via ABIFM. In the case of DIN, a significant increase in the INP number concentration occurred for SICE>1.38–1.4. To initiate homogeneous freezing, SICE values ≥ 1.5 are required at temperatures around −50 ∘C. Ice crystals that are already heterogeneously nucleated and growing will, however, quickly lead to a reduction in SICE, so SICE>1.5 may never be reached, even during very strong updrafts that trigger strong cooling rates. Similar results were obtained in the simulation of the 30 October measurement (not shown here) with a starting height of 10 850 m (located in the uppermost part of the humid layer in Fig. 6b) and a wave amplitude of 190 m. Thus, lofting by about 100–200 m is sufficient to initiate significant heterogeneous ice nucleation.
Finally, it should be mentioned that these simplified simulations were conducted to provide insight in the ability of smoke particles to initiate cirrus formation during the passage of a GW. They do not allow us to draw any conclusion about the further evolution of the cirrus. The latest status of comprehensive cirrus modeling with a focus on the role of heterogeneous ice nucleation may be found in Kärcher et al. (2022). In the case of organic aerosol particles, sophisticated simulations need to include complex aerosol particle compositions and all the potential complex ice nucleation processes due to the amorphous phase transitions of the various organic phases, as discussed in Berkemeier et al. (2014), Zobrist et al. (2008), Knopf et al. (2018), Charnawskas et al. (2017), Wang et al. (2012b), and Lienhard et al. (2015).
Based on lidar observations at Limassol, Cyprus, in the eastern Mediterranean, we found clear evidence for the impact of wildfire smoke on cirrus formation in the tropopause region at −47 to −53 ∘C. Optically dense smoke layers crossed the Mediterranean Basin in October–November 2020. Several observational cases of smoke–cirrus interaction have been discussed. Simplified gravity wave simulations were in line with the observations. Lofting by about 100–200 m was found to be sufficient to initiate significant ice nucleation on the wildfire particles, which mainly contain organic material.
We will continue our research on the impact of wildfire smoke and cirrus evolution processes by analyzing lidar observations in the central Arctic in the framework of the MOSAiC expedition in 2019–2020. We observed more than 50 cirrus systems which evolved in smoke-polluted air (Engelmann et al., 2021; Ansmann et al., 2023). The advantage of the MOSAiC campaign is that, in addition to the lidar-derived INP estimates, the ice crystal number concentration can be obtained from combined radar–lidar observations (Bühl et al., 2019), making closure studies such as that presented by Ansmann et al. (2019a) possible. In this way, more quantitative conclusions regarding INP levels and nucleated ice crystal number concentrations can be drawn. A rigorous uncertainty analysis often does not provide a realistic picture of the true error margins in active remote-sensing applications. Closure studies, which are conducted to determine the consistency among the various result data sets (observations, parameterizations, and simulations), are therefore the most promising way to increase the reliability of observational findings.
In this article, we used a specific INP parameterization developed for organic aerosol particles to describe the ice-nucleating efficiency of aged wildfire smoke particles. Future work must include airborne sampling of aged smoke particles (after long-range transport for weeks or even months), which would allow the multi-modal microspectroscopic analysis and chemical imaging of these aged wildfire smoke particles (Laskin et al., 2016, 2019; Knopf et al., 2014, 2022; Lata et al., 2021), coupled to the laboratory-based characterization of their ice nucleation properties.
Polly lidar observations (level 0 data, measured signals) are available in the PollyNet database (http://polly.tropos.de/, PollyNET, 2023). All the analysis products are available upon request (info@tropos.de). Radiosonde data (Nicosia-Athalassa2023) are available in archived form at https://www.meteociel.fr/observations-meteo/sondage.php?map=1 (Nicosia-Athalassa-RS, 2023). Backward trajectory analysis was performed by air mass transport computation with the NOAA (National Oceanic and Atmospheric Administration) HYSPLIT (HYbrid Single-Particle Lagrangian Integrated Trajectory) model (https://www.ready.noaa.gov/hypub-bin/trajtype.pl?runtype=archive, HYSPLIT, 2023). AERONET observational data can be downloaded from the respective data base (http://aeronet.gsfc.nasa.gov/, AERONET, 2023).
The paper was written by REM and AA with the strong support of DAK. The gravity wave model was developed by AA. The data analysis was performed by KO, REM, and HB. RE, AN, AS, PS, JB, and DE were involved in the instrumentation setup, the calibration and quality tests, and the maintenance of the station. UW and DH are involved in the project EXCELSIOR. All coauthors were actively involved in extended discussions and the elaboration of the final design of the manuscript.
At least one of the (co)authors is a member of the editorial board of Atmospheric Chemistry and Physics.
Publisher’s note: Copernicus Publications remains neutral with regard to jurisdictional claims made in the text, published maps, institutional affiliations, or any other geographical representation in this paper. While Copernicus Publications makes every effort to include appropriate place names, the final responsibility lies with the authors.
We are very grateful to Nicosia–Athalassa radiosonde station for their excellent radiosonde observations and especially to Demitris Charalambous, Meteorology Officer at the Cyprus Department of Meteorology, for the provision of historic data. We also thank the HYSPLIT team for an easy-to-use internet platform.
The research has been supported by the EXCELSIOR (ERATOSTHENES: Excellence Research Centre for Earth Surveillance and Space-Based Monitoring of the Environment) H2020 Widespread Teaming project (http://www.excelisor2020.eu, last access: 27 March 2023). The EXCELSIOR project has received funding from the European Union's Horizon 2020 research and innovation program under grant agreement no. 857510, from the Government of the Republic of Cyprus through the Directorate General for the European Programmes, Coordination and Development, and from the Cyprus University of Technology. The authors acknowledge support through the European Research Infrastructure for the observation of Aerosol, Clouds and Trace Gases (ACTRIS) under grant agreement nos. 654109 and 739530 from the European Union's Horizon 2020 research and innovation program. The PollyXT-CYP was funded by the German Federal Ministry of Education and Research (BMBF) via the PoLiCyTa project (grant no. 01LK1603A). The study is supported by the ACCEPT project (prot. no. LOCALDEV-0008) co-financed by the Financial Mechanism of Norway (85 %) and the Republic of Cyprus (15 %) in the framework of the programming period 2014–2021. The lidar analysis of smoke–cirrus interactions was further supported by BMBF funding of the SCiAMO (Smoke-Cirrus interaction in the Arctic during MOSAiC) project (MOSAIC-FKZ 03F0915A). DAK acknowledges support from the U.S. Department of Energy's (DOE) Atmospheric System Research (ASR) program, Office of Biological and Environmental Research (OBER) (grant no. DE-SC0021034).
The publication of this article was funded by the Open Access Fund of the Leibniz Association.
This paper was edited by Martina Krämer and reviewed by two anonymous referees.
Abatzoglou, J. T., Williams, A. P., and Barbero, R.: Global emergence of anthropogenic climate change in fire weather indices, Geophys. Res. Lett., 46, 326–336, https://doi.org/10.1029/2018GL080959, 2019. a
ACTRIS: Aerosols, Clouds and Trace gases Research InfraStructure home page, https://www.actris.eu/, last access: 27 March 2023. a
AERONET: Aerosol Robotic Network aerosol data base, National Aeronautics and Space Administration (NASA) [data set], http://aeronet.gsfc.nasa.gov/, last access: 27 March 2023. a, b, c
Ansmann, A., Wandinger, U., Riebesell, M., Weitkamp, C., and Michaelis, W.: Independent measurement of extinction and backscatter profiles in cirrus clouds by using a combined Raman elastic–backscatter lidar, Appl. Optics, 31, 7113–7131, https://doi.org/10.1364/AO.31.007113, 1992. a, b
Ansmann, A., Mamouri, R.-E., Bühl, J., Seifert, P., Engelmann, R., Hofer, J., Nisantzi, A., Atkinson, J. D., Kanji, Z. A., Sierau, B., Vrekoussis, M., and Sciare, J.: Ice-nucleating particle versus ice crystal number concentrationin altocumulus and cirrus layers embedded in Saharan dust:a closure study, Atmos. Chem. Phys., 19, 15087–15115, https://doi.org/10.5194/acp-19-15087-2019, 2019a. a, b, c
Ansmann, A., Mamouri, R.-E., Hofer, J., Baars, H., Althausen, D., and Abdullaev, S. F.: Dust mass, cloud condensation nuclei, and ice-nucleating particle profiling with polarization lidar: updated POLIPHON conversion factors from global AERONET analysis, Atmos. Meas. Tech., 12, 4849–4865, https://doi.org/10.5194/amt-12-4849-2019, 2019b. a
Ansmann, A., Ohneiser, K., Mamouri, R.-E., Knopf, D. A., Veselovskii, I., Baars, H., Engelmann, R., Foth, A., Jimenez, C., Seifert, P., and Barja, B.: Tropospheric and stratospheric wildfire smoke profiling with lidar: mass, surface area, CCN, and INP retrieval, Atmos. Chem. Phys., 21, 9779–9807, https://doi.org/10.5194/acp-21-9779-2021, 2021. a, b, c, d, e, f, g, h
Ansmann, A., Ohneiser, K., Engelmann, R., Radenz, M., Griesche, H., Hofer, J., Althausen, D., Creamean, J. M., Boyer, M. C., Knopf, D. A., Dahlke, S., Maturilli, M., Gebauer, H., Bühl, J., Jimenez, C., Seifert, P., and Wandinger, U.: Annual cycle of aerosol properties over the central Arctic during MOSAiC 2019–2020 – light-extinction, CCN, and INP levels from the boundary layer to the tropopause, Atmos. Chem. Phys., 23, 12821–12849, https://doi.org/10.5194/acp-23-12821-2023, 2023. a, b, c
Baars, H., Kanitz, T., Engelmann, R., Althausen, D., Heese, B., Komppula, M., Preißler, J., Tesche, M., Ansmann, A., Wandinger, U., Lim, J.-H., Ahn, J. Y., Stachlewska, I. S., Amiridis, V., Marinou, E., Seifert, P., Hofer, J., Skupin, A., Schneider, F., Bohlmann, S., Foth, A., Bley, S., Pfüller, A., Giannakaki, E., Lihavainen, H., Viisanen, Y., Hooda, R. K., Pereira, S. N., Bortoli, D., Wagner, F., Mattis, I., Janicka, L., Markowicz, K. M., Achtert, P., Artaxo, P., Pauliquevis, T., Souza, R. A. F., Sharma, V. P., van Zyl, P. G., Beukes, J. P., Sun, J., Rohwer, E. G., Deng, R., Mamouri, R.-E., and Zamorano, F.: An overview of the first decade of PollyNET: an emerging network of automated Raman-polarization lidars for continuous aerosol profiling, Atmos. Chem. Phys., 16, 5111–5137, https://doi.org/10.5194/acp-16-5111-2016, 2016. a
Baars, H., Ansmann, A., Ohneiser, K., Haarig, M., Engelmann, R., Althausen, D., Hanssen, I., Gausa, M., Pietruczuk, A., Szkop, A., Stachlewska, I. S., Wang, D., Reichardt, J., Skupin, A., Mattis, I., Trickl, T., Vogelmann, H., Navas-Guzmán, F., Haefele, A., Acheson, K., Ruth, A. A., Tatarov, B., Müller, D., Hu, Q., Podvin, T., Goloub, P., Veselovskii, I., Pietras, C., Haeffelin, M., Fréville, P., Sicard, M., Comerón, A., Fernández García, A. J., Molero Menéndez, F., Córdoba-Jabonero, C., Guerrero-Rascado, J. L., Alados-Arboledas, L., Bortoli, D., Costa, M. J., Dionisi, D., Liberti, G. L., Wang, X., Sannino, A., Papagiannopoulos, N., Boselli, A., Mona, L., D'Amico, G., Romano, S., Perrone, M. R., Belegante, L., Nicolae, D., Grigorov, I., Gialitaki, A., Amiridis, V., Soupiona, O., Papayannis, A., Mamouri, R.-E., Nisantzi, A., Heese, B., Hofer, J., Schechner, Y. Y., Wandinger, U., and Pappalardo, G.: The unprecedented 2017–2018 stratospheric smoke event: decay phase and aerosol properties observed with the EARLINET, Atmos. Chem. Phys., 19, 15183–15198, https://doi.org/10.5194/acp-19-15183-2019, 2019. a, b, c
Baars, H., Radenz, M., Floutsi, A. A., Engelmann, R., Althausen, D., Heese, B., Ansmann, A., Flament, T., Dabas, A., Trapon, D., Reitebuch, O., Bley, S., and Wandinger, U.: Californian wildfire smoke over Europe: A first example of the aerosol observing capabilities of Aeolus compared to ground-based lidar, Geophys. Res. Lett., 48, e2020GL092194, https://doi.org/10.1029/2020GL092194, 2021. a
Barry, K. R., Hill, T. C. J., Levin, E. J. T., Twohy, C. H., Moore, K. A., Weller, Z. D., Toohey, D. W., Reeves, M., Campos, T., Geiss, R., Schill, G. P., Fischer, E. V., Kreidenweis, S. M., and DeMott, P. J.: Observations of Ice Nucleating Particles in the Free Troposphere From Western US Wildfires, J. Geophys. Res.-Atmos., 126, e2020JD033752, https://doi.org/10.1029/2020JD033752, 2021. a
Berkemeier, T., Shiraiwa, M., Pöschl, U., and Koop, T.: Competition between water uptake and ice nucleation by glassy organic aerosol particles, Atmos. Chem. Phys., 14, 12513–12531, https://doi.org/10.5194/acp-14-12513-2014, 2014. a, b, c
Bühl, J., Seifert, P., Radenz, M., Baars, H., and Ansmann, A.: Ice crystal number concentration from lidar, cloud radar and radar wind profiler measurements, Atmos. Meas. Tech., 12, 6601–6617, https://doi.org/10.5194/amt-12-6601-2019, 2019. a
Burton, S. P., Hair, J. W., Kahnert, M., Ferrare, R. A., Hostetler, C. A., Cook, A. L., Harper, D. B., Berkoff, T. A., Seaman, S. T., Collins, J. E., Fenn, M. A., and Rogers, R. R.: Observations of the spectral dependence of linear particle depolarization ratio of aerosols using NASA Langley airborne High Spectral Resolution Lidar, Atmos. Chem. Phys., 15, 13453–13473, https://doi.org/10.5194/acp-15-13453-2015, 2015. a
Charnawskas, J. C., Alpert, P. A., Lambe, A. T., Berkemeier, T., O’Brien, R. E., Massoli, P., Onasch, T. B., Shiraiwa, M., Moffet, R. C., Gilles, M. K., Davidovits, P., Worsnop, D. R., and Knopf, D. A.: Condensed-phase biogenic–anthropogenic interactions with implications for cold cloud formation, Faraday Discuss., 200, 165–194, https://doi.org/10.1039/C7FD00010C, 2017. a, b, c, d, e, f, g
Chou, C., Kanji, Z. A., Stetzer, O., Tritscher, T., Chirico, R., Heringa, M. F., Weingartner, E., Prévôt, A. S. H., Baltensperger, U., and Lohmann, U.: Effect of photochemical ageing on the ice nucleation properties of diesel and wood burning particles, Atmos. Chem. Phys., 13, 761–772, https://doi.org/10.5194/acp-13-761-2013, 2013. a
Dahlkötter, F., Gysel, M., Sauer, D., Minikin, A., Baumann, R., Seifert, P., Ansmann, A., Fromm, M., Voigt, C., and Weinzierl, B.: The Pagami Creek smoke plume after long-range transport to the upper troposphere over Europe – aerosol properties and black carbon mixing state, Atmos. Chem. Phys., 14, 6111–6137, https://doi.org/10.5194/acp-14-6111-2014, 2014. a, b, c
DeMott, P. J., Prenni, A. J., McMeeking, G. R., Sullivan, R. C., Petters, M. D., Tobo, Y., Niemand, M., Möhler, O., Snider, J. R., Wang, Z., and Kreidenweis, S. M.: Integrating laboratory and field data to quantify the immersion freezing ice nucleation activity of mineral dust particles, Atmos. Chem. Phys., 15, 393–409, https://doi.org/10.5194/acp-15-393-2015, 2015. a, b, c
Engelmann, R., Kanitz, T., Baars, H., Heese, B., Althausen, D., Skupin, A., Wandinger, U., Komppula, M., Stachlewska, I. S., Amiridis, V., Marinou, E., Mattis, I., Linné, H., and Ansmann, A.: The automated multiwavelength Raman polarization and water-vapor lidar PollyXT: the neXT generation, Atmos. Meas. Tech., 9, 1767–1784, https://doi.org/10.5194/amt-9-1767-2016, 2016. a, b
Engelmann, R., Ansmann, A., Ohneiser, K., Griesche, H., Radenz, M., Hofer, J., Althausen, D., Dahlke, S., Maturilli, M., Veselovskii, I., Jimenez, C., Wiesen, R., Baars, H., Bühl, J., Gebauer, H., Haarig, M., Seifert, P., Wandinger, U., and Macke, A.: Wildfire smoke, Arctic haze, and aerosol effects on mixed-phase and cirrus clouds over the North Pole region during MOSAiC: an introduction, Atmos. Chem. Phys., 21, 13397–13423, https://doi.org/10.5194/acp-21-13397-2021, 2021. a, b
Fernald, F. G.: Analysis of atmospheric lidar observations: some comments, Appl. Optics, 23, 652–653, https://doi.org/10.1364/AO.23.000652, 1984. a
Floutsi, A. A., Baars, H., Radenz, M., Haarig, M., Yin, Z., Seifert, P., Jimenez, C., Ansmann, A., Engelmann, R., Barja, B., Zamorano, F., and Wandinger, U.: Advection of Biomass Burning Aerosols towards the Southern Hemispheric Mid-Latitude Station of Punta Arenas as Observed with Multiwavelength Polarization Raman Lidar, Remote Sens., 13, 138, https://doi.org/10.3390/rs13010138, 2021. a
Foth, A., Kanitz, T., Engelmann, R., Baars, H., Radenz, M., Seifert, P., Barja, B., Fromm, M., Kalesse, H., and Ansmann, A.: Vertical aerosol distribution in the southern hemispheric midlatitudes as observed with lidar in Punta Arenas, Chile (53.2∘ S and 70.9∘ W), during ALPACA, Atmos. Chem. Phys., 19, 6217–6233, https://doi.org/10.5194/acp-19-6217-2019, 2019. a
Froyd, K. D., Murphy, D. M., Lawson, P., Baumgardner, D., and Herman, R. L.: Aerosols that form subvisible cirrus at the tropical tropopause, Atmos. Chem. Phys., 10, 209–218, https://doi.org/10.5194/acp-10-209-2010, 2010. a
Froyd, K. D., Yu, P., Schill, G. P., Brock, C. A., Kupc, A., Williamson, C. J., Jensen, E. J., Ray, E., Rosenlof, K. H., Bian, H., Darmenov, A. S., Colarco, P. R., Diskin, G. S., Bui, T., and Murphy, D. M.: Dominant role of mineral dust in cirrus cloud formation revealed by global-scale measurements, Nat. Geosci., 15, 177–183, https://doi.org/10.1038/s41561-022-00901-w, 2022. a, b
Gialitaki, A., Tsekeri, A., Amiridis, V., Ceolato, R., Paulien, L., Kampouri, A., Gkikas, A., Solomos, S., Marinou, E., Haarig, M., Baars, H., Ansmann, A., Lapyonok, T., Lopatin, A., Dubovik, O., Groß, S., Wirth, M., Tsichla, M., Tsikoudi, I., and Balis, D.: Is the near-spherical shape the “new black” for smoke?, Atmos. Chem. Phys., 20, 14005–14021, https://doi.org/10.5194/acp-20-14005-2020, 2020. a
Haarig, M., Ansmann, A., Baars, H., Jimenez, C., Veselovskii, I., Engelmann, R., and Althausen, D.: Depolarization and lidar ratios at 355, 532, and 1064 nm and microphysical properties of aged tropospheric and stratospheric Canadian wildfire smoke, Atmos. Chem. Phys., 18, 11847–11861, https://doi.org/10.5194/acp-18-11847-2018, 2018. a, b, c, d
Heymsfield, A. J. and Miloshevich, L. M.: Relative Humidity and Temperature Influences on Cirrus Formation and Evolution: Observations from Wave Clouds and FIRE II, J. Atmos. Sci., 52, 4302–4326, https://doi.org/10.1175/1520-0469(1995)052<4302:RHATIO>2.0.CO;2, 1995. a
Hodzic, A., Campuzano-Jost, P., Bian, H., Chin, M., Colarco, P. R., Day, D. A., Froyd, K. D., Heinold, B., Jo, D. S., Katich, J. M., Kodros, J. K., Nault, B. A., Pierce, J. R., Ray, E., Schacht, J., Schill, G. P., Schroder, J. C., Schwarz, J. P., Sueper, D. T., Tegen, I., Tilmes, S., Tsigaridis, K., Yu, P., and Jimenez, J. L.: Characterization of organic aerosol across the global remote troposphere: a comparison of ATom measurements and global chemistry models, Atmos. Chem. Phys., 20, 4607–4635, https://doi.org/10.5194/acp-20-4607-2020, 2020. a
Hofer, J., Althausen, D., Abdullaev, S. F., Makhmudov, A. N., Nazarov, B. I., Schettler, G., Engelmann, R., Baars, H., Fomba, K. W., Müller, K., Heinold, B., Kandler, K., and Ansmann, A.: Long-term profiling of mineral dust and pollution aerosol with multiwavelength polarization Raman lidar at the Central Asian site of Dushanbe, Tajikistan: case studies, Atmos. Chem. Phys., 17, 14559–14577, https://doi.org/10.5194/acp-17-14559-2017, 2017. a, b
Holben, B. N., Eck, T. F., Slutsker, I., Tanré, D., Buis, J. P., Setzer, A., Vermote, E., Reagan, J. A., Kaufman, Y. J., Nakajima, T., Lavenu, F., Jankowiak, I., and Smirnov, A.: AERONET – A federated instrument network and data archive for aerosol characterization, Remote Sens. Environ., 66, 1–16, https://doi.org/10.1016/S0034-4257(98)00031-5, 1998. a
Hu, Q., Goloub, P., Veselovskii, I., and Podvin, T.: The characterization of long-range transported North American biomass burning plumes: what can a multi-wavelength Mie–Raman-polarization-fluorescence lidar provide?, Atmos. Chem. Phys., 22, 5399–5414, https://doi.org/10.5194/acp-22-5399-2022, 2022. a, b
HYSPLIT: HYbrid Single-Particle Lagrangian Integrated Trajectory model, backward trajectory calculation tool, National Oceanic and Atmospheric Administration (NOAA) [code], https://www.ready.noaa.gov/hypub-bin/trajtype.pl?runtype=archive, last access: 27 March 2023. a, b
Jahl, L. G., Brubaker, T. A., Polen, M. J., Jahn, L. G., Cain, K. P., Bowers, B. B., Fahy, W. D., Graves, S., and Sullivan, R. C.: Atmospheric aging enhances the ice nucleation ability of biomass-burning aerosol, Sci. Adv., 7, eabd3440, https://doi.org/10.1126/sciadv.abd3440, 2021. a
Jahn, L. G., Polen, M. J., Jahl, L. G., Brubaker, T. A., Somers, J., and Sullivan, R. C.: Biomass combustion produces ice-active minerals in biomass-burning aerosol and bottom ash, P. Natl. Acad. Sci. USA, 117, 21928–21937, https://doi.org/10.1073/pnas.1922128117, 2020. a, b, c
Jimenez, C., Ansmann, A., Engelmann, R., Donovan, D., Malinka, A., Seifert, P., Wiesen, R., Radenz, M., Yin, Z., Bühl, J., Schmidt, J., Barja, B., and Wandinger, U.: The dual-field-of-view polarization lidar technique: a new concept in monitoring aerosol effects in liquid-water clouds – case studies, Atmos. Chem. Phys., 20, 15265–15284, https://doi.org/10.5194/acp-20-15265-2020, 2020. a, b
Jolly, W. M., Cochrane, M. A., Freeborn, P. H., Holden, Z. A., Brown, T. J., Williamson, G. J., and Bowman, D. M. J. S.: Climate-induced variations in global wildfire danger from 1979 to 2013, Nat. Commun., 6, 7537, https://doi.org/10.1038/ncomms8537, 2015. a
Kalesse, H. and Kollias, P.: Climatology of high cloud dynamics using profiling ARM Doppler radar observations, J. Climate, 26, 6340–6359, https://doi.org/10.1175/JCLI-D-12-00695.1, 2013. a
Kanji, Z. A., Ladino, L. A., Wex, H., Boose, Y., Burkert-Kohn, M., Cziczo, D. J., and Krämer, M.: Overview of ice nucleating particles, Meteor. Mon., 58, 1–33, https://doi.org/10.1175/AMSMONOGRAPHS-D-16-0006.1, 2017. a
Kärcher, B. and Podglajen, A.: A Stochastic Representation of Temperature Fluctuations Induced by Mesoscale Gravity Waves, J. Geophys. Res.-Atmos., 124, 11506–11529, https://doi.org/10.1029/2019JD030680, 2019. a
Kärcher, B., DeMott, P. J., Jensen, E. J., and Harrington, J. Y.: Studies on the Competition Between Homogeneous and Heterogeneous Ice Nucleation in Cirrus Formation, J. Geophys. Res.-Atmos., 127, e2021JD035805, https://doi.org/10.1029/2021JD035805, 2022. a, b, c
Kilchhofer, K., Mahrt, F., and Kanji, Z. A.: The Role of Cloud Processing for the Ice Nucleating Ability of Organic Aerosol and Coal Fly Ash Particles, J. Geophys. Res.-Atmos., 126, e2020JD033338, https://doi.org/10.1029/2020JD033338, 2021. a, b, c
Kim, J.-E., Alexander, M. J., Bui, T. P., Dean-Day, J. M., Lawson, R. P., Woods, S., Hlavka, D., Pfister, L., and Jensen, E. J.: Ubiquitous influence of waves on tropical high cirrus clouds, Geophys. Res. Lett., 43, 5895–5901, https://doi.org/10.1002/2016GL069293, 2016. a
Kirchmeier-Young, M. C., Gillett, N. P., Zwiers, F. W., Cannon, A. J., and Anslow, F. S.: Attribution of the influence of human- induced climate change on an extreme fire season, Earths Future, 7, 2–10, https://doi.org/10.1029/2018EF001050, 2019. a
Klett, J. D.: Stable analytic inversion solution for processing lidar returns, Appl. Optics, 20, 211–220, https://doi.org/10.1364/AO.20.000211, 1981. a
Kloss, C., Berthet, G., Sellitto, P., Ploeger, F., Bucci, S., Khaykin, S., Jégou, F., Taha, G., Thomason, L. W., Barret, B., Le Flochmoen, E., von Hobe, M., Bossolasco, A., Bègue, N., and Legras, B.: Transport of the 2017 Canadian wildfire plume to the tropics via the Asian monsoon circulation, Atmos. Chem. Phys., 19, 13547–13567, https://doi.org/10.5194/acp-19-13547-2019, 2019. a
Knopf, D. A. and Alpert, P. A.: A water activity based model of heterogeneous ice nucleation kinetics for freezing of water and aqueous solution droplets, Farad. Discuss., 165, 513–534, https://doi.org/10.1039/c3fd00035d, 2013. a, b
Knopf, D. A. and Alpert, P. A.: Atmospheric ice nucleation, Nature Reviews Physics, 5, 203–217, https://doi.org/10.1038/s42254-023-00570-7, 2023. a, b, c, d
Knopf, D. A., Alpert, P. A., Wang, B., O'Brien, R. E., Kelly, S. T., Laskin, A., Gilles, M. K., and Moffet, R. C.: Microspectroscopic imaging and characterization of individually identified ice nucleating particles from a case field study, J. Geophys. Res.-Atmos., 119, 10365–10381, https://doi.org/10.1002/2014JD021866, 2014. a
Knopf, D. A., Alpert, P. A., and Wang, B.: The role of organic aerosol in atmospheric ice nucleation: a review, ACS Earth Space Chem., 2, 168–202, https://doi.org/10.1021/acsearthspacechem.7b00120, 2018. a, b, c, d, e, f
Knopf, D. A., Charnawskas, J. C., Wang, P., Wong, B., Tomlin, J. M., Jankowski, K. A., Fraund, M., Veghte, D. P., China, S., Laskin, A., Moffet, R. C., Gilles, M. K., Aller, J. Y., Marcus, M. A., Raveh-Rubin, S., and Wang, J.: Micro-spectroscopic and freezing characterization of ice-nucleating particles collected in the marine boundary layer in the eastern North Atlantic, Atmos. Chem. Phys., 22, 5377–5398, https://doi.org/10.5194/acp-22-5377-2022, 2022. a
Koop, T.: Homogeneous Ice Nucleation in Water and Aqueous Solutions, Z. Phys. Chem., 218, 1231–1258, https://doi.org/10.1524/zpch.218.11.1231.50812, 2004. a
Koop, T., Luo, B. P., Tsias, A., and Peter, T.: Water activity as the determinant for homogeneous ice nucleation in aqueous solutions, Nature, 406, 611–614, https://doi.org/10.1038/35020537, 2000. a, b
Koop, T., Bookhold, J., Shiraiwa, M., and Pöschl, U.: Glass transition and phase state of organic compounds: dependency on molecular properties and implications for secondary organic aerosols in the atmosphere, Phys. Chem. Chem. Phys., 13, 19238–19255, https://doi.org/10.1039/C1CP22617G, 2011. a
Laskin, A., Gilles, M. K., Knopf, D. A., Wang, B., and China, S.: Progress in the Analysis of Complex Atmospheric Particles, Annu. Rev. Anal. Chem., 9, 117–143, https://doi.org/10.1146/annurev-anchem-071015-041521, 2016. a
Laskin, A., Moffet, R. C., and Gilles, M. K.: Chemical Imaging of Atmospheric Particles, Accounts Chem. Res., 52, 3419–3431, https://doi.org/10.1021/acs.accounts.9b00396, 2019. a
Lata, N. N., Zhang, B., Schum, S., Mazzoleni, L., Brimberry, R., Marcus, M. A., Cantrell, W. H., Fialho, P., Mazzoleni, C., and China, S.: Aerosol Composition, Mixing State, and Phase State of Free Tropospheric Particles and Their Role in Ice Cloud Formation, ACS Earth Space Chem., 5, 3499–3510, https://doi.org/10.1021/acsearthspacechem.1c00315, 2021. a
Lienhard, D. M., Huisman, A. J., Krieger, U. K., Rudich, Y., Marcolli, C., Luo, B. P., Bones, D. L., Reid, J. P., Lambe, A. T., Canagaratna, M. R., Davidovits, P., Onasch, T. B., Worsnop, D. R., Steimer, S. S., Koop, T., and Peter, T.: Viscous organic aerosol particles in the upper troposphere: diffusivity-controlled water uptake and ice nucleation?, Atmos. Chem. Phys., 15, 13599–13613, https://doi.org/10.5194/acp-15-13599-2015, 2015. a
Mamouri, R.-E. and Ansmann, A.: Potential of polarization lidar to provide profiles of CCN- and INP-relevant aerosol parameters, Atmos. Chem. Phys., 16, 5905–5931, https://doi.org/10.5194/acp-16-5905-2016, 2016. a, b
Mamouri, R.-E. and Ansmann, A.: Potential of polarization/Raman lidar to separate fine dust, coarse dust, maritime, and anthropogenic aerosol profiles, Atmos. Meas. Tech., 10, 3403–3427, https://doi.org/10.5194/amt-10-3403-2017, 2017. a
Mamouri, R. E., Ansmann, A., Nisantzi, A., Kokkalis, P., Schwarz, A., and Hadjimitsis, D.: Low Arabian dust extinction-to-backscatter ratio, Geophys. Res. Lett., 40, 4762–4766, https://doi.org/10.1002/grl.50898, 2013. a
Mamouri, R.-E., Ansmann, A., Nisantzi, A., Solomos, S., Kallos, G., and Hadjimitsis, D. G.: Extreme dust storm over the eastern Mediterranean in September 2015: satellite, lidar, and surface observations in the Cyprus region, Atmos. Chem. Phys., 16, 13711–13724, https://doi.org/10.5194/acp-16-13711-2016, 2016. a
Marcolli, C.: Deposition nucleation viewed as homogeneous or immersion freezing in pores and cavities, Atmos. Chem. Phys., 14, 2071–2104, https://doi.org/10.5194/acp-14-2071-2014, 2014. a
Mardi, A. H., Dadashazar, H., MacDonald, A. B., Braun, R. A., Crosbie, E., Xian, P., Thorsen, T. J., Coggon, M. M., Fenn, M. A., Ferrare, R. A., Hair, J. W., Woods, R. K., Jonsson, H. H., Flagan, R. C., Seinfeld, J. H., and Sorooshian, A.: Biomass Burning Plumes in the Vicinity of the California Coast: Airborne Characterization of Physicochemical Properties, Heating Rates, and Spatiotemporal Features, J. Geophys. Res.-Atmos., 123, 13560–13582, https://doi.org/10.1029/2018JD029134, 2018. a
Marinou, E., Tesche, M., Nenes, A., Ansmann, A., Schrod, J., Mamali, D., Tsekeri, A., Pikridas, M., Baars, H., Engelmann, R., Voudouri, K.-A., Solomos, S., Sciare, J., Groß, S., Ewald, F., and Amiridis, V.: Retrieval of ice-nucleating particle concentrations from lidar observations and comparison with UAV in situ measurements, Atmos. Chem. Phys., 19, 11315–11342, https://doi.org/10.5194/acp-19-11315-2019, 2019. a
Mattis, I., Müller, D., Ansmann, A., Wandinger, U., Preißler, J., Seifert, P., and Tesche, M.: Ten years of multiwavelength Raman lidar observations of free-tropospheric aerosol layers over central Europe: Geometrical properties and annual cycle, J. Geophys. Res.-Atmos., 113, D20202, https://doi.org/10.1029/2007JD009636, 2008. a
Michailidis, K., Koukouli, M.-E., Balis, D., Veefkind, J. P., de Graaf, M., Mona, L., Papagianopoulos, N., Pappalardo, G., Tsikoudi, I., Amiridis, V., Marinou, E., Gialitaki, A., Mamouri, R.-E., Nisantzi, A., Bortoli, D., João Costa, M., Salgueiro, V., Papayannis, A., Mylonaki, M., Alados-Arboledas, L., Romano, S., Perrone, M. R., and Baars, H.: Validation of the TROPOMI/S5P aerosol layer height using EARLINET lidars, Atmos. Chem. Phys., 23, 1919–1940, https://doi.org/10.5194/acp-23-1919-2023, 2023. a, b, c
Murray, B. J., Wilson, T. W., Dobbie, S., and Cui, Z.: Heterogeneous nucleation of ice particles on glassy aerosols under cirrus conditions, Nat. Geosci., 3, 233–237, https://doi.org/10.1038/ngeo817, 2010. a, b, c, d, e
Nicosia-Athalassa-RS: Athalassa Radiosonde Station, Cyprus, profile data, Meteorological Service Cyprus [data set], https://www.meteociel.fr/observations-meteo/sondage.php?map=1, last access: 23 March 2023. a, b
Nisantzi, A., Mamouri, R. E., Ansmann, A., and Hadjimitsis, D.: Injection of mineral dust into the free troposphere during fire events observed with polarization lidar at Limassol, Cyprus, Atmos. Chem. Phys., 14, 12155–12165, https://doi.org/10.5194/acp-14-12155-2014, 2014. a, b
Nisantzi, A., Mamouri, R. E., Ansmann, A., Schuster, G. L., and Hadjimitsis, D. G.: Middle East versus Saharan dust extinction-to-backscatter ratios, Atmos. Chem. Phys., 15, 7071–7084, https://doi.org/10.5194/acp-15-7071-2015, 2015. a
Ohneiser, K., Ansmann, A., Baars, H., Seifert, P., Barja, B., Jimenez, C., Radenz, M., Teisseire, A., Floutsi, A., Haarig, M., Foth, A., Chudnovsky, A., Engelmann, R., Zamorano, F., Bühl, J., and Wandinger, U.: Smoke of extreme Australian bushfires observed in the stratosphere over Punta Arenas, Chile, in January 2020: optical thickness, lidar ratios, and depolarization ratios at 355 and 532 nm, Atmos. Chem. Phys., 20, 8003–8015, https://doi.org/10.5194/acp-20-8003-2020, 2020. a, b, c, d, e
Ohneiser, K., Ansmann, A., Chudnovsky, A., Engelmann, R., Ritter, C., Veselovskii, I., Baars, H., Gebauer, H., Griesche, H., Radenz, M., Hofer, J., Althausen, D., Dahlke, S., and Maturilli, M.: The unexpected smoke layer in the High Arctic winter stratosphere during MOSAiC 2019–2020, Atmos. Chem. Phys., 21, 15783–15808, https://doi.org/10.5194/acp-21-15783-2021, 2021. a, b, c, d, e
Ohneiser, K., Ansmann, A., Kaifler, B., Chudnovsky, A., Barja, B., Knopf, D. A., Kaifler, N., Baars, H., Seifert, P., Villanueva, D., Jimenez, C., Radenz, M., Engelmann, R., Veselovskii, I., and Zamorano, F.: Australian wildfire smoke in the stratosphere: the decay phase in 2020/2021 and impact on ozone depletion, Atmos. Chem. Phys., 22, 7417–7442, https://doi.org/10.5194/acp-22-7417-2022, 2022. a, b, c, d, e
Ohneiser, K., Ansmann, A., Witthuhn, J., Deneke, H., Chudnovsky, A., Walter, G., and Senf, F.: Self-lofting of wildfire smoke in the troposphere and stratosphere: simulations and space lidar observations, Atmos. Chem. Phys., 23, 2901–2925, https://doi.org/10.5194/acp-23-2901-2023, 2023. a, b
Oraltay, R. and Hallett, J.: Scavenging of soot particles by ice crystals, J. Aerosol Sci., 21, S263–S266, https://doi.org/10.1016/0021-8502(90)90234-O, 1990. a
Peterson, D. A., Campbell, J. R., Hyer, E. J., Fromm, M. D., Kablick, G. P., Cossuth, J. H., and DeLand, M. T.: Wildfire-driven thunderstorms cause a volcano-like stratospheric injection of smoke, npj Clim. Atmos. Sci., 1, 30, https://doi.org/10.1038/s41612-018-0039-3, 2018. a
Peterson, D. A., Fromm, M. D., McRae, R. H. D., Campbell, J. R., Hyer, E. J., Taha, G., Camacho, C. P., Kablick, G. P., Schmidt, C. C., and DeLand, M. T.: Australia’s Black Summer pyrocumulonimbus super outbreak reveals potential for increasingly extreme stratospheric smoke events, npj Clim. Atmos. Sci., 4, 38, https://doi.org/10.1038/s41612-021-00192-9, 2021. a
PollyNET: PollyNET lidar data base, Leibniz Institute for Tropospheric Research [data set], http://polly.tropos.de/, last access: 27 March 2023. a, b
Radenz, M., Bühl, J., Seifert, P., Baars, H., Engelmann, R., Barja González, B., Mamouri, R.-E., Zamorano, F., and Ansmann, A.: Hemispheric contrasts in ice formation in stratiform mixed-phase clouds: disentangling the role of aerosol and dynamics with ground-based remote sensing, Atmos. Chem. Phys., 21, 17969–17994, https://doi.org/10.5194/acp-21-17969-2021, 2021. a
Rieger, L. A., Randel, W. J., Bourassa, A. E., and Solomon, S.: Stratospheric temperature and ozone anomalies associated with the 2020 Australian New Year fires, Geophys. Res. Lett., 48, e2021GL095898, https://doi.org/10.1029/2021GL095898, 2021. a
Rigg, Y. J., Alpert, P. A., and Knopf, D. A.: Immersion freezing of water and aqueous ammonium sulfate droplets initiated by humic-like substances as a function of water activity, Atmos. Chem. Phys., 13, 6603–6622, https://doi.org/10.5194/acp-13-6603-2013, 2013. a
Rolph, G., Stein, A., and Stunder, B.: Real-time Environmental Applications and Display sYstem: READY, Environ. Model. Softw., 95, 210–228, https://doi.org/10.1016/j.envsoft.2017.06.025, 2017. a
Safford, H. D., Paulson, A. K., Steel, Z. L., Young, D. J. N., and Wayman, R. B.: The 2020 California fire season: A year like no other, a return to the past or a harbinger of the future?, Global Ecol. Biogeogr., 31, 2005–2025, https://doi.org/10.1111/geb.13498, 2022. a
Santachiara, G., Piazza, M., and Belosi, F.: Aerosol scavenging during the early growth stage of ice crystal formation, Atmospheric and Climate Sciences, 8, 395–409, https://doi.org/10.4236/acs.2018.84026, 2018. a
Schill, G. P., Froyd, K. D., Bian, H., Kupc, A., Williamson, C., Brock, C. A., Ray, E., Hornbrook, R. S., Hills, A. J., Apel, E. C., Chin, M., Colarco, P. R., and Murphy, D. M.: Widespread biomass burning smoke throughout the remote troposphere, Nat. Geosci., 13, 422–427, https://doi.org/10.1038/s41561-020-0586-1, 2020. a
Schumann, U., Mayer, B., Gierens, K., Unterstrasser, S., Jessberger, P., Petzold, A., Voigt, C., and Gayet, J.-F.: Effective Radius of Ice Particles in Cirrus and Contrails, J. Atmos. Sci., 68, 300–321, https://doi.org/10.1175/2010JAS3562.1, 2011. a
Seifert, P., Ansmann, A., Mattis, I., Wandinger, U., Tesche, M., Engelmann, R., Müller, D., Pérez, C., and Haustein, K.: Saharan dust and heterogeneous ice formation: Eleven years of cloud observations at a central European EARLINET site, J. Geophys. Res.-Atmos., 115, D20201, https://doi.org/10.1029/2009JD013222, 2010. a, b
Seifert, P., Ansmann, A., Groß, S., Freudenthaler, V., Heinold, B., Hiebsch, A., Mattis, I., Schmidt, J., Schnell, F., Tesche, M., Wandinger, U., and Wiegner, M.: Ice formation in ash-influenced clouds after the eruption of the Eyjafjallajökull volcano in April 2010, J. Geophys. Res.-Atmos., 116, D00U04, https://doi.org/10.1029/2011JD015702, 2011. a, b
Stein, A. F., Draxler, R. R., Rolph, G. D., Stunder, B. J. B., Cohen, M. D., and Ngan, F.: NOAA's HYSPLIT Atmospheric Transport and Dispersion Modeling System, B. Am. Meteorol. Soc., 96, 2059–2077, https://doi.org/10.1175/BAMS-D-14-00110.1, 2015. a
Thomas, L., Cartwright, J. C., and Wareing, D. P.: Lidar observations of the horizontal orientation of ice crystals in cirrus clouds, Tellus B, 42, 211–216, https://doi.org/10.1034/j.1600-0889.1990.00001.x-i1, 1990. a
Torres, O., Jethva, H., Ahn, C., Jaross, G., and Loyola, D. G.: TROPOMI aerosol products: evaluation and observations of synoptic-scale carbonaceous aerosol plumes during 2018–2020, Atmos. Meas. Tech., 13, 6789–6806, https://doi.org/10.5194/amt-13-6789-2020, 2020. a
Vaughan, G., Draude, A. P., Ricketts, H. M. A., Schultz, D. M., Adam, M., Sugier, J., and Wareing, D. P.: Transport of Canadian forest fire smoke over the UK as observed by lidar, Atmos. Chem. Phys., 18, 11375–11388, https://doi.org/10.5194/acp-18-11375-2018, 2018. a
Veselovskii, I., Hu, Q., Ansmann, A., Goloub, P., Podvin, T., and Korenskiy, M.: Fluorescence lidar observations of wildfire smoke inside cirrus: a contribution to smoke–cirrus interaction research, Atmos. Chem. Phys., 22, 5209–5221, https://doi.org/10.5194/acp-22-5209-2022, 2022. a
Wagner, R., Jähn, M., and Schepanski, K.: Wildfires as a source of airborne mineral dust – revisiting a conceptual model using large-eddy simulation (LES), Atmos. Chem. Phys., 18, 11863–11884, https://doi.org/10.5194/acp-18-11863-2018, 2018. a
Wandinger, U.: Multiple-scattering influence on extinction- and backscatter-coefficient measurements with Raman and high-spectral-resolution lidars, Appl. Optics, 37, 417–427, https://doi.org/10.1364/AO.37.000417, 1998. a
Wang, B. and Knopf, D. A.: Heterogeneous ice nucleation on particles composed of humic‐like substances impacted by O3, J. Geophys. Res.-Atmos., 116, D03205, https://doi.org/10.1029/2010JD014964, 2011. a, b, c, d
Wang, B., Laskin, A., Roedel, T., Gilles, M. K., Moffet, R. C., Tivanski, A. V., and Knopf, D. A.: Heterogeneous ice nucleation and water uptake by field-collected atmospheric particles below 273 K, J. Geophys. Res.-Atmos., 117, D00V19, https://doi.org/10.1029/2012JD017446, 2012a. a
Wang, B., Lambe, A. T., Massoli, P., Onasch, T. B., Davidovits, P., Worsnop, D. R., and Knopf, D. A.: The deposition ice nucleation and immersion freezing potential of amorphous secondary organic aerosol: Pathways for ice and mixed-phase cloud formation, J. Geophys. Res.-Atmos., 117, D16209, https://doi.org/10.1029/2012JD018063, 2012b. a, b, c, d, e, f
Yu, P., Toon, O. B., Bardeen, C. G., Zhu, Y., Rosenlof, K. H., Portmann, R. W., Thornberry, T. D., Gao, R.-S., Davis, S. M., Wolf, E. T., de Gouw, J., Peterson, D. A., Fromm, M. D., and Robock, A.: Black carbon lofts wildfire smoke high into the stratosphere to form a persistent plume, Science, 365, 587–590, https://doi.org/10.1126/science.aax1748, 2019. a
Zhao, B., Liou, K.-N., Gu, Y., Jiang, J. H., Li, Q., Fu, R., Huang, L., Liu, X., Shi, X., Su, H., and He, C.: Impact of aerosols on ice crystal size, Atmos. Chem. Phys., 18, 1065–1078, https://doi.org/10.5194/acp-18-1065-2018, 2018. a
Zobrist, B., Marcolli, C., Pedernera, D. A., and Koop, T.: Do atmospheric aerosols form glasses?, Atmos. Chem. Phys., 8, 5221–5244, https://doi.org/10.5194/acp-8-5221-2008, 2008. a, b