the Creative Commons Attribution 4.0 License.
the Creative Commons Attribution 4.0 License.
 | 07 Nov 2023
Secondary aerosol formation during a special dust transport event: impacts from unusually enhanced ozone and dust backflows over the ocean
Da Lu
Hao Li
Mengke Tian
Guochen Wang
Xiaofei Qin
Na Zhao
Juntao Huo
Fan Yang
Yanfen Lin
Jia Chen
Qingyan Fu
Yusen Duan
Xinyi Dong
Congrui Deng
Sabur F. Abdullaev
Kan Huang
In the autumn of 2019, a 5 d long-lasting dust event was observed using a synergy of field measurement techniques in Shanghai. This particular dust event stood out from others due to its unique characteristics, including low wind speed, high relative humidity, elevated levels of gaseous precursors, and contrasting wind patterns at different altitudes. During this event, three distinct dust stages were identified. The first stage was a typical dust invasion characterized by high concentrations of particulate matters but relatively short duration. In contrast, the second stage exhibited an unusual enhancement of ozone, attributed to compound causes of a weak synoptic system, transport from the ocean, and subsidence of high-altitude ozone downdrafted by dust. Consequently, gas-phase oxidation served as the major formation pathway of sulfate and nitrate. In the third stage of dust, a noteworthy phenomenon known as dust backflow occurred. The dust plume originated from the Shandong Peninsula and slowly drifted over the Yellow Sea and the East China Sea before eventually returning to Shanghai. Evidence of this backflow was found through the enrichment of marine vessel emissions (V and Ni) and increased solubility of calcium. Under the influence of humid oceanic breezes, the formation of nitrate was dominated by aqueous processing. Additionally, parts of nitrate and sulfate were directly transported via sea salts, evidenced by their co-variation with Na+ and confirmed through thermodynamic modeling. The uptake of NH3 on particles, influenced by the contributions of alkali metal ions and aerosol pH, regulated the formation potential of secondary aerosol. By developing an upstream–receptor relationship method, the quantities of transported and secondarily formed aerosol species were separated. This study highlights that the transport pathway of dust, coupled with environmental conditions, can significantly modify the aerosol properties, especially at the complex land–sea interface.
- Article
(6180 KB) - Full-text XML
-
Supplement
(1342 KB) - BibTeX
- EndNote


Dust serves as a significant natural source of aerosols, constituting approximately half of the tropospheric aerosols (Zheng et al., 2016). Dust aerosols play crucial roles in environmental and climatic changes by affecting the radiation balance (Feng et al., 2020; Nagashima et al., 2016; Goodman et al., 2019). The optical properties of dust aerosols are influenced by various parameters of iron oxides, including refractive indices, size distributions, and mineralogical compositions. Consequently, these factors introduce potential uncertainties regarding the role of dust in climate forcing (Zhang et al., 2015; Jeong, 2008). Furthermore, dust aerosols have important impacts on tropospheric chemistry by participating in heterogeneous and photolysis reactions in the atmosphere (Wang et al., 2014; Liu et al., 2018). During transport, dust can mix with gaseous pollutants, toxic metals, and soot, thereby affecting air quality immediately and potentially posing public health hazards (Liu et al., 2021; Wang et al., 2021). Moreover, Barkley et al. (2021) found that iron-containing aerosols transported from Africa to the equatorial North Atlantic Ocean provided plentiful nutrients to algae in the ocean and accumulated inside algae.
The irregular shapes of dust particles provide an efficient medium for heterogeneous reactions with NO2, O3, SO2, and NH3, thereby altering the particle size spectrum, hygroscopicity, and radiative properties (Hsu et al., 2014; Tian et al., 2021; Jiang et al., 2018). Jiang et al. (2018) observed a significant increase in nitrate and sulfate concentrations during a dust period in March 2010 in Shanghai. This elevation was attributed to the presence of moderate to high levels of relative humidity and gaseous precursors, implying that dust can efficiently promote the formation of sulfate and nitrate. Previous studies have revealed that HNO3 formed through the reactions of NO2 with hydroxyl radicals or N2O5 hydrolysis preferentially reacts with mineral dust particles and produces nitrate, which serves as the primary source of nitrate during dust episodes (Tang et al., 2016; Wu et al., 2020). Improvements in the simulation of sulfate were achieved by employing various parameterization schemes for the heterogeneous uptake of SO2 on natural dust surfaces in the presence of NH3 and NO2 under different relative humidity conditions (Zhang et al., 2019). Wang et al. (2018) simulated heterogeneous reactions on dust and found they accounted for the majority of nitrate over the Yellow Sea and the East China Sea during the dust long-range transport. Tang et al. (2017) conducted a comprehensive review on the effect of dust heterogeneous reactions on the tropospheric oxidation capacity. They proposed that high RH (> 80 %) and a wider range of temperature should be considered in the laboratory studies of heterogeneous reactions of mineral dust. Additionally, more comprehensive kinetic models should be developed to understand the complex multiphase reactions.
Controversies have arisen regarding the mixing of dust and anthropogenic aerosols. Zhang et al. (2005) found that anthropogenic aerosols separated from dust during a dust event in Qingdao, China. Coincidentally, a time lag between dust and anthropogenic aerosols was observed in Japan and South Korea downstream of the dust transport. Single-particle analysis revealed that sulfate in fine particles appeared 12 h before the dust arrival in Japan. Wang et al. (2013) also observed a lag of 10–12 h between dust and anthropogenic aerosols on a dust day in Shanghai (Wang et al., 2013). Furthermore, Huang et al. (2019) documented vertical differences in long-distance-transported aerosols during a pollution event in Taiwan. Dust from the Gobi Desert in Inner Mongolia and China existed at the altitudes of 0.8 and 1.90 km, respectively, while biomass burning aerosols from South Asia were present at the higher altitude of 3.5 km.
Coastal regions often experience a mixture of inland anthropogenic emissions and releases from the ocean, making regional pollution complex in these areas (Wang et al., 2022; Hilario et al., 2020; Patel and Rastogi, 2020; Perez et al., 2016; Wang et al., 2017). The eastern coast of China, bordering the East China Sea and the Yellow Sea, is particularly influenced by the Asian monsoon and high emissions from inland industries, resulting in highly intricate meteorological and pollution conditions (Hilario et al., 2020). Furthermore, the marine boundary layer in this region exhibits significant seasonal and diurnal variations in relative humidity and temperature, further impacting photochemical processes and heterogeneous reactions on aerosol surfaces (Zhao et al., 2021). Sea and land breezes play a crucial role in this coastal area. During the night, land breezes carry pollutants from the land to the sea. Subsequently, during the day, these land breezes transform into sea breezes, bringing the pollutants back over the sea. This phenomenon leads to an increase in air pollutants over the land (Zhao et al., 2021). For instance, Q. Wang et al. (2022) found that during the ozone pollution in Shanghai in 2018, the presence of O3 at high altitudes at night was transported vertically downward during the daytime and high O3 over the ocean was transported horizontally to the land, jointly contributing to regional O3 pollution in Shanghai. Also, one dust episode in 2014 was observed over Shanghai via detouring from northern China due to the blocked northern Pacific subtropical high-pressure system (Wang et al., 2018).
Previous studies have shown that about 70 % of Asian dust traverses the eastern coast of China before moving towards the Korean Peninsula and the Sea of Japan and eventually reaching the Pacific Ocean. The eastern coast of China serves as a crucial route for Asian dust transport to the Pacific Ocean (Arimoto et al., 1997; Huang et al., 2010). Most previous research has focused on typical dust events characterized by strong intensities, high wind speed, low humidity, and low oxidants (Li et al., 2017; Ma et al., 2019; Xu et al., 2017; Xie et al., 2005). In contrast, this study aims to depict an atypical dust event that was observed in Shanghai, a coastal mega-city in eastern China. The unusualness of the meteorological conditions, transport pathways, and air pollutants during the particular dust event is explicitly described. The study involves categorizing the dust event into three stages and comparing the aerosol chemical compositions between these stages. By focusing on the second and third stages, the different formation mechanisms of nitrate and sulfate are investigated. The quantities of major aerosol species from transport and secondary formation are estimated based on a simplified method of relating the upstream and receptor simultaneous measurements.
2.1 Observational sites
At Shanghai Pudong Environmental Monitoring Station (31∘13′ N, 121∘32′ E), comprehensive measurements of various atmospheric parameters were conducted. All the instruments were installed on the top floor of a building, about 25 m above the ground level. As shown in Fig. S1 in the Supplement, the sampling site is situated at the eastern tip of Shanghai, close to the coastal line. During November, the mean temperature and relative humidity in Shanghai were recorded as 17.3 ∘C and 72 %, respectively. In autumn and winter, air pollutants originating from upstream urban regions often undergo transport to Shanghai via high-pressure systems. Additionally, air pollutants in Shanghai tend to linger at the sea–land boundary regions due to the sea–land breeze (Shen et al., 2019).
In addition to the measurements taken in Shanghai, data from environmental monitoring stations in Qingdao and Lianyungang are also incorporated into this study.
2.2 Instrumentation
A set of online instruments were set up at the Pudong observational site. Inorganic ions (NO, SO, Cl−, Na+, NH, K+, Mg2+, Ca2+) in PM2.5 and soluble gases (NH3, HNO3, HCl, HONO) were measured by an online ion chromatography (IC, MARGA 1S, Metrohm). It operated at a flow rate of 16.7 L min−1 with a time resolution of 1 h. Briefly, air was drawn into a PM2.5 cyclone inlet and passed through a wet rotating denuder (gases) and a steam jet aerosol collector (aerosols). Subsequently, the aqueous samples were analyzed with ion chromatography. More details can be found in Xu et al. (2020). Hourly trace metals (Si, Ca, Cu, Fe, K, Co, Mn, Cr, Zn, Pb, As, Cd, V, Ni) in PM2.5 were measured by using the Xact 625 multi-metals monitor (Cooper Environmental Services, Beaverton, Oregon, USA). Particles were collected onto a Teflon filter tape at a flow rate of 16.7 L min−1 and then transported into the spectrometer where the particles were analyzed with X-ray fluorescence. Organic carbon and elemental carbon were measured by an in situ semi-continuous organic carbon and elemental carbon aerosol analyzer (RT-4, Sunset Laboratory, Beaverton, Oregon, USA). Samples were collected for 40 min and then analyzed in the following 20 min. The concentration of mineral aerosols is calculated by summing the major mineral elements with oxygen for their normal oxides; i.e., [minerals] = (2.2 ⋅ Al + 2.49 ⋅ Si + 1.63 ⋅ Ca + 2.42 ⋅ Fe + 1.94 ⋅ Ti) (Malm et al., 1994). The concentration of OM (organic matter) is estimated by multiplying organic carbon (OC) by a factor of 2.
The concentrations of particles and gaseous pollutants were measured by a set of Thermo Fisher Scientific instruments, with pollutants including PM2.5 (Thermo 5030i), PM10 (Thermo 5030i), SO2 (Thermo Fisher 43i), NOx (Thermo Fisher 42i), O3 (Thermo Fisher 49i), and CO (Thermo Fisher 48i-TLE). These parameters were measured at the temporal resolution of 5 min. Meteorological parameters (ambient temperature, relative humidity, wind speed, and wind direction) were obtained by a Vaisala weather transmitter (WXT520) at the temporal resolution of 1 min. The height of the planetary boundary layer (PBL) was retrieved from a ceilometer (CL31, Vaisala) at the temporal resolution of 30 min. Vertical profiles of aerosol optical properties were obtained by an aerosol lidar (AGJ, AIOFM) at the temporal resolution of 30 min and vertical resolution of 7.5 m. Vertical profiles of ozone were obtained by an ozone lidar (LIDAR-G-2000, Wuxi Zhongke) at the temporal resolution of 15 min and vertical resolution of 7.5 m. All instruments are routinely maintained and calibrated to ensure the quality of data.
2.3 Thermodynamic simulation of aerosol pH and aerosol liquid water content
The ISORROPIA II model (ISORROPIA, 2009) is subject to the principle of minimizing the Gibbs energy of the multiphase aerosol system, leading to a computationally intensive optimization problem (Song et al., 2018). The model can predict the physical state and compositions of atmospheric inorganic species (NH, Na+, K+, Mg2+, Ca2+, SO, NO, and Cl−) with their gas- and particle-phase concentrations and meteorological parameters (relative humidity and temperature) as model inputs. The model includes two modes, i.e., reverse and forward mode. The reverse mode calculates the equilibrium partitioning based on aerosol-phase concentrations only, while the latter uses both aerosol-phase and gas-phase concentrations as inputs. Moreover, particles can be assumed to be “metastable” with the liquid phase but no solid phase participating and “stable” with the liquid and solid phases or both. ISORROPIA II running in the forward mode at the metastable state was applied in this study. Aerosol pH was calculated based on the equilibrium particle hydronium ion concentration and aerosol liquid water content (ALWC) obtained from model results. The performances and advantages of ISORROPIA II over the usage of other thermodynamic equilibrium codes have been assessed in numerous studies (Nenes et al., 1998; West et al., 1999; Ansari and Pandis, 1999; Yu et al., 2005).
2.4 HYSPLIT
HYSPLIT was used to compute the backward trajectories of the air parcels during the dust events. It is a widely used model that computes dispersion following the particle or puff. The advection of a particle or puff is computed from the average of the three-dimensional velocity vectors for the initial position and the first-guess position (Draxler and Hess, 1998). Turbulent velocity components are expressed as a function of the velocity variance, a statistical quantity derived from the meteorological data, and the Lagrangian timescale. The calculation of air mass trajectories can be used to depict the airflow patterns for interpreting the transport of air pollutants over various spatial and temporal ranges (Stein et al., 2015). In this study, the HYSPLIT model was driven by meteorological data outputs from the Global Data Assimilation System (GDAS) (Su et al., 2015), which is available with free access (GDAS, 2004).
2.5 Calculation of uptake coefficient of NH3 () on particles
NH3, being the most abundant alkaline species in the atmosphere, plays a crucial role in acid neutralization and secondary aerosol formation. To assess the gas–particle partitioning of NH3, the uptake coefficient of NH3 () on particles is calculated as below. Initially, the quasi-first-order reaction rate constant for heterogeneous conversion from NH3 to NH (khet, s−1) is calculated by Eq. (1) (Liu et al., 2022).
khet is only valid when increases, while decreases assuming a constant emission rate from t1 to t2 (1 h in this study). Then, the uptake coefficient of NH3 () on particles can be calculated as below (Liu et al., 2022; Wang and Lu, 2016).
where S is the surface area of particles (m2 m−3) measured using a scanning mobility particle sizer (SMPS) and an aerodynamic particle sizer (APS). ω is the velocity of NH3 molecules. T is the ambient temperature (K). R is the ideal gas constant, and M is the molecular weight of NH3 (kg mol−1).
3.1 Characteristics of an unusual dust event
Figure 1 shows the time series of PM10, PM2.5, and meteorological parameters, as well as the vertical profiles of the aerosol extinction coefficient and depolarization ratio observed at the Shanghai sampling site from 25 October to 6 November 2019. From 25 to 28 October, the mean wind speed was 0.9 ± 0.72 m s−1 with a peak value of 3.1 m s−1, remaining relatively low and predominantly blowing from the northwest. The mean concentrations of PM2.5 and PM10 were 34.7 and 44.2 µg m−3, respectively. Starting at 04:00 LST (this time zone applies throughout the paper) on 29 October, the concentration of PM10 increased sharply and lasted till 2 November (Fig. 1d). The aerosol lidar observation indicated that both the aerosol extinction coefficient and the depolarization ratio extended from the ground to around 2 km during the same period. In general, if the particle depolarization ratio exceeds 10 %, the aerosol is identified as mineral dust (Shimizu et al., 2004) due to the nonsphericity (irregular shapes) and relatively large size of particles (Mcneil and Carswell, 1975). Notably, the enhanced depolarization ratio (> 0.1) suggested the occurrence of a prolonged dust event in Shanghai. By using the PM2.5 PM10 mass ratio of 0.4 as a threshold (Fan et al., 2021), the period from 29 October to 2 November was defined as the dust period in this study. The remaining days, including 25 to 28 October and 3 to 6 November, were defined as the non-dust period. Throughout the entire dust period, the mean concentrations of PM2.5 and PM10 reached 53.3 ± 20.5 µg m−3 and 172.4 ± 70.2 µg m−3, respectively, yielding a low PM2.5 PM10 ratio of 0.34 ± 0.15. As a comparison, PM2.5 and PM10 during the non-dust period were 38.9 µg m−3 and 49.8 µg m−3, respectively, exhibiting a relatively high PM2.5 PM10 ratio of 0.62 ± 0.20.
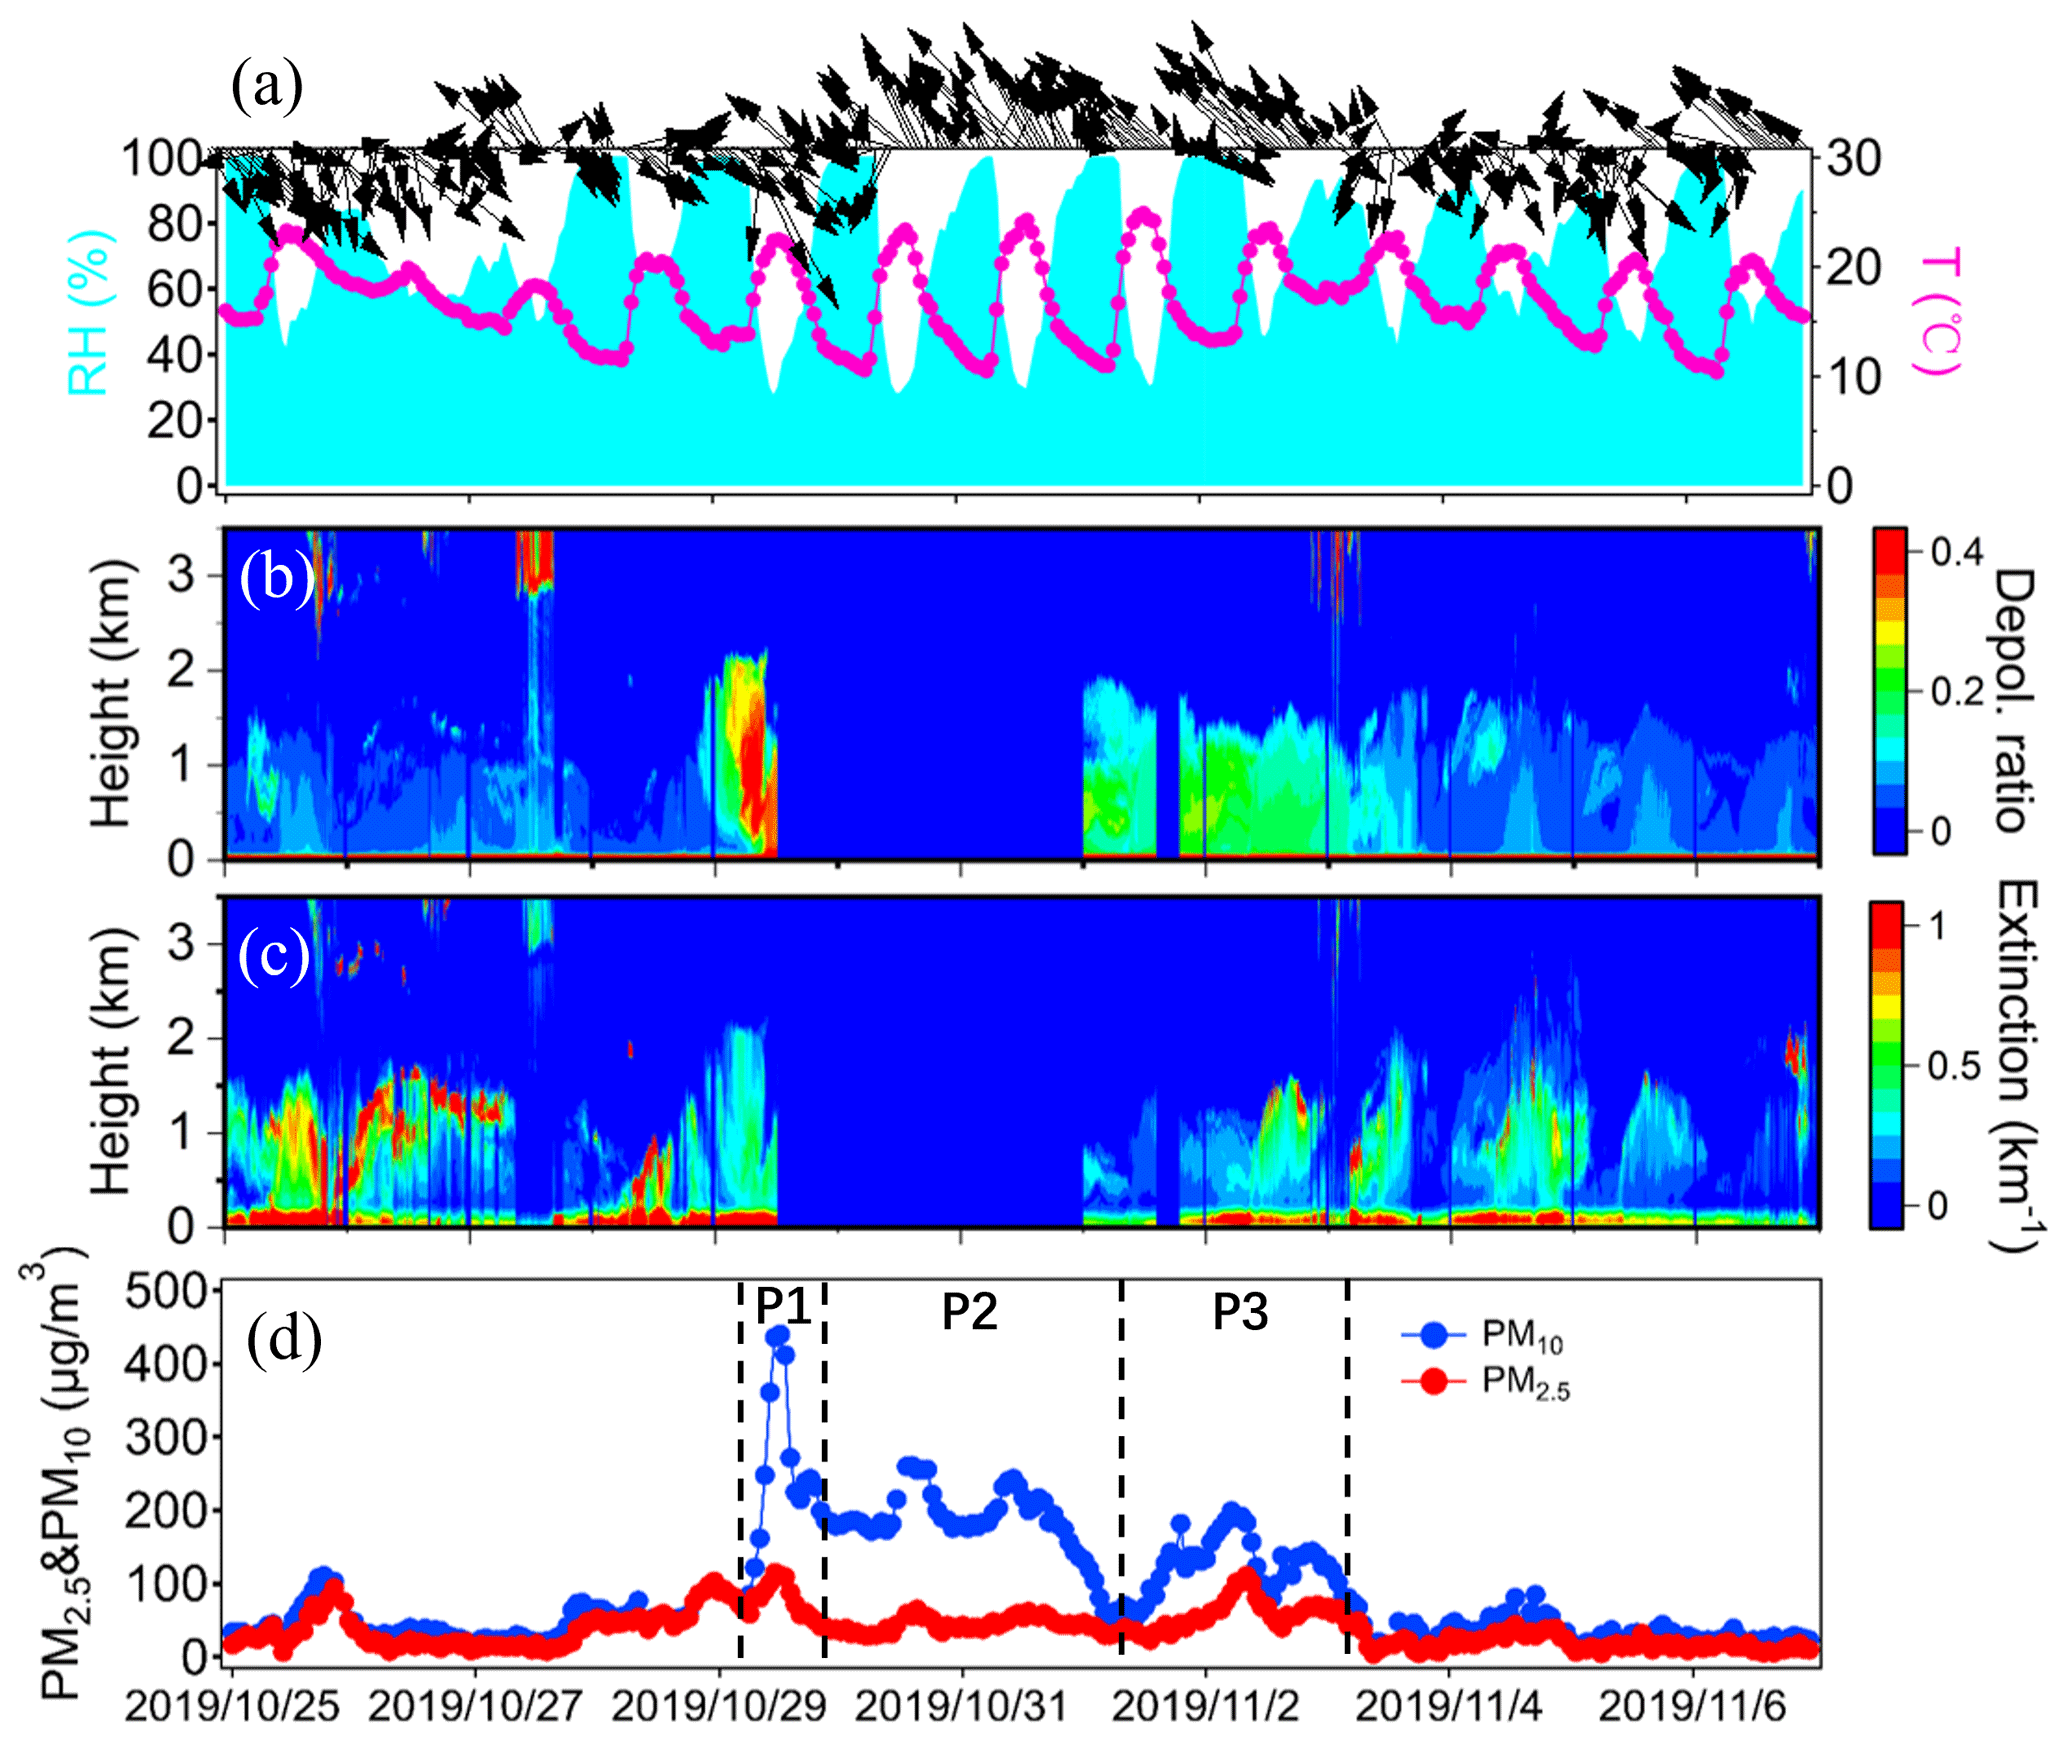
Figure 1Time series of (a) relative humidity, temperature, and wind vectors; (b) the aerosol depolarization ratio; (c) the aerosol extinction coefficient; and (d) mass concentrations of PM2.5 and PM10 during the study period. Three dust stages, i.e., P1, P2, and P3, are also marked. The missing aerosol lidar data were due to instrument malfunction. The date format is year/month/day.
Occurrences of dust are typically accompanied by low relative humidity and strong winds due to the passage of cold fronts (Huang et al., 2010; L. Wang et al., 2013; Z. Wang et al., 2018). However, in this study, relative humidity was exceptionally high with a mean value of 71 ± 26 %. It showed strong diurnal variation, reaching its minimum in the daytime and even close to 100 % in the nighttime (Fig. 1a). Additionally, wind speed was low at 0.54 ± 0.59 m s−1 with a maximum of 2.6 m s−1. This stagnant synoptic condition led to elevated concentrations of the main gaseous pollutants such as O3, SO2, and NO2, with mean values of 86.0 ± 47.8, 11.8 ± 3.4, and 63.3 ± 27.9 µg m−3, respectively, even higher than those during the non-dust period.
We further divided the dust event into three stages based on the temporal characteristics of PM10 and the transport patterns of air masses. As shown in Fig. 1d, PM10 quickly climbed from 04:00 on 29 October and reached a maximum of 436 µg m−3 after 8 h. The air masses primarily originated from the semi-arid regions of northwest China (Fig. 2d), which is consistent with both the near-surface wind observation (Fig. 1a) and the wind lidar observation (Fig. 2a). The wind profiles showed prevailing northwest winds from the surface up to around 2 km before noon on 29 October, indicating the presence of a strong synoptic system. Afterwards, PM10 quickly decreased to 199 µg m−3 at 20:00 on 29 October within 8 h. This was primarily attributed to the shift in wind directions. As shown in Fig. 2a, while winds above 700 m continued to blow from the northwest, near-surface winds had shifted from the southeast. Due to Shanghai's coastal location adjacent to the East China Sea, the relatively clean southeasterlies diluted the local air pollutants, thereby explaining the quick decline in PM10 concentrations. This initial dust episode occurring from 04:00–13:00 on 29 October was defined as Stage P1.
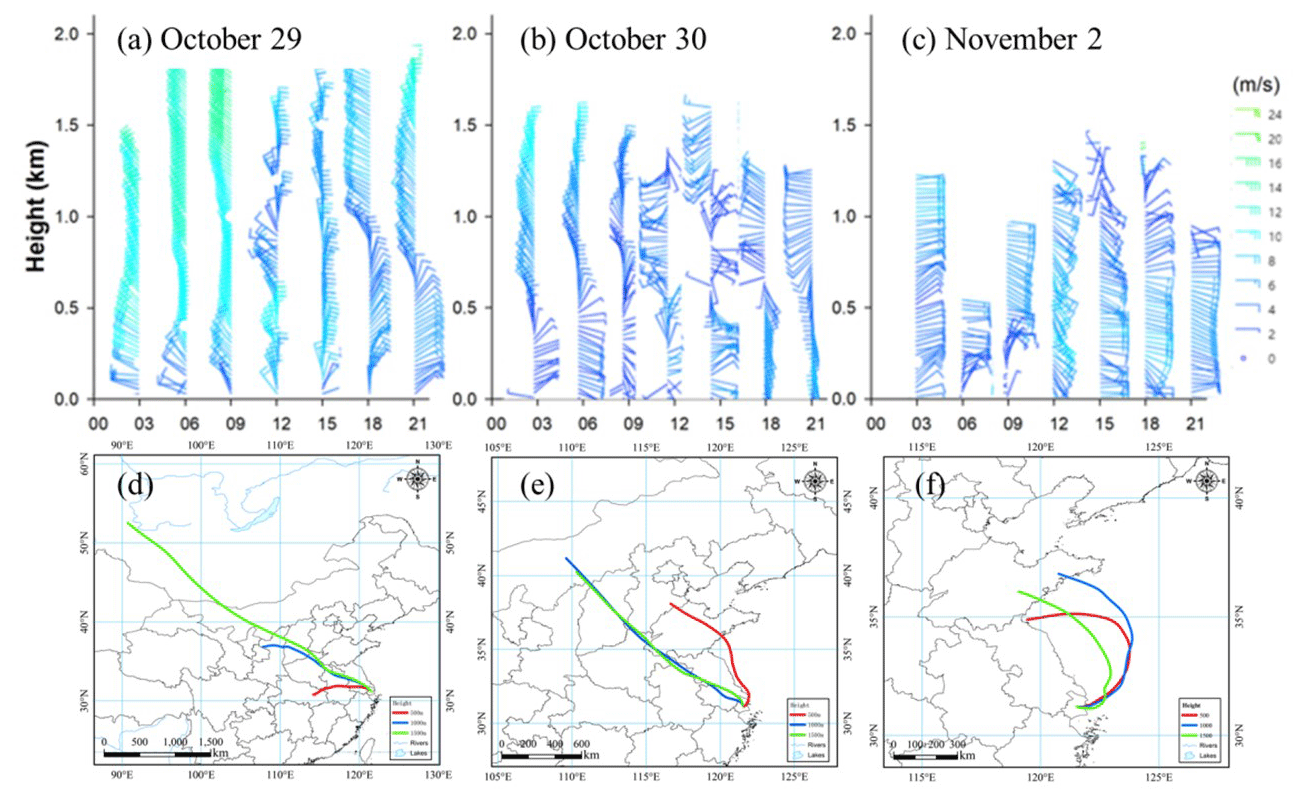
Figure 2Wind profiles observed by a wind profiler radar on (a) 29 October, (b) 30 October, and (c) 2 November. The 48 h backward trajectories simulated at the sampling site starting from (d) 04:00 on 29 October, (e) 09:00 on 30 October, and (f) 13:00 on 2 November. The red, blue, and green trajectories represent starting altitudes of 100, 500, and 1500 m, respectively.
Despite the persistent southeasterly winds, the dust event did not come to a complete halt. Even under these prevailing winds, hourly PM10 concentrations remained above 150 µg m−3 until 1 November, gradually decreasing to 65 µg m−3 at 03:00 on 1 November (Fig. 1d). Compared to P1, wind speed during this stage was as low as 0.4 ± 0.5 m s−1, while RH was moderately high at 70 ± 26 %. Although the daytime RH stayed low between 30 % and 50 %, it frequently soared above 90 % at nighttime. Figure 2e shows that although the air masses originated from the Gobi Desert, they also traversed considerable coastal regions. The wind profiles further indicated that while northwest winds prevailed at altitudes higher than 500 m, east and northeast winds were dominant below 500 m (Fig. 2b). Consequently, the relatively high RH during this period can be attributed to the mixing of dust plumes with coastal sea breezes. This dust episode from 14:00 on 29 October to 03:00 on 1 November was designated as Stage P2.
Following P2, PM10 and PM2.5 rose again and peaked at 05:00 and 09:00 on 2 November with hourly concentrations of 199 and 117 µg m−3, respectively. Differently from P1 and P2, the air masses during this stage originated from the Shandong Peninsula and the northern region of Jiangsu Province and then migrated over the Yellow Sea and the East China Sea (Fig. 2f). Typically, dust plumes tend to travel eastward, impacting the western Pacific region and even distant oceanic regions (Wang et al., 2018; Nagashima et al., 2016). However, in this case, the air masses evidently deviated and pushed the dust back towards the mainland. The wind profiles on 2 November revealed that winds within the detected altitude range predominantly originated from the eastern and southeastern oceanic regions (Fig. 2c). This probably indicated that the mixing between dust plumes and humid oceanic air masses was quite sufficient, which was also reflected by the highest average RH of 76 ± 24 % among the three stages of the dust event. Moreover, the concentrations of O3 and NO2 at this stage were higher than those of P1 and P2, potentially promoting the formation of secondary aerosol components, and will be discussed later. This rarely observed dust backflow transport episode from 04:00 on 1 November to 23:00 on 2 November was designated as Stage P3.
3.2 Comparisons of aerosol chemical compositions among the three dust stages
Figure 3a shows the time series of hourly aerosol chemical components, including SNA (NO, SO, and NH), OM, elemental carbon (EC), and mineral aerosols in PM2.5. During P1, the mean concentration of SNA was 49.9 ± 31.6 µg m−3. The mineral aerosols reached 16.4 ± 14.6 µg m−3, accounting for 19 % in PM2.5. The contribution of OM to PM2.5 was almost identical to that of mineral aerosols (Fig. 3b).
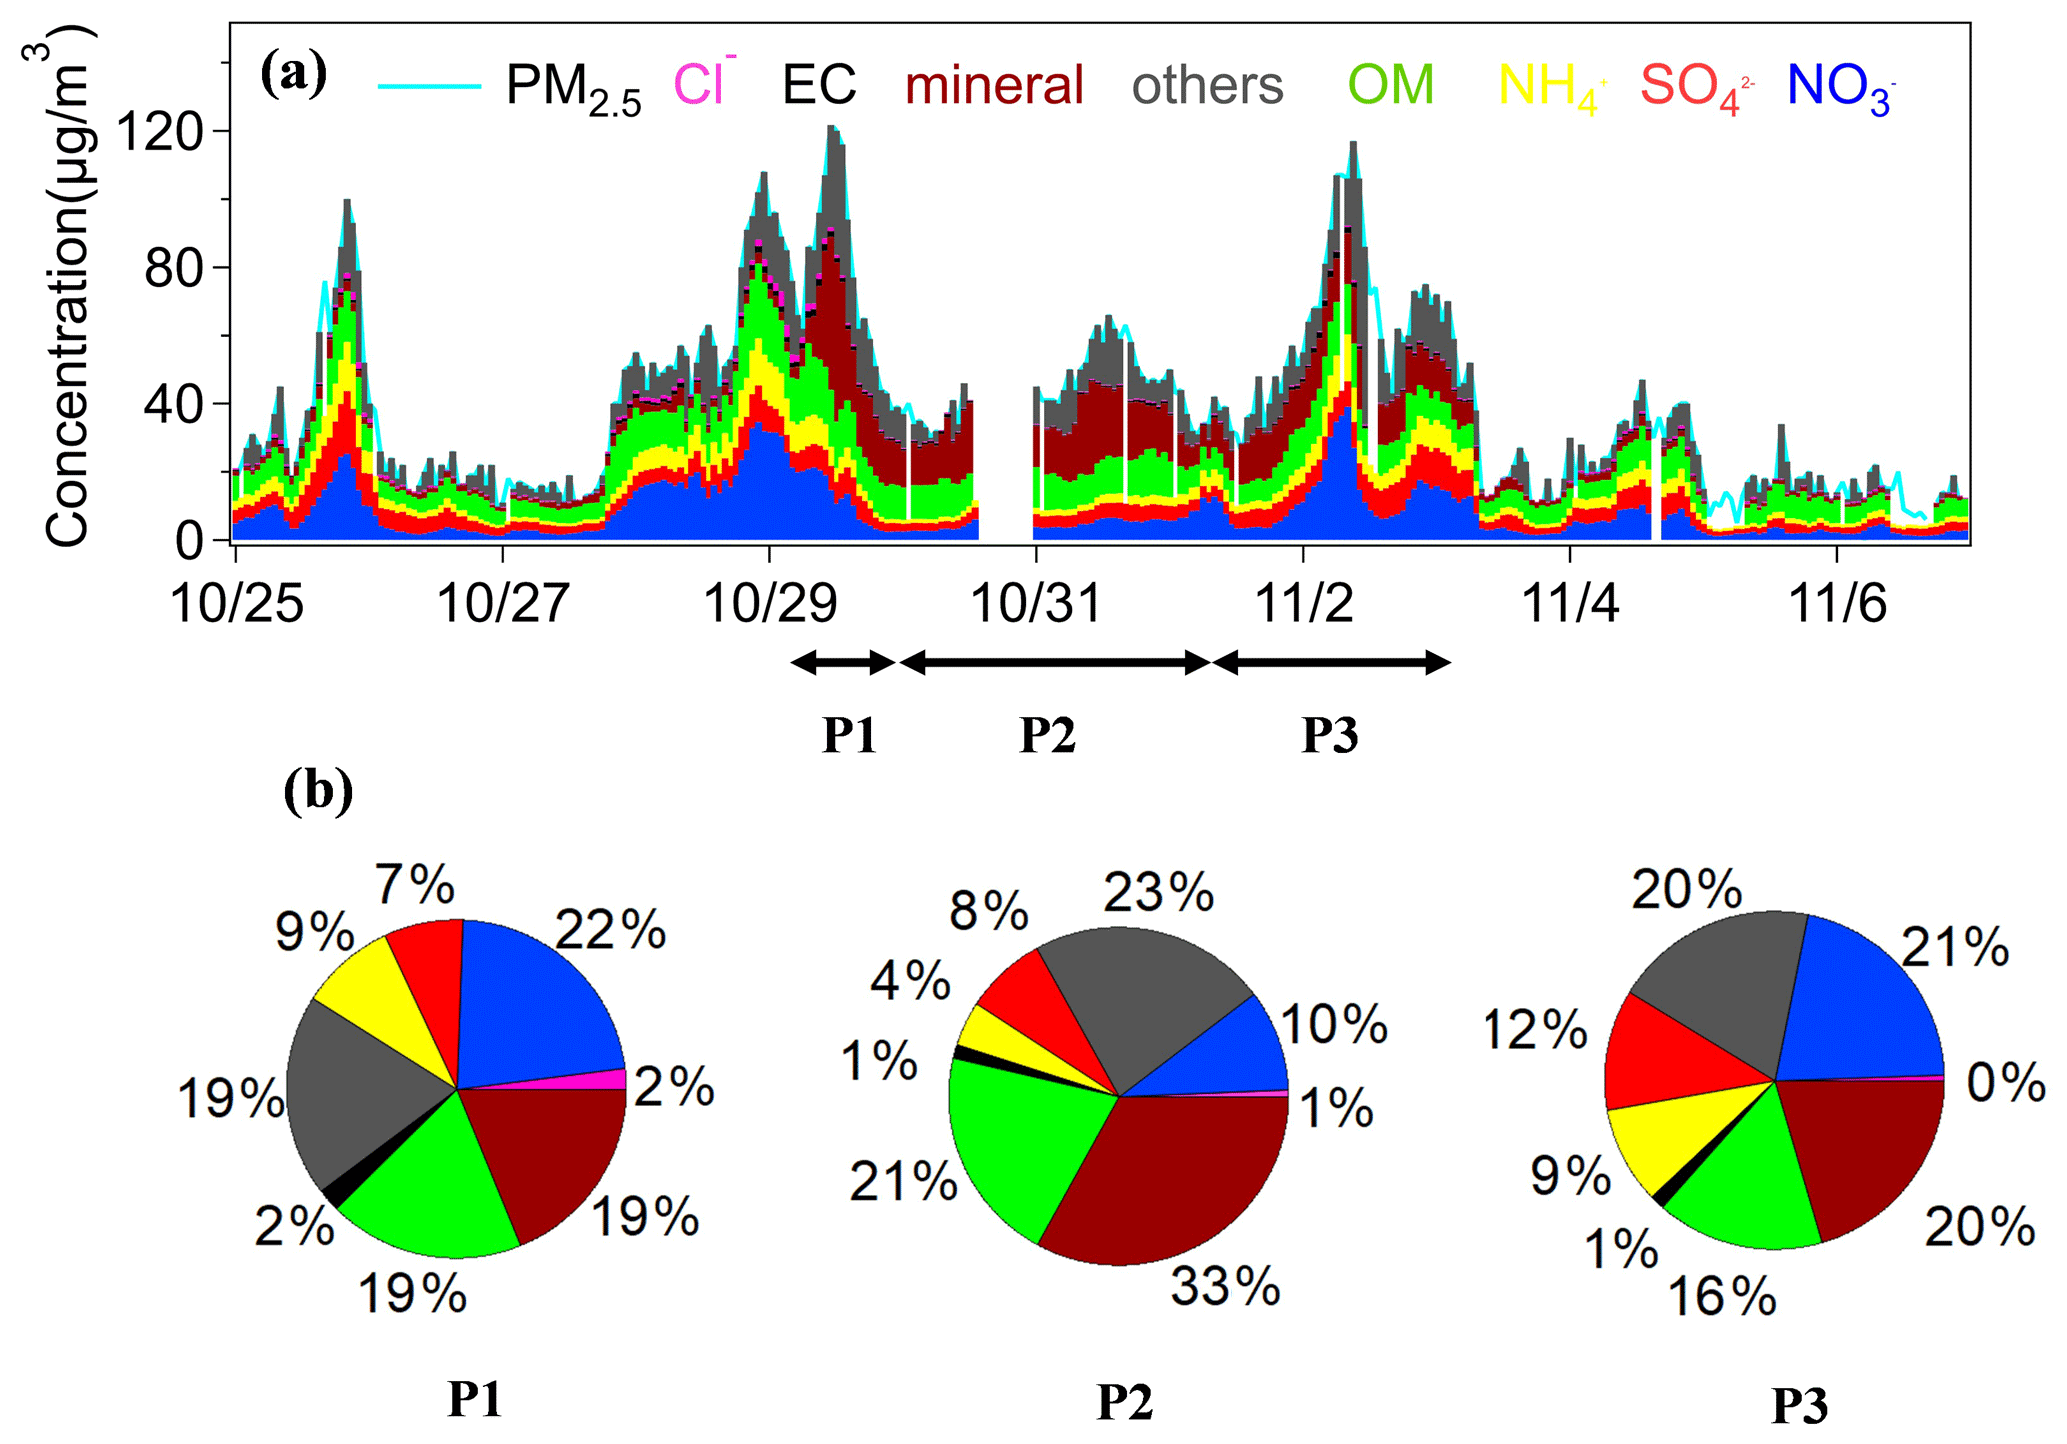
Figure 3(a) Time series of major chemical components in PM2.5 during the study period. (b) The mean proportion of major chemical components in PM2.5 during the three dust stages.
During P2, mineral aerosols increased to 23.4 ± 54.1 µg m−3 and accounted for 33 % in PM2.5, representing the highest among all three stages (Fig. 3b). Due to the continuous dilution effect of dust on local anthropogenic pollutants, the concentrations and proportions of SNA in PM2.5 were the lowest during this stage. For instance, NO only accounted for 10 % in PM2.5, indicating a suppression of nitrate formation to some extent. The levels of OM did not exhibit obvious changes and averaged 10.1 ± 2.1 µg m−3, accounting for 21 % in PM2.5.
During P3, mineral aerosols averaged 11.9 ± 2.7 µg m−3, ranking the lowest among all three stages. The proportion of mineral aerosols in PM2.5 decreased to 20 %, suggesting the dust backflow from the ocean was less enriched in mineral components. Compared to P2, SNA showed significant increases and much stronger diurnal variations during P3. SO, NO, and NH averaged 6.7 ± 2.4, 12.4 ± 8.9, and 5.4 ± 2.7 µg m−3, respectively. As shown in Fig. 3b, the contribution of nitrate to PM2.5 increased to 21 %, while that of sulfate rose to 12 %, the highest among all three stages. The concentration of OM (9.3 ± 3.2 µg m−3) and its proportion (16 %) during P3 were lower than the other two stages, likely due to the unconventional dust backflow transport pathway.
3.3 Unconventional features of the dust episodes
3.3.1 Unusually enhanced O3 during dust
Figure 4 shows the hourly near-surface ozone concentrations and vertical profiles of ozone during the study period. Interestingly, a few high O3 peaks occurred during the dust event (Fig. 4a). O3 averaged 92.8 ± 52.8 µg m−3 during the dust, about 50 % higher than the non-dust days. Among the three dust stages, O3 substantially increased from 35.9 ± 36.4 µg m−3 during P1 to 80.7 ± 41.2 µg m−3 during P2 and further rose to 104.0 ± 48.7 µg m−3 during P3. The low O3 during P1 can be attributed to the cleansing effect of the strong dust associated with the cold front, which was consistent with previous studies that reported reduced oxidant concentrations during intense dust events (Benas et al., 2013). Regarding the relatively high O3 during P2 and P3, several causes may contribute to this phenomenon. Firstly, the mean wind speed was low at 0.4 and 0.6 m s−1 during P2 and P3, respectively. One numerical study conducted during a similar period suggested that the low wind speed caused a reduction in boundary layer height and the subsequent warming of the lower atmosphere, thus accelerating the ozone formation by ∼ 1 ppbv h−1 (Wang et al., 2020). Consequently, this weak synoptic system was favorable for the accumulation of ozone. Secondly, since the dust plume traveled mostly over coastal and oceanic areas, a portion of O3 could be transported from the high-ozone oceanic areas (Q. Wang et al., 2022). Thirdly, the ozone lidar also detected high-O3 stripes during P2 and P3. As shown in Fig. 4b, the high-O3 profiles extended from the surface to around 1 km and the profile structure was similar to that of aerosol depolarization ratio. The subsidence of dust particles likely contributed to downward transport of high-altitude O3, thereby influencing the elevated O3 near the ground (Yang et al., 2022).
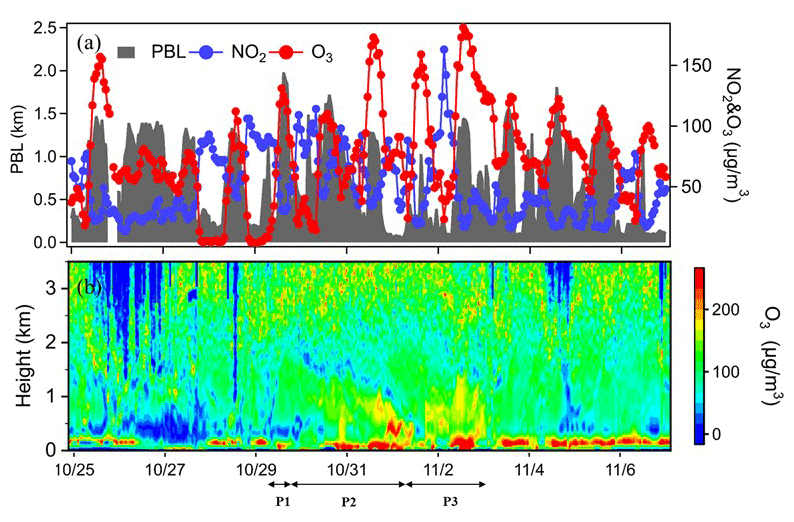
Figure 4(a) Time series of near-surface O3, NO2, and planetary boundary layer height. (b) Vertical profiles of ozone observed by the ozone lidar.
3.3.2 Dust backflows during P3
The dust during P3 was diagnosed as a backflow transport pathway from the mainland to Shanghai through the Yellow Sea and the East China Sea, as determined by the backward trajectory analysis (Fig. 2f). This unconventional dust transport route, termed “dust backflow”, was consistent with a similar occurrence in 2014 when dust from northern China detoured over Shanghai (Wang et al., 2018). In this section, we provide further evidence of the dust backflow from various aspects.
Figure 2f illustrates that the dust drifted away from the Shandong Peninsula; thus we selected two coastal sites in Shandong Province for supplementary analysis. Figure S2 compares the time series of hourly air pollutants at Qingdao, Lianyungang, and Shanghai. At Qingdao and Lianyungang, high PM10 concentrations were observed during 30–31 October, indicating the invasion of dust in these regions. After about 2 d, PM10 peaked in Shanghai early on 2 November. This temporal consistency aligned with the simulation duration of the backward trajectories, which lasted around 48 h (Fig. 2f). In Fig. S2, it can be observed that in the upstream dust regions (i.e., Qingdao and Lianyungang), PM10 varied negatively with NO2 and CO (the highlighted period in the figure). While in Shanghai, positive correlations between PM10 and both NO2 (R2= 0.32) and CO (R2= 0.55) indicated that the dust during P3 served as a carrier for gaseous pollutants rather than acting a diluter.
Additional evidence of dust backflows was provided from the perspective of aerosol chemical tracers. Figure 5a plots the time series of Ca and Ca2+, representing the total calcium and the soluble part of calcium, respectively. It was observed that Ca and Ca2+ did not exhibit a proportional variation trend, which should be related to the solubility of calcium during different dust stages. During P1, the mean concentration of Ca reached its highest of 1.63 ± 1.53 µg m−3, while Ca2+ was its lowest at 0.21 ± 0.20 µg m−3, thus resulting in the lowest Ca2+ Ca ratio of 0.10 ± 0.08. As discussed in Sect. 3.1, dust during P1 was the strongest, and thus it contained higher fractions of minerals, primarily in the form of insoluble metal oxides. The average concentrations of Ca2+ and Ca during P2 were 0.33 ± 0.28 and 1.11 ± 0.46 µg m−3, respectively, resulting in the higher Ca2+ Ca ratio of 0.27 ± 0.20. As a comparison, the average concentrations of Ca2+ and Ca during P3 reached 0.34 ± 0.20 and 0.78 ± 0.27 µg m−3, respectively, yielding the highest Ca2+ Ca ratio of 0.38 ± 0.19. The significantly higher solubility of calcium during P3 should be directly related to the prolonged presence of dust plumes over the open ocean. The abundant water vapor over the ocean could accelerate the dissolution of the insoluble components in particles during the mixing between continental dust and oceanic air masses. Additionally, the backflow transport pathway facilitated the entrainment of sea salts and contributed to the increase in soluble calcium.
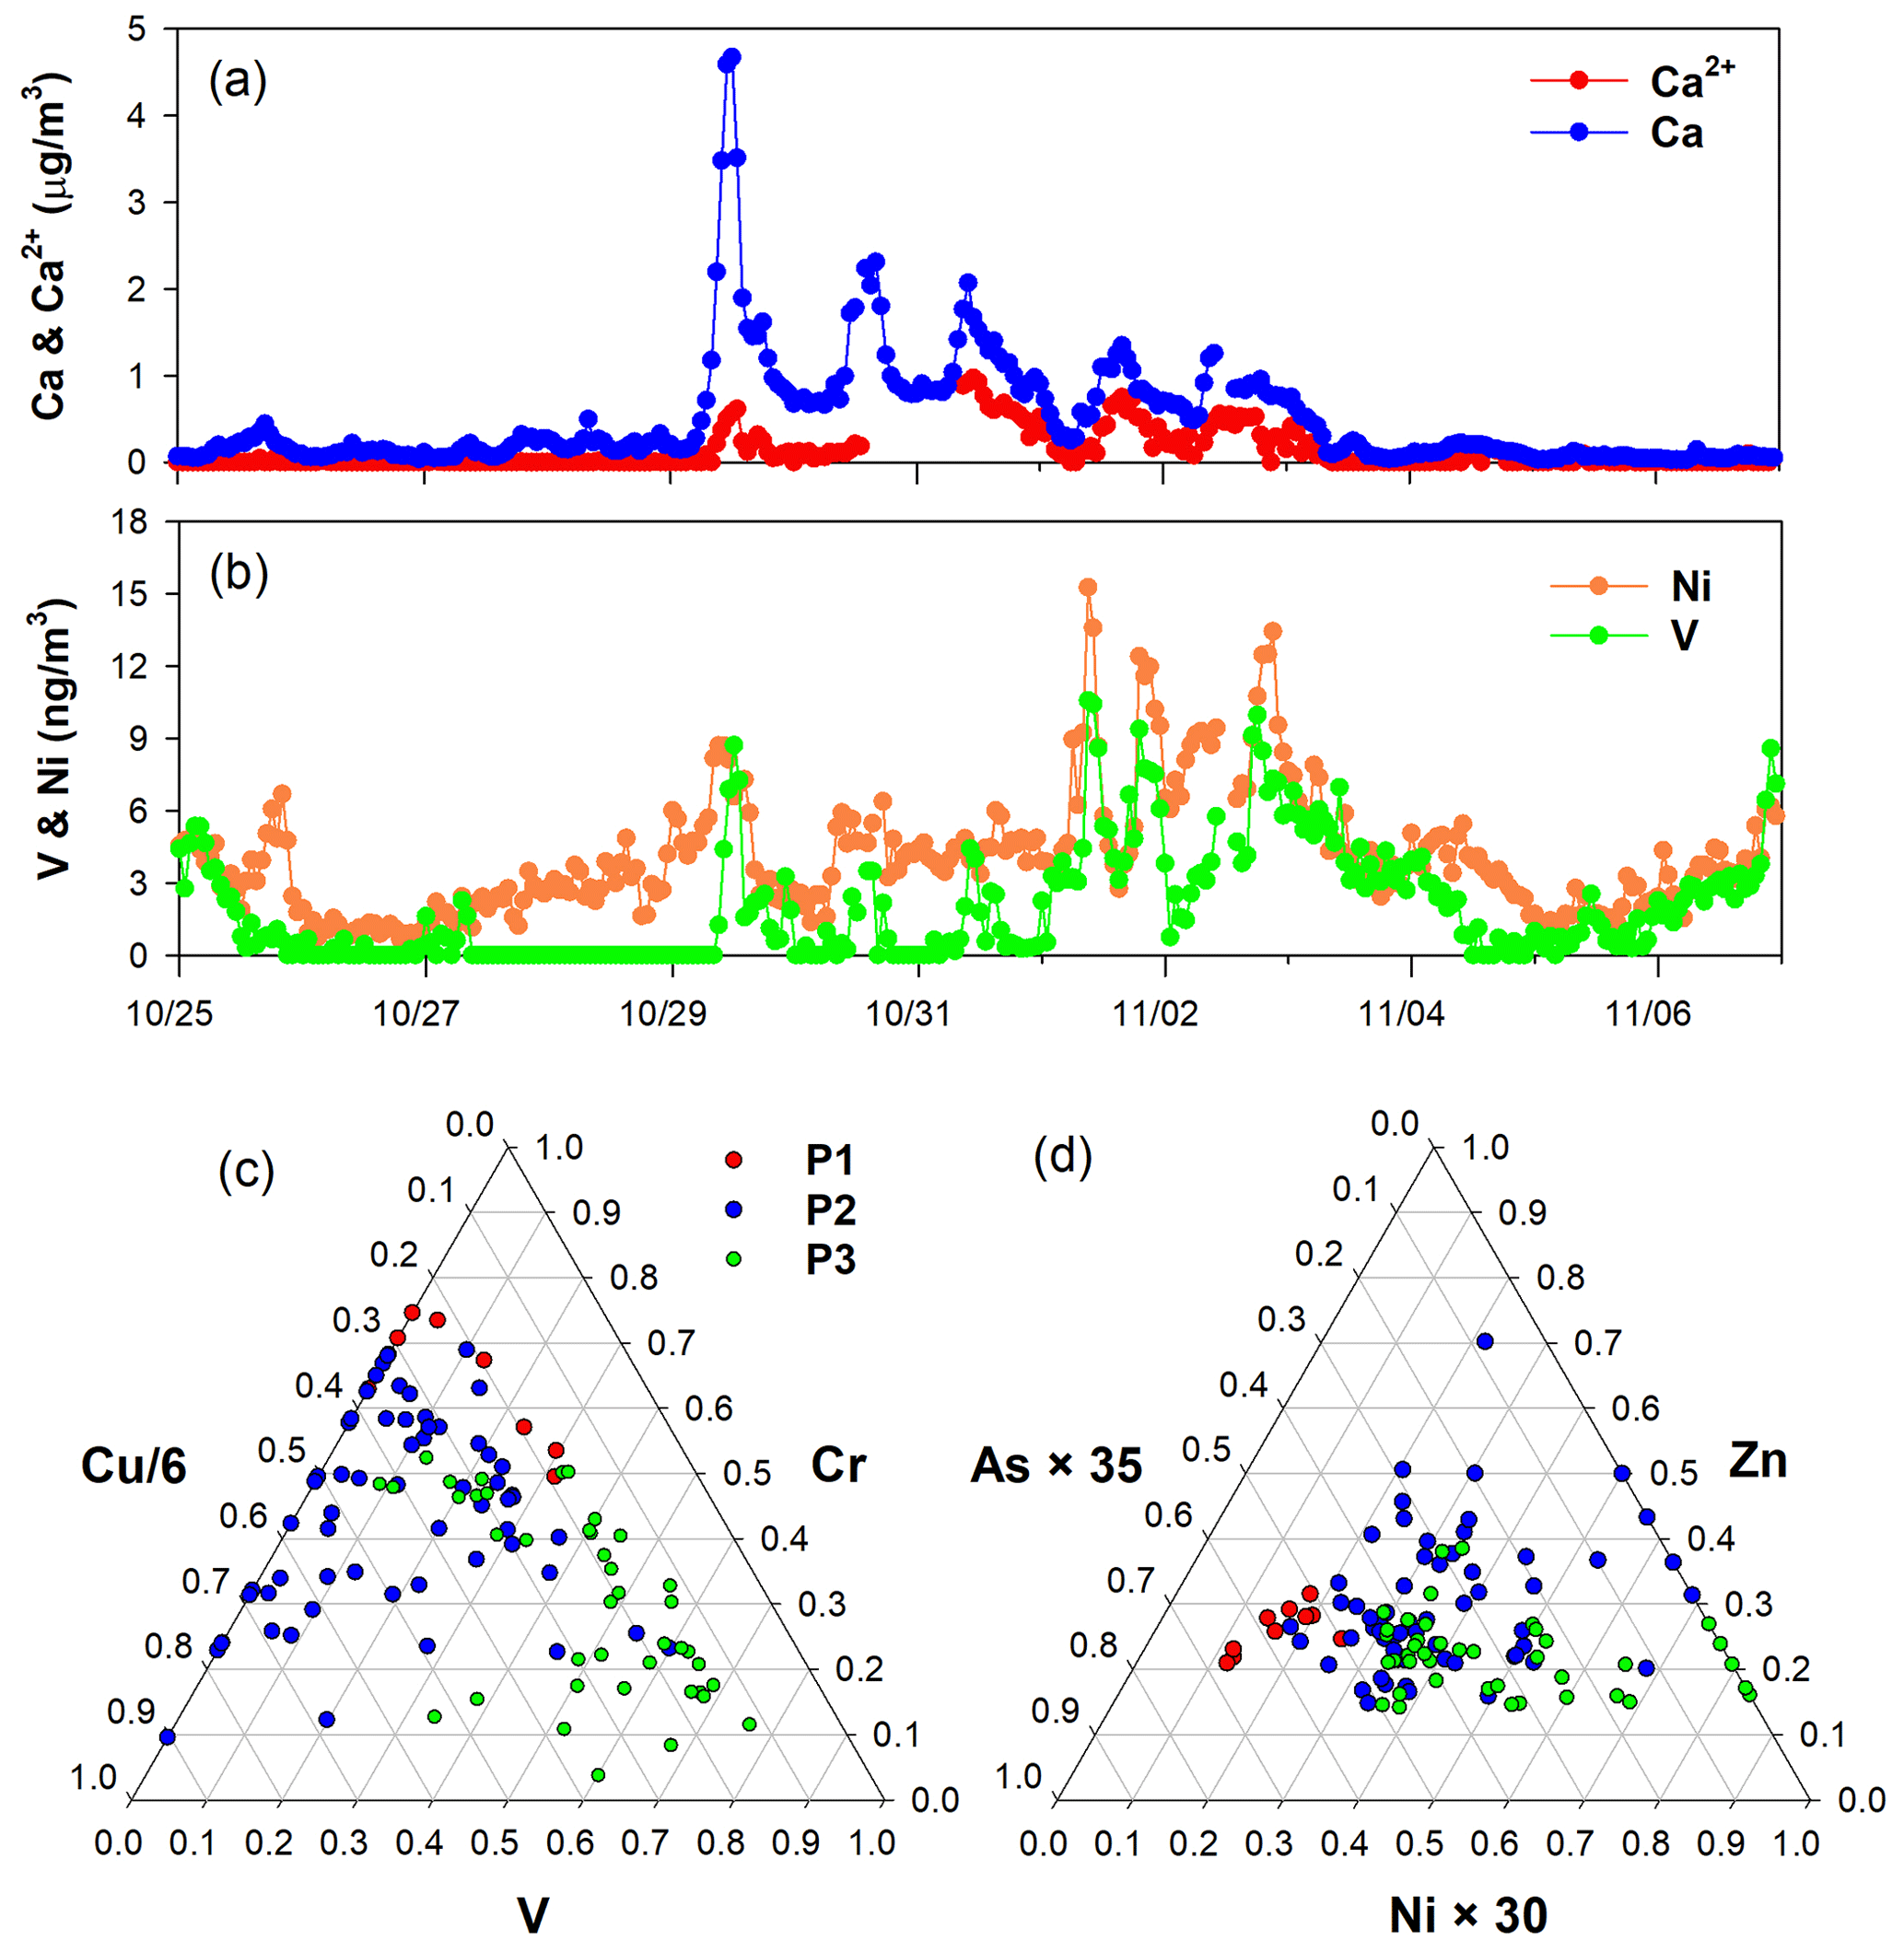
Figure 5Time series of (a) Ca and Ca2+ and (b) V and Ni during the study period. (c) Cu–Cr–V ternary diagram and (d) As–Zn–Ni ternary diagram among the P1–P3 dust episodes. Due to substantial concentration differences of various elements, some elements are artificially changed to make most scatters appear around the centroid.
Figure 5b provides additional insights by displaying the time series of V and Ni, which are typical tracers of oil combustions (Becagli et al., 2012). They varied significantly during the study period, and the mass concentrations of V and Ni increased 4 and 1.8 times during P3 compared to P2, respectively. Consistently, the enrichment factors of Ni and V displayed higher values during P3 than P1 and P2 (Fig. S3). The trends are substantiated in the ternary diagrams, which are commonly applied to illustrate the relative abundances of three components and infer the source variations (Bozlaker et al., 2019; Cwiertny et al., 2008; Laskin et al., 2005). As shown in the Cu–Cr–V ternary diagram (Fig. 5c), the dust samples during P1 were positioned away from the V apex. As a comparison, the dust samples during P2 exhibited greater scattering, manifesting enhanced anthropogenic contributions, e.g., from chrome-plating industries (Hammond et al., 2008). Compared to P2, the dust samples during P3 moved towards the V apex, indicating a higher contribution from oil combustions (Becagli et al., 2012). A similar pattern is observed in the As–Zn–Ni ternary diagram (Fig. 5d). The majority of dust samples during P2 spanned across the diagram, reflecting contributions from mixed anthropogenic sources. Reciprocally, P3 was closer to the Ni-apex. These lines of evidence collectively confirmed that the dust had mixed with pollutants from marine vessel emissions over one of the busiest international shipping trade routes (Fan et al., 2016) and was subsequently transported back to Shanghai.
3.4 Formation of secondary aerosols during the dust long-range transport
3.4.1 Comparison of typical chemical tracers
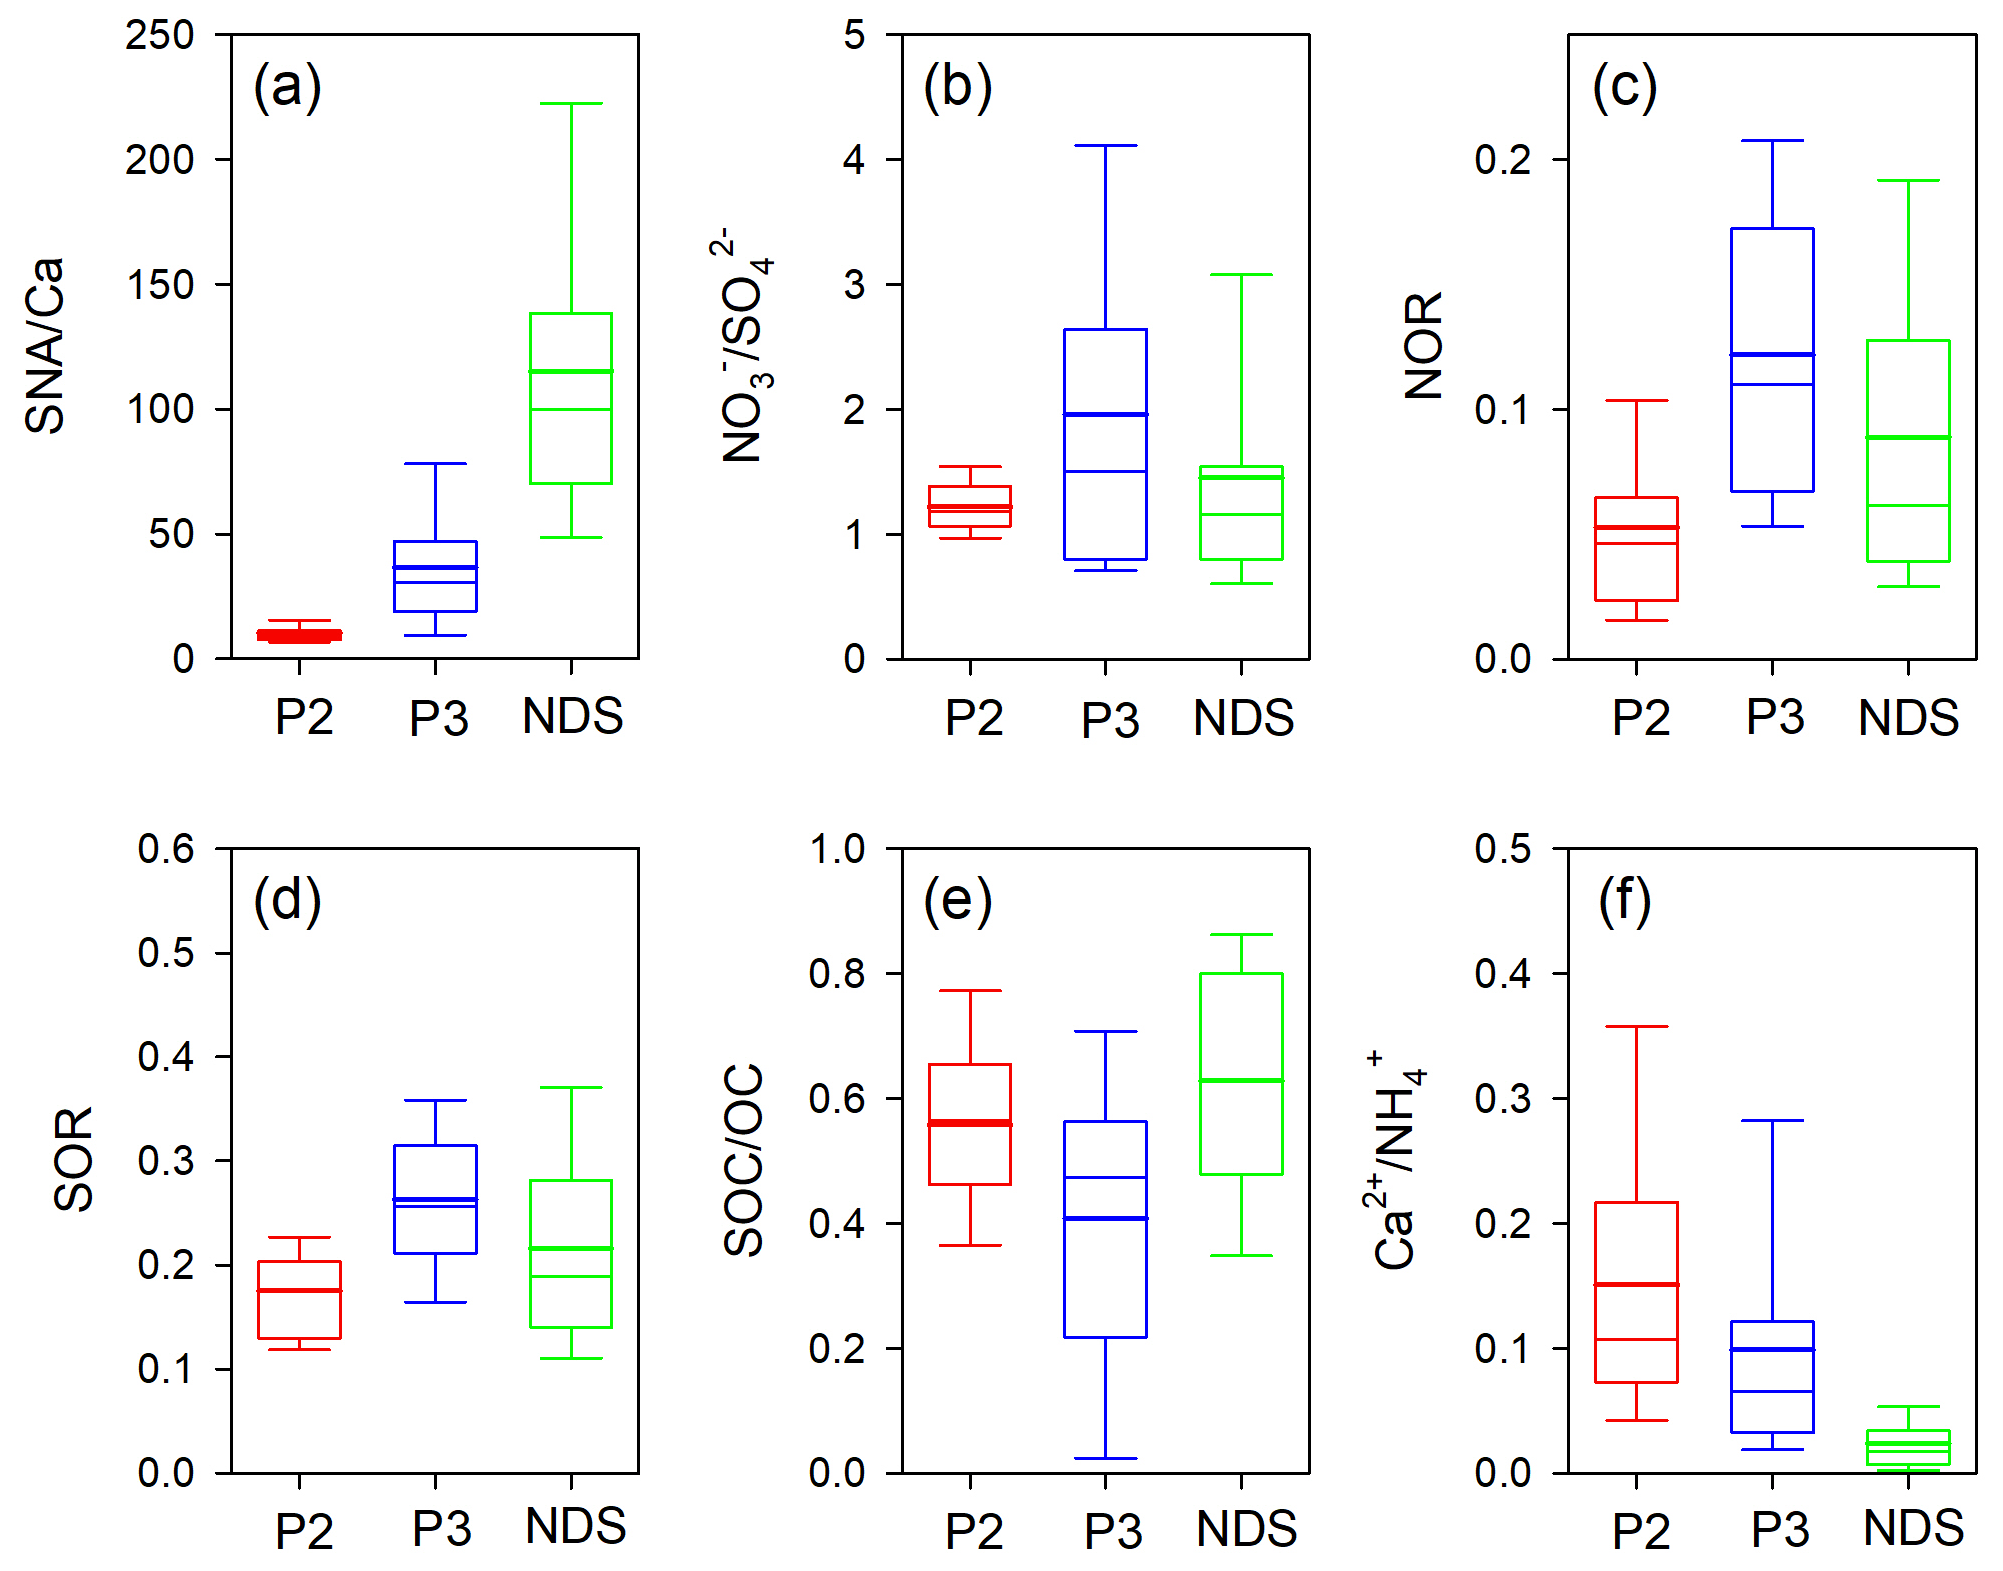
Figure 6Box plots of (a) SNA Ca, (b) NO SO, (c) NOR, (d) sulfur oxidation ratio (SOR), (e) SOC OC, and (f) Ca2+ NH during P2, P3, and non-dust days (NDs), respectively.
To delve deeper into the formation characteristics of secondary aerosols in different stages, a variety of chemical tracers was investigated. The P1 dust stage was excluded from statistical analysis due to its short duration and limited data availability. Figure 6a shows the comparison of SNA Ca ratios during P2, P3, and non-dust days (NDs). The SNA Ca ratio can be used to assess the relative changes between secondary production and primary dust emission by eliminating the impact of meteorological conditions among different periods (Zheng et al., 2015). Compared to the two dust episodes, the SNA Ca ratio is significantly higher during NDs. This can be attributed to the much lower concentrations of mineral aerosols during NDs, thus resulting in the higher SNA relative to Ca. In terms of comparing P2 and P3, the average SNA Ca ratio during P3 was 3 times that of P2, indicating that the formation of secondary inorganic aerosols was more prominent during the dust backflow. Regarding the NO SO ratios (Fig. 6b), they were close between NDs and P2, with NO slightly exceeding SO. The range of NO SO was the largest during P3 with a mean value of around 2, suggesting that the dust backflow was more conducive to the accumulation of nitrate. The nitrogen oxidation ratio (NOR = NO (NO NO2)) and the sulfur oxidation ratio (SOR = SO (SO SO2)) were further used to gauge the extent of nitrate and sulfate formation, both showing trends of P3 > NDs > P2 (Fig. 6c and d). It should be noted that NOR and SOR cannot be used to realistically characterize the extent of nitrogen and sulfur oxidation during transport-dominated pollution cases, as upstream aging aerosols can significantly increase the above ratios (Ji et al., 2018). In the following discussion, we will focus on the formation mechanism of SNA during different dust stages.
The results of secondary organic carbon (SOC) OC ratios differed from the above analysis in that SOC OC was lower during P3 than during P2 and NDs (Fig. 6e), suggesting that the formation of secondary organic aerosols was not favored via the dust backflow. This may be due to its maritime transport pathway as the emission intensity of volatile organic compounds from the ocean is much lower than that from land sources. Consequently, the lack of organic aerosol precursors could be the main cause for the lower SOC OC ratios during P3. Finally, the Ca2+ NH ratio was employed to assess the relative contributions of alkaline chemical components (Fig. 6f). As expected, this ratio during the two dust stages was much higher than that of NDs, indicating the important contribution of dust to alkaline metal ions. The Ca2+ NH ratio was higher during P3 (0.15) than during P2 (0.10), which aligned with the findings presented in Sect. 3.2.
3.4.2 Distinct formation processes of secondary aerosols between P2 and P3
In this section, we further analyze the formation mechanism and key influencing factors of secondary components during P2 and P3. Figure 7a and b compare the correlation heatmaps of SO and NO with various parameters. During P2, both SO and NO displayed the most significant correlations with O3 and Ox (O3+ NO2), while they were even negatively correlated with ALWC. In regard to the obvious ozone enhancement phenomenon as discussed in Sect. 3.3.1, the photochemistry pathway for the secondary aerosol formation (e.g., S(IV) + O3 (aq) → S(VI)) should be overwhelming compared to the aqueous-phase pathways, e.g., oxidation by H2O2, catalysis by tracer metals, and oxidation by NO2. In addition, SO and NO also showed moderate correlations with elemental Ca, suggesting that dust acted as a carrier to transport these salts, which can be derived from background minerals in dust (Wu et al., 2022) and dust heterogeneous reactions during the transport (Huang et al., 2010).
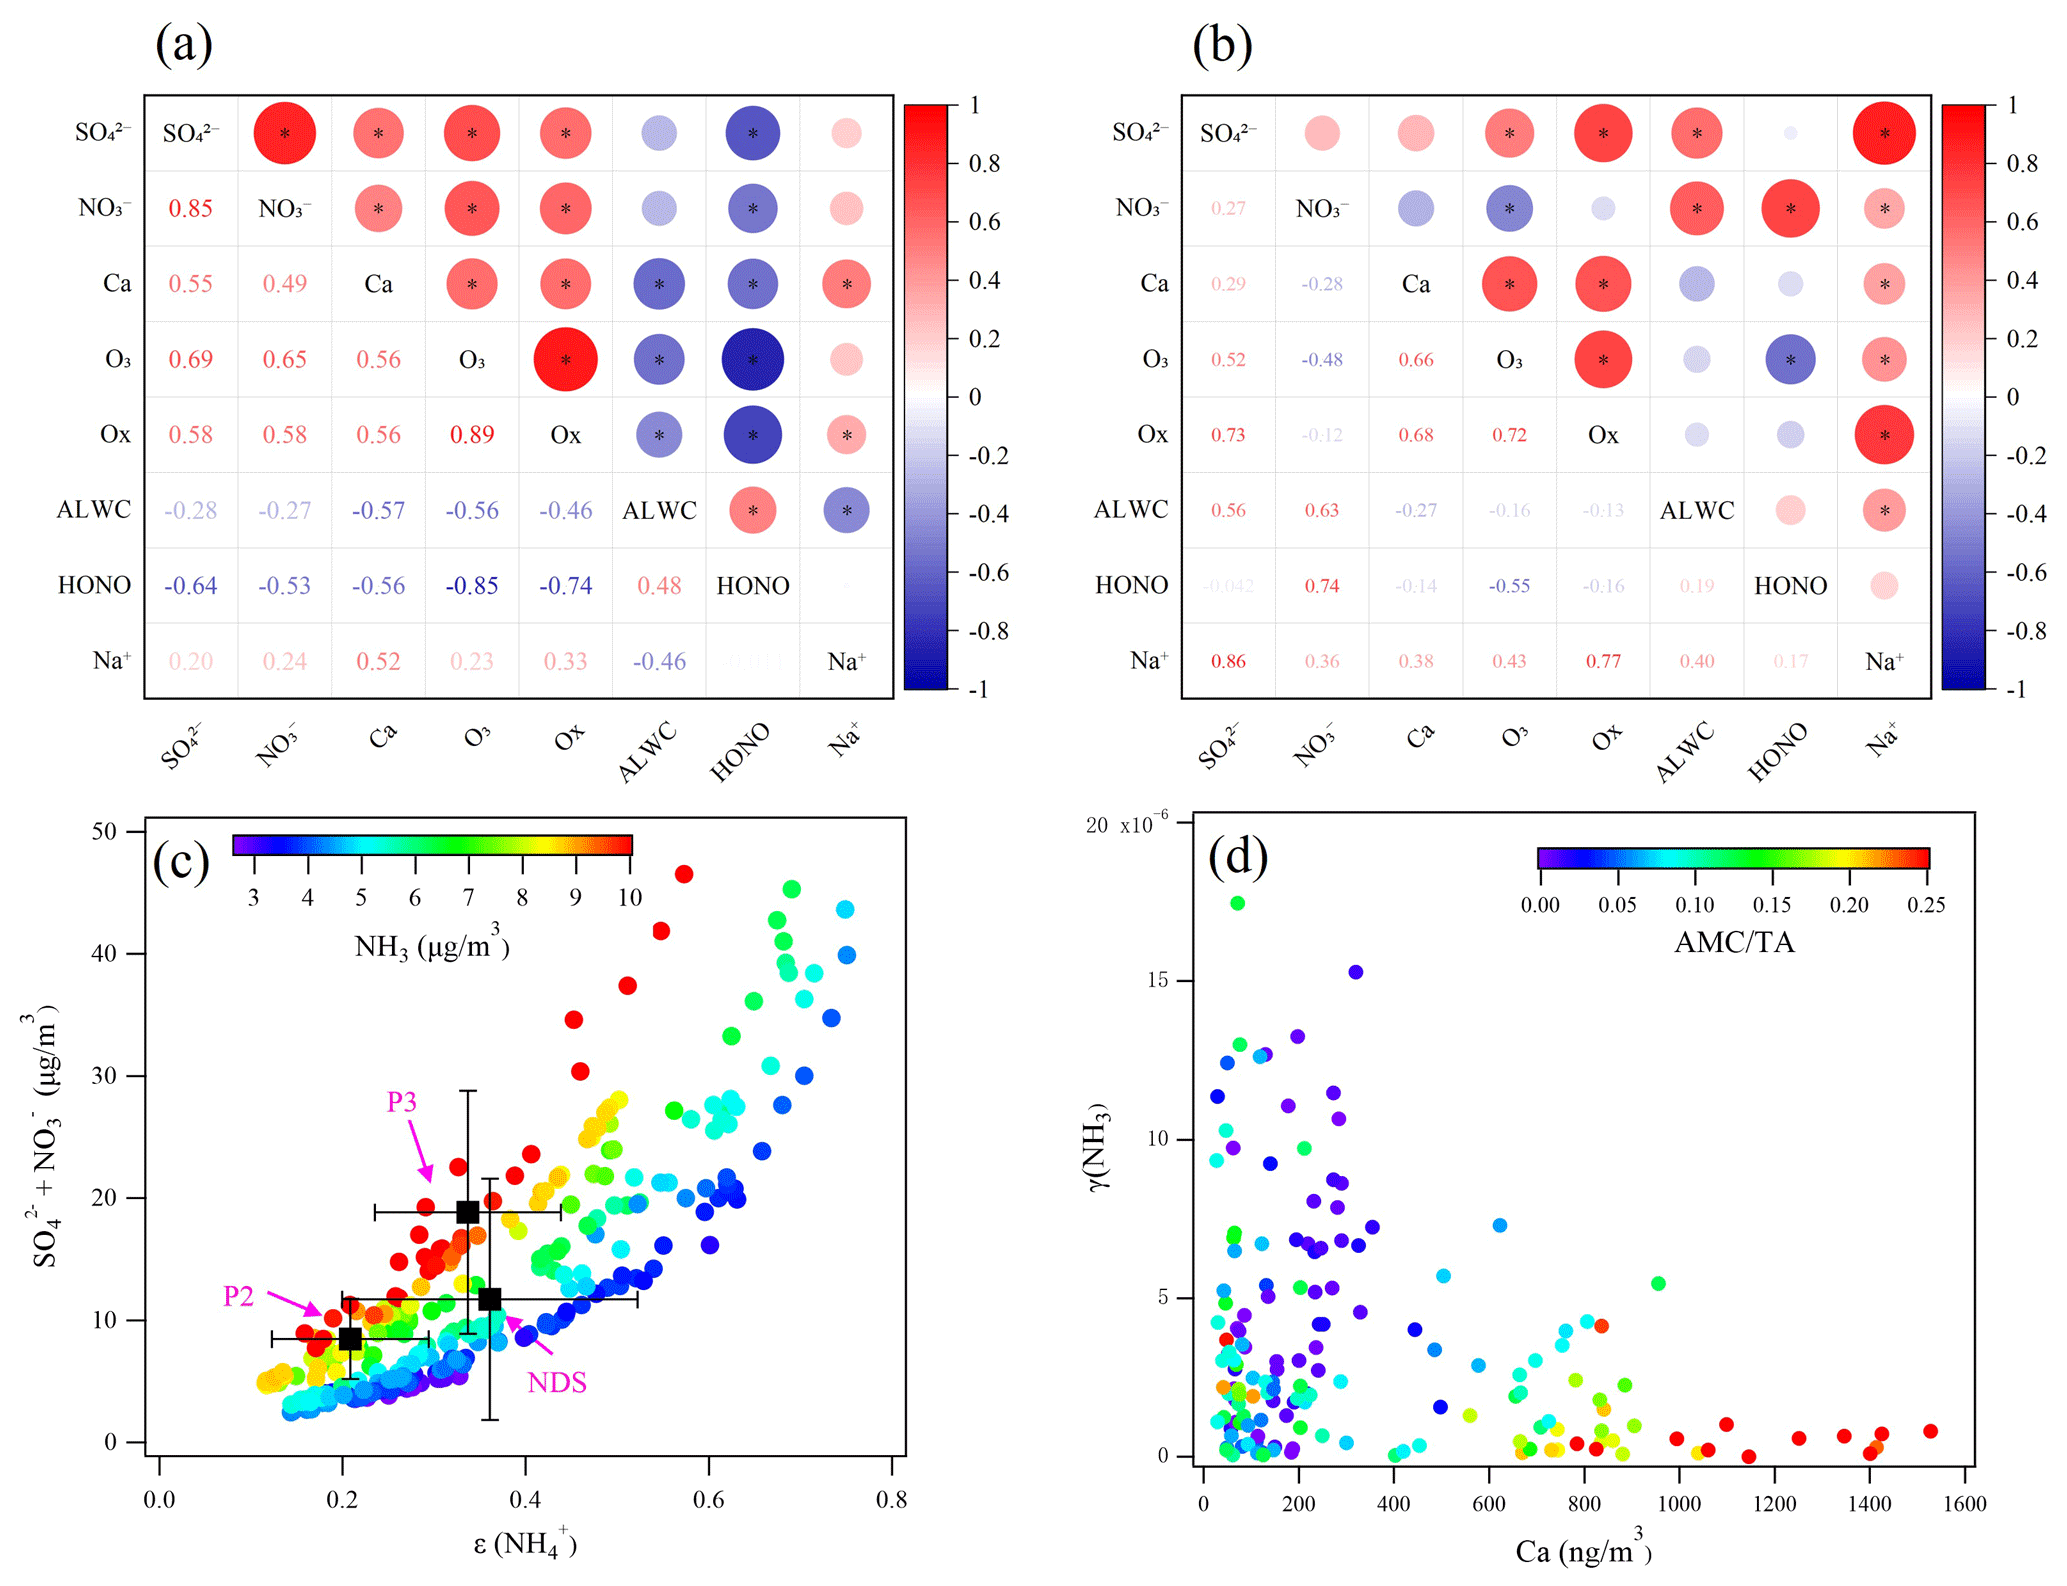
Figure 7Correlation heatmaps during (a) P2 and (b) P3. The size of the dot corresponds to the value of the correlation coefficient. The black star inside the dot means the correlation is significant (p<0.05). (c) The mass concentrations of SO and NO as a function of ), with dots colored by the concentration of NH3. The mean states of P2, P3, and NDs are added. Error bars denote 1 standard deviation. (d) The uptake coefficient of NH3 () on particles as a function of Ca, with dots colored by the molar ratios. AMC and TA denote the total molar concentrations of Na+, K+, Mg2+, and Ca2+ and the total molar concentrations of anions, respectively.
As for P3, it showed a distinctly different correlation heatmap from P2. While SO still demonstrates a correlation with O3, the relationship between NO and O3 (as well as Ox) disappeared. On the contrary, both SO and NO show significant correlations with ALWC. During P3, the average RH reached 76 %, providing favorable conditions for liquid-phase reactions. Furthermore, by relating NO and the multiplication of ALWC and NO2, the correlation coefficient (R2= 0.41) was further improved (Fig. S4a). Similar results were observed by relating NO to the multiplication of ALWC and NO2 ⋅ O3 ⋅ NO2 (a proxy for N2O5; Huang et al., 2021) (Fig. S4b), confirming the dominant reaction pathway of nitrogen oxides to nitrate via the aqueous-phase reactions. As a result, NO was also strongly correlated with HONO (Fig. S4c), typically deriving from the heterogeneous reactions of NO2 on the surface of moist particles (Alicke et al., 2002).
In addition, unlike P2, both SO and NO showed moderate to significant correlations with Na+, a tracer of sea salts (Fig. 7b). Since neither SO nor NO correlated with Ca, it can be inferred that sea salts played a more important role in the transport of air pollutant during the dust backflow over the ocean. To assess whether dust or sea salts participated in the heterogeneous reactions of secondary aerosol during P3, the ISORROPIA II model was run with different scenarios. Figure S5 shows the model performance for SO, NO, NH, and NH3 based on the SO–NO–NH–Cl−–NH3–HCl–HNO3 system. After adding Ca2+ into this thermodynamic equilibrium system, the correlations between the simulations vs. observations for all four species were lowered with different extents (Fig. S6). If Na+ was added into the thermodynamic equilibrium system. the model performance was slightly improved (Fig. S7). This corroborated the evidence that the heterogeneous reactions on dust were very limited while sea salts were intensively involved in the formation of secondary inorganic aerosols during the dust backflow.
To further explore the influencing factors affecting the formation of secondary inorganic aerosols, we examined the role of NH3 in different stages, represented by the relationship between the gas–particle partitioning of ammonia (), defined as the ratio between particle-phase ammonia, NH, and total ammonia, NHx= NH3+ NH) and the total acids (SO NO). As shown in Fig. 7c, it is obvious that the total acids strongly co-varied with ). Higher ) resulted in higher concentrations of secondary aerosols. Moreover, under similar ) conditions, higher NH3 promoted stronger formation of secondary aerosols. Thus, both NH3 and ) collectively determined the aerosol formation potential. The mean states of P2, P3, and NDs are compared in Fig. 7c. P2 had the lowest ) with a mean value of 0.21, despite the relatively high concentrations of NH3 during this period (7.9 ± 1.0 µg m−3). The relatively low gas–particle partitioning of ammonia limited the neutralization of the acidic components. In contrast, NH3 during P3 was the highest during the study period (9.8 ± 1.8 µg m−3), and ) (0.34) was only slightly lower than that during NDs, thus effectively fostering the formation of secondary inorganic aerosols.
To explain this phenomenon, the uptake coefficient of NH3 () on particles, which is one of the important parameters affecting the gas–particle partitioning of ammonia, was calculated. Figure 7d shows the decreasing trend of with the increase in dust intensity (using Ca as an indicator). This coincided with a multi-year observational study in Beijing and Shijiazhuang, where obviously increased due to significant decline in alkali earth metal contents from the dust emission sources during 2018–2020 (Liu et al., 2022). Thus, this partially explained why ) was relatively low during P2, which was ascribed to the reduced uptake capacity of NH3 on particles.
The ion balance calculation indicated that the total anions and cations are in ideal equilibrium (Fig. S8, regression slope = 0.99, R2= 0.99), indicating that both NH and alkali metal cations (including Na+, K+, Mg2+, and Ca2+) contributed to the neutralization of acids to varying degrees. The ratio of alkali metal cations total anions () was used to color the data points in Fig. 7d, showing an opposite trend between and . During P2, the mean value of reached 21 %, implying that the neutralization of acids by NH3 had been significantly suppressed, thus explaining the decrease in the NH3 uptake coefficient at high dust intensity. In contrast, the ratio decreased to 11 % during P3, indicating reduced competition between NH3 and the alkali dust components. Finally, we also compared the aerosol pH at different stages, which was 3.2, 3.0, and 2.8 during P2, P3, and NDs, respectively. The relatively high aerosol acidity at P3 and NDs favored the uptake of alkaline gases (Liu et al., 2022), which also contributed to the higher at these two stages.
3.5 Estimation of transported and secondarily formed particles during P3
As discussed in previous sections, the aerosols observed during P3 could originate from both aged aerosols transported via the dust backflows and secondary formation. In this section, we aim to estimate the contribution of transport and secondary formation, respectively, to the main aerosol species, based on the simultaneous measurements at the Pudong site and the Lianyungang site. As discussed in Sect. 3.3.2, Lianyungang acted as an upstream region where dust drifted away from the mainland. The duration of dust observed at Lianyungang was approximately from 05:00 on 30 October to 16:00 on 31 October, about 46 h ahead of the dust invasion observed at Pudong (Fig. S2).
To assess the extents of transported air pollutants, black carbon (BC) was used as a reference aerosol component. As shown in Fig. S9, one BC pollution episode on 30 October at Lianyungang was observed. Correspondingly, another BC pollution episode emerged at Pudong on 2 November after about 46 h. Since the air mass trajectory from Lianyungang to Pudong predominantly traversed the ocean and considering that BC has no secondary sources, it can be reasonably assumed that the differences in BC concentrations between these two sites were ascribed to the removal processes of particles.
To determine the removal fractions of aerosols during dust transport, we first defined the average concentrations of various aerosol components during the preceding 5 h of the dust at Pudong as their background concentrations. Then, a coefficient k was derived to calculate the removal fractions of aerosols during the dust transport as below.
AVLYG,BC and AVPD,BC represent the average concentration of BC at Lianyungang and Pudong during their respective dust periods. BKGPD,BC represents the background concentration of BC at Pudong. Assuming that other aerosol species were removed with a similar efficiency to BC, the quantities of transported aerosol species from Lianyungang to Pudong can be estimated as below.
TPPD,i represents the transported quantities of aerosol species i, and 1−k represents the transport fraction of aerosols. Then, the secondarily formed aerosol species i at Pudong can be calculated as below.
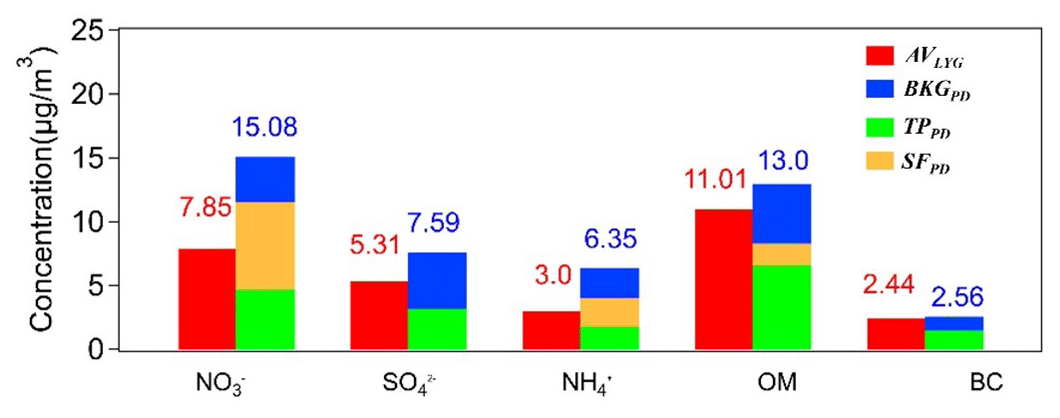
Figure 8 shows the results of the transported and the secondarily formed aerosol species during P3. It was calculated that the secondarily formed and transported NO averaged 6.8 and 4.7 µg m−3, accounting for about 45 % and 31 % of its total mass concentration, respectively. This was consistent with the earlier analysis that a considerable portion of nitrate was formed through the aqueous-phase secondary formation. In contrast, it was calculated that the transported SO accounted for about 42 % of its total mass concentration, while the secondarily formed SO was almost negligible. This was also consistent with the phenomenon that SO correlated significantly with Na+ (Fig. 6b). As for NH, it exhibited a similar apportionment to NO, with the secondarily formed and transported NH accounting for about 35 % and 28 % of its total mass concentration, respectively. Compared to NO and NH, OM was more dominated by transport (57 %), while its secondary formation only accounted for about 13 %. It should be noted that the simple method devised in this study may have inherent uncertainties. Considering the prolonged duration of the dust event, it is possible that certain dust particles lingered over the open ocean. Consequently, the contributions attributed to aerosol transport should be considered a conservative estimate or lower bound, rather than an exhaustive assessment.
During 29 October to 2 November 2019, a long-lasting dust event was observed in Shanghai based on a synergy measurement of near-surface air pollutants, aerosol lidar, wind profiling lidar, and air mass trajectory modeling. Different from most dust events, this dust event was characterized by exceptionally high relative humidity, low wind speed, and relatively high concentrations of gaseous pollutants. The dust event was divided into three stages from P1–P3. P1 was a short dust episode due to the strong cold front. P2 was a dust episode when RH was moderately high at 70 ± 26 % and the southeasterlies prevailed with partial air masses from coastal regions. P3 was a rarely observed dust backflow transport episode. The air masses originated from the Shandong Peninsula and the northern region of Jiangsu Province and then migrated over the Yellow Sea and the East China Sea. RH reached its highest level of 76 ± 24 % among the three stages of the dust event.
During P2, abnormally high O3 concentrations were observed, which could be due to the weak synoptic system as well as downdrafted high-altitude O3 along with the subsidence of dust particles of sulfate and nitrate moderately correlated with O3, while there was almost no correlation with ALWC, indicating that the formation of secondary aerosols during P2 is mainly promoted via gas-phase oxidations. During P3, a special phenomenon of dust backflow was observed and confirmed by various lines of evidence. The highest Ca2+ Ca ratio was observed due to lingering dust plumes over the open ocean. Moreover, contributions of V and Ni significantly increased, indicating the mixing between dust and marine vessel emissions. Differently from P2, nitrate significantly correlated with ALWC but not with O3, indicating its aqueous-phase reaction pathway. Also, sulfate and nitrate exhibited moderate to strong correlations with Na+, suggesting sea salts as a medium for the heterogeneous reactions.
By analyzing various chemical tracers, the formation extent of SNA was found to be much stronger during P3 than during P2. Both NH3 and ) (NH (NH3+ NH)) determined the concentrations of SNA. To explain the relatively high ) values during P3, the uptake coefficient of NH3 () on particles is calculated. negatively varied with the intensity of dust, which was attributed to two factors. Higher contributions of alkali metal components suppressed the neutralization capacity of NH3 on acids, thereby lowering during P2. Also, relatively high aerosol pH during P2 did not facilitate the uptake of NH3 and the subsequent aerosol formation.
Based on a simplified method, the levels of transported and secondarily formed particles during P3 were quantified. It was calculated that about 45 % and 31 % of NO were contributed by secondary formation and transport, respectively. In contrast, the transported SO accounted for about 42 % of its total mass concentration, while the rest was from its background concentration with negligible secondary formation. OM was dominated by transport (57 %), while its secondary formation only accounted for about 13 %.
All data used in this study can be requested upon the corresponding author (huangkan@fudan.edu.cn).
The supplement related to this article is available online at: https://doi.org/10.5194/acp-23-13853-2023-supplement.
KH, QF, and YD designed this study. JH, FY, YL, and JC performed data collection. DL and KH performed data analysis and wrote the paper. All have commented on and reviewed the paper.
The contact author has declared that none of the authors has any competing interests.
Publisher’s note: Copernicus Publications remains neutral with regard to jurisdictional claims made in the text, published maps, institutional affiliations, or any other geographical representation in this paper. While Copernicus Publications makes every effort to include appropriate place names, the final responsibility lies with the authors.
We sincerely thank the Shanghai Pudong New Area Environmental Monitoring Station for maintaining the Pudong supersite. We also thank the handling editor and reviewers for providing insightful comments and suggestions. Kan Huang also acknowledges the Jiangsu Shuangchuang Program through Jiangsu Fuyu Environmental Technology Co., Ltd.
The research has been supported by the National Key R&D Plan programs (grant no. 2023YFE0102500) and National Science Foundation of China (grant no. 42175119).
This paper was edited by Dara Salcedo and reviewed by Zhang Xuelei and three anonymous referees.
Alicke, B., Platt, U., and Stutz, J.: Impact of nitrous acid photolysis on the total hydroxyl radical budget during the Limitation of Oxidant Production/Pianura Padana Produzione di Ozono study in Milan, J. Geophys. Res.-Atmos., 107, 8196, https://doi.org/10.1029/2000jd000075, 2002.
Ansari, A. S. and Pandis, S. N.: An analysis of four models predicting the partitioning of semivolatile inorganic aerosol components, Aerosol Sci. Tech., 31, 129–153, https://doi.org/10.1080/027868299304200, 1999.
Arimoto, R., Ray, B. J., Lewis, N. F., Tomza, U., and Duce, R. A.: Mass-particle size distributions of atmospheric dust and the dry deposition of dust to the remote ocean, J. Geophys. Res.-Atmos., 102, 15867–15874, https://doi.org/10.1029/97jd00796, 1997.
Barkley, A., Olson, N., Prospero, J., Gatineau, A., Panechou, K., Maynard, N., Blackwelder, P., China, S., Ault, A., and Gaston, C.: Atmospheric Transport of North African Dust – Bearing Supermicron Freshwater Diatoms to South America: Implications for Iron Transport to the Equatorial North Atlantic Ocean, Geophys. Res. Lett., 48, e2020GL090476, https://doi.org/10.1029/2020GL090476, 2021.
Becagli, S., Sferlazzo, D. M., Pace, G., di Sarra, A., Bommarito, C., Calzolai, G., Ghedini, C., Lucarelli, F., Meloni, D., Monteleone, F., Severi, M., Traversi, R., and Udisti, R.: Evidence for heavy fuel oil combustion aerosols from chemical analyses at the island of Lampedusa: a possible large role of ships emissions in the Mediterranean, Atmos. Chem. Phys., 12, 3479–3492, https://doi.org/10.5194/acp-12-3479-2012, 2012.
Benas, N., Mourtzanou, E., Kouvarakis, G., Bais, A., Mihalopoulos, N., and Vardavas, I.: Surface ozone photolysis rate trends in the Eastern Mediterranean: Modeling the effects of aerosols and total column ozone based on Terra MODIS data, Atmos. Environ., 74, 1–9, https://doi.org/10.1016/j.atmosenv.2013.03.019, 2013.
Bozlaker, A., Prospero, J. M., Price, J., and Chellam, S.: Identifying and Quantifying the Impacts of Advected North African Dust on the Concentration and Composition of Airborne Fine Particulate Matter in Houston and Galveston, Texas, J. Geophys. Res.-Atmos., 124, 12282–12300, https://doi.org/10.1029/2019jd030792, 2019.
Cwiertny, D. M., Baltrusaitis, J., Hunter, G. J., Laskin, A., Scherer, M. M., and Grassian, V. H.: Characterization and acid-mobilization study of iron-containing mineral dust source materials, J. Geophys. Res.-Atmos., 113, D05202, https://doi.org/10.1029/2007jd009332, 2008.
Draxler, R. R. and Hess, G. D.: An overview of the HYSPLIT_4 modeling system for trajectories, dispersion, and deposition, Aust. Meteorol. Mag., 47, 295–308, 1998.
Fan, H., Zhao, C., Yang, Y., and Yang, X.: Spatio-Temporal Variations of the PM2.5 PM10 Ratios and Its Application to Air Pollution Type Classification in China, Front. Environ. Sci., 2021, 692440, https://doi.org/10.3389/fenvs.2021.692440.
Fan, Q. Z., Zhang, Y., Ma, W. C., Ma, H. X., Feng, J. L., Yu, Q., Yang, X., Ng, S. K. W., Fu, Q. Y., and Chen, L. M.: Spatial and Seasonal Dynamics of Ship Emissions over the Yangtze River Delta and East China Sea and Their Potential Environmental Influence, Environ. Sci. Technol., 50, 1322–1329, https://doi.org/10.1021/acs.est.5b03965, 2016.
Feng, X., Mao, R., Gong, D.-Y., Zhao, C., Wu, C., Zhao, C., Wu, G., Lin, Z., Liu, X., Wang, K., and Sun, Y.: Increased Dust Aerosols in the High Troposphere Over the Tibetan Plateau From 1990s to 2000s, J. Geophys. Res.-Atmos., 125, e2020JD032807, https://doi.org/10.1029/2020JD032807, 2020.
GDAS: one-degree archive (Dec 2004–present), GDAS [data set], https://www.ready.noaa.gov/data/archives/gdas1 (last access: 2 November 2023), 2004.
Goodman, M. M., Carling, G. T., Fernandez, D. P., Rey, K. A., Hale, C. A., Bickmore, B. R., Nelson, S. T., and Munroe, J. S.: Trace element chemistry of atmospheric deposition along the Wasatch Front (Utah, USA) reflects regional playa dust and local urban aerosols, Chem. Geol., 530, 119317, https://doi.org/10.1016/j.chemgeo.2019.119317, 2019.
Hammond, D. M., Dvonch, J. T., Keeler, G. J., Parker, E. A., Kamal, A. S., Barres, J. A., Yip, F. Y., and Brakefield-Caldwell, W.: Sources of ambient fine particulate matter at two community sites in Detroit, Michigan, Atmos. Environ., 42, 720–732, https://doi.org/10.1016/j.atmosenv.2007.09.065, 2008.
Hilario, M. R. A., Cruz, M. T., Cambaliza, M. O. L., Reid, J. S., Xian, P., Simpas, J. B., Lagrosas, N. D., Uy, S. N. Y., Cliff, S., and Zhao, Y.: Investigating size-segregated sources of elemental composition of particulate matter in the South China Sea during the 2011 Vasco cruise, Atmos. Chem. Phys., 20, 1255–1276, https://doi.org/10.5194/acp-20-1255-2020, 2020.
Hsu, S.-C., Lee, C. S. L., Huh, C.-A., Shaheen, R., Lin, F.-J., Liu, S. C., Liang, M.-C., and Tao, J.: Ammonium deficiency caused by heterogeneous reactions during a super Asian dust episode, J. Geophys. Res.-Atmos., 119, 6803–6817, https://doi.org/10.1002/2013jd021096, 2014.
Huang, K., Zhuang, G., Li, J., Wang, Q., Sun, Y., Lin, Y., and Fu, J. S.: Mixing of Asian dust with pollution aerosol and the transformation of aerosol components during the dust storm over China in spring 2007, J. Geophys. Res., 115, D00K13, https://doi.org/10.1029/2009jd013145, 2010.
Huang, K., Fu, J. S., Lin, N.-H., Wang, S.-H., Dong, X., and Wang, G.: Superposition of Gobi Dust and Southeast Asian Biomass Burning: The Effect of Multisource Long-Range Transport on Aerosol Optical Properties and Regional Meteorology Modification, J. Geophys. Res.-Atmos., 124, 9464–9483, https://doi.org/10.1029/2018JD030241, 2019.
Huang, X., Ding, A. J., Gao, J., Zheng, B., Zhou, D. R., Qi, X. M., Tang, R., Wang, J. P., Ren, C. H., Nie, W., Chi, X. G., Xu, Z., Chen, L. D., Li, Y. Y., Che, F., Pang, N. N., Wang, H. K., Tong, D., Qin, W., Cheng, W., Liu, W. J., Fu, Q. Y., Liu, B. X., Chai, F. H., Davis, S. J., Zhang, Q., and He, K. B.: Enhanced secondary pollution offset reduction of primary emissions during COVID-19 lockdown in China, Natl. Sci. Rev., 8, nwaa137, https://doi.org/10.1093/nsr/nwaa137, 2021.
ISORROPIA: https://www.epfl.ch/labs/lapi/models-and-software/isorropia/iso-code-repository/ EPFL [code], (last access: 2 November 2023), 2009.
Jeong, G. Y.: Bulk and single-particle mineralogy of Asian dust and a comparison with its source soils, J. Geophys. Res.-Atmos., 113, D02208, https://doi.org/10.1029/2007jd008606, 2008.
Ji, Y., Qin, X., Wang, B., Xu, J., Shen, J., Chen, J., Huang, K., Deng, C., Yan, R., Xu, K., and Zhang, T.: Counteractive effects of regional transport and emission control on the formation of fine particles: a case study during the Hangzhou G20 summit, Atmos. Chem. Phys., 18, 13581–13600, https://doi.org/10.5194/acp-18-13581-2018, 2018.
Jiang, Y., Zhuang, G., Wang, Q., Huang, K., Deng, C., Yu, G., Xu, C., Fu, Q., Lin, Y., Fu, J. S., Li, M., and Zhou, Z.: Impact of mixed anthropogenic and natural emissions on air quality and eco-environment – the major water-soluble components in aerosols from northwest to offshore isle, Air Qual. Atmos. Hlth., 11, 521–534, https://doi.org/10.1007/s11869-018-0557-5, 2018.
Laskin, A., Wietsma, T. W., Krueger, B. J., and Grassian, V. H.: Heterogeneous chemistry of individual mineral dust particles with nitric acid: A combined CCSEM/EDX, ESEM, and ICP-MS study, J. Geophys. Res.-Atmos., 110, D10208, https://doi.org/10.1029/2004jd005206, 2005.
Li, T., Wang, Y., Zhou, J., Wang, T., Ding, A. J., Nie, W., Xue, L. K., Wang, X. F., and Wang, W. X.: Evolution of trace elements in the planetary boundary layer in southern China: Effects of dust storms and aerosol-cloud interactions, J. Geophys. Res.-Atmos., 122, 3492–3506, https://doi.org/10.1002/2016jd025541, 2017.
Liu, H., Liu, S., Xue, B., Lv, Z., Meng, Z., Yang, X., Xue, T., Yu, Q., and He, K.: Ground-level ozone pollution and its health impacts in China, Atmos. Environ., 173, 223–230, https://doi.org/10.1016/j.atmosenv.2017.11.014, 2018.
Liu, J., Ding, J., Rexiding, M., Li, X., Zhang, J., Ran, S., Bao, Q., and Ge, X.: Characteristics of dust aerosols and identification of dust sources in Xinjiang, China, Atmos. Environ., 262, 118651, https://doi.org/10.1016/j.atmosenv.2021.118651, 2021.
Liu, Y. C., Zhan, J. L., Zheng, F. X., Song, B. Y., Zhang, Y. S., Ma, W., Hua, C. J., Xie, J. L., Bao, X. L., Yan, C., Bianchi, F., Petaja, T., Ding, A. J., Song, Y., He, H., and Kulmala, M.: Dust emission reduction enhanced gas-to-particle conversion of ammonia in the North China Plain, Nat. Commun., 13, 6887, https://doi.org/10.1038/s41467-022-34733-4, 2022.
Ma, S. Q., Zhang, X. L., Gao, C., Tong, Q. S., Xiu, A. J., Zhao, H. M., and Zhang, S. C.: Simulating Performance of CHIMERE on a Late Autumnal Dust Storm over Northern China, Sustainability-Basel, 11, 1074, https://doi.org/10.3390/su11041074, 2019.
Malm, W. C., Sisler, J. F., Huffman, D., Eldred, R. A., and Cahill, T. A.: Spatial and seasonal trends in particle concentration and optical extinction in the United States, J. Geophys. Res.-Atmos., 99, 1347–1370, https://doi.org/10.1029/93JD02916, 1994.
Mcneil, W. R. and Carswell, A. I.: Lidar Polarization Studies of Troposphere, Appl. Opt., 14, 2158–2168, 1975.
Nagashima, K., Suzuki, Y., Irino, T., Nakagawa, T., Tada, R., Hara, Y., Yamada, K., and Kurosaki, Y.: Asian dust transport during the last century recorded in Lake Suigetsu sediments, Geophys. Res. Lett., 43, 2835–2842, https://doi.org/10.1002/2015GL067589, 2016.
Nenes, A., Pandis, S. N., and Pilinis, C.: ISORROPIA: A new thermodynamic equilibrium model for multiphase multicomponent inorganic aerosols, Aquat. Geochem., 4, 123–152, https://doi.org/10.1023/a:1009604003981, 1998.
Patel, A. and Rastogi, N.: Chemical Composition and Oxidative Potential of Atmospheric PM10 over the Arabian Sea, ACS Earth Space Chem., 4, 112–121, https://doi.org/10.1021/acsearthspacechem.9b00285, 2020.
Perez, N., Pey, J., Reche, C., Cortes, J., Alastuey, A., and Querol, X.: Impact of harbour emissions on ambient PM10 and PM2.5 in Barcelona (Spain): Evidences of secondary aerosol formation within the urban area, Sci. Total Environ., 571, 237–250, https://doi.org/10.1016/j.scitotenv.2016.07.025, 2016.
Shen, L., Zhao, C., Ma, Z., Li, Z., Li, J., and Wang, K.: Observed decrease of summer sea-land breeze in Shanghai from 1994 to 2014 and its association with urbanization, Atmos. Res., 227, 198–209, https://doi.org/10.1016/j.atmosres.2019.05.007, 2019.
Shimizu, A., Sugimoto, N., Matsui, I., Arao, K., Uno, I., Murayama, T., Kagawa, N., Aoki, K., Uchiyama, A., and Yamazaki, A.: Continuous observations of Asian dust and other aerosols by polarization lidars in China and Japan during ACE-Asia, J. Geophys. Res., 109, D19S17, https://doi.org/10.1029/2002JD003253, 2004.
Song, S., Gao, M., Xu, W., Shao, J., Shi, G., Wang, S., Wang, Y., Sun, Y., and McElroy, M. B.: Fine-particle pH for Beijing winter haze as inferred from different thermodynamic equilibrium models, Atmos. Chem. Phys., 18, 7423–7438, https://doi.org/10.5194/acp-18-7423-2018, 2018.
Stein, A. F., Draxler, R. R., Rolph, G. D., Stunder, B. J. B., Cohen, M. D., and Ngan, F.: NOAA's HYSPLIT Atmospheric Transport and Dispersion Modeling System, B. Am. Meteorol. Soc., 96, 2059–2077, 2015.
Su, L., Yuan, Z., Fung, J. C. H., and Lau, A. K. H.: A comparison of HYSPLIT backward trajectories generated from two GDAS datasets, Sci. Total Environ., 506–507, 527–537, https://doi.org/10.1016/j.scitotenv.2014.11.072, 2015.
Tang, M., Cziczo, D. J., and Grassian, V. H.: Interactions of Water with Mineral Dust Aerosol: Water Adsorption, Hygroscopicity, Cloud Condensation, and Ice Nucleation, Chem. Rev., 116, 4205–4259, https://doi.org/10.1021/acs.chemrev.5b00529, 2016.
Tang, M., Huang, X., Lu, K., Ge, M., Li, Y., Cheng, P., Zhu, T., Ding, A., Zhang, Y., Gligorovski, S., Song, W., Ding, X., Bi, X., and Wang, X.: Heterogeneous reactions of mineral dust aerosol: implications for tropospheric oxidation capacity, Atmos. Chem. Phys., 17, 11727–11777, https://doi.org/10.5194/acp-17-11727-2017, 2017.
Tian, R., Ma, X., Sha, T., Pan, X., and Wang, Z.: Exploring dust heterogeneous chemistry over China: Insights from field observation and GEOS-Chem simulation, Sci. Total Environ., 798, 149307, https://doi.org/10.1016/j.scitotenv.2021.149307, 2021.
Wang, G., Chen, J., Xu, J., Yun, L., Zhang, M., Li, H., Qin, X., Deng, C., Zheng, H., Gui, H., Liu, J., and Huang, K.: Atmospheric processing at the sea-land interface over the South China Sea: secondary aerosol formation, aerosol acidity, and role of sea salts, J. Geophys. Res.-Atmos., 127, e2021JD036255, https://doi.org/10.1029/2021JD036255, 2022.
Wang, G. H., Cheng, C. L., Huang, Y., Tao, J., Ren, Y. Q., Wu, F., Meng, J. J., Li, J. J., Cheng, Y. T., Cao, J. J., Liu, S. X., Zhang, T., Zhang, R., and Chen, Y. B.: Evolution of aerosol chemistry in Xi'an, inland China, during the dust storm period of 2013 – Part 1: Sources, chemical forms and formation mechanisms of nitrate and sulfate, Atmos. Chem. Phys., 14, 11571–11585, https://doi.org/10.5194/acp-14-11571-2014, 2014.
Wang, H. C. and Lu, K. D.: Determination and Parameterization of the Heterogeneous Uptake Coefficient of Dinitrogen Pentoxide (N2O5), Prog. Chem., 28, 917–933, https://doi.org/10.7536/Pc151225, 2016.
Wang, J. J., Zhang, M. G., Bai, X. L., Tan, H. J., Li, S., Liu, J. P., Zhang, R., Wolters, M. A., Qin, X. Y., Zhang, M. M., Lin, H. M., Li, Y. N., Li, J., and Chen, L. Q.: Large-scale transport of PM2.5 in the lower troposphere during winter cold surges in China, Sci. Rep.-UK, 7, 13238, https://doi.org/10.1038/s41598-017-13217-2, 2017.
Wang, L., Du, H., Chen, J., Zhang, M., Huang, X., Tan, H., Kong, L., and Geng, F.: Consecutive transport of anthropogenic air masses and dust storm plume: Two case events at Shanghai, China, Atmos. Res., 127, 22–33, https://doi.org/10.1016/j.atmosres.2013.02.011, 2013.
Wang, N., Zheng, P., Wang, R., Wei, B., An, Z., Li, M., Xie, J., Wang, Z., Wang, H., and He, M.: Homogeneous and heterogeneous atmospheric ozonolysis of acrylonitrile on the mineral dust aerosols surface, Journal of Environmental Chemical Engineering, 9, 106654, https://doi.org/10.1016/j.jece.2021.106654, 2021.
Wang, Q., Wang, X., Huang, R., Wu, J., Xiao, Y., Hu, M., Fu, Q., Duan, Y., and Chen, J.-M.: Regional Transport of PM2.5 and O3 Based on Complex Network Method and Chemical Transport Model in the Yangtze River Delta, China, J. Geophys. Res.-Atmos., 127, e2021JD034807, https://doi.org/10.1029/2021JD034807, 2022.
Wang, Z., Pan, X. L., Uno, I., Chen, X. S., Yamamoto, S., Zheng, H. T., Li, J., and Wang, Z. F.: Importance of mineral dust and anthropogenic pollutants mixing during a long-lasting high PM event over East Asia, Environ. Pollut., 234, 368–378, https://doi.org/10.1016/j.envpol.2017.11.068, 2018.
Wang, Z. L., Huang, X., Wang, N., Xu, J. W., and Ding, A. J.: Aerosol-Radiation Interactions of Dust Storm Deteriorate Particle and Ozone Pollution in East China, J. Geophys. Res.-Atmos., 125, e2020JD033601, https://doi.org/10.1029/2020JD033601, 2020.
West, J. J., Ansari, A. S., and Pandis, S. N.: Marginal PM25: Nonlinear Aerosol Mass Response to Sulfate Reductions in the Eastern United States, J. Air Waste Manage., 49, 1415–1424, https://doi.org/10.1080/10473289.1999.10463973, 1999.
Wu, C., Zhang, S., Wang, G., Lv, S., Li, D., Liu, L., Li, J., Liu, S., Du, W., Meng, J., Qiao, L., Zhou, M., Huang, C., and Wang, H.: Efficient Heterogeneous Formation of Ammonium Nitrate on the Saline Mineral Particle Surface in the Atmosphere of East Asia during Dust Storm Periods, Environ. Sci. Technol., 54, 15622–15630, https://doi.org/10.1021/acs.est.0c04544, 2020.
Wu, F., Cheng, Y., Hu, T. F., Song, N., Zhang, F., Shi, Z. B., Ho, S. S. H., Cao, J. J., and Zhang, D. Z.: Saltation-Sandblasting Processes Driving Enrichment of Water- Soluble Salts in Mineral Dust, Environ. Sci. Tech. Let., 9, 921–928, https://doi.org/10.1021/acs.estlett.2c00652, 2022.
Xie, S. D., Yu, T., Zhang, Y. H., Zeng, L. M., Qi, L., and Tang, X. Y.: Characteristics of PM10, SO2, NO, and O3 in ambient air during the dust storm period in Beijing, Sci. Total Environ., 345, 153–164, https://doi.org/10.1016/j.scitotenv.2004.10.013, 2005.
Xu, J., Chen, J., Zhao, N., Wang, G., Yu, G., Li, H., Huo, J., Lin, Y., Fu, Q., Guo, H., Deng, C., Lee, S.-H., Chen, J., and Huang, K.: Importance of gas-particle partitioning of ammonia in haze formation in the rural agricultural environment, Atmos. Chem. Phys., 20, 7259–7269, https://doi.org/10.5194/acp-20-7259-2020, 2020.
Xu, P., Zhang, J. K., Ji, D. S., Liu, Z. R., Tang, G. Q., Hu, B., Jiang, C. S., and Wang, Y. S.: Evaluating the Effects of Springtime Dust Storms over Beijing and the Associated Characteristics of Sub-Micron Aerosol, Aerosol Air Qual. Res., 17, 680–692, https://doi.org/10.4209/aaqr.2016.05.0195, 2017.
Yang, Y., Wang, Z. L., Lou, S. J., Xue, L., Lu, J. P., Wang, H. Y., Wang, J. D., Ding, A. J., and Huang, X.: Strong ozone intrusions associated with super dust storms in East Asia, Atmos. Environ., 290, 119355, https://doi.org/10.1016/j.atmosenv.2022.119355, 2022.
Yu, S. C., Dennis, R., Roselle, S., Nenes, A., Walker, J., Eder, B., Schere, K., Swall, J., and Robarge, W.: An assessment of the ability of three-dimensional air quality models with current thermodynamic equilibrium models to predict aerosol NO3, J. Geophys. Res.-Atmos., 110, D07S13, https://doi.org/10.1029/2004jd004718, 2005.
Zhang, D., Iwasaka, Y., Shi, G., Zang, J., Hu, M., and Li, C.: Separated status of the natural dust plume and polluted air masses in an Asian dust storm event at coastal areas of China, J. Geophys. Res.-Atmos., 110, D06302, https://doi.org/10.1029/2004jd005305, 2005.
Zhang, S. P., Xing, J., Sarwar, G., Ge, Y. L., He, H., Duan, F. K., Zhao, Y., He, K. B., Zhu, L. D., and Chu, B. W.: Parameterization of heterogeneous reaction of SO2 to sulfate on dust with coexistence of NH3 and NO2 under different humidity conditions, Atmos. Environ., 208, 133–140, https://doi.org/10.1016/j.atmosenv.2019.04.004, 2019.
Zhang, X. L., Wu, G. J., Zhang, C. L., Xu, T. L., and Zhou, Q. Q.: What is the real role of iron oxides in the optical properties of dust aerosols?, Atmos. Chem. Phys., 15, 12159–12177, https://doi.org/10.5194/acp-15-12159-2015, 2015.
Zhao, D., Xin, J., Wang, W., Jia, D., Wang, Z., Xiao, H., Liu, C., Zhou, J., Tong, L., Ma, Y., Wen, T.-X., Wu, F.-K., and Wang, L.: Effects of the sea-land breeze on coastal ozone pollution in the Yangtze River Delta, Sci. Total Environ., 807, 150306, https://doi.org/10.1016/j.scitotenv.2021.150306, 2021.
Zheng, G. J., Duan, F. K., Su, H., Ma, Y. L., Cheng, Y., Zheng, B., Zhang, Q., Huang, T., Kimoto, T., Chang, D., Pöschl, U., Cheng, Y. F., and He, K. B.: Exploring the severe winter haze in Beijing: the impact of synoptic weather, regional transport and heterogeneous reactions, Atmos. Chem. Phys., 15, 2969–2983, https://doi.org/10.5194/acp-15-2969-2015, 2015.
Zheng, Y., Zhao, T., Che, H., Liu, Y., Han, Y., Liu, C., Xiong, J., Liu, J., and Zhou, Y.: A 20-year simulated climatology of global dust aerosol deposition, Sci. Total Environ., 557–558, 861–868, https://doi.org/10.1016/j.scitotenv.2016.03.086, 2016.